بررسی رژیمهای درمانی حاوی پلاتینوم در درمان سرطان متاستاتیک پستان
چکیده
پیشینه
مطالعات موجود نرخ بالای پاسخ تومور را به رژیمهای حاوی پلاتینوم در درمان زنان مبتلا به سرطان متاستاتیک پستان گزارش کردهاند. بسیاری از این مطالعات پیش از دوره intrinsic subtype انجام شدند و بهطور خاص بر سرطانهای متاستاتیک پستان سهگانه منفی (metastatic triple‐negative breast cancers; mTNBCs) تمرکز نکردند.
اهداف
شناسایی و مرور شواهد بهدست آمده از کارآزماییهای تصادفیسازی شده که به مقایسه رژیمهای شیمیدرمانی حاوی پلاتینوم با رژیمهای بدون پلاتینوم در مدیریت درمانی زنان مبتلا به سرطان متاستاتیک پستان پرداختند.
روشهای جستوجو
برای بهروز کردن این مرور، پایگاه ثبت تخصصی گروه سرطان پستان در کاکرین، CENTRAL؛ MEDLINE؛ Embase؛ پلتفرم بینالمللی پایگاه ثبت کارآزماییهای بالینی سازمان جهانی بهداشت و ClinicalTrials.gov را در 28 می 2015 جستوجو کردیم. مطالعات بالقوه مرتبط بیشتری را از طریق جستوجوی دستی منابع کارآزماییهای قبلی، مرور سیستماتیک، و متاآنالیز (meta‐analysis) شناسایی کردیم. پیش از بهروز کردن این مرور، جدیدترین جستوجو برای مرور اصلی سال 2004، در می 2003 انجام شد.
معیارهای انتخاب
کارآزماییهای تصادفیسازی شدهای که به مقایسه رژیمهای شیمیدرمانی حاوی پلاتینوم با رژیمهای بدون پلاتینوم در زنان مبتلا به سرطان متاستاتیک پستان پرداختند.
گردآوری و تجزیهوتحلیل دادهها
حداقل دو نویسنده مرور بهطور مستقل از هم واجد شرایط بودن و کیفیت مطالعات را ارزیابی کرده، و تمام دادههای مرتبط را از هر مطالعه استخراج کردند. نسبتهای خطر (HR) برای پیامدهای زمان تا رویداد، در جایی که امکانپذیر بود؛ به دست آمد، و برای متاآنالیز (meta‐analysis)، از مدل اثر‐ثابت استفاده شد. نرخ پاسخ ابجکتیو تومور (objective tumour response rates; OTRR) و سمیّتها بهعنوان پیامدهای باینری (دو‐حالتی) با خطر نسبی (RR) که بهعنوان معیارهای تاثیرات استفاده شد، مورد تجزیهوتحلیل قرار گرفت. در صورت امکان دادههای مربوط به کیفیت زندگی استخراج شد. برای نرخ کیفیت شواهد مربوط به پیامدهای بقا و پاسخ تومور در سطح زیر‐گروههای انتخاب شده و انتخاب نشده برای mTNBC، و برای پیامدهای مربوط به سمیّت بر اساس ترکیب دادههای به دست آمده از جمعیتهای انتخاب شده و انتخاب نشده از درجهبندی توصیه، ارزیابی، توسعه و ارزشیابی (GRADE) استفاده شد.
نتایج اصلی
این نسخه بهروز 15 مورد مقایسههای درمانی (treatment‐comparisons) واجد شرایط به دست آمده از 12 مطالعه را وارد کرد. در کل، 28 درمان مقایسهای، شامل 4418 زن، از 24 مطالعه، در یک یا چند متاآنالیز وارد شدند. از 28 درمان مقایسهای، 19 و 16 مقایسه به ترتیب، دادههای قابل استخراج مربوط به زمان بروز عوارض را در بقای کلی (overall survival; OS) یا بقای بدون پیشرفت/زمان پیشرفت (progression‐free survival/time to progression; PFS/TTP) را منتشر کرده یا ارائه کردند. تمام 28 درمان مقایسهای دادههای OTRR را که میتوانست در متاآنالیزها وارد شود، ارائه کردند. اکثر زنانی که در این مطالعات به کار گرفته شدند بر اساس وضعیت mTNBC انتخاب نشدند.
زیر‐گروهی از سه درمان مقایسهای که به ارزیابی زنان مبتلا به mTNBC پرداختند، نشان دادند که رژیمهای حاوی پلاتینوم ممکن است مزیت بقا به همراه داشته باشند (HR: 0.75؛ 95% CI؛ 0.57 تا 1.00؛ شواهد با کیفیت پائین). برای زنان انتخاب نشده برای زیر‐تایپهای طبیعی مانند mTNBC، تاثیری اندک یا عدم تاثیر بر بقا وجود داشت (HR: 1.01؛ 95% CI؛ 0.92 تا 1.12؛ شواهد با کیفیت بالا). این تاثیر با تجزیهوتحلیل ترکیب شده از دادههای مربوط به بقا در هر دو جمعیت مشابه بود (HR: 0.98؛ 95% CI؛ 0.89 تا 1.07؛ 39% = I2؛ 1868 مورد مرگومیر؛ 2922 زن؛ 19 کارآزمایی). تفاوت در اثر درمان بین زنان مبتلا به mTNBC در مقایسه با زنان انتخاب نشده دارای معنیداری مرزی آماری بود (0.05 = P).
دادههای به دست آمده از سه درمان مقایسهای با شرکتکنندگان مبتلا به mTNBC نشان داد که رژیمهای پلاتینوم ممکن است PFS/TTP را بهبود ببخشند (HR: 0.59؛ 95% CI؛0.49 تا 0.72؛ شواهد با کیفیت پائین). سیزده درمان مقایسهای با شرکتکنندگان متاستاتیک انتخاب نشده نشان داد که احتمالا مزیت PFS/TTP کوچکی برای دریافت کنندگان پلاتینوم وجود داشت؛ هر چند که هیچ تفاوتی در فاصله اطمینان وجود نداشت (HR: 0.92؛ 95% CI؛ 0.84 تا 1.01؛ شواهد با کیفیت متوسط). تجزیهوتحلیل ترکیب شده از دادههای به دست آمده از 1772 زن تخمین زده شده از 2136 زن انتخاب شده یا انتخاب نشده برای mTNBC که پیشرفت بیماری داشتند یا جان خود را از دست دادند؛ نشان داد که رژیمهای حاوی پلاتینوم PFS/TTP را بهبود بخشیدند (HR: 0.85؛ 95% CI؛ 0.78 تا 0.93؛ شواهد با کیفیت متوسط). شواهد مشخص شده (marked evidence) از ناهمگونی وجود داشت (0.0004 = P؛ 63% = I2 ). مزیت بزرگتر درمان در زنان مبتلا به mTNBC در مقایسه با زنان انتخاب نشده دارای اهمیت آماری بود (0.0001 > P).
در مورد پاسخ بهتر تومور در هر زیر‐گروه از زنان مبتلا به mTNBC و زنان انتخاب نشده شواهدی با کیفیت پائین وجود داشت (به ترتیب؛ RR: 1.33؛ 95% CI؛ 1.13 تا 1.56؛ RR: 1.11؛ 95% CI؛ 1.04 تا 1.19). تجزیهوتحلیل ترکیب شده از هر دو جمعیت در زنان انتخاب نشده نزدیک به تاثیر بود (RR: 1.15؛ 95% CI؛ 1.08 تا 1.22؛ 4130 زن). شواهد قابل توجهی از ناهمگونی وجود داشت (0.0001 > P؛ 64% = I2)، که ممکن بود بازتاب تفاوتهای بین مطالعه و مشکلات عمومی در ارزیابی پاسخ و همچنین توان متفاوت مقایسه کنندهها باشد.
در مقایسه با زنان دریافت کننده رژیمهای بدون پلاتینوم: احتمالا نرخ تهوع و استفراغ درجه 3 و 4 بین زنان دریافت کننده سیسپلاتین بالاتر بود (RR: 2.65؛ 95% CI؛ 2.10 تا 3.34؛ 1731 زن؛ شواهد با کیفیت متوسط)، اما تاثیر رژیمهای حاوی کربوپلاتین کمتر مشخص بود (RR: 0.77؛ 95% CI؛ 0.47 تا 1.26؛ 1441 زن؛ شواهد با کیفیت متوسط)؛ نرخ کمخونی (آنمی) درجه 3 و 4 میان زنان دریافت کننده سیسپلاتین (RR: 3.72؛ 95% CI؛ 2.36 تا 5.88؛ 1644 زن؛ شواهد با کیفیت بالا) و رژیمهای حاوی کربوپلاتین بالاتر بود (RR: 1.72؛ 95% CI؛ 1.10 تا 2.70؛ 1441 زن؛ شواهد با کیفیت بالا)؛ نرخ ریزش موی درجه 3 و 4 (RR: 1.41؛ 95% CI؛ 1.26 تا 1.58؛ 1452 زن؛ شواهد با کیفیت بالا) و لکوپنی (RR: 1.38؛ 95% CI؛ 1.21 تا 1.57؛ 3176 زن؛ شواهد با کیفیت متوسط) میان زنان دریافت کننده رژیمهای حاوی پلاتینوم بالاتر بود (بدون توجه به عامل پلاتینوم).
نتیجهگیریهای نویسندگان
درباره زنان مبتلا به سرطان متاستاتیک پستان که بیماری منفی سهگانه ندارند، شواهدی با کیفیت بالا وجود دارد که مزیتی اندک یا عدم مزیت را برای بقا و سمیّت بیش از حد ناشی از رژیمهای مبتنی بر پلاتینوم نشان میدهد. در مورد مزیت بقای متوسط ناشی از رژیمهای مبتنی بر پلاتینوم برای زنان مبتلا به mTNBC شواهد اولیه با کیفیت پائین وجود دارد. انجام کارآزماییهای تصادفیسازی شده بیشتری در مورد رژیمهای مبتنی بر پلاتینوم در این زیر‐گروه جمعیتی از زنان مبتلا به سرطان متاستاتیک پستان مورد نیاز است.
PICO
خلاصه به زبان ساده
بررسی رژیمهای درمانی حاوی پلاتینوم در درمان سرطان متاستاتیک پستان
موضوع چیست؟ سرطان متاستاتیک پستان زمانی اتفاق میافتد که سرطان به قسمتهایی از بدن فراتر از پستان و نزدیک گرههای لنفاوی گسترش یابد. اگر چه سرطان متاستاتیک پستان بهطور کلی قابل درمان نیست، بهطور گسترده پذیرفته شده که زنان مبتلا به بیماری متاستاتیک برای کمک به کاهش شدت نشانههای بیماری باید نوعی شیمیدرمانی دریافت کنند؛ در حالی که امیدواریم زمان بقا را افزایش دهد. شیمیدرمانی حاوی پلاتینوم برای درمان تعدادی از انواع سرطان از قبیل سرطانهای ریه، بیضه، سر و گردن، مثانه و تخمدان موثر شناخته شده؛ اما مشخص شده که نسبت به سایر گزینههای شیمیدرمانی منجر به عوارض جانبی بیشتری میشود (مانند تهوع و استفراغ، ریزش مو، کمخونی، آسیب کلیه و لکوپنی (leukopenia) (کاهش گلبولهای سفید خون)). دو عامل پلاتینوم که برای درمان سرطان متاستاتیک پستان بیشتر استفاده میشوند عبارتند از کربوپلاتین (carboplatin) و سیسپلاتین (cisplatin).
نسخه اصلی این مرور (2004) نتیجهگیری کرد که شیمیدرمانی حاوی پلاتینوم، زمان بقا را در زنان درمان شده برای سرطان متاستاتیک پستان افزایش نمیدهد. با این حال، از آن زمان، محققان کشف کردهاند که انواع زیر‐تایپهای سرطان پستان وجود دارد که ممکن است به انواع مختلف شیمیدرمانی پاسخهای متفاوتی بدهند. یکی از این زیر‐تایپها ‐ سرطان پستان منفی سهگانه (triple‐negative breast cancer; TNBC) ‐ تقریبا 12% تا 17% از سرطانهای پستان را تشکیل میدهد و با بقای کوتاهتر و احتمال بالای عود سرطان همراه است. برخی از محققان پیشبینی کردهاند که شیمیدرمانی حاوی پلاتینوم ممکن است در درمان TNBC متاستاتیک (mTNBC) موثرتر از سایر گزینههای شیمیدرمانی باشد.
چرا این موضوع مهم است؟ حداقل دو دلیل وجود دارد که نشان میدهد چرا بهروز کردن شواهد مربوط به این موضوع مهم است. اولا، مهم است که این نکته را ارزیابی کنیم که نتیجهگیری ما در سال 2004 ‐ براساس 12 مطالعه زودهنگام ‐ نشان دهنده 24 مطالعهای است که اخیرا منتشر شده یا نتایج آن تا سال 2015 ارائه شده است. ثانیا، مهم است این نکته را ارزیابی کنیم که شیمیدرمانی حاوی پلاتینوم بیش از سایر گزینههای شیمیدرمانی موجب افزایش بقا برای زنان مبتلا به mTNBC میشود یا خیر.
ما سوال کردیم که درمانهای شیمیدرمانی حاوی یک عامل پلاتینوم برای درمان زنان مبتلا به سرطان متاستاتیک پستان بیشتر یا کمتر از درمانهای شیمیدرمانی بدون عامل پلاتینوم موثر هستند. ما همچنین همین سوال را با تمرکز بر زنان مبتلا به mTNBC پرسیدیم.
24 مطالعه را یافتیم که شامل 4418 زن بودند. شواهد تا می 2015 بهروز است. پنج مطالعه از 24 مطالعه بهطور خاص زنان مبتلا به mTNBC را ارزیابی کردند در حالی که 19 مطالعه دیگر زنان مبتلا به سرطان متاستاتیک پستان را در کل ارزیابی کردند (عمدتا زنان بدون mTNBC). این مرور نشان داد که، بهطور کلی در مقایسه با شیمیدرمانی بدون پلاتینوم، شیمیدرمانی با پلاتینوم باعث افزایش زمان بقا با هر درجه مهم برای زنان مبتلا به سرطان متاستاتیک پستان نمیشود (عمدتا زنان بدون mTNBC). کیفیت شواهد برای این موضوع بالا بود، به این معنی که ما به این نتایج اطمینان داریم. با این حال، برای زنان مبتلا به mTNBC، این مرور نشان داد که شیمیدرمانی حاوی پلاتینوم ممکن است زمان بقا را بیش از شیمیدرمانی بدون پلاتینوم افزایش دهد؛ اما کیفیت شواهد برای این موضوع در این نقطه زمانی پائین است (بهطور عمده به دلیل تعداد کم مطالعاتی که mTNBC را ارزیابی کردهاند). این مرور همچنین نشان داد که شیمیدرمانی حاوی پلاتینوم، در مقایسه با شیمیدرمانی که حاوی پلاتینوم نیست، تعداد موارد عود سرطان پستان را در زنان مبتلا به mTNBC کاهش داد؛ اما در حال حاضر این یافتهها از شواهدی با کیفیت پائین بهدست آمدهاند. بهطور کلی تفاوتی در تعداد عود سرطان پستان در زنان دریافت کننده شیمیدرمانی با پلاتینوم یا بدون پلاتینوم برای سرطان متاستاتیک پستان وجود نداشت. احتمال بیشتری وجود داشت که شیمیدرمانی با پلاتینوم در مقایسه با شیمیدرمانی بدون پلاتینوم تومورها را کوچک کند، اما این نتیجه باید با احتیاط در نظر گرفته شود.
در مقایسه با زنان دریافت کننده شیمیدرمانی بدون پلاتینوم، زنان دریافت کننده شیمیدرمانی با پلاتینوم نرخ بالاتر تهوع/استفراغ، آنمی، لکوپنی و ریزش مو را تجربه کردند.
این بدان معنی است که توجیه استفاده از شیمیدرمانی حاوی پلاتینوم برای درمان سرطان متاستاتیک پستان، که mTNBC نیست، دشوار است، با توجه به اینکه اثربخشی مشابهی دارند؛ اما شیمیدرمانی با سمیّت کم معمولا در دسترس است. شیمیدرمانی حاوی پلاتینوم ممکن است برای شرکتکنندگان مبتلا به mTNBC با میزان کافی برای توجیه استفاده از آن، مزیت بقا به همراه داشته باشد، اما کیفیت شواهد برای این موضوع در این نقطه زمانی پائین است. پیش از اتخاذ یک نتیجهگیری قطعیتر انجام مطالعات بیشتری مورد نیاز است.
Authors' conclusions
Summary of findings
| Platinum compared to non‐platinum chemotherapy regimens for women with metastatic breast cancer unselected for triple‐negative disease | ||||||
| Patient or population: women with metastatic breast cancer unselected for triple‐negative breast cancer (TNBC) | ||||||
| Outcomes | Anticipated absolute effects* (95% CI) | Relative effect | No. of participants (treatment‐ comparisons) | Quality of the evidence | Comments | |
| Risk with non‐platinum chemotherapy regimens | Risk with platinum | |||||
| Overall survival ‐ trials of metastatic breast cancer participants unselected for TNBC | 1‐year risk of death | HR 1.01 | 2531 (16) | ⊕⊕⊕⊕ | Heterogeneity: P = 0.09, I2=34% | |
| 310 per 1,000 1 | 313 per 1,000 | |||||
| 2‐year risk of death | ||||||
| 540 per 1,000 1 | 543 per 1,000 | |||||
| Progression‐free survival/time to progression (randomised participants) ‐ trials of metastatic breast cancer participants unselected for TNBC | 1‐year risk of progression or death | HR 0.92 | 1745 (13) | ⊕⊕⊕⊝ | Heterogeneity: P = 0.08, I2=38% | |
| 737 per 1,000 1 | 707 per 1,000 | |||||
| 2‐year risk of progression or death | ||||||
| 891 per 1,000 1 | 869 per 1,000 | |||||
| Objective tumour response rate (assessable participants) ‐ trials of metastatic breast cancer participants unselected for TNBC | 493 per 1,000 5 | 547 per 1,000 | RR 1.11 | 3252 (23) | ⊕⊕⊝⊝ | Heterogeneity: P = 0.0002, I2=58% |
| *The risk in the intervention group (and its 95% confidence interval) is based on the assumed risk in the comparison group and the relative effect of the intervention (and its 95% CI). | ||||||
| GRADE Working Group grades of evidence | ||||||
| 1 Estimated from the average of non‐platinum group Kaplan‐Meier probabilities from the three highest weighted non‐TNBC treatment‐comparisons for this outcome 2 Estimated as 1000*(1‐S(t)HR) where S(t) is the estimated probability of survival for non‐platinum participants and HR is the pooled hazard ratio (Davies 1998) 3 Quality of evidence for OS was not downgraded for blinding because this outcome is unlikely to be affected by non‐blinding. 4 Downgraded quality of evidence one level for 'indirectness' because this outcome is a surrogate endpoint of questionable validity for assessing the more important outcome of OS in the context of metastatic breast cancer (Burzykowski 2008) 5 Estimated from all 23 non‐TNBC treatment‐comparisons in the review 6 Downgraded quality of evidence one level for 'inconsistency' because there was substantial evidence of heterogeneity across studies (P < 0.05) | ||||||
| Platinum compared to non‐platinum chemotherapy regimens for women with metastatic triple‐negative breast cancer | ||||||
| Patient or population: women with metastatic triple‐negative breast cancer (mTNBC) | ||||||
| Outcomes | Anticipated absolute effects* (95% CI) | Relative effect | No. of participants (treatment‐ comparisons) | Quality of the evidence | Comments | |
| Risk with non‐platinum chemotherapy regimens | Risk with platinum | |||||
| Overall survival ‐ trials of mTNBC participants | 1‐year risk of death | HR 0.75 | 391 (3) | ⊕⊕⊝⊝ | Heterogeneity: P = 0.23, I2 = 32% | |
| 485 per 1,000 1 | 392 per 1,000 | |||||
| 2‐year risk of death | ||||||
| 655 per 1,000 1 | 550 per 1,000 | |||||
| Progression‐free survival/time to progression (randomised participants) ‐ trials of mTNBC participants | 1‐year risk of death | HR 0.59 | 391 (3) | ⊕⊕⊝⊝ | Heterogeneity: P = 0.07, I2 = 67% | |
| 894 per 1,000 1 | 733 per 1,000 | |||||
| 2‐year risk of death | ||||||
| 987 per 1,000 1 | 922 per 1,000 | |||||
| Objective tumour response rate (assessable participants) ‐ trials of mTNBC participants | 354 per 1,0007 | 470 per 1,000 | RR 1.33 | 878 (5) | ⊕⊕⊝⊝ | Heterogeneity: P = 0.0010, I2 = 78% |
| *The risk in the intervention group (and its 95% confidence interval) is based on the assumed risk in the comparison group and the relative effect of the intervention (and its 95% CI). | ||||||
| GRADE Working Group grades of evidence | ||||||
| 1 Estimated from the average of non‐platinum group Kaplan‐Meier probabilities from the three TNBC treatment‐comparisons contributing data for pooling on this outcome 2 Estimated as 1000*(1‐S(t)HR) where S(t) is the estimated probability of survival for non‐platinum participants and HR is the pooled hazard ratio (Davies 1998) 3 Downgraded quality of evidence one level for 'imprecision' because the confidence interval for the pooled estimate is wide and crosses or nearly crosses unity 4 Downgraded quality of evidence one level for 'suspected publication bias' because Tutt 2014 is a large study with 376 participants but has so far only reported median OS/PFS times. As a consequence, the study did not contribute to the pooled HR estimates for OS or PFS/TTP. The reported median OS/PFS times in Tutt 2014 were similar between platinum and non‐platinum regimens. Hence, it seems likely that if HRs from Tutt 2014 were able to be included in pooled HR estimates, these pooled estimates would be considerably closer to the null. 5 Quality of evidence for OS was not downgraded for blinding because this outcome is unlikely to be affected by non‐blinding. 6 Downgraded quality of evidence one level for 'indirectness' because this outcome is a surrogate endpoint of questionable validity for assessing the more important outcome of OS in the context of metastatic breast cancer (Burzykowski 2008) 7Estimated from all five TNBC treatment‐comparisons in the review 8 Downgraded quality of evidence one level for 'inconsistency' because there was substantial evidence of heterogeneity across studies (P < 0.05) | ||||||
| Platinum compared to non‐platinum chemotherapy regimens for nausea/vomiting, anaemia, hair loss and leukopenia | ||||||
| Patient or population: women with metastatic breast cancer | ||||||
| Outcomes | Anticipated absolute effects* (95% CI) | Relative effect | No. of participants (treatment‐ comparisons) | Quality of the evidence | Comments | |
| Risk with non‐platinum chemotherapy regimens | Risk with platinum | |||||
| Nausea/vomiting* grade 3 or 4 (safety population) by type of platinum agent in platinum regimen | Carboplatin | (RR 0.77, 95% CI 0.47 to 1.26) | 1441 (7) | ⊕⊕⊕⊝ | Test for carboplatin/cisplatin subgroup difference: P < 0.0001 Heterogeneity among carboplatin studies: P = 0.30, I2 = 17% Heterogeneity among cisplatin studies: P = 0.010, I2 = 32% | |
| 80 per 1,000 1 | 62 per 1,000 | |||||
| Cisplatin | (RR 2.65, 95% CI 2.10 to 3.34) | 1747 (14) | ⊕⊕⊕⊝ | |||
| 80 per 1,000 1 | 210 per 1,000 | |||||
| Anaemia grade 3 or 4 (safety population) by type of platinum agent in platinum regimen | Carboplatin | (RR 1.72, 95% CI 1.10 to 2.70) | 1441 (7) | ⊕⊕⊕⊕ | Test for carboplatin/cisplatin subgroup difference: P = 0.02 Heterogeneity among carboplatin studies: P = 0.67, I2 = 0% Heterogeneity among cisplatin studies: P = 0.50, I2 = 0% | |
| 33 per 1,000 1 | 57 per 1,000 | |||||
| Cisplatin | (RR 3.72, 95% CI 2.36 to 5.88) | 1644 (13) | ⊕⊕⊕⊕ HIGH | |||
| 33 per 1,000 1 | 123 per 1,000 | |||||
| Hair loss grade 3 or 4 (safety population) | Carboplatin or cisplatin | (RR 1.41, 95% CI 1.26 to 1.58) | 1452 (13) | ⊕⊕⊕⊕ | Test for carboplatin/cisplatin subgroup difference: P = 0.23 Heterogeneity: P = 0.10, I2 = 40% | |
| 264 per 1,000 1 | 372 per 1,000 | |||||
| Leukopenia** grade 3 or 4 (safety population) | Carboplatin or cisplatin | (RR 1.38, 95% CI 1.21 to 1.57) | 3176 (22) | ⊕⊕⊕⊝ | Test for carboplatin/cisplatin subgroup difference: P = 0.22 Heterogeneity: P = 0.0002, I2 = 60% | |
| 179 per 1,000 1 | 247 per 1,000 (217 to 281) | |||||
| *The risk in the intervention group (and its 95% confidence interval) is based on the assumed risk in the comparison group and the relative effect of the intervention (and its 95% CI). | ||||||
| GRADE Working Group grades of evidence | ||||||
| 1 Estimated from all treatment‐comparisons (cisplatin and carboplatin) contributing data for pooling for this outcome 2 Downgraded quality of evidence one level for 'imprecision' because the confidence interval for the pooled estimate is wide and does not rule out 'no effect' 3 Downgraded quality of evidence one level for 'inconsistency' because there was substantial evidence of heterogeneity across studies (P < 0.05) *data on vomiting was included if data on nausea/vomiting was reported separately **data on neutropenia was included if data on leukopenia was not reported | ||||||
Background
Description of the condition
Breast cancer is both the most common type of cancer in women and the most common cause of cancer death in women (Ferlay 2013). In 2012, there was an estimated 1.67 million estimated new cases and approximately 522,000 deaths from breast cancer worldwide, with an age standardised death rate (ASR) of 12.9 per 100,000 (Ferlay 2013). ASRs of 25 or greater were recorded that same year in Fiji (28.4), Bahamas (26.3), Nigeria (25.9), Former Yugoslav Republic (FYR) Macedonia (25.5) and Pakistan (25.2) (Ferlay 2013).
The stage of breast cancer at the time of diagnosis is an important indicator of prognosis. Once breast cancer becomes metastatic, it is not generally considered curable and most women with metastatic disease do not survive beyond five years from the time of their metastatic diagnosis (Clements 2012). Another important predictor of prognosis is the biological subtype of breast cancer. One of these subtypes — triple‐negative breast cancer (TNBC) — is characterised by a lack of expression of oestrogen and progesterone receptors (ER and PgR) and human epidermal receptor 2 (HER2). TNBC comprises approximately 12 to 17% of breast cancers and is associated with shorter survival and higher likelihood of recurrence (Foulkes 2010). The median survival time for women diagnosed with metastatic TNBC (mTNBC) is about one year from their metastatic diagnosis (Kassam 2009).
Although there is no evidence from randomised trials comparing chemotherapy with observation (no chemotherapy) in women with metastatic breast cancer, it is widely accepted that women with metastatic disease should receive some form of systemic therapy at some time during the course of their metastatic disease. Chemotherapy is considered by many to be the appropriate first treatment option for women with multiple sites of recurrence or where visceral disease is not easily treated by local modalities (Hayes 1995; Beslija 2009). Chemotherapy is also considered to be useful in women whose cancer is hormone refractory or is expected to be hormone resistant (Hortobagyi 1996).
Description of the intervention
Platinum compound, an alkylating agent, has been known to be active in metastatic breast cancer since clinical trials in the 1970s. However, it is more toxic and difficult to administer than other chemotherapy agents. The three most widely used platinum agents for treating breast cancer are cisplatin, carboplatin (both divalent complexes) and oxaliplatin (a tetravalent complex) (Sikov 2015). Cisplatin and carboplatin have demonstrated benefits in treating a number of cancer types including lung, testicular, head and neck, bladder and ovarian cancers. Oxaliplatin is often used to treat cisplatin‐ and carboplatin‐resistant tumours because it is commonly believed that cross‐resistance between oxaliplatin and cisplatin or carboplatin is incomplete (Mani 2002). More recent evidence suggests that the benefits of oxaliplatin may be due to its low toxicity and ability to be combined with other drugs rather than incomplete cross‐resistance with other platinum agents (Stordal 2007).
The use of oxaliplatin for treating breast cancers is much less common than the use of cisplatin or carboplatin, both in normal clinical practice and as an intervention in clinical trials (Sikov 2015). Cisplatin and carboplatin have been used and studied extensively as first‐line metastatic therapy in combination with other older pharmacological agents including 5‐fluorouracil and etoposide, and more recently with doxorubicin, epirubicin, vinorelbine, paclitaxel, docetaxel, cyclophosphamide, methotrexate and gemcitabine. The potential benefits of cisplatin or carboplatin as monotherapy for metastatic breast cancer, rather than as combination therapy, are rarely studied in clinical trials.
Although platinum agents have been shown to be efficacious in the treatment of a number of cancer types, their use is often associated with a variety of side effects. The known side effects of platinum agents include nausea, vomiting, myelosuppression (thrombocytopenia, leukopenia, neutropenia and anaemia), peripheral neuropathy (symptoms include tingling in fingers and toes), nephrotoxicity, ototoxicities (hearing loss and tinnitus), hypomagnesaemia and anaphylaxis. Carboplatin is reported to be more tolerable than cisplatin with less nausea and vomiting, nephrotoxicity, ototoxicity and neurotoxicity, but worse myelosuppression, especially thrombocytopenia (Sikov 2015).
How the intervention might work
The exact mechanism of action of platinum agents is not known but deoxyribonucleic acid (DNA) adducts are formed (Sikov 2015). These complexes are believed to inhibit DNA synthesis, replication and transcription by forming interstrand and intrastrand cross‐linking of DNA molecules. Interstrand cross‐links that remain intact can produce cell death, and it is this cytotoxic effect, when successful, that forms the mechanistic basis of action for cancer cell death by platinum agents (Noll 2006). For TNBC, it has been additionally hypothesised that a dysfunctional BRCA1 pathway in some TNBCs may make them more sensitive to platinum agents that selectively target cells deficient in homologous recombination DNA repair (Foulkes 2010).
Why it is important to do this review
There are a number of reasons for updating this review. First, this review was originally published in 2004 (Carrick 2004) and was based on 12 studies (13 treatment‐comparisons) identified from a May 2003 search of the literature. Although there have since been some updates to this review containing minor amendments, no new searches for relevant studies have been conducted since 2003. In the current review update, the number of included studies has increased from 12 in the original version of this review to 24 (28 treatment‐comparisons). This allows effects to be estimated with greater precision than before and provides an opportunity to conduct new subgroup analyses corresponding to emerging evidence and new hypotheses. Second, all 12 studies included in the original version of this review were conducted prior to the 'intrinsic subtype' era and thus did not specifically focus on TNBC (a term first mentioned in the medical literature in October 2006) (Foulkes 2010). Since 2009, however, five randomised control trials have published data specifically on the effects of platinum‐based regimens on survival, progression or tumour response in mTNBC participants; the inclusion of these five trials in this review update represents the first meta‐analysis of such trials. Third, some interest remains in the use of platinum agents for the treatment of women with metastatic breast cancer in general (i.e. unselected for intrinsic subtypes such as mTNBC) (Shamseddine 2012). This is notwithstanding the primary conclusion contained in the original version of this review that "...in view of the significant excess toxicity, lack of progression or survival benefit and the availability of less toxic active agents it is difficult to justify the use of platinum‐containing regimens, particularly as first‐line treatment for women with metastatic breast cancer in routine clinical practice."
Objectives
To identify and review the evidence from randomised trials comparing platinum‐containing chemotherapy regimens with regimens not containing platinum in the management of women with metastatic breast cancer.
Additional objectives of this review were to investigate whether or not women in selected subgroups of studies benefited more or less from platinum‐based chemotherapy. Some subgroup analyses included in this review update were conducted in the original version of this review, while others have been added in response to new hypotheses and the availability of new subgroups.
Methods
Criteria for considering studies for this review
Types of studies
Properly randomised controlled clinical trials (i.e. where the trial report asserts that the trial was randomised and there was no evidence to suggest otherwise).
Types of participants
Women with advanced (metastatic) breast cancer, either newly diagnosed or recurrent. Treatment‐comparisons that included both women with metastatic disease and women with loco‐regionally recurrent disease only were eligible for inclusion if it was possible to distinguish between the two groups (i.e. data were reported separately) or if women with isolated locoregional recurrence were less than 20% of the total group. There were no age restrictions.
In the protocol for this review, it was proposed that treatment‐comparisons would be included if the women randomised to receive chemotherapy, were to receive it as first‐line treatment (i.e. no previous chemotherapy given except as adjuvant therapy). As few treatment‐comparisons assessing first‐line treatment were identified for inclusion in the original version of this review, those meeting the remaining eligibility criteria but which involved participants who were not first‐line naive were included. This modification of the inclusion criteria was maintained for this review update, with subgroup analysis by treatment being performed (treatment‐comparisons with first‐line therapy for > 80% of participants vs other treatment lines).
Types of interventions
Interventions were any chemotherapy regimen containing a platinum agent (see Table 1 and Table 2). Comparators were any chemotherapy regimen without a platinum agent. Endocrine therapy may also have been given to participants if it was planned to be given to both treatment groups.
Studies may or may not have specified recommended treatment upon disease progression or initial treatment failure or both. This recommended treatment may have included cross‐over to the alternative treatment arm of the treatment‐comparison.
| Generic name | Other names |
| Carboplatin | Blastocarb, Carboplat, Carboplatin Hexal, Carboplatino, Carbosin, Carbosol, Carbotec, CBDCA, Displata, Ercar, Nealorin, Novoplatinum, Paraplat, Paraplatin AQ, Paraplatin, Paraplatine, Platinwas, Ribocarbo |
| Cisplatin | Abiplatin, Blastolem, Briplatin,CACP, CDDP, cis‐DDP, cis‐diamminedichloridoplatinum, cis‐diamminedichloro platinum (II), cis‐diamminedichloroplatinum, Cis‐dichloroammine Platinum (II), Cismaplat, Cisplatina, cis‐platinous diamine dichloride, cis‐platinum II diamine dichloride, cis‐platinum II, cis‐platinum, Cisplatyl, Citoplatino, Citosin, CPDD, Cysplatyna, DDP, DDP, Lederplatin, Metaplatin, Neoplatin, PDD, Peyrone's Chloride, Peyrone's Salt, Placis, Platamine, Platiblastin, Platiblastin‐S, Platinex, Platinol‐ AQ, Platinol, Platinol‐AQ VHA Plus, Platinol‐AQ, Platinoxan, platinum diamminodichloride, Platiran, Platistin, Platosin |
| Oxaliplatin | Ai Heng, Aiheng, diaminocyclohexane oxalatoplatinum, oxalatoplatin, oxalatoplatinum, oxaliplatine, Eloxatin, Dacotin, Dacplat, Eloxatine, 1‐OHP, L‐OHP, oxaliplatin medac |
| Type of Agent | Action | Includes |
| Agents that damage the DNA template | by alkylation: nitrogen mustards | cyclophosphamide, melphalan, ifosfamide, chlorambucil |
| by alkylation: nitrosureas | carmustine (BCNU), lomustine (CCNU) | |
| by alkylation: other agents | thiotepa, mitomycin C | |
| by platinum coordination cross‐linking | cisplatin, carboplatin | |
| antibiotics | doxorubicin, daunorubicin, mitoxantrone, idarubicin, epirubicin, amsacrine | |
| podophyllotoxins | etoposide, teniposide | |
| by intercalation | dactinomycin, mithramycin | |
| by uncertain mechanisms | bleomycin | |
| Spindle poisons | vinca alkaloids | vincristine, vinblastine, vendesine, vinorelbine |
| taxanes | taxol, taxotere | |
| Antimetabolites | thymidylate synthase | 5‐fluorouracil |
| dihydrofolate reductase | methotrexate |
Types of outcome measures
Primary outcomes
-
Overall survival (OS)
-
Progression‐free survival/time to progression (PFS/TTP)
Secondary outcomes
-
Time to treatment failure (TTF)
-
Objective tumour response rate (OTRR)
-
Toxicity rates (multiple condition‐specific outcomes)
-
Quality of life measures (multiple outcomes)
The definitions of some outcomes varied slightly across studies included in this review. Outcomes were commonly defined as:
-
Overall survival (OS): time elapsed between randomisation (or study enrolment or treatment initiation) to date of death from any cause.
-
Progression‐free survival (PFS): time elapsed between randomisation (or study enrolment or treatment initiation) and event, with event defined as disease progression or death from any cause.
-
Time to progression (TTP): time elapsed between randomisation (or study enrolment or treatment initiation) and event, with event defined as disease progression (which sometimes included cause‐specific death from the study disease).
-
Time to treatment failure (TTF): time elapsed between randomisation (or study enrolment or treatment initiation) to treatment discontinuation for any reason, including disease progression, treatment toxicity, participant preference, or death.
-
Objective tumour response rate (OTRR): the proportion of participants who experienced a complete or partial tumour response (versus stable disease or no response).
-
Toxicity rates (multiple condition‐specific outcomes): the proportions of participants who experienced a grade 3 or 4 adverse event of nausea and vomiting, nephrotoxicity, anaemia, hair loss and leukopenia based on WHO criteria or individual protocol‐based definitions. We also investigated treatment‐related death which, for the purpose of this review, was defined as death due to the toxicity of the drug and not to disease progression. If an individual trial did not include their definition of a treatment‐related death but used the terms 'toxic death' or 'lethal toxicity', then these deaths were still included in the pooled analysis of treatment related deaths.
-
Quality of life measures (QoL) (multiple outcomes): various validated instruments for measuring various quality of life domains.
For the purposes of this review, PFS and TTP were analysed as the same outcome (referred to as PFS/TTP), with preference given to PFS for studies reporting both PFS and TTP extractable data.
Search methods for identification of studies
Electronic searches
For this update of the review, we searched the following databases and registries on the 28 May 2015.
(a) The Cochrane Breast Cancer Specialised Register maintained by the Cochrane Breast Cancer Group (searched 1 June 2015). Details of the search strategies used by the Cochrane Breast Cancer Group for the identification of studies and the procedure used to code references are outlined in their module (www.mrw.interscience.wiley.com/cochrane/clabout/articles/BREASTCA/frame.html). Trials coded with the key words 'advanced', 'Cisplatin', 'cisplatinum', 'carboplatin', 'carboplatinum', 'platin', 'platinum', 'platinum diamminodichloride', 'cis‐diamminedichloroplatinum', 'cis‐dichlorodiammineplatinum', 'biocisplatinum', 'dichlorodiammineplatinum', 'nsc‐119875', 'platidiam', 'platino', 'Platinol', 'cis‐diamminedichloroplatinum', 'cis‐platinum', 'cis‐diammine (cyclobutanedicarboxylato) platinum', 'cbdca', 'jm‐8', 'nsc‐241240', 'paraplatin' were extracted for consideration.
(b) Cochrane Central Register of Controlled Trials (CENTRAL; 2015, Issue 4) in the Cochrane Library (searched 28 May 2015). See Appendix 1.
(c) MEDLINE (via OvidSP; July 2008 to 28 May 2015). Searches were conducted from 2008 due to the Cochrane Breast Cancer Group's Specialised Register being out‐of‐date for an interim period. See Appendix 2.
(d) Embase (Via Embase.com; July 2008 to 28 May 2015). Searches were conducted from 2008 due to the Cochrane Breast Cancer Group's Specialised Register being out‐of‐date for an interim period. See Appendix 3.
(e) The WHO International Clinical Trials Registry Platform (ICTRP) search portal (http://apps.who.int/trialsearch/Default.aspx) for all prospectively registered and ongoing trials. See Appendix 4.
(f) ClinicalTrials.gov (http://clinicaltrials.gov/ct2/home). See Appendix 5.
No restrictions were applied based on language.
Searching other resources
In addition, we searched the reference lists of other, related literature reviews.
Data collection and analysis
Selection of studies
In the original version of this review and in this review update, two reviewers applied the selection criteria (including the quality of randomisation) to each reference identified by the search strategy while masked to the study results. Any discrepancies regarding eligibility or quality were resolved by consensus or adjudication from a third reviewer. Studies that may appear to have met the eligibility criteria, but which were deemed ineligible are listed in the Characteristics of excluded studies table.
Data extraction and management
In the original version of this review and in this review update, data on the relevant outcomes were extracted by at least two reviewers, with discrepancies resolved by consensus or adjudication from another reviewer. Data were also extracted on information relating to outcome definitions, study accrual, randomisation methods, baseline characteristics of participants (e.g. age, first‐line/second‐line treatment, prior anthracyclines/anthracycline‐naïve), chemotherapy regimens (number of cycles and duration), follow‐up time and analytical methods used. Where available, multiple publications on the same study were obtained and the most complete report was assigned as the primary reference. In instances where a more recent publication was used in this review update for a study that was included in the original version of this review, the year of the reference ID was also updated. Data were entered into the Cochrane Review Manager 5.3 (RevMan 5.3) software, and RevMan 5.3 was used for most statistical analyses.
Assessment of risk of bias in included studies
In this review update, potential sources of bias for all included studies (including those in the original version of this review) were assessed using Cochrane's 'Risk of bias' assessment tool (Higgins 2011). Risk of bias for each treatment‐comparison was evaluated independently by at least two reviewers and discrepancies were resolved by consensus or adjudication from an additional reviewer. Clarification from authors was sought if the published data provided inadequate information for the review. The 'risk of bias' domains that were assessed were 'random sequence generation', 'allocation concealment', 'blinding of participants and personnel', 'blinding of outcome assessment', 'incomplete outcome data', 'selective reporting' and 'other bias'. For each included study, ratings of 'high', 'low', or 'unclear' risk of bias were assigned for each risk of bias domain following criteria outlined in the 'Risk of bias' assessment tool (Higgins 2011).
Open‐label studies are common in phase III oncology trials because it is often difficult to conceal treatments from participants, care‐providers and outcome assessors (due to differences in toxicities and treatment schedules of various treatments, for example). However, because a lack of blinding can affect risk of bias in different ways for different outcomes, we assessed 'blinding of outcome assessment' by dividing outcomes into two outcome classes: 1) OS and 2) outcomes other than OS and quality of life. This division was made because, unlike other outcomes, assessment of OS is unlikely to be affected by non‐blinding.
We also divided the 'incomplete outcome data' risk of bias domain into two outcome classes: 1) time‐to‐event outcomes and 2) binary (i.e. dichotomous) outcomes. For time‐to‐event outcomes, risk of bias was deemed low, unclear, and high risk if time‐to‐event analysis was intention‐to‐treat (ITT), modified intention‐to‐treat (mITT) or per‐protocol, respectively. For the binary outcomes (OTRRs and toxicity rates), risk of bias was deemed low, unclear, and high risk if the highest percentage of randomised participants excluded from effect estimation was less than 10%, between 10% and 15%, or more than 15%, respectively.
For 'risk of bias' domains that were divided into outcome classes, assessments were made for all studies known to be measuring the outcomes, regardless of results being reported in sufficient detail to be included in meta‐analysis or reported at all (e.g. a study might specify OS as an outcome in the study protocol but not report any results).
Measures of treatment effect
OS, PFS/TTP and TTF were analysed as time‐to‐event outcomes, for which the hazard ratio (HR) is the most appropriate measure of treatment effect. If reported, the HR and associated variance were extracted directly from the trial publication(s), and these were used to calculate observed (O) minus expected (E) numbers of events and logrank variance (V) for each treatment‐comparison using the methods described by Tierney 2007 or Parmar 1998. If not reported, O ‐ E and V were obtained indirectly from other available summary statistics or from data extracted from published Kaplan‐Meier curves using the methods described by Tierney 2007 or Parmar 1998. For studies that did not report the relevant effect estimates and required curve extraction, the numbers at risk were based on reported minimum and maximum follow‐up times. If these were not reported, minimum follow‐up was estimated as the time taken to complete treatment, and maximum follow‐up was estimated using the last event reported in the relevant time‐to‐event curve. These follow‐up estimates were recorded in the Characteristics of included studies table under 'Notes'. For the purposes of data extraction, preference was given to time‐to‐event effect estimates derived from ITT analysis, followed by mITT analysis, then per‐protocol analysis.
Pooled HRs and 95% confidence intervals (CIs) were obtained from the O ‐ E and V statistics for each treatment‐comparison using the fixed‐effect model (Yusuf 1985). The pooled HR represented the instantaneous risk of an event (such as death, disease progression or treatment failure) for women receiving platinum divided by the corresponding risk for those not receiving platinum. HRs less than 1.00 favoured the platinum‐containing regimens and values greater than 1.00 favoured non‐platinum regimens.
Toxicity rates and OTRRs were analysed as proportions using the risk ratio (RR) as the measure of treatment effect. OTRRs were most often calculated by trialists using only participants that were assessable for tumour response. These 'assessable participants' were generally defined as participants whose tumour response could be assessed according to prespecified criteria such as RECIST (Eisenhauer 2009), but this definition was sometimes extended to additionally exclude participants who had not received a specified minimum dose of chemotherapy. In this review update and in the original version of this review, we calculated OTRRs using the numbers of assessable participants in the OTRR denominators, but we also separately calculated OTRRs using the numbers of randomised participants in the denominators. In this review update, however, only the results from the assessable participants analyses were reported as there was almost no difference between the results obtained using assessable and randomised participant denominators (the latter are available on request). Toxicity rates were most often calculated by trialists using a 'safety population' of participants who received a specified minimum dose of chemotherapy. We calculated toxicity rates for each study using the population used by that study.
Pooled RRs and 95% confidence intervals were obtained through Mantel‐Haenszel fixed‐effect analysis. The pooled RR represented the cumulative risk of an event for participants receiving platinum divided by the corresponding risk for those not receiving platinum. RRs greater than 1.00 favoured platinum‐containing regimens and values less than 1.00 favoured non‐platinum regimens.
Quality of life was generally reported as a continuous outcome. Hence, if sufficient quality of life data become available for meta‐analysis in future review updates, the effect measure would most likely be the mean difference (MD) or standardised mean difference (SMD), depending on whether the same or different validated questionnaires (respectively) were employed.
Unit of analysis issues
Treatment‐comparisons were the unit of analysis in this review and corresponded to pairwise comparisons of platinum and non‐platinum regimens. Individual studies assessing more than one platinum‐based regimen or more than one non‐platinum regimen (or both) contributed more than one treatment‐comparison to the review. Consequently, there were more treatment‐comparisons in this review than there were studies.
Two studies each contained two non‐platinum regimen (control) groups for comparison against a single platinum‐based regimen (intervention) group. This was taken into account when treatment effect statistics were calculated by splitting each study into two treatment‐comparisons (Stemmler 2011 A, Stemmler 2011 B and Fountzilas 2009 A, Fountzilas 2009 B) and halving the number of participants in their intervention groups (for odd numbered group sizes, the additional participant was arbitrarily distributed to the treatment‐comparison with label ending with 'A'). Another study contained two platinum‐based regimen (intervention) groups for comparison against a single non‐platinum (control) group. This study was split into two treatment‐comparisons (Xu 2011 A, Xu 2011 B) with treatment effect statistics calculated by halving the number of participants in the control group (with additional participants again arbitrarily distributed to treatment‐comparisons with label ending with 'A'). One other study was a four‐armed trial and was also reported as two separate treatment‐comparisons (Berruti 2002 A, Berruti 2002 B). For these two treatment‐comparisons, no adjustments to participant numbers were required as their control and intervention groups were unique to each comparison. These methods for correcting for multiple intervention and/or control groups were suggested in the Cochrane Handbook (Higgins 2011).
Dealing with missing data
Attempts were made to contact a number of trial investigators for additional information. Three trialists (Cocconi, Costanza and Fountzilas) provided additional time‐to‐event data which allowed HRs to be extracted.
Assessment of heterogeneity
Heterogeneity between trial results was assessed using the Chi2 test statistic and the I2 statistic. The Chi2 test statistic assesses the amount of variation in a set of trials. Small P values for the Chi2 test statistic suggest that there is more heterogeneity present than would be expected by chance. Chi2 is not a particularly sensitive test: a cut‐off of P value less than 0.10 is often used to indicate significance, but lack of statistical significance does not mean there is no heterogeneity. I2 is the proportion of variation that is due to heterogeneity rather than chance. In conjunction with the Chi2 test, we used the I2 statistic to assess heterogeneity using the rule of thumb guide outlined in the Cochrane Handbook (Higgins 2011) (i.e. I2 between 0% to 40% might not be important; between 30% to 60% may represent moderate heterogeneity; between 50% to 90% may represent substantial heterogeneity; and between 75% to 100% considerable heterogeneity).
Assessment of reporting biases
In addition to assessing each treatment‐comparison individually for 'selective reporting' using the Cochrane Collaboration's 'Risk of bias' assessment tool (see Assessment of risk of bias in included studies above), publication bias and/or small‐study effects were assessed for the outcomes OS, PFS/TTP and OTRR by visual inspection of funnel plot asymmetry. Egger's statistical test was used to formally assess the degree of asymmetry (Egger 1997).
Data synthesis
For time‐to‐event outcomes, RevMan 5.3 was used to estimate pooled HRs and 95% CIs using fixed‐effect models of the derived or reported observed (O) and expected (E) number of events and the variance of the log‐rank statistic (V) for each trial. For binary outcomes, RevMan 5.3 was used to estimate pooled RRs and 95% CIs using the fixed‐effect Mantel‐Haenszel method.
The standard GRADE system (Guyatt 2011) was to use to rate the quality of evidence relating to the estimated treatment effects on OS, PFS/TTP, OTRR, nausea/vomiting, anaemia, hair loss and leukopenia. GRADE criteria for assessing quality of evidence include 'study design', 'risk of bias', 'inconsistency', 'indirectness', 'imprecision', 'suspected publication bias' and 'other considerations'. Assessments of these criteria and corresponding justifications are provided in three 'Summary of findings' tables largely created using GRADEproGDT (GradeproGDT). GRADE assessments were performed separately for selected subgroups related to effect estimate heterogeneity (or 'inconsistency' as labelled in the GRADE assessment criteria).
Subgroup analysis and investigation of heterogeneity
Subgroup analyses were performed to determine whether the results differed by:
-
mTNBC status: (a) mTNBC participants, (b) participants unselected for mTNBC;
-
type of regimen comparison: (a) regimen A + platinum vs regimen A, (b) regimen A + platinum vs regimen B, (c) single agent platinum vs regimen C; (note that we allowed "regimen A" to differ in dosage by small amounts between intervention and control arms)
-
type of platinum agent in platinum arm: (a) cisplatin, (b) carboplatin, (c) oxaliplatin;
-
first‐line therapy: (a) first‐line therapy for > 80% of participants, (b) second‐ or third‐line therapy for ≥ 20% of participants;
-
anthracycline in regimens: (a) no anthracycline in platinum or non‐platinum regimens, (b) platinum + anthracycline vs non‐platinum + anthracycline regimen, (c) platinum + anthracycline vs non‐platinum + non‐anthracycline regimens;
-
taxane in regimens: (a) no taxane in platinum or non‐platinum regimens, (b) platinum + taxane vs non‐platinum + taxane regimens, (c) platinum + non‐taxane vs non‐platinum + taxane regimens;
-
trastuzumab in regimens: (a) no trastuzumab in platinum or non‐platinum regimens, (b) platinum + trastuzumab vs non‐platinum + trastuzumab regimens
Possible subgroup differences were assessed using Chi2 tests.
Of the above seven subgroup analyses:
-
Subgroup analysis 2 was the only 'a priori' subgroup analysis pre‐specified in the review protocol; all other subgroup analyses were 'post hoc'.
-
Subgroup analyses 2, 4, 5 and 6 were conducted in the original review, although additional subgroups have been added for some of these analyses (eg. the conjugate subgroup 'second‐ or third‐line therapy for ≥ 20% of participants' has been added to the 'first‐line therapy' analysis).
-
In order to reduce the number of forest plots in this review update, toxicity rates were only assessed overall and by subgroup analysis 3 (as 'type of platinum agent' is known to be related to toxicity). Analyses of toxicity rates by other subgroups are available on request.
In this review update, the subgroupings of a few studies have been corrected from the original version of the review. Furthermore, the subgroup analysis 'first‐line therapy' was incorrectly labelled '100% firstline trials' in the original version of the review and the actual cut‐off that was applied was first‐line therapy for > 80% of participants.
Sensitivity analysis
Sensitivity analyses were performed to assess whether apparent inconsistencies in results relating to OS, PFS/TTP and OTRR were more likely to be due to differences in the underlying nature of these outcomes, or an artefact of the different treatment‐comparisons available for the meta‐analysis of each outcome. First, the pooled effect estimate for OTRR was recalculated restricting the meta‐analysis to the 19 treatment‐comparisons with extractable data on OS. Second, the pooled effect estimates for PFS/TTP and OS were recalculated restricting both meta‐analyses to the 12 treatment‐comparisons with extractable data on both OS and PFS/TTP.
In additional sensitivity analyses, PFS/TTP estimates were stratified according to whether the outcome was PFS or TTP. For these analyses, estimates were classified as PFS if the event of interest was defined as disease progression or death from any cause. Estimates were classified as TTP if the event of interest was defined as disease progression, which may also include cause‐specific death from breast cancer. In instances where the event of interest was ambiguously defined or not defined at all, we relied on the authors label of the outcome for classifying as PFS or TTP.
Lastly, to assess the sensitivity of our primary results to our choice of analytical method, we repeated Analysis 1.1, Analysis 1.2 and Analysis 1.3 but using random‐effects rather than fixed‐effect methods.
Results
Description of studies
Results of the search
For the 2016 review update, we reviewed 1644 unique records identified by the May 2015 database searches (Figure 1). Of these, 1610 could be excluded based on information in the title or abstract, and nine records from trial registries or protocol publications were considered to be potentially relevant ongoing studies yet to publish results (see Characteristics of ongoing studies). For the remaining 25 records, we retrieved full‐text articles or abstracts for further examination. Eight of the 25 articles or abstracts were excluded because they were reviews (but these were still used to search for further studies by handsearching the bibliographies) and three other full‐text articles were excluded for reasons outlined in the Characteristics of excluded studies table.
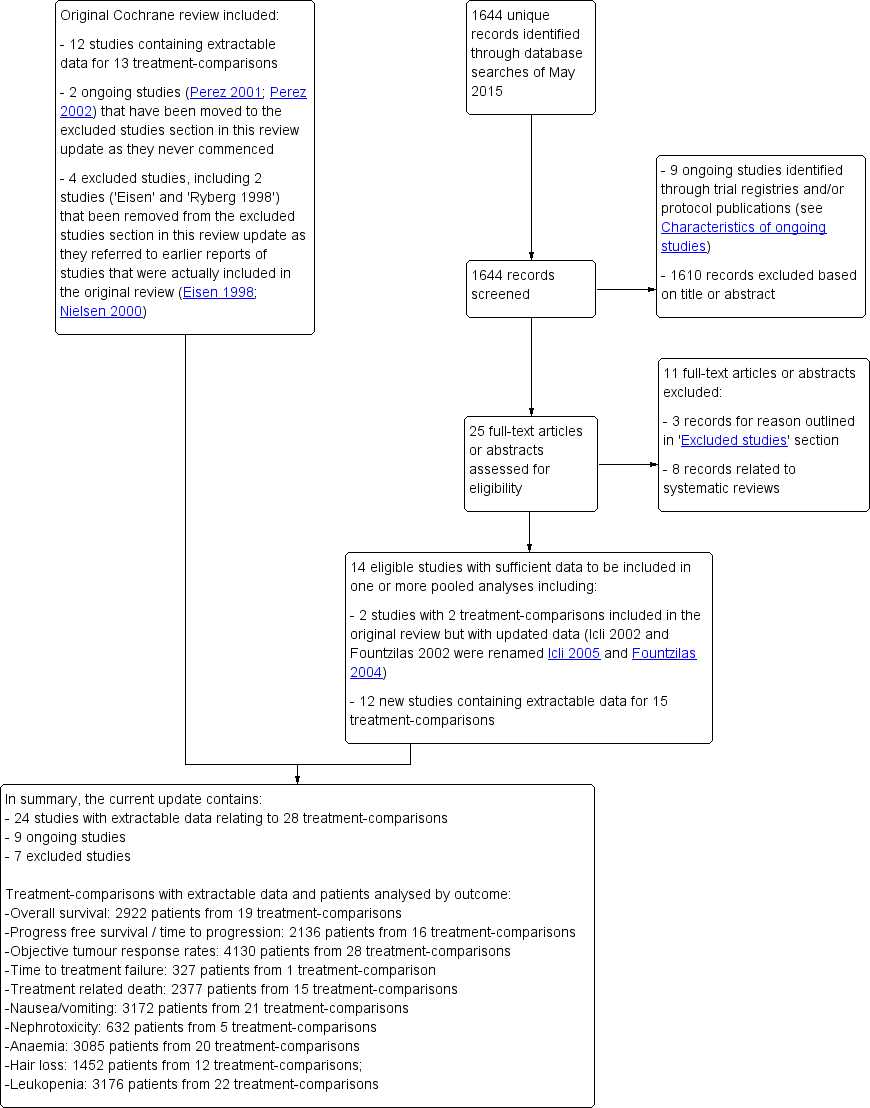
Review update 2016: study flow diagram.
Included studies
Fourteen studies containing 17 treatment‐comparisons with sufficient data to be included in one or more pooled analyses were identified by this review update. Of these 17 treatment‐comparisons, two had been included in the original review but had since published updated results (Icli 2002 and Fountzilas 2002 in the original review were renamed Icli 2005 and Fountzilas 2004 in this review update), and 15 were new to the review (Amadori 2013 ;Bhattacharyya 2009; Carey 2012; Fan 2012; Delaloge 2004; Fountzilas 2009 A; Fountzilas 2009 B; Hu 2015; Robert 2006; Stemmler 2011 A; Stemmler 2011 B; Tutt 2014; Valero 2011; Xu 2011 A; Xu 2011 B). Overall, the review now includes results from 24 studies corresponding to 28 treatment‐comparisons (see Characteristics of included studies).
Of the 28 treatment‐comparisons included in this review update (Table 3):
| Outcome | ||||
| Subgroup | Treatment‐ comparisons N | Overall survival n (% of N) | Progression ‐free survival/time to progression n (% of N) | Objective response rate n (% of N) |
| Overall: | 28 | 19 (68%) | 16 (57%) | 28 (100%) |
| Type of platinum agent in platinum arm: | ||||
| Cisplatin in platinum arm | 17 | 11 (65%) | 11 (65%) | 17 (100%) |
| Carboplatin in platinum arm | 10 | 8 (80%) | 5 (50%) | 10 (100%) |
| Oxaliplatin in platinum arm | 1 | (0%) | (0%) | 1 (100%) |
| Type of regimen comparison: | ||||
| Regimen A + platinum agent vs regimen A | 9 | 6 (67%) | 6 (67%) | 9 (100%) |
| Regimen A + platinum agent vs regimen B | 18 | 13 (72%) | 10 (56%) | 18 (100%) |
| Single agent platinum vs regimen C | 1 | (0%) | (0%) | 1 (100%) |
| First‐line therapy: | ||||
| First‐line therapy for > 80% of participants | 20 | 15 (75%) | 11 (55%) | 20 (100%) |
| Second‐ or third‐line therapy for ≥ 20% of participants | 8 | 4 (50%) | 5 (63%) | 8 (100%) |
| Participant selection for mTNBC: | ||||
| Participants with mTNBC | 5 | 3 (60%) | 3 (60%) | 5 (100%) |
| Participants unselected for mTNBC | 23 | 16 (70%) | 13 (57%) | 23 (100%) |
| Anthracycline in regimens: | ||||
| No anthracycline in platinum or non‐platinum regimens | 18 | 14 (78%) | 11 (61%) | 18 (100%) |
| Platinum + anthracycline vs non‐platinum + anthracycline regimens | 6 | 3 (50%) | 4 (67%) | 6 (100%) |
| Platinum + anthracycline vs non‐platinum + non‐anthracycline regimens | 4 | 2 (50%) | 1 (25%) | 4 (100%) |
| Taxane in regimens: | ||||
| No taxane in platinum or non‐platinum regimens | 17 | 9 (53%) | 9 (53%) | 17 (100%) |
| Platinum + taxane vs non‐platinum + taxane regimens | 6 | 6 (100%) | 3 (50%) | 6 (100%) |
| Platinum + non‐taxane vs non‐platinum + taxane regimens | 5 | 4 (80%) | 4 (80%) | 5 (100%) |
| Trastuzumab in regimens: | ||||
| No trastuzumab in platinum or non‐platinum regimens | 26 | 17 (65%) | 14 (54%) | 26 (100%) |
| Platinum + trastuzumab vs non‐platinum + trastuzumab regimens | 2 | 2 (100%) | 2 (100%) | 2 (100%) |
-
17 (61%) used cisplatin, 10 (36%) used carboplatin and one (4%) used oxaliplatin as the platinum agent in the intervention arm;
-
9 (32%) compared 'regimen A + platinum vs regimen A', 18 (64%) compared 'regimen A + platinum vs regimen B' and one (4%) compared single agent platinum vs regimen C' (Table 4);
-
20 (71%) had more than 80% of participants receiving first‐line therapy;
-
5 (18%) were designed to assess participants with mTNBC;
-
18 (64%) had no anthracycline in the platinum or non‐platinum regimens, six (21%) had an anthracycline in both regimens, and four (14%) had an anthracycline in the platinum regimen only;
-
17 (61%) had no taxane in the platinum or non‐platinum regimens; six (21%) had a taxane in both regimens and five (18%) had a taxane in the non‐platinum regimen only;
-
26 (93%) had no trastuzumab in the platinum or non‐platinum regimens and two (7%) had a trastuzumab in both regimens.
| Trials ID | Arm 1 (platinum‐containing) | Arm 2 (control) | First‐line therapy for > 80% of participants | Majority participants anthracycline‐naive |
| Regimen A + platinum vs regimen A | ||||
| Epi + Cis (epirubicin+cisplatin) | Epi (epirubicin) | Y | Y | |
| Epi + Cis + LND (epirubicin+cisplatin+lonidamine) | Epi + LND (epirubicin + lonidamine) | Y | Y | |
| Endoxan 50 mg per day at 10 am and methotrexate 2.5 mg twice a day at 9 am and 5 pm and with 'cisplatinum' | Endoxan 50 mg per day at 10 am and methotrexate 2.5 mg twice a day at 9 am and 5 pm | N | N | |
| C + Cb (Cetuximab + carboplatin) | C (Cetuximab with carboplatin added after progression) | N | N | |
| CBDA + CAF (carboplatin + cycloheximide + doxorubicin + fluorouracil + methotrexate) | CAF (cycloheximide + doxorubicin + fluorouracil) (methotrexate substituted after total doxorubicin ‐ 540 mg) | Y | Unclear | |
| PCb (paclitaxel + carboplatin) | Pw (paclitaxel) | Y | N | |
| Epi + Cis (epirubicin + cisplatin) | Epi (epirubicin) | Y | Y | |
| TPC (trastuzumab + paclitaxel + carboplatin) | TP (trastuzumab + paclitaxel) | Y | Unclear | |
| TCH (trastuzumab + docetaxel + carboplatin) | TH (trastuzumab + docetaxel) | Y | N | |
| Regimen A + platinum vs regimen B | ||||
| (pemetrexed + carboplatin) | (vinorelbine + gemcitabine) | N | N | |
| MPEPIV(a) or MPEMi (b) (a: methotrexate, leucovorin, cisplatin, epirubicin, vincristine; b: methotrexate, leucovorin, cisplatin, etoposide, mitomycin) | CMF (cyclophosphamide, methotrexate, fluorouracil) | Y | Y | |
| Etop + Cis (etoposide + cisplatin) | CMF (cyclophosphamide, methotrexate, fluorouracil) | Y | Unclear | |
| PE + CMF + AL (cisplatin + etoposide + doxorubicin + cyclophosphamide, methotrexate + fluorouracil, lecovorin + allopurinol) | CMF (cyclophosphamide, methotrexate, fluorouracil) | Y | Unclear | |
| CFP + CAP (cyclophosphamide + doxorubicin + cis‐dichlordiammine + CFP) | CFP (cyclophosphamide + fluorouracil + prednisone) | Y | Y | |
| OXA (oxaliplatin + 5‐flurouracil) | VIN (vinorelbine) | N | N | |
| EcisF (5‐flurouracil + epirubicin + cisplatin) | EcycloF (5‐flurouracil + epirubicin + cyclophosphamide) | Y | Y | |
| TP (docetaxel + cisplatin) | TX (docetaxel + capecitabine) | Y | N | |
| Epi + Pcb (epirubicin + carboplatin) | Epi + P (epirubicin + paclitaxel) | Y | Y (54%) | |
| PCb (paclitaxel + carboplatin) | GDoc (docetaxel + gemcitabine) | Y | N | |
| (cisplatin + gemcitabine) | (paclitaxel + gemcitabine) | Y | N | |
| Etop + Cis (etoposide + cisplatin) | P (paclitaxel) | N | N | |
| CAP (cyclophosphamide + doxorubicin + platinum) | CMFVP (cyclophosphamide + methotrexate + 5‐fluorouracil + vincristine + prednisone) | Y | Y | |
| CAP (cyclophosphamide + doxorubicin +platinum) | FAC (5‐flurouracil + doxorubicin + cyclophosphamide) | Y | Y | |
| GemCis (gemcitabine + cisplatin) | GemVin (gemcitabine + vinorelbine) | N | N | |
| GemCis (gemcitabine + cisplatin) | GemCap (gemcitabine + capecitabine) | N | N | |
| GemCis (gemcitabine + cisplatin) | GemPac (gemcitabine + paclitaxel) | Y | N | |
| GemCarb (gemcitabine + carboplatin) | GemPac (gemcitabine + paclitaxel) | Y | N | |
| Single agent platinum vs regimen C | ||||
| C (carboplatin) | D (docetaxel) | N | Unclear | |
Not all the studies provided sufficient information on all outcomes for inclusion in meta‐analyses. Of the 28 treatment‐comparisons:
-
19 (68%), 16 (57%) and 28 (100%) had sufficient data to be included in the meta‐analyses of effect estimates for OS, PFS/TTP and OTRR, respectively (Table 3 and Figure 1);
-
15 (54%), 21 (75%), 5 (18%), 20 (71%), 12 (43%) and 22 (79%) had sufficient data to be included in the meta‐analyses of effect estimates for treatment‐related death, nausea/vomiting, nephrotoxicity, anaemia, hair loss, and leukopenia, respectively (Table 5 and Figure 1).
| Trial ID | Extractable OS data for HR estimation1 | Median OS time2 | Extractable PFS/TTP data for HR estimation1 | Median PFS/TTP time2 | Overall response | Treatment‐related deaths | Grade III & IV Toxicity | Accrual3 |
| Regimen A + platinum vs regimen A | ||||||||
| NR | Y | Y | Y | Y | Y | Nausea/vomiting Nephrotoxicity Anaemia Leukopenia | 185 | |
| NR | Y | Y | Y | Y | Y | Nausea/vomiting Nephrotoxicity Anaemia Leukopenia | 186 | |
| NR | Y | NR | Y | Y | NR | NR | 126 | |
| Y | Y | Y | NR | Y | NR | Not extractable | 102 | |
| Y | Y | NR | NR | Y | Y | Nausea/vomiting Anaemia Leukopenia | 221 | |
| Y | Y | NR | NR | Y | Y | Nausea/vomiting Anaemia Hair loss Leukopenia | 204 | |
| Y | Y | Y | Y | Y | Y | Nausea/vomiting Leukopenia | 155 | |
| Y | Y | Y | Y | Y | NR | Nausea/vomiting Anaemia Leukopenia | 196 | |
| Y | Y | Y | Y | Y | Y | Nausea/vomiting Anaemia | 263 | |
| Regimen A + platinum vs regimen B | ||||||||
| NR | NR | Y | Y | Y | Y | Leukopenia | 135 | |
| Y | Y | NR | Y | Y | NR | Anaemia Leukopenia | 140 | |
| Y | Y | NR | Y | Y | NR | Nausea/vomiting Anaemia Hair loss Leukopenia | 105 | |
| NR | Y | NR | Y | Y | DU | Not extractable | 169 | |
| Y | Y | Y | Y | Y | NR | Nausea/vomiting Hair loss Leukopenia | 86 | |
| NR | Y | NR | Y | Y | Y | Not extractable | 137 | |
| NR | Y | Y | Y | Y | DU | Nausea/vomiting Anaemia Hair loss Leukopenia | 59 | |
| Y | Y | Y | Y | Y | Y | Nausea/vomiting Anaemia Leukopenia | 53 | |
| Y | NR | NR | NR | Y | NR | Nausea/vomiting Anaemia Leukopenia | 327 | |
| Y | Y | NR | NR | Y | Y | Nausea/vomiting Anaemia Hair loss Leukopenia | 212 | |
| Y | NR | Y | Y | Y | Y | Nausea/vomiting Anaemia Hair loss Leukopenia | 236 | |
| Y | Y | Y | NR | Y | Y | Nausea/vomiting Anaemia Leukopenia | 193 | |
| NR | NR | NR | NR | Y | NR | Nausea/vomiting Nephrotoxicity Anaemia Hair loss Leukopenia | 123 | |
| Y | Y | NR | NR | Y | Y | Nausea/vomiting Anaemia Hair loss Leukopenia | 142 | |
| Y | Y | Y | Y | Y | NR | Nausea/vomiting Anaemia Hair loss Leukopenia | 69 | |
| Y | Y | Y | Y | Y | NR | Nausea/vomiting Anaemia Hair loss Leukopenia | 72 | |
| Y | Y | Y | Y | Y | Y | Nausea/vomiting Nephrotoxicity Anaemia Hair loss Leukopenia | 75 | |
| Y | Y | Y | Y | Y | Y | Nausea/vomiting Nephrotoxicity Anaemia Hair loss Leukopenia | 71 | |
| Single agent platinum vs regimen C | ||||||||
| NR | Y | NR | Y | Y | NR | NR | 376 | |
1 Sufficient data reported to estimate a HR for pooling as outlined by Parmar 1998 and Tierney 2007; this includes Kapalan‐Meier curve, HR and standard error/confidence interval or logrank statistics
2 Trials that did not explicitly report median time were classified as NR here regardless of estimable median time from Kaplan‐Meier curve
3 Accrual numbers represent the maximum numbers of participants in the trial (not study) that were included in the analyses of OS, PFS/TTP or OR (assessable participants).
*NR = not reported, DU = deaths unexplained, Y = data reported.
Three studies reported treatment effects on various quality of life domains (Fountzilas 2004; Fountzilas 2009: Fountzilas 2009 A & Fountzilas 2009 B; Amadori 2013) but these results could not be pooled in a meta‐analysis. Three studies reported TTF results (Amadori 2013; Fountzilas 2004; Xu: Xu 2011 A & Xu 2011 B), but these data were only extractable for Fountzilas 2004.
Excluded studies
In this review update, seven studies may have appeared to have met the eligibility criteria, but were deemed ineligible for reasons given in the Characteristics of excluded studies table. Of these seven excluded studies: two were registered trials that were previously listed as 'ongoing studies' in the original review but were reclassified as 'excluded' in this review update because the principal investigator had informed us that the trials never commenced (Perez 2001; Perez 2002); two were 'excluded studies' in the original review and remained so in this review update (Cartei 1996; Hogdall 1993); and three were newly identified in this review update (Crump 2008; Somlo 2015; Wang 2008). Two other studies listed as 'excluded' in the original review ('Eisen' and 'Ryberg 1998') were removed from the excluded studies section altogether in this review update as they referred to earlier reports of studies that were actually included in the original review (Eisen 1998; Nielsen 2000).
Risk of bias in included studies
Figure 2 shows a summary of the 'Risk of bias' judgements for each 'Risk of bias' domain of the included treatment‐comparisons. Reasons for each judgement are detailed for each treatment‐comparison in the Characteristics of included studies table. For each 'risk of bias' domain, a summary of the general risk of bias for results of the included studies was as follows.

Risk of bias summary: review authors' judgements about each risk of bias item for each included study.
Allocation
All 24 studies, relating to 28 treatment‐comparisons, were described as randomised (this being an inclusion criterion of the review). The method of random sequence generation was described sufficiently to be judged at low risk of bias for this domain in 5 treatment‐comparisons (Bhattacharyya 2009; Carey 2012; Fountzilas 2004; Hu 2015; Valero 2011). The remaining 23 treatment‐comparisons were judged to be at unclear risk of bias for random sequence generation as the information available was insufficient to accurately assess this domain.
Eight of the 28 treatment‐comparisons described central randomisation systems and were thus judged to be at low risk of bias for treatment allocation concealment (Cocconi 1991; Cocconi 1999; Fountzilas 2004; Fountzilas 2009 A; Fountzilas 2009 B; Hu 2015; Icli 2005; Nielsen 2000). The remaining 20 treatment‐comparisons did not adequately describe methods of concealment and were thus judged as having unclear risk of bias for this domain.
Blinding
Eleven treatment‐comparisons were described as 'nonblinded', 'not blinded', 'single blind' or 'open‐label' (Amadori 2013; Carey 2012; Fan 2012; Hu 2015; Icli 2005; Stemmler 2011 A; Stemmler 2011 B; Tutt 2014; Valero 2011; Xu 2011 A; Xu 2011 B). These 11 'unblinded' treatment‐comparisons were judged to be at high risk of 'performance bias' due to the lack of blinding of participants and personnel to the treatment being administered. The remaining 17 treatment‐comparisons were judged as at unclear risk of 'performance bias' because of a lack of information needed to make a firm conclusion. It seemed highly likely, however, that a number of these 17 treatment‐comparisons would have also been 'unblinded', as open‐label studies are common in phase III oncology trials.
All 27 treatment‐comparisons known to have OS as a study outcome (including 8 not included in OS meta‐analyses but excluding Amadori 2013 which did not assess OS as an outcome) were judged to be at low risk of bias from a lack of blinding of outcome assessors, regardless of actual blinding. This is because death certification was unlikely to be affected by any lack of blinding.
For outcomes other than OS and QoL, five treatment‐comparisons were judged to be at low risk of bias from a lack of blinding of outcome assessors due to these outcomes being measured/confirmed through formal assessments including imaging, biochemical tests and/or the involvement of an independent clinical or radiological review group (Carey 2012; Cocconi 1991; Cocconi 1999; Fountzilas 2004; Icli 2005). The remaining 23 treatment‐comparisons provided insufficient detail on outcome assessments and were thus classified as having an unclear risk of bias.
Incomplete outcome data
Three treatment‐comparisons were judged to be at high risk of attrition bias for time‐to‐event outcomes because participants who did not receive a specified number of cycles of chemotherapy were excluded from time‐to‐event analyses (a form of per‐protocol analysis) (Kolaric 1985; Kolaric 1989; Nielsen 2000). Eleven treatment‐comparisons excluded randomised participants who never started treatment or who were subsequently found to have been 'ineligible' from time‐to‐event analyses (mITT analyses) (Berruti 2002 A; Carey 2012; Cocconi 1999; Cocconi 1996; Creagan 1984; Fountzilas 2004; Fountzilas 2009 A; Fountzilas 2009 B; Hu 2015; Icli 2005; Xu 2011 A). These 11 treatment‐comparisons were judged to be at unclear risk of attrition bias for time‐to‐event outcomes. The remaining 14 treatment‐comparisons were judged to be at low risk of attrition bias for time‐to‐event outcomes because all randomised participants were analysed in the groups to which they were randomised (ITT analysis).
Four treatment‐comparisons had more than 15% of participants not assessed/assessable for at least one binary outcome and were thus judged to be at high risk of attrition bias for binary outcomes (Amadori 2013; Fountzilas 2009 B; Stemmler 2011 A; Stemmler 2011 B; ). Fourteen treatment‐comparisons had less than 10% of participants not assessed/assessable for all binary outcomes and were thus judged to be at low risk of attrition bias for binary outcomes (Berruti 2002 A; Berruti 2002 B; Cocconi 1991; Cocconi 1999; Creagan 1984; Fan 2012; Fountzilas 2004; Hu 2015; Icli 2005; Kolaric 1985; Robert 2006; Valero 2011; Xu 2011 A; Xu 2011 B). The remaining 10 treatment‐comparisons were judged to be at unclear risk of attrition bias for binary outcomes (10 to 15% of participants not assessed/assessable for at least one binary outcome or it was unclear what proportion were not assessed).
Selective reporting
The assessment of risk of bias from selective reporting included crosschecking the outcomes for which there were published results against the stated outcomes reported in trial registers (WHO ICTRP and ClinicalTrials.gov) and published protocols. In our assessment of risk of bias from selective reporting, studies that began recruiting participants on or after July 1, 2005 were expected have a clinical registration or published protocol specifying the study outcome or they were deemed to be at high risk of bias from selective reporting. We chose July 1, 2005 as our cut‐off date because the International Committee of Medical Journal Editors (ICMJE) made a seminal announcement in September 2004 that clinical trials that begin recruiting on or after July 1, 2005 would not be considered for publication unless they were included on a clinical trials registry (De Angelis 2005). Studies included in this review which began recruiting participants before July 1, 2005 and which did not have a trial registration or published protocol prespecifying study outcomes, were assumed to be at unclear risk of bias from selective reporting, unless additional evidence suggested otherwise.
Six treatment‐comparisons from four studies were judged to be at low risk of bias from the selective reporting of outcomes (Carey 2012; Hu 2015; Stemmler 2011 A; Stemmler 2011 B; Xu 2011 A; Xu 2011 B). Each of these studies was included on a clinical trials registry and their prespecified outcomes either matched those in the trial reports or non‐matches were considered to be relatively minor. Three treatment‐comparisons were judged to be at high risk of bias from the selective reporting of outcomes. The first of these was Tutt 2014 which specified TTP, TTF and toxicity as outcomes in the trial registration, but did not report on these outcomes in either of two conference abstracts (future publications may report in more detail and this 'risk of bias' assessment may change). The second was Fan 2012 which did not have a trial registration or published protocol and did not report the date that participants were first enrolled. However, given that Fan 2012 was first published in December 2012 and that there were only 53 study participants, it seemed highly likely that recruitment began after July 1, 2005. Consequently, there was a high expectation of trial registration which this study failed to undertake. The third of these was Bhattacharyya 2009 in which the abstract indicated that toxicity was recorded but no results were reported. In addition, for Bhattacharyya 2009, there was no trial registration or published protocol containing prespecified outcomes. The date that participant recruitment began was not reported, but given that this was first published in September 2009, it seemed likely that recruitment began after July 1, 2005. As of April 2015, there had been no further results published other than those in the conference abstract. The remaining 19 treatment‐comparisons were judged to be at unclear risk of bias from the selective reporting of outcomes either because the trial was unregistered with recruitment starting before July 1, 2005 or the stated outcomes in the registry did not match those in the trial reports, but it was unclear if these non‐matches posed a high risk of bias.
Egger's tests for funnel plot asymmetry did not identify evidence consistent with the presence of publication bias or small‐study effects, or both, for OS (P value = 0.98; Figure 3), PFS/TTP (P value = 0.36) or OTRR (P value = 0.45).

Funnel plot 1: Overall survival (OS). Assessing publication bias and/or small‐study effects. Plot includes all treatment‐comparisons with extractable data for OS. The plot does not show asymmetry (Egger's test P value = 0.98)
Other potential sources of bias
Five treatment‐comparisons were judged to be at unclear risk of 'other bias' (Carey 2012; Eisen 1998; Fountzilas 2004; Hu 2015; Tutt 2014) for various reasons outlined in the Characteristics of included studies table. The remaining 23 treatment‐comparisons were judged to be at low risk of 'other bias'.
Effects of interventions
See: Summary of findings for the main comparison Platinum‐containing regimens for women with metastatic breast cancer unselected for triple‐negative disease; Summary of findings 2 Platinum‐containing regimens for women with metastatic triple‐negative breast cancer; Summary of findings 3 Platinum‐containing regimens and toxicity profile
Refer to summary of findings Table for the main comparison; summary of findings Table 2; summary of findings Table 3.
Overall survival (OS)
Twenty‐seven of the 28 included treatment‐comparisons assessed OS as an outcome; 19 provided sufficient OS data for pooling in meta‐analyses. From these 19 treatment‐comparisons, 2922 of 2956 randomised participants were analysed representing 99% of randomised participants in these treatment‐comparisons (and there were about 1868 deaths). There was no statistically significant difference in survival between platinum‐containing regimens or non‐platinum regimens with a HR of 0.98 (95% CI 0.89 to 1.07, P = 0.64) with some heterogeneity identified across trials (P = 0.04; I2 = 39%) (Analysis 1.1; Figure 4).

Forest plot of comparison: 1 Platinum vs non‐platinum regimens (subgroup analysis 1: by treatment‐comparisons assessing mTNBC), outcome: 1.1 Overall survival.
Subgroup analysis showed a marginally significant survival benefit in favour of platinum‐containing regimens for three treatment‐comparisons assessing women with metastatic triple‐negative breast cancer (mTNBC) only (HR 0.75, 95% CI 0.57 to 1.00; P = 0.05; low‐quality evidence) (Analysis 1.1; Figure 4). The difference between this pooled HR of 0.75 and that from 16 treatment‐comparisons assessing participants unselected for TNBC (HR 1.01, 95% CI 0.92 to 1.12; high‐quality evidence) was marginally significant (P = 0.05); heterogeneity was not large in either subgroup (P = 0.23, I2 = 32% and P = 0.09, 34% respectively). The six other subgroup analyses showed no evidence of subgroup differences (P values ranged from P = 0.09 to P = 0.86; see Analysis 2.1; Analysis 3.1; Analysis 4.1; Analysis 5.1; Analysis 6.1; Analysis 7.1).
Progression‐free survival/time to progression (PFS/TTP)
Twenty‐four of the 28 included treatment‐comparisons assessed PFS or TTP, or both, as an outcome; 16 provided sufficient data for pooling in meta‐analyses of the composite outcome of PFS/TTP. From these 16 treatment‐comparisons, 2136 out of 2162 (99%) randomised participants were analysed (and there were about 1772 events). There was a statistically significant difference in favour of platinum‐containing regimens (HR 0.85, 95% CI 0.78 to 0.93, P = 0.0002), although there was marked evidence of heterogeneity (P = 0.0004; I2 = 63%) (Analysis 1.2; Figure 5).

Forest plot of comparison: 1 Platinum vs non‐platinum regimens (subgroup analysis 1: by treatment‐comparisons assessing mTNBC), outcome: 1.2 Progression‐free survival/time to progression.
Significant differences in the pooled HRs of subgroups were found in three of the seven subgroup analyses involving PFS/TTP. Specifically, there were significant differences in the pooled HRs for subgroups of treatment‐comparisons:
-
assessing participants with mTNBC (HR 0.59, 95% CI 0.49 to 0.72; heterogeneity P = 0.07, I2 = 62%; n = 3; low‐quality evidence) and unselected for mTNBC (HR 0.92, 95% CI 0.84 to 1.01; heterogeneity P = 0.08, I2 = 38%; n = 13; moderate‐quality evidence) (P < 0.0001 for subgroup difference) (Analysis 1.2; Figure 5).
-
with > 80% of participants receiving first‐line therapy (HR 0.93, 95% CI 0.83 to 1.03; heterogeneity P = 0.003, I2 = 63%; n = 11) and > 20% of participants receiving second‐ or third‐line therapy (HR 0.75, 95% CI 0.65 to 0.86; heterogeneity P = 0.12, I2 = 45%; n = 5) (P = 0.01 for subgroup difference) (Analysis 4.2).
-
with no anthracycline in the platinum or non‐platinum regimens (HR 0.80, 95% CI 0.73 to 0.88; heterogeneity P = 0.001, I2 = 65%; n = 11), an anthracycline in both the platinum and non‐platinum regimens (HR 1.05, 95% CI 0.86 to 1.27; heterogeneity P = 0.35, I2 = 8%; n = 4) and an anthracycline in the platinum regimen only (HR 1.23, 95% CI 0.75 to 2.03; n = 1) (P = 0.02 for subgroup difference) (Analysis 5.2).
The four other subgroup analyses showed no evidence of subgroup differences (P values ranged from P = 0.34 to P = 0.88; see Analysis 3.2; Analysis 6.2; Analysis 7.2; Analysis 8.2).
Time to treatment failure (TTF)
Three of the 28 included treatment‐comparisons assessed TTF as an outcome but only one provided sufficient data for extraction (Fountzilas 2004: HR 0.88, 95% CI 0.69 to 1.13).
Objective Tumour Response Rate (OTRR) — assessable participants
All 28 included treatment‐comparisons assessed OTRR as an outcome and provided sufficient data for extraction. From the 28 treatment‐comparisons, 4130 out of 4475 (92%) randomised participants were assessable for tumour response (and 2017 had a complete or partial response). There was a statistically significant difference in OTRRs in favour of platinum‐containing regimens (RR 1.15, 95% CI 1.08 to 1.22, P < 0.0001), but there was also considerable evidence of heterogeneity (P < 0.0001; I2 = 64%) (Analysis 1.3; Figure 6).

Forest plot of comparison: 1 Platinum vs non‐platinum regimens (subgroup analysis 1: by treatment‐comparisons assessing mTNBC), outcome: 1.3 Objective tumour response rate (assessable participants).
Significant differences in the pooled RRs of subgroups were found in five of the seven OTRR subgroup analyses. Specifically, there were significant differences in the pooled RRs for subgroups of treatment‐comparisons:
-
assessing participants with mTNBC (RR 1.33, 95% CI 1.13 to 1.56; heterogeneity P = 0.0010, I2 = 78%; n = 5; low‐quality evidence) and unselected for mTNBC (RR 1.11, 95% CI 1.04 to 1.19; heterogeneity P = 0.0002, I2 = 58%; n = 23; low‐quality evidence) (P = 0.05 for subgroup difference) (Analysis 1.3; Figure 6).
-
comparing 'regimen A + platinum vs regimen A' (RR 1.10, 95% CI 1.01 to 1.21; heterogeneity P = 0.009, I2 = 61%; n = 9), 'regimen A + platinum vs regimen B' (RR 1.22, 95% CI 1.12 to 1.33; heterogeneity P = 0.0002, I2 = 63%; n = 18) and 'single agent platinum vs regimen C' (RR 0.88, 95% CI 0.66 to 1.17; n = 1) (P = 0.05 for subgroup difference) (Analysis 2.3).
-
using cisplatin (RR 1.35, 95% CI 1.24 to 1.46; heterogeneity P = 0.006, I2 = 53%; n = 17), carboplatin (RR 0.94, 95% CI 0.86 to 1.04; heterogeneity P = 0.10, I2 = 38%; n = 10) and oxaliplatin (RR 0.85, 95% CI 0.48 to 1.52; n = 1) as the platinum agent in the platinum regimen (P < 0.0001 for subgroup difference) (Analysis 3.3).
-
with no anthracycline in their platinum or non‐platinum regimens (RR 1.10, 95% CI 1.02 to 1.20; heterogeneity P < 0.0001, I2 = 65%; n = 18), an anthracycline in both the platinum and non‐platinum regimens (RR 1.09, 95% CI 0.97 to 1.22; heterogeneity P = 0.12, I2 = 42%; n = 6) and an anthracycline in the platinum regimen only (RR 1.49, 95% CI 1.28 to 1.74; heterogeneity P = 0.38, I2 = 2%; n = 4) (P = 0.002 for subgroup difference) (Analysis 5.3).
-
with no taxane in the platinum or non‐platinum regimens (RR 1.25, 95% CI 1.15 to 1.36; heterogeneity P = 0.009, I2 = 51%; n = 17), a taxane in both platinum and non‐platinum regimens (RR 1.01, 95% CI 0.90 to 1.12; heterogeneity P = 0.002, I2 = 74%; n = 6) and a taxane in the non‐platinum regimen only (RR 1.11, 95% CI 0.94 to 1.30; heterogeneity P = 0.02, I2 = 67%; n = 5) (P = 0.007 for subgroup difference) (Analysis 6.3).
The two other subgroup analyses showed no evidence of subgroup differences (P = 0.55, Analysis 4.3; and P = 0.94, Analysis 7.3).
Toxicity — safety populations
Treatment‐related death
Fifteen of the 28 included treatment‐comparisons assessed treatment‐related death and provided sufficient data for extraction. Of these 15 treatment‐comparisons, five had non‐estimable RRs due to no treatment‐related deaths and, consequently, did not contribute to the pooled estimates. For the 10 remaining treatment‐comparisons, 1688 out of 1759 (96%) randomised women were included in the safety populations, with 32 treatment‐related deaths. There was no significant difference between platinum and non‐platinum regimens in terms of treatment‐related death but the confidence interval was wide (RR 1.42, 95% CI 0.73 to 2.76; Analysis 3.4). There was no evidence of heterogeneity (P = 0.94, I2 = 0%).
No significant differences in pooled RRs were found according to the type of platinum agent used (P = 0.61).
Nausea/vomiting
Twenty‐one of the 28 included treatment‐comparisons assessed grade 3 and 4 nausea/vomiting with sufficient data for extraction. One treatment‐comparison had a non‐estimable RR due to there being no grade 3 or 4 cases. For the 20 remaining treatment‐comparisons, 3101 out of 3192 (97%) randomised women were included in the safety populations with 364 cases of grade 3 or 4 nausea/vomiting. Risk of grade 3 or 4 nausea/vomiting was significantly higher among women receiving platinum‐containing regimens (RR 2.07, 95% CI 1.69 to 2.54, P < 0.0001) but there was also considerable evidence of heterogeneity (P = 0.0003, I2 = 60%) (Analysis 3.5).
Subgroup analysis indicated that the increased risk of grade 3 or 4 nausea/vomiting for platinum recipients (compared to non‐platinum recipients) was primarily driven by cisplatin rather than carboplatin use. Specifically, there was a significant difference in the pooled RR for treatment‐comparisons using cisplatin (RR 2.65, 95% CI 2.10 to 3.34; n = 14; moderate‐quality evidence) rather than carboplatin (RR 0.77, 95% CI 0.47 to 1.26; n = 6; moderate‐quality evidence) in their platinum‐containing regimens (P < 0.0001 for subgroup difference). There was evidence of heterogeneity in the cisplatin (P = 0.008, I2 = 54%) but not the carboplatin (P = 0.30, I2 = 17%) subgroup.
Nephrotoxicity
Five of the 28 included treatment‐comparisons assessed grade 3 and 4 nephrotoxicity and reported sufficient data for extraction. One treatment‐comparison had a non‐estimable RR due to there being no grade 3 or 4 cases. For the four remaining treatment‐comparisons, 557 out of 571 (98%) randomised women were included in the safety populations, with 11 cases of grade 3 or 4 nephrotoxicity. Risk of grade 3 or 4 nephrotoxicity was more than three‐fold higher among women receiving platinum‐containing regimens, but this increase in risk was not significant (RR 3.06, 95% CI 0.86 to 10.84, P = 0.08) (Analysis 3.6). There was no evidence of heterogeneity (P = 0.92, I2 = 0%).
No significant differences in pooled RRs were found according to the type of platinum agent used (P = 0.65).
Anaemia
Twenty of the 28 included treatment‐comparisons assessed grade 3 and 4 anaemia with sufficient data for extraction. One treatment‐comparison had a non‐estimable RR due to there being no grade 3 or 4 anaemia cases. For the 19 remaining treatment‐comparisons, 3032 out of 3107 (98%) randomised women were included in the safety populations, with 176 cases of grade 3 or 4 anaemia. Risk of grade 3 or 4 anaemia was significantly higher among women receiving platinum‐containing regimens (RR 2.61, 95% CI 1.90 to 3.58, P < 0.0001) (Analysis 3.7). There was no evidence of heterogeneity (P = 0.41, I2 = 4%).
Subgroup analysis indicated that the increased risk of grade 3 or 4 anaemia for platinum recipients (compared to non‐platinum recipients) was worse for cisplatin recipients compared to carboplatin recipients. Specifically, there was a significant difference between the pooled RRs for treatment‐comparisons using cisplatin (RR 3.72, 95% CI 2.36 to 5.88; n =12; high‐quality evidence) rather than carboplatin (RR 1.72, 95% CI 1.10 to 2.70; n = 7; high‐quality evidence) in their platinum‐containing regimens (P = 0.02 for subgroup difference). There was no evidence of heterogeneity in the cisplatin or carboplatin subgroups (P = 0.50 and P = 0.67, respectively; I2 = 0% and I2 = 0%, respectively).
Hair Loss
Twelve of the 28 included treatment‐comparisons assessed grade 3 and 4 hair loss and reported sufficient data for extraction. Three treatment‐comparisons had a non‐estimable RR due to there being no grade 3 or 4 cases. For the nine remaining treatment‐comparisons, 1080 out of 1089 (99%) randomised women were included in the safety populations, with 469 cases of grade 3 or 4 hair loss. Risk of grade 3 or 4 hair loss was significantly higher among women receiving platinum‐containing regimens (RR 1.41, 95% CI 1.26 to 1.58, P < 0.0001; high‐quality evidence) (Analysis 3.8). There was some indication of heterogeneity (P = 0.10, I2 = 40%).
No significant differences in pooled RRs were found according to the type of platinum agent used (P = 0.23).
Leukopenia
Twenty‐two of the 28 included treatment‐comparisons assessed grade 3 and 4 leukopenia and reported sufficient data for extraction. One treatment‐comparison had a non‐estimable RR due to there being no grade 3 or 4 cases of leukopenia. For the 21 remaining treatment‐comparisons, 3123 out of 3222 (97%) randomised women were included in the safety populations, with 628 cases of grade 3 or 4 leukopenia. Risk of grade 3 or 4 leukopenia was significantly higher among women receiving platinum‐containing regimens (RR 1.38, 95% CI 1.21 to 1.57, P < 0.0001; moderate‐quality evidence) but with evidence of heterogeneity (P = 0.0002, I2 = 62%) (Analysis 3.9).
No significant differences in pooled RRs were found according to the type of platinum agent used (P = 0.21).
Quality of life
Three studies reported treatment effects on quality of life; Fountzilas 2004 (EORTC QLQ‐C30), Fountzilas 2009 (Fountzilas 2009 A; Fountzilas 2009 B) (EUROQOL EQ5D and EQ VAS) and Amadori 2013 (EORTC QLQ‐C30). However, quality of life results could not be pooled in a meta‐analysis because only one quality of life domain was common to two treatment‐comparisons (the EORTC QLQ‐C30 'global' domain reported by Fountzilas 2004 and Amadori 2013) and only one reported sufficient data for extraction (Amadori 2013) .
Fountzilas 2004 found paclitaxel/carboplatin was associated with an improvement both in the emotional functioning scale and in sleep disturbance symptoms compared with paclitaxel/epirubicin, but did not find significant group differences in any other quality of life domains assessed (physical role, cognitive, social, global quality of life, fatigue, nausea and vomiting, pain, dyspnoea, appetite loss, constipation, diarrhoea, financial impact). Fountzilas 2009 (Fountzilas 2009 A; Fountzilas 2009 B) found that changes in quality across time did not differ significantly between groups for the domains reported (EQ5D index and EQ VAS score). Amadori 2013 found that pemetrexed/carboplatin participants had significantly greater deterioration in global health status scores (follow‐up minus baseline scores) than vinorelbine/gemcitabine participants, but there was no significance difference in body image scores between groups.
Sensitivity analyses
Restricting the OTRR meta‐analysis to the 19 treatment‐comparisons with extractable data on OS had little impact on the pooled RR estimate (RR = 1.15 and RR = 1.13 in the original and sensitivity analyses, respectively). Restricting the OS and PFS/TTP meta‐analyses to the 12 treatment‐comparisons with extractable data on both OS and OS and PFS/TTP lowered the pooled HR estimate from HR = 0.98 to HR = 0.92 for OS, and from 0.85 to 0.80 for PFS/TTP. This represented a 6% reduction in the HR estimates for both OS and PFS/TTP and suggested that the relative difference between OS and PFS/TTP results was unlikely to be due to the different treatment‐comparisons available for the meta‐analysis of each outcome.
Stratifying PFS/TTP estimates according to whether the outcome was PFS or TTP suggested that platinum chemotherapy was more beneficial in terms of TTP than PFS, although the difference was not statistically significant (P = 0.06). Repeating Analysis 1.1, and Analysis 1.2 using random‐effects methods did not appreciably change the point estimates for OS or PFS/TTP, but did produce slightly wider confidence intervals (Analysis 10.1; Analysis 10.2). Repeating Analysis 1.3 using a random‐effects model did not appreciably change the OTRR point estimate for participants unselected for mTNBC, but did increase the point estimate for mTNBC participants (from 1.33 to 1.60).
Discussion
Summary of main results
In this review update and consistent with the findings of the original review, our results did not show an OS benefit from platinum‐containing regimens compared to non‐platinum regimens for women with metastatic breast cancer 'in general' (i.e. without regard to subgroups). The confidence limits for the OS pooled HR estimate suggested that platinum‐containing regimens were unlikely to confer more than a 11% reduction in the risk of death and might increase the risk by up to 7%. The lack of an OS benefit for platinum‐containing regimens was somewhat at odds with the significant PFS/TTP and OTRR benefits observed in this review. Compared to women receiving non‐platinum regimens, those receiving platinum‐containing regimens had a 15% lower rate of progression or death (as measured by PFS/TTP) and a 15% higher rate of complete or partial tumour response. Sensitivity analyses indicated that the discrepancies between the OS and OTRR findings, and between the OS and PFS/TTP findings, were unlikely to be due to the different sets of treatment‐comparisons used in the various meta‐analyses of OS, PFS/TTP and OTRR. Rather, these discrepancies seemed more likely to be related to PFS/TTP and OTRR being somewhat poor surrogate outcomes for OS in metastatic breast cancer research (Burzykowski 2008), and perhaps also related to general difficulties in measuring tumour response. Given that OS is generally regarded as the outcome of choice for assessing treatment efficacy in metastatic breast cancer research (Burzykowski 2008) and given that this review now has a sufficient number of included studies to estimate the effects of treatments on OS with relatively high precision, we think that considerably more weight should be given to the OS results than the PFS/TTP or OTRR results.
In the absence of subgroup analyses, heterogeneity of effect estimates was observed for PFS/TTP, OTRR and, to a lesser degree, OS. With regards to OS and PFS/TTP, heterogeneity was explained to a large extent by the triple‐negative status of study participants. More specifically for OS, data from three treatment‐comparisons assessing mTNBC participants showed a 25% reduction in the risk of death for recipients of platinum‐containing regimens compared to recipients of non‐platinum regimens (P = 0.05). In absolute terms, this 25% risk ratio reduction corresponded to about 93 fewer deaths at one year after metastatic diagnosis for every 1000 mTNBC participants who received platinum‐containing chemotherapy, and about 105 fewer deaths at two years (summary of findings Table 2). In contrast, data from 16 treatment‐comparisons, assessing participants unselected for TNBC, showed similar risks of death among platinum and non‐platinum recipients (HR = 1.01). In relation to PFS/TTP, platinum‐containing regimens reduced the risk of death or progression, or both, by about 41% for mTNBC participants (P < 0.0001) but only by about 8% for participants unselected for mTNBC (P = 0.10). The difference between the pooled effect estimates of the mTNBC and 'unselected for mTNBC' subgroups was significant for PFS/TTP (P < 0.0001) and on the margins of statistical significance for OS (P = 0.05) and OTRR (P = 0.05).
While we also found a number of other statistically significant subgroup differences for OTRR and PFS/TTP (see Effects of interventions), it is difficult to judge the importance or reliability of these findings, given that similar differences were not observed in relation to OS.
Assessments of toxicity showed that women receiving platinum‐containing regimens experienced higher rates of grade 3 and 4 nausea/vomiting, anaemia, leukopenia and hair loss than women receiving non‐platinum regimens. Subgroup analysis indicated that the higher rate of grade 3 and 4 nausea/vomiting was associated with cisplatin but not carboplatin use, and the increased risk of grade 3 and 4 anaemia was higher for cisplatin recipients than for carboplatin recipients.
Overall completeness and applicability of evidence
This review now includes data from 24 studies relating to 28 treatment‐comparisons, with publications years ranging from 1984 to 2014. Of the 28 treatment‐comparisons,19 (68%) and 16 (57%) provided sufficient time‐to‐event data to be included in OS and PFS/TTP meta‐analyses, respectively. All 28 treatment‐comparisons provided OTRR data that could be included in meta‐analyses. A majority of treatment‐comparisons had sufficient data on treatment‐related death (n =15; 54%), nausea/vomiting (n =21; 75%), anaemia (n =20; 71%) and leukopenia (n =22; 79%) for inclusion in meta‐analyses. Five (18%) and 12 (43%) treatment‐comparisons had sufficient data on nephrotoxicity and hair loss for pooling, respectively. The evidence relating to treatment effects on quality of life remained almost wholly incomplete, with only three studies reporting quality of life results that could not be pooled in meta‐analysis.
Although data for the most important outcome (OS) was extractable for 68% of treatment‐comparisons, the evidence would clearly be more complete if OS data were extractable for all 28 treatment‐comparisons. Nonetheless, it is somewhat reassuring that sensitivity analyses restricting the OTRR meta‐analysis to the 19 treatment‐comparisons with extractable OS data did not appreciably change the OTRR pooled estimate of effect (RR=1.15 and RR=1.13 in the original and sensitivity analyses, respectively). This provides some evidence that the 'overall' pooled effect estimate for OS was unlikely to have changed substantively if OS data were extractable for all 28 treatment‐comparisons. It is important to note, however, that although the 'overall' pooled estimate of effect for OS appeared robust to the missing treatment‐comparisons, this may not be the case for smaller subgroups. For example, our finding of a significant OS benefit for mTNBC participants receiving platinum‐containing regimens ― based on data from only three treatment‐comparisons ― may have been different if we were able to include OS data from Tutt 2014 in the meta‐analysis. In this relatively large treatment‐comparison of mainly mTNBC participants, median OS times were similar in the platinum and non‐platinum groups.
The evidence in this review appeared to be generally applicable to the current practice of the treatment of metastatic breast cancer for a number of reasons. First, the platinum and non‐platinum regimens used in the included trials contained most chemotherapy drugs currently used in clinical practice to treat metastatic breast cancer, including cyclophosphamide, methotrexate, fluorouracil (CMF), trastuzumab and various anthracyclines and taxanes. Second, the review included trials of women receiving first‐line treatment and women receiving treatment after failure of previous anthracycline or taxane regimens. Third, the review was well populated with trials using the two most commonly used platinum agents for treating metastatic breast cancer ― carboplatin and cisplatin. While the review had only one trial using oxaliplatin as the platinum agent, oxaliplatin is not widely used in clinical practice for treating breast cancers. Fourth, this review update is the first to use meta‐analysis to synthesise the evidence on an issue of considerable interest and importance to clinical practice; namely, whether platinum‐based chemotherapies improved survival outcomes for mTNBC participants.
Quality of the evidence
Quality of evidence ratings relating to OS, PFS/TTP and OTRR effect estimates were graded separately for the subgroups of treatment‐comparisons with women unselected for mTNBC (summary of findings Table for the main comparison) and with mTNBC (summary of findings Table 2). We identified no problems using the GRADE assessment criteria in relation to the OS effect estimate for the 'unselected' subgroup; hence, the quality of the evidence for this estimate was rated 'high'. For the 'mTNBC' subgroup, the quality of the evidence rating for the OS effect estimate was downgraded two levels to 'low' for 'imprecision' (because the confidence interval for the pooled estimate was wide and close to the null) and for 'suspected publication bias' (because of the absence of Tutt 2014 from the OS meta‐analysis). The quality of the evidence ratings for PFS/TTP and OTRR effect estimates ranged from 'low' to 'moderate' across the 'unselected' and 'mTNBC' subgroups for reasons including 'indirectness', 'imprecision' , 'inconsistency' and 'suspected publication bias' (see summary of findings Table for the main comparison and summary of findings Table 2 for details).
Treatment effect estimates for four key toxicity outcomes were graded for quality of evidence (summary of findings Table 3). Gradings were stratified by 'type of platinum agent' (cisplatin or carboplatin) for nausea/vomiting and anaemia and not stratified for hair loss and leukopenia (because hair loss and leukopenia were not significantly related to 'type of platinum agent'). The quality of the evidence ratings were 'high' for hair loss and for anaemia (both cisplatin and carboplatin subgroups), and downgraded one level to 'moderate' for nausea/vomiting (both cisplatin and carboplatin subgroups) and leukopenia due to either 'imprecision' or 'inconsistency' (see summary of findings Table 3 for details).
Potential biases in the review process
Although it is possible that we may not have identified every eligible study with published results, study protocol or clinical trial registration, this seemed unlikely given our highly sensitive search strategies, including access to the Cochrane Breast Cancer Specialised Register maintained by the Cochrane Breast Cancer Group. A related but more insidious problem, however, was the risk of reporting bias arising from completed studies that never published their (largely) negative findings. While non‐publication of negative findings probably has occurred less frequently in recent years (due to increasing pressures to preregister clinical trials and publish results within reasonable time‐frames), many systematic reviews remain vulnerable to historical reporting bias. In this review, many of the included studies were conducted in an era when non‐publication of negative findings was more likely, but it seemed unlikely that this would have substantively affected our OS main finding, given that this finding was itself negative.
Agreements and disagreements with other studies or reviews
Petrelli 2016 recently published a systematic review and meta‐analysis of randomised trials to assess the efficacy and safety of therapy with platinum salts in participants with locally advanced or metastatic breast cancer. In their review, Petrelli reported overall pooled effect estimates similar to our estimates in terms of OS (HR = 0.91 vs HR = 0.98, respectively), PFS/TTP (HR = 0.84 vs HR = 0.85, respectively) and OTRR (odds ratio = 1.27 vs odds ratio = 1.33, respectively after recalculating our relative risk estimate into an odds ratio). It is important to note, however, that while the overall results of the two systematic reviews are similar, Petrelli 2016 included studies with 100% locally advanced participants whereas our review excluded studies with more than 20% of participants having isolated locoregional recurrence. In addition, our review extended the work of Petrelli through the inclusion of multiple additional subgroup analyses.
To our knowledge, there has been only one other systematic review of randomised trials comparing the effects of platinum and non‐platinum‐containing regimens among participants with mTNBC (Guan 2015). That review, however, only performed meta‐analyses of tumour response rates and not time‐to‐event outcomes. The OTRR meta‐analysis in Guan 2015 was comprised of three of the five mTNBC treatment‐comparisons included in the current review (Bhattacharyya 2009; Carey 2012; Fan 2012); the additional inclusion of Tutt 2014 and Hu 2015 in the current review resulted in a pooled OTRR estimate of effect (RR 1.33, 95% CI 1.13 to 1.56), significantly lower than that of Guan 2015 (RR 2.42, 95% CI 1.66 to 3.53).

Review update 2016: study flow diagram.

Risk of bias summary: review authors' judgements about each risk of bias item for each included study.
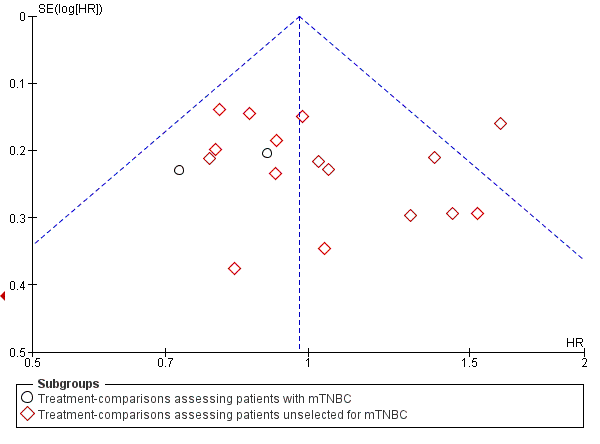
Funnel plot 1: Overall survival (OS). Assessing publication bias and/or small‐study effects. Plot includes all treatment‐comparisons with extractable data for OS. The plot does not show asymmetry (Egger's test P value = 0.98)

Forest plot of comparison: 1 Platinum vs non‐platinum regimens (subgroup analysis 1: by treatment‐comparisons assessing mTNBC), outcome: 1.1 Overall survival.

Forest plot of comparison: 1 Platinum vs non‐platinum regimens (subgroup analysis 1: by treatment‐comparisons assessing mTNBC), outcome: 1.2 Progression‐free survival/time to progression.

Forest plot of comparison: 1 Platinum vs non‐platinum regimens (subgroup analysis 1: by treatment‐comparisons assessing mTNBC), outcome: 1.3 Objective tumour response rate (assessable participants).

Comparison 1 Platinum vs non‐platinum regimens (subgroup analysis 1: by treatment‐comparisons assessing mTNBC), Outcome 1 Overall survival.

Comparison 1 Platinum vs non‐platinum regimens (subgroup analysis 1: by treatment‐comparisons assessing mTNBC), Outcome 2 Progression‐free survival/time to progression.
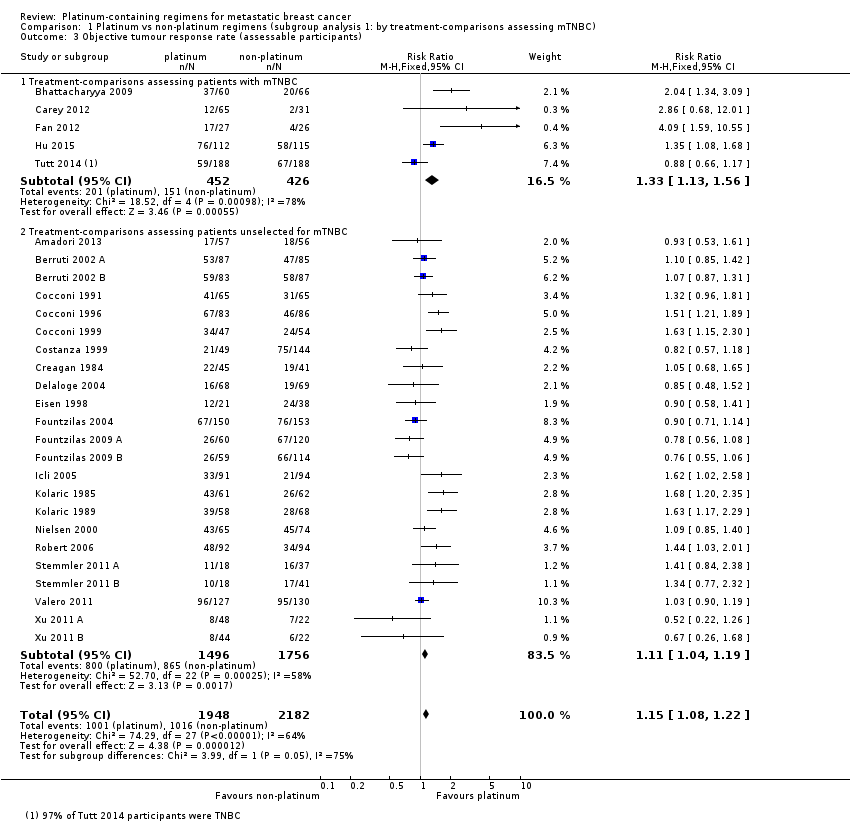
Comparison 1 Platinum vs non‐platinum regimens (subgroup analysis 1: by treatment‐comparisons assessing mTNBC), Outcome 3 Objective tumour response rate (assessable participants).
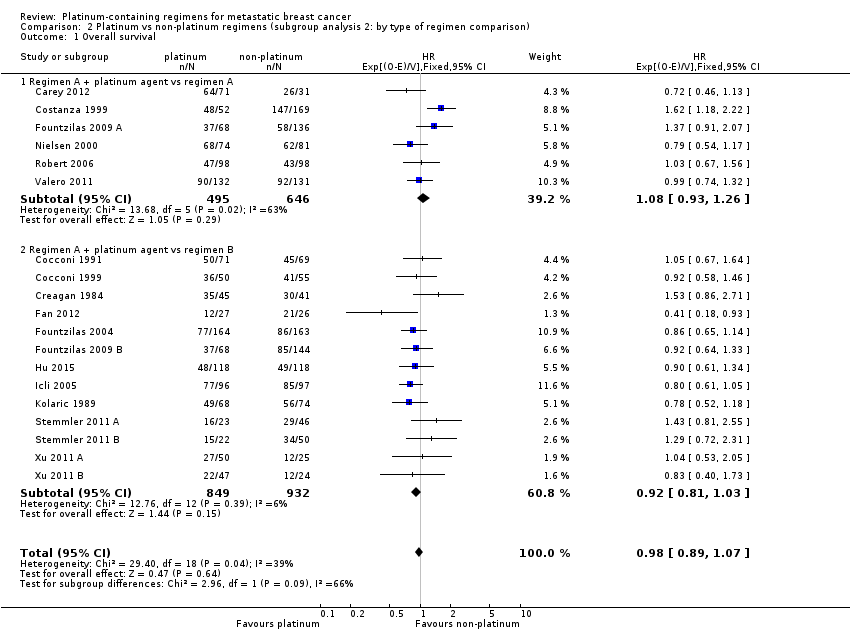
Comparison 2 Platinum vs non‐platinum regimens (subgroup analysis 2: by type of regimen comparison), Outcome 1 Overall survival.

Comparison 2 Platinum vs non‐platinum regimens (subgroup analysis 2: by type of regimen comparison), Outcome 2 Progression‐free survival / time to progression.

Comparison 2 Platinum vs non‐platinum regimens (subgroup analysis 2: by type of regimen comparison), Outcome 3 Objective tumour response rate (assessable participants).
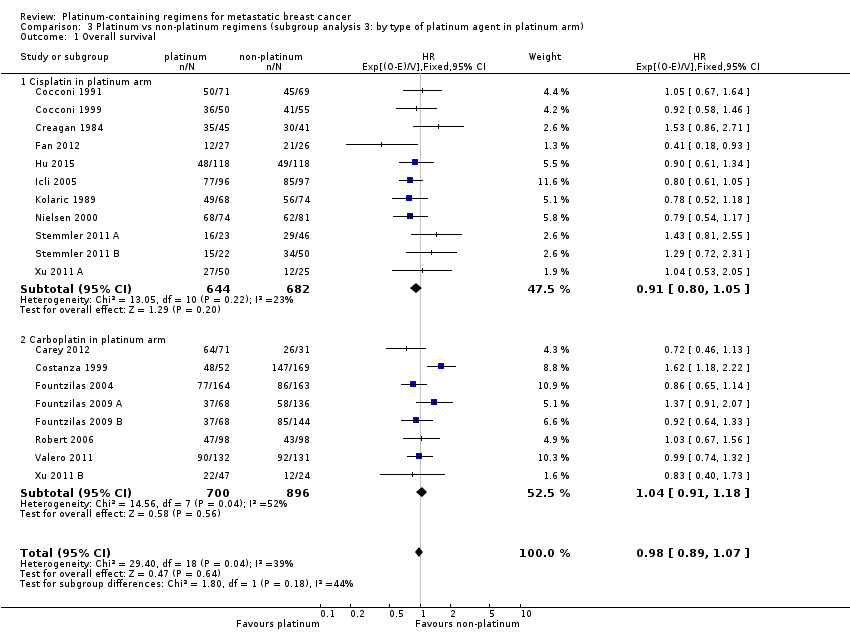
Comparison 3 Platinum vs non‐platinum regimens (subgroup analysis 3: by type of platinum agent in platinum arm), Outcome 1 Overall survival.

Comparison 3 Platinum vs non‐platinum regimens (subgroup analysis 3: by type of platinum agent in platinum arm), Outcome 2 Progression‐free survival/time to progression.

Comparison 3 Platinum vs non‐platinum regimens (subgroup analysis 3: by type of platinum agent in platinum arm), Outcome 3 Objective tumour response rate (assessable participants).
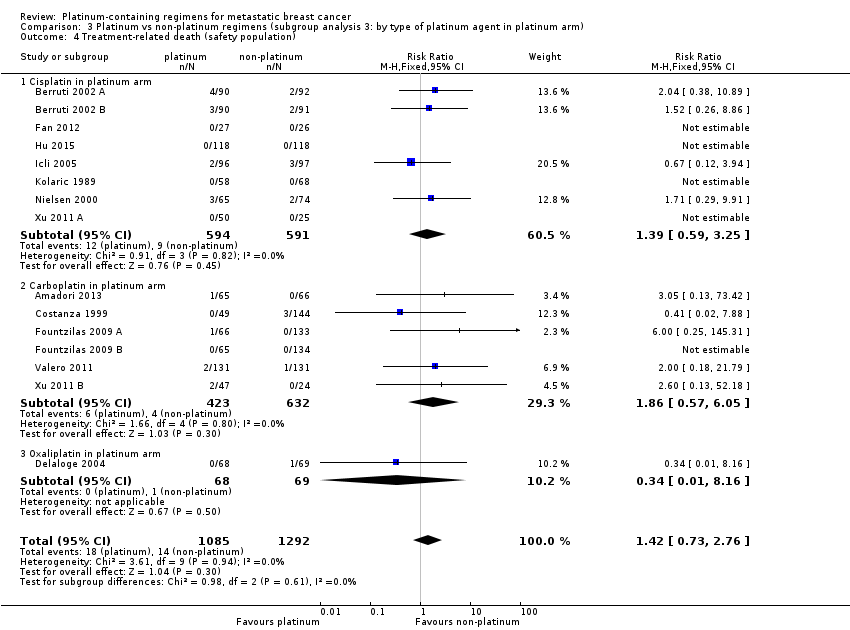
Comparison 3 Platinum vs non‐platinum regimens (subgroup analysis 3: by type of platinum agent in platinum arm), Outcome 4 Treatment‐related death (safety population).

Comparison 3 Platinum vs non‐platinum regimens (subgroup analysis 3: by type of platinum agent in platinum arm), Outcome 5 Nausea/vomiting (safety population).

Comparison 3 Platinum vs non‐platinum regimens (subgroup analysis 3: by type of platinum agent in platinum arm), Outcome 6 Nephrotoxicity (safety population).

Comparison 3 Platinum vs non‐platinum regimens (subgroup analysis 3: by type of platinum agent in platinum arm), Outcome 7 Anaemia (safety population).

Comparison 3 Platinum vs non‐platinum regimens (subgroup analysis 3: by type of platinum agent in platinum arm), Outcome 8 Hair loss (safety population).

Comparison 3 Platinum vs non‐platinum regimens (subgroup analysis 3: by type of platinum agent in platinum arm), Outcome 9 Leukopenia (safety population).
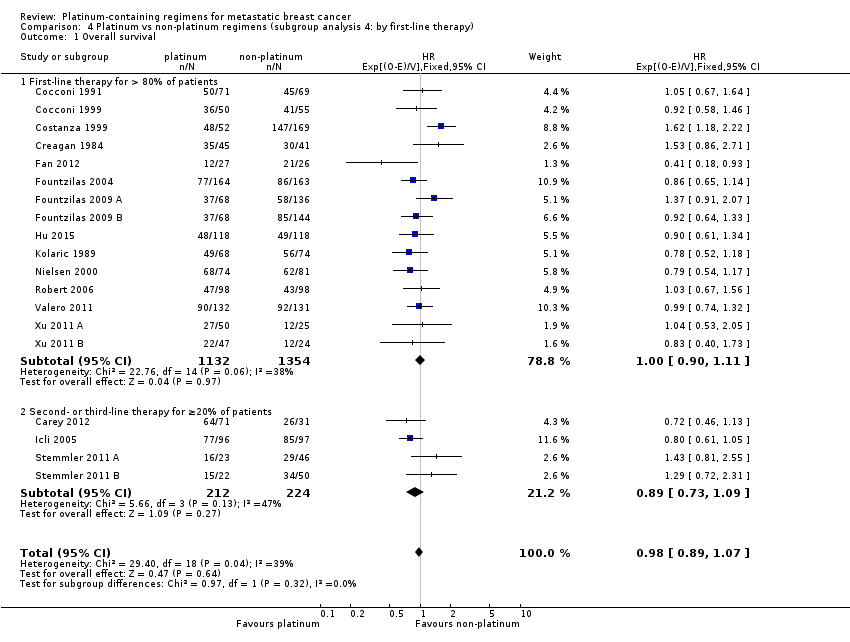
Comparison 4 Platinum vs non‐platinum regimens (subgroup analysis 4: by first‐line therapy), Outcome 1 Overall survival.

Comparison 4 Platinum vs non‐platinum regimens (subgroup analysis 4: by first‐line therapy), Outcome 2 Progression‐free survival/time to progression.
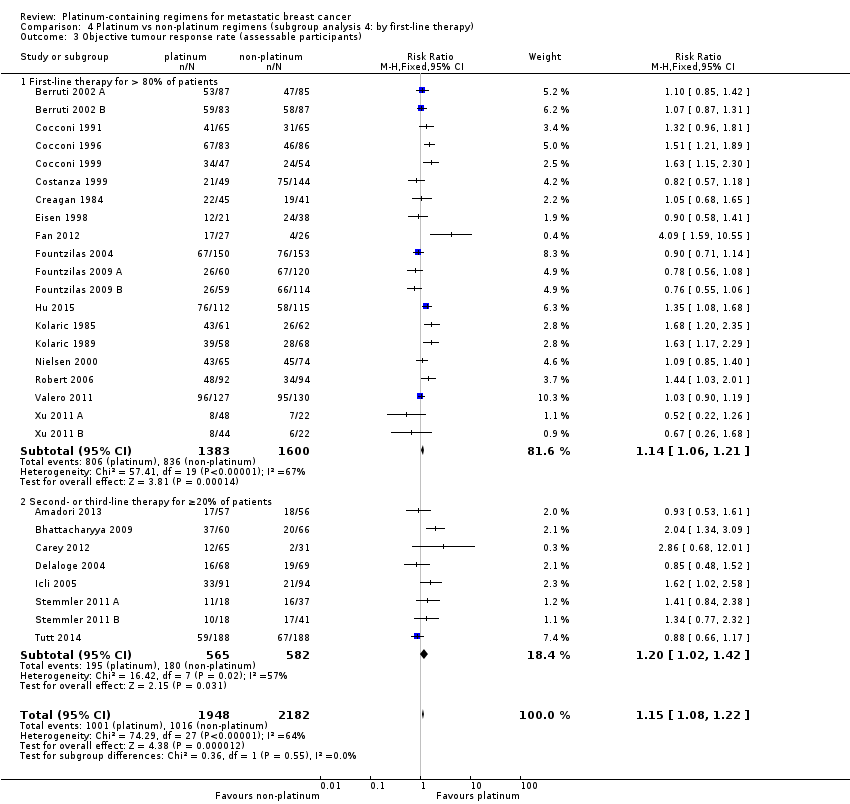
Comparison 4 Platinum vs non‐platinum regimens (subgroup analysis 4: by first‐line therapy), Outcome 3 Objective tumour response rate (assessable participants).

Comparison 5 Platinum vs non‐platinum regimens (subgroup analysis 5 by anthracycline in regimens), Outcome 1 Overall survival.
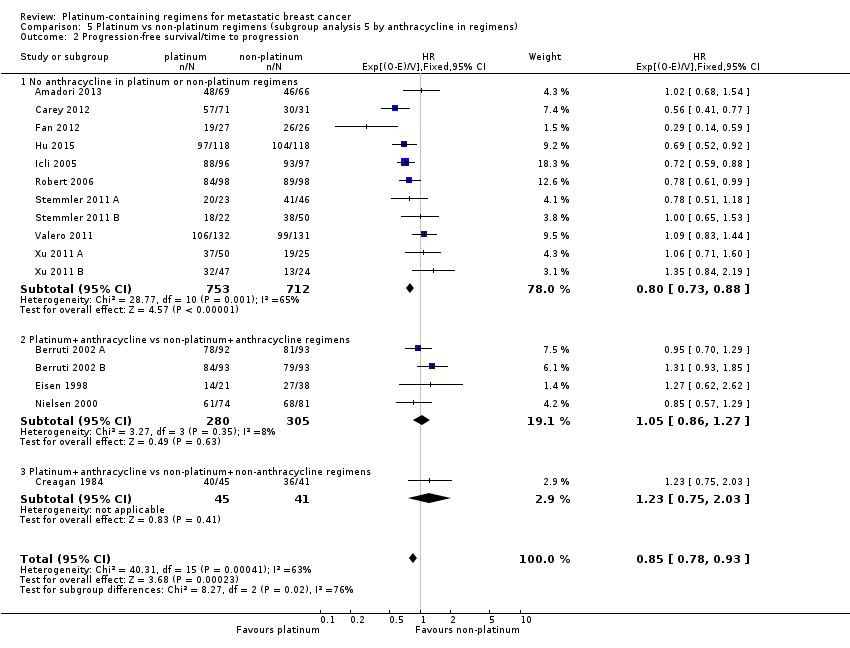
Comparison 5 Platinum vs non‐platinum regimens (subgroup analysis 5 by anthracycline in regimens), Outcome 2 Progression‐free survival/time to progression.

Comparison 5 Platinum vs non‐platinum regimens (subgroup analysis 5 by anthracycline in regimens), Outcome 3 Objective tumour response rate (assessable participants).

Comparison 6 Platinum vs non‐platinum regimens (subgroup analysis 6: by taxane in regimens), Outcome 1 Overall survival.
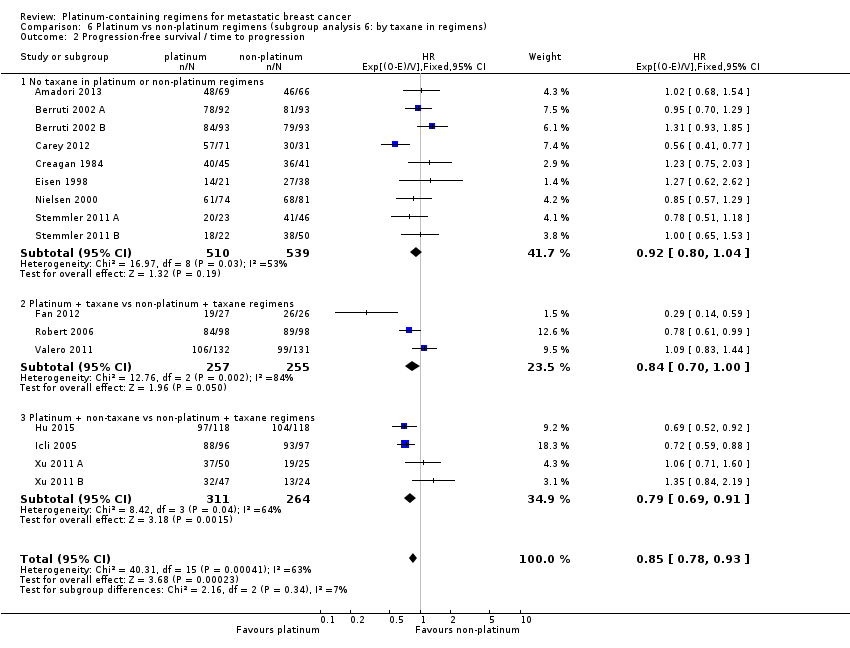
Comparison 6 Platinum vs non‐platinum regimens (subgroup analysis 6: by taxane in regimens), Outcome 2 Progression‐free survival / time to progression.
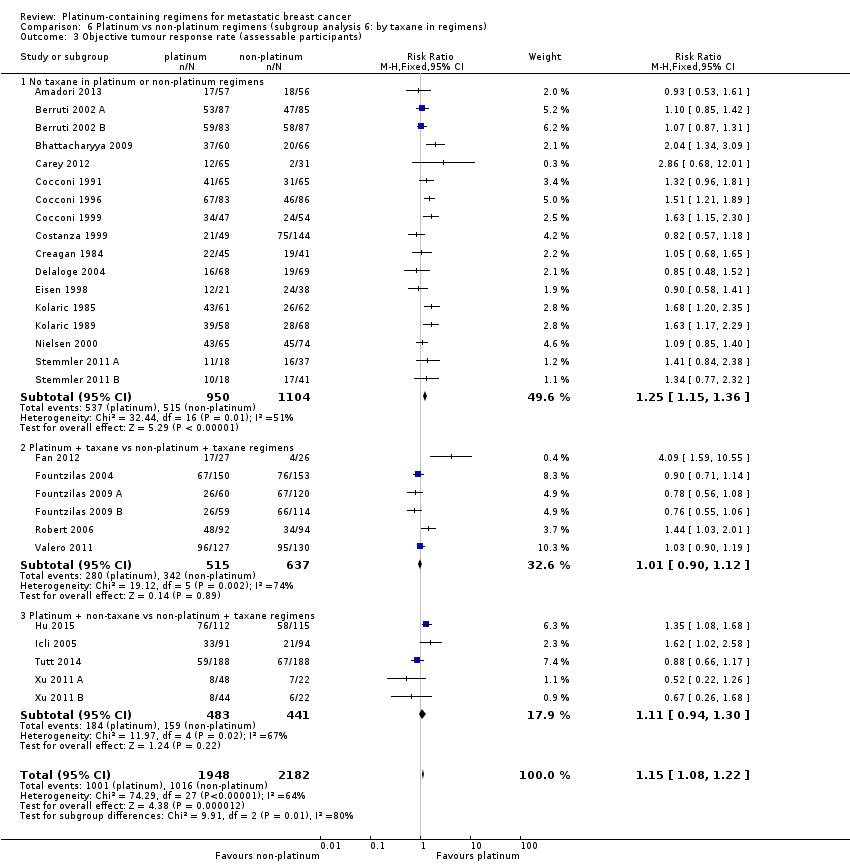
Comparison 6 Platinum vs non‐platinum regimens (subgroup analysis 6: by taxane in regimens), Outcome 3 Objective tumour response rate (assessable participants).

Comparison 7 Platinum vs non‐platinum regimens (subgroup analysis 7: by trastuzumab in regimens), Outcome 1 Overall survival.

Comparison 7 Platinum vs non‐platinum regimens (subgroup analysis 7: by trastuzumab in regimens), Outcome 2 Progression‐free survival/time to progression.

Comparison 7 Platinum vs non‐platinum regimens (subgroup analysis 7: by trastuzumab in regimens), Outcome 3 Objective tumour response rate (assessable participants).

Comparison 8 Platinum vs non‐platinum regimens (sensitivity analysis 1: excluding selected treatment‐comparisons), Outcome 1 Overall survival (restricted to the 12 treatment‐comparisons common to OS and PFS/TTP meta‐analyses).

Comparison 8 Platinum vs non‐platinum regimens (sensitivity analysis 1: excluding selected treatment‐comparisons), Outcome 2 Progression‐free survival/time to progression (restricted to the 12 treatment‐comparisons common to OS and PFS/TTP meta‐analyses).

Comparison 8 Platinum vs non‐platinum regimens (sensitivity analysis 1: excluding selected treatment‐comparisons), Outcome 3 Objective tumour response rate (assessable participants‐ restricted to the 19 treatment‐comparisons in OS meta‐analyses).

Comparison 9 Platinum vs non‐platinum regimens (sensitivity analysis 2: Progression‐free survival vs. time to progression), Outcome 1 Progression‐free survival vs time to progression.

Comparison 10 Platinum vs non‐platinum regimens (sensitivity analysis 3: Analyses 1 repeated but with random effects approach), Outcome 1 Overall survival.

Comparison 10 Platinum vs non‐platinum regimens (sensitivity analysis 3: Analyses 1 repeated but with random effects approach), Outcome 2 Progression‐free survival/time to progression.

Comparison 10 Platinum vs non‐platinum regimens (sensitivity analysis 3: Analyses 1 repeated but with random effects approach), Outcome 3 Objective tumour response rate (assessable participants).
| Platinum compared to non‐platinum chemotherapy regimens for women with metastatic breast cancer unselected for triple‐negative disease | ||||||
| Patient or population: women with metastatic breast cancer unselected for triple‐negative breast cancer (TNBC) | ||||||
| Outcomes | Anticipated absolute effects* (95% CI) | Relative effect | No. of participants (treatment‐ comparisons) | Quality of the evidence | Comments | |
| Risk with non‐platinum chemotherapy regimens | Risk with platinum | |||||
| Overall survival ‐ trials of metastatic breast cancer participants unselected for TNBC | 1‐year risk of death | HR 1.01 | 2531 (16) | ⊕⊕⊕⊕ | Heterogeneity: P = 0.09, I2=34% | |
| 310 per 1,000 1 | 313 per 1,000 | |||||
| 2‐year risk of death | ||||||
| 540 per 1,000 1 | 543 per 1,000 | |||||
| Progression‐free survival/time to progression (randomised participants) ‐ trials of metastatic breast cancer participants unselected for TNBC | 1‐year risk of progression or death | HR 0.92 | 1745 (13) | ⊕⊕⊕⊝ | Heterogeneity: P = 0.08, I2=38% | |
| 737 per 1,000 1 | 707 per 1,000 | |||||
| 2‐year risk of progression or death | ||||||
| 891 per 1,000 1 | 869 per 1,000 | |||||
| Objective tumour response rate (assessable participants) ‐ trials of metastatic breast cancer participants unselected for TNBC | 493 per 1,000 5 | 547 per 1,000 | RR 1.11 | 3252 (23) | ⊕⊕⊝⊝ | Heterogeneity: P = 0.0002, I2=58% |
| *The risk in the intervention group (and its 95% confidence interval) is based on the assumed risk in the comparison group and the relative effect of the intervention (and its 95% CI). | ||||||
| GRADE Working Group grades of evidence | ||||||
| 1 Estimated from the average of non‐platinum group Kaplan‐Meier probabilities from the three highest weighted non‐TNBC treatment‐comparisons for this outcome 2 Estimated as 1000*(1‐S(t)HR) where S(t) is the estimated probability of survival for non‐platinum participants and HR is the pooled hazard ratio (Davies 1998) 3 Quality of evidence for OS was not downgraded for blinding because this outcome is unlikely to be affected by non‐blinding. 4 Downgraded quality of evidence one level for 'indirectness' because this outcome is a surrogate endpoint of questionable validity for assessing the more important outcome of OS in the context of metastatic breast cancer (Burzykowski 2008) 5 Estimated from all 23 non‐TNBC treatment‐comparisons in the review 6 Downgraded quality of evidence one level for 'inconsistency' because there was substantial evidence of heterogeneity across studies (P < 0.05) | ||||||
| Platinum compared to non‐platinum chemotherapy regimens for women with metastatic triple‐negative breast cancer | ||||||
| Patient or population: women with metastatic triple‐negative breast cancer (mTNBC) | ||||||
| Outcomes | Anticipated absolute effects* (95% CI) | Relative effect | No. of participants (treatment‐ comparisons) | Quality of the evidence | Comments | |
| Risk with non‐platinum chemotherapy regimens | Risk with platinum | |||||
| Overall survival ‐ trials of mTNBC participants | 1‐year risk of death | HR 0.75 | 391 (3) | ⊕⊕⊝⊝ | Heterogeneity: P = 0.23, I2 = 32% | |
| 485 per 1,000 1 | 392 per 1,000 | |||||
| 2‐year risk of death | ||||||
| 655 per 1,000 1 | 550 per 1,000 | |||||
| Progression‐free survival/time to progression (randomised participants) ‐ trials of mTNBC participants | 1‐year risk of death | HR 0.59 | 391 (3) | ⊕⊕⊝⊝ | Heterogeneity: P = 0.07, I2 = 67% | |
| 894 per 1,000 1 | 733 per 1,000 | |||||
| 2‐year risk of death | ||||||
| 987 per 1,000 1 | 922 per 1,000 | |||||
| Objective tumour response rate (assessable participants) ‐ trials of mTNBC participants | 354 per 1,0007 | 470 per 1,000 | RR 1.33 | 878 (5) | ⊕⊕⊝⊝ | Heterogeneity: P = 0.0010, I2 = 78% |
| *The risk in the intervention group (and its 95% confidence interval) is based on the assumed risk in the comparison group and the relative effect of the intervention (and its 95% CI). | ||||||
| GRADE Working Group grades of evidence | ||||||
| 1 Estimated from the average of non‐platinum group Kaplan‐Meier probabilities from the three TNBC treatment‐comparisons contributing data for pooling on this outcome 2 Estimated as 1000*(1‐S(t)HR) where S(t) is the estimated probability of survival for non‐platinum participants and HR is the pooled hazard ratio (Davies 1998) 3 Downgraded quality of evidence one level for 'imprecision' because the confidence interval for the pooled estimate is wide and crosses or nearly crosses unity 4 Downgraded quality of evidence one level for 'suspected publication bias' because Tutt 2014 is a large study with 376 participants but has so far only reported median OS/PFS times. As a consequence, the study did not contribute to the pooled HR estimates for OS or PFS/TTP. The reported median OS/PFS times in Tutt 2014 were similar between platinum and non‐platinum regimens. Hence, it seems likely that if HRs from Tutt 2014 were able to be included in pooled HR estimates, these pooled estimates would be considerably closer to the null. 5 Quality of evidence for OS was not downgraded for blinding because this outcome is unlikely to be affected by non‐blinding. 6 Downgraded quality of evidence one level for 'indirectness' because this outcome is a surrogate endpoint of questionable validity for assessing the more important outcome of OS in the context of metastatic breast cancer (Burzykowski 2008) 7Estimated from all five TNBC treatment‐comparisons in the review 8 Downgraded quality of evidence one level for 'inconsistency' because there was substantial evidence of heterogeneity across studies (P < 0.05) | ||||||
| Platinum compared to non‐platinum chemotherapy regimens for nausea/vomiting, anaemia, hair loss and leukopenia | ||||||
| Patient or population: women with metastatic breast cancer | ||||||
| Outcomes | Anticipated absolute effects* (95% CI) | Relative effect | No. of participants (treatment‐ comparisons) | Quality of the evidence | Comments | |
| Risk with non‐platinum chemotherapy regimens | Risk with platinum | |||||
| Nausea/vomiting* grade 3 or 4 (safety population) by type of platinum agent in platinum regimen | Carboplatin | (RR 0.77, 95% CI 0.47 to 1.26) | 1441 (7) | ⊕⊕⊕⊝ | Test for carboplatin/cisplatin subgroup difference: P < 0.0001 Heterogeneity among carboplatin studies: P = 0.30, I2 = 17% Heterogeneity among cisplatin studies: P = 0.010, I2 = 32% | |
| 80 per 1,000 1 | 62 per 1,000 | |||||
| Cisplatin | (RR 2.65, 95% CI 2.10 to 3.34) | 1747 (14) | ⊕⊕⊕⊝ | |||
| 80 per 1,000 1 | 210 per 1,000 | |||||
| Anaemia grade 3 or 4 (safety population) by type of platinum agent in platinum regimen | Carboplatin | (RR 1.72, 95% CI 1.10 to 2.70) | 1441 (7) | ⊕⊕⊕⊕ | Test for carboplatin/cisplatin subgroup difference: P = 0.02 Heterogeneity among carboplatin studies: P = 0.67, I2 = 0% Heterogeneity among cisplatin studies: P = 0.50, I2 = 0% | |
| 33 per 1,000 1 | 57 per 1,000 | |||||
| Cisplatin | (RR 3.72, 95% CI 2.36 to 5.88) | 1644 (13) | ⊕⊕⊕⊕ HIGH | |||
| 33 per 1,000 1 | 123 per 1,000 | |||||
| Hair loss grade 3 or 4 (safety population) | Carboplatin or cisplatin | (RR 1.41, 95% CI 1.26 to 1.58) | 1452 (13) | ⊕⊕⊕⊕ | Test for carboplatin/cisplatin subgroup difference: P = 0.23 Heterogeneity: P = 0.10, I2 = 40% | |
| 264 per 1,000 1 | 372 per 1,000 | |||||
| Leukopenia** grade 3 or 4 (safety population) | Carboplatin or cisplatin | (RR 1.38, 95% CI 1.21 to 1.57) | 3176 (22) | ⊕⊕⊕⊝ | Test for carboplatin/cisplatin subgroup difference: P = 0.22 Heterogeneity: P = 0.0002, I2 = 60% | |
| 179 per 1,000 1 | 247 per 1,000 (217 to 281) | |||||
| *The risk in the intervention group (and its 95% confidence interval) is based on the assumed risk in the comparison group and the relative effect of the intervention (and its 95% CI). | ||||||
| GRADE Working Group grades of evidence | ||||||
| 1 Estimated from all treatment‐comparisons (cisplatin and carboplatin) contributing data for pooling for this outcome 2 Downgraded quality of evidence one level for 'imprecision' because the confidence interval for the pooled estimate is wide and does not rule out 'no effect' 3 Downgraded quality of evidence one level for 'inconsistency' because there was substantial evidence of heterogeneity across studies (P < 0.05) *data on vomiting was included if data on nausea/vomiting was reported separately **data on neutropenia was included if data on leukopenia was not reported | ||||||
| Generic name | Other names |
| Carboplatin | Blastocarb, Carboplat, Carboplatin Hexal, Carboplatino, Carbosin, Carbosol, Carbotec, CBDCA, Displata, Ercar, Nealorin, Novoplatinum, Paraplat, Paraplatin AQ, Paraplatin, Paraplatine, Platinwas, Ribocarbo |
| Cisplatin | Abiplatin, Blastolem, Briplatin,CACP, CDDP, cis‐DDP, cis‐diamminedichloridoplatinum, cis‐diamminedichloro platinum (II), cis‐diamminedichloroplatinum, Cis‐dichloroammine Platinum (II), Cismaplat, Cisplatina, cis‐platinous diamine dichloride, cis‐platinum II diamine dichloride, cis‐platinum II, cis‐platinum, Cisplatyl, Citoplatino, Citosin, CPDD, Cysplatyna, DDP, DDP, Lederplatin, Metaplatin, Neoplatin, PDD, Peyrone's Chloride, Peyrone's Salt, Placis, Platamine, Platiblastin, Platiblastin‐S, Platinex, Platinol‐ AQ, Platinol, Platinol‐AQ VHA Plus, Platinol‐AQ, Platinoxan, platinum diamminodichloride, Platiran, Platistin, Platosin |
| Oxaliplatin | Ai Heng, Aiheng, diaminocyclohexane oxalatoplatinum, oxalatoplatin, oxalatoplatinum, oxaliplatine, Eloxatin, Dacotin, Dacplat, Eloxatine, 1‐OHP, L‐OHP, oxaliplatin medac |
| Type of Agent | Action | Includes |
| Agents that damage the DNA template | by alkylation: nitrogen mustards | cyclophosphamide, melphalan, ifosfamide, chlorambucil |
| by alkylation: nitrosureas | carmustine (BCNU), lomustine (CCNU) | |
| by alkylation: other agents | thiotepa, mitomycin C | |
| by platinum coordination cross‐linking | cisplatin, carboplatin | |
| antibiotics | doxorubicin, daunorubicin, mitoxantrone, idarubicin, epirubicin, amsacrine | |
| podophyllotoxins | etoposide, teniposide | |
| by intercalation | dactinomycin, mithramycin | |
| by uncertain mechanisms | bleomycin | |
| Spindle poisons | vinca alkaloids | vincristine, vinblastine, vendesine, vinorelbine |
| taxanes | taxol, taxotere | |
| Antimetabolites | thymidylate synthase | 5‐fluorouracil |
| dihydrofolate reductase | methotrexate |
| Outcome | ||||
| Subgroup | Treatment‐ comparisons N | Overall survival n (% of N) | Progression ‐free survival/time to progression n (% of N) | Objective response rate n (% of N) |
| Overall: | 28 | 19 (68%) | 16 (57%) | 28 (100%) |
| Type of platinum agent in platinum arm: | ||||
| Cisplatin in platinum arm | 17 | 11 (65%) | 11 (65%) | 17 (100%) |
| Carboplatin in platinum arm | 10 | 8 (80%) | 5 (50%) | 10 (100%) |
| Oxaliplatin in platinum arm | 1 | (0%) | (0%) | 1 (100%) |
| Type of regimen comparison: | ||||
| Regimen A + platinum agent vs regimen A | 9 | 6 (67%) | 6 (67%) | 9 (100%) |
| Regimen A + platinum agent vs regimen B | 18 | 13 (72%) | 10 (56%) | 18 (100%) |
| Single agent platinum vs regimen C | 1 | (0%) | (0%) | 1 (100%) |
| First‐line therapy: | ||||
| First‐line therapy for > 80% of participants | 20 | 15 (75%) | 11 (55%) | 20 (100%) |
| Second‐ or third‐line therapy for ≥ 20% of participants | 8 | 4 (50%) | 5 (63%) | 8 (100%) |
| Participant selection for mTNBC: | ||||
| Participants with mTNBC | 5 | 3 (60%) | 3 (60%) | 5 (100%) |
| Participants unselected for mTNBC | 23 | 16 (70%) | 13 (57%) | 23 (100%) |
| Anthracycline in regimens: | ||||
| No anthracycline in platinum or non‐platinum regimens | 18 | 14 (78%) | 11 (61%) | 18 (100%) |
| Platinum + anthracycline vs non‐platinum + anthracycline regimens | 6 | 3 (50%) | 4 (67%) | 6 (100%) |
| Platinum + anthracycline vs non‐platinum + non‐anthracycline regimens | 4 | 2 (50%) | 1 (25%) | 4 (100%) |
| Taxane in regimens: | ||||
| No taxane in platinum or non‐platinum regimens | 17 | 9 (53%) | 9 (53%) | 17 (100%) |
| Platinum + taxane vs non‐platinum + taxane regimens | 6 | 6 (100%) | 3 (50%) | 6 (100%) |
| Platinum + non‐taxane vs non‐platinum + taxane regimens | 5 | 4 (80%) | 4 (80%) | 5 (100%) |
| Trastuzumab in regimens: | ||||
| No trastuzumab in platinum or non‐platinum regimens | 26 | 17 (65%) | 14 (54%) | 26 (100%) |
| Platinum + trastuzumab vs non‐platinum + trastuzumab regimens | 2 | 2 (100%) | 2 (100%) | 2 (100%) |
| Trials ID | Arm 1 (platinum‐containing) | Arm 2 (control) | First‐line therapy for > 80% of participants | Majority participants anthracycline‐naive |
| Regimen A + platinum vs regimen A | ||||
| Epi + Cis (epirubicin+cisplatin) | Epi (epirubicin) | Y | Y | |
| Epi + Cis + LND (epirubicin+cisplatin+lonidamine) | Epi + LND (epirubicin + lonidamine) | Y | Y | |
| Endoxan 50 mg per day at 10 am and methotrexate 2.5 mg twice a day at 9 am and 5 pm and with 'cisplatinum' | Endoxan 50 mg per day at 10 am and methotrexate 2.5 mg twice a day at 9 am and 5 pm | N | N | |
| C + Cb (Cetuximab + carboplatin) | C (Cetuximab with carboplatin added after progression) | N | N | |
| CBDA + CAF (carboplatin + cycloheximide + doxorubicin + fluorouracil + methotrexate) | CAF (cycloheximide + doxorubicin + fluorouracil) (methotrexate substituted after total doxorubicin ‐ 540 mg) | Y | Unclear | |
| PCb (paclitaxel + carboplatin) | Pw (paclitaxel) | Y | N | |
| Epi + Cis (epirubicin + cisplatin) | Epi (epirubicin) | Y | Y | |
| TPC (trastuzumab + paclitaxel + carboplatin) | TP (trastuzumab + paclitaxel) | Y | Unclear | |
| TCH (trastuzumab + docetaxel + carboplatin) | TH (trastuzumab + docetaxel) | Y | N | |
| Regimen A + platinum vs regimen B | ||||
| (pemetrexed + carboplatin) | (vinorelbine + gemcitabine) | N | N | |
| MPEPIV(a) or MPEMi (b) (a: methotrexate, leucovorin, cisplatin, epirubicin, vincristine; b: methotrexate, leucovorin, cisplatin, etoposide, mitomycin) | CMF (cyclophosphamide, methotrexate, fluorouracil) | Y | Y | |
| Etop + Cis (etoposide + cisplatin) | CMF (cyclophosphamide, methotrexate, fluorouracil) | Y | Unclear | |
| PE + CMF + AL (cisplatin + etoposide + doxorubicin + cyclophosphamide, methotrexate + fluorouracil, lecovorin + allopurinol) | CMF (cyclophosphamide, methotrexate, fluorouracil) | Y | Unclear | |
| CFP + CAP (cyclophosphamide + doxorubicin + cis‐dichlordiammine + CFP) | CFP (cyclophosphamide + fluorouracil + prednisone) | Y | Y | |
| OXA (oxaliplatin + 5‐flurouracil) | VIN (vinorelbine) | N | N | |
| EcisF (5‐flurouracil + epirubicin + cisplatin) | EcycloF (5‐flurouracil + epirubicin + cyclophosphamide) | Y | Y | |
| TP (docetaxel + cisplatin) | TX (docetaxel + capecitabine) | Y | N | |
| Epi + Pcb (epirubicin + carboplatin) | Epi + P (epirubicin + paclitaxel) | Y | Y (54%) | |
| PCb (paclitaxel + carboplatin) | GDoc (docetaxel + gemcitabine) | Y | N | |
| (cisplatin + gemcitabine) | (paclitaxel + gemcitabine) | Y | N | |
| Etop + Cis (etoposide + cisplatin) | P (paclitaxel) | N | N | |
| CAP (cyclophosphamide + doxorubicin + platinum) | CMFVP (cyclophosphamide + methotrexate + 5‐fluorouracil + vincristine + prednisone) | Y | Y | |
| CAP (cyclophosphamide + doxorubicin +platinum) | FAC (5‐flurouracil + doxorubicin + cyclophosphamide) | Y | Y | |
| GemCis (gemcitabine + cisplatin) | GemVin (gemcitabine + vinorelbine) | N | N | |
| GemCis (gemcitabine + cisplatin) | GemCap (gemcitabine + capecitabine) | N | N | |
| GemCis (gemcitabine + cisplatin) | GemPac (gemcitabine + paclitaxel) | Y | N | |
| GemCarb (gemcitabine + carboplatin) | GemPac (gemcitabine + paclitaxel) | Y | N | |
| Single agent platinum vs regimen C | ||||
| C (carboplatin) | D (docetaxel) | N | Unclear | |
| Trial ID | Extractable OS data for HR estimation1 | Median OS time2 | Extractable PFS/TTP data for HR estimation1 | Median PFS/TTP time2 | Overall response | Treatment‐related deaths | Grade III & IV Toxicity | Accrual3 |
| Regimen A + platinum vs regimen A | ||||||||
| NR | Y | Y | Y | Y | Y | Nausea/vomiting Nephrotoxicity Anaemia Leukopenia | 185 | |
| NR | Y | Y | Y | Y | Y | Nausea/vomiting Nephrotoxicity Anaemia Leukopenia | 186 | |
| NR | Y | NR | Y | Y | NR | NR | 126 | |
| Y | Y | Y | NR | Y | NR | Not extractable | 102 | |
| Y | Y | NR | NR | Y | Y | Nausea/vomiting Anaemia Leukopenia | 221 | |
| Y | Y | NR | NR | Y | Y | Nausea/vomiting Anaemia Hair loss Leukopenia | 204 | |
| Y | Y | Y | Y | Y | Y | Nausea/vomiting Leukopenia | 155 | |
| Y | Y | Y | Y | Y | NR | Nausea/vomiting Anaemia Leukopenia | 196 | |
| Y | Y | Y | Y | Y | Y | Nausea/vomiting Anaemia | 263 | |
| Regimen A + platinum vs regimen B | ||||||||
| NR | NR | Y | Y | Y | Y | Leukopenia | 135 | |
| Y | Y | NR | Y | Y | NR | Anaemia Leukopenia | 140 | |
| Y | Y | NR | Y | Y | NR | Nausea/vomiting Anaemia Hair loss Leukopenia | 105 | |
| NR | Y | NR | Y | Y | DU | Not extractable | 169 | |
| Y | Y | Y | Y | Y | NR | Nausea/vomiting Hair loss Leukopenia | 86 | |
| NR | Y | NR | Y | Y | Y | Not extractable | 137 | |
| NR | Y | Y | Y | Y | DU | Nausea/vomiting Anaemia Hair loss Leukopenia | 59 | |
| Y | Y | Y | Y | Y | Y | Nausea/vomiting Anaemia Leukopenia | 53 | |
| Y | NR | NR | NR | Y | NR | Nausea/vomiting Anaemia Leukopenia | 327 | |
| Y | Y | NR | NR | Y | Y | Nausea/vomiting Anaemia Hair loss Leukopenia | 212 | |
| Y | NR | Y | Y | Y | Y | Nausea/vomiting Anaemia Hair loss Leukopenia | 236 | |
| Y | Y | Y | NR | Y | Y | Nausea/vomiting Anaemia Leukopenia | 193 | |
| NR | NR | NR | NR | Y | NR | Nausea/vomiting Nephrotoxicity Anaemia Hair loss Leukopenia | 123 | |
| Y | Y | NR | NR | Y | Y | Nausea/vomiting Anaemia Hair loss Leukopenia | 142 | |
| Y | Y | Y | Y | Y | NR | Nausea/vomiting Anaemia Hair loss Leukopenia | 69 | |
| Y | Y | Y | Y | Y | NR | Nausea/vomiting Anaemia Hair loss Leukopenia | 72 | |
| Y | Y | Y | Y | Y | Y | Nausea/vomiting Nephrotoxicity Anaemia Hair loss Leukopenia | 75 | |
| Y | Y | Y | Y | Y | Y | Nausea/vomiting Nephrotoxicity Anaemia Hair loss Leukopenia | 71 | |
| Single agent platinum vs regimen C | ||||||||
| NR | Y | NR | Y | Y | NR | NR | 376 | |
| 1 Sufficient data reported to estimate a HR for pooling as outlined by Parmar 1998 and Tierney 2007; this includes Kapalan‐Meier curve, HR and standard error/confidence interval or logrank statistics 2 Trials that did not explicitly report median time were classified as NR here regardless of estimable median time from Kaplan‐Meier curve 3 Accrual numbers represent the maximum numbers of participants in the trial (not study) that were included in the analyses of OS, PFS/TTP or OR (assessable participants). *NR = not reported, DU = deaths unexplained, Y = data reported. | ||||||||
| Outcome or subgroup title | No. of studies | No. of participants | Statistical method | Effect size |
| 1 Overall survival Show forest plot | 19 | 2922 | HR (95% CI) | 0.98 [0.89, 1.07] |
| 1.1 Treatment‐comparisons assessing patients with mTNBC | 3 | 391 | HR (95% CI) | 0.75 [0.57, 1.00] |
| 1.2 Treatment‐comparisons assessing patients unselected for mTNBC | 16 | 2531 | HR (95% CI) | 1.01 [0.92, 1.12] |
| 2 Progression‐free survival/time to progression Show forest plot | 16 | 2136 | HR (95% CI) | 0.85 [0.78, 0.93] |
| 2.1 Treatment‐comparisons assessing patients with mTNBC | 3 | 391 | HR (95% CI) | 0.59 [0.49, 0.72] |
| 2.2 Treatment‐comparisons assessing patients unselected for mTNBC | 13 | 1745 | HR (95% CI) | 0.92 [0.84, 1.01] |
| 3 Objective tumour response rate (assessable participants) Show forest plot | 28 | 4130 | Risk Ratio (M‐H, Fixed, 95% CI) | 1.15 [1.08, 1.22] |
| 3.1 Treatment‐comparisons assessing patients with mTNBC | 5 | 878 | Risk Ratio (M‐H, Fixed, 95% CI) | 1.33 [1.13, 1.56] |
| 3.2 Treatment‐comparisons assessing patients unselected for mTNBC | 23 | 3252 | Risk Ratio (M‐H, Fixed, 95% CI) | 1.11 [1.04, 1.19] |
| Outcome or subgroup title | No. of studies | No. of participants | Statistical method | Effect size |
| 1 Overall survival Show forest plot | 19 | 2922 | HR (95% CI) | 0.98 [0.89, 1.07] |
| 1.1 Regimen A + platinum agent vs regimen A | 6 | 1141 | HR (95% CI) | 1.08 [0.93, 1.26] |
| 1.2 Regimen A + platinum agent vs regimen B | 13 | 1781 | HR (95% CI) | 0.92 [0.81, 1.03] |
| 2 Progression‐free survival / time to progression Show forest plot | 16 | 2136 | HR (95% CI) | 0.85 [0.78, 0.93] |
| 2.1 Regimen A+platinum agent vs regimen A | 6 | 1087 | HR (95% CI) | 0.88 [0.78, 1.00] |
| 2.2 Regimen A+platinum agent vs regimen B | 10 | 1049 | HR (95% CI) | 0.83 [0.74, 0.93] |
| 3 Objective tumour response rate (assessable participants) Show forest plot | 28 | 4130 | Risk Ratio (M‐H, Fixed, 95% CI) | 1.15 [1.08, 1.22] |
| 3.1 Regimen A + platinum agent vs regimen A | 9 | 1519 | Risk Ratio (M‐H, Fixed, 95% CI) | 1.10 [1.01, 1.21] |
| 3.2 Regimen A + platinum agent vs regimen B | 18 | 2235 | Risk Ratio (M‐H, Fixed, 95% CI) | 1.22 [1.12, 1.33] |
| 3.3 Single agent platinum vs regimen C | 1 | 376 | Risk Ratio (M‐H, Fixed, 95% CI) | 0.88 [0.66, 1.17] |
| Outcome or subgroup title | No. of studies | No. of participants | Statistical method | Effect size |
| 1 Overall survival Show forest plot | 19 | 2922 | HR (95% CI) | 0.98 [0.89, 1.07] |
| 1.1 Cisplatin in platinum arm | 11 | 1326 | HR (95% CI) | 0.91 [0.80, 1.05] |
| 1.2 Carboplatin in platinum arm | 8 | 1596 | HR (95% CI) | 1.04 [0.91, 1.18] |
| 2 Progression‐free survival/time to progression Show forest plot | 16 | 2136 | HR (95% CI) | 0.85 [0.78, 0.93] |
| 2.1 Cisplatin in platinum arm | 11 | 1369 | HR (95% CI) | 0.85 [0.76, 0.94] |
| 2.2 Carboplatin in platinum arm | 5 | 767 | HR (95% CI) | 0.86 [0.75, 0.99] |
| 3 Objective tumour response rate (assessable participants) Show forest plot | 28 | 4130 | Risk Ratio (M‐H, Fixed, 95% CI) | 1.15 [1.08, 1.22] |
| 3.1 Cisplatin in platinum arm | 17 | 2050 | Risk Ratio (M‐H, Fixed, 95% CI) | 1.35 [1.24, 1.46] |
| 3.2 Carboplatin in platinum arm | 10 | 1943 | Risk Ratio (M‐H, Fixed, 95% CI) | 0.94 [0.86, 1.04] |
| 3.3 Oxaliplatin in platinum arm | 1 | 137 | Risk Ratio (M‐H, Fixed, 95% CI) | 0.85 [0.48, 1.52] |
| 4 Treatment‐related death (safety population) Show forest plot | 15 | 2377 | Risk Ratio (M‐H, Fixed, 95% CI) | 1.42 [0.73, 2.76] |
| 4.1 Cisplatin in platinum arm | 8 | 1185 | Risk Ratio (M‐H, Fixed, 95% CI) | 1.39 [0.59, 3.25] |
| 4.2 Carboplatin in platinum arm | 6 | 1055 | Risk Ratio (M‐H, Fixed, 95% CI) | 1.86 [0.57, 6.05] |
| 4.3 Oxaliplatin in platinum arm | 1 | 137 | Risk Ratio (M‐H, Fixed, 95% CI) | 0.34 [0.01, 8.16] |
| 5 Nausea/vomiting (safety population) Show forest plot | 21 | 3172 | Risk Ratio (M‐H, Fixed, 95% CI) | 2.07 [1.69, 2.54] |
| 5.1 Cisplatin in platinum arm | 14 | 1731 | Risk Ratio (M‐H, Fixed, 95% CI) | 2.65 [2.10, 3.34] |
| 5.2 Carboplatin in platinum arm | 7 | 1441 | Risk Ratio (M‐H, Fixed, 95% CI) | 0.77 [0.47, 1.26] |
| 6 Nephrotoxicity (safety population) Show forest plot | 5 | 632 | Risk Ratio (M‐H, Fixed, 95% CI) | 3.06 [0.86, 10.84] |
| 6.1 Cisplatin in platinum arm | 4 | 561 | Risk Ratio (M‐H, Fixed, 95% CI) | 3.46 [0.86, 13.97] |
| 6.2 Carboplatin in platinum arm | 1 | 71 | Risk Ratio (M‐H, Fixed, 95% CI) | 1.56 [0.07, 36.97] |
| 7 Anaemia (safety population) Show forest plot | 20 | 3085 | Risk Ratio (M‐H, Fixed, 95% CI) | 2.61 [1.90, 3.58] |
| 7.1 Cisplatin in platinum arm | 13 | 1644 | Risk Ratio (M‐H, Fixed, 95% CI) | 3.72 [2.36, 5.88] |
| 7.2 Carboplatin in platinum arm | 7 | 1441 | Risk Ratio (M‐H, Fixed, 95% CI) | 1.72 [1.10, 2.70] |
| 8 Hair loss (safety population) Show forest plot | 12 | 1452 | Risk Ratio (M‐H, Fixed, 95% CI) | 1.41 [1.26, 1.58] |
| 8.1 Cisplatin in platinum arm | 9 | 983 | Risk Ratio (M‐H, Fixed, 95% CI) | 1.33 [1.15, 1.54] |
| 8.2 Carboplatin in platinum arm | 3 | 469 | Risk Ratio (M‐H, Fixed, 95% CI) | 1.53 [1.28, 1.84] |
| 9 Leukopenia (safety population) Show forest plot | 22 | 3176 | Risk Ratio (M‐H, Fixed, 95% CI) | 1.38 [1.21, 1.57] |
| 9.1 Cisplatin in platinum arm | 15 | 1866 | Risk Ratio (M‐H, Fixed, 95% CI) | 1.49 [1.23, 1.81] |
| 9.2 Carboplatin in platinum arm | 7 | 1310 | Risk Ratio (M‐H, Fixed, 95% CI) | 1.27 [1.07, 1.50] |
| Outcome or subgroup title | No. of studies | No. of participants | Statistical method | Effect size |
| 1 Overall survival Show forest plot | 19 | 2922 | HR (95% CI) | 0.98 [0.89, 1.07] |
| 1.1 First‐line therapy for > 80% of patients | 15 | 2486 | HR (95% CI) | 1.00 [0.90, 1.11] |
| 1.2 Second‐ or third‐line therapy for ≥20% of patients | 4 | 436 | HR (95% CI) | 0.89 [0.73, 1.09] |
| 2 Progression‐free survival/time to progression Show forest plot | 16 | 2136 | HR (95% CI) | 0.85 [0.78, 0.93] |
| 2.1 First‐line therapy for > 80% of patients | 11 | 1565 | HR (95% CI) | 0.93 [0.83, 1.03] |
| 2.2 Second‐ or third‐line therapy for ≥20% of patients | 5 | 571 | HR (95% CI) | 0.75 [0.65, 0.86] |
| 3 Objective tumour response rate (assessable participants) Show forest plot | 28 | 4130 | Risk Ratio (M‐H, Fixed, 95% CI) | 1.15 [1.08, 1.22] |
| 3.1 First‐line therapy for > 80% of patients | 20 | 2983 | Risk Ratio (M‐H, Fixed, 95% CI) | 1.14 [1.06, 1.21] |
| 3.2 Second‐ or third‐line therapy for ≥20% of patients | 8 | 1147 | Risk Ratio (M‐H, Fixed, 95% CI) | 1.20 [1.02, 1.42] |
| Outcome or subgroup title | No. of studies | No. of participants | Statistical method | Effect size |
| 1 Overall survival Show forest plot | 19 | 2922 | HR (95% CI) | 0.98 [0.89, 1.07] |
| 1.1 No anthracycline in platinum or non‐platinum regimens | 14 | 2213 | HR (95% CI) | 0.94 [0.84, 1.05] |
| 1.2 Platinum + anthracycline vs non‐platinum + anthracycline regimens | 3 | 518 | HR (95% CI) | 1.09 [0.88, 1.34] |
| 1.3 Platinum + anthracycline vs non‐platinum + non‐anthracycline regimens | 2 | 191 | HR (95% CI) | 1.12 [0.78, 1.60] |
| 2 Progression‐free survival/time to progression Show forest plot | 16 | 2136 | HR (95% CI) | 0.85 [0.78, 0.93] |
| 2.1 No anthracycline in platinum or non‐platinum regimens | 11 | 1465 | HR (95% CI) | 0.80 [0.73, 0.88] |
| 2.2 Platinum+anthracycline vs non‐platinum+anthracycline regimens | 4 | 585 | HR (95% CI) | 1.05 [0.86, 1.27] |
| 2.3 Platinum+anthracycline vs non‐platinum+non‐anthracycline regimens | 1 | 86 | HR (95% CI) | 1.23 [0.75, 2.03] |
| 3 Objective tumour response rate (assessable participants) Show forest plot | 28 | 4130 | Risk Ratio (M‐H, Fixed, 95% CI) | 1.15 [1.08, 1.22] |
| 3.1 No anthracycline in platinum or non‐platinum regimens | 18 | 2792 | Risk Ratio (M‐H, Fixed, 95% CI) | 1.10 [1.02, 1.20] |
| 3.2 Platinum+anthracycline vs non‐platinum+anthracycline regimens | 6 | 859 | Risk Ratio (M‐H, Fixed, 95% CI) | 1.09 [0.97, 1.22] |
| 3.3 Platinum+anthracycline vs non‐platinum+non‐anthracycline regimens | 4 | 479 | Risk Ratio (M‐H, Fixed, 95% CI) | 1.49 [1.28, 1.74] |
| Outcome or subgroup title | No. of studies | No. of participants | Statistical method | Effect size |
| 1 Overall survival Show forest plot | 19 | 2922 | HR (95% CI) | 0.98 [0.89, 1.07] |
| 1.1 No taxane in platinum or non‐platinum regimens | 9 | 1092 | HR (95% CI) | 1.07 [0.93, 1.24] |
| 1.2 Platinum + taxane vs non‐platinum + taxane regimens | 6 | 1255 | HR (95% CI) | 0.96 [0.82, 1.11] |
| 1.3 Platinum + non‐taxane vs non‐platinum + taxane regimens | 4 | 575 | HR (95% CI) | 0.85 [0.69, 1.04] |
| 2 Progression‐free survival / time to progression Show forest plot | 16 | 2136 | HR (95% CI) | 0.85 [0.78, 0.93] |
| 2.1 No taxane in platinum or non‐platinum regimens | 9 | 1049 | HR (95% CI) | 0.92 [0.80, 1.04] |
| 2.2 Platinum + taxane vs non‐platinum + taxane regimens | 3 | 512 | HR (95% CI) | 0.84 [0.70, 1.00] |
| 2.3 Platinum + non‐taxane vs non‐platinum + taxane regimens | 4 | 575 | HR (95% CI) | 0.79 [0.69, 0.91] |
| 3 Objective tumour response rate (assessable participants) Show forest plot | 28 | 4130 | Risk Ratio (M‐H, Fixed, 95% CI) | 1.15 [1.08, 1.22] |
| 3.1 No taxane in platinum or non‐platinum regimens | 17 | 2054 | Risk Ratio (M‐H, Fixed, 95% CI) | 1.25 [1.15, 1.36] |
| 3.2 Platinum + taxane vs non‐platinum + taxane regimens | 6 | 1152 | Risk Ratio (M‐H, Fixed, 95% CI) | 1.01 [0.90, 1.12] |
| 3.3 Platinum + non‐taxane vs non‐platinum + taxane regimens | 5 | 924 | Risk Ratio (M‐H, Fixed, 95% CI) | 1.11 [0.94, 1.30] |
| Outcome or subgroup title | No. of studies | No. of participants | Statistical method | Effect size |
| 1 Overall survival Show forest plot | 19 | 2922 | HR (95% CI) | 0.98 [0.89, 1.07] |
| 1.1 No trastuzumab in platinum or non‐platinum regimens | 17 | 2463 | HR (95% CI) | 0.97 [0.88, 1.08] |
| 1.2 Platinum + trastuzumab vs non‐platinum + trastuzumab regimens | 2 | 459 | HR (95% CI) | 1.00 [0.79, 1.27] |
| 2 Progression‐free survival/time to progression Show forest plot | 16 | 2136 | HR (95% CI) | 0.85 [0.78, 0.93] |
| 2.1 No trastuzumab in platinum or non‐platinum regimens | 14 | 1677 | HR (95% CI) | 0.84 [0.76, 0.92] |
| 2.2 Platinum+trastuzumab vs non‐platinum+trastuzumab regimens | 2 | 459 | HR (95% CI) | 0.90 [0.75, 1.08] |
| 3 Objective tumour response rate (assessable participants) Show forest plot | 28 | 4130 | Risk Ratio (M‐H, Fixed, 95% CI) | 1.15 [1.08, 1.22] |
| 3.1 No trastuzumab in platinum or non‐platinum regimens | 26 | 3687 | Risk Ratio (M‐H, Fixed, 95% CI) | 1.15 [1.07, 1.23] |
| 3.2 Platinum+trastuzumab vs non‐platinum+trastuzumab regimens | 2 | 443 | Risk Ratio (M‐H, Fixed, 95% CI) | 1.14 [0.99, 1.31] |
| Outcome or subgroup title | No. of studies | No. of participants | Statistical method | Effect size |
| 1 Overall survival (restricted to the 12 treatment‐comparisons common to OS and PFS/TTP meta‐analyses) Show forest plot | 12 | 1571 | HR (95% CI) | 0.92 [0.81, 1.04] |
| 2 Progression‐free survival/time to progression (restricted to the 12 treatment‐comparisons common to OS and PFS/TTP meta‐analyses) Show forest plot | 12 | 1571 | HR (95% CI) | 0.80 [0.73, 0.88] |
| 3 Objective tumour response rate (assessable participants‐ restricted to the 19 treatment‐comparisons in OS meta‐analyses) Show forest plot | 19 | 2685 | Risk Ratio (M‐H, Fixed, 95% CI) | 1.13 [1.05, 1.22] |
| Outcome or subgroup title | No. of studies | No. of participants | Statistical method | Effect size |
| 1 Progression‐free survival vs time to progression Show forest plot | 16 | 2136 | HR (95% CI) | 0.85 [0.78, 0.93] |
| 1.1 Progression‐free survival | 9 | 1324 | HR (95% CI) | 0.92 [0.82, 1.03] |
| 1.2 Time to progression | 7 | 812 | HR (95% CI) | 0.78 [0.69, 0.88] |
| Outcome or subgroup title | No. of studies | No. of participants | Statistical method | Effect size |
| 1 Overall survival Show forest plot | 19 | Hazard Ratio (Random, 95% CI) | 0.98 [0.87, 1.11] | |
| 1.1 Treatment‐comparisons assessing patients with mTNBC | 3 | Hazard Ratio (Random, 95% CI) | 0.73 [0.51, 1.04] | |
| 1.2 Treatment‐comparisons assessing patients unselected for mTNBC | 16 | Hazard Ratio (Random, 95% CI) | 1.02 [0.90, 1.16] | |
| 2 Progression‐free survival/time to progression Show forest plot | 16 | Hazard Ratio (Random, 95% CI) | 0.88 [0.76, 1.02] | |
| 2.1 Treatment‐comparisons assessing patients with mTNBC | 3 | Hazard Ratio (Random, 95% CI) | 0.55 [0.38, 0.78] | |
| 2.2 Treatment‐comparisons assessing patients unselected for mTNBC | 13 | Hazard Ratio (Random, 95% CI) | 0.96 [0.85, 1.09] | |
| 3 Objective tumour response rate (assessable participants) Show forest plot | 28 | 4130 | Risk Ratio (M‐H, Random, 95% CI) | 1.17 [1.05, 1.30] |
| 3.1 Treatment‐comparisons assessing patients with mTNBC | 5 | 878 | Risk Ratio (M‐H, Random, 95% CI) | 1.60 [1.04, 2.45] |
| 3.2 Treatment‐comparisons assessing patients unselected for mTNBC | 23 | 3252 | Risk Ratio (M‐H, Random, 95% CI) | 1.13 [1.01, 1.25] |