بررسی رژیمهای درمانی حاوی پلاتینوم در درمان سرطان متاستاتیک پستان
Referencias
منابع مطالعات واردشده در این مرور
منابع مطالعات خارجشده از این مرور
منابع مطالعات در حال انجام
منابع اضافی
Characteristics of studies
Characteristics of included studies [ordered by study ID]
| Methods | Multicentre, randomised, two‑stage, open‐label, noncomparative, parallel‐group phase II study conducted between June 2006 and April 2010. | |
| Participants | 135 adult females with a histologic or cytologic diagnosis of advanced breast cancer previously treated with anthracycline and taxanes.. Median age 52 and 51.5 years in platinum and control arms, respectively. | |
| Interventions | Pemetrexed and carboplatin vs vinorelbine and gemcitabine. ARM A: Pemetrexed 600 mg/m2 (intravenously for 10 min on day 1) and carboplatin (given over approximately 30 min beginning after the end of the pemetrexed infusion for target area under the curve (AUC) 5.0) on day 1, after pretreatment with folic acid, vitamin B12 and dexamethasone. ARM B: Vinorelbine 30 mg/m2 (given over approximately 6 to 10 min) and gemcitabine 1,200 mg/m2 (given over approximately 30 min) were administered on day 1 and day 8. | |
| Outcomes | Response. Grades 3 and 4 adverse events (only reported when event occurred in ≥ 10% of participants in each treatment group). QoL (EORTC questionnaires, QLQ‑C30 global health status, and QLQ‑BR23 body image). | |
| Notes | Data for TTTF was not extractable because only event numbers and median TTFs were reported (i.e. pemetrexed and carboplatin: events/total = 60/69, median TTTF = 4.8 months; vinorelbine and gemcitabine: events/total= 58/66, median TTTF = 5.1 months). Data for some adverse event types such as anaemia were not extractable because event data were only reported for event types which occurred in ≥ 10% of participants in each treatment group. QoL: Pemetrexed/carboplatin participants had significantly greater deterioration in global health status scores (follow‐up minus baseline scores) than vinorelbine/gemcitabine participants. There was no significance difference in body image scores between groups. Median TTPD was 5.1 (95% CI: 4.1 to 8.0) months for pemetrexed/carboplatin arm and 5.6 months (95% CI: 4.2 to 7.5) months for vinorelbine/gemcitabine arm. This study was sponsored by Eli Lilly and Company, Indianapolis, IN, USA. | |
| Risk of bias | ||
| Bias | Authors' judgement | Support for judgement |
| Random sequence generation (selection bias) | Unclear risk | Participants were "randomised either to Arm A …or to Arm B..."; no additional details were provided on how random assignment was achieved in the trial report. |
| Allocation concealment (selection bias) | Unclear risk | Method of concealment was not described. |
| Blinding of participants and personnel (performance bias) | High risk | Open‐label trial. |
| Blinding of outcome assessment (detection bias) (outcomes other than overall survival and quality of life) | Unclear risk | Open‐label study but not clear if outcome assessors were blinded to intervention. For tumour response rates, radiological assessments performed before treatment at every other cycle. No further details provided. |
| Incomplete outcome data (attrition bias) (time‐to‐event outcomes) | Low risk | All 69 and 66 participants randomised to intervention and control groups, respectively, were analysed in time‐to‐event analyses (intent‐to‐treat analyses). |
| Incomplete outcome data (attrition bias) (binary outcomes) | High risk | 12 of 69 and 10 of 66 participants randomised to intervention and control groups, respectively, were not assessed/assessable for tumour response (16.3% of all randomised participants). 4 of 69 and 0 of 66 participants randomised to intervention and control groups, respectively, were not included in the safety population for evaluating toxicities (3.0% of all randomised participants). |
| Selective reporting (reporting bias) | Unclear risk | Quality of life was not included in ClinicalTrials.gov record (https://clinicaltrials.gov/ct2/show/NCT00325234) but was included in the trial report. All other outcomes in the trial report were listed in the ClinicalTrials.gov record and vice versa. |
| Other bias | Low risk | None identified. |
| Methods | RCT multicentre phase III trial. Accrual October 1995 to April 1999. | |
| Participants | 186 women with histologically confirmed metastatic breast cancer (1 ineligible ‐185 entered trial) in the treatment‐comparison Berruti 2002 A (186 participants also for Berruti 2002 B). | |
| Interventions | EPI vs EPI + CDDP. ARM A: Epirubicin 60 mg/m2 on days 1 and 2 every 21 days. ARM B: EPI + CDDP: Epiubicin 60 mg/m2 IV on days 1 and 2 + platinum 30 mg/2 IV on day 1 and 2 every 21 days. | |
| Outcomes | Overall survival measured from the date of randomisation until death (insufficient OS data reported to calculate hazard ratio for pooling). | |
| Notes | The trial was part of a factorial 2 x 2 design (4 arms n = 371) to answer two questions. IT IS INCLUDED IN THIS REVIEW AS TWO TRIALS: Berruti (a) and Berrutti (b). Intention‐to‐treat analyses used for overall survival and time to progression. | |
| Risk of bias | ||
| Bias | Authors' judgement | Support for judgement |
| Random sequence generation (selection bias) | Unclear risk | Method of random sequence generation not reported in detail. |
| Allocation concealment (selection bias) | Unclear risk | Not reported ‐ stated as "randomized" only. |
| Blinding of participants and personnel (performance bias) | Unclear risk | No information in trial publication. |
| Blinding of outcome assessment (detection bias) (overall survival) | Low risk | No information in trial publication. Unlikely that assessment of overall survival would be influenced by lack of blinding. |
| Blinding of outcome assessment (detection bias) (outcomes other than overall survival and quality of life) | Unclear risk | Standard criteria used for classifying tumour response; physical examination or radiography took place. No further details provided. |
| Incomplete outcome data (attrition bias) (time‐to‐event outcomes) | Unclear risk | 92 of 93 and 93 of 93 participants randomised to intervention and control groups, respectively, were analysed in time‐to‐event analysis (modified intent‐to‐treat). |
| Incomplete outcome data (attrition bias) (binary outcomes) | Low risk | 8 of 93 and 5 of 93 participants randomised to intervention and control groups, respectively, were not assessed/assessable for tumour response (7.5% of all randomised participants). 3 of 93 and 1 of 93 participants randomised to intervention and control groups, respectively, were not included in the safety population for evaluating toxicities (2.2% of all randomised participants). |
| Selective reporting (reporting bias) | Unclear risk | No trial registration or published protocol prespecifying all study outcomes. Study began recruitment before July 1, 2005 so expectation of registration or published protocol was low. |
| Other bias | Low risk | None identified. |
| Methods | RCT mulitcentre phase III trial. Accrual October 1995 to April 1999. | |
| Participants | 186 women with histologically confirmed metastatic breast cancer. | |
| Interventions | EPI + LND vs EPI + CDDP + LND. ARM A: EPI + LND: Epiubicin 60 mg/m2 IV on days 1 and 2 every 21 days and Lonidamine 450 mg po every day. ARM B: EPI + CDDP + LND: Epiubicin 60 mg/m2 IV on days 1 and 2 + cisplatin 30 mg/m2 IV on days 1 and 2 every 21 days + lonidamine 450 mg po every day. LND was pursued until progression. Remaining chemotherapy was delivered up to a maximum of 6 weeks. | |
| Outcomes | Overall survival measured from the date of randomisation until death. | |
| Notes | Toxic deaths n = 5, due to either hematologic, toxicity, pulmonary thromboembolism, congestive heart failure, arrhythmia, hepatorenal syndrome or sudden death. | |
| Risk of bias | ||
| Bias | Authors' judgement | Support for judgement |
| Random sequence generation (selection bias) | Unclear risk | Method of random sequence generation not reported in detail. |
| Allocation concealment (selection bias) | Unclear risk | Not reported ‐ stated as "randomized" only. |
| Blinding of participants and personnel (performance bias) | Unclear risk | No information in trial publication. |
| Blinding of outcome assessment (detection bias) (overall survival) | Low risk | No information in trial publication. Unlikely that assessment of overall survival would be influenced by lack of blinding. |
| Blinding of outcome assessment (detection bias) (outcomes other than overall survival and quality of life) | Unclear risk | Standard criteria used for classifying tumour response; physical examination or radiography took place. No further details provided. |
| Incomplete outcome data (attrition bias) (time‐to‐event outcomes) | Low risk | All 93 and 93 participants randomised to intervention and control groups, respectively, were analysed in time‐to‐event analyses (intent‐to‐treat analyses). |
| Incomplete outcome data (attrition bias) (binary outcomes) | Low risk | 8 of 93 and 5 of 93 participants randomised to intervention and control groups, respectively, were not assessed/assessable for tumour response (8.6% of all randomised participants). 3 of 93 and 2 of 93 participants randomised to intervention and control groups, respectively, were not included in the safety population for evaluating toxicities (2.7% of all randomised participants). |
| Selective reporting (reporting bias) | Unclear risk | No trial registration or published protocol prespecifying all study outcomes. Study began recruitment before July 1, 2005 so expectation of trial registration or published protocol was low. |
| Other bias | Low risk | None identified. |
| Methods | Randomised phase III trial. | |
| Participants | 126 mTNBC participants between age group of 38 to 72 years and who had already received anthracyclines and taxanes and had relapsed and could not afford ixabepilone and/or avastin. | |
| Interventions | 'No platinum' arm: endoxan 50 mg per day at 10 am and methotrexate 2.5 mg twice a day at 9 am and 5 pm. | |
| Outcomes | Response. Time to progression (insufficient TTP data reported to calculate hazard ratio for pooling). Toxicity (no results reported). | |
| Notes | Abstract only. Median follow‐up not stated. Median TTP: Platinum arm 13 months vs 'no platinum' arm 7 months (insufficient TTP data reported to calculate hazard ratio for pooling). Median OS: Platinum arm 16 months vs 'no platinum' arm 12 months (insufficient OS data reported to calculate hazard ratio for pooling). | |
| Risk of bias | ||
| Bias | Authors' judgement | Support for judgement |
| Random sequence generation (selection bias) | Low risk | Stratified on more than one factor. Quote: "Patients were randomised to either... stratified by number of sites of metastasis and with or without visceral metastasis with or without bisphosphonates." |
| Allocation concealment (selection bias) | Unclear risk | Method of concealment was not described in the abstract. |
| Blinding of participants and personnel (performance bias) | Unclear risk | No information provided in the abstract. |
| Blinding of outcome assessment (detection bias) (overall survival) | Low risk | No information provided in the abstract. Unlikely that assessment of overall survival would be influenced by lack of blinding. |
| Blinding of outcome assessment (detection bias) (outcomes other than overall survival and quality of life) | Unclear risk | No information provided in the abstract. |
| Incomplete outcome data (attrition bias) (time‐to‐event outcomes) | Low risk | All 60 and 66 participants randomised to intervention and control groups, respectively, appear to have been analysed in time‐to‐event analyses (intent‐to‐treat analyses), but only median times were reported (hence no extractable time‐to‐event data). |
| Incomplete outcome data (attrition bias) (binary outcomes) | Unclear risk | All randomised participants appear to have been assessed/assessable for tumour response. This was not entirely clear though, as it was not explicitly stated and they may have simply used randomised participant denominators. |
| Selective reporting (reporting bias) | High risk | The abstract mentions that toxicity was recorded but no results were reported. In addition, there was no trial registration or published protocol containing prespecified outcomes. The date when participant recruitment began was not reported, but given that this was first published in September 2009, it seemed likely that recruitment began after July 1, 2005. As of April 2015, there has been no further results published other than those in the conference abstract. |
| Other bias | Low risk | None identified. |
| Methods | Multicentre randomised phase II study. Participants were randomised to control or platinum arms, with control participants additionally receiving platinum upon progression. | |
| Participants | 112 women with stage IV triple‐negative metastatic breast cancer measurable by RECIST criteria and negative for ER, PR, and HER2 (0 or 1 on immunohistochemistry and/or normal gene copy number by fluorescence in situ hybridisation), of which 102 were treated and included in time‐to‐event analyses. Median age 52 and 49 years in platinum and control arms, respectively. | |
| Interventions | Ce vs Ce + C. ARM 1: Cetuximab (400 mg/m2 load then 250 mg/m2 per week intravenously (IV)) alone, with carboplatin (area under the curve of 2, once per week IV) added after progression. ARM 2: Cetuximab (400 mg/m2 load then 250 mg/m2 per week intravenously and with carboplatin | |
| Outcomes | Response. Toxicity (data not extractable because results for Arm 2 were combined with Arm 1 participants after progression). | |
| Notes | Estimated min follow‐up = 0.25 months (based on first censoring tick on TTP curve). Median OS was 7.5 months (95% CI, 5.0 to 11.6) for arm one and 10.4 months (95% CI, 7.7 to 13.1) for arm 2. Study supported by Bristol‐Myers Squibb, University of North Carolina Breast Cancer Specialized Program of Research, Avon Partners‐for‐Progress awards and by National Institutes of Health. | |
| Risk of bias | ||
| Bias | Authors' judgement | Support for judgement |
| Random sequence generation (selection bias) | Low risk | Quotes: "Patients were randomly assigned…" and "Constrained block randomizations (block size 21 plus 21) kept the imbalance between the arms to four at most". |
| Allocation concealment (selection bias) | Unclear risk | Method of concealment was not described. |
| Blinding of participants and personnel (performance bias) | High risk | Quote: "Single Blind (Outcomes Assessor)" at https://clinicaltrials.gov/show/NCT00232505 implying that participants and personnel were aware of treatment allocation. |
| Blinding of outcome assessment (detection bias) (overall survival) | Low risk | Single Blind (Outcomes Assessor). Assessment of overall survival was unlikely to be influenced by no or incomplete blinding. |
| Blinding of outcome assessment (detection bias) (outcomes other than overall survival and quality of life) | Low risk | Cyclical evaluations including biochemical tests, CT or MRI imaging every 8 weeks, in addition to an independent evaluation of OTRR by "investigators blinded to treatment arms and not involved in the study". |
| Incomplete outcome data (attrition bias) (time‐to‐event outcomes) | Unclear risk | 102 of 112 randomised participants were analysed in time‐to‐event analyses (modified ITT). The 10 excluded participants were excluded after enrolment but before treatment, but no information was provided on the randomised groups of these excluded participants. |
| Incomplete outcome data (attrition bias) (binary outcomes) | Unclear risk | 10 of 112 randomised participants were excluded from all analyses, with no information provided on the randomised groups of these excluded participants. In addition to these 10 excluded participants: 6 of 71 and 0 of 31 participants in the (known) intervention and control groups, respectively, were not assessed/assessable for tumour response (14.3% of all randomised participants); 6 of 71 and 0 of 31 participants in the (known) intervention and control groups, respectively, were excluded from the safety population for evaluating toxicities (14.3% of all randomised participants) (toxicity data were not extractable because results for Arm 2 were combined with Arm 1 participants after progression). |
| Selective reporting (reporting bias) | Low risk | Toxicity was not listed under 'outcomes' in ClinicalTrials.gov record (https://clinicaltrials.gov/show/NCT00232505), but it was mentioned in the 'secondary objectives' section of the record. All other outcomes in the trial report were listed in the ClinicalTrials.gov record and vice versa. |
| Other bias | Unclear risk | 26 participants in the control arm were additionally given carboplatin after progression. This may have attenuated any differences between treatment arms in overall survival. |
| Methods | National, multicentre, RCT, Accrual May 1985 to April 1988. Randomisation ‐ telephone call to central office. Treatment allocation by randomly permuted blocks of two. | |
| Participants | 140 women with histologically confirmed metastatic breast cancer. | |
| Interventions | CMF vs PE. ARM A: Cyclophosphamide 100 mg/m2, orally days 1 to 14; Methotrexate 40 mg/m2 IV days 1 and 8; Fluorouracil 600 mg/m2 IV days 1 and 8 repeated every 4 weeks; ARM B: Cisplatin 100 mg/m2 IV day 1 (with hydration and mannitol forced diuresis); etoposide 100 mg/m2 IV days 1, 3 and 5 repeated every 3 weeks. | |
| Outcomes | Overall survival (curve). | |
| Notes | Min follow‐up: 12 months (reported). Study supported by Associozione Italiens per la Ricerca sul Cancro and in part by Progetto Finalizzato Oncologia of Consiglio Nazionale delle Ricerche. | |
| Risk of bias | ||
| Bias | Authors' judgement | Support for judgement |
| Random sequence generation (selection bias) | Unclear risk | Method of random sequence generation not reported in sufficient detail. |
| Allocation concealment (selection bias) | Low risk | Central randomisation. |
| Blinding of participants and personnel (performance bias) | Unclear risk | No information in trial publication. |
| Blinding of outcome assessment (detection bias) (overall survival) | Low risk | No information in trial publication. Unlikely that assessment of overall survival would be influenced by lack of blinding. |
| Blinding of outcome assessment (detection bias) (outcomes other than overall survival and quality of life) | Low risk | Tumour response rate evaluated every 3 cycles and every 3 months after suspension of treatment and were assessed "by an extramural review committee for response to treatment" (p. 666). |
| Incomplete outcome data (attrition bias) (time‐to‐event outcomes) | Low risk | 70 of 70 and 70 of 70 participants randomised to intervention and control groups, respectively, were analysed in time‐to‐event analyses (intent‐to‐treat analyses). |
| Incomplete outcome data (attrition bias) (binary outcomes) | Low risk | 5 of 70 and 5 of 70 participants randomised to intervention and control groups, respectively, were not assessed/assessable for tumour response (7.1% of all randomised participants). 0 of 70 and 2 of 70 participants randomised to intervention and control groups, respectively, were not included in the safety population for evaluating toxicities (1.4% of all randomised participants). |
| Selective reporting (reporting bias) | Unclear risk | No trial registration or published protocol prespecifying all study outcomes. Study began recruitment before July 1, 2005 so expectation of trial registration or published protocol was low. |
| Other bias | Low risk | None identified. |
| Methods | National multicentre RCT. Randomisation and treatment allocation methods not reported. | |
| Participants | 186 (183 eligible) women with metastatic breast cancer. | |
| Interventions | CMF vs MPEPIV or MPEMI. ARM A: CMF: Cyclophosphamide 600 mg/m2 days 1 to 8; methotrexate 40 mg/m2 days 1 to 8; Fluorouracil 600 mg/m2 days 1 to 9; every 4 weeks. ARM B: MPEPIV: Methotrexate 100 mg/m2 days 1 to 8, + leucovorin rescue; cisplatin (P) 70 mg/m2, day 1; epirubicin 70 mg/m2 day 1 + vincristine 1.4 mg/m2 days 1 to 8; every 3 weeks. MPEMI: Methotrexate 100 mg/m2 days 1 to 8 + rescue; cisplatin 70 mg/m2 day 2; etoposide (E) 100 mg/m2 days 1 to 2; mitomycin (MI) 6 mg/m2 day 1; every 3 weeks. | |
| Outcomes | Time to progression (insufficient TTP data reported to calculate hazard ratio for pooling). | |
| Notes | Conference abstract (1996). Median TTP: 10.7 CMF, 9.5 MPEPIV or MPEMI (insufficient TTP data reported to calculate hazard ratio for pooling). Study "Supported by CNR Flnalyzed Project ACRO and by AIRC." | |
| Risk of bias | ||
| Bias | Authors' judgement | Support for judgement |
| Random sequence generation (selection bias) | Unclear risk | Method of random sequence generation not reported in sufficient detail. Stated as "randomised" only. |
| Allocation concealment (selection bias) | Unclear risk | Not reported. |
| Blinding of participants and personnel (performance bias) | Unclear risk | No information provided in the abstract. |
| Blinding of outcome assessment (detection bias) (overall survival) | Low risk | No information in abstract. Unlikely that assessment of overall survival would be influenced by lack of blinding. |
| Blinding of outcome assessment (detection bias) (outcomes other than overall survival and quality of life) | Unclear risk | No details provided in the abstract. |
| Incomplete outcome data (attrition bias) (time‐to‐event outcomes) | Unclear risk | 91 of 93 and 92 of 93 participants randomised to intervention and control groups, respectively, were analysed in time‐to‐event analysis (modified intent‐to‐treat), but only median times were reported (hence, no extractable time‐to‐event data). |
| Incomplete outcome data (attrition bias) (binary outcomes) | Unclear risk | 5 of 93 and 9 of 93 participants randomised to intervention and control groups, respectively, were not assessed/assessable for tumour response (9.1% of all randomised participants). It is not clear how many participants were included in the safety population, but toxicity data were not extractable anyway. |
| Selective reporting (reporting bias) | Unclear risk | No trial registration or published protocol prespecifying all study outcomes. Study began recruitment before July 1, 2005 so expectation of trial registration or published protocol was low. |
| Other bias | Low risk | None identified. |
| Methods | National, multicentre, RCT, accrual July 1988 to June 1991. Randomisation was by telephone to a central office in blocks of two. Treatment allocation not reported. | |
| Participants | 109 (105 eligible) women with histologically confirmed metastatic breast cancer. | |
| Interventions | CMF vs PE + CMF + AL. ARM A: Cyclophosphamide 100 mg/m2 po days 1 to 14 + methotrexate 40 mg/m2 IV bolus days 1 and 8 + 5‐FU 6000 mg/m2 IV bolus days 1 and 8, 4 weekly cycles. ARM B: Cisplatin 100 mg/m2 i.v. infusion for 30 minutes on day 1; etoposide 100 mg/m2 i.v. infusion for 15 minutes on days 1, 3, and 5, 3 week intervals. Cyclophosphamide 100 mg/m2 po days 1 to 14 + methotrexate 40 mg/m2 IV bolus days 1 and 8 + 5‐FU 6000 mg/m2 IV bolus days 1 and 8, 4 weekly cycles. Doxorubicin 60 mg/m2 i.v. bolus on day 2; leucovorin 500 mg/m2 i.v. infusion for 2 hours on days 1 and 8; 5‐FU 600 mg/m2 i.v. bolus 1 hour after the beginning of leucovorin infusion on days 1 and 8; allopurinol, 900 mg 24 hours after each 5‐FU dose, 3 week intervals. | |
| Outcomes | Overall survival (Kaplan‐Meier curve). | |
| Notes | The trial included 2 complex protocol treatments, rotational crossing and sequential intensification. The rotational crossing protocol was not included because of the difficulty in separating the cisplatin‐related outcomes. Intent‐to‐treat for survival, TTP and toxicity on all eligible participants. Study "Supported by Assoc. Ital. Ricerca sul Cancro (AIRC) and by PF ACRO of the Consiglio Nazionale Delle Ricerche (CNR)." | |
| Risk of bias | ||
| Bias | Authors' judgement | Support for judgement |
| Random sequence generation (selection bias) | Unclear risk | Method of random sequence generation not reported in sufficient detail. |
| Allocation concealment (selection bias) | Low risk | Central randomisation. |
| Blinding of participants and personnel (performance bias) | Unclear risk | No information in trial publication. |
| Blinding of outcome assessment (detection bias) (overall survival) | Low risk | No information in trial publication. Unlikely that assessment of overall survival would be influenced by lack of blinding. |
| Blinding of outcome assessment (detection bias) (outcomes other than overall survival and quality of life) | Low risk | Tumour response rate evaluated every 2 cycles and every 3 months after suspension of treatment and were assessed "by an extramural treatment response review committee". |
| Incomplete outcome data (attrition bias) (time‐to‐event outcomes) | Unclear risk | 105 of 109 randomised participants were analysed in time‐to‐event analyses (modified ITT). The randomised groups of the 4 excluded participants were not clear. Potential bias reported as participants with progression on CMF were immediately withdrawn. |
| Incomplete outcome data (attrition bias) (binary outcomes) | Low risk | 4 of 109 randomised participants were excluded from all analyses, with no information provided on the randomised groups of these excluded participants (7.3% of all randomised participants). In addition to these 10 excluded participants: 3 of 50 and 1 of 55 participants in the (known) intervention and control groups, respectively, were not assessed/assessable for tumour response; no participants in the (known) intervention and control groups, respectively, were excluded from the safety population for evaluating toxicities (3.7% of all randomised participants). |
| Selective reporting (reporting bias) | Unclear risk | No trial registration or published protocol prespecifying all study outcomes. Study began recruitment before July 1, 2005 so expectation of trial registration or published protocol was low. |
| Other bias | Low risk | None identified. |
| Methods | Randomised unblinded phase II study. Randomisation was 1:2 ratio of standard to experimental arm. | |
| Participants | 221 (193 eligible) women with histologically confirmed metastatic breast cancer. | |
| Interventions | CAF vs C + CAF ARM A: CAF: cyclophosphamide 600 mg/m2 IV day 1, doxorubicin 45 mg/m2 IV day 1, fluorouracil 500 mg/m2 IV days 1 and 8, every 4 weeks. Following a total doxorubicin dose of 540 mg/m2 (including any adjuvant doxorubicin), methotrexate was substituted at 40 mg/m2 IV days 1 and 8 (30 mg/m2 for participants 60 or older). ARM B: C: Carboplatin 400 mg/m2 IV bolus escalated by 50 mg/m2 depending on day 1 nadir counts. Repeated every 28 days for up to 4 cycles followed by standard CAF. | |
| Outcomes | Overall survival (Kaplan‐Meier, data from trialist). | |
| Notes | Participants randomised to the phase II arm (n = 178) were randomised to CAF alone or to one of 5 phase II agents including carboplatin followed by CAF. Carboplatin data (from the published paper) only is included in the review (n = 49). For time‐to‐event analyses, intent‐to‐treat data and numbers of participants randomised and included as eligible were provided by the trialist (ITT). Study "Supported in part by National Institutes of Health grants." | |
| Risk of bias | ||
| Bias | Authors' judgement | Support for judgement |
| Random sequence generation (selection bias) | Unclear risk | Method of random sequence generation not reported. Stated as "randomised" only. |
| Allocation concealment (selection bias) | Unclear risk | Not reported ‐ stated as "randomised" only. |
| Blinding of participants and personnel (performance bias) | Unclear risk | No information in trial publication. |
| Blinding of outcome assessment (detection bias) (overall survival) | Low risk | No information in trial publication. Unlikely that assessment of overall survival would be influenced by lack of blinding. |
| Blinding of outcome assessment (detection bias) (outcomes other than overall survival and quality of life) | Unclear risk | Blood tests and scans completed; no further details provided. |
| Incomplete outcome data (attrition bias) (time‐to‐event outcomes) | Low risk | All 52 and 169 participants randomised to intervention and control groups, respectively, were analysed in time‐to‐event analyses (intent‐to‐treat analyses). |
| Incomplete outcome data (attrition bias) (binary outcomes) | Unclear risk | 3 of 52 and 25 of 169 participants randomised to intervention and control groups, respectively, were not assessed/assessable for tumour response (12.7% of all randomised participants). 3 of 52 and 25 of 169 participants randomised to intervention and control groups, respectively, were not included in the safety population for evaluating toxicities (12.7% of all randomised participants). |
| Selective reporting (reporting bias) | Unclear risk | No trial registration or published protocol prespecifying all study outcomes. Study began recruitment before July 1, 2005 so expectation of trial registration or published protocol was low. |
| Other bias | Low risk | None identified. |
| Methods | Single centre, prospective cross‐over RCT. Randomisation by dynamic allocation. Accrual not detailed. | |
| Participants | 88 (86 eligible) postmenopausal women with histologically confirmed metastatic breast cancer. | |
| Interventions | CFP vs CFP + CAP ARM A: CFP: Cyclophosphamide 150 mg/m2 per day; 5‐Fluorouracil 300 mg/m2 per day IV infusion on days 1 through 5 every 5 weeks; prednisone 30 mg/d po days 1 through 14, 20 mg/d days 15 through 21; then 10 mg daily. | |
| Outcomes | Overall survival (Kaplan‐Meier curve from time of first treatment). | |
| Notes | Abstract. 86 of 88 randomised participants were analysed in time‐to‐event analyses (modified ITT). Study supported in part by National Cancer Institute, National Institutes of Health. | |
| Risk of bias | ||
| Bias | Authors' judgement | Support for judgement |
| Random sequence generation (selection bias) | Unclear risk | Method of random sequence generation not reported in sufficient detail. |
| Allocation concealment (selection bias) | Unclear risk | Not reported. |
| Blinding of participants and personnel (performance bias) | Unclear risk | No information in trial publication. |
| Blinding of outcome assessment (detection bias) (overall survival) | Low risk | No information in trial publication. Unlikely that assessment of overall survival would be influenced by lack of blinding. |
| Blinding of outcome assessment (detection bias) (outcomes other than overall survival and quality of life) | Unclear risk | Standard criteria used for classifying tumour response; no further details provided. |
| Incomplete outcome data (attrition bias) (time‐to‐event outcomes) | Unclear risk | 86 of 88 randomised participants were analysed in time‐to‐event analyses (modified ITT). No information was provided on the randomised groups of the 2 excluded participants. |
| Incomplete outcome data (attrition bias) (binary outcomes) | Low risk | 2 of 88 randomised participants were excluded from all analyses, with no information provided on the randomised groups of these excluded participants. Apart from the 2 excluded participants (2.3% of all randomised participants), there were no missing data for tumour response; 1 of 45 and 2 of 41 participants in the (known) intervention and control groups, respectively, were excluded from the safety population for evaluating toxicities (5.7% of all randomised participants). |
| Selective reporting (reporting bias) | Unclear risk | No trial registration or published protocol prespecifying all study outcomes. Study began recruitment before July 1, 2005 so expectation of trial registration or published protocol was low. |
| Other bias | Low risk | None identified. |
| Methods | Multicentre prospective randomised controlled trial. Participant characteristics at baseline: no differences reported. | |
| Participants | 137 women with progressing metastatic breast cancer with at least one measurable target lesion and at least one previous chemotherapy agent. | |
| Interventions | OXA + FU vs VIN + FU Arm A: OXA + FU: Oxaliplatin 130 mg/m2 2 hours IV on day 1 plus 5‐fluorouracil 750 mg/m2 daily by continuous IV infusion days 1 to 5 q 3 weeks. Arm B: VIN + FU: Vinorelbine 25 mg/m2 IV bolus plus 5‐fluorouracil 750 mg/m2 daily by continuous IV infusion days 1 to 5 q 3 weeks. | |
| Outcomes | Overall survival (insufficient OS data reported to calculate hazard ratio for pooling). Progression‐free survival (insufficient PFS data reported to calculate hazard ratio for pooling). Response rate. Toxicity (grade‐specific data not reported). | |
| Notes | Abstract. Follow‐up could not be estimated. Efficacy was evaluated by radiological assessment every 6 weeks; responses were confirmed at least 4 weeks later. Median PFS: 19.1 weeks OXA + FU, 22.9 weeks VIN + FU (P = 0.26) (insufficient PFS data reported to calculate hazard ratio for pooling). The study was prematurely discontinued due to accrual difficulty related to competitive drugs introduced (Capecitabine) in the same clinical setting. | |
| Risk of bias | ||
| Bias | Authors' judgement | Support for judgement |
| Random sequence generation (selection bias) | Unclear risk | Method of random sequence generation not reported. Stated as "randomised" only. |
| Allocation concealment (selection bias) | Unclear risk | Not reported. |
| Blinding of participants and personnel (performance bias) | Unclear risk | No information provided in the 2 abstracts. |
| Blinding of outcome assessment (detection bias) (overall survival) | Low risk | No information provided in the 2 abstracts. Unlikely that assessment of overall survival would be influenced by lack of blinding. |
| Blinding of outcome assessment (detection bias) (outcomes other than overall survival and quality of life) | Unclear risk | Quote: "Efficacy was evaluated by radiological assessment every 6 wks; responses are confirmed at least 4 wks later" (abstract from 2004). No further details provided. |
| Incomplete outcome data (attrition bias) (time‐to‐event outcomes) | Low risk | All 68 and 69 participants randomised to intervention and control groups, respectively, were analysed in time‐to‐event analyses (intent‐to‐treat analyses), but only median times were reported (hence no extractable time‐to‐event data) |
| Incomplete outcome data (attrition bias) (binary outcomes) | Unclear risk | All randomised participants appear to have been assessed/assessable for tumour response and included in the safety population for evaluating toxicities (only toxic death data extractable as grade‐specific data not reported for other conditions). This was not entirely clear though, as it was not explicitly stated and the authors may have simply used randomised participant denominators. |
| Selective reporting (reporting bias) | Unclear risk | No trial registration or published protocol prespecifying all study outcomes. Study began recruitment before July 1, 2005 so expectation of trial registration or published protocol was low. |
| Other bias | Low risk | None identified. |
| Methods | Phase II RCT. Allocation assigned to intervention in a 2:1 randomisation. Accrual February 1994 to January 1997. | |
| Participants | 59 women with cytologically or histologically confirmed metastatic/advanced inoperable breast cancer. | |
| Interventions | ECycloF vs EcisF. ARM A: ECycloF: 5‐Fluorouracil 200 mg/m2 continuous IV every 24 hours + epirubicin 60 mg/m2 by IV bolus every 3 weeks for 6 courses + Cyclophosphamide 600 mg/m2 by IV bolus every 3 weeks for 6 courses. ARM B: ECisF: 5‐Fluorouracil 200 mg/m2 IV every 24 hours + epirubicin 60 mg/m2 by IV bolus every 3 weeks for 6 courses + cisplatin 60 mg/m2 IV every 3 weeks for 6 courses. | |
| Outcomes | Overall survival, measured from start of treatment (insufficient OS data reported to calculate hazard ratio for pooling). Time to progression, endpoints not defined (medians only). | |
| Notes | Metastatic and locoregional results reported separately for response. All 59 randomised metastatic participants were analysed in time‐to‐event PFS analysis (ITT). | |
| Risk of bias | ||
| Bias | Authors' judgement | Support for judgement |
| Random sequence generation (selection bias) | Unclear risk | Method of random sequence generation not reported. Stated as "randomised" only. |
| Allocation concealment (selection bias) | Unclear risk | Not reported. |
| Blinding of participants and personnel (performance bias) | Unclear risk | No information in trial publication. |
| Blinding of outcome assessment (detection bias) (overall survival) | Low risk | No information in trial publication. Unlikely that assessment of overall survival would be influenced by lack of blinding. |
| Blinding of outcome assessment (detection bias) (outcomes other than overall survival and quality of life) | Unclear risk | Standard criteria used for classifying tumour response; no further details provided. |
| Incomplete outcome data (attrition bias) (time‐to‐event outcomes) | Low risk | All 21 and 38 participants randomised to intervention and control groups, respectively, were analysed in time‐to‐event analyses (intent‐to‐treat analyses). |
| Incomplete outcome data (attrition bias) (binary outcomes) | Unclear risk | The study reported "Patients who received at least two cycles of chemotherapy were assessable for response... ", but they did report how many metastatic participants completed at least 2 cycles. The study calculated response rates using the numbers of randomised participants as denominators, which may or may not mean that all metastatic participants completed at least 2 cycles. Combined metastatic and locoregional toxicity data were included in this review on the assumption that stage of disease might not influence toxicity. All 96 metastatic and locoregional participants randomised to intervention and control groups, respectively, were included in the safety population for evaluating toxicities. |
| Selective reporting (reporting bias) | Unclear risk | No trial registration or published protocol prespecifying all study outcomes. Study began recruitment before July 1, 2005 so expectation of trial registration or published protocol was low. |
| Other bias | Unclear risk | None identified. |
| Methods | A prospective, open‐label, randomised phase II clinical trial carried out in the Cancer Hospital, Chinese Academy of Medical Sciences. | |
| Participants | 53 metastatic triple‐negative breast cancer (mTNBC) participants aged ≥18 years with histologically confirmed ER‐, PR‐, and HER2‐ primary breast cancer. Median age 48 and 49 years in platinum and control arms, respectively. 100% 1st‐line. All the participants had received anthracyclines while 66.7% of participants in the TP arm and 57.7% of participants in the TX arm received paclitaxel in the adjuvant/neoadjuvant setting.. | |
| Interventions | TP vs TX. TP ARM: Docetaxel 75 mg/m2 plus cisplatin 75 mg/m2 IV infusion day 1. TX ARM: Docetaxel 75 mg/m2 IV infusion day 1 plus capecitabine 1000 mg/m2 bid, 2 weeks on, 1 week off. | |
| Outcomes | Response. Common adverse events. | |
| Notes | Estimated min follow‐up = 6 months (based on first event on OS curve). Median PFS time: Docetaxel + cisplatin arm 10.9 months, docetaxel + capecitabine arm 4.8 months, P < 0.001. Median survival time: Docetaxel + cisplatin arm 32.8 months, docetaxel + capecitabine arm 21.5 months, P = 0.027. All 53 randomised participants were analysed in time‐to‐event analyses (ITT). Funding grant: AVON China breast cancer research grant and the National Natural Science Foundation of China. | |
| Risk of bias | ||
| Bias | Authors' judgement | Support for judgement |
| Random sequence generation (selection bias) | Unclear risk | Quote: "patients were randomized…"; no additional details were provided on how random assignment was achieved in the trial report. |
| Allocation concealment (selection bias) | Unclear risk | Method of concealment was not described. |
| Blinding of participants and personnel (performance bias) | High risk | Open‐label trial. |
| Blinding of outcome assessment (detection bias) (overall survival) | Low risk | Unlikely that assessment of overall survival would be influenced by lack of blinding. |
| Blinding of outcome assessment (detection bias) (outcomes other than overall survival and quality of life) | Unclear risk | Not clear if outcome assessors were blinded to allocated intervention. Tumour response rates evaluated by CT or MRI every two cycles; no further details provided. |
| Incomplete outcome data (attrition bias) (time‐to‐event outcomes) | Low risk | All 27 and 26 participants randomised to intervention and control groups, respectively, were analysed in time‐to‐event analyses (intent‐to‐treat analyses). |
| Incomplete outcome data (attrition bias) (binary outcomes) | Low risk | All randomised participants were assessed/assessable for tumour response. All randomised participants appear to have been included in the safety population for evaluating toxicities. |
| Selective reporting (reporting bias) | High risk | No trial registration or published protocol containing prespecified outcomes could be found. The date when participant recruitment began was not reported, but given that this was first published in December 2012 and that there were only 53 participants, it seems highly likely that recruitment began after July 1, 2005. Consequently, there was a high expectation of trial registration. |
| Other bias | Low risk | Baseline characteristics similar across groups except for histological grade, where the docetaxel‐platinum arm had a greater number of grade III tumours than the docetaxel‐capecitabine arm. |
| Methods | Prospective RCT. Central randomisation and stratification. | |
| Participants | 327 eligible women (5 excluded) with histologically confirmed metastatic breast cancer. | |
| Interventions | PE vs PCb. ARM A: PE: 6 cycles epirubicin 80 mg/m2 followed by paclitaxel 175 mg/m2. ARM B: PCb: 6 cycles of paclitaxel 175 mg/m2 in a 3‐hour infusion immediately followed by carboplatin 6 AUC. | |
| Outcomes | Overall survival (Kaplan‐Meier curve). | |
| Notes | Estimated min follow‐up: 3 months. 327 of 332 randomised participants were analysed in time‐to‐event analyses (modified ITT) Note that 'Fountzilas 2004' was labelled 'Fountzilas 2002' in the original version of this review and its TTF estimate was incorrectly included in PFS/TTP meta‐analyses. This has been corrected in the 2016 review update. Study "Supported by a Hellenic Cooperative Oncology Group research grant (HE R‐11b/99). Dr George Fountzilas received research support from Bristol–Myers Squibb, Aventis and AstraZeneca." | |
| Risk of bias | ||
| Bias | Authors' judgement | Support for judgement |
| Random sequence generation (selection bias) | Low risk | Quote: "Patients were randomized centrally at the HeCOG Data Office in Athens and stratified according to the history of previous adjuvant chemotherapy and risk category in a modified version of that used by Cavalli et al." |
| Allocation concealment (selection bias) | Low risk | Central randomisation. |
| Blinding of participants and personnel (performance bias) | Unclear risk | No information in trial publication. |
| Blinding of outcome assessment (detection bias) (overall survival) | Low risk | No information in trial publication. Unlikely that assessment of overall survival would be influenced by lack of blinding. |
| Blinding of outcome assessment (detection bias) (outcomes other than overall survival and quality of life) | Low risk | Images for tumour response were reviewed by an "independent radiological response review committee", 83% were reviewed by this committee (p. 1518). |
| Incomplete outcome data (attrition bias) (time‐to‐event outcomes) | Unclear risk | 327 of 332 randomised participants were analysed in time‐to‐event analyses (modified ITT). No information was provided on the randomised groups of the 5 excluded participants. |
| Incomplete outcome data (attrition bias) (binary outcomes) | Low risk | 5 of 332 randomised participants were excluded from all analyses, with no information provided on the randomised groups of these excluded participants. In addition to these 5 excluded participants: 14 of 164 and 10 of 163 participants in the (known) intervention and control groups, respectively, were not assessed/assessable for tumour response (8.7% of all randomised participants); 4 of 164 and 1 of 163 participants in the (known) intervention and control groups, respectively, were excluded from the safety population for evaluating toxicities (3.0% of all randomised participants). |
| Selective reporting (reporting bias) | Unclear risk | No trial registration or published protocol prespecifying all study outcomes. Study began recruitment before July 1, 2005 so expectation of trial registration or published protocol was low. |
| Other bias | Unclear risk | None identified. |
| Methods | Prospective RCT. Central stratified block randomisation. Baseline comparability ‐ all characteristics equal with the exception of performance status and the incidence of osseous metastases at study entry. | |
| Participants | Total of 437 women with histologically confirmed metastatic breast cancer 'entered' the study (this included participants in both treatment‐comparisons Fountzilas 2009 A and Fountzilas 2009 B). 21 were found 'ineligible' leaving 416 'eligible' participants, of which 272 were in Fountzilas 2009 A. | |
| Interventions | Pw vs PCb. ARM A: Pw: Paclitaxel 80 mg/m2 for 12 weeks. ARM B: PCb: Paclitaxel 175 mg/m2 + carboplatin 6 AUC for 6 (3 week) cycles. | |
| Outcomes | Overall survival. | |
| Notes | The effective number of intervention participants allocated to Fountzilas 2009 A for calculating treatment effects was halved because Fountzilas 2009 A and Fountzilas 2009 B shared a common intervention group. Minimum reported follow‐up 0.01 months. Maximum reported follow‐up 56.9 months. No toxic deaths reported. Median TTP: 11.5 months PCb (0.01 to 54.6), 11.4 months Pw (0.92 to 56.9) (insufficient TTP data reported to calculate hazard ratio for pooling). Changes in QoL (EQ‐5D index and EQ VAS Score) across time did not differ significantly between groups. 21 participants in Arms A, B and C were excluded after they 'entered' the study as they were found to be ineligible. | |
| Risk of bias | ||
| Bias | Authors' judgement | Support for judgement |
| Random sequence generation (selection bias) | Unclear risk | Method of random sequence generation not reported in sufficient detail. |
| Allocation concealment (selection bias) | Low risk | Centralised. |
| Blinding of participants and personnel (performance bias) | Unclear risk | No information in trial publication. |
| Blinding of outcome assessment (detection bias) (overall survival) | Low risk | No information in trial publication. Unlikely that assessment of overall survival would be influenced by lack of blinding. |
| Blinding of outcome assessment (detection bias) (outcomes other than overall survival and quality of life) | Unclear risk | Response assessed by blood and biochemistry tests, CT scans during and after treatment but "central evaluation of imaging material pertinent to tumor response was not performed in this study" and it was unclear whether or not the study was open‐label. |
| Incomplete outcome data (attrition bias) (time‐to‐event outcomes) | Unclear risk | 21 randomised participants were excluded from time‐to‐event analyses across all three treatment arms before the commencement of treatment (modified intent‐to‐treat). No information was provided on the randomised groups of the 21 excluded participants. |
| Incomplete outcome data (attrition bias) (binary outcomes) | Unclear risk | 21 randomised participants were excluded from all analyses, with no information provided on the randomised groups of these excluded participants. In addition to these 21 excluded participants: 17 of 136 and 16 of 136 participants in the (known) intervention and control groups, respectively, were not assessed/assessable for tumour response (11.8% of all randomised participants); 5 of 136 and 3 of 136 in the (known) intervention and control groups, respectively, were excluded from the safety population for evaluating toxicities (2.5% of all randomised participants). |
| Selective reporting (reporting bias) | Unclear risk | No trial registration or published protocol prespecifying all study outcomes. Study began recruitment before July 1, 2005 so expectation of trial registration or published protocol was low. |
| Other bias | Low risk | None identified. |
| Methods | Prospective RCT. Central stratified block randomisation. Baseline comparability ‐ all characteristics equal with the exception of performance status and the incidence of osseous metastases at study entry. | |
| Participants | Total of 437 women with histologically confirmed metastatic breast cancer 'entered' the study (this included participants in both treatment‐comparisons Fountzilas 2009 A and Fountzilas 2009 B). 21 were found 'ineligible' leaving 416 'eligible' participants, of which 280 were in Fountzilas 2009 B. | |
| Interventions | PCb vs GDoc ARM B: PCb: Paclitaxel 175 mg/m2 + carboplatin 6 AUC for 6 (3 week) cycles. ARM C: GDoc: Gemcitabine 1000 mg/m2 + docetaxel 75 mg/m2 for 6 (3 week) cycles. | |
| Outcomes | Overall survival. | |
| Notes | The effective number of intervention participants allocated to Fountzilas 2009 B for calculating treatment effects was halved because Fountzilas 2009 A and Fountzilas 2009 B shared a common intervention group. Minimum reported follow‐up 0.01 months. Maximum reported follow‐up 56.9 months. No toxic deaths reported. Median TTP: 11.5 months PCb (0.01 to 54.6), 10.4 months GDoc (0.01 to 51.4) (insufficient TTP data reported to calculate hazard ratio for pooling). Changes in QoL (EQ‐5D index and EQ VAS Score) across time did not differ significantly between groups. | |
| Risk of bias | ||
| Bias | Authors' judgement | Support for judgement |
| Random sequence generation (selection bias) | Unclear risk | Method of random sequence generation not reported in sufficient detail. |
| Allocation concealment (selection bias) | Low risk | Centralised. |
| Blinding of participants and personnel (performance bias) | Unclear risk | No information in trial publication. |
| Blinding of outcome assessment (detection bias) (overall survival) | Low risk | No information in trial publication. Unlikely that assessment of overall survival would be influenced by lack of blinding. |
| Blinding of outcome assessment (detection bias) (outcomes other than overall survival and quality of life) | Unclear risk | Response assessed by blood and biochemistry tests, CT scans during and after treatment but "central evaluation of imaging material pertinent to tumor response was not performed in this study" and it was unclear whether or not the study was open‐label. |
| Incomplete outcome data (attrition bias) (time‐to‐event outcomes) | Unclear risk | 21 randomised participants were excluded from time‐to‐event analyses across all three treatment arms (modified intent‐to‐treat). No information was provided on the randomised groups of the 21 excluded participants. |
| Incomplete outcome data (attrition bias) (binary outcomes) | High risk | 21 randomised participants were excluded from all analyses, with no information provided on the randomised groups of these excluded participants. In addition to these 21 excluded participants: 17 of 136 and 30 of 144 participants in the (known) intervention and control groups, respectively, were not assessed/assessable for tumour response (18.4% of all randomised participants); 5 of 136 and 10 of 144 in the (known) intervention and control groups, respectively, were excluded from the safety population for evaluating toxicities (6.1% of all randomised participants). |
| Selective reporting (reporting bias) | Unclear risk | No trial registration or published protocol prespecifying all study outcomes. Study began recruitment before July 1, 2005 so expectation of trial registration or published protocol was low. |
| Other bias | Low risk | None identified. |
| Methods | Prospective, open‐label, multicentre, randomised, phase 3 trial at 12 institutions or hospitals | |
| Participants | 240 Chinese participants (236 analysed) with breast cancer aged 18 to 70 years who had metastatic triple‐negative breast cancer (mTNBC) histologically confirmed at the primary tumour, with clinical, imaging, histological or cytological evidence of metastatic (stage IV) disease. Median age 47 and 48 years in platinum and control arms, respectively. 100% 1st‐line. 152 (64%) of the 236 participants had received anthracyclines. 195 (83%) of the 236 participants had received taxanes. | |
| Interventions | Cisplatin + gemcitabine vs paclitaxel + gemcitabine. Platinum ARM: Cisplatin plus gemcitabine (cisplatin 75 mg/m2 on day 1; gemcitabine 1250 mg/m2 on days 1 and 8) intravenously every 3 weeks for a maximum of eight cycles, or until disease progression or intolerable toxic effects developed. Control ARM: Paclitaxel plus gemcitabine (paclitaxel 175 mg/m2 on day 1; gemcitabine 1250 mg/m2 on days 1 and 8) intravenously every 3 weeks for a maximum of eight cycles, or until disease progression or intolerable toxic effects developed. | |
| Outcomes | Response. Adverse events. | |
| Notes | 4 participants were randomised but not analysed for OS or PFS (i.e. modified ITT). An additional 9 participants were not assessable for response. Median progression‐free survival was 7.73 months (95% CI 6.16 to 9.30) in the cisplatin plus gemcitabine group and 6.47 months (5.76 to 7.18) in the paclitaxel plus gemcitabine group. Median survival time was 22.3 months in the cisplatin plus gemcitabine group and 18.6 months in the paclitaxel plus gemcitabine group; not reported in the text of the study paper but estimated from Kaplan‐Meier curve. 118 of 120 randomised metastatic participants were analysed in time‐to‐event PFS analyses (modified ITT). The study was funded by Shanghai Natural Science Foundation and gemcitabine was provided by Eli Lilly. | |
| Risk of bias | ||
| Bias | Authors' judgement | Support for judgement |
| Random sequence generation (selection bias) | Low risk | Quote: "Randomisation was done centrally via a block randomisation of size eight, with no stratification factors, via an interactive web‐response system." |
| Allocation concealment (selection bias) | Low risk | Central allocation. Quote: "Randomisation was done centrally…" and "After checking the inclusion criteria, the study coordinator sent the allocated treatment back to the investigator by fax." |
| Blinding of participants and personnel (performance bias) | High risk | Open‐label trial. |
| Blinding of outcome assessment (detection bias) (overall survival) | Low risk | Unlikely that assessment of overall survival would be influenced by lack of blinding. |
| Blinding of outcome assessment (detection bias) (outcomes other than overall survival and quality of life) | Unclear risk | The extent and/or the effectiveness of intended blinding was not clear. Quote: "Tumour response was assessed by a team of local investigators … and when needed, with independent central assessment, every two cycles until disease progression." Assessment of toxicity appeared to be unblinded. Quote: "Adverse events were recorded at each treatment visit, at each follow‐up visit, and at the end‐of‐study visit." |
| Incomplete outcome data (attrition bias) (time‐to‐event outcomes) | Unclear risk | 118 of 120 and 118 of 120 participants randomised to intervention and control groups, respectively, were analysed in time‐to‐event analysis (modified intent‐to‐treat analysis). |
| Incomplete outcome data (attrition bias) (binary outcomes) | Low risk | 8 of 120 and 5 of 120 participants randomised to intervention and control groups, respectively, were not assessed/assessable for tumour response (5.4% of all randomised participants). 2 of 120 and 2 of 120 participants randomised to intervention and control groups, respectively, were not included in the safety population for evaluating toxicities (1.7% of all randomised participants). |
| Selective reporting (reporting bias) | Low risk | Overall survival was not listed under 'outcomes' in ClinicalTrials.gov record (https://clinicaltrials.gov/ct2/show/NCT01287624) but it was mentioned in the 'purpose' section of the record. All other outcomes in the trial report were listed in the ClinicalTrials.gov record and vice versa. |
| Other bias | Unclear risk | Baseline characteristics were generally similar across groups except for ECOG performance status, number of metastatic organ sites and menopausal status. |
| Methods | Prospective randomised non‐blinded multicentre phase III study. No stratification for prognostic factors or centres. Central randomisation. | |
| Participants | 201 women with histologically confirmed locally advanced or metastatic breast cancer previously treated with anthracyclines (193 eligible). | |
| Interventions | T vs VP‐16 + P. ARM A: Paclitaxel 175 mg/m2 IV, day 1 q3 weeks. | |
| Outcomes | Overall survival (Kaplan‐Meier curve). | |
| Notes | Conference powerpoint slide presentation. 193 of 202 randomised metastatic participants were analysed in time‐to‐event PFS analyses (modified ITT). "Bristol Myers Squibb (Turkey) supplied limited number of paclitaxel for this trial". | |
| Risk of bias | ||
| Bias | Authors' judgement | Support for judgement |
| Random sequence generation (selection bias) | Unclear risk | Method of random sequence generation not reported other than "No stratification was carried out for prognostic factors or centers." |
| Allocation concealment (selection bias) | Low risk | Central randomisation. |
| Blinding of participants and personnel (performance bias) | High risk | "nonblinded study" |
| Blinding of outcome assessment (detection bias) (overall survival) | Low risk | Non‐blinded study. Unlikely that assessment of overall survival would be influenced by lack of blinding. |
| Blinding of outcome assessment (detection bias) (outcomes other than overall survival and quality of life) | Low risk | Quote: "Responses were reviewed by two independent experts to confirm the response status blindly for treatment received" (p. 2). |
| Incomplete outcome data (attrition bias) (time‐to‐event outcomes) | Unclear risk | 96 of 100 and 97 of 101 participants randomised to intervention and control groups, respectively, were analysed in time‐to‐event analysis (modified intent‐to‐treat analysis). |
| Incomplete outcome data (attrition bias) (binary outcomes) | Low risk | 9 of 100 and 7 of 101 participants randomised to intervention and control groups, respectively, were not assessed/assessable for tumour response (8.0% of all randomised participants). 7 of 100 and 4 of 101 participants randomised to intervention and control groups, respectively, were not included in the safety population for evaluating toxicities (4.0% of all randomised participants). |
| Selective reporting (reporting bias) | Unclear risk | No trial registration or published protocol prespecifying all study outcomes. Study began recruitment before July 1, 2005 so expectation of trial registration or published protocol was low. |
| Other bias | Low risk | None identified. |
| Methods | Prospective phase III RCT. Randomisation, treatment, allocation methods, and accrual not detailed. | |
| Participants | 128 women with metastatic breast cancer. | |
| Interventions | CMFVP vs CAP. ARM A: CMFVP: Cyclophosphamide 200 mg/m2 IV days 1, 2, 3, 4, 5 + methotrexate 20 mg/m2 IV days 2, 4 + 5‐fluorouracil 500 mg/m2 IV days 1, 3, 5 + vincristine 1 mg/m2 po days 1 and 5 + prednisolone 40 mg po days 1, 2, 3, 4, 5. | |
| Outcomes | Overall survival (insufficient OS data reported to calculate hazard ratio for pooling). | |
| Notes | Trial analysis not intent‐to‐treat: | |
| Risk of bias | ||
| Bias | Authors' judgement | Support for judgement |
| Random sequence generation (selection bias) | Unclear risk | Method of random sequence generation not reported. Stated as "randomised" only. |
| Allocation concealment (selection bias) | Unclear risk | Not reported. |
| Blinding of participants and personnel (performance bias) | Unclear risk | No information in trial publication. |
| Blinding of outcome assessment (detection bias) (overall survival) | Low risk | No information in trial publication. Unlikely that assessment of overall survival would be influenced by lack of blinding. |
| Blinding of outcome assessment (detection bias) (outcomes other than overall survival and quality of life) | Unclear risk | Standard criteria used to assess tumour response but no further details provided. |
| Incomplete outcome data (attrition bias) (time‐to‐event outcomes) | High risk | 61 of 65 and 62 of 63 participants randomised to intervention and control groups, respectively, were analysed in time‐to‐event analysis. Excluded participants included those who did not complete more than 2 cycles of chemotherapy (per‐protocol analysis), but only median times were reported (hence no extractable time‐to‐event data). |
| Incomplete outcome data (attrition bias) (binary outcomes) | Low risk | 4 of 65 and 1 of 63 participants randomised to intervention and control groups, respectively, were not assessed/assessable for tumour response or included in the safety population for evaluating toxicities (3.9% of all randomised participants). |
| Selective reporting (reporting bias) | Unclear risk | No trial registration or published protocol prespecifying all study outcomes. Study began recruitment before July 1, 2005 so expectation of trial registration or published protocol was low. |
| Other bias | Low risk | None identified. |
| Methods | Prospective RCT. Stratification prior to randomisation. Randomisation and allocation methods not detailed. | |
| Participants | 142 women with metastatic or locoregional advanced inoperable breast cancer. | |
| Interventions | CAP vs FAC. ARM A: FAC (n = 68): 5‐Fluorouracil 500 mg/m2 days 1 and 8; adriamycin 50 mg/m2 500 mg/m2 day 1; cyclophosphamide 500 mg/m2 day 1. | |
| Outcomes | Overall survival (Kaplan‐Meier curve). | |
| Notes | 126 evaluable for > 2 cycles. Proportion of total numbers with either metastatic or locoregionally advanced disease was not reported. However, 53 reported with predominant metastatic site of soft tissue: 73 were reported with predominant site as viscera or bones; hence, an assumption made that at least 58% (73/126) were likely to have metastatic breast cancer. 126 of 142 participants that had > 2 cycles were analysed in time‐to‐event OS analysis (per‐protocol analysis). | |
| Risk of bias | ||
| Bias | Authors' judgement | Support for judgement |
| Random sequence generation (selection bias) | Unclear risk | Method of random sequence generation not detailed. |
| Allocation concealment (selection bias) | Unclear risk | Not reported. |
| Blinding of participants and personnel (performance bias) | Unclear risk | No information in trial publication. |
| Blinding of outcome assessment (detection bias) (overall survival) | Low risk | No information in trial publication. Unlikely that assessment of overall survival would be influenced by lack of blinding. |
| Blinding of outcome assessment (detection bias) (outcomes other than overall survival and quality of life) | Unclear risk | Standard criteria used to assess tumour response but no further details provided. |
| Incomplete outcome data (attrition bias) (time‐to‐event outcomes) | High risk | 58 of 68 and 68 of 74 participants randomised to intervention and control groups, respectively, were analysed in time‐to‐event analysis. Excluded participants included those who did not complete more than 2 cycles of chemotherapy (per‐protocol analysis). |
| Incomplete outcome data (attrition bias) (binary outcomes) | Unclear risk | 10 of 69 and 6 of 74 participants randomised to intervention and control groups, respectively, were not assessed/assessable for tumour response or included in the safety population for evaluating toxicities (11.3% of all randomised participants). |
| Selective reporting (reporting bias) | Unclear risk | No trial registration or published protocol prespecifying all study outcomes. Study began recruitment before July 1, 2005 so expectation of trial registration or published protocol was low. |
| Other bias | Low risk | None identified. |
| Methods | Phase III RCT. Central randomisation registered, stratified by ECOG performance status. Accrual from July 1987 to November 1990. Baseline comparability: no significant imbalance apparent or reported. | |
| Participants | 155 women with histologically proven locally advanced or metastatic breast cancer. | |
| Interventions | EPI vs EPI + CIS. ARM A: Epirubicin 70 mg/m2 days 1 and 8 every 4 weeks. ARM B: Epirubicin 60 mg/m2 days 1 and 8 + cisplatin 100 mg/m2 day 1 every 4 weeks. | |
| Outcomes | Overall survival (Kaplan‐Meier curve). | |
| Notes | Oopherectomy performed in premenopausal participants, n = 45 (32%). | |
| Risk of bias | ||
| Bias | Authors' judgement | Support for judgement |
| Random sequence generation (selection bias) | Unclear risk | Method of random sequence generation not reported in sufficient detail. |
| Allocation concealment (selection bias) | Low risk | Central randomisation. |
| Blinding of participants and personnel (performance bias) | Unclear risk | No information in trial publication. |
| Blinding of outcome assessment (detection bias) (overall survival) | Low risk | No information in trial publication. Unlikely that assessment of overall survival would be influenced by lack of blinding. |
| Blinding of outcome assessment (detection bias) (outcomes other than overall survival and quality of life) | Unclear risk | "evaluation of response ... was done according to WHO criteria" (p. 460) but no further details provided. |
| Incomplete outcome data (attrition bias) (time‐to‐event outcomes) | High risk | 65 of 74 and 74 of 81 participants randomised to intervention and control groups, respectively, were analysed in time‐to‐event analysis. Excluded participants included those who did not complete more than 2 cycles of chemotherapy (per‐protocol analysis). |
| Incomplete outcome data (attrition bias) (binary outcomes) | Unclear risk | 9 of 74 and 7 of 81 participants randomised to intervention and control groups, respectively, were not assessed/assessable for tumour response or included in the safety population for evaluating toxicities (10.3% of all randomised participants). |
| Selective reporting (reporting bias) | Unclear risk | No trial registration or published protocol prespecifying all study outcomes. Study began recruitment before July 1, 2005 so expectation of trial registration or published protocol was low. |
| Other bias | Low risk | None identified. |
| Methods | Randomised, multicentre, phase III trial. Accrual between November 1998 and May 2002. Baseline characteristics reported as well balanced between study arms. | |
| Participants | 196 women with histologically proven HER2 positive metastatic breast cancer. 100% HER2 positive. | |
| Interventions | TPa vs TPC. ARM A: TPa: Trastuzumab 4 mg/kg + paclitaxel 175mg/m2. ARM B: TPC: Trastuzumab 4 mg/kg + paclitaxel 175mg/m2 + carboplatin 6 AUC. | |
| Outcomes | Overall survival. Progression‐free survival, defined as the interval between the date of first dose and the date of progression or death as a result of any cause. Response. Toxicity. | |
| Notes | Minimum reported follow‐up: < 1 month. Maximum reported follow‐up: 56.8 months. No deaths due to toxicity. Randomisation procedure not stated ‐ just reported as "randomised". Stratified by IHC score (2+ or 3+). Reported hazard ratios and confidence intervals were inconsistent with the Kaplan Meier curves. For example, the text stated that the difference in OS "was not statistically significant", yet the reported 95% confidence interval was 0.88 to 0.92 (not only was the confidence interval highly statistically significant, it was far too narrow, given the cohort size). Consequently, we extracted OS and TTP data from the Kaplan‐Meier curves rather than relying on the reported hazard ratios. Study "Supported by grants from Bristol‐Myers Squibb Co, Princeton, NJ, and Genentech Inc, South San Francisco, CA." | |
| Risk of bias | ||
| Bias | Authors' judgement | Support for judgement |
| Random sequence generation (selection bias) | Unclear risk | Method of random sequence generation not reported in detail. |
| Allocation concealment (selection bias) | Unclear risk | Not stated. |
| Blinding of participants and personnel (performance bias) | Unclear risk | No information in trial publication. |
| Blinding of outcome assessment (detection bias) (overall survival) | Low risk | No information in trial publication. Unlikely that assessment of overall survival would be influenced by lack of blinding. |
| Blinding of outcome assessment (detection bias) (outcomes other than overall survival and quality of life) | Unclear risk | Quote: "Tumor assessments were performed by physical examination before every cycle, with imaging studies evaluating indicator lesions repeated every other cycle" (p. 2787). No further details provided on whether central assessment took place. |
| Incomplete outcome data (attrition bias) (time‐to‐event outcomes) | Low risk | All 98 and 98 participants randomised to intervention and control groups, respectively, were analysed in time‐to‐event analyses (intent‐to‐treat analyses). |
| Incomplete outcome data (attrition bias) (binary outcomes) | Low risk | 6 of 98 and 4 of 98 participants randomised to intervention and control groups, respectively, were not assessed/assessable for tumour response (5.1% of all randomised participants). One randomised participant(control group) was excluded from the safety population for evaluating toxicities (0.5% of all randomised participants). |
| Selective reporting (reporting bias) | Unclear risk | No trial registration or published protocol prespecifying all study outcomes. Study began recruitment before July 1, 2005 so expectation of trial registration or published protocol was low. |
| Other bias | Low risk | None identified. |
| Methods | Randomised multicentre phase II trial. Accrual between 2003 and 2006. Groups comparable at baseline in all regards except menopausal status. | |
| Participants | Overall, a total of 141 participants (91 in Arm A + Arm B) with histologically confirmed metastatic breast cancer. Median age: ˜ 60. 100% metastatic breast cancer. First line: ˜ 36%. Anthracycline‐naive: ˜ 43%. | |
| Interventions | GemVin vs GemCis. ARM A: GemVin: Gemcitabine 1000 mg/m2 + vinorelbine 25 mg/m2. ARM B: GemCis: Gemcitabine 1000 mg/m2+ cisplatin 30 mg/m2. Treatment for a maximum of six (3 week) cycles. | |
| Outcomes | Overall survival (Kaplan‐Meier). Time to progression, defined as "time from the start of therapy to first evidence of progressive disease or last follow‐up" (but TTP was also interchangeably referred to as PFS at various points in the paper) (Kaplan‐Meier). Response rate. Toxcity. Quality of life. | |
| Notes | No reported deaths due to toxicity. Estimated min follow‐up: 1 month. Estimated max follow‐up: 47 months. Median PFS: 5.7 months, 95% CI: 3.9 to 8.2 (GemVin); 6.9 months, 95% CI: 5.8 to 8.8 (GemCis). Median OS: 17.5 months, 95% CI: 12.2 to 30.0 (GemVin); 13.0 months, 95% CI: 11.0 to 19.2 (GemCis). Randomisation procedure not stated ‐ just reported as "randomised". All randomised participants were analysed in time‐to‐event analyses (ITT). "This study was supported by Lilly GmbH Germany." | |
| Risk of bias | ||
| Bias | Authors' judgement | Support for judgement |
| Random sequence generation (selection bias) | Unclear risk | Method of random sequence generation not reported. Stated as "randomised" only. |
| Allocation concealment (selection bias) | Unclear risk | Not stated. |
| Blinding of participants and personnel (performance bias) | High risk | Registered as 'open‐label' trial (https://www.clinicaltrials.gov/ct2/show/NCT00480597). |
| Blinding of outcome assessment (detection bias) (overall survival) | Low risk | Open‐label study. Unlikely that assessment of overall survival would be influenced by lack of blinding. |
| Blinding of outcome assessment (detection bias) (outcomes other than overall survival and quality of life) | Unclear risk | Blood and biochemistry tests, and imaging took place during therapy. No details were provided on whether there was a central (independent) evaluation team for assessing tumour response rates. |
| Incomplete outcome data (attrition bias) (time‐to‐event outcomes) | Low risk | All 45 and 46 participants randomised to intervention and control groups, respectively, were analysed in time‐to‐event analyses (intent‐to‐treat analyses). |
| Incomplete outcome data (attrition bias) (binary outcomes) | High risk | 10 of 45 and 9 of 46 participants randomised to intervention and control groups, respectively, were not assessed/assessable for tumour response (20.3% of all randomised participants). 0 of 45 and 4 of 46 participants randomised to intervention and control groups, respectively, were not included in the safety population for evaluating toxicities (5.8% of all randomised participants). |
| Selective reporting (reporting bias) | Low risk | All outcomes in the trial report were listed in the ClinicalTrials.gov record and vice versa (https://www.clinicaltrials.gov/ct2/show/NCT00480597). |
| Other bias | Low risk | None identified. |
| Methods | Randomised multicentre phase II trial. Accrual between 2003 and 2006. Groups comparable at baseline in all regards except menopausal status. | |
| Participants | Overall 141 participants (95 in Arm B + Arm C) with histologically confirmed metastatic breast cancer. Median age: ˜ 60 years. 100% metastatic breast cancer. First‐line: ˜ 36%. Anthracycline‐naive: ˜ 43%. | |
| Interventions | GemCis vs GemCap. ARM B: GemCis: Gemcitabine 1000 mg/m2 + cisplatin 30 mg/m2. ARM C: GemCap: Gemcitabine 1000 mg/m2 + capecitabine 1.300 mg/m2. Treatment for a maximum of six (3 week) cycles. | |
| Outcomes | Overall survival (Kaplan‐Meier). Time to progression, defined as "time from the start of therapy to first evidence of progressive disease or last follow‐up" (but TTP was also interchangeably referred to as PFS at various points in the paper) (Kaplan‐Meier). Response rate. Toxcity. | |
| Notes | No reported deaths due to toxicity. Estimated min follow‐up: 1 month. Estimated max follow‐up: 47 months. Median PFS: 6.9 months, 95% CI: 5.8 to 8.8 (GemCis); and 8.3 months, 95% CI: 4.3 to 9.6 (GemCap). Median OS: 13.0 months, 95% CI: 11.0 to 19.2 (GemCis); and 19.4 months, 95% CI: 16.6 to 22.0 (GemCap). All randomised participants were analysed in time‐to‐event analyses (ITT). "This study was supported by Lilly GmbH Germany." | |
| Risk of bias | ||
| Bias | Authors' judgement | Support for judgement |
| Random sequence generation (selection bias) | Unclear risk | Method of random sequence generation not reported. Stated as "randomised" only. |
| Allocation concealment (selection bias) | Unclear risk | Not stated. |
| Blinding of participants and personnel (performance bias) | High risk | Registered as "open label" trial (https://www.clinicaltrials.gov/ct2/show/NCT00480597). |
| Blinding of outcome assessment (detection bias) (overall survival) | Low risk | Open‐label study. Unlikely that assessment of overall survival would be influenced by lack of blinding. |
| Blinding of outcome assessment (detection bias) (outcomes other than overall survival and quality of life) | Unclear risk | Blood and biochemistry tests, and imaging took place during therapy. No details were provided on whether there was a central (independent) evaluation team for assessing tumour response rates. |
| Incomplete outcome data (attrition bias) (time‐to‐event outcomes) | Low risk | All 45 and 50 participants randomised to intervention and control groups, respectively, were analysed in time‐to‐event analyses (intent‐to‐treat analyses). |
| Incomplete outcome data (attrition bias) (binary outcomes) | High risk | 10 of 45 and 9 of 50 participants randomised to intervention and control groups, respectively, were not assessed/assessable for tumour response (18.1% of all randomised participants). 0 of 45 and 1 of 50 participants randomised to intervention and control groups, respectively, were not included in the safety population for evaluating toxicities (1.4% of all randomised participants). |
| Selective reporting (reporting bias) | Low risk | All outcomes in the trial report were listed in the ClinicalTrials.gov record and vice versa (https://www.clinicaltrials.gov/ct2/show/NCT00480597). |
| Other bias | Low risk | None identified. |
| Methods | Randomised phase III trial. | |
| Participants | 341 metastatic and 35 recurrent locally advanced triple‐negative or BRCA1/2 breast cancer. 43 BRCA + participants (29 known (i.e. 16 TNBC, 12 ER‐positive, HER2‐negative, 1 ER unknown, HER2‐negative) & 14 research test). | |
| Interventions | C vs D. C: Carboplatin (AUC 6 every 3 weeks for six cycles). D: Docetaxel (100 mg/m2 every 3 weeks for six cycles). | |
| Outcomes | Response. Progession‐free survival (insufficient PFS data reported to calculate hazard ratio for pooling). Toxicity (no results reported). | |
| Notes | Abstracts only. Median follow‐up: 11 months. Median PFS: Carboplatin 3.1 (95% CI 2.5 to 4.2) vs docetaxel 4.5 (95% CI 4.1 to 5.2) months; absolute difference ‐0.4 (95%CI ‐1.1 to 0.3), P = 0.29 (insufficient PFS data reported to calculate hazard ratio for pooling). Median OS: Carboplatin 12.4 (95% CI 10.4 to 15.3) vs docetaxel 12.3 (95% CI 10.5 to 13.6) months; absolute difference ‐0.2 (95% CI ‐1.1 to 0.8), P = 0.31 (insufficient OS data reported to calculate hazard ratio for pooling). Subgroup analysis restricted to 43 BRCA1/2+ participants showed carboplatin was associated with significantly greater proportions of objective responses (68% vs 33%; P = 0.03). "Sponsor: Institute of Cancer Research, United Kingdom". | |
| Risk of bias | ||
| Bias | Authors' judgement | Support for judgement |
| Random sequence generation (selection bias) | Unclear risk | Quote: "patients were randomized" ; no additional details were provided on how random assignment was achieved in the abstracts or ClinicalTrials.gov record (https://clinicaltrials.gov/ct2/show/NCT00532727). |
| Allocation concealment (selection bias) | Unclear risk | Method of concealment was not described in the abstracts. |
| Blinding of participants and personnel (performance bias) | High risk | Open‐label trial. |
| Blinding of outcome assessment (detection bias) (overall survival) | Low risk | Open‐label trial. Unlikely that assessment of overall survival would be influenced by lack of blinding. |
| Blinding of outcome assessment (detection bias) (outcomes other than overall survival and quality of life) | Unclear risk | Insufficient information provided in the available abstracts. |
| Incomplete outcome data (attrition bias) (time‐to‐event outcomes) | Low risk | All 188 and 188 participants randomised to intervention and control groups, respectively, were analysed in time‐to‐event analyses (intent‐to‐treat analyses), but only median times were reported (hence no extractable time‐to‐event data). |
| Incomplete outcome data (attrition bias) (binary outcomes) | Unclear risk | All randomised participants were included in response rate denominators, but it was not explicitly stated that all participants were assessed/assessable. No toxicity results reported. |
| Selective reporting (reporting bias) | High risk | TTP, TTF and toxicity were specified as outcomes in ClinicalTrials.gov record (https://clinicaltrials.gov/ct2/show/NCT00532727), but no results for these outcomes were provided in the abstracts. |
| Other bias | Unclear risk | Unable to assess from the abstracts. |
| Methods | Randomised multicentre phase III trial. Accrual between 11 December 2001 and 23 March 2004. Groups comparable at baseline. | |
| Participants | 263 participants with histologically confirmed metastatic breast cancer. Median age 52/51 years. 100% metastatic breast cancer. 100% first‐line. | |
| Interventions | TH vs TCH ARM A: TH: Trastuzumab 2 mg/kg + docetaxel 100 mg/m2. ARM B: TCH: Trastuzumab 2 mg/kg + docetaxel 75 mg/m2 + carboplatin 6 AUC. | |
| Outcomes | Overall survival (Kaplan‐Meier curves and unadjusted HRs). Progression‐free survival (Kaplan‐Meier curves and unadjusted HRs) defined as "the interval from the day of random assignment to the date of disease progression, diagnosis of second primary malignancy or death" (the authors used the terms TTP and PFS interchangeably). Response rate. Toxicity (frequencies for some conditions were not grade‐specific and therefore could not be used for pooling). | |
| Notes | Estimated min follow‐up: 6 months. Estimated max follow‐up: 78 months. Median TTP: 11.1 and 10.4 months for TH and TCH arms, respectively. Median OS: 37.1 and 37.4 months for TH and TCH arms, respectively. Reported HRs were for Arm B as the reference group and were thus inverted. All 263 randomised participants were analysed in time‐to‐event analyses (ITT). Research Funding: Pfizer, Sanofi‐Aventis, Roche, GlaxoSmithKline. | |
| Risk of bias | ||
| Bias | Authors' judgement | Support for judgement |
| Random sequence generation (selection bias) | Low risk | Quote: "Patients were randomly assigned... Treatment allocation was based on a dynamic minimization procedure, stratified by center and by prior neoadjuvant chemotherapy." |
| Allocation concealment (selection bias) | Unclear risk | Not stated. |
| Blinding of participants and personnel (performance bias) | High risk | "Treatment was not blinded" (p.151). |
| Blinding of outcome assessment (detection bias) (overall survival) | Low risk | Open‐label study. Unlikely that assessment of overall survival would be influenced by lack of blinding. |
| Blinding of outcome assessment (detection bias) (outcomes other than overall survival and quality of life) | Unclear risk | Imaging for tumour response took place before, during, and after chemotherapy. No details were provided on whether there was a central (independent) evaluation team for assessing tumour response rates. |
| Incomplete outcome data (attrition bias) (time‐to‐event outcomes) | Low risk | All 132 and 131 participants randomised to intervention and control groups, respectively, were analysed in time‐to‐event analyses (intent‐to‐treat analyses). |
| Incomplete outcome data (attrition bias) (binary outcomes) | Low risk | 5 of 132 and 1 of 131 participants randomised to intervention and control groups, respectively, were not assessed/assessable for tumour response (2.3% of all randomised participants). One randomised participant(control) was excluded from the safety population for evaluating toxicities (0.3% of all randomised participants). |
| Selective reporting (reporting bias) | Unclear risk | Most outcomes in the trial report were listed in the ClinicalTrials.gov record and vice versa (https://clinicaltrials.gov/ct2/show/NCT00047255). However, the ClinicalTrials.gov record indicated that pathologic, molecular, genetic and biochemical markers would also be assessed, but these were not reported on in the paper. |
| Other bias | Low risk | None identified. |
| Methods | Randomised multicentre phase II trial. Accrual between March 2005 and December 2007. Groups comparable at baseline except length of disease‐free interval of > 24 months at enrolment. | |
| Participants | Total of 147 women overall (100 in Arm 1 and Arm 3) with histologically or cytologically confirmed metastatic breast cancer. Median age 48 years. 100% metastatic breast cancer. 97.3% of participants had received neoadjuvant or adjuvant anthracycline based chemotherapy. | |
| Interventions | GemCis vs GemPac. ARM 1: GemPac: Paclitaxel 150 mg/m2 + gemcitabine 2500 mg/m2. ARM 3: GemCis: Gemcitabine 2500 mg/m2 + cisplatin 50 mg/m2. | |
| Outcomes | Overall survival (Kaplan‐Meier). Progression‐free survival, endpoints not stated (Kaplan‐Meier). Response rate. Time to treatment failure (insufficient TTF data reported to calculate hazard ratio for pooling). Toxicity. | |
| Notes | Estimated min follow‐up: 2 months. Estimated max follow‐up: 24 months. Median OS: GemPac = 15.5 months (10.4 to 26.7), GemCis = 20.1 months (12.4 to 21.6). Median PFS:GemPac = 4.8 months (4.2 to 7.0) , GemCis = 4.8 months (3.7 to 8.1). Median TTF: GemPac = 5.8 months (4.2 to 5.8), GemCis = not calculable. 99 of 100 randomised participants analysed in time‐to‐event analyses (modified ITT). "This study was sponsored by Eli Lilly and Company". | |
| Risk of bias | ||
| Bias | Authors' judgement | Support for judgement |
| Random sequence generation (selection bias) | Unclear risk | Method of random sequence generation not reported in detail other than stratified on one factor only. Quote: "Eligible patients were randomly assigned in a 1:1:1 ratio, stratified by country...". |
| Allocation concealment (selection bias) | Unclear risk | Not stated. |
| Blinding of participants and personnel (performance bias) | High risk | Open‐label trial. |
| Blinding of outcome assessment (detection bias) (overall survival) | Low risk | Open‐label study. Unlikely that assessment of overall survival would be influenced by lack of blinding. |
| Blinding of outcome assessment (detection bias) (outcomes other than overall survival and quality of life) | Unclear risk | Qutote: "Tumor assessments were performed at baseline (within 4 weeks of enrolment) and at the end of cycles 4 and 8" (p. 205) and during follow‐up. No mention of a central (independent, blinded) adjudication team for assessing tumour response. |
| Incomplete outcome data (attrition bias) (time‐to‐event outcomes) | Unclear risk | 50 of 51 and 49 of 49 participants randomised to intervention and control groups, respectively, were analysed in time‐to‐event analysis (modified intent‐to‐treat analysis). |
| Incomplete outcome data (attrition bias) (binary outcomes) | Low risk | 3 of 51 and 5 of 49 participants randomised to intervention and control groups, respectively, were not assessed/assessable for tumour response (7.9% of all randomised participants). One randomised participant(intervention) was excluded from the safety population for evaluating toxicities (1.3% of all randomised participants). |
| Selective reporting (reporting bias) | Low risk | All outcomes in the trial report were listed in the ClinicalTrials.gov record and vice versa (https://clinicaltrials.gov/ct2/show/study/NCT00191854). |
| Other bias | Low risk | None identified. |
| Methods | Randomised multicentre phase II trial. Accrual between March 2005 and December 2007. Groups comparable at baseline except length of disease‐free interval of > 24 months at enrolment. | |
| Participants | Total of 147 women overall (96 in Arm 1 and Arm 2) with histologically or cytologically confirmed metastatic breast cancer. Median age 48 years. 100% metastatic breast cancer. 97.3% of participants had received neoadjuvant or adjuvant anthracycline‐based chemotherapy. | |
| Interventions | GemCarb vs GemPac. ARM 1: GemPac: Paclitaxel 150 mg/m2 + gemcitabine 2500 mg/m2. ARM 2: GemCarb: Gemcitabine 2500 mg/m2 + carboplatin 2.5 AUC. | |
| Outcomes | Overall survival (Kaplan‐Meier). Progression‐free survival, endpoints not stated (Kaplan‐Meier). Response rate. Time to treatment failure (insufficient TTF data reported to calculate hazard ratio for pooling). Toxicity. | |
| Notes | Estimated min follow‐up: 2 months. Estimated max follow‐up: 24 months. Median OS: GemPac = 15.5 months (10.4 to 26.7), GemCarb = 22.8 months (13.3 – not calculable). Median PFS: GemPac = 4.8 months (4.2 to 7.0), GemCarb = 4.3 months (3.7 to 5.9). Median TTF: GemPac = 5.8 months (4.2 to 5.8), GemCarb = 4.3 months (3.7 – not calculable). All 96 randomised participants analysed in time‐to‐event analyses (ITT). "This study was sponsored by Eli Lilly and Company". | |
| Risk of bias | ||
| Bias | Authors' judgement | Support for judgement |
| Random sequence generation (selection bias) | Unclear risk | Method of random sequence generation not reported in detail other than stratified on one factor only. Quote: "Eligible patients were randomly assigned in a 1:1:1 ratio, stratified by country...". |
| Allocation concealment (selection bias) | Unclear risk | Not stated. |
| Blinding of participants and personnel (performance bias) | High risk | Open‐label trial. |
| Blinding of outcome assessment (detection bias) (overall survival) | Low risk | Open‐label study. Unlikely that assessment of overall survival would be influenced by lack of blinding. |
| Blinding of outcome assessment (detection bias) (outcomes other than overall survival and quality of life) | Unclear risk | Quote: "Tumor assessments were performed at baseline (within 4 weeks of enrolment) and at the end of cycles 4 and 8" (p. 205) and during follow‐up. No mention of a central (independent, blinded) adjudication team for assessing tumour response. |
| Incomplete outcome data (attrition bias) (time‐to‐event outcomes) | Low risk | All 47 and 49 participants randomised to intervention and control groups, respectively, were analysed in time‐to‐event analyses (intent‐to‐treat analyses). |
| Incomplete outcome data (attrition bias) (binary outcomes) | Low risk | 3 of 47 and 5 of 49 participants randomised to intervention and control groups, respectively, were not assessed/assessable for tumour response (7.0% of all randomised participants). No participants were excluded from the safety population for evaluating toxicities. |
| Selective reporting (reporting bias) | Low risk | All outcomes in the trial report were listed in the ClinicalTrials.gov record and vice versa (https://clinicaltrials.gov/ct2/show/study/NCT00191854). |
| Other bias | Low risk | None identified. |
5‐FU:5‐fluorouracil
AL: doxorubicin, leucovorin, 5‐fluorouracil, allopurinol
AUC: Area under the curve
bid: Twice a day
C: Carboplatin
CAF: Cyclophosphamide, doxorubicin, fluorouracil
CAP: Cyclophosphamide, adriamycin, Cis‐dichlordiammine platinum
CDDP: Cis‐dichlordiammine platinum
Ce: Cetuximab
CFP: Cyclophosphamide, 5‐Fluorouracil, prednisone
CI: Confidence interval
CIS: Cisplatin
CMF: Cyclophosphamide, methotrexate, fluorouracil
CMFVP: Cyclophosphamide, methotrexate, 5‐fluorouracil, vincristine, prednisolone
CT: X‐ray image made using computerized axial tomography
D: Docetaxel
EcisF: 5‐Fluorouracil, epirubicin, cisplatin
ECOG: Eastern Cooperative Oncology Group
EcycloF: 5‐Fluorouracil, epirubicin, cyclophosphamide
EGFR: Epidermal growth factor receptor
EORTC: European Organisation for Research and Treatment of Cancer
EPI: Epirubicin
EQ‐5D: EuroQol five dimensions questionnaire
EQ VAS: EuroQol visual analogue scale
ER: oestrogen receptor
EUROQOL: The EuroQOL research Group
FAC: 5‐Fluorouracil, adriamycin, cyclophosphamide
FU: 5‐fluorouracil
GemCap: Gemcitabine, capecitabine
GemCarb: Gemcitabine, carboplatin
GemCis: Gemcitabine, cisplatin
GemPac: Gemcitabine, paclitaxel
GemVin: Gemcitabine, vinorelbine
GDoc: Gemcitabine, docetaxel
HeCOG: Hellenic Cooperative Oncology Group
HER2: Human epidermal growth factor receptor 2
HR: Hazard ratio
IHC: Immunohistochemistry
ITT: Intention‐to‐treat
IV: Intravenous
LND: Lonidamine
Max: Maximum
Min: Minimum
MPEMI: Methotrexate + rescue, cisplatin, etoposide, mitomycin
MPEPIV: Methotrexate+ leucovorin rescue; cisplatin, epirubicin, vincristine
MRI: Magnetic resonance imaging
mTNBC: metastatic triple‐negative breast cancer
OS: overall survival
OXA: Oxaliplatin
P: Cisplatin
p.: Page
PCb: Paclitaxel, carboplatin
PE: Cisplatin, etoposide
PFS: progression‐free survival
po: by mouth
PR: Progesterone receptor
Pw: Paclitaxel
q: every
QLQ‐BR23: 23 item quality of life questionnaire
QLQ‐C30: 30 item quality of life questionnaire
QoL: quality of life
RECIST: Response Evaluation Criteria In Solid Tumors
T: Paclitaxel
TCH: Trastuzumab 2 mg/kg + docetaxel 75 mg/m2 + carboplatin
TH: Trastuzumab, docetaxel
TP: Docetaxel, cisplatin
TPa: Trastuzumab, paclitaxel
TPC: Trastuzumab, carboplatin
TTF: Time to treatment failure
TTP: Time to progression
TTPD: Time to progressive disease
TTTF: Time to treatment failure
TX: Docetaxel, capecitabine
VIN: Vinorelbine
VP‐16:Oral etoposide
WBC: White blood cell
Characteristics of excluded studies [ordered by study ID]
| Study | Reason for exclusion |
| Conference abstract only with insufficient data. Attempts to contact authors were unsuccessful. This study was listed as an 'excluded study' in the original version of this review. | |
| Included 38% participants with locoregional disease. Attempts to contact authors were unsuccessful. | |
| Trial reported only the serum tetranectin levels in relation to survival and response.This study was listed as an 'excluded study' in the original version of this review. | |
| Trial was registered but never started. Hence, this study has been moved from the 'ongoing studies' section in the original version of this review to the 'excluded studies' of this review update. | |
| Trial was registered but never started. Hence, this study has been moved from the 'ongoing studies' section in the original version of this review to the 'excluded studies' of this review update. | |
| Participants not randomised. | |
| > 20% participants with locally advanced disease only. Data were not reported separately. |
Characteristics of ongoing studies [ordered by study ID]
| Trial name or title | Carboplatin or Docetaxel in Treating Women With Metastatic Genetic Breast Cancer (BRCA Trial). |
| Methods | A randomised phase II pilot trial. |
| Participants | Participants with metastatic genetic breast cancer. |
| Interventions | Carboplatin vs docetaxel. |
| Outcomes | Response. Time to progression. Toxicity. |
| Starting date | January 2005. Estimated primary completion date: 2009. |
| Contact information | Andrew Tutt, King's College London, email: [email protected]. |
| Notes | Emails sent to the principal investigator in 2015/16 requesting a progress report on the study were not answered. |
| Trial name or title | Gemcitabine/Trastuzumab and Gemcitabine/Cisplatin/Trastuzumab in Patients With Metastatic Breast Cancer. |
| Methods | Randomised phase II study. |
| Participants | Participants with metastatic breast cancer. |
| Interventions | Gemcitabine/trastuzumab vs gemcitabine/cisplatin/trastuzumab. |
| Outcomes | Disease‐free progression. Response. Side effects. |
| Starting date | February 2005. Estimated study completion date: December 2012. |
| Contact information | Kari Kendra, MD, email: [email protected]. |
| Notes | Emails sent to the principal investigator in 2015 requesting a progress report on the study were not answered. Sponsor: Eli Lilly and Company. |
| Trial name or title | A Randomised,Multi‐Center Study of Docetaxol Plus Capecitabine or Cisplatin in Anthracycline‐Pretreated Patients With Advanced Breast Cancer. |
| Methods | Randomised, phase 2, multicentre study. |
| Participants | Participants with advanced breast cancer. |
| Interventions | Docetaxel + capecitabine vs docetaxel + cisplatin. |
| Outcomes | Response. Time to progression. Time to treatment failure. 2 year progression‐free survival. Safety. QoL. |
| Starting date | May 2008. Estimated study completion date: May 2010. |
| Contact information | Jiang Zefei, Ph.D, emails: [email protected]; [email protected]. |
| Notes | Emails sent to the principal investigator in 2015 requesting a progress report on the study were not answered. |
| Trial name or title | The Study Evaluating Efficacy And Tolerability Of Veliparib in Combination With Temozolomide or In Combination With Carboplatin and Paclitaxel Versus Placebo in Subjects With BRCA1 and BRCA2 Mutation and Metastatic Breast Cancer. |
| Methods | Randomised, phase 2 study. |
| Participants | Women with BRCA1 or BRCA2 mutation and metastatic breast cancer. |
| Interventions | Veliparib with temozolomide vs veliparib with carboplatin and paclitaxel vs placebo with carboplatin and paclitaxel. |
| Outcomes | Progression‐free survival. |
| Starting date | Study start date: January 2012. Estimated study completion date: May 2016. |
| Contact information | Stacie P. Shepherd, MD, AbbVie. |
| Notes | Sponsors and Collaborators: AbbVie (prior sponsor, Abbott). |
| Trial name or title | Biomarker Discovery Randomized Phase IIb Trial With Carboplatin‐cyclophosphamide Versus Paclitaxel With or Without Bevacizumab as First‐line Treatment in Advanced Triple Negative Breast Cancer. |
| Methods | Randomised phase IIb trial. |
| Participants | Participants with advanced triple‐negative breast cancer. |
| Interventions | Carboplatin‐cyclophosphamide vs paclitaxel with or without bevacizumab. |
| Outcomes | Progression‐free survival. Overall survival. Toxicity. |
| Starting date | July 2013. Estimated primary completion date: December 2019. |
| Contact information | Sabine C Linn, Prof, MD, email; [email protected]. |
| Notes |
| Trial name or title | Trial of Gemcitabine_Capecitabine Versus Gemcitabine_Carboplatin in Breast Cancer. |
| Methods | A multicentre randomised phase Ⅲ clinical trial. |
| Participants | Participants with triple‐negative recurrent or metastatic breast cancer. |
| Interventions | Gemcitabine + capecitabine vs gemcitabine + carboplatin. |
| Outcomes | Response (RECIST 1.1). |
| Starting date | December 2013. Estimated study completion date: December 2016. |
| Contact information | Zhongsheng Tong, Master, email: [email protected]. |
| Notes |
| Trial name or title | Paclitaxel in Combination With Carboplatin Versus Paclitaxel Plus Epirubicin in Metastatic Breast Cancer. |
| Methods | Randomised prospective clinical trial. |
| Participants | Participants with metastatic breast cancer. |
| Interventions | Paclitaxel + carboplatin vs paclitaxel + epirubicin. |
| Outcomes | Response (RECIST 1.1). |
| Starting date | December 2013. Estimated study completion date: December 2016. |
| Contact information | Zhongsheng Tong, Master, email: [email protected]. |
| Notes |
| Trial name or title | TnAcity: A phase 2/3 randomised study of weekly nab‐paclitaxel in combination with either gemcitabine or carboplatin vs gemcitabine/carboplatin as first‐line treatment for triple‐negative metastatic breast cancer. |
| Methods | Phase 2/3 randomised study. |
| Participants | Women with ER‐, PR‐, and HER2 negative (triple‐negative) metastatic breast cancer. |
| Interventions | Carboplatin plus gemcitabine vs nab‐paclitaxel plus carboplatin OR gemcitabine. |
| Outcomes | Progression‐free survival. Overall survival. Response. Duration of response. Safety. |
| Starting date | Date of registration: 12/06/2013. |
| Contact information | |
| Notes | Sponsored by Abraxis BioScience, LLC, a wholly‐owned subsidiary of Celgene Corporation. |
BRCA: Breast cancer susceptibility gene
ER: Oestrogen receptor
HER2: Human epidermal growth factor receptor 2
PR: Progesterone receptor
QoL: Quality of life
RECIST:Response Evaluation Criteria In Solid Tumors
Data and analyses
| Outcome or subgroup title | No. of studies | No. of participants | Statistical method | Effect size |
| 1 Overall survival Show forest plot | 19 | 2922 | HR (95% CI) | 0.98 [0.89, 1.07] |
| Analysis 1.1 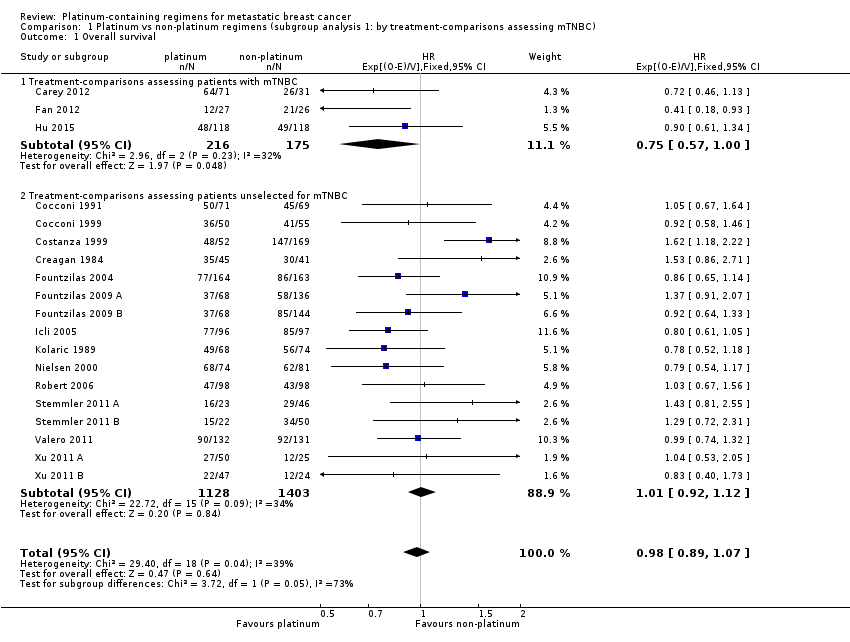 Comparison 1 Platinum vs non‐platinum regimens (subgroup analysis 1: by treatment‐comparisons assessing mTNBC), Outcome 1 Overall survival. | ||||
| 1.1 Treatment‐comparisons assessing patients with mTNBC | 3 | 391 | HR (95% CI) | 0.75 [0.57, 1.00] |
| 1.2 Treatment‐comparisons assessing patients unselected for mTNBC | 16 | 2531 | HR (95% CI) | 1.01 [0.92, 1.12] |
| 2 Progression‐free survival/time to progression Show forest plot | 16 | 2136 | HR (95% CI) | 0.85 [0.78, 0.93] |
| Analysis 1.2  Comparison 1 Platinum vs non‐platinum regimens (subgroup analysis 1: by treatment‐comparisons assessing mTNBC), Outcome 2 Progression‐free survival/time to progression. | ||||
| 2.1 Treatment‐comparisons assessing patients with mTNBC | 3 | 391 | HR (95% CI) | 0.59 [0.49, 0.72] |
| 2.2 Treatment‐comparisons assessing patients unselected for mTNBC | 13 | 1745 | HR (95% CI) | 0.92 [0.84, 1.01] |
| 3 Objective tumour response rate (assessable participants) Show forest plot | 28 | 4130 | Risk Ratio (M‐H, Fixed, 95% CI) | 1.15 [1.08, 1.22] |
| Analysis 1.3 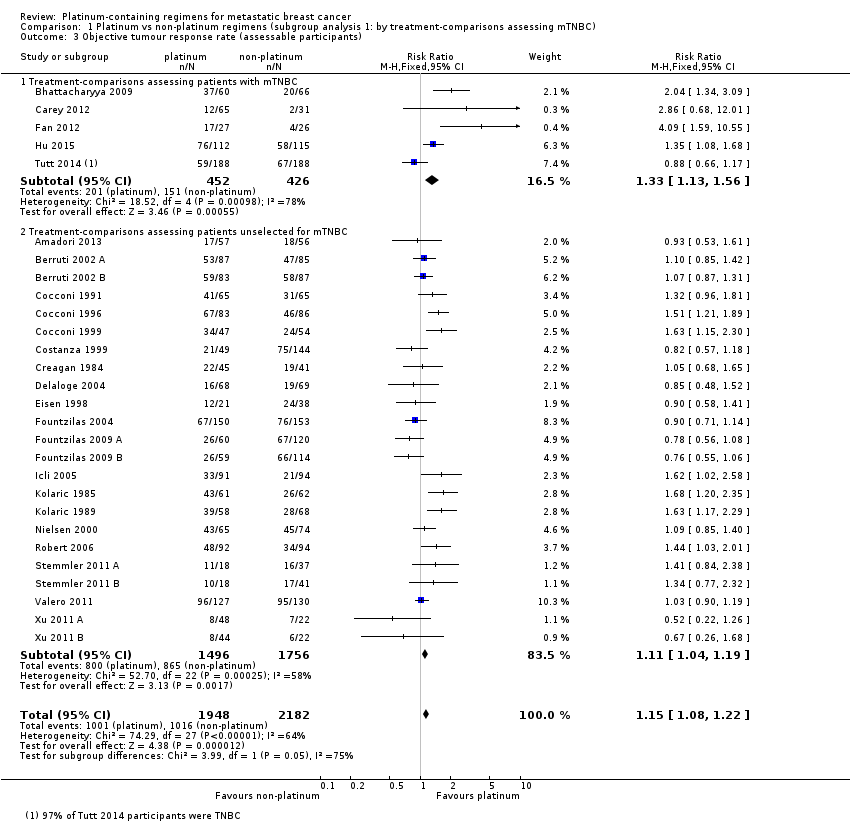 Comparison 1 Platinum vs non‐platinum regimens (subgroup analysis 1: by treatment‐comparisons assessing mTNBC), Outcome 3 Objective tumour response rate (assessable participants). | ||||
| 3.1 Treatment‐comparisons assessing patients with mTNBC | 5 | 878 | Risk Ratio (M‐H, Fixed, 95% CI) | 1.33 [1.13, 1.56] |
| 3.2 Treatment‐comparisons assessing patients unselected for mTNBC | 23 | 3252 | Risk Ratio (M‐H, Fixed, 95% CI) | 1.11 [1.04, 1.19] |
| Outcome or subgroup title | No. of studies | No. of participants | Statistical method | Effect size |
| 1 Overall survival Show forest plot | 19 | 2922 | HR (95% CI) | 0.98 [0.89, 1.07] |
| Analysis 2.1  Comparison 2 Platinum vs non‐platinum regimens (subgroup analysis 2: by type of regimen comparison), Outcome 1 Overall survival. | ||||
| 1.1 Regimen A + platinum agent vs regimen A | 6 | 1141 | HR (95% CI) | 1.08 [0.93, 1.26] |
| 1.2 Regimen A + platinum agent vs regimen B | 13 | 1781 | HR (95% CI) | 0.92 [0.81, 1.03] |
| 2 Progression‐free survival / time to progression Show forest plot | 16 | 2136 | HR (95% CI) | 0.85 [0.78, 0.93] |
| Analysis 2.2 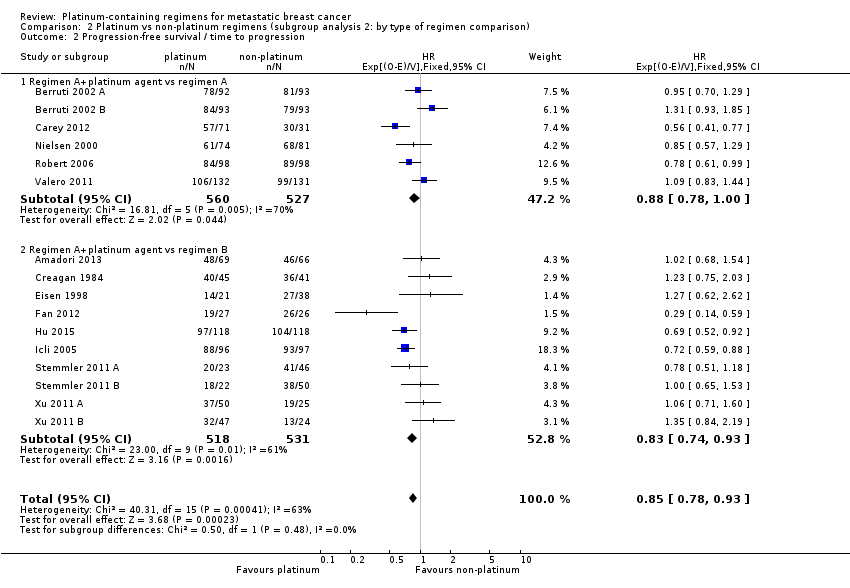 Comparison 2 Platinum vs non‐platinum regimens (subgroup analysis 2: by type of regimen comparison), Outcome 2 Progression‐free survival / time to progression. | ||||
| 2.1 Regimen A+platinum agent vs regimen A | 6 | 1087 | HR (95% CI) | 0.88 [0.78, 1.00] |
| 2.2 Regimen A+platinum agent vs regimen B | 10 | 1049 | HR (95% CI) | 0.83 [0.74, 0.93] |
| 3 Objective tumour response rate (assessable participants) Show forest plot | 28 | 4130 | Risk Ratio (M‐H, Fixed, 95% CI) | 1.15 [1.08, 1.22] |
| Analysis 2.3  Comparison 2 Platinum vs non‐platinum regimens (subgroup analysis 2: by type of regimen comparison), Outcome 3 Objective tumour response rate (assessable participants). | ||||
| 3.1 Regimen A + platinum agent vs regimen A | 9 | 1519 | Risk Ratio (M‐H, Fixed, 95% CI) | 1.10 [1.01, 1.21] |
| 3.2 Regimen A + platinum agent vs regimen B | 18 | 2235 | Risk Ratio (M‐H, Fixed, 95% CI) | 1.22 [1.12, 1.33] |
| 3.3 Single agent platinum vs regimen C | 1 | 376 | Risk Ratio (M‐H, Fixed, 95% CI) | 0.88 [0.66, 1.17] |
| Outcome or subgroup title | No. of studies | No. of participants | Statistical method | Effect size |
| 1 Overall survival Show forest plot | 19 | 2922 | HR (95% CI) | 0.98 [0.89, 1.07] |
| Analysis 3.1  Comparison 3 Platinum vs non‐platinum regimens (subgroup analysis 3: by type of platinum agent in platinum arm), Outcome 1 Overall survival. | ||||
| 1.1 Cisplatin in platinum arm | 11 | 1326 | HR (95% CI) | 0.91 [0.80, 1.05] |
| 1.2 Carboplatin in platinum arm | 8 | 1596 | HR (95% CI) | 1.04 [0.91, 1.18] |
| 2 Progression‐free survival/time to progression Show forest plot | 16 | 2136 | HR (95% CI) | 0.85 [0.78, 0.93] |
| Analysis 3.2  Comparison 3 Platinum vs non‐platinum regimens (subgroup analysis 3: by type of platinum agent in platinum arm), Outcome 2 Progression‐free survival/time to progression. | ||||
| 2.1 Cisplatin in platinum arm | 11 | 1369 | HR (95% CI) | 0.85 [0.76, 0.94] |
| 2.2 Carboplatin in platinum arm | 5 | 767 | HR (95% CI) | 0.86 [0.75, 0.99] |
| 3 Objective tumour response rate (assessable participants) Show forest plot | 28 | 4130 | Risk Ratio (M‐H, Fixed, 95% CI) | 1.15 [1.08, 1.22] |
| Analysis 3.3  Comparison 3 Platinum vs non‐platinum regimens (subgroup analysis 3: by type of platinum agent in platinum arm), Outcome 3 Objective tumour response rate (assessable participants). | ||||
| 3.1 Cisplatin in platinum arm | 17 | 2050 | Risk Ratio (M‐H, Fixed, 95% CI) | 1.35 [1.24, 1.46] |
| 3.2 Carboplatin in platinum arm | 10 | 1943 | Risk Ratio (M‐H, Fixed, 95% CI) | 0.94 [0.86, 1.04] |
| 3.3 Oxaliplatin in platinum arm | 1 | 137 | Risk Ratio (M‐H, Fixed, 95% CI) | 0.85 [0.48, 1.52] |
| 4 Treatment‐related death (safety population) Show forest plot | 15 | 2377 | Risk Ratio (M‐H, Fixed, 95% CI) | 1.42 [0.73, 2.76] |
| Analysis 3.4  Comparison 3 Platinum vs non‐platinum regimens (subgroup analysis 3: by type of platinum agent in platinum arm), Outcome 4 Treatment‐related death (safety population). | ||||
| 4.1 Cisplatin in platinum arm | 8 | 1185 | Risk Ratio (M‐H, Fixed, 95% CI) | 1.39 [0.59, 3.25] |
| 4.2 Carboplatin in platinum arm | 6 | 1055 | Risk Ratio (M‐H, Fixed, 95% CI) | 1.86 [0.57, 6.05] |
| 4.3 Oxaliplatin in platinum arm | 1 | 137 | Risk Ratio (M‐H, Fixed, 95% CI) | 0.34 [0.01, 8.16] |
| 5 Nausea/vomiting (safety population) Show forest plot | 21 | 3172 | Risk Ratio (M‐H, Fixed, 95% CI) | 2.07 [1.69, 2.54] |
| Analysis 3.5 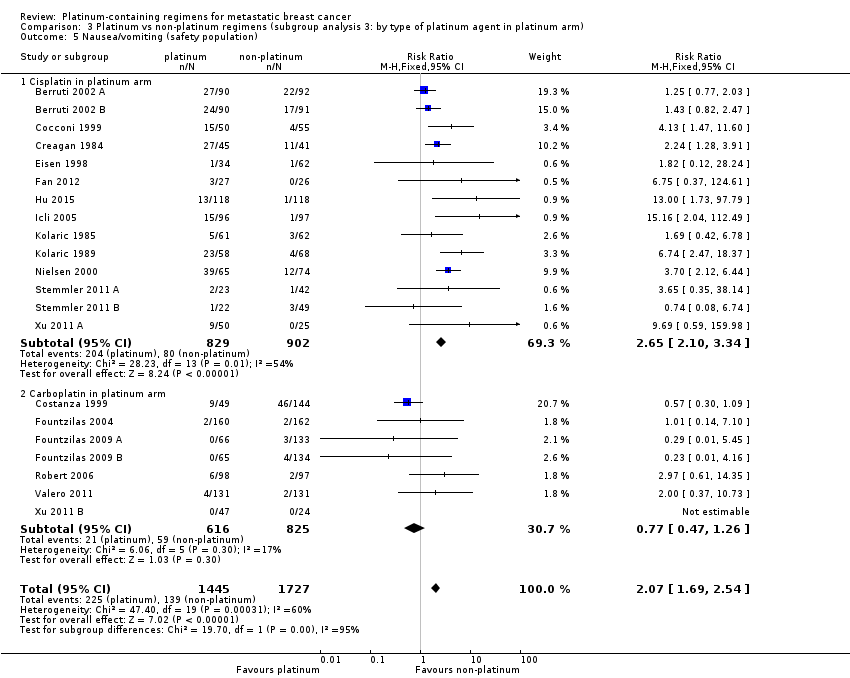 Comparison 3 Platinum vs non‐platinum regimens (subgroup analysis 3: by type of platinum agent in platinum arm), Outcome 5 Nausea/vomiting (safety population). | ||||
| 5.1 Cisplatin in platinum arm | 14 | 1731 | Risk Ratio (M‐H, Fixed, 95% CI) | 2.65 [2.10, 3.34] |
| 5.2 Carboplatin in platinum arm | 7 | 1441 | Risk Ratio (M‐H, Fixed, 95% CI) | 0.77 [0.47, 1.26] |
| 6 Nephrotoxicity (safety population) Show forest plot | 5 | 632 | Risk Ratio (M‐H, Fixed, 95% CI) | 3.06 [0.86, 10.84] |
| Analysis 3.6  Comparison 3 Platinum vs non‐platinum regimens (subgroup analysis 3: by type of platinum agent in platinum arm), Outcome 6 Nephrotoxicity (safety population). | ||||
| 6.1 Cisplatin in platinum arm | 4 | 561 | Risk Ratio (M‐H, Fixed, 95% CI) | 3.46 [0.86, 13.97] |
| 6.2 Carboplatin in platinum arm | 1 | 71 | Risk Ratio (M‐H, Fixed, 95% CI) | 1.56 [0.07, 36.97] |
| 7 Anaemia (safety population) Show forest plot | 20 | 3085 | Risk Ratio (M‐H, Fixed, 95% CI) | 2.61 [1.90, 3.58] |
| Analysis 3.7  Comparison 3 Platinum vs non‐platinum regimens (subgroup analysis 3: by type of platinum agent in platinum arm), Outcome 7 Anaemia (safety population). | ||||
| 7.1 Cisplatin in platinum arm | 13 | 1644 | Risk Ratio (M‐H, Fixed, 95% CI) | 3.72 [2.36, 5.88] |
| 7.2 Carboplatin in platinum arm | 7 | 1441 | Risk Ratio (M‐H, Fixed, 95% CI) | 1.72 [1.10, 2.70] |
| 8 Hair loss (safety population) Show forest plot | 12 | 1452 | Risk Ratio (M‐H, Fixed, 95% CI) | 1.41 [1.26, 1.58] |
| Analysis 3.8  Comparison 3 Platinum vs non‐platinum regimens (subgroup analysis 3: by type of platinum agent in platinum arm), Outcome 8 Hair loss (safety population). | ||||
| 8.1 Cisplatin in platinum arm | 9 | 983 | Risk Ratio (M‐H, Fixed, 95% CI) | 1.33 [1.15, 1.54] |
| 8.2 Carboplatin in platinum arm | 3 | 469 | Risk Ratio (M‐H, Fixed, 95% CI) | 1.53 [1.28, 1.84] |
| 9 Leukopenia (safety population) Show forest plot | 22 | 3176 | Risk Ratio (M‐H, Fixed, 95% CI) | 1.38 [1.21, 1.57] |
| Analysis 3.9  Comparison 3 Platinum vs non‐platinum regimens (subgroup analysis 3: by type of platinum agent in platinum arm), Outcome 9 Leukopenia (safety population). | ||||
| 9.1 Cisplatin in platinum arm | 15 | 1866 | Risk Ratio (M‐H, Fixed, 95% CI) | 1.49 [1.23, 1.81] |
| 9.2 Carboplatin in platinum arm | 7 | 1310 | Risk Ratio (M‐H, Fixed, 95% CI) | 1.27 [1.07, 1.50] |
| Outcome or subgroup title | No. of studies | No. of participants | Statistical method | Effect size |
| 1 Overall survival Show forest plot | 19 | 2922 | HR (95% CI) | 0.98 [0.89, 1.07] |
| Analysis 4.1  Comparison 4 Platinum vs non‐platinum regimens (subgroup analysis 4: by first‐line therapy), Outcome 1 Overall survival. | ||||
| 1.1 First‐line therapy for > 80% of patients | 15 | 2486 | HR (95% CI) | 1.00 [0.90, 1.11] |
| 1.2 Second‐ or third‐line therapy for ≥20% of patients | 4 | 436 | HR (95% CI) | 0.89 [0.73, 1.09] |
| 2 Progression‐free survival/time to progression Show forest plot | 16 | 2136 | HR (95% CI) | 0.85 [0.78, 0.93] |
| Analysis 4.2 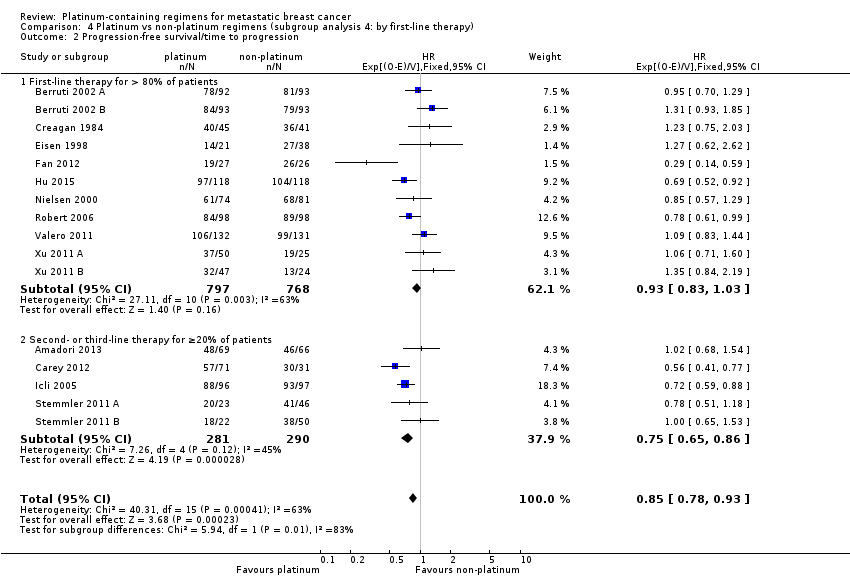 Comparison 4 Platinum vs non‐platinum regimens (subgroup analysis 4: by first‐line therapy), Outcome 2 Progression‐free survival/time to progression. | ||||
| 2.1 First‐line therapy for > 80% of patients | 11 | 1565 | HR (95% CI) | 0.93 [0.83, 1.03] |
| 2.2 Second‐ or third‐line therapy for ≥20% of patients | 5 | 571 | HR (95% CI) | 0.75 [0.65, 0.86] |
| 3 Objective tumour response rate (assessable participants) Show forest plot | 28 | 4130 | Risk Ratio (M‐H, Fixed, 95% CI) | 1.15 [1.08, 1.22] |
| Analysis 4.3 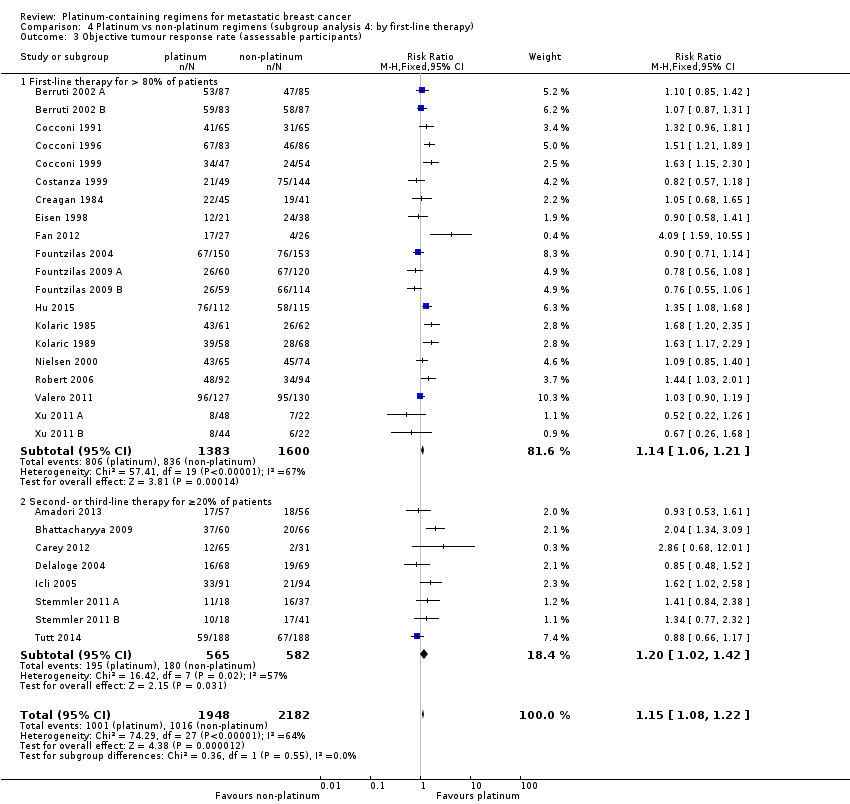 Comparison 4 Platinum vs non‐platinum regimens (subgroup analysis 4: by first‐line therapy), Outcome 3 Objective tumour response rate (assessable participants). | ||||
| 3.1 First‐line therapy for > 80% of patients | 20 | 2983 | Risk Ratio (M‐H, Fixed, 95% CI) | 1.14 [1.06, 1.21] |
| 3.2 Second‐ or third‐line therapy for ≥20% of patients | 8 | 1147 | Risk Ratio (M‐H, Fixed, 95% CI) | 1.20 [1.02, 1.42] |
| Outcome or subgroup title | No. of studies | No. of participants | Statistical method | Effect size |
| 1 Overall survival Show forest plot | 19 | 2922 | HR (95% CI) | 0.98 [0.89, 1.07] |
| Analysis 5.1 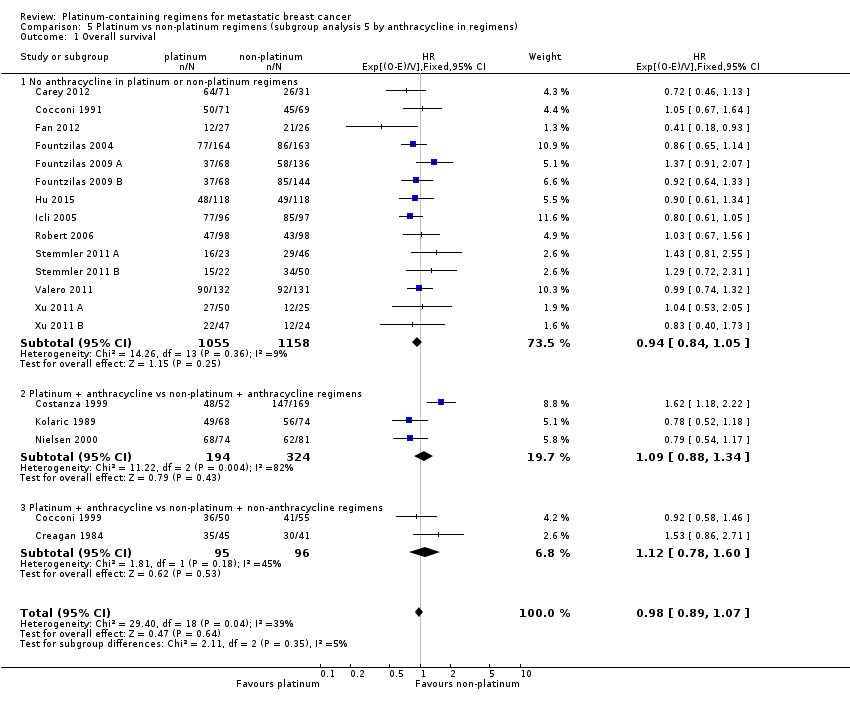 Comparison 5 Platinum vs non‐platinum regimens (subgroup analysis 5 by anthracycline in regimens), Outcome 1 Overall survival. | ||||
| 1.1 No anthracycline in platinum or non‐platinum regimens | 14 | 2213 | HR (95% CI) | 0.94 [0.84, 1.05] |
| 1.2 Platinum + anthracycline vs non‐platinum + anthracycline regimens | 3 | 518 | HR (95% CI) | 1.09 [0.88, 1.34] |
| 1.3 Platinum + anthracycline vs non‐platinum + non‐anthracycline regimens | 2 | 191 | HR (95% CI) | 1.12 [0.78, 1.60] |
| 2 Progression‐free survival/time to progression Show forest plot | 16 | 2136 | HR (95% CI) | 0.85 [0.78, 0.93] |
| Analysis 5.2  Comparison 5 Platinum vs non‐platinum regimens (subgroup analysis 5 by anthracycline in regimens), Outcome 2 Progression‐free survival/time to progression. | ||||
| 2.1 No anthracycline in platinum or non‐platinum regimens | 11 | 1465 | HR (95% CI) | 0.80 [0.73, 0.88] |
| 2.2 Platinum+anthracycline vs non‐platinum+anthracycline regimens | 4 | 585 | HR (95% CI) | 1.05 [0.86, 1.27] |
| 2.3 Platinum+anthracycline vs non‐platinum+non‐anthracycline regimens | 1 | 86 | HR (95% CI) | 1.23 [0.75, 2.03] |
| 3 Objective tumour response rate (assessable participants) Show forest plot | 28 | 4130 | Risk Ratio (M‐H, Fixed, 95% CI) | 1.15 [1.08, 1.22] |
| Analysis 5.3  Comparison 5 Platinum vs non‐platinum regimens (subgroup analysis 5 by anthracycline in regimens), Outcome 3 Objective tumour response rate (assessable participants). | ||||
| 3.1 No anthracycline in platinum or non‐platinum regimens | 18 | 2792 | Risk Ratio (M‐H, Fixed, 95% CI) | 1.10 [1.02, 1.20] |
| 3.2 Platinum+anthracycline vs non‐platinum+anthracycline regimens | 6 | 859 | Risk Ratio (M‐H, Fixed, 95% CI) | 1.09 [0.97, 1.22] |
| 3.3 Platinum+anthracycline vs non‐platinum+non‐anthracycline regimens | 4 | 479 | Risk Ratio (M‐H, Fixed, 95% CI) | 1.49 [1.28, 1.74] |
| Outcome or subgroup title | No. of studies | No. of participants | Statistical method | Effect size |
| 1 Overall survival Show forest plot | 19 | 2922 | HR (95% CI) | 0.98 [0.89, 1.07] |
| Analysis 6.1  Comparison 6 Platinum vs non‐platinum regimens (subgroup analysis 6: by taxane in regimens), Outcome 1 Overall survival. | ||||
| 1.1 No taxane in platinum or non‐platinum regimens | 9 | 1092 | HR (95% CI) | 1.07 [0.93, 1.24] |
| 1.2 Platinum + taxane vs non‐platinum + taxane regimens | 6 | 1255 | HR (95% CI) | 0.96 [0.82, 1.11] |
| 1.3 Platinum + non‐taxane vs non‐platinum + taxane regimens | 4 | 575 | HR (95% CI) | 0.85 [0.69, 1.04] |
| 2 Progression‐free survival / time to progression Show forest plot | 16 | 2136 | HR (95% CI) | 0.85 [0.78, 0.93] |
| Analysis 6.2  Comparison 6 Platinum vs non‐platinum regimens (subgroup analysis 6: by taxane in regimens), Outcome 2 Progression‐free survival / time to progression. | ||||
| 2.1 No taxane in platinum or non‐platinum regimens | 9 | 1049 | HR (95% CI) | 0.92 [0.80, 1.04] |
| 2.2 Platinum + taxane vs non‐platinum + taxane regimens | 3 | 512 | HR (95% CI) | 0.84 [0.70, 1.00] |
| 2.3 Platinum + non‐taxane vs non‐platinum + taxane regimens | 4 | 575 | HR (95% CI) | 0.79 [0.69, 0.91] |
| 3 Objective tumour response rate (assessable participants) Show forest plot | 28 | 4130 | Risk Ratio (M‐H, Fixed, 95% CI) | 1.15 [1.08, 1.22] |
| Analysis 6.3  Comparison 6 Platinum vs non‐platinum regimens (subgroup analysis 6: by taxane in regimens), Outcome 3 Objective tumour response rate (assessable participants). | ||||
| 3.1 No taxane in platinum or non‐platinum regimens | 17 | 2054 | Risk Ratio (M‐H, Fixed, 95% CI) | 1.25 [1.15, 1.36] |
| 3.2 Platinum + taxane vs non‐platinum + taxane regimens | 6 | 1152 | Risk Ratio (M‐H, Fixed, 95% CI) | 1.01 [0.90, 1.12] |
| 3.3 Platinum + non‐taxane vs non‐platinum + taxane regimens | 5 | 924 | Risk Ratio (M‐H, Fixed, 95% CI) | 1.11 [0.94, 1.30] |
| Outcome or subgroup title | No. of studies | No. of participants | Statistical method | Effect size |
| 1 Overall survival Show forest plot | 19 | 2922 | HR (95% CI) | 0.98 [0.89, 1.07] |
| Analysis 7.1 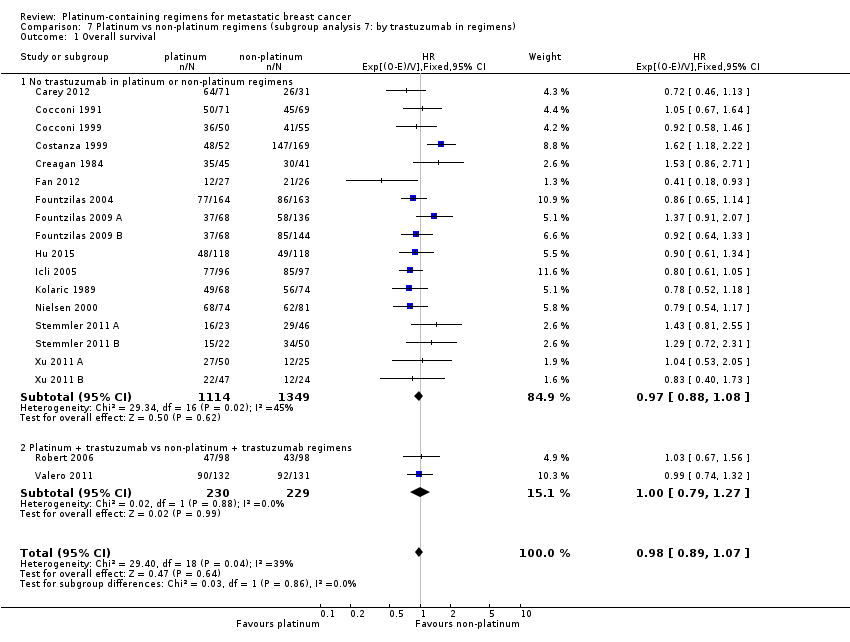 Comparison 7 Platinum vs non‐platinum regimens (subgroup analysis 7: by trastuzumab in regimens), Outcome 1 Overall survival. | ||||
| 1.1 No trastuzumab in platinum or non‐platinum regimens | 17 | 2463 | HR (95% CI) | 0.97 [0.88, 1.08] |
| 1.2 Platinum + trastuzumab vs non‐platinum + trastuzumab regimens | 2 | 459 | HR (95% CI) | 1.00 [0.79, 1.27] |
| 2 Progression‐free survival/time to progression Show forest plot | 16 | 2136 | HR (95% CI) | 0.85 [0.78, 0.93] |
| Analysis 7.2 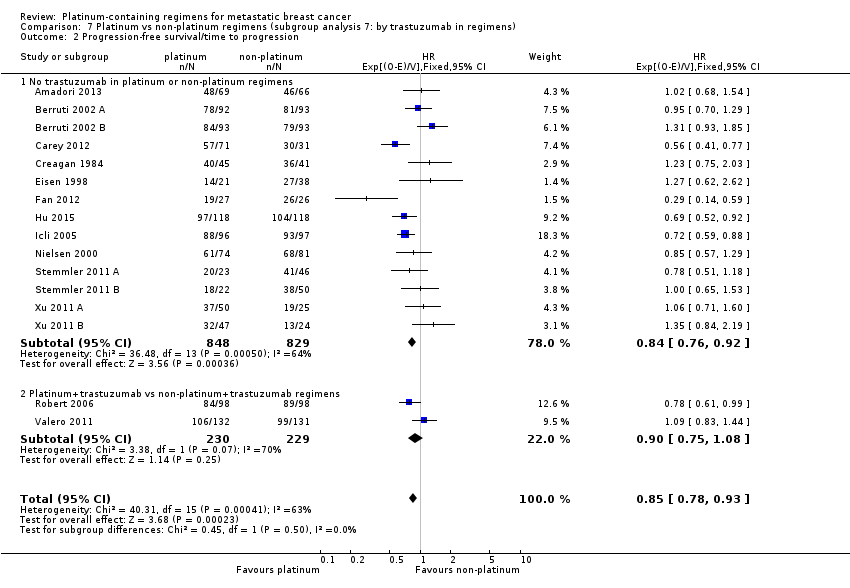 Comparison 7 Platinum vs non‐platinum regimens (subgroup analysis 7: by trastuzumab in regimens), Outcome 2 Progression‐free survival/time to progression. | ||||
| 2.1 No trastuzumab in platinum or non‐platinum regimens | 14 | 1677 | HR (95% CI) | 0.84 [0.76, 0.92] |
| 2.2 Platinum+trastuzumab vs non‐platinum+trastuzumab regimens | 2 | 459 | HR (95% CI) | 0.90 [0.75, 1.08] |
| 3 Objective tumour response rate (assessable participants) Show forest plot | 28 | 4130 | Risk Ratio (M‐H, Fixed, 95% CI) | 1.15 [1.08, 1.22] |
| Analysis 7.3 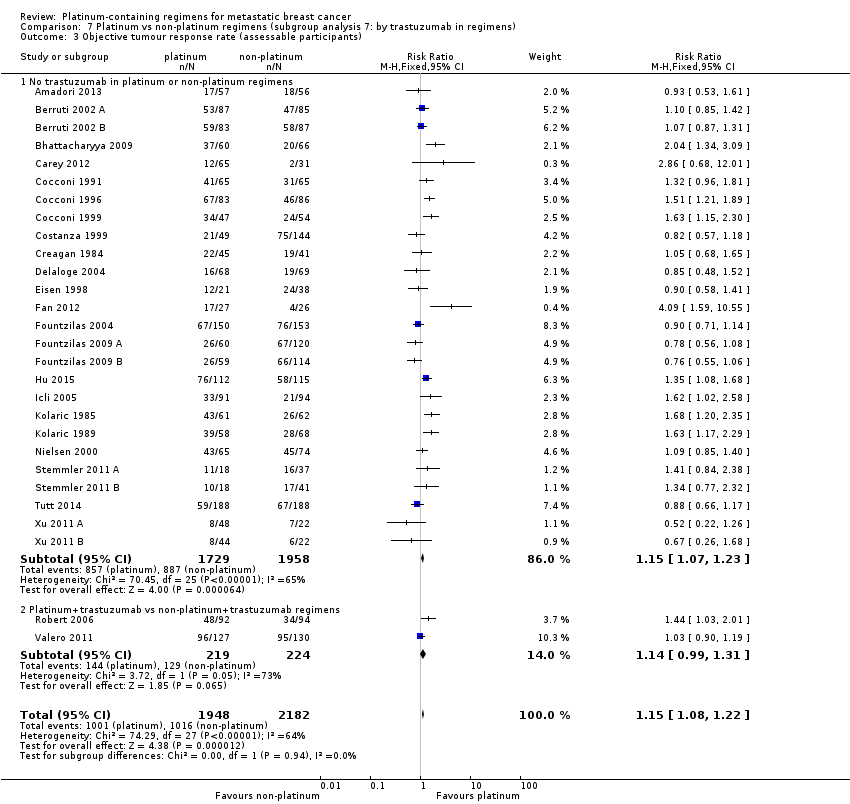 Comparison 7 Platinum vs non‐platinum regimens (subgroup analysis 7: by trastuzumab in regimens), Outcome 3 Objective tumour response rate (assessable participants). | ||||
| 3.1 No trastuzumab in platinum or non‐platinum regimens | 26 | 3687 | Risk Ratio (M‐H, Fixed, 95% CI) | 1.15 [1.07, 1.23] |
| 3.2 Platinum+trastuzumab vs non‐platinum+trastuzumab regimens | 2 | 443 | Risk Ratio (M‐H, Fixed, 95% CI) | 1.14 [0.99, 1.31] |
| Outcome or subgroup title | No. of studies | No. of participants | Statistical method | Effect size |
| 1 Overall survival (restricted to the 12 treatment‐comparisons common to OS and PFS/TTP meta‐analyses) Show forest plot | 12 | 1571 | HR (95% CI) | 0.92 [0.81, 1.04] |
| Analysis 8.1  Comparison 8 Platinum vs non‐platinum regimens (sensitivity analysis 1: excluding selected treatment‐comparisons), Outcome 1 Overall survival (restricted to the 12 treatment‐comparisons common to OS and PFS/TTP meta‐analyses). | ||||
| 2 Progression‐free survival/time to progression (restricted to the 12 treatment‐comparisons common to OS and PFS/TTP meta‐analyses) Show forest plot | 12 | 1571 | HR (95% CI) | 0.80 [0.73, 0.88] |
| Analysis 8.2  Comparison 8 Platinum vs non‐platinum regimens (sensitivity analysis 1: excluding selected treatment‐comparisons), Outcome 2 Progression‐free survival/time to progression (restricted to the 12 treatment‐comparisons common to OS and PFS/TTP meta‐analyses). | ||||
| 3 Objective tumour response rate (assessable participants‐ restricted to the 19 treatment‐comparisons in OS meta‐analyses) Show forest plot | 19 | 2685 | Risk Ratio (M‐H, Fixed, 95% CI) | 1.13 [1.05, 1.22] |
| Analysis 8.3 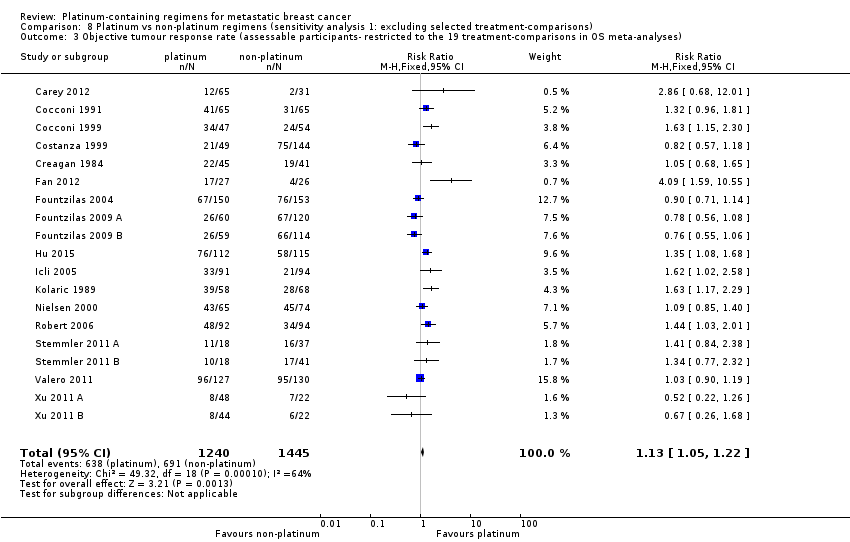 Comparison 8 Platinum vs non‐platinum regimens (sensitivity analysis 1: excluding selected treatment‐comparisons), Outcome 3 Objective tumour response rate (assessable participants‐ restricted to the 19 treatment‐comparisons in OS meta‐analyses). | ||||
| Outcome or subgroup title | No. of studies | No. of participants | Statistical method | Effect size |
| 1 Progression‐free survival vs time to progression Show forest plot | 16 | 2136 | HR (95% CI) | 0.85 [0.78, 0.93] |
| Analysis 9.1  Comparison 9 Platinum vs non‐platinum regimens (sensitivity analysis 2: Progression‐free survival vs. time to progression), Outcome 1 Progression‐free survival vs time to progression. | ||||
| 1.1 Progression‐free survival | 9 | 1324 | HR (95% CI) | 0.92 [0.82, 1.03] |
| 1.2 Time to progression | 7 | 812 | HR (95% CI) | 0.78 [0.69, 0.88] |
| Outcome or subgroup title | No. of studies | No. of participants | Statistical method | Effect size |
| 1 Overall survival Show forest plot | 19 | Hazard Ratio (Random, 95% CI) | 0.98 [0.87, 1.11] | |
| Analysis 10.1 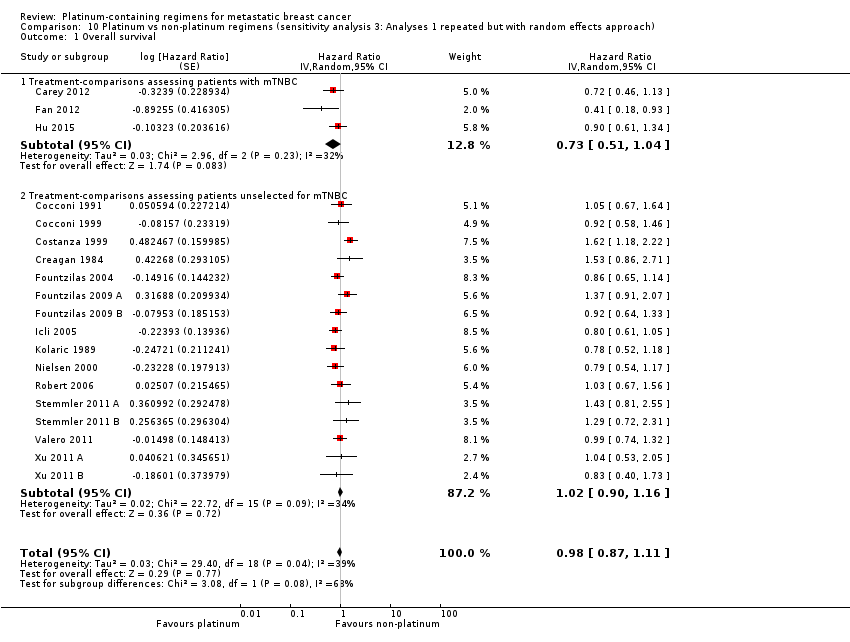 Comparison 10 Platinum vs non‐platinum regimens (sensitivity analysis 3: Analyses 1 repeated but with random effects approach), Outcome 1 Overall survival. | ||||
| 1.1 Treatment‐comparisons assessing patients with mTNBC | 3 | Hazard Ratio (Random, 95% CI) | 0.73 [0.51, 1.04] | |
| 1.2 Treatment‐comparisons assessing patients unselected for mTNBC | 16 | Hazard Ratio (Random, 95% CI) | 1.02 [0.90, 1.16] | |
| 2 Progression‐free survival/time to progression Show forest plot | 16 | Hazard Ratio (Random, 95% CI) | 0.88 [0.76, 1.02] | |
| Analysis 10.2 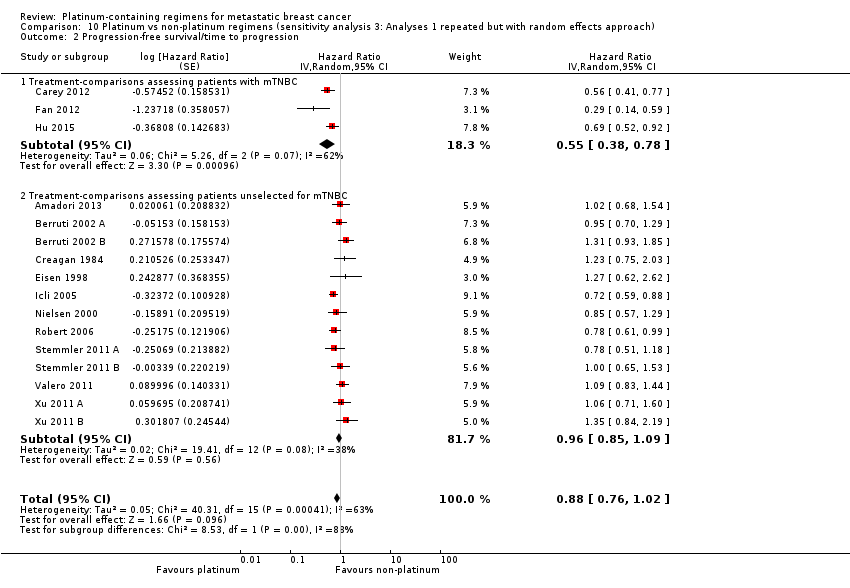 Comparison 10 Platinum vs non‐platinum regimens (sensitivity analysis 3: Analyses 1 repeated but with random effects approach), Outcome 2 Progression‐free survival/time to progression. | ||||
| 2.1 Treatment‐comparisons assessing patients with mTNBC | 3 | Hazard Ratio (Random, 95% CI) | 0.55 [0.38, 0.78] | |
| 2.2 Treatment‐comparisons assessing patients unselected for mTNBC | 13 | Hazard Ratio (Random, 95% CI) | 0.96 [0.85, 1.09] | |
| 3 Objective tumour response rate (assessable participants) Show forest plot | 28 | 4130 | Risk Ratio (M‐H, Random, 95% CI) | 1.17 [1.05, 1.30] |
| Analysis 10.3 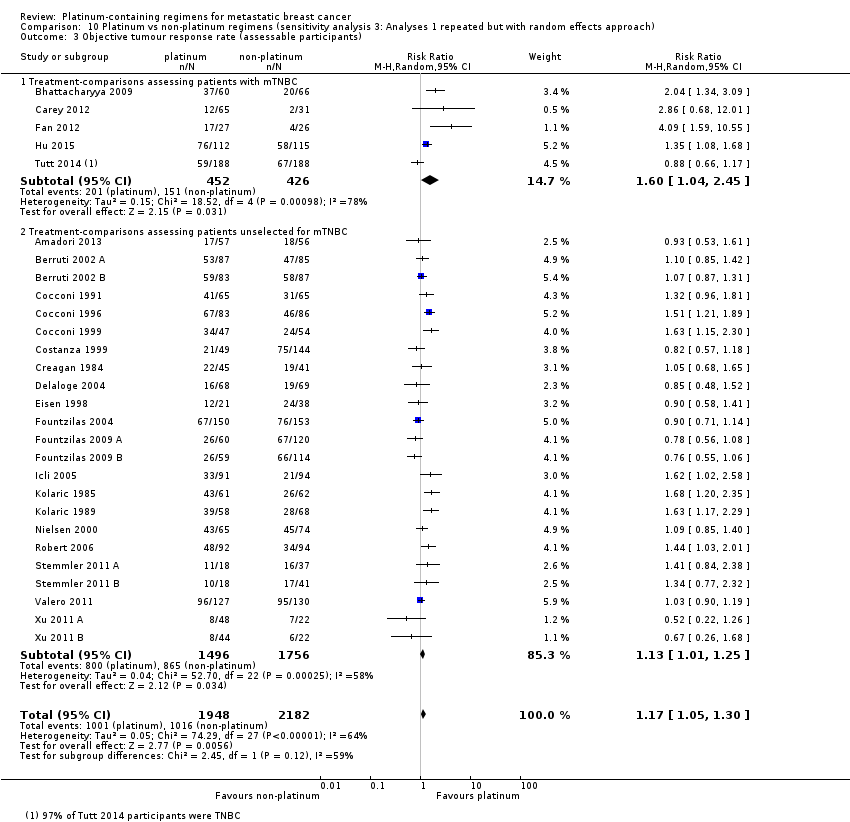 Comparison 10 Platinum vs non‐platinum regimens (sensitivity analysis 3: Analyses 1 repeated but with random effects approach), Outcome 3 Objective tumour response rate (assessable participants). | ||||
| 3.1 Treatment‐comparisons assessing patients with mTNBC | 5 | 878 | Risk Ratio (M‐H, Random, 95% CI) | 1.60 [1.04, 2.45] |
| 3.2 Treatment‐comparisons assessing patients unselected for mTNBC | 23 | 3252 | Risk Ratio (M‐H, Random, 95% CI) | 1.13 [1.01, 1.25] |

Review update 2016: study flow diagram.

Risk of bias summary: review authors' judgements about each risk of bias item for each included study.
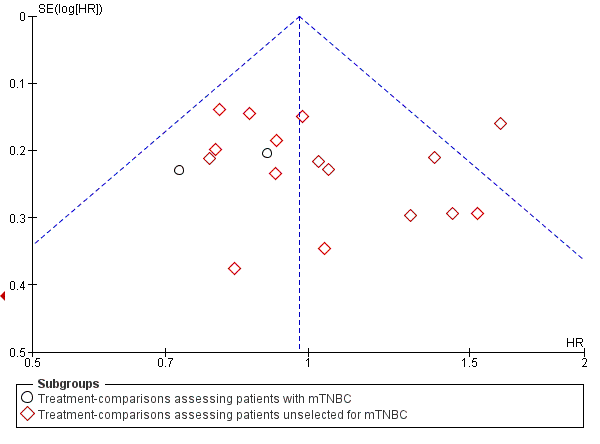
Funnel plot 1: Overall survival (OS). Assessing publication bias and/or small‐study effects. Plot includes all treatment‐comparisons with extractable data for OS. The plot does not show asymmetry (Egger's test P value = 0.98)

Forest plot of comparison: 1 Platinum vs non‐platinum regimens (subgroup analysis 1: by treatment‐comparisons assessing mTNBC), outcome: 1.1 Overall survival.

Forest plot of comparison: 1 Platinum vs non‐platinum regimens (subgroup analysis 1: by treatment‐comparisons assessing mTNBC), outcome: 1.2 Progression‐free survival/time to progression.

Forest plot of comparison: 1 Platinum vs non‐platinum regimens (subgroup analysis 1: by treatment‐comparisons assessing mTNBC), outcome: 1.3 Objective tumour response rate (assessable participants).

Comparison 1 Platinum vs non‐platinum regimens (subgroup analysis 1: by treatment‐comparisons assessing mTNBC), Outcome 1 Overall survival.

Comparison 1 Platinum vs non‐platinum regimens (subgroup analysis 1: by treatment‐comparisons assessing mTNBC), Outcome 2 Progression‐free survival/time to progression.

Comparison 1 Platinum vs non‐platinum regimens (subgroup analysis 1: by treatment‐comparisons assessing mTNBC), Outcome 3 Objective tumour response rate (assessable participants).
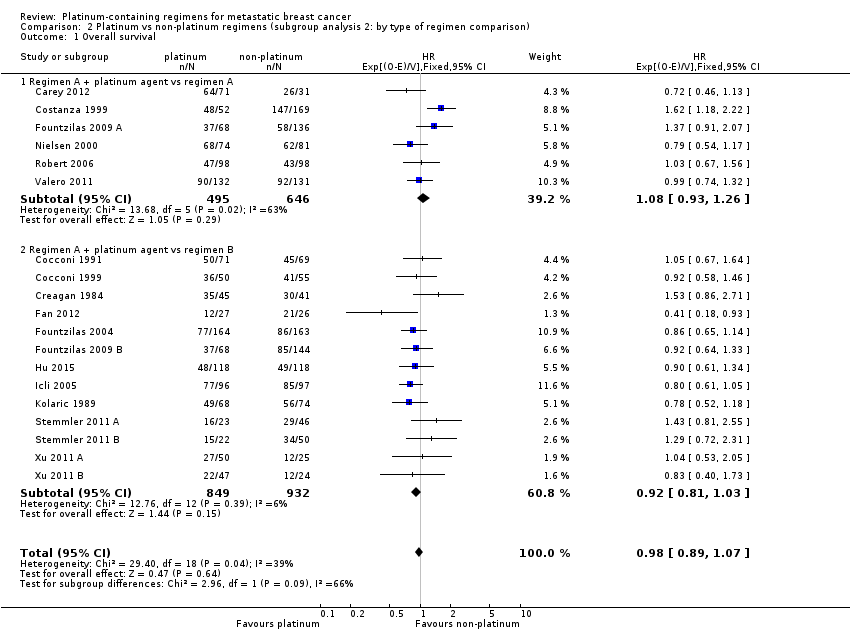
Comparison 2 Platinum vs non‐platinum regimens (subgroup analysis 2: by type of regimen comparison), Outcome 1 Overall survival.

Comparison 2 Platinum vs non‐platinum regimens (subgroup analysis 2: by type of regimen comparison), Outcome 2 Progression‐free survival / time to progression.

Comparison 2 Platinum vs non‐platinum regimens (subgroup analysis 2: by type of regimen comparison), Outcome 3 Objective tumour response rate (assessable participants).
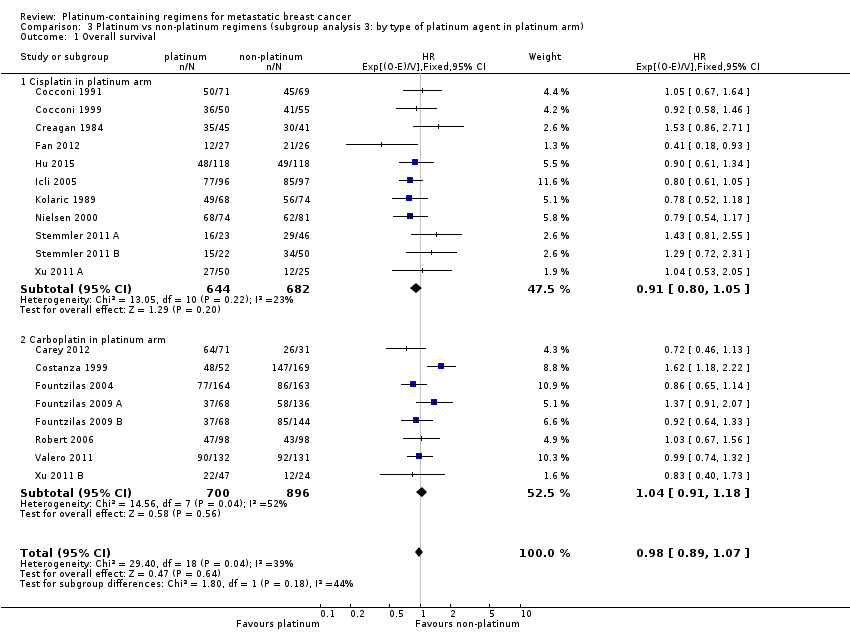
Comparison 3 Platinum vs non‐platinum regimens (subgroup analysis 3: by type of platinum agent in platinum arm), Outcome 1 Overall survival.

Comparison 3 Platinum vs non‐platinum regimens (subgroup analysis 3: by type of platinum agent in platinum arm), Outcome 2 Progression‐free survival/time to progression.

Comparison 3 Platinum vs non‐platinum regimens (subgroup analysis 3: by type of platinum agent in platinum arm), Outcome 3 Objective tumour response rate (assessable participants).
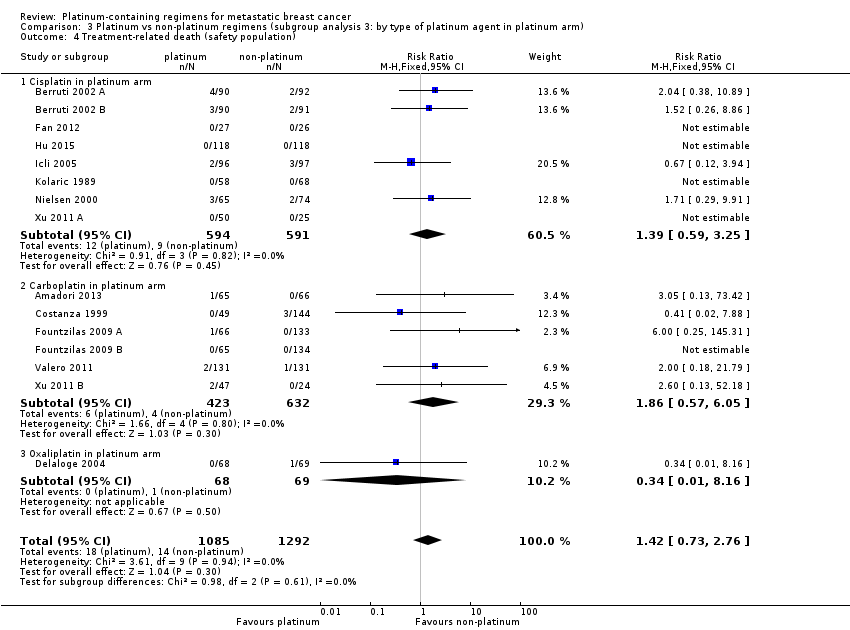
Comparison 3 Platinum vs non‐platinum regimens (subgroup analysis 3: by type of platinum agent in platinum arm), Outcome 4 Treatment‐related death (safety population).

Comparison 3 Platinum vs non‐platinum regimens (subgroup analysis 3: by type of platinum agent in platinum arm), Outcome 5 Nausea/vomiting (safety population).

Comparison 3 Platinum vs non‐platinum regimens (subgroup analysis 3: by type of platinum agent in platinum arm), Outcome 6 Nephrotoxicity (safety population).

Comparison 3 Platinum vs non‐platinum regimens (subgroup analysis 3: by type of platinum agent in platinum arm), Outcome 7 Anaemia (safety population).

Comparison 3 Platinum vs non‐platinum regimens (subgroup analysis 3: by type of platinum agent in platinum arm), Outcome 8 Hair loss (safety population).

Comparison 3 Platinum vs non‐platinum regimens (subgroup analysis 3: by type of platinum agent in platinum arm), Outcome 9 Leukopenia (safety population).
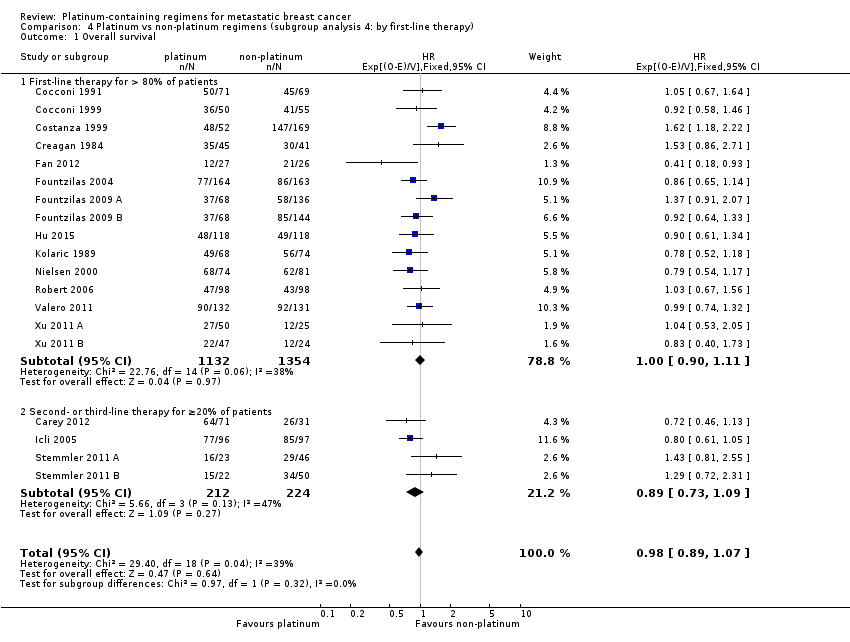
Comparison 4 Platinum vs non‐platinum regimens (subgroup analysis 4: by first‐line therapy), Outcome 1 Overall survival.

Comparison 4 Platinum vs non‐platinum regimens (subgroup analysis 4: by first‐line therapy), Outcome 2 Progression‐free survival/time to progression.

Comparison 4 Platinum vs non‐platinum regimens (subgroup analysis 4: by first‐line therapy), Outcome 3 Objective tumour response rate (assessable participants).

Comparison 5 Platinum vs non‐platinum regimens (subgroup analysis 5 by anthracycline in regimens), Outcome 1 Overall survival.
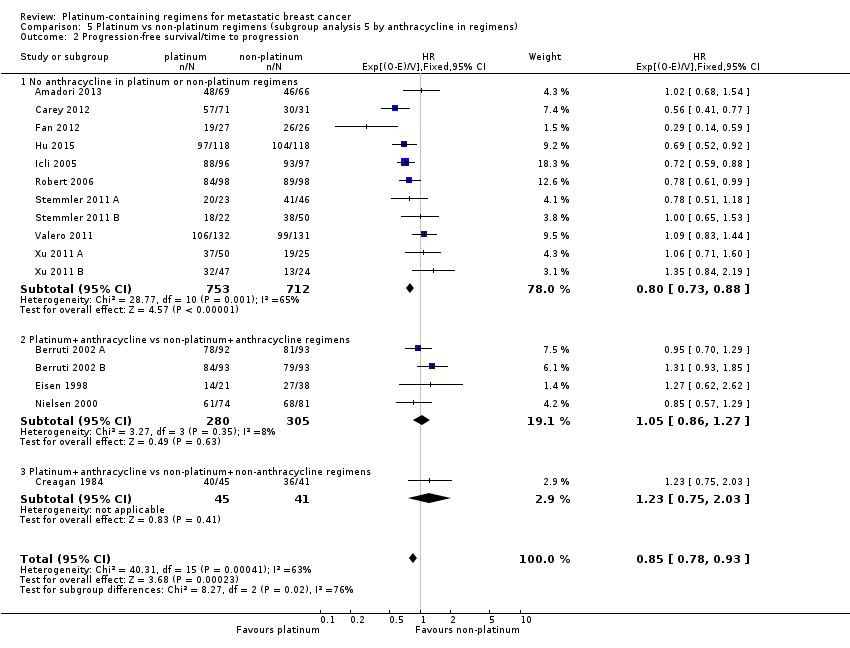
Comparison 5 Platinum vs non‐platinum regimens (subgroup analysis 5 by anthracycline in regimens), Outcome 2 Progression‐free survival/time to progression.

Comparison 5 Platinum vs non‐platinum regimens (subgroup analysis 5 by anthracycline in regimens), Outcome 3 Objective tumour response rate (assessable participants).

Comparison 6 Platinum vs non‐platinum regimens (subgroup analysis 6: by taxane in regimens), Outcome 1 Overall survival.
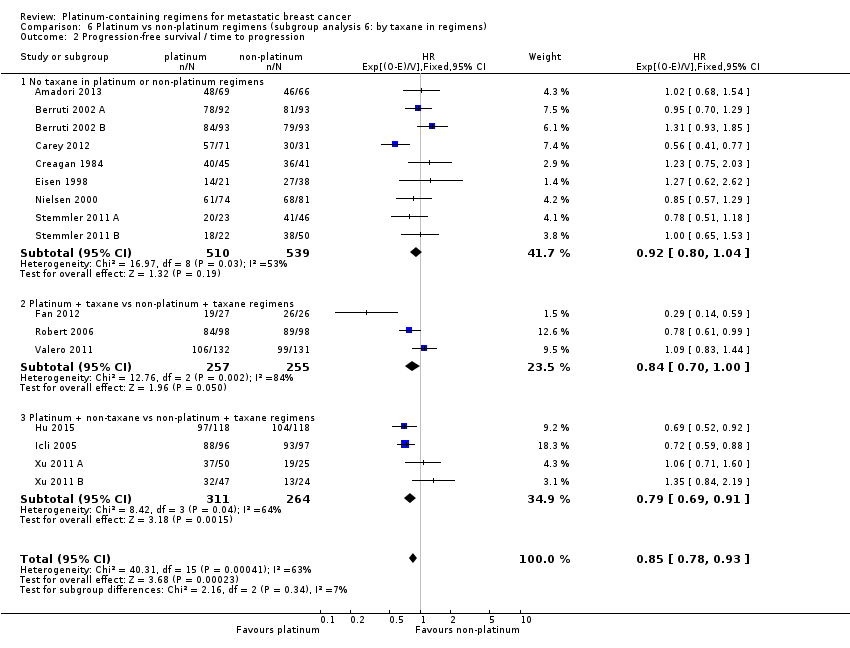
Comparison 6 Platinum vs non‐platinum regimens (subgroup analysis 6: by taxane in regimens), Outcome 2 Progression‐free survival / time to progression.
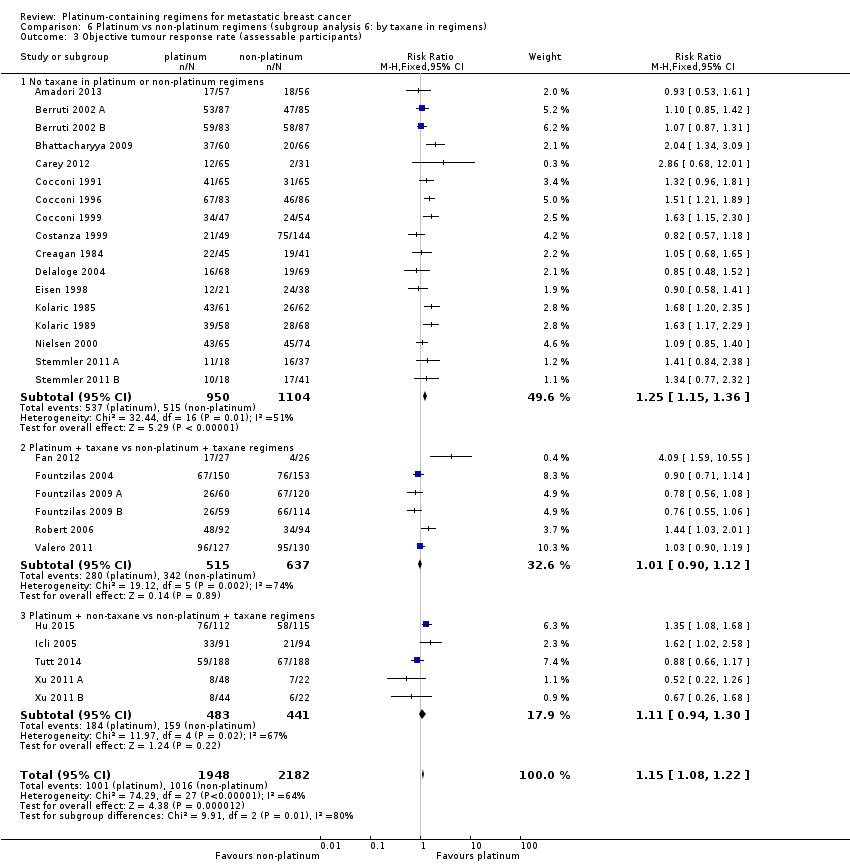
Comparison 6 Platinum vs non‐platinum regimens (subgroup analysis 6: by taxane in regimens), Outcome 3 Objective tumour response rate (assessable participants).

Comparison 7 Platinum vs non‐platinum regimens (subgroup analysis 7: by trastuzumab in regimens), Outcome 1 Overall survival.

Comparison 7 Platinum vs non‐platinum regimens (subgroup analysis 7: by trastuzumab in regimens), Outcome 2 Progression‐free survival/time to progression.

Comparison 7 Platinum vs non‐platinum regimens (subgroup analysis 7: by trastuzumab in regimens), Outcome 3 Objective tumour response rate (assessable participants).

Comparison 8 Platinum vs non‐platinum regimens (sensitivity analysis 1: excluding selected treatment‐comparisons), Outcome 1 Overall survival (restricted to the 12 treatment‐comparisons common to OS and PFS/TTP meta‐analyses).

Comparison 8 Platinum vs non‐platinum regimens (sensitivity analysis 1: excluding selected treatment‐comparisons), Outcome 2 Progression‐free survival/time to progression (restricted to the 12 treatment‐comparisons common to OS and PFS/TTP meta‐analyses).

Comparison 8 Platinum vs non‐platinum regimens (sensitivity analysis 1: excluding selected treatment‐comparisons), Outcome 3 Objective tumour response rate (assessable participants‐ restricted to the 19 treatment‐comparisons in OS meta‐analyses).

Comparison 9 Platinum vs non‐platinum regimens (sensitivity analysis 2: Progression‐free survival vs. time to progression), Outcome 1 Progression‐free survival vs time to progression.

Comparison 10 Platinum vs non‐platinum regimens (sensitivity analysis 3: Analyses 1 repeated but with random effects approach), Outcome 1 Overall survival.

Comparison 10 Platinum vs non‐platinum regimens (sensitivity analysis 3: Analyses 1 repeated but with random effects approach), Outcome 2 Progression‐free survival/time to progression.

Comparison 10 Platinum vs non‐platinum regimens (sensitivity analysis 3: Analyses 1 repeated but with random effects approach), Outcome 3 Objective tumour response rate (assessable participants).
| Platinum compared to non‐platinum chemotherapy regimens for women with metastatic breast cancer unselected for triple‐negative disease | ||||||
| Patient or population: women with metastatic breast cancer unselected for triple‐negative breast cancer (TNBC) | ||||||
| Outcomes | Anticipated absolute effects* (95% CI) | Relative effect | No. of participants (treatment‐ comparisons) | Quality of the evidence | Comments | |
| Risk with non‐platinum chemotherapy regimens | Risk with platinum | |||||
| Overall survival ‐ trials of metastatic breast cancer participants unselected for TNBC | 1‐year risk of death | HR 1.01 | 2531 (16) | ⊕⊕⊕⊕ | Heterogeneity: P = 0.09, I2=34% | |
| 310 per 1,000 1 | 313 per 1,000 | |||||
| 2‐year risk of death | ||||||
| 540 per 1,000 1 | 543 per 1,000 | |||||
| Progression‐free survival/time to progression (randomised participants) ‐ trials of metastatic breast cancer participants unselected for TNBC | 1‐year risk of progression or death | HR 0.92 | 1745 (13) | ⊕⊕⊕⊝ | Heterogeneity: P = 0.08, I2=38% | |
| 737 per 1,000 1 | 707 per 1,000 | |||||
| 2‐year risk of progression or death | ||||||
| 891 per 1,000 1 | 869 per 1,000 | |||||
| Objective tumour response rate (assessable participants) ‐ trials of metastatic breast cancer participants unselected for TNBC | 493 per 1,000 5 | 547 per 1,000 | RR 1.11 | 3252 (23) | ⊕⊕⊝⊝ | Heterogeneity: P = 0.0002, I2=58% |
| *The risk in the intervention group (and its 95% confidence interval) is based on the assumed risk in the comparison group and the relative effect of the intervention (and its 95% CI). | ||||||
| GRADE Working Group grades of evidence | ||||||
| 1 Estimated from the average of non‐platinum group Kaplan‐Meier probabilities from the three highest weighted non‐TNBC treatment‐comparisons for this outcome 2 Estimated as 1000*(1‐S(t)HR) where S(t) is the estimated probability of survival for non‐platinum participants and HR is the pooled hazard ratio (Davies 1998) 3 Quality of evidence for OS was not downgraded for blinding because this outcome is unlikely to be affected by non‐blinding. 4 Downgraded quality of evidence one level for 'indirectness' because this outcome is a surrogate endpoint of questionable validity for assessing the more important outcome of OS in the context of metastatic breast cancer (Burzykowski 2008) 5 Estimated from all 23 non‐TNBC treatment‐comparisons in the review 6 Downgraded quality of evidence one level for 'inconsistency' because there was substantial evidence of heterogeneity across studies (P < 0.05) | ||||||
| Platinum compared to non‐platinum chemotherapy regimens for women with metastatic triple‐negative breast cancer | ||||||
| Patient or population: women with metastatic triple‐negative breast cancer (mTNBC) | ||||||
| Outcomes | Anticipated absolute effects* (95% CI) | Relative effect | No. of participants (treatment‐ comparisons) | Quality of the evidence | Comments | |
| Risk with non‐platinum chemotherapy regimens | Risk with platinum | |||||
| Overall survival ‐ trials of mTNBC participants | 1‐year risk of death | HR 0.75 | 391 (3) | ⊕⊕⊝⊝ | Heterogeneity: P = 0.23, I2 = 32% | |
| 485 per 1,000 1 | 392 per 1,000 | |||||
| 2‐year risk of death | ||||||
| 655 per 1,000 1 | 550 per 1,000 | |||||
| Progression‐free survival/time to progression (randomised participants) ‐ trials of mTNBC participants | 1‐year risk of death | HR 0.59 | 391 (3) | ⊕⊕⊝⊝ | Heterogeneity: P = 0.07, I2 = 67% | |
| 894 per 1,000 1 | 733 per 1,000 | |||||
| 2‐year risk of death | ||||||
| 987 per 1,000 1 | 922 per 1,000 | |||||
| Objective tumour response rate (assessable participants) ‐ trials of mTNBC participants | 354 per 1,0007 | 470 per 1,000 | RR 1.33 | 878 (5) | ⊕⊕⊝⊝ | Heterogeneity: P = 0.0010, I2 = 78% |
| *The risk in the intervention group (and its 95% confidence interval) is based on the assumed risk in the comparison group and the relative effect of the intervention (and its 95% CI). | ||||||
| GRADE Working Group grades of evidence | ||||||
| 1 Estimated from the average of non‐platinum group Kaplan‐Meier probabilities from the three TNBC treatment‐comparisons contributing data for pooling on this outcome 2 Estimated as 1000*(1‐S(t)HR) where S(t) is the estimated probability of survival for non‐platinum participants and HR is the pooled hazard ratio (Davies 1998) 3 Downgraded quality of evidence one level for 'imprecision' because the confidence interval for the pooled estimate is wide and crosses or nearly crosses unity 4 Downgraded quality of evidence one level for 'suspected publication bias' because Tutt 2014 is a large study with 376 participants but has so far only reported median OS/PFS times. As a consequence, the study did not contribute to the pooled HR estimates for OS or PFS/TTP. The reported median OS/PFS times in Tutt 2014 were similar between platinum and non‐platinum regimens. Hence, it seems likely that if HRs from Tutt 2014 were able to be included in pooled HR estimates, these pooled estimates would be considerably closer to the null. 5 Quality of evidence for OS was not downgraded for blinding because this outcome is unlikely to be affected by non‐blinding. 6 Downgraded quality of evidence one level for 'indirectness' because this outcome is a surrogate endpoint of questionable validity for assessing the more important outcome of OS in the context of metastatic breast cancer (Burzykowski 2008) 7Estimated from all five TNBC treatment‐comparisons in the review 8 Downgraded quality of evidence one level for 'inconsistency' because there was substantial evidence of heterogeneity across studies (P < 0.05) | ||||||
| Platinum compared to non‐platinum chemotherapy regimens for nausea/vomiting, anaemia, hair loss and leukopenia | ||||||
| Patient or population: women with metastatic breast cancer | ||||||
| Outcomes | Anticipated absolute effects* (95% CI) | Relative effect | No. of participants (treatment‐ comparisons) | Quality of the evidence | Comments | |
| Risk with non‐platinum chemotherapy regimens | Risk with platinum | |||||
| Nausea/vomiting* grade 3 or 4 (safety population) by type of platinum agent in platinum regimen | Carboplatin | (RR 0.77, 95% CI 0.47 to 1.26) | 1441 (7) | ⊕⊕⊕⊝ | Test for carboplatin/cisplatin subgroup difference: P < 0.0001 Heterogeneity among carboplatin studies: P = 0.30, I2 = 17% Heterogeneity among cisplatin studies: P = 0.010, I2 = 32% | |
| 80 per 1,000 1 | 62 per 1,000 | |||||
| Cisplatin | (RR 2.65, 95% CI 2.10 to 3.34) | 1747 (14) | ⊕⊕⊕⊝ | |||
| 80 per 1,000 1 | 210 per 1,000 | |||||
| Anaemia grade 3 or 4 (safety population) by type of platinum agent in platinum regimen | Carboplatin | (RR 1.72, 95% CI 1.10 to 2.70) | 1441 (7) | ⊕⊕⊕⊕ | Test for carboplatin/cisplatin subgroup difference: P = 0.02 Heterogeneity among carboplatin studies: P = 0.67, I2 = 0% Heterogeneity among cisplatin studies: P = 0.50, I2 = 0% | |
| 33 per 1,000 1 | 57 per 1,000 | |||||
| Cisplatin | (RR 3.72, 95% CI 2.36 to 5.88) | 1644 (13) | ⊕⊕⊕⊕ HIGH | |||
| 33 per 1,000 1 | 123 per 1,000 | |||||
| Hair loss grade 3 or 4 (safety population) | Carboplatin or cisplatin | (RR 1.41, 95% CI 1.26 to 1.58) | 1452 (13) | ⊕⊕⊕⊕ | Test for carboplatin/cisplatin subgroup difference: P = 0.23 Heterogeneity: P = 0.10, I2 = 40% | |
| 264 per 1,000 1 | 372 per 1,000 | |||||
| Leukopenia** grade 3 or 4 (safety population) | Carboplatin or cisplatin | (RR 1.38, 95% CI 1.21 to 1.57) | 3176 (22) | ⊕⊕⊕⊝ | Test for carboplatin/cisplatin subgroup difference: P = 0.22 Heterogeneity: P = 0.0002, I2 = 60% | |
| 179 per 1,000 1 | 247 per 1,000 (217 to 281) | |||||
| *The risk in the intervention group (and its 95% confidence interval) is based on the assumed risk in the comparison group and the relative effect of the intervention (and its 95% CI). | ||||||
| GRADE Working Group grades of evidence | ||||||
| 1 Estimated from all treatment‐comparisons (cisplatin and carboplatin) contributing data for pooling for this outcome 2 Downgraded quality of evidence one level for 'imprecision' because the confidence interval for the pooled estimate is wide and does not rule out 'no effect' 3 Downgraded quality of evidence one level for 'inconsistency' because there was substantial evidence of heterogeneity across studies (P < 0.05) *data on vomiting was included if data on nausea/vomiting was reported separately **data on neutropenia was included if data on leukopenia was not reported | ||||||
| Generic name | Other names |
| Carboplatin | Blastocarb, Carboplat, Carboplatin Hexal, Carboplatino, Carbosin, Carbosol, Carbotec, CBDCA, Displata, Ercar, Nealorin, Novoplatinum, Paraplat, Paraplatin AQ, Paraplatin, Paraplatine, Platinwas, Ribocarbo |
| Cisplatin | Abiplatin, Blastolem, Briplatin,CACP, CDDP, cis‐DDP, cis‐diamminedichloridoplatinum, cis‐diamminedichloro platinum (II), cis‐diamminedichloroplatinum, Cis‐dichloroammine Platinum (II), Cismaplat, Cisplatina, cis‐platinous diamine dichloride, cis‐platinum II diamine dichloride, cis‐platinum II, cis‐platinum, Cisplatyl, Citoplatino, Citosin, CPDD, Cysplatyna, DDP, DDP, Lederplatin, Metaplatin, Neoplatin, PDD, Peyrone's Chloride, Peyrone's Salt, Placis, Platamine, Platiblastin, Platiblastin‐S, Platinex, Platinol‐ AQ, Platinol, Platinol‐AQ VHA Plus, Platinol‐AQ, Platinoxan, platinum diamminodichloride, Platiran, Platistin, Platosin |
| Oxaliplatin | Ai Heng, Aiheng, diaminocyclohexane oxalatoplatinum, oxalatoplatin, oxalatoplatinum, oxaliplatine, Eloxatin, Dacotin, Dacplat, Eloxatine, 1‐OHP, L‐OHP, oxaliplatin medac |
| Type of Agent | Action | Includes |
| Agents that damage the DNA template | by alkylation: nitrogen mustards | cyclophosphamide, melphalan, ifosfamide, chlorambucil |
| by alkylation: nitrosureas | carmustine (BCNU), lomustine (CCNU) | |
| by alkylation: other agents | thiotepa, mitomycin C | |
| by platinum coordination cross‐linking | cisplatin, carboplatin | |
| antibiotics | doxorubicin, daunorubicin, mitoxantrone, idarubicin, epirubicin, amsacrine | |
| podophyllotoxins | etoposide, teniposide | |
| by intercalation | dactinomycin, mithramycin | |
| by uncertain mechanisms | bleomycin | |
| Spindle poisons | vinca alkaloids | vincristine, vinblastine, vendesine, vinorelbine |
| taxanes | taxol, taxotere | |
| Antimetabolites | thymidylate synthase | 5‐fluorouracil |
| dihydrofolate reductase | methotrexate |
| Outcome | ||||
| Subgroup | Treatment‐ comparisons N | Overall survival n (% of N) | Progression ‐free survival/time to progression n (% of N) | Objective response rate n (% of N) |
| Overall: | 28 | 19 (68%) | 16 (57%) | 28 (100%) |
| Type of platinum agent in platinum arm: | ||||
| Cisplatin in platinum arm | 17 | 11 (65%) | 11 (65%) | 17 (100%) |
| Carboplatin in platinum arm | 10 | 8 (80%) | 5 (50%) | 10 (100%) |
| Oxaliplatin in platinum arm | 1 | (0%) | (0%) | 1 (100%) |
| Type of regimen comparison: | ||||
| Regimen A + platinum agent vs regimen A | 9 | 6 (67%) | 6 (67%) | 9 (100%) |
| Regimen A + platinum agent vs regimen B | 18 | 13 (72%) | 10 (56%) | 18 (100%) |
| Single agent platinum vs regimen C | 1 | (0%) | (0%) | 1 (100%) |
| First‐line therapy: | ||||
| First‐line therapy for > 80% of participants | 20 | 15 (75%) | 11 (55%) | 20 (100%) |
| Second‐ or third‐line therapy for ≥ 20% of participants | 8 | 4 (50%) | 5 (63%) | 8 (100%) |
| Participant selection for mTNBC: | ||||
| Participants with mTNBC | 5 | 3 (60%) | 3 (60%) | 5 (100%) |
| Participants unselected for mTNBC | 23 | 16 (70%) | 13 (57%) | 23 (100%) |
| Anthracycline in regimens: | ||||
| No anthracycline in platinum or non‐platinum regimens | 18 | 14 (78%) | 11 (61%) | 18 (100%) |
| Platinum + anthracycline vs non‐platinum + anthracycline regimens | 6 | 3 (50%) | 4 (67%) | 6 (100%) |
| Platinum + anthracycline vs non‐platinum + non‐anthracycline regimens | 4 | 2 (50%) | 1 (25%) | 4 (100%) |
| Taxane in regimens: | ||||
| No taxane in platinum or non‐platinum regimens | 17 | 9 (53%) | 9 (53%) | 17 (100%) |
| Platinum + taxane vs non‐platinum + taxane regimens | 6 | 6 (100%) | 3 (50%) | 6 (100%) |
| Platinum + non‐taxane vs non‐platinum + taxane regimens | 5 | 4 (80%) | 4 (80%) | 5 (100%) |
| Trastuzumab in regimens: | ||||
| No trastuzumab in platinum or non‐platinum regimens | 26 | 17 (65%) | 14 (54%) | 26 (100%) |
| Platinum + trastuzumab vs non‐platinum + trastuzumab regimens | 2 | 2 (100%) | 2 (100%) | 2 (100%) |
| Trials ID | Arm 1 (platinum‐containing) | Arm 2 (control) | First‐line therapy for > 80% of participants | Majority participants anthracycline‐naive |
| Regimen A + platinum vs regimen A | ||||
| Epi + Cis (epirubicin+cisplatin) | Epi (epirubicin) | Y | Y | |
| Epi + Cis + LND (epirubicin+cisplatin+lonidamine) | Epi + LND (epirubicin + lonidamine) | Y | Y | |
| Endoxan 50 mg per day at 10 am and methotrexate 2.5 mg twice a day at 9 am and 5 pm and with 'cisplatinum' | Endoxan 50 mg per day at 10 am and methotrexate 2.5 mg twice a day at 9 am and 5 pm | N | N | |
| C + Cb (Cetuximab + carboplatin) | C (Cetuximab with carboplatin added after progression) | N | N | |
| CBDA + CAF (carboplatin + cycloheximide + doxorubicin + fluorouracil + methotrexate) | CAF (cycloheximide + doxorubicin + fluorouracil) (methotrexate substituted after total doxorubicin ‐ 540 mg) | Y | Unclear | |
| PCb (paclitaxel + carboplatin) | Pw (paclitaxel) | Y | N | |
| Epi + Cis (epirubicin + cisplatin) | Epi (epirubicin) | Y | Y | |
| TPC (trastuzumab + paclitaxel + carboplatin) | TP (trastuzumab + paclitaxel) | Y | Unclear | |
| TCH (trastuzumab + docetaxel + carboplatin) | TH (trastuzumab + docetaxel) | Y | N | |
| Regimen A + platinum vs regimen B | ||||
| (pemetrexed + carboplatin) | (vinorelbine + gemcitabine) | N | N | |
| MPEPIV(a) or MPEMi (b) (a: methotrexate, leucovorin, cisplatin, epirubicin, vincristine; b: methotrexate, leucovorin, cisplatin, etoposide, mitomycin) | CMF (cyclophosphamide, methotrexate, fluorouracil) | Y | Y | |
| Etop + Cis (etoposide + cisplatin) | CMF (cyclophosphamide, methotrexate, fluorouracil) | Y | Unclear | |
| PE + CMF + AL (cisplatin + etoposide + doxorubicin + cyclophosphamide, methotrexate + fluorouracil, lecovorin + allopurinol) | CMF (cyclophosphamide, methotrexate, fluorouracil) | Y | Unclear | |
| CFP + CAP (cyclophosphamide + doxorubicin + cis‐dichlordiammine + CFP) | CFP (cyclophosphamide + fluorouracil + prednisone) | Y | Y | |
| OXA (oxaliplatin + 5‐flurouracil) | VIN (vinorelbine) | N | N | |
| EcisF (5‐flurouracil + epirubicin + cisplatin) | EcycloF (5‐flurouracil + epirubicin + cyclophosphamide) | Y | Y | |
| TP (docetaxel + cisplatin) | TX (docetaxel + capecitabine) | Y | N | |
| Epi + Pcb (epirubicin + carboplatin) | Epi + P (epirubicin + paclitaxel) | Y | Y (54%) | |
| PCb (paclitaxel + carboplatin) | GDoc (docetaxel + gemcitabine) | Y | N | |
| (cisplatin + gemcitabine) | (paclitaxel + gemcitabine) | Y | N | |
| Etop + Cis (etoposide + cisplatin) | P (paclitaxel) | N | N | |
| CAP (cyclophosphamide + doxorubicin + platinum) | CMFVP (cyclophosphamide + methotrexate + 5‐fluorouracil + vincristine + prednisone) | Y | Y | |
| CAP (cyclophosphamide + doxorubicin +platinum) | FAC (5‐flurouracil + doxorubicin + cyclophosphamide) | Y | Y | |
| GemCis (gemcitabine + cisplatin) | GemVin (gemcitabine + vinorelbine) | N | N | |
| GemCis (gemcitabine + cisplatin) | GemCap (gemcitabine + capecitabine) | N | N | |
| GemCis (gemcitabine + cisplatin) | GemPac (gemcitabine + paclitaxel) | Y | N | |
| GemCarb (gemcitabine + carboplatin) | GemPac (gemcitabine + paclitaxel) | Y | N | |
| Single agent platinum vs regimen C | ||||
| C (carboplatin) | D (docetaxel) | N | Unclear | |
| Trial ID | Extractable OS data for HR estimation1 | Median OS time2 | Extractable PFS/TTP data for HR estimation1 | Median PFS/TTP time2 | Overall response | Treatment‐related deaths | Grade III & IV Toxicity | Accrual3 |
| Regimen A + platinum vs regimen A | ||||||||
| NR | Y | Y | Y | Y | Y | Nausea/vomiting Nephrotoxicity Anaemia Leukopenia | 185 | |
| NR | Y | Y | Y | Y | Y | Nausea/vomiting Nephrotoxicity Anaemia Leukopenia | 186 | |
| NR | Y | NR | Y | Y | NR | NR | 126 | |
| Y | Y | Y | NR | Y | NR | Not extractable | 102 | |
| Y | Y | NR | NR | Y | Y | Nausea/vomiting Anaemia Leukopenia | 221 | |
| Y | Y | NR | NR | Y | Y | Nausea/vomiting Anaemia Hair loss Leukopenia | 204 | |
| Y | Y | Y | Y | Y | Y | Nausea/vomiting Leukopenia | 155 | |
| Y | Y | Y | Y | Y | NR | Nausea/vomiting Anaemia Leukopenia | 196 | |
| Y | Y | Y | Y | Y | Y | Nausea/vomiting Anaemia | 263 | |
| Regimen A + platinum vs regimen B | ||||||||
| NR | NR | Y | Y | Y | Y | Leukopenia | 135 | |
| Y | Y | NR | Y | Y | NR | Anaemia Leukopenia | 140 | |
| Y | Y | NR | Y | Y | NR | Nausea/vomiting Anaemia Hair loss Leukopenia | 105 | |
| NR | Y | NR | Y | Y | DU | Not extractable | 169 | |
| Y | Y | Y | Y | Y | NR | Nausea/vomiting Hair loss Leukopenia | 86 | |
| NR | Y | NR | Y | Y | Y | Not extractable | 137 | |
| NR | Y | Y | Y | Y | DU | Nausea/vomiting Anaemia Hair loss Leukopenia | 59 | |
| Y | Y | Y | Y | Y | Y | Nausea/vomiting Anaemia Leukopenia | 53 | |
| Y | NR | NR | NR | Y | NR | Nausea/vomiting Anaemia Leukopenia | 327 | |
| Y | Y | NR | NR | Y | Y | Nausea/vomiting Anaemia Hair loss Leukopenia | 212 | |
| Y | NR | Y | Y | Y | Y | Nausea/vomiting Anaemia Hair loss Leukopenia | 236 | |
| Y | Y | Y | NR | Y | Y | Nausea/vomiting Anaemia Leukopenia | 193 | |
| NR | NR | NR | NR | Y | NR | Nausea/vomiting Nephrotoxicity Anaemia Hair loss Leukopenia | 123 | |
| Y | Y | NR | NR | Y | Y | Nausea/vomiting Anaemia Hair loss Leukopenia | 142 | |
| Y | Y | Y | Y | Y | NR | Nausea/vomiting Anaemia Hair loss Leukopenia | 69 | |
| Y | Y | Y | Y | Y | NR | Nausea/vomiting Anaemia Hair loss Leukopenia | 72 | |
| Y | Y | Y | Y | Y | Y | Nausea/vomiting Nephrotoxicity Anaemia Hair loss Leukopenia | 75 | |
| Y | Y | Y | Y | Y | Y | Nausea/vomiting Nephrotoxicity Anaemia Hair loss Leukopenia | 71 | |
| Single agent platinum vs regimen C | ||||||||
| NR | Y | NR | Y | Y | NR | NR | 376 | |
| 1 Sufficient data reported to estimate a HR for pooling as outlined by Parmar 1998 and Tierney 2007; this includes Kapalan‐Meier curve, HR and standard error/confidence interval or logrank statistics 2 Trials that did not explicitly report median time were classified as NR here regardless of estimable median time from Kaplan‐Meier curve 3 Accrual numbers represent the maximum numbers of participants in the trial (not study) that were included in the analyses of OS, PFS/TTP or OR (assessable participants). *NR = not reported, DU = deaths unexplained, Y = data reported. | ||||||||
| Outcome or subgroup title | No. of studies | No. of participants | Statistical method | Effect size |
| 1 Overall survival Show forest plot | 19 | 2922 | HR (95% CI) | 0.98 [0.89, 1.07] |
| 1.1 Treatment‐comparisons assessing patients with mTNBC | 3 | 391 | HR (95% CI) | 0.75 [0.57, 1.00] |
| 1.2 Treatment‐comparisons assessing patients unselected for mTNBC | 16 | 2531 | HR (95% CI) | 1.01 [0.92, 1.12] |
| 2 Progression‐free survival/time to progression Show forest plot | 16 | 2136 | HR (95% CI) | 0.85 [0.78, 0.93] |
| 2.1 Treatment‐comparisons assessing patients with mTNBC | 3 | 391 | HR (95% CI) | 0.59 [0.49, 0.72] |
| 2.2 Treatment‐comparisons assessing patients unselected for mTNBC | 13 | 1745 | HR (95% CI) | 0.92 [0.84, 1.01] |
| 3 Objective tumour response rate (assessable participants) Show forest plot | 28 | 4130 | Risk Ratio (M‐H, Fixed, 95% CI) | 1.15 [1.08, 1.22] |
| 3.1 Treatment‐comparisons assessing patients with mTNBC | 5 | 878 | Risk Ratio (M‐H, Fixed, 95% CI) | 1.33 [1.13, 1.56] |
| 3.2 Treatment‐comparisons assessing patients unselected for mTNBC | 23 | 3252 | Risk Ratio (M‐H, Fixed, 95% CI) | 1.11 [1.04, 1.19] |
| Outcome or subgroup title | No. of studies | No. of participants | Statistical method | Effect size |
| 1 Overall survival Show forest plot | 19 | 2922 | HR (95% CI) | 0.98 [0.89, 1.07] |
| 1.1 Regimen A + platinum agent vs regimen A | 6 | 1141 | HR (95% CI) | 1.08 [0.93, 1.26] |
| 1.2 Regimen A + platinum agent vs regimen B | 13 | 1781 | HR (95% CI) | 0.92 [0.81, 1.03] |
| 2 Progression‐free survival / time to progression Show forest plot | 16 | 2136 | HR (95% CI) | 0.85 [0.78, 0.93] |
| 2.1 Regimen A+platinum agent vs regimen A | 6 | 1087 | HR (95% CI) | 0.88 [0.78, 1.00] |
| 2.2 Regimen A+platinum agent vs regimen B | 10 | 1049 | HR (95% CI) | 0.83 [0.74, 0.93] |
| 3 Objective tumour response rate (assessable participants) Show forest plot | 28 | 4130 | Risk Ratio (M‐H, Fixed, 95% CI) | 1.15 [1.08, 1.22] |
| 3.1 Regimen A + platinum agent vs regimen A | 9 | 1519 | Risk Ratio (M‐H, Fixed, 95% CI) | 1.10 [1.01, 1.21] |
| 3.2 Regimen A + platinum agent vs regimen B | 18 | 2235 | Risk Ratio (M‐H, Fixed, 95% CI) | 1.22 [1.12, 1.33] |
| 3.3 Single agent platinum vs regimen C | 1 | 376 | Risk Ratio (M‐H, Fixed, 95% CI) | 0.88 [0.66, 1.17] |
| Outcome or subgroup title | No. of studies | No. of participants | Statistical method | Effect size |
| 1 Overall survival Show forest plot | 19 | 2922 | HR (95% CI) | 0.98 [0.89, 1.07] |
| 1.1 Cisplatin in platinum arm | 11 | 1326 | HR (95% CI) | 0.91 [0.80, 1.05] |
| 1.2 Carboplatin in platinum arm | 8 | 1596 | HR (95% CI) | 1.04 [0.91, 1.18] |
| 2 Progression‐free survival/time to progression Show forest plot | 16 | 2136 | HR (95% CI) | 0.85 [0.78, 0.93] |
| 2.1 Cisplatin in platinum arm | 11 | 1369 | HR (95% CI) | 0.85 [0.76, 0.94] |
| 2.2 Carboplatin in platinum arm | 5 | 767 | HR (95% CI) | 0.86 [0.75, 0.99] |
| 3 Objective tumour response rate (assessable participants) Show forest plot | 28 | 4130 | Risk Ratio (M‐H, Fixed, 95% CI) | 1.15 [1.08, 1.22] |
| 3.1 Cisplatin in platinum arm | 17 | 2050 | Risk Ratio (M‐H, Fixed, 95% CI) | 1.35 [1.24, 1.46] |
| 3.2 Carboplatin in platinum arm | 10 | 1943 | Risk Ratio (M‐H, Fixed, 95% CI) | 0.94 [0.86, 1.04] |
| 3.3 Oxaliplatin in platinum arm | 1 | 137 | Risk Ratio (M‐H, Fixed, 95% CI) | 0.85 [0.48, 1.52] |
| 4 Treatment‐related death (safety population) Show forest plot | 15 | 2377 | Risk Ratio (M‐H, Fixed, 95% CI) | 1.42 [0.73, 2.76] |
| 4.1 Cisplatin in platinum arm | 8 | 1185 | Risk Ratio (M‐H, Fixed, 95% CI) | 1.39 [0.59, 3.25] |
| 4.2 Carboplatin in platinum arm | 6 | 1055 | Risk Ratio (M‐H, Fixed, 95% CI) | 1.86 [0.57, 6.05] |
| 4.3 Oxaliplatin in platinum arm | 1 | 137 | Risk Ratio (M‐H, Fixed, 95% CI) | 0.34 [0.01, 8.16] |
| 5 Nausea/vomiting (safety population) Show forest plot | 21 | 3172 | Risk Ratio (M‐H, Fixed, 95% CI) | 2.07 [1.69, 2.54] |
| 5.1 Cisplatin in platinum arm | 14 | 1731 | Risk Ratio (M‐H, Fixed, 95% CI) | 2.65 [2.10, 3.34] |
| 5.2 Carboplatin in platinum arm | 7 | 1441 | Risk Ratio (M‐H, Fixed, 95% CI) | 0.77 [0.47, 1.26] |
| 6 Nephrotoxicity (safety population) Show forest plot | 5 | 632 | Risk Ratio (M‐H, Fixed, 95% CI) | 3.06 [0.86, 10.84] |
| 6.1 Cisplatin in platinum arm | 4 | 561 | Risk Ratio (M‐H, Fixed, 95% CI) | 3.46 [0.86, 13.97] |
| 6.2 Carboplatin in platinum arm | 1 | 71 | Risk Ratio (M‐H, Fixed, 95% CI) | 1.56 [0.07, 36.97] |
| 7 Anaemia (safety population) Show forest plot | 20 | 3085 | Risk Ratio (M‐H, Fixed, 95% CI) | 2.61 [1.90, 3.58] |
| 7.1 Cisplatin in platinum arm | 13 | 1644 | Risk Ratio (M‐H, Fixed, 95% CI) | 3.72 [2.36, 5.88] |
| 7.2 Carboplatin in platinum arm | 7 | 1441 | Risk Ratio (M‐H, Fixed, 95% CI) | 1.72 [1.10, 2.70] |
| 8 Hair loss (safety population) Show forest plot | 12 | 1452 | Risk Ratio (M‐H, Fixed, 95% CI) | 1.41 [1.26, 1.58] |
| 8.1 Cisplatin in platinum arm | 9 | 983 | Risk Ratio (M‐H, Fixed, 95% CI) | 1.33 [1.15, 1.54] |
| 8.2 Carboplatin in platinum arm | 3 | 469 | Risk Ratio (M‐H, Fixed, 95% CI) | 1.53 [1.28, 1.84] |
| 9 Leukopenia (safety population) Show forest plot | 22 | 3176 | Risk Ratio (M‐H, Fixed, 95% CI) | 1.38 [1.21, 1.57] |
| 9.1 Cisplatin in platinum arm | 15 | 1866 | Risk Ratio (M‐H, Fixed, 95% CI) | 1.49 [1.23, 1.81] |
| 9.2 Carboplatin in platinum arm | 7 | 1310 | Risk Ratio (M‐H, Fixed, 95% CI) | 1.27 [1.07, 1.50] |
| Outcome or subgroup title | No. of studies | No. of participants | Statistical method | Effect size |
| 1 Overall survival Show forest plot | 19 | 2922 | HR (95% CI) | 0.98 [0.89, 1.07] |
| 1.1 First‐line therapy for > 80% of patients | 15 | 2486 | HR (95% CI) | 1.00 [0.90, 1.11] |
| 1.2 Second‐ or third‐line therapy for ≥20% of patients | 4 | 436 | HR (95% CI) | 0.89 [0.73, 1.09] |
| 2 Progression‐free survival/time to progression Show forest plot | 16 | 2136 | HR (95% CI) | 0.85 [0.78, 0.93] |
| 2.1 First‐line therapy for > 80% of patients | 11 | 1565 | HR (95% CI) | 0.93 [0.83, 1.03] |
| 2.2 Second‐ or third‐line therapy for ≥20% of patients | 5 | 571 | HR (95% CI) | 0.75 [0.65, 0.86] |
| 3 Objective tumour response rate (assessable participants) Show forest plot | 28 | 4130 | Risk Ratio (M‐H, Fixed, 95% CI) | 1.15 [1.08, 1.22] |
| 3.1 First‐line therapy for > 80% of patients | 20 | 2983 | Risk Ratio (M‐H, Fixed, 95% CI) | 1.14 [1.06, 1.21] |
| 3.2 Second‐ or third‐line therapy for ≥20% of patients | 8 | 1147 | Risk Ratio (M‐H, Fixed, 95% CI) | 1.20 [1.02, 1.42] |
| Outcome or subgroup title | No. of studies | No. of participants | Statistical method | Effect size |
| 1 Overall survival Show forest plot | 19 | 2922 | HR (95% CI) | 0.98 [0.89, 1.07] |
| 1.1 No anthracycline in platinum or non‐platinum regimens | 14 | 2213 | HR (95% CI) | 0.94 [0.84, 1.05] |
| 1.2 Platinum + anthracycline vs non‐platinum + anthracycline regimens | 3 | 518 | HR (95% CI) | 1.09 [0.88, 1.34] |
| 1.3 Platinum + anthracycline vs non‐platinum + non‐anthracycline regimens | 2 | 191 | HR (95% CI) | 1.12 [0.78, 1.60] |
| 2 Progression‐free survival/time to progression Show forest plot | 16 | 2136 | HR (95% CI) | 0.85 [0.78, 0.93] |
| 2.1 No anthracycline in platinum or non‐platinum regimens | 11 | 1465 | HR (95% CI) | 0.80 [0.73, 0.88] |
| 2.2 Platinum+anthracycline vs non‐platinum+anthracycline regimens | 4 | 585 | HR (95% CI) | 1.05 [0.86, 1.27] |
| 2.3 Platinum+anthracycline vs non‐platinum+non‐anthracycline regimens | 1 | 86 | HR (95% CI) | 1.23 [0.75, 2.03] |
| 3 Objective tumour response rate (assessable participants) Show forest plot | 28 | 4130 | Risk Ratio (M‐H, Fixed, 95% CI) | 1.15 [1.08, 1.22] |
| 3.1 No anthracycline in platinum or non‐platinum regimens | 18 | 2792 | Risk Ratio (M‐H, Fixed, 95% CI) | 1.10 [1.02, 1.20] |
| 3.2 Platinum+anthracycline vs non‐platinum+anthracycline regimens | 6 | 859 | Risk Ratio (M‐H, Fixed, 95% CI) | 1.09 [0.97, 1.22] |
| 3.3 Platinum+anthracycline vs non‐platinum+non‐anthracycline regimens | 4 | 479 | Risk Ratio (M‐H, Fixed, 95% CI) | 1.49 [1.28, 1.74] |
| Outcome or subgroup title | No. of studies | No. of participants | Statistical method | Effect size |
| 1 Overall survival Show forest plot | 19 | 2922 | HR (95% CI) | 0.98 [0.89, 1.07] |
| 1.1 No taxane in platinum or non‐platinum regimens | 9 | 1092 | HR (95% CI) | 1.07 [0.93, 1.24] |
| 1.2 Platinum + taxane vs non‐platinum + taxane regimens | 6 | 1255 | HR (95% CI) | 0.96 [0.82, 1.11] |
| 1.3 Platinum + non‐taxane vs non‐platinum + taxane regimens | 4 | 575 | HR (95% CI) | 0.85 [0.69, 1.04] |
| 2 Progression‐free survival / time to progression Show forest plot | 16 | 2136 | HR (95% CI) | 0.85 [0.78, 0.93] |
| 2.1 No taxane in platinum or non‐platinum regimens | 9 | 1049 | HR (95% CI) | 0.92 [0.80, 1.04] |
| 2.2 Platinum + taxane vs non‐platinum + taxane regimens | 3 | 512 | HR (95% CI) | 0.84 [0.70, 1.00] |
| 2.3 Platinum + non‐taxane vs non‐platinum + taxane regimens | 4 | 575 | HR (95% CI) | 0.79 [0.69, 0.91] |
| 3 Objective tumour response rate (assessable participants) Show forest plot | 28 | 4130 | Risk Ratio (M‐H, Fixed, 95% CI) | 1.15 [1.08, 1.22] |
| 3.1 No taxane in platinum or non‐platinum regimens | 17 | 2054 | Risk Ratio (M‐H, Fixed, 95% CI) | 1.25 [1.15, 1.36] |
| 3.2 Platinum + taxane vs non‐platinum + taxane regimens | 6 | 1152 | Risk Ratio (M‐H, Fixed, 95% CI) | 1.01 [0.90, 1.12] |
| 3.3 Platinum + non‐taxane vs non‐platinum + taxane regimens | 5 | 924 | Risk Ratio (M‐H, Fixed, 95% CI) | 1.11 [0.94, 1.30] |
| Outcome or subgroup title | No. of studies | No. of participants | Statistical method | Effect size |
| 1 Overall survival Show forest plot | 19 | 2922 | HR (95% CI) | 0.98 [0.89, 1.07] |
| 1.1 No trastuzumab in platinum or non‐platinum regimens | 17 | 2463 | HR (95% CI) | 0.97 [0.88, 1.08] |
| 1.2 Platinum + trastuzumab vs non‐platinum + trastuzumab regimens | 2 | 459 | HR (95% CI) | 1.00 [0.79, 1.27] |
| 2 Progression‐free survival/time to progression Show forest plot | 16 | 2136 | HR (95% CI) | 0.85 [0.78, 0.93] |
| 2.1 No trastuzumab in platinum or non‐platinum regimens | 14 | 1677 | HR (95% CI) | 0.84 [0.76, 0.92] |
| 2.2 Platinum+trastuzumab vs non‐platinum+trastuzumab regimens | 2 | 459 | HR (95% CI) | 0.90 [0.75, 1.08] |
| 3 Objective tumour response rate (assessable participants) Show forest plot | 28 | 4130 | Risk Ratio (M‐H, Fixed, 95% CI) | 1.15 [1.08, 1.22] |
| 3.1 No trastuzumab in platinum or non‐platinum regimens | 26 | 3687 | Risk Ratio (M‐H, Fixed, 95% CI) | 1.15 [1.07, 1.23] |
| 3.2 Platinum+trastuzumab vs non‐platinum+trastuzumab regimens | 2 | 443 | Risk Ratio (M‐H, Fixed, 95% CI) | 1.14 [0.99, 1.31] |
| Outcome or subgroup title | No. of studies | No. of participants | Statistical method | Effect size |
| 1 Overall survival (restricted to the 12 treatment‐comparisons common to OS and PFS/TTP meta‐analyses) Show forest plot | 12 | 1571 | HR (95% CI) | 0.92 [0.81, 1.04] |
| 2 Progression‐free survival/time to progression (restricted to the 12 treatment‐comparisons common to OS and PFS/TTP meta‐analyses) Show forest plot | 12 | 1571 | HR (95% CI) | 0.80 [0.73, 0.88] |
| 3 Objective tumour response rate (assessable participants‐ restricted to the 19 treatment‐comparisons in OS meta‐analyses) Show forest plot | 19 | 2685 | Risk Ratio (M‐H, Fixed, 95% CI) | 1.13 [1.05, 1.22] |
| Outcome or subgroup title | No. of studies | No. of participants | Statistical method | Effect size |
| 1 Progression‐free survival vs time to progression Show forest plot | 16 | 2136 | HR (95% CI) | 0.85 [0.78, 0.93] |
| 1.1 Progression‐free survival | 9 | 1324 | HR (95% CI) | 0.92 [0.82, 1.03] |
| 1.2 Time to progression | 7 | 812 | HR (95% CI) | 0.78 [0.69, 0.88] |
| Outcome or subgroup title | No. of studies | No. of participants | Statistical method | Effect size |
| 1 Overall survival Show forest plot | 19 | Hazard Ratio (Random, 95% CI) | 0.98 [0.87, 1.11] | |
| 1.1 Treatment‐comparisons assessing patients with mTNBC | 3 | Hazard Ratio (Random, 95% CI) | 0.73 [0.51, 1.04] | |
| 1.2 Treatment‐comparisons assessing patients unselected for mTNBC | 16 | Hazard Ratio (Random, 95% CI) | 1.02 [0.90, 1.16] | |
| 2 Progression‐free survival/time to progression Show forest plot | 16 | Hazard Ratio (Random, 95% CI) | 0.88 [0.76, 1.02] | |
| 2.1 Treatment‐comparisons assessing patients with mTNBC | 3 | Hazard Ratio (Random, 95% CI) | 0.55 [0.38, 0.78] | |
| 2.2 Treatment‐comparisons assessing patients unselected for mTNBC | 13 | Hazard Ratio (Random, 95% CI) | 0.96 [0.85, 1.09] | |
| 3 Objective tumour response rate (assessable participants) Show forest plot | 28 | 4130 | Risk Ratio (M‐H, Random, 95% CI) | 1.17 [1.05, 1.30] |
| 3.1 Treatment‐comparisons assessing patients with mTNBC | 5 | 878 | Risk Ratio (M‐H, Random, 95% CI) | 1.60 [1.04, 2.45] |
| 3.2 Treatment‐comparisons assessing patients unselected for mTNBC | 23 | 3252 | Risk Ratio (M‐H, Random, 95% CI) | 1.13 [1.01, 1.25] |