Inmunoglobulina para la enfermedad hemolítica aloinmune en los recién nacidos
Información
- DOI:
- https://doi.org/10.1002/14651858.CD003313.pub2Copiar DOI

- Base de datos:
-
- Cochrane Database of Systematic Reviews
- Versión publicada:
-
- 18 marzo 2018see what's new
- Tipo:
-
- Intervention
- Etapa:
-
- Review
- Grupo Editorial Cochrane:
-
Grupo Cochrane de Neonatología
- Copyright:
-
- Copyright © 2018 The Cochrane Collaboration. Published by John Wiley & Sons, Ltd.
Cifras del artículo
Altmetric:
Citado por:
Autores
Contributions of authors
Mirjam Rath wrote the protocol for the review. She also performed part of the literature search, assessed study methodology, extracted relevant data from included studies and contacted authors for any additional information required. She wrote a first version of the text of the review.
Carolien Zwiers updated the literature review, led the re‐evaluation of included studies, and extensively revised all analyses and the text of the review, including updating of references in 'Background' and 'Discussion' sessions.
Helen Liley, Enrico Lopriore and Masja de Haas assisted in adapting the protocol and writing the review.
Helen Liley independently assessed study methodology and extracted data from included studies.
Enrico Lopriore was the third blinded review author.
Helen Liley and Carolien Zwiers performed the GRADE analysis of quality of evidence.
Declarations of interest
CZ: none.
MR: none.
EL: none.
MH: none.
HL: none.
Acknowledgements
Gary Alcock for writing the original protocol and review.
Gürbey Ocak for his help in translating the Turkish article.
David Corpman for translating two Chinese articles and Wenjun Nie for translating the third.
Jan Schoones for his help in making and performing the literature search.
Lizelle Weber for contributions to the literature search.
Vivianne Smits‐Wintjens for advice to Mirjam Rath on initial assessment of risk of bias in included and excluded studies
Version history
| Published | Title | Stage | Authors | Version |
| 2018 Mar 18 | Immunoglobulin for alloimmune hemolytic disease in neonates | Review | Carolien Zwiers, Mirjam EA Scheffer‐Rath, Enrico Lopriore, Masja de Haas, Helen G Liley | |
| 2002 Jul 22 | Immunoglobulin infusion for isoimmune haemolytic jaundice in neonates | Review | Gary S Alcock, Helen Liley | |
Differences between protocol and review
In addition to analysis of all included studies, analyses were performed of all placebo‐controlled studies. The search method, inclusion criteria and criteria to measure risk of bias were more extensively described in the review than in the protocol.
For the 2017 update, we updated the search and included seven new studies. We updated the background to include contemporary literature. The eligible participants were further specified (from "Neonates with isoimmune hemolytic disease" to "Neonates with alloimmune HDN due to either Rh or ABO blood group antibodies with or without any other blood group antibodies." The primary and secondary outcomes were adjusted to more relevant outcomes in the current era. Previously, the subgroup analysis for timing of IVIg treatment was divided in 'prophylactic use' and 'treatment of established jaundice'. For the current review, this was changed to within 12 hours of life or later. Due to the lack of definitions and the possibility of incomplete reporting in regard to adverse events, the adverse events of individual trials were stated in the current review, rather than combined raw outcomes of all included studies.
A sensitivity analysis for risk of performance or detection bias (or both) was added. Furthermore, we incorporated the GRADE criteria and added a 'Summary of findings' table for the most important outcomes.
Keywords
MeSH
Medical Subject Headings (MeSH) Keywords
Medical Subject Headings Check Words
Humans; Infant, Newborn;
PICO
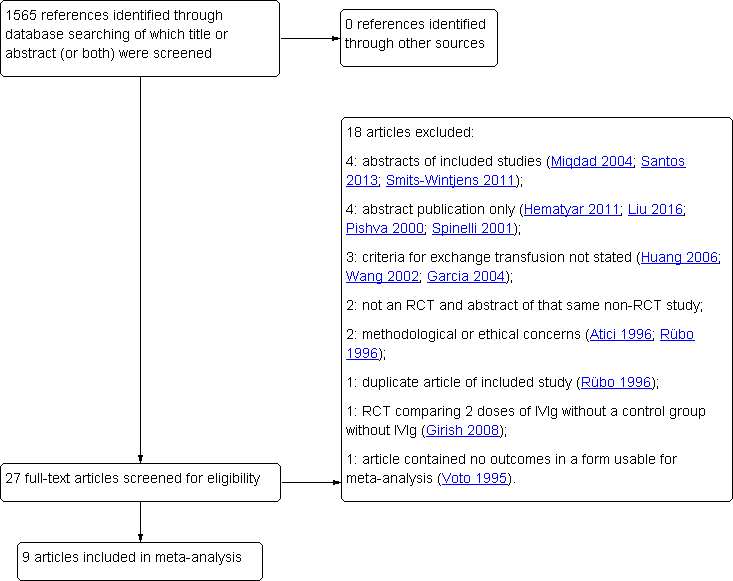
Flow diagram of study selection process. IVIg: intravenous immunoglobulin; RCT: randomized controlled trial.
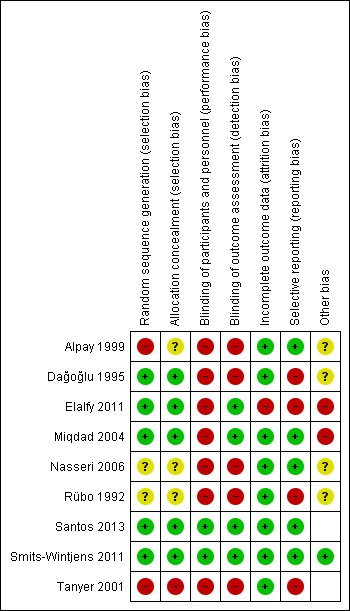
Risk of bias summary: review authors' judgments about each risk of bias item for each included study.

Comparison 1 Intravenous immunoglobulin plus phototherapy versus phototherapy, Outcome 1 Use of exchange transfusion (≥ 1).

Comparison 1 Intravenous immunoglobulin plus phototherapy versus phototherapy, Outcome 2 Exchange transfusions per infant, by study quality.

Comparison 1 Intravenous immunoglobulin plus phototherapy versus phototherapy, Outcome 3 Use of top‐up transfusion in 1st week by study quality.
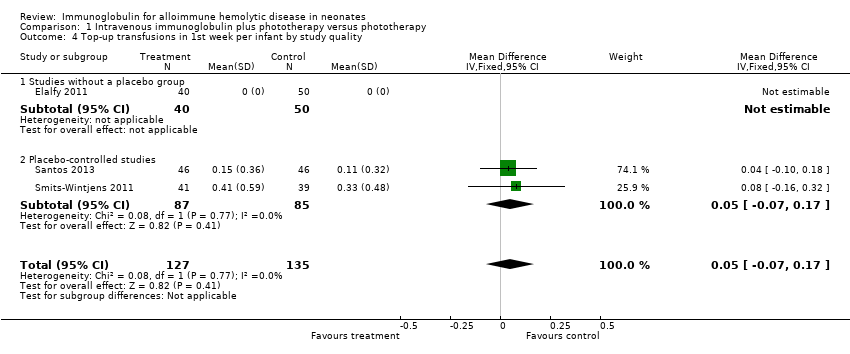
Comparison 1 Intravenous immunoglobulin plus phototherapy versus phototherapy, Outcome 4 Top‐up transfusions in 1st week per infant by study quality.
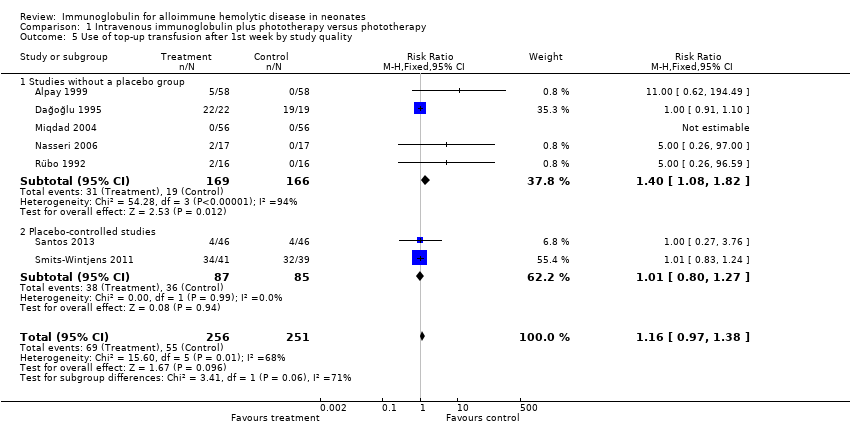
Comparison 1 Intravenous immunoglobulin plus phototherapy versus phototherapy, Outcome 5 Use of top‐up transfusion after 1st week by study quality.

Comparison 1 Intravenous immunoglobulin plus phototherapy versus phototherapy, Outcome 6 Top‐up transfusions after first week per infant, by study quality.

Comparison 1 Intravenous immunoglobulin plus phototherapy versus phototherapy, Outcome 7 Maximum total serum bilirubin (µmol/L) by study quality.

Comparison 1 Intravenous immunoglobulin plus phototherapy versus phototherapy, Outcome 8 Duration of phototherapy (days) by study quality.
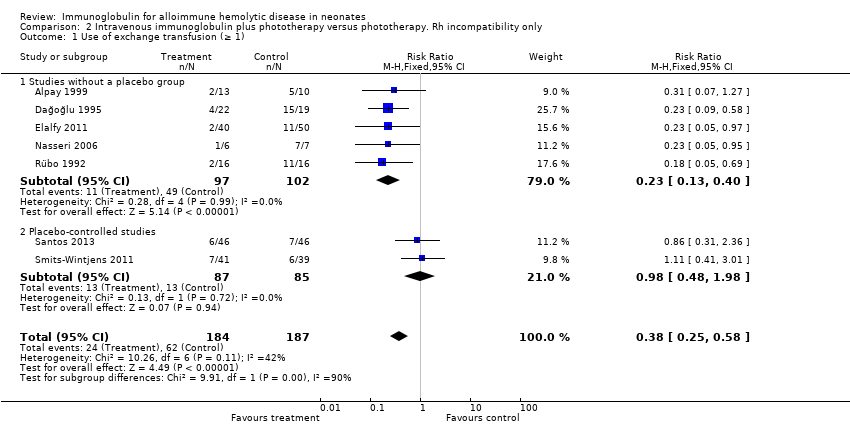
Comparison 2 Intravenous immunoglobulin plus phototherapy versus phototherapy. Rh incompatibility only, Outcome 1 Use of exchange transfusion (≥ 1).

Comparison 2 Intravenous immunoglobulin plus phototherapy versus phototherapy. Rh incompatibility only, Outcome 2 Exchange transfusions per infant.
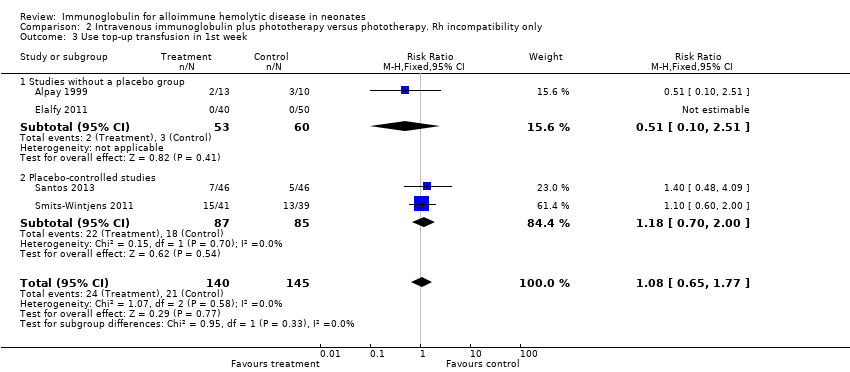
Comparison 2 Intravenous immunoglobulin plus phototherapy versus phototherapy. Rh incompatibility only, Outcome 3 Use top‐up transfusion in 1st week.

Comparison 2 Intravenous immunoglobulin plus phototherapy versus phototherapy. Rh incompatibility only, Outcome 4 Top‐up transfusions in 1st week per infant.
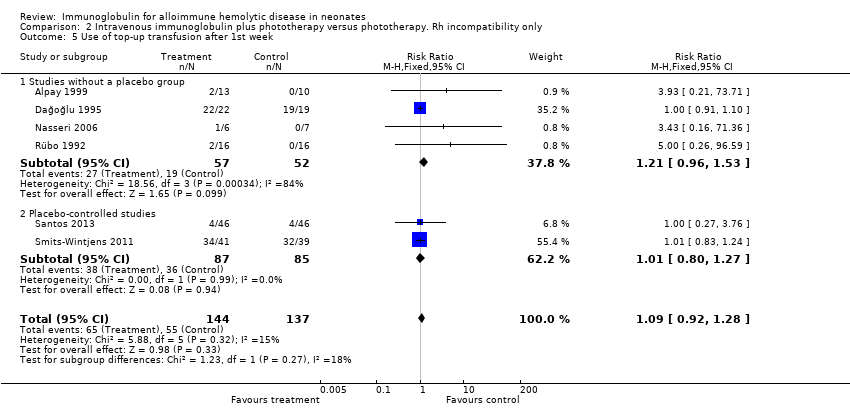
Comparison 2 Intravenous immunoglobulin plus phototherapy versus phototherapy. Rh incompatibility only, Outcome 5 Use of top‐up transfusion after 1st week.

Comparison 2 Intravenous immunoglobulin plus phototherapy versus phototherapy. Rh incompatibility only, Outcome 6 Top‐up transfusions after 1st week per infant.
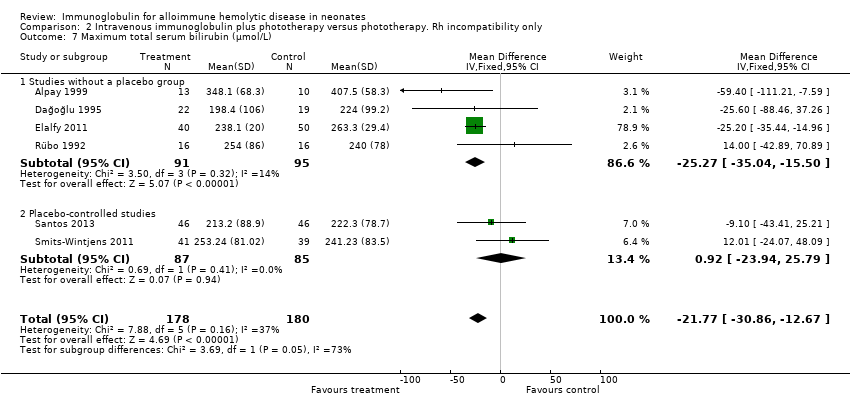
Comparison 2 Intravenous immunoglobulin plus phototherapy versus phototherapy. Rh incompatibility only, Outcome 7 Maximum total serum bilirubin (µmol/L).

Comparison 2 Intravenous immunoglobulin plus phototherapy versus phototherapy. Rh incompatibility only, Outcome 8 Duration of phototherapy (days).

Comparison 3 Intravenous immunoglobulin (IVIg) plus phototherapy versus phototherapy. IVIg administration ≤ 12 hours after birth, Outcome 1 Use of exchange transfusion (≥ 1).

Comparison 3 Intravenous immunoglobulin (IVIg) plus phototherapy versus phototherapy. IVIg administration ≤ 12 hours after birth, Outcome 2 Exchange transfusions per infant.
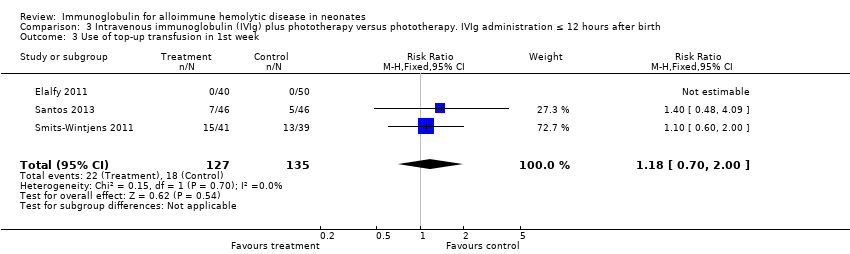
Comparison 3 Intravenous immunoglobulin (IVIg) plus phototherapy versus phototherapy. IVIg administration ≤ 12 hours after birth, Outcome 3 Use of top‐up transfusion in 1st week.
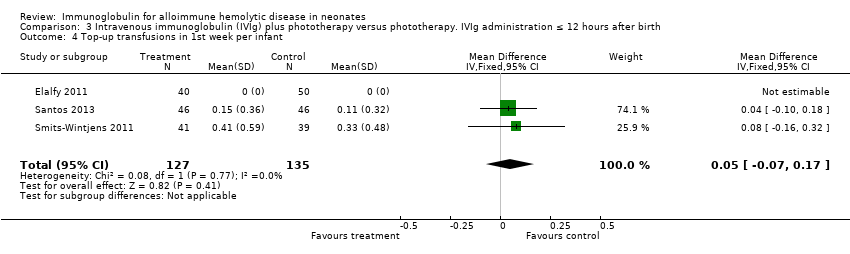
Comparison 3 Intravenous immunoglobulin (IVIg) plus phototherapy versus phototherapy. IVIg administration ≤ 12 hours after birth, Outcome 4 Top‐up transfusions in 1st week per infant.

Comparison 3 Intravenous immunoglobulin (IVIg) plus phototherapy versus phototherapy. IVIg administration ≤ 12 hours after birth, Outcome 5 Use of top‐up transfusions after 1st week.

Comparison 3 Intravenous immunoglobulin (IVIg) plus phototherapy versus phototherapy. IVIg administration ≤ 12 hours after birth, Outcome 6 Top‐up transfusions after 1st week per infant.
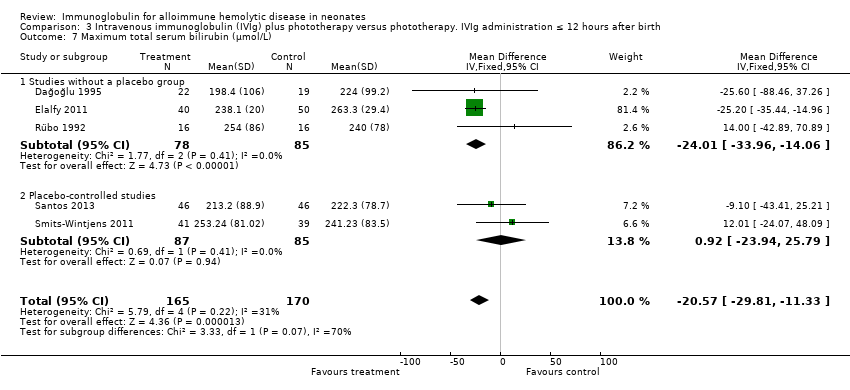
Comparison 3 Intravenous immunoglobulin (IVIg) plus phototherapy versus phototherapy. IVIg administration ≤ 12 hours after birth, Outcome 7 Maximum total serum bilirubin (µmol/L).
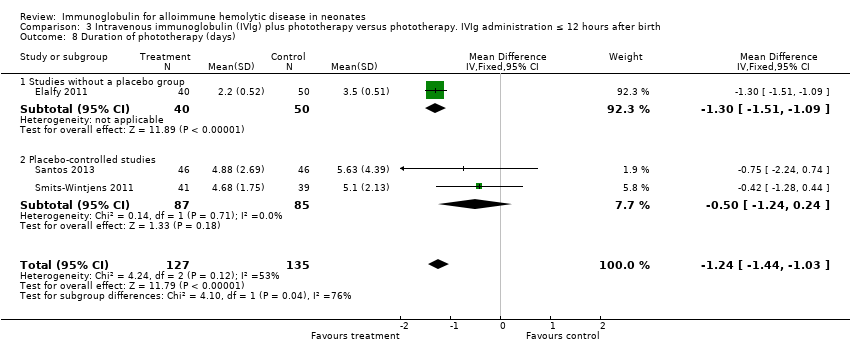
Comparison 3 Intravenous immunoglobulin (IVIg) plus phototherapy versus phototherapy. IVIg administration ≤ 12 hours after birth, Outcome 8 Duration of phototherapy (days).

Comparison 4 Intravenous immunoglobulin (IVIg) plus phototherapy versus phototherapy. Single dose of IVIg, Outcome 1 Use of exchange transfusion (≥ 1).
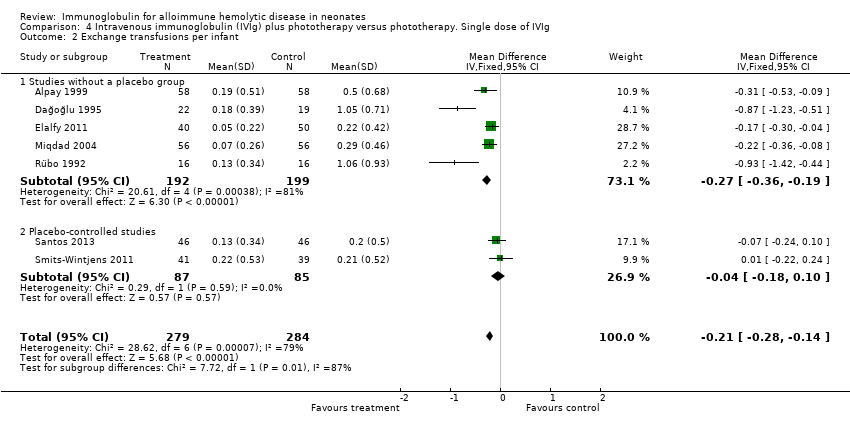
Comparison 4 Intravenous immunoglobulin (IVIg) plus phototherapy versus phototherapy. Single dose of IVIg, Outcome 2 Exchange transfusions per infant.

Comparison 4 Intravenous immunoglobulin (IVIg) plus phototherapy versus phototherapy. Single dose of IVIg, Outcome 3 Use of top‐up transfusions in 1st week.
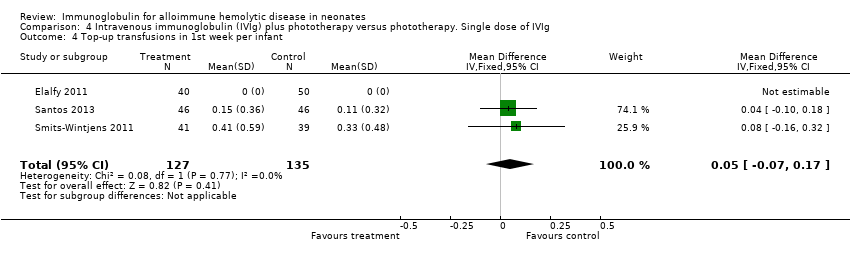
Comparison 4 Intravenous immunoglobulin (IVIg) plus phototherapy versus phototherapy. Single dose of IVIg, Outcome 4 Top‐up transfusions in 1st week per infant.

Comparison 4 Intravenous immunoglobulin (IVIg) plus phototherapy versus phototherapy. Single dose of IVIg, Outcome 5 Use of top‐up transfusion after 1st week.
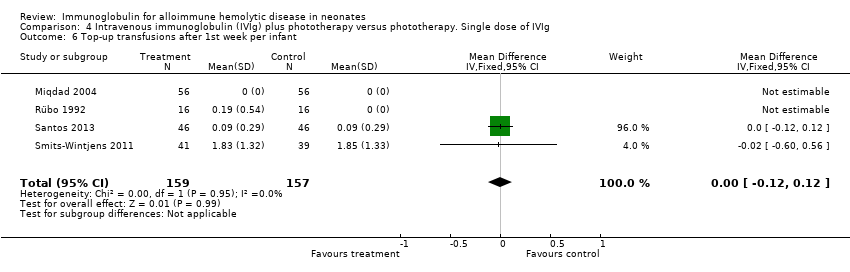
Comparison 4 Intravenous immunoglobulin (IVIg) plus phototherapy versus phototherapy. Single dose of IVIg, Outcome 6 Top‐up transfusions after 1st week per infant.
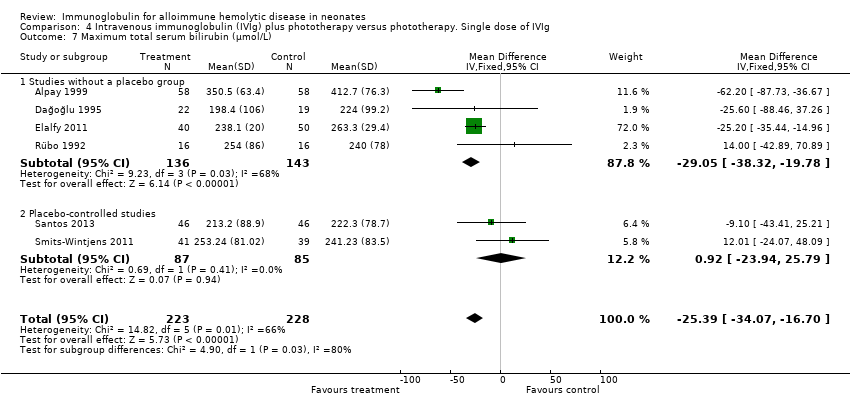
Comparison 4 Intravenous immunoglobulin (IVIg) plus phototherapy versus phototherapy. Single dose of IVIg, Outcome 7 Maximum total serum bilirubin (µmol/L).

Comparison 4 Intravenous immunoglobulin (IVIg) plus phototherapy versus phototherapy. Single dose of IVIg, Outcome 8 Duration of phototherapy (days).
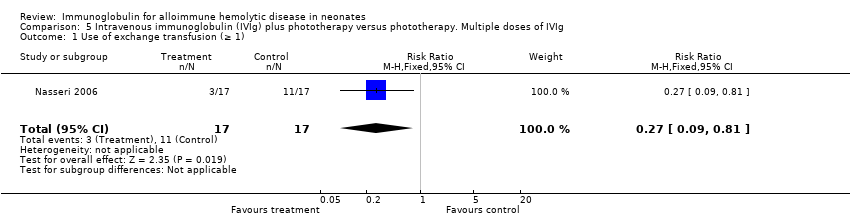
Comparison 5 Intravenous immunoglobulin (IVIg) plus phototherapy versus phototherapy. Multiple doses of IVIg, Outcome 1 Use of exchange transfusion (≥ 1).

Comparison 5 Intravenous immunoglobulin (IVIg) plus phototherapy versus phototherapy. Multiple doses of IVIg, Outcome 2 Exchange transfusions per infant.
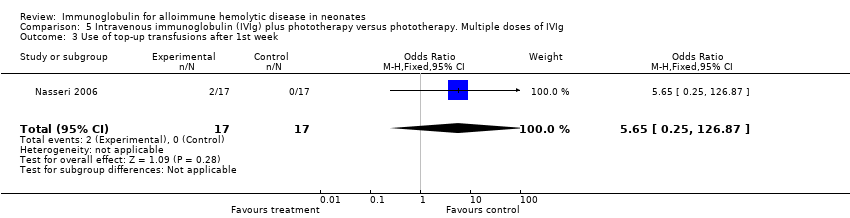
Comparison 5 Intravenous immunoglobulin (IVIg) plus phototherapy versus phototherapy. Multiple doses of IVIg, Outcome 3 Use of top‐up transfusions after 1st week.

Comparison 5 Intravenous immunoglobulin (IVIg) plus phototherapy versus phototherapy. Multiple doses of IVIg, Outcome 4 Duration of phototherapy (days).

Comparison 6 Intravenous immunoglobulin (IVIg) plus phototherapy versus phototherapy. Gestational age ≥ 37 weeks, Outcome 1 Use of exchange transfusion (≥ 1).
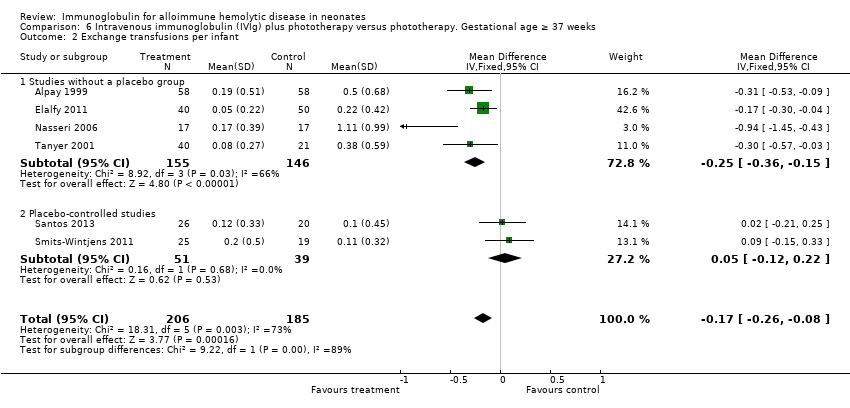
Comparison 6 Intravenous immunoglobulin (IVIg) plus phototherapy versus phototherapy. Gestational age ≥ 37 weeks, Outcome 2 Exchange transfusions per infant.
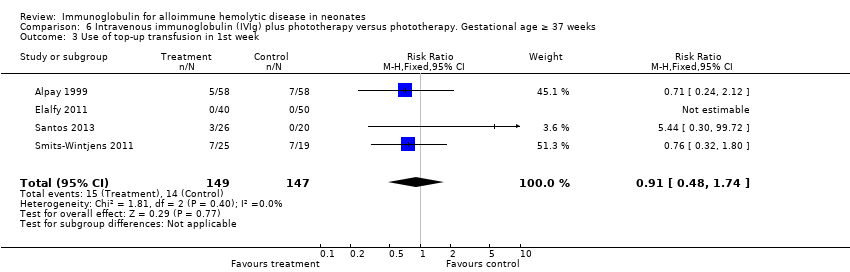
Comparison 6 Intravenous immunoglobulin (IVIg) plus phototherapy versus phototherapy. Gestational age ≥ 37 weeks, Outcome 3 Use of top‐up transfusion in 1st week.

Comparison 6 Intravenous immunoglobulin (IVIg) plus phototherapy versus phototherapy. Gestational age ≥ 37 weeks, Outcome 4 Top‐up transfusions in 1st week per infant.
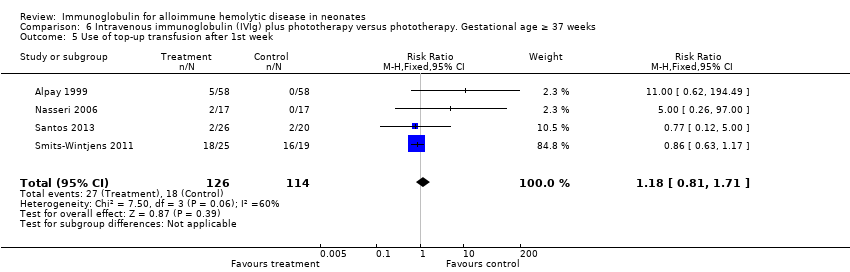
Comparison 6 Intravenous immunoglobulin (IVIg) plus phototherapy versus phototherapy. Gestational age ≥ 37 weeks, Outcome 5 Use of top‐up transfusion after 1st week.

Comparison 6 Intravenous immunoglobulin (IVIg) plus phototherapy versus phototherapy. Gestational age ≥ 37 weeks, Outcome 6 Top‐up transfusions after 1st week per infant.

Comparison 6 Intravenous immunoglobulin (IVIg) plus phototherapy versus phototherapy. Gestational age ≥ 37 weeks, Outcome 7 Maximum total serum bilirubin (µmol/L).

Comparison 6 Intravenous immunoglobulin (IVIg) plus phototherapy versus phototherapy. Gestational age ≥ 37 weeks, Outcome 8 Duration of phototherapy (days).
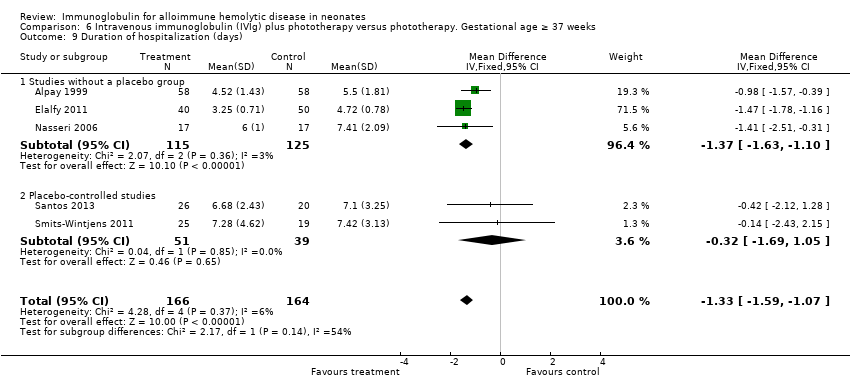
Comparison 6 Intravenous immunoglobulin (IVIg) plus phototherapy versus phototherapy. Gestational age ≥ 37 weeks, Outcome 9 Duration of hospitalization (days).
| Intravenous immunoglobulin plus phototherapy compared to phototherapy alone for alloimmune hemolytic disease in neonates | |||||
| Patient or population: neonates with alloimmune hemolytic disease Settings: ‐ Intervention: IVIg + phototherapy Comparison: phototherapy | |||||
| Outcomes | № of participants | Quality of the evidence | Relative effect | Anticipated absolute effects* (95% CI) | |
| Risk with phototherapy alone | Risk difference with IVIg + phototherapy | ||||
| Use of ET (≥ 1); all studies | 658 | ⊕⊝⊝⊝ | RR 0.35 | Study population | |
| 329 per 1000 | 214 fewer per 1000 | ||||
| Use of ET (≥ 1); placebo‐controlled studies | 172 | ⊕⊕⊕⊝ | RR 0.98 | Study population | |
| 153 per 1000 | 3 fewer per 1000 | ||||
| ETs performed per infant; all studies | 658 | ⊕⊝⊝⊝ | ‐ | The mean ETs per infant for all studies was 0 | MD 0.34 lower |
| ETs performed per infant; placebo‐controlled studies | 172 | ⊕⊕⊕⊝ | ‐ | The mean ETs per infant for placebo‐controlled studies was 0 | MD 0.04 lower |
| Use of top‐up transfusion in 1st week of life; all studies | 378 | ⊕⊕⊝⊝ | RR 1.05 | Study population | |
| 130 per 1000 | 6 more per 1000 | ||||
| Use of top‐up transfusion after 1st week of life; all studies | 507 | ⊕⊝⊝⊝ | RR 1.16 | Study population | |
| 219 per 1000 | 35 more per 1000 | ||||
| Maximum total serum bilirubin (µmol/L); all studies | 451 | ⊕⊝⊝⊝ | ‐ | The mean maximum serum bilirubin (µmol/L) for all studies was 0 | MD 25.39 lower |
| *The risk in the intervention group (and its 95% confidence interval) is based on the assumed risk in the comparison group and the relative effect of the intervention (and its 95% CI). CI: confidence interval; ET: exchange transfusion; IVIg: intravenous immunoglobulin; MD: mean difference; RCT: randomized controlled trial; RR: risk ratio. | |||||
| GRADE Working Group grades of evidence | |||||
| 1In three studies, the method of randomization was not stated and there was inadequate concealment of random sequence (selection bias). In seven studies, there was no blinding of personnel (performance bias) and in five studies, no blinding of outcome assessment (detection bias). Among other potential sources of bias were that mean bilirubin levels at study entry were already higher than the threshold for the outcome (ET) in one study, differences between study groups despite randomization (one study), postrandomization withdrawals or cross‐over between study groups (two studies) and criteria for ET differing between treatment arms (one study). 2Substantial heterogeneity: Chi2 = 34.63, df = 8 (P = 0.0003), I2 = 77%. 3Four studies did not clearly specify use of intensive phototherapy (which should be a routine intervention for infants at high risk of ET). 4Total number of participants in these two trials was low, increasing the risk of possible bias. 5Only a few infants needed a second ET. 6In one trial, the methods of randomization and allocation concealment were not stated. In two studies, there was no blinding of personnel (performance bias). 7Combined studies were underpowered for use of top‐up transfusion in 1st week. A total of 378 infants were enrolled in all four trials, and the overall frequency of top‐up transfusion was low (13.8%). 8Substantial heterogeneity: Chi2 = 15.60, df = 5 (P = 0.008); I2 = 68%. 9Due to small differences between treatment groups, the combined studies were underpowered for use of top‐up transfusion after 1st week. 10Four studies used no method of blinding the intervention. 11Substantial heterogeneity: Chi2 = 14.82, df = 5 (P = 0.01); I2 = 66%. 12Peak serum bilirubin in the control group varied 1.86‐fold between studies; there was considerably greater variation between studies than between groups within studies. | |||||
| Outcome or subgroup title | No. of studies | No. of participants | Statistical method | Effect size |
| 1 Use of exchange transfusion (≥ 1) Show forest plot | 9 | 658 | Risk Ratio (M‐H, Fixed, 95% CI) | 0.35 [0.25, 0.49] |
| 1.1 Studies without a placebo group | 7 | 486 | Risk Ratio (M‐H, Fixed, 95% CI) | 0.26 [0.18, 0.39] |
| 1.2 Placebo‐controlled studies | 2 | 172 | Risk Ratio (M‐H, Fixed, 95% CI) | 0.98 [0.48, 1.98] |
| 2 Exchange transfusions per infant, by study quality Show forest plot | 9 | 658 | Mean Difference (IV, Random, 95% CI) | ‐0.34 [‐0.50, ‐0.17] |
| 2.1 Studies without a placebo group | 7 | 486 | Mean Difference (IV, Random, 95% CI) | ‐0.44 [‐0.64, ‐0.25] |
| 2.2 Placebo‐controlled studies | 2 | 172 | Mean Difference (IV, Random, 95% CI) | ‐0.04 [‐0.18, 0.10] |
| 3 Use of top‐up transfusion in 1st week by study quality Show forest plot | 4 | 378 | Risk Ratio (M‐H, Fixed, 95% CI) | 1.05 [0.65, 1.69] |
| 3.1 Studies without a placebo group | 2 | 206 | Risk Ratio (M‐H, Fixed, 95% CI) | 0.71 [0.24, 2.12] |
| 3.2 Placebo‐controlled studies | 2 | 172 | Risk Ratio (M‐H, Fixed, 95% CI) | 1.18 [0.70, 2.00] |
| 4 Top‐up transfusions in 1st week per infant by study quality Show forest plot | 3 | 262 | Mean Difference (IV, Fixed, 95% CI) | 0.05 [‐0.07, 0.17] |
| 4.1 Studies without a placebo group | 1 | 90 | Mean Difference (IV, Fixed, 95% CI) | 0.0 [0.0, 0.0] |
| 4.2 Placebo‐controlled studies | 2 | 172 | Mean Difference (IV, Fixed, 95% CI) | 0.05 [‐0.07, 0.17] |
| 5 Use of top‐up transfusion after 1st week by study quality Show forest plot | 7 | 507 | Risk Ratio (M‐H, Fixed, 95% CI) | 1.16 [0.97, 1.38] |
| 5.1 Studies without a placebo group | 5 | 335 | Risk Ratio (M‐H, Fixed, 95% CI) | 1.40 [1.08, 1.82] |
| 5.2 Placebo‐controlled studies | 2 | 172 | Risk Ratio (M‐H, Fixed, 95% CI) | 1.01 [0.80, 1.27] |
| 6 Top‐up transfusions after first week per infant, by study quality Show forest plot | 4 | 316 | Mean Difference (IV, Fixed, 95% CI) | ‐0.00 [‐0.12, 0.12] |
| 6.1 Studies without a placebo group | 2 | 144 | Mean Difference (IV, Fixed, 95% CI) | 0.0 [0.0, 0.0] |
| 6.2 Placebo‐controlled studies | 2 | 172 | Mean Difference (IV, Fixed, 95% CI) | ‐0.00 [‐0.12, 0.12] |
| 7 Maximum total serum bilirubin (µmol/L) by study quality Show forest plot | 6 | 451 | Mean Difference (IV, Fixed, 95% CI) | ‐25.39 [‐34.07, ‐16.70] |
| 7.1 Studies without a placebo group | 4 | 279 | Mean Difference (IV, Fixed, 95% CI) | ‐29.05 [‐38.32, ‐19.78] |
| 7.2 Placebo‐controlled studies | 2 | 172 | Mean Difference (IV, Fixed, 95% CI) | 0.93 [‐23.94, 25.79] |
| 8 Duration of phototherapy (days) by study quality Show forest plot | 7 | 585 | Mean Difference (IV, Random, 95% CI) | ‐0.98 [‐1.31, ‐0.66] |
| 8.1 Studies without a placebo group | 5 | 413 | Mean Difference (IV, Random, 95% CI) | ‐1.06 [‐1.41, ‐0.72] |
| 8.2 Placebo‐controlled studies | 2 | 172 | Mean Difference (IV, Random, 95% CI) | ‐0.50 [‐1.24, 0.24] |
| Outcome or subgroup title | No. of studies | No. of participants | Statistical method | Effect size |
| 1 Use of exchange transfusion (≥ 1) Show forest plot | 7 | 371 | Risk Ratio (M‐H, Fixed, 95% CI) | 0.38 [0.25, 0.58] |
| 1.1 Studies without a placebo group | 5 | 199 | Risk Ratio (M‐H, Fixed, 95% CI) | 0.23 [0.13, 0.40] |
| 1.2 Placebo‐controlled studies | 2 | 172 | Risk Ratio (M‐H, Fixed, 95% CI) | 0.98 [0.48, 1.98] |
| 2 Exchange transfusions per infant Show forest plot | 7 | 371 | Mean Difference (IV, Fixed, 95% CI) | ‐0.25 [‐0.34, ‐0.16] |
| 2.1 Studies without a placebo group | 5 | 199 | Mean Difference (IV, Fixed, 95% CI) | ‐0.39 [‐0.51, ‐0.28] |
| 2.2 Placebo‐controlled studies | 2 | 172 | Mean Difference (IV, Fixed, 95% CI) | ‐0.04 [‐0.18, 0.10] |
| 3 Use top‐up transfusion in 1st week Show forest plot | 4 | 285 | Risk Ratio (M‐H, Fixed, 95% CI) | 1.08 [0.65, 1.77] |
| 3.1 Studies without a placebo group | 2 | 113 | Risk Ratio (M‐H, Fixed, 95% CI) | 0.51 [0.10, 2.51] |
| 3.2 Placebo‐controlled studies | 2 | 172 | Risk Ratio (M‐H, Fixed, 95% CI) | 1.18 [0.70, 2.00] |
| 4 Top‐up transfusions in 1st week per infant Show forest plot | 3 | 262 | Mean Difference (IV, Fixed, 95% CI) | 0.05 [‐0.07, 0.17] |
| 4.1 Studies without a placebo group | 1 | 90 | Mean Difference (IV, Fixed, 95% CI) | 0.0 [0.0, 0.0] |
| 4.2 Placebo‐controlled studies | 2 | 172 | Mean Difference (IV, Fixed, 95% CI) | 0.05 [‐0.07, 0.17] |
| 5 Use of top‐up transfusion after 1st week Show forest plot | 6 | 281 | Risk Ratio (M‐H, Fixed, 95% CI) | 1.09 [0.92, 1.28] |
| 5.1 Studies without a placebo group | 4 | 109 | Risk Ratio (M‐H, Fixed, 95% CI) | 1.21 [0.96, 1.53] |
| 5.2 Placebo‐controlled studies | 2 | 172 | Risk Ratio (M‐H, Fixed, 95% CI) | 1.01 [0.80, 1.27] |
| 6 Top‐up transfusions after 1st week per infant Show forest plot | 3 | 204 | Mean Difference (IV, Fixed, 95% CI) | ‐0.00 [‐0.12, 0.12] |
| 7 Maximum total serum bilirubin (µmol/L) Show forest plot | 6 | 358 | Mean Difference (IV, Fixed, 95% CI) | ‐21.77 [‐30.86, ‐12.67] |
| 7.1 Studies without a placebo group | 4 | 186 | Mean Difference (IV, Fixed, 95% CI) | ‐25.27 [‐35.04, ‐15.50] |
| 7.2 Placebo‐controlled studies | 2 | 172 | Mean Difference (IV, Fixed, 95% CI) | 0.92 [‐23.94, 25.79] |
| 8 Duration of phototherapy (days) Show forest plot | 5 | 298 | Mean Difference (IV, Fixed, 95% CI) | ‐1.23 [‐1.43, ‐1.02] |
| 8.1 Studies without a placebo group | 3 | 126 | Mean Difference (IV, Fixed, 95% CI) | ‐1.28 [‐1.49, ‐1.07] |
| 8.2 Placebo‐controlled studies | 2 | 172 | Mean Difference (IV, Fixed, 95% CI) | ‐0.50 [‐1.24, 0.24] |
| Outcome or subgroup title | No. of studies | No. of participants | Statistical method | Effect size |
| 1 Use of exchange transfusion (≥ 1) Show forest plot | 5 | 335 | Risk Ratio (M‐H, Fixed, 95% CI) | 0.41 [0.26, 0.66] |
| 1.1 Studies without a placebo group | 3 | 163 | Risk Ratio (M‐H, Fixed, 95% CI) | 0.22 [0.11, 0.42] |
| 1.2 Placebo‐controlled studies | 2 | 172 | Risk Ratio (M‐H, Fixed, 95% CI) | 0.98 [0.48, 1.98] |
| 2 Exchange transfusions per infant Show forest plot | 5 | 335 | Mean Difference (IV, Fixed, 95% CI) | ‐0.19 [‐0.28, ‐0.10] |
| 2.1 Studies without a placebo group | 3 | 163 | Mean Difference (IV, Fixed, 95% CI) | ‐0.30 [‐0.42, ‐0.18] |
| 2.2 Placebo‐controlled studies | 2 | 172 | Mean Difference (IV, Fixed, 95% CI) | ‐0.04 [‐0.18, 0.10] |
| 3 Use of top‐up transfusion in 1st week Show forest plot | 3 | 262 | Risk Ratio (M‐H, Fixed, 95% CI) | 1.18 [0.70, 2.00] |
| 4 Top‐up transfusions in 1st week per infant Show forest plot | 3 | 262 | Mean Difference (IV, Fixed, 95% CI) | 0.05 [‐0.07, 0.17] |
| 5 Use of top‐up transfusions after 1st week Show forest plot | 4 | 245 | Risk Ratio (M‐H, Fixed, 95% CI) | 1.04 [0.89, 1.22] |
| 6 Top‐up transfusions after 1st week per infant Show forest plot | 3 | 204 | Mean Difference (IV, Fixed, 95% CI) | ‐0.00 [‐0.12, 0.12] |
| 7 Maximum total serum bilirubin (µmol/L) Show forest plot | 5 | 335 | Mean Difference (IV, Fixed, 95% CI) | ‐20.57 [‐29.81, ‐11.33] |
| 7.1 Studies without a placebo group | 3 | 163 | Mean Difference (IV, Fixed, 95% CI) | ‐24.01 [‐33.96, ‐14.06] |
| 7.2 Placebo‐controlled studies | 2 | 172 | Mean Difference (IV, Fixed, 95% CI) | 0.92 [‐23.94, 25.79] |
| 8 Duration of phototherapy (days) Show forest plot | 3 | 262 | Mean Difference (IV, Fixed, 95% CI) | ‐1.24 [‐1.44, ‐1.03] |
| 8.1 Studies without a placebo group | 1 | 90 | Mean Difference (IV, Fixed, 95% CI) | ‐1.30 [‐1.51, ‐1.09] |
| 8.2 Placebo‐controlled studies | 2 | 172 | Mean Difference (IV, Fixed, 95% CI) | ‐0.50 [‐1.24, 0.24] |
| Outcome or subgroup title | No. of studies | No. of participants | Statistical method | Effect size |
| 1 Use of exchange transfusion (≥ 1) Show forest plot | 7 | 563 | Risk Ratio (M‐H, Fixed, 95% CI) | 0.37 [0.26, 0.53] |
| 1.1 Studies without a placebo group | 5 | 391 | Risk Ratio (M‐H, Fixed, 95% CI) | 0.27 [0.17, 0.42] |
| 1.2 Placebo‐controlled studies | 2 | 172 | Risk Ratio (M‐H, Fixed, 95% CI) | 0.98 [0.48, 1.98] |
| 2 Exchange transfusions per infant Show forest plot | 7 | 563 | Mean Difference (IV, Fixed, 95% CI) | ‐0.21 [‐0.28, ‐0.14] |
| 2.1 Studies without a placebo group | 5 | 391 | Mean Difference (IV, Fixed, 95% CI) | ‐0.27 [‐0.36, ‐0.19] |
| 2.2 Placebo‐controlled studies | 2 | 172 | Mean Difference (IV, Fixed, 95% CI) | ‐0.04 [‐0.18, 0.10] |
| 3 Use of top‐up transfusions in 1st week Show forest plot | 4 | 378 | Risk Ratio (M‐H, Fixed, 95% CI) | 1.05 [0.65, 1.69] |
| 4 Top‐up transfusions in 1st week per infant Show forest plot | 3 | 262 | Mean Difference (IV, Fixed, 95% CI) | 0.05 [‐0.07, 0.17] |
| 5 Use of top‐up transfusion after 1st week Show forest plot | 6 | 473 | Risk Ratio (M‐H, Fixed, 95% CI) | 1.13 [0.95, 1.33] |
| 6 Top‐up transfusions after 1st week per infant Show forest plot | 4 | 316 | Mean Difference (IV, Fixed, 95% CI) | ‐0.00 [‐0.12, 0.12] |
| 7 Maximum total serum bilirubin (µmol/L) Show forest plot | 6 | 451 | Mean Difference (IV, Fixed, 95% CI) | ‐25.39 [‐34.07, ‐16.70] |
| 7.1 Studies without a placebo group | 4 | 279 | Mean Difference (IV, Fixed, 95% CI) | ‐29.05 [‐38.32, ‐19.78] |
| 7.2 Placebo‐controlled studies | 2 | 172 | Mean Difference (IV, Fixed, 95% CI) | 0.92 [‐23.94, 25.79] |
| 8 Duration of phototherapy (days) Show forest plot | 5 | 490 | Mean Difference (IV, Fixed, 95% CI) | ‐1.12 [‐1.30, ‐0.94] |
| 8.1 Studies without a placebo group | 3 | 318 | Mean Difference (IV, Fixed, 95% CI) | ‐1.16 [‐1.34, ‐0.97] |
| 8.2 Placebo‐controlled studies | 2 | 172 | Mean Difference (IV, Fixed, 95% CI) | ‐0.50 [‐1.24, 0.24] |
| Outcome or subgroup title | No. of studies | No. of participants | Statistical method | Effect size |
| 1 Use of exchange transfusion (≥ 1) Show forest plot | 1 | 34 | Risk Ratio (M‐H, Fixed, 95% CI) | 0.27 [0.09, 0.81] |
| 2 Exchange transfusions per infant Show forest plot | 1 | 34 | Mean Difference (IV, Fixed, 95% CI) | ‐0.94 [‐1.45, ‐0.43] |
| 3 Use of top‐up transfusions after 1st week Show forest plot | 1 | 34 | Odds Ratio (M‐H, Fixed, 95% CI) | 5.65 [0.25, 126.87] |
| 4 Duration of phototherapy (days) Show forest plot | 1 | 34 | Mean Difference (IV, Fixed, 95% CI) | ‐1.47 [‐2.52, ‐0.42] |
| Outcome or subgroup title | No. of studies | No. of participants | Statistical method | Effect size |
| 1 Use of exchange transfusion (≥ 1) Show forest plot | 6 | 391 | Risk Ratio (M‐H, Fixed, 95% CI) | 0.39 [0.25, 0.61] |
| 1.1 Studies without a placebo group | 4 | 301 | Risk Ratio (M‐H, Fixed, 95% CI) | 0.29 [0.18, 0.49] |
| 1.2 Placebo‐controlled studies | 2 | 90 | Risk Ratio (M‐H, Fixed, 95% CI) | 1.78 [0.49, 6.42] |
| 2 Exchange transfusions per infant Show forest plot | 6 | 391 | Mean Difference (IV, Fixed, 95% CI) | ‐0.17 [‐0.26, ‐0.08] |
| 2.1 Studies without a placebo group | 4 | 301 | Mean Difference (IV, Fixed, 95% CI) | ‐0.25 [‐0.36, ‐0.15] |
| 2.2 Placebo‐controlled studies | 2 | 90 | Mean Difference (IV, Fixed, 95% CI) | 0.05 [‐0.12, 0.22] |
| 3 Use of top‐up transfusion in 1st week Show forest plot | 4 | 296 | Risk Ratio (M‐H, Fixed, 95% CI) | 0.91 [0.48, 1.74] |
| 4 Top‐up transfusions in 1st week per infant Show forest plot | 3 | 180 | Mean Difference (IV, Fixed, 95% CI) | ‐0.01 [‐0.35, 0.33] |
| 5 Use of top‐up transfusion after 1st week Show forest plot | 4 | 240 | Risk Ratio (M‐H, Fixed, 95% CI) | 1.18 [0.81, 1.71] |
| 6 Top‐up transfusions after 1st week per infant Show forest plot | 2 | 90 | Mean Difference (IV, Fixed, 95% CI) | ‐0.03 [‐0.20, 0.13] |
| 7 Maximum total serum bilirubin (µmol/L) Show forest plot | 4 | 296 | Mean Difference (IV, Fixed, 95% CI) | ‐26.81 [‐35.97, ‐17.65] |
| 7.1 Studies without a placebo group | 2 | 206 | Mean Difference (IV, Fixed, 95% CI) | ‐30.33 [‐39.83, ‐20.82] |
| 7.2 Placebo‐controlled studies | 2 | 90 | Mean Difference (IV, Fixed, 95% CI) | 19.47 [‐15.00, 53.94] |
| 8 Duration of phototherapy (days) Show forest plot | 6 | 391 | Mean Difference (IV, Fixed, 95% CI) | ‐1.20 [‐1.38, ‐1.01] |
| 8.1 Studies without a placebo group | 4 | 301 | Mean Difference (IV, Fixed, 95% CI) | ‐1.25 [‐1.44, ‐1.06] |
| 8.2 Placebo‐controlled studies | 2 | 90 | Mean Difference (IV, Fixed, 95% CI) | 0.18 [‐0.75, 1.12] |
| 9 Duration of hospitalization (days) Show forest plot | 5 | 330 | Mean Difference (IV, Fixed, 95% CI) | ‐1.33 [‐1.59, ‐1.07] |
| 9.1 Studies without a placebo group | 3 | 240 | Mean Difference (IV, Fixed, 95% CI) | ‐1.37 [‐1.63, ‐1.10] |
| 9.2 Placebo‐controlled studies | 2 | 90 | Mean Difference (IV, Fixed, 95% CI) | ‐0.32 [‐1.69, 1.05] |