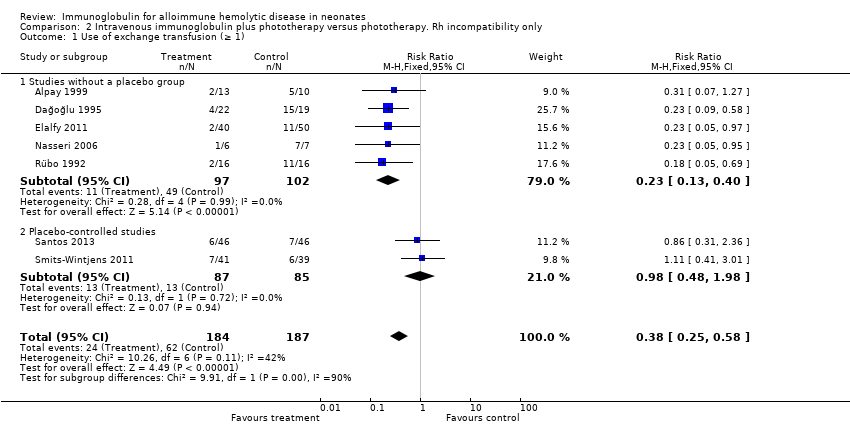
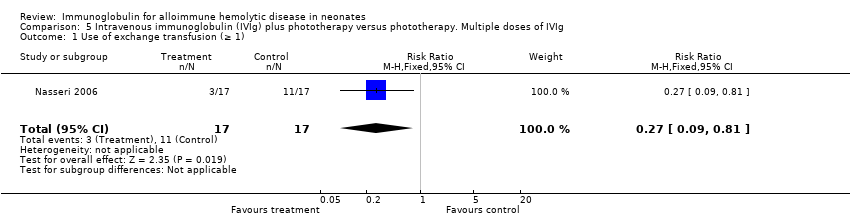
| 1 Use of exchange transfusion (≥ 1) Show forest plot | 9 | 658 | Risk Ratio (M‐H, Fixed, 95% CI) | 0.35 [0.25, 0.49] |
|
| 1.1 Studies without a placebo group | 7 | 486 | Risk Ratio (M‐H, Fixed, 95% CI) | 0.26 [0.18, 0.39] |
| 1.2 Placebo‐controlled studies | 2 | 172 | Risk Ratio (M‐H, Fixed, 95% CI) | 0.98 [0.48, 1.98] |
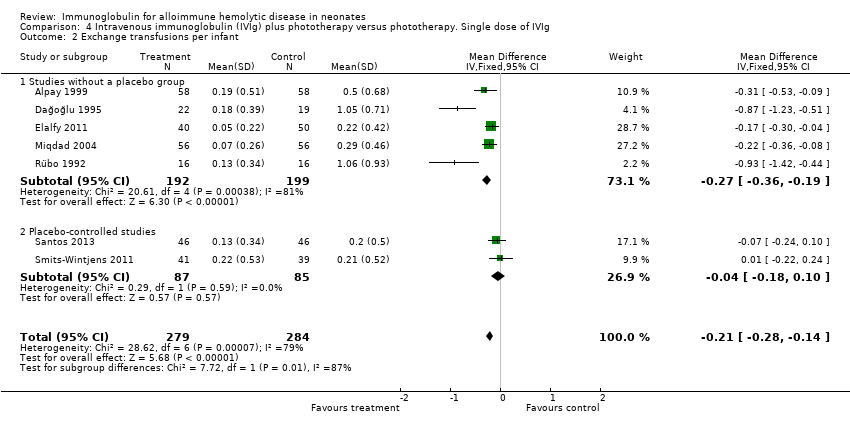
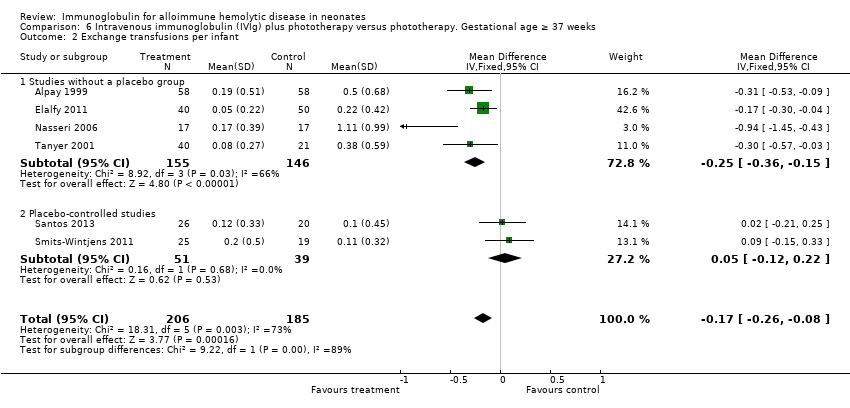
| 2 Exchange transfusions per infant, by study quality Show forest plot | 9 | 658 | Mean Difference (IV, Random, 95% CI) | ‐0.34 [‐0.50, ‐0.17] |
|
| 2.1 Studies without a placebo group | 7 | 486 | Mean Difference (IV, Random, 95% CI) | ‐0.44 [‐0.64, ‐0.25] |
| 2.2 Placebo‐controlled studies | 2 | 172 | Mean Difference (IV, Random, 95% CI) | ‐0.04 [‐0.18, 0.10] |
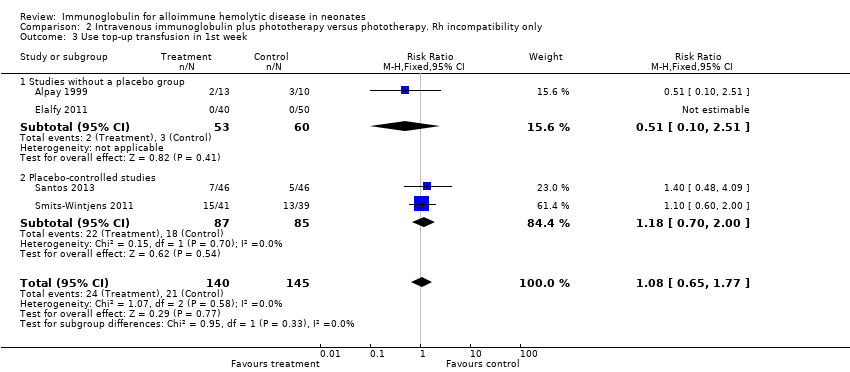
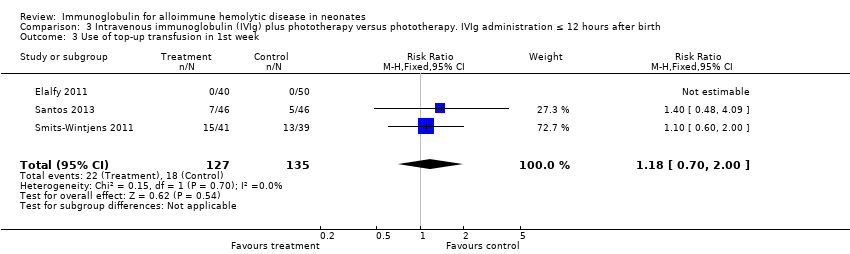
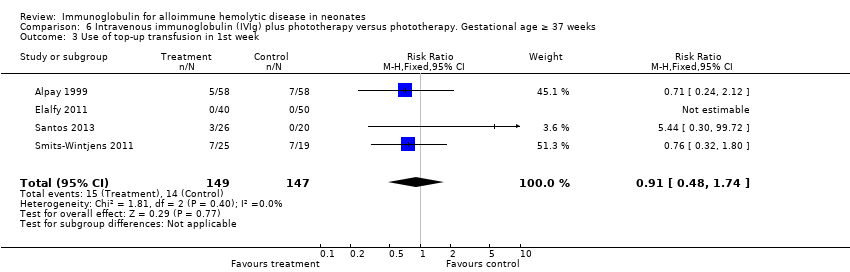
| 3 Use of top‐up transfusion in 1st week by study quality Show forest plot | 4 | 378 | Risk Ratio (M‐H, Fixed, 95% CI) | 1.05 [0.65, 1.69] |
|
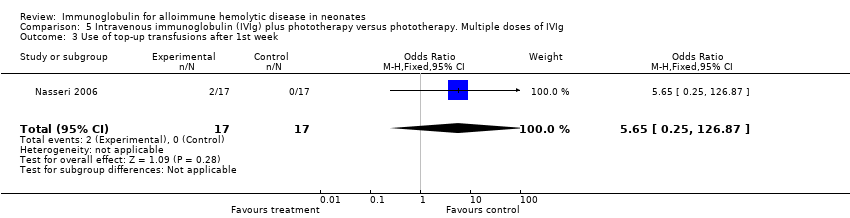
| 3.1 Studies without a placebo group | 2 | 206 | Risk Ratio (M‐H, Fixed, 95% CI) | 0.71 [0.24, 2.12] |
| 3.2 Placebo‐controlled studies | 2 | 172 | Risk Ratio (M‐H, Fixed, 95% CI) | 1.18 [0.70, 2.00] |
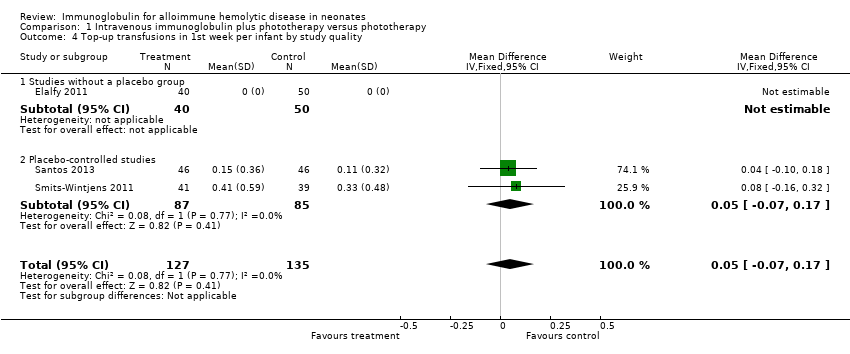
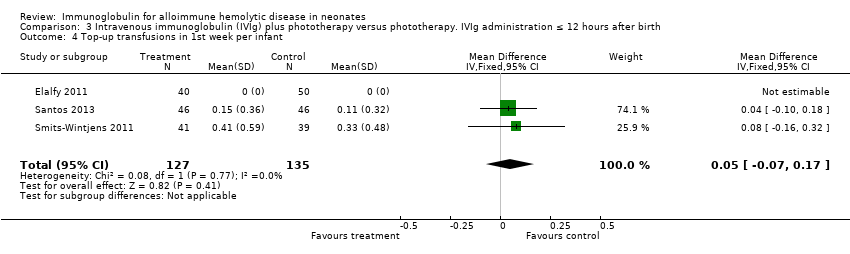
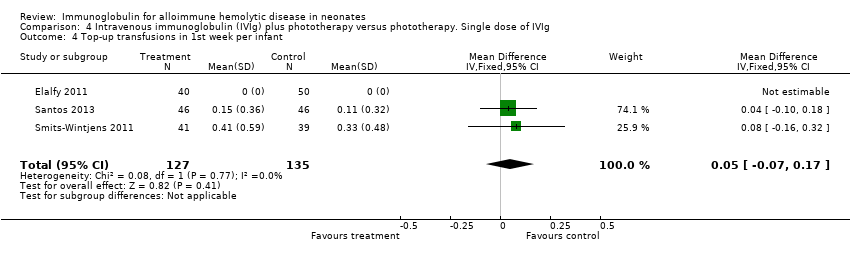
| 4 Top‐up transfusions in 1st week per infant by study quality Show forest plot | 3 | 262 | Mean Difference (IV, Fixed, 95% CI) | 0.05 [‐0.07, 0.17] |
|
| 4.1 Studies without a placebo group | 1 | 90 | Mean Difference (IV, Fixed, 95% CI) | 0.0 [0.0, 0.0] |
| 4.2 Placebo‐controlled studies | 2 | 172 | Mean Difference (IV, Fixed, 95% CI) | 0.05 [‐0.07, 0.17] |
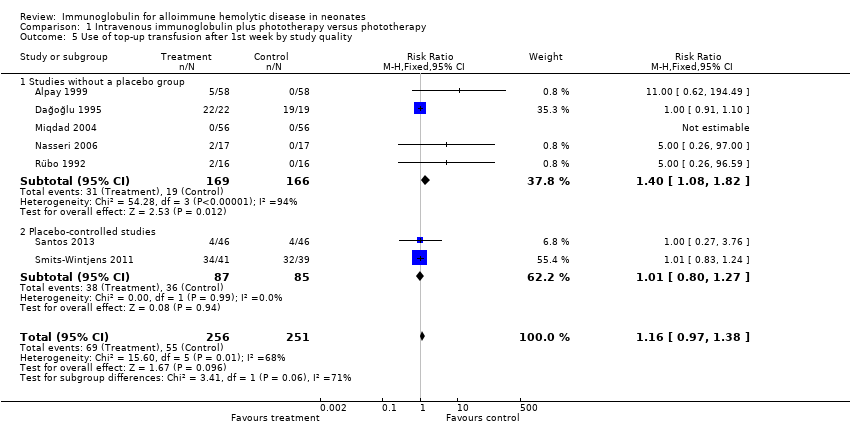
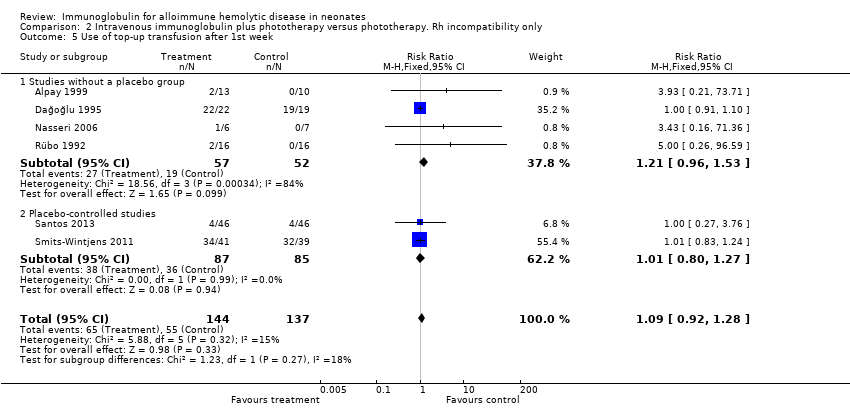
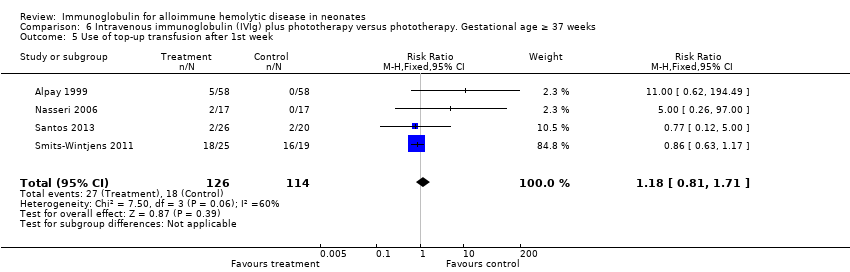
| 5 Use of top‐up transfusion after 1st week by study quality Show forest plot | 7 | 507 | Risk Ratio (M‐H, Fixed, 95% CI) | 1.16 [0.97, 1.38] |
|
| 5.1 Studies without a placebo group | 5 | 335 | Risk Ratio (M‐H, Fixed, 95% CI) | 1.40 [1.08, 1.82] |
| 5.2 Placebo‐controlled studies | 2 | 172 | Risk Ratio (M‐H, Fixed, 95% CI) | 1.01 [0.80, 1.27] |
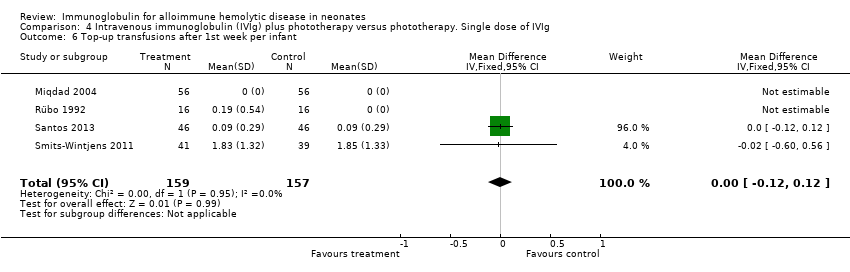
| 6 Top‐up transfusions after first week per infant, by study quality Show forest plot | 4 | 316 | Mean Difference (IV, Fixed, 95% CI) | ‐0.00 [‐0.12, 0.12] |
|
| 6.1 Studies without a placebo group | 2 | 144 | Mean Difference (IV, Fixed, 95% CI) | 0.0 [0.0, 0.0] |
| 6.2 Placebo‐controlled studies | 2 | 172 | Mean Difference (IV, Fixed, 95% CI) | ‐0.00 [‐0.12, 0.12] |
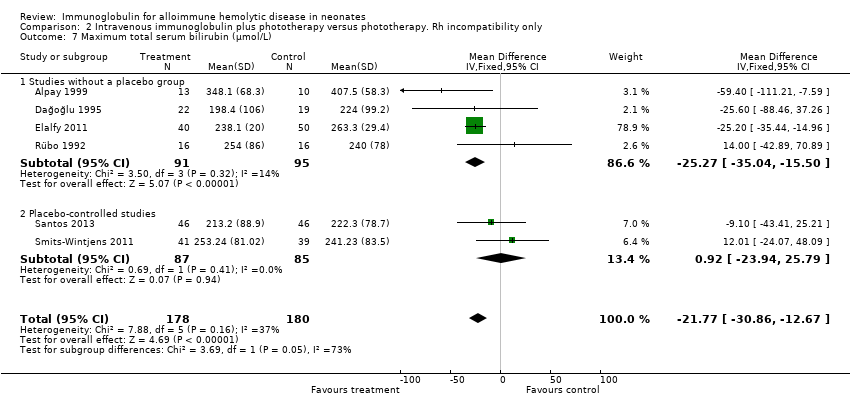
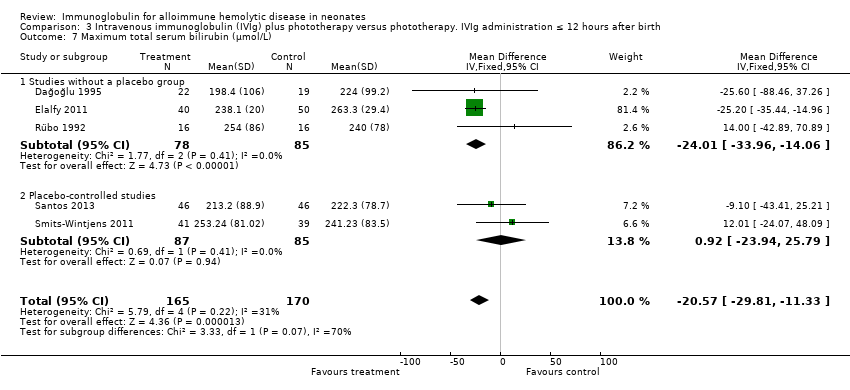
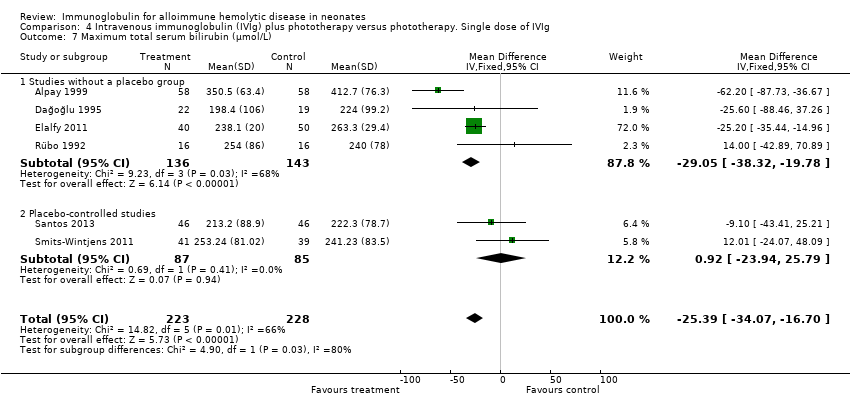
| 7 Maximum total serum bilirubin (µmol/L) by study quality Show forest plot | 6 | 451 | Mean Difference (IV, Fixed, 95% CI) | ‐25.39 [‐34.07, ‐16.70] |
|
| 7.1 Studies without a placebo group | 4 | 279 | Mean Difference (IV, Fixed, 95% CI) | ‐29.05 [‐38.32, ‐19.78] |
| 7.2 Placebo‐controlled studies | 2 | 172 | Mean Difference (IV, Fixed, 95% CI) | 0.93 [‐23.94, 25.79] |
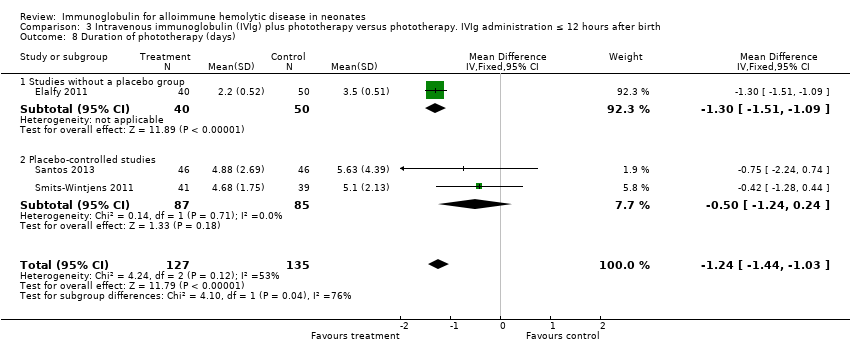
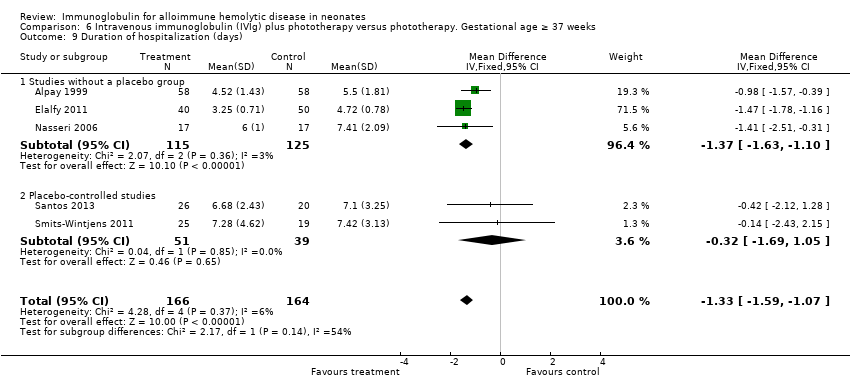
| 8 Duration of phototherapy (days) by study quality Show forest plot | 7 | 585 | Mean Difference (IV, Random, 95% CI) | ‐0.98 [‐1.31, ‐0.66] |
|
| 8.1 Studies without a placebo group | 5 | 413 | Mean Difference (IV, Random, 95% CI) | ‐1.06 [‐1.41, ‐0.72] |
| 8.2 Placebo‐controlled studies | 2 | 172 | Mean Difference (IV, Random, 95% CI) | ‐0.50 [‐1.24, 0.24] |