| 1 Mortality Show forest plot | 2 | 50 | Risk Ratio (M‐H, Fixed, 95% CI) | 0.73 [0.26, 2.09] |
|
| 2 Major neurodevelopmental disability in survivors assessed Show forest plot | 1 | 23 | Risk Ratio (M‐H, Fixed, 95% CI) | 3.08 [0.40, 23.44] |
|
| 3 Death or major neurodevelopmental disability in survivors assessed Show forest plot | 1 | 31 | Risk Ratio (M‐H, Fixed, 95% CI) | 1.26 [0.46, 3.44] |
|
| 4 Cerebral palsy in survivors assessed Show forest plot | 1 | 23 | Risk Ratio (M‐H, Fixed, 95% CI) | 2.31 [0.28, 18.99] |
|
| 5 Developmental delay (more than 2 SD below mean) in survivors assessed Show forest plot | 1 | 22 | Risk Ratio (M‐H, Fixed, 95% CI) | 5.0 [0.29, 86.43] |
|
| 6 Blindness in survivors assessed Show forest plot | 1 | 22 | Risk Ratio (M‐H, Fixed, 95% CI) | 0.0 [0.0, 0.0] |
|
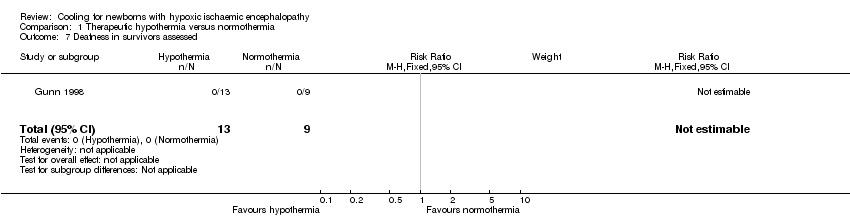
| 7 Deafness in survivors assessed Show forest plot | 1 | 22 | Risk Ratio (M‐H, Fixed, 95% CI) | 0.0 [0.0, 0.0] |
|
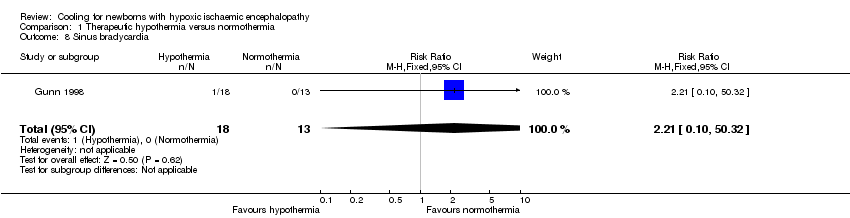
| 8 Sinus bradycardia Show forest plot | 1 | 31 | Risk Ratio (M‐H, Fixed, 95% CI) | 2.21 [0.10, 50.32] |
|
| 9 Hypotension requiring inotropic support Show forest plot | 2 | 50 | Risk Ratio (M‐H, Fixed, 95% CI) | 2.41 [0.82, 7.08] |
|
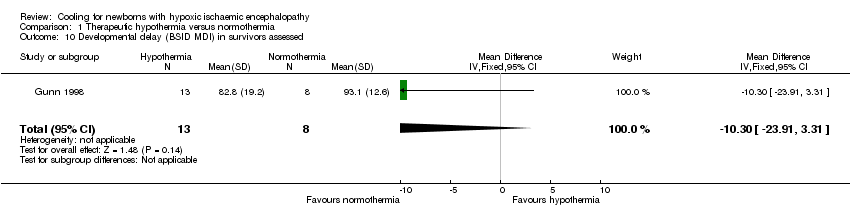
| 10 Developmental delay (BSID MDI) in survivors assessed Show forest plot | 1 | 21 | Mean Difference (IV, Fixed, 95% CI) | ‐10.30 [‐23.91, 3.31] |
|
| 11 Arrhythmia requiring medical treatment Show forest plot | 1 | 31 | Risk Ratio (M‐H, Fixed, 95% CI) | 0.0 [0.0, 0.0] |
|
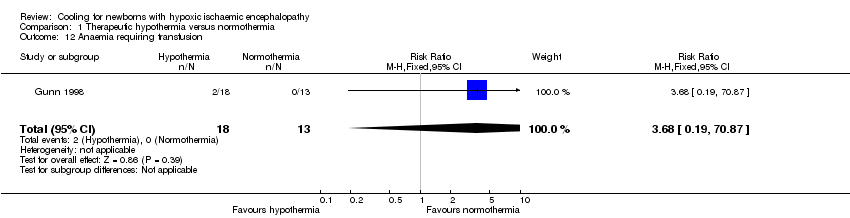
| 12 Anaemia requiring transfusion Show forest plot | 1 | 31 | Risk Ratio (M‐H, Fixed, 95% CI) | 3.68 [0.19, 70.87] |
|
| 13 Leukopaenia Show forest plot | 1 | 31 | Risk Ratio (M‐H, Fixed, 95% CI) | 2.21 [0.10, 50.32] |
|
| 14 Thrombocytopaenia Show forest plot | 1 | 31 | Risk Ratio (M‐H, Fixed, 95% CI) | 2.53 [0.62, 10.25] |
|
| 15 Coagulopathy resulting in major thrombosis or haemorrhage Show forest plot | 1 | 31 | Risk Ratio (M‐H, Fixed, 95% CI) | 3.68 [0.19, 70.87] |
|
| 16 Hypoglycaemia Show forest plot | 1 | 31 | Risk Ratio (M‐H, Fixed, 95% CI) | 1.81 [0.41, 7.90] |
|
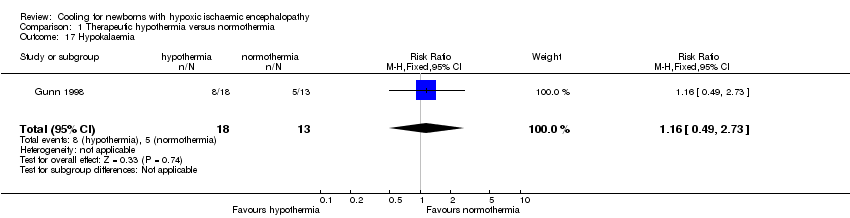
| 17 Hypokalaemia Show forest plot | 1 | 31 | Risk Ratio (M‐H, Fixed, 95% CI) | 1.16 [0.49, 2.73] |
|
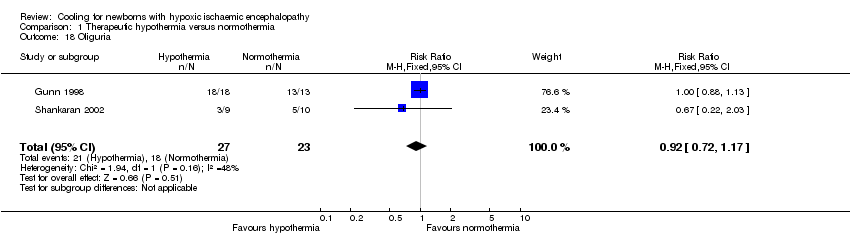
| 18 Oliguria Show forest plot | 2 | 50 | Risk Ratio (M‐H, Fixed, 95% CI) | 0.92 [0.72, 1.17] |
|
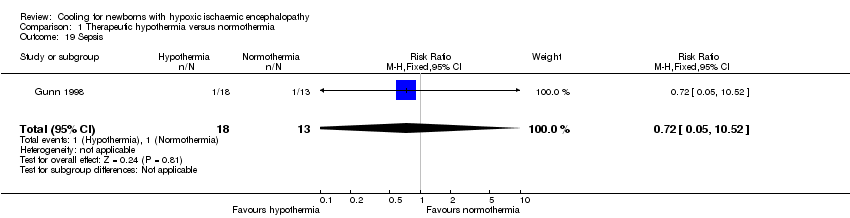
| 19 Sepsis Show forest plot | 1 | 31 | Risk Ratio (M‐H, Fixed, 95% CI) | 0.72 [0.05, 10.52] |
|
| 20 Moderate or severe enecphalopathy (Sarnat) Show forest plot | 1 | 31 | Risk Ratio (M‐H, Fixed, 95% CI) | 1.17 [0.70, 1.97] |
|
| 21 Seizures Show forest plot | 2 | 50 | Risk Ratio (M‐H, Fixed, 95% CI) | 1.37 [0.67, 2.80] |
|