Eritropoyetina humana recombinante versus placebo o ningún tratamiento para la anemia de la enfermedad renal crónica en pacientes que no requieren diálisis
Información
- DOI:
- https://doi.org/10.1002/14651858.CD003266.pub3Copiar DOI

- Base de datos:
-
- Cochrane Database of Systematic Reviews
- Versión publicada:
-
- 20 enero 2016see what's new
- Tipo:
-
- Intervention
- Etapa:
-
- Review
- Grupo Editorial Cochrane:
-
Grupo Cochrane de Riñón y trasplante
- Copyright:
-
- Copyright © 2016 The Cochrane Collaboration. Published by John Wiley & Sons, Ltd.
Cifras del artículo
Altmetric:
Citado por:
Autores
Contributions of authors
-
2001 and 2005 review: JC and MC undertook, independently, the quality assessment of the studies. Data extraction was performed by JC and a sample was double‐checked by SP. Extensive literature searching was performed by SW. JC entered the data and wrote the text of the review. MC and AG gave statistical and methodological advice. AM, CD, KR and IK provided a clinical perspective. CD and LV provided a health economics perspective. All reviewers commented on the review.
-
2016 review: EH assessed the four studies and updated the review
Declarations of interest
None known.
Acknowledgements
Health Services Research Unit and Health Economics Research Unit are funded by the Chief Scientist's Office, Scottish Office Department of Health.
Grateful thanks to Carol Ritchie for secretarial and clerical support. We would also like to acknowledge the support of Paul Lawrence, formerly Chief Librarian of the Medical School Library, University of Aberdeen. Thanks also to Oliver Campbell for undertaking the Internet searching.
We wish to thank Alison MacLeod, Conal Daly, Marion Campbell, Cameron Donaldson, Adrian Grant, Izhar Khan, Susan Pennington, Luke Vale, Sheila Wallace and Kannaiyan Rabindranath who contributed to the 2001 and 2005 reviews.
Version history
| Published | Title | Stage | Authors | Version |
| 2016 Jan 20 | Recombinant human erythropoietin versus placebo or no treatment for the anaemia of chronic kidney disease in people not requiring dialysis | Review | June D Cody, Elisabeth M Hodson | |
| 2005 Jul 20 | Recombinant human erythropoietin for chronic renal failure anaemia in pre‐dialysis patients | Review | June D Cody, Conal Daly, Marion K Campbell, Izhar Khan, Kannaiyan S Rabindranath, Luke Vale, Sheila A Wallace, Alison M MacLeod, Adrian M Grant, Susan Pennington, Ionut Nistor, Davide Bolignano, Angela C Webster | |
| 2001 Oct 23 | Recombinant human erythropoietin for chronic renal failure anaemia in pre‐dialysis patients | Review | June D Cody, Conal Daly, Marion K Campbell, Cameron Donaldson, Adrian Grant, Izhar Khan, Susan Pennington, Luke Vale, Sheila A Wallace, Alison M MacLeod | |
Notes
As of January 2016 this Cochrane Review is no longer being updated. The clinical efficacy of rHuEPO compared with placebo or no treatment is now clinically well established.
Keywords
MeSH
Medical Subject Headings (MeSH) Keywords
Medical Subject Headings Check Words
Humans;
PICO
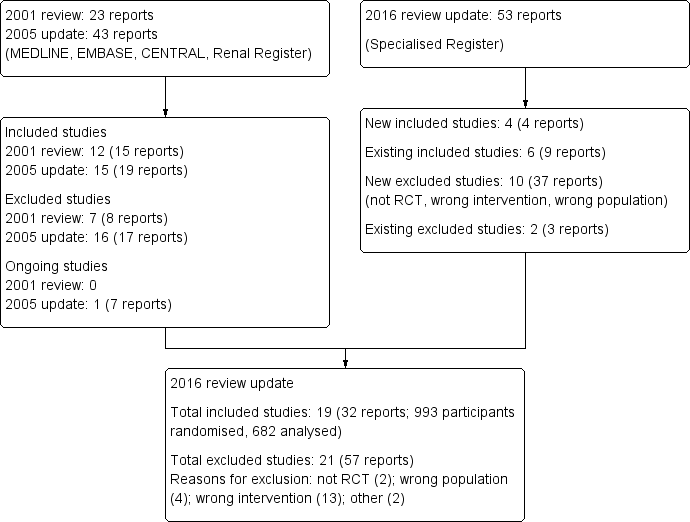
Study flow diagram.
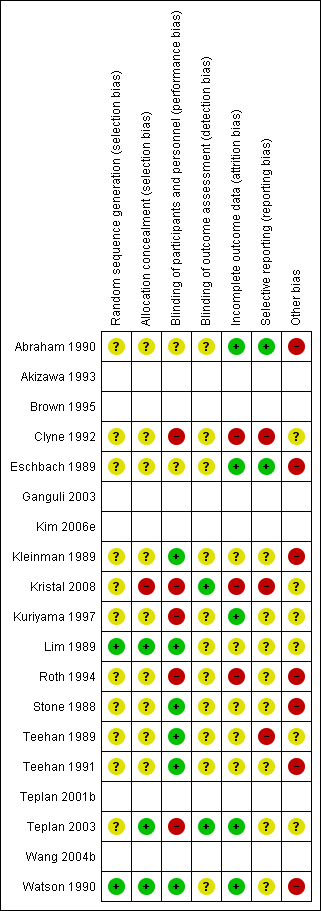
Risk of bias summary: review authors' judgements about each risk of bias item for each included study.
The empty rows relate to abstract‐only publications ‐ risk of bias could not be assessed
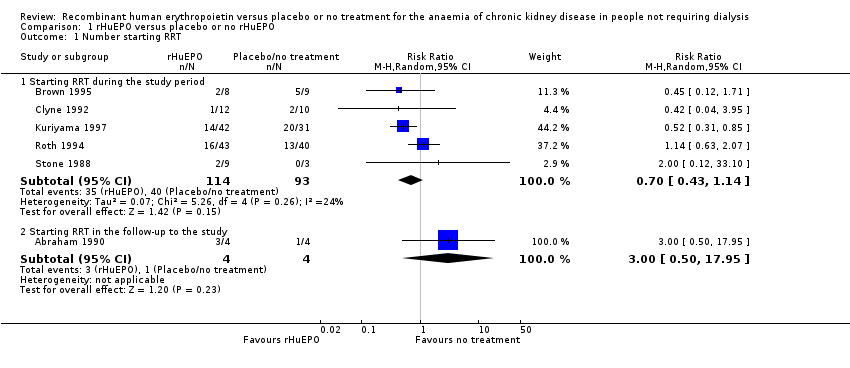
Comparison 1 rHuEPO versus placebo or no rHuEPO, Outcome 1 Number starting RRT.

Comparison 1 rHuEPO versus placebo or no rHuEPO, Outcome 2 GFR.
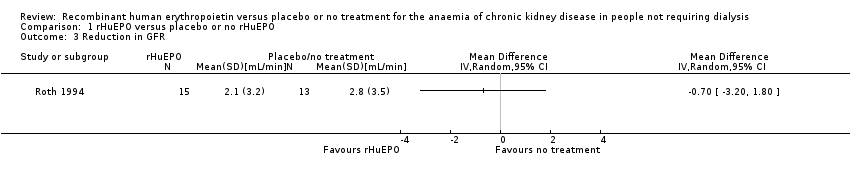
Comparison 1 rHuEPO versus placebo or no rHuEPO, Outcome 3 Reduction in GFR.

Comparison 1 rHuEPO versus placebo or no rHuEPO, Outcome 4 Serum creatinine.
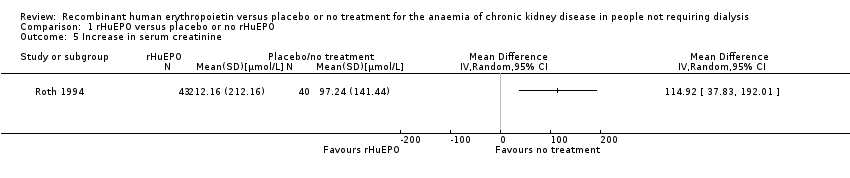
Comparison 1 rHuEPO versus placebo or no rHuEPO, Outcome 5 Increase in serum creatinine.
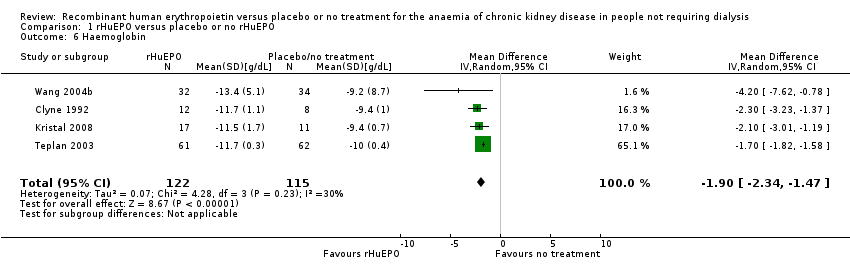
Comparison 1 rHuEPO versus placebo or no rHuEPO, Outcome 6 Haemoglobin.

Comparison 1 rHuEPO versus placebo or no rHuEPO, Outcome 7 Haematocrit.
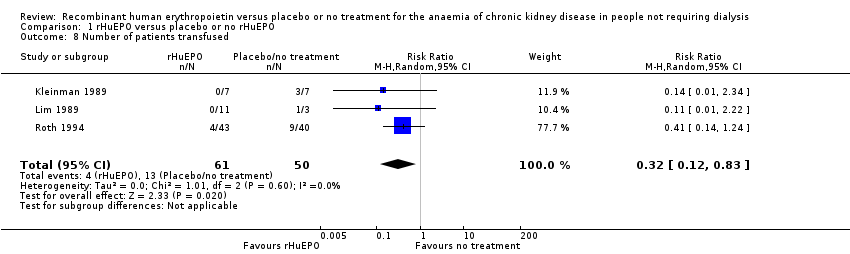
Comparison 1 rHuEPO versus placebo or no rHuEPO, Outcome 8 Number of patients transfused.

Comparison 1 rHuEPO versus placebo or no rHuEPO, Outcome 9 Quality of life measures.

Comparison 1 rHuEPO versus placebo or no rHuEPO, Outcome 10 Change in exercise capacity.
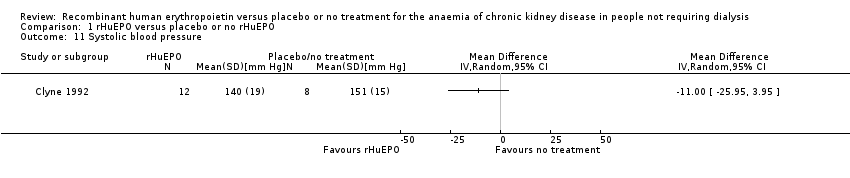
Comparison 1 rHuEPO versus placebo or no rHuEPO, Outcome 11 Systolic blood pressure.

Comparison 1 rHuEPO versus placebo or no rHuEPO, Outcome 12 Diastolic blood pressure.

Comparison 1 rHuEPO versus placebo or no rHuEPO, Outcome 13 Number with an increase or introduction of antihypertensive treatment.

Comparison 1 rHuEPO versus placebo or no rHuEPO, Outcome 14 Number discontinued due to adverse events.
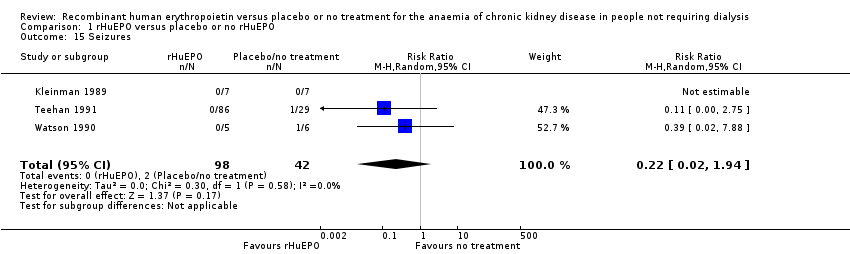
Comparison 1 rHuEPO versus placebo or no rHuEPO, Outcome 15 Seizures.
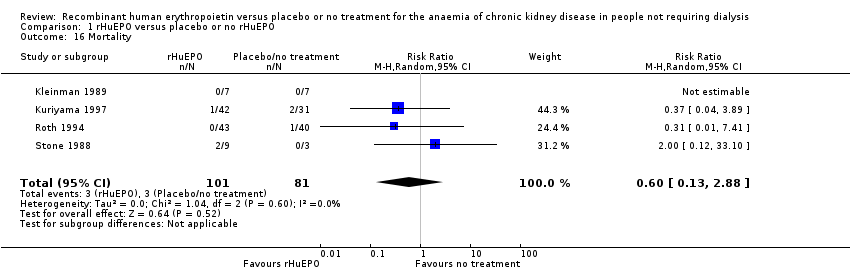
Comparison 1 rHuEPO versus placebo or no rHuEPO, Outcome 16 Mortality.
| Outcome or subgroup title | No. of studies | No. of participants | Statistical method | Effect size |
| 1 Number starting RRT Show forest plot | 6 | Risk Ratio (M‐H, Random, 95% CI) | Subtotals only | |
| 1.1 Starting RRT during the study period | 5 | 207 | Risk Ratio (M‐H, Random, 95% CI) | 0.70 [0.43, 1.14] |
| 1.2 Starting RRT in the follow‐up to the study | 1 | 8 | Risk Ratio (M‐H, Random, 95% CI) | 3.0 [0.50, 17.95] |
| 2 GFR Show forest plot | 7 | 283 | Mean Difference (IV, Random, 95% CI) | ‐2.11 [‐3.08, ‐1.15] |
| 3 Reduction in GFR Show forest plot | 1 | Mean Difference (IV, Random, 95% CI) | Totals not selected | |
| 4 Serum creatinine Show forest plot | 8 | 327 | Mean Difference (IV, Random, 95% CI) | 27.86 [‐32.04, 87.76] |
| 5 Increase in serum creatinine Show forest plot | 1 | Mean Difference (IV, Random, 95% CI) | Totals not selected | |
| 6 Haemoglobin Show forest plot | 4 | 237 | Mean Difference (IV, Random, 95% CI) | ‐1.90 [‐2.34, ‐1.47] |
| 7 Haematocrit Show forest plot | 7 | 145 | Mean Difference (IV, Random, 95% CI) | ‐9.85 [‐11.34, ‐8.35] |
| 8 Number of patients transfused Show forest plot | 3 | 111 | Risk Ratio (M‐H, Random, 95% CI) | 0.32 [0.12, 0.83] |
| 9 Quality of life measures Show forest plot | 1 | Mean Difference (IV, Random, 95% CI) | Totals not selected | |
| 10 Change in exercise capacity Show forest plot | 1 | Mean Difference (IV, Random, 95% CI) | Totals not selected | |
| 11 Systolic blood pressure Show forest plot | 1 | Mean Difference (IV, Random, 95% CI) | Totals not selected | |
| 12 Diastolic blood pressure Show forest plot | 1 | Mean Difference (IV, Random, 95% CI) | Totals not selected | |
| 13 Number with an increase or introduction of antihypertensive treatment Show forest plot | 4 | 232 | Risk Ratio (M‐H, Random, 95% CI) | 1.26 [0.76, 2.11] |
| 14 Number discontinued due to adverse events Show forest plot | 4 | 223 | Risk Ratio (M‐H, Random, 95% CI) | 0.86 [0.28, 2.59] |
| 15 Seizures Show forest plot | 3 | 140 | Risk Ratio (M‐H, Random, 95% CI) | 0.22 [0.02, 1.94] |
| 16 Mortality Show forest plot | 4 | 182 | Risk Ratio (M‐H, Random, 95% CI) | 0.60 [0.13, 2.88] |