Amniocentesis y toma de muestras de vellosidades coriónicas para el diagnóstico prenatal
Referencias
References to studies included in this review
References to studies excluded from this review
Additional references
References to other published versions of this review
Characteristics of studies
Characteristics of included studies [ordered by study ID]
Ir a:
| Methods | Consecutively‐numbered sealed envelopes | |
| Participants | 800 women in early pregnancy requesting prenatal diagnosis | |
| Interventions | 4 operators performed all procedures ‐ TC CVS with Portex cannula or AC at 16 weeks under ultrasound guidance | |
| Outcomes | Pregnancy outcome, abnormal karyotype, antenatal complications, and diagnostic accuracy | |
| Notes | This study was part of the international MRC trial Dates of study: not reported Setting: hospital in Helsinki, Finland Funding: not reported Conflict of interest: not reported | |
| Risk of bias | ||
| Bias | Authors' judgement | Support for judgement |
| Random sequence generation (selection bias) | Low risk | Block randomisation |
| Allocation concealment (selection bias) | Low risk | Allocation concealed in consecutively numbered sealed envelopes |
| Blinding of participants and personnel (performance bias) | Low risk | Not feasible due to nature of intervention. Lack of blinding was not expected to have significant impact on the way main outcomes were assessed and recorded (e.g. pregnancy loss, laboratory failure), and therefore, we did not rate the risk of bias as high. |
| Blinding of outcome assessment (detection bias) | Unclear risk | Not specified |
| Incomplete outcome data (attrition bias) | Low risk | Participants appropriately accounted for, intention‐to‐treat analysis |
| Selective reporting (reporting bias) | Low risk | Specified outcomes reported |
| Other bias | Low risk | Comparable groups |
| Methods | Random telephone allocation using a table of random numbers | |
| Participants | Women requesting fetal karyotyping on the basis of advanced maternal age prior to 12th completed week | |
| Interventions | TC CVS performed from 9th to 13th week of pregnancy using round tipped curved steel forceps after initial ultrasound scan. Procedure performed under direct ultrasound guidance. AC was performed from the 15th to 18th week of pregnancy using 22 G needle under direct ultrasound guidance. | |
| Outcomes | Diagnostic success and fetal loss rate | |
| Notes | Trial prematurely discontinued when second trimester serum biochemistry screening was introduced. 110 women miscarried before the assigned procedure; 68 in the CVS group and 42 in the AC group. In total, the assigned procedure was performed in only 67% of randomised women (681/1011). Dates of study: not reported Setting: hospital in Barcelona, Spain Funding: not reported in translation Conflict of interest: not reported in translation | |
| Risk of bias | ||
| Bias | Authors' judgement | Support for judgement |
| Random sequence generation (selection bias) | Low risk | Randomised using a table of random numbers in blocks of 16 |
| Allocation concealment (selection bias) | Low risk | Allocated via telephone |
| Blinding of participants and personnel (performance bias) | Low risk | Not feasible due to nature of intervention. Lack of blinding was not expected to have significant impact on the way main outcomes were assessed and recorded (e.g. pregnancy loss, laboratory failure), and therefore, we did not rate the risk of bias as high. |
| Blinding of outcome assessment (detection bias) | Unclear risk | Not specified |
| Incomplete outcome data (attrition bias) | High risk | The assigned procedure was performed in 681/1011 women. A large and uneven dropout rate may be a source of significant bias and data from this trial have to be interpreted with caution. |
| Selective reporting (reporting bias) | Low risk | Outcomes appropriately reported |
| Other bias | Unclear risk | Trial prematurely discontinued when second trimester serum biochemistry screening was introduced. We were unsure of the impact of insufficient recruitment to fulfil sample size calculation. |
| Methods | Randomly assigned ‐ method not described | |
| Participants | Inclusion criteria: gestational age 9 to 13 weeks, viable embryo with an intact sac | |
| Interventions | TC performed under direct ultrasound guidance. 16 G cannula passed via the cervix to chorion frondosum and villi aspirated with suction. TA CVS was performed using continuous ultrasound guidance and an 18 G needle passed to reach the border of the chorion frondosum. A 20 G needle was then passed through this first needle and villi aspirated. | |
| Outcomes | Technical difficulty, fetal loss rate, and speed of procedure | |
| Notes | Dates of study: not reported Setting: hospital in Bologna, Italy Funding: not reported Conflict of interest: not reported | |
| Risk of bias | ||
| Bias | Authors' judgement | Support for judgement |
| Random sequence generation (selection bias) | Unclear risk | Method not described |
| Allocation concealment (selection bias) | Unclear risk | Method not described |
| Blinding of participants and personnel (performance bias) | Low risk | Not feasible due to nature of intervention. Lack of blinding was not expected to have significant impact on the way main outcomes were assessed and recorded (e.g. pregnancy loss, laboratory failure), and therefore, we did not rate the risk of bias as high. |
| Blinding of outcome assessment (detection bias) | Unclear risk | Not specified |
| Incomplete outcome data (attrition bias) | Unclear risk | Data appeared accounted for (reported in letter format only) |
| Selective reporting (reporting bias) | Unclear risk | Outcomes reported in letter format |
| Other bias | Low risk | None identified |
| Methods | Randomisation by telephone | |
| Participants | Women aged between 19 and 48 years attending for first trimester fetal diagnosis of genetic diseases. Indications for fetal diagnosis included chromosomal aberration, sex determination for X‐linked diseases, metabolic diseases, DNA analysis for haemoglobinopathies and haemophilias. Gestational age between 8 and 12 weeks. Exclusion criteria: multiple pregnancy, vaginal infection, pending cerclage, vaginal bleeding, and placenta inaccessible via either cervical canal or abdominal wall. | |
| Interventions | TC and TA CVS were performed using a 20 G needle; no more than 2 cannula or needle insertions used in 1 session. | |
| Outcomes | Technical difficulty and quantity of tissue obtained, along with pregnancy outcome | |
| Notes | Dates: March 1986 ‐ July 1988 Setting: hospital in Milan, Italy Funding: partially supported by WHO Hereditary Disease Programme Conflict of interest: not reported | |
| Risk of bias | ||
| Bias | Authors' judgement | Support for judgement |
| Random sequence generation (selection bias) | Low risk | Unstratified block randomisation by telephone |
| Allocation concealment (selection bias) | Low risk | Allocation list held at the trial service unit |
| Blinding of participants and personnel (performance bias) | High risk | Not feasible to blind participants or personnel due to the nature of the comparison. The proportion of cases where the operator deviated from the allocated procedure increased during the study (4.6%, 9.7%,and 15.5% during years 1 to 3). Majority of deviations were in the TC CVS arm, where deviations were 6%, 16%, and 27% in years 1 to 3, respectively. |
| Blinding of outcome assessment (detection bias) | Unclear risk | Not specified |
| Incomplete outcome data (attrition bias) | Low risk | All participants appropriately accounted for, intention‐to‐treat analysis |
| Selective reporting (reporting bias) | Low risk | All specified outcomes reported |
| Other bias | Low risk | Balanced groups |
| Methods | Central randomisation (unknown), and stratified according to age 35 to 38, ≥ 39, and centre. | |
| Participants | Participants from 12 centres in Canada. Eligible women ‐ aged 35 years or older at time of delivery, or those referred for fetal chromosome analysis, less than 12 weeks' gestation, viable singleton intrauterine pregnancy confirmed by ultrasound Women excluded if dead or disorganized embryo, multiple pregnancy, Rh isoimmunisation, untreated cervical infection, or gestation greater than 12 weeks. | |
| Interventions | TC vs second trimester AC | |
| Outcomes | Technical difficulties, abnormal karyotype, pregnancy complications, perinatal loss, neonatal complications, and cytogenetic accuracy | |
| Notes | Dates of study: October 1987 ‐ September 1988 Setting: multiple centres in Canada Funding: Canadian Medical Research Council Conflict of interest: not reported | |
| Risk of bias | ||
| Bias | Authors' judgement | Support for judgement |
| Random sequence generation (selection bias) | Unclear risk | Method not described |
| Allocation concealment (selection bias) | Low risk | Central randomisation by telephone |
| Blinding of participants and personnel (performance bias) | Low risk | Not feasible due to nature of intervention. Lack of blinding was not expected to have significant impact on the way main outcomes were assessed and recorded (e.g. pregnancy loss, laboratory failure), and therefore, we did not rate the risk of bias as high. |
| Blinding of outcome assessment (detection bias) | Unclear risk | Not specified |
| Incomplete outcome data (attrition bias) | Unclear risk | Outcomes not reported for 72 (5.3%) participants randomised to CVS and 90 (6.6%) randomised to AC. 22 and 30 lost to follow‐up in CVS and AC groups respectively. |
| Selective reporting (reporting bias) | Unclear risk | Outcomes not reported for 72 (5.3%) participants randomised to CVS and 90 (6.6%) randomised to AC. |
| Other bias | Low risk | Balanced groups |
| Methods | Telephone randomisation, random allocation list computer generated | |
| Participants | 4368 participants in 12 centres. Inclusion criteria: prenatal diagnosis due to maternal age, newborn baby with a chromosomal abnormality, viable fetus with a CRL of 20 mm to 50 mm on ultrasound, and consent to enter the trial Exclusion criteria: previous open neural tube defect detected by prenatal diagnosis, molecular or biochemical disorders found on prenatal tests, non viable fetus, multiple pregnancy, failed CVS, fetal anomaly or oligohydramnios, active vaginal bleeding, alloimmunised patient, recurrent unexplained miscarriages, intrauterine contraceptive device in utero, previous CEMAT trial randomisation | |
| Interventions | Both groups underwent detailed fetal anomaly ultrasound examination at 15 and 20 weeks. | |
| Outcomes | Pregnancy outcome, congenital anomalies, abnormal karyotype, and technical difficulty | |
| Notes | Dates of study: enrolment from July 1994 to December 1996, follow‐up finished in 1997 Setting: 12 participating centres in Canada Funding: MRC of Canada Clinical Trials Committee Conflict of interest: not reported | |
| Risk of bias | ||
| Bias | Authors' judgement | Support for judgement |
| Random sequence generation (selection bias) | Low risk | Computer generated randomisation |
| Allocation concealment (selection bias) | Low risk | Centralised allocation via telephone |
| Blinding of participants and personnel (performance bias) | Low risk | Not feasible due to nature of intervention. Lack of blinding was not expected to have significant impact on the way main outcomes were assessed and recorded (e.g. pregnancy loss, laboratory failure), and therefore, we did not rate the risk of bias as high. |
| Blinding of outcome assessment (detection bias) | Unclear risk | Not specified |
| Incomplete outcome data (attrition bias) | Low risk | Participants appropriately accounted for, intention‐to‐treat analysis |
| Selective reporting (reporting bias) | Low risk | All specified outcomes reported |
| Other bias | Low risk | Comparable groups |
| Methods | Random assignment | |
| Participants | 3998 patients recruited in 8 US collaborating centres. Inclusion criteria: favourable placental position allowing both procedures to be performed, gestational age between 49 and 90 days Exclusion criteria: active genital herpes, active vaginal bleeding or cervical polyps 1190 randomised to TC CVS and 1163 to TA CVS | |
| Interventions | TA or TC CVS. TC performed with a plastic catheter, and TA with an 18 to 22 G spinal needle | |
| Outcomes | Sampling success, pregnancy outcome | |
| Notes | Initial cohort of 2353 women, who delivered before July 1 1989 Dates of study: April 1987 to September 1989 Setting: hospital in US Funding: not reported Conflict of interest: not reported | |
| Risk of bias | ||
| Bias | Authors' judgement | Support for judgement |
| Random sequence generation (selection bias) | Unclear risk | Randomisation method not described |
| Allocation concealment (selection bias) | Unclear risk | Not specified |
| Blinding of participants and personnel (performance bias) | Low risk | Not feasible due to nature of intervention. Lack of blinding was not expected to have significant impact on the way main outcomes were assessed and recorded (e.g. pregnancy loss, laboratory failure), and therefore, we did not rate the risk of bias as high. |
| Blinding of outcome assessment (detection bias) | Unclear risk | Not specified |
| Incomplete outcome data (attrition bias) | Unclear risk | Outcome not reported for women where sampling was not attempted (3.2%). For the majority of important clinical outcomes including type of pregnancy loss, intention‐to‐treat analysis was not feasible because data were presented only for women with genetically normal pregnancies (91.5%). |
| Selective reporting (reporting bias) | Unclear risk | Outcomes not reported for women where sampling was not attempted (3.2%) |
| Other bias | Low risk | None identified |
| Methods | EA vs TA CVS. Women eligible were given the choice for randomisation or to decide the method of prenatal diagnosis themselves. Allocation was performed using sequentially numbered envelopes. | |
| Participants | Women requesting prenatal diagnosis due to age related risk. 212 women were recruited, 115 agreed to be randomised; 70 chose EA and 25 CVS. 2 women did not participate because fetal death was diagnosed before any intervention. | |
| Interventions | TA CVS was performed using a 20 G needle. | |
| Outcomes | Technical difficulties, abnormal karyotype, pregnancy complications, perinatal loss, neonatal complications, Dutch version of Denver Developmental Screening Test at 6 to 9 months. | |
| Notes | Study stopped after 18 months following advice of the institutional ethics committee due to a higher incidence of fetal loss in the EA group. Dates of study: two years, dates not specified Setting: Leiden University Hospital, the Netherlands Funding: not reported Conflict of interest: not reported | |
| Risk of bias | ||
| Bias | Authors' judgement | Support for judgement |
| Random sequence generation (selection bias) | Unclear risk | Method of randomisation not specified |
| Allocation concealment (selection bias) | Low risk | Sequentially numbered envelopes |
| Blinding of participants and personnel (performance bias) | Low risk | Not feasible due to nature of intervention. Lack of blinding was not expected to have significant impact on the way main outcomes were assessed and recorded (e.g. pregnancy loss, laboratory failure), and therefore, we did not rate the risk of bias as high. |
| Blinding of outcome assessment (detection bias) | Unclear risk | Not specified |
| Incomplete outcome data (attrition bias) | Low risk | All data accounted for |
| Selective reporting (reporting bias) | Low risk | Specified outcomes reported |
| Other bias | Unclear risk | The number of women who did not receive the intervention according to allocation was not evenly distributed between the groups. |
| Methods | Central telephone randomisation. Random allocation in balanced blocks and stratified by centre. Finland ‐ consecutively numbered, sealed, opaque envelopes. | |
| Participants | 3248 recruited from 31 centres in Europe (21 in the UK, 4 in Italy, 2 in the Netherlands, and 1 in Finland, Denmark, Switzerland, and Germany). Prenatal diagnosis due to maternal age. Other indications were anxiety and previously affected child with chromosome anomaly. Centres eligible if each participating obstetrician had performed at least 30 procedures with > 10 mg of tissue in 23 out of 25 most recent cases. 1609 randomised to CVS and 1592 to AC. | |
| Interventions | First trimester CVS TC or TA approach vs second trimester AC | |
| Outcomes | Pregnancy outcome, abnormal karyotype, antenatal complications, and diagnostic accuracy | |
| Notes | Dates of study: recruited from 1985‐1989 Setting: 31 centres in Europe (21 in the UK, 4 in Italy, 2 in the Netherlands, and 1 in Finland, Denmark, Switzerland, and Germany) Funding: grant from Department of Health, UK Conflict of interest: not reported | |
| Risk of bias | ||
| Bias | Authors' judgement | Support for judgement |
| Random sequence generation (selection bias) | Low risk | Block randomisation |
| Allocation concealment (selection bias) | Low risk | Central allocation by telephone. In Finland, consecutively numbered, sealed, opaque envelopes were used. |
| Blinding of participants and personnel (performance bias) | Low risk | Not feasible due to nature of intervention. Lack of blinding was not expected to have significant impact on the way main outcomes were assessed and recorded (e.g. pregnancy loss, laboratory failure), and therefore, we did not rate the risk of bias as high. |
| Blinding of outcome assessment (detection bias) | Unclear risk | Data collected by clinical team, unclear if laboratory staff blinded |
| Incomplete outcome data (attrition bias) | Low risk | Participants appropriately accounted for |
| Selective reporting (reporting bias) | Low risk | Specified outcomes reported |
| Other bias | Low risk | Comparable groups |
| Methods | Sealed opaque envelope containing a card for 1 of the procedures. Not sequentially numbered envelopes. | |
| Participants | Median age 38 years range (22 to 46). Inclusion criteria: ultrasonographic evidence of a viable fetus at 10 to 13 weeks 6 days' gestation (minimum CRL = 38 mm) and maternal request for karyotyping due to advanced maternal age, anxiety, or family history of chromosomal abnormality. Exclusions: increased nuchal translucency, missed abortion, multiple pregnancy, major fetal abnormality, intrauterine device, multiple fibroids, or large placental haemorrhage. EA was performed in 840 women (278 after randomisation), and CVS in 652 women (277 after randomisation). | |
| Interventions | EA vs CVS. Both procedures being carried out by Professor Nicolaides, or under his direct supervision. A freehand technique and a 20 G needle was used for both EA and CVS. | |
| Outcomes | Technical difficulties, abnormal karyotype, pregnancy complications, perinatal loss, and maternal complications | |
| Notes | Aimed to recruit 4400 women. However, by March 1993 recruitment collapsed because of widespread publicity that CVS could cause fetal limb abnormalities, and was associated with a high risk of spontaneous abortion, and that non‐invasive screening by ultrasonography and maternal serum biochemistry could provide sufficient reassurance to avoid invasive testing. Dates of study: January 1990 to March 1993 Setting: hospital in London Funding: not reported Conflict of interest: not reported | |
| Risk of bias | ||
| Bias | Authors' judgement | Support for judgement |
| Random sequence generation (selection bias) | High risk | Randomised with a choice of 2 non‐sequentially numbered envelopes selected by the participant |
| Allocation concealment (selection bias) | Low risk | Allocation concealed in a sealed opaque envelope |
| Blinding of participants and personnel (performance bias) | Low risk | Not feasible due to nature of intervention. Lack of blinding was not expected to have significant impact on the way main outcomes were assessed and recorded (e.g. pregnancy loss, laboratory failure), and therefore, we did not rate the risk of bias as high. |
| Blinding of outcome assessment (detection bias) | Unclear risk | Not specified |
| Incomplete outcome data (attrition bias) | Low risk | Outcome data available for all but 1 participant |
| Selective reporting (reporting bias) | Low risk | All outcomes reported |
| Other bias | High risk | Trial stopped due to adverse publicity regarding risks associated with CVS |
| Methods | Random allocation (method unknown) | |
| Participants | 223 women randomised | |
| Interventions | Mid‐trimester AC with or without 'the obstetrician having the benefit of ultrasound results'. | |
| Outcomes | Number of taps, bloody taps | |
| Notes | Dates of study: not clear Setting: hospital in US Funding: not reported Conflict of interest: not reported | |
| Risk of bias | ||
| Bias | Authors' judgement | Support for judgement |
| Random sequence generation (selection bias) | Unclear risk | Sequence generation not described |
| Allocation concealment (selection bias) | Unclear risk | Not specified |
| Blinding of participants and personnel (performance bias) | Low risk | Not feasible due to nature of intervention. Lack of blinding was not expected to have significant impact on the way main outcomes were assessed and recorded (e.g. pregnancy loss, laboratory failure), and therefore, we did not rate the risk of bias as high. |
| Blinding of outcome assessment (detection bias) | Unclear risk | Not specified |
| Incomplete outcome data (attrition bias) | Low risk | Participants appropriately accounted for |
| Selective reporting (reporting bias) | Low risk | Specified outcomes reported |
| Other bias | Low risk | Comparable groups |
| Methods | Telephone randomisation interactive voice response computer‐based system | |
| Participants | 14 clinical centres. Inclusion criteria: age of mother more than 34 years, previous affected child, positive screening test. Total number of patients = 3775 (CVS group = 1914 and EAC group = 1861) | |
| Interventions | EAC group: 22 G spinal needle, 1 mL for each week CVS ‐ single (19 to 20 G) and double needle technique (18 to 20 G). Larger guide needle to the margin of the chorion | |
| Outcomes | Primary outcome: fetal loss at less than 28 weeks. Secondary outcome: all fetal loss, all neonatal death, oligohydramnios, gestational age at the delivery, IUGR, respiratory distress syndrome, limb reduction defects, talipes equinovarus, other congenital anomalies | |
| Notes | Dates of study: January 1997 ‐ December 2001 Setting: hospitals in Denmark, US, and Canada Funding: The principal funding source was the U.S. National Institute of Child Health and Human Development (NICHD), which approved the design of the trial. Neither the NICHD nor the Centre for Evaluation and Health Technology Assessment of the Danish National Board of Health (which funded continuation of enrolment in 2001) had any role in data collection, analysis, or interpretation of the data. Conflict of interest: Not reported | |
| Risk of bias | ||
| Bias | Authors' judgement | Support for judgement |
| Random sequence generation (selection bias) | Low risk | Computer‐based randomisation (urn method), stratified by clinical centre |
| Allocation concealment (selection bias) | Low risk | Centrally allocated, via telephone using an interactive voice response system |
| Blinding of participants and personnel (performance bias) | Low risk | Not feasible due to nature of intervention. Lack of blinding was not expected to have significant impact on the way main outcomes were assessed and recorded (e.g. pregnancy loss, laboratory failure), and therefore, we did not rate the risk of bias as high. |
| Blinding of outcome assessment (detection bias) | Unclear risk | Not specified |
| Incomplete outcome data (attrition bias) | Low risk | 99.9% of participants randomised were followed through to delivery |
| Selective reporting (reporting bias) | Low risk | Specified outcomes reported |
| Other bias | Low risk | Comparable groups |
| Methods | 3‐way randomisation of low‐risk women (TA vs TC vs AC). A 2‐way randomisation of high‐risk women (TA vs TC). Central randomisation (unknown) with stratification for genetic risk | |
| Participants | 2 centres in Denmark from 1985 to 1990. Eligible low‐risk women: age > 34, or father > 49, history of, or anxiety about chromosomal abnormality, > 3 spontaneous miscarriages with viable fetus at 9 to 11 weeks Eligible high‐risk women: history of translocation, late termination, or fetus at risk of metabolic disorder with a viable fetus at 9 to 11 weeks Exclusions: active bleeding, intrauterine device, genital infection, severe mental illness, use of teratogenic drugs, history of neural tube defects, and discrepant dating | |
| Interventions | CVS vs second trimester AC | |
| Outcomes | Pregnancy outcome, antenatal complications, and diagnostic accuracy | |
| Notes | Dates of study: August 1985 to October 1990 Setting: 2 hospitals in Denmark Funding: This study was supported by grants from Gangstedfonden, Egmont H. Petersens Fond, Fru Lily Benthine Lunds Fond, Rosalie Petersens Fond, Meda A/S, Bruel og Kjaer, S&W Fondet, Tuborgfondet, Unisis Corp., Winterthur‐borgen Legatet, Hafuia Fonden, Kromosomforskningsfonden, and the US National Institute of Child Health and Human Development. Conflict of interest: not reported | |
| Risk of bias | ||
| Bias | Authors' judgement | Support for judgement |
| Random sequence generation (selection bias) | Unclear risk | Not specified |
| Allocation concealment (selection bias) | Low risk | Central allocation via telephone |
| Blinding of participants and personnel (performance bias) | Low risk | Not feasible due to nature of intervention. Lack of blinding was not expected to have significant impact on the way main outcomes were assessed and recorded (e.g. pregnancy loss, laboratory failure), and therefore, we did not rate the risk of bias as high. |
| Blinding of outcome assessment (detection bias) | Unclear risk | Not specified |
| Incomplete outcome data (attrition bias) | Low risk | All data accounted for |
| Selective reporting (reporting bias) | Low risk | Specified outcomes reported |
| Other bias | Low risk | Comparable groups |
| Methods | Central telephone randomisation | |
| Participants | Women aged 35 years or over with risk factors including Down syndrome in the family, a previous child with chromosomal abnormality, a parent who was a carrier of chromosomal abnormalities, history of a diseased or dead offspring, recurrent miscarriage, environmental exposure during pregnancy, or anxiety. All women had a singleton pregnancy and gestational age confirmed by ultrasound. Exclusion criteria: high risk of genetic disease (25% or more), malformation suspected on ultrasound, intrauterine device, uterine haematomas, and malformations 579 women were assigned to CVS, 581 women to EA, and 114/1274 (9%) were excluded | |
| Interventions | TA CVS was performed between 10 and 12 weeks with ultrasound guidance and a needle guide. The double needle technique was used (guide needle of 1.2 mm (18 G) and aspiration needle of 0.8 mm (21 G). | |
| Outcomes | Technical difficulties, abnormal karyotype, pregnancy complications, perinatal loss, neonatal complications. | |
| Notes | Trial was stopped early due to slow recruitment and due to clustering of talipes equinovarus in the EA group. Dates of study: February 1993 ‐ September 1995 Setting: University Hosiptal, Copenhagen Funding: not reported Conflict of interest: not reported | |
| Risk of bias | ||
| Bias | Authors' judgement | Support for judgement |
| Random sequence generation (selection bias) | Unclear risk | Method not specified |
| Allocation concealment (selection bias) | Low risk | Central telephone randomisation |
| Blinding of participants and personnel (performance bias) | Low risk | Not feasible due to nature of intervention. Lack of blinding was not expected to have significant impact on the way main outcomes were assessed and recorded (e.g. pregnancy loss, laboratory failure), and therefore, we did not rate the risk of bias as high. |
| Blinding of outcome assessment (detection bias) | Unclear risk | Not specified |
| Incomplete outcome data (attrition bias) | Low risk | All data accounted for |
| Selective reporting (reporting bias) | Low risk | Specified outcomes reported |
| Other bias | Low risk | None identified |
| Methods | Random allocation according to a table of random numbers. Randomisation code given out by a medical secretary at Rigshospitalet, Copenhagen (majority). Some women were randomised by envelopes (Fredriksborg county). | |
| Participants | 4606 women between ages of 25 and 34 randomised. Exclusion criteria: women believed to be at risk of a child with a chromosomal abnormality, neural tube defect, or increased risk of spontaneous abortion, women with known uterine abnormalities or intrauterine contraceptive devices, multiple gestations | |
| Interventions | Women in the study group were allocated to AC, all of which were carried out at the centre for prenatal diagnosis. The mean gestational age for AC was 16.4 ± 1.1 weeks. AC was carried out with a 20 G needle under direct ultrasound guidance. Women in the control group were allocated to the routine antenatal programme. | |
| Outcomes | Pregnancy outcome, abnormal karyotype and neonatal complications, and congenital abnormalities | |
| Notes | Dates of study: enrolment February 1980 to May 1984 Setting: hospitals in Denmark Funding: This study was supported by the Dagmar Marshall Foundation. Conflict of interest: not reported | |
| Risk of bias | ||
| Bias | Authors' judgement | Support for judgement |
| Random sequence generation (selection bias) | Low risk | Block randomisation generated using a table of random numbers. Allocated separately at each of 2 recruiting centres. |
| Allocation concealment (selection bias) | Unclear risk | Methods state 'randomisation numbers kept in sealed opaque envelopes' in 1 centre, no information for second centre. |
| Blinding of participants and personnel (performance bias) | Low risk | Not feasible due to nature of intervention. Lack of blinding was not expected to have significant impact on the way main outcomes were assessed and recorded (e.g. pregnancy loss, laboratory failure), and therefore, we did not rate the risk of bias as high. |
| Blinding of outcome assessment (detection bias) | Unclear risk | Not specified |
| Incomplete outcome data (attrition bias) | Low risk | 3 women lost to follow‐up following randomisation were excluded from analysis. |
| Selective reporting (reporting bias) | Low risk | Specified outcomes reported |
| Other bias | Low risk | Comparable groups |
| Methods | Random selection (method unknown) | |
| Participants | 44 women between 9 and 12 weeks of gestation | |
| Interventions | Transcervical CVS with ago‐cannula, or TA procedure with a spinal needle (G size unknown) and a suction pistol | |
| Outcomes | Sampling failure, vaginal spotting, and amniotic fluid leak, pregnancy loss | |
| Notes | Dates of study: not clear Setting: hospital in Italy Funding: not reported Conflict of interest: not reported | |
| Risk of bias | ||
| Bias | Authors' judgement | Support for judgement |
| Random sequence generation (selection bias) | Unclear risk | Randomisation method not described |
| Allocation concealment (selection bias) | Unclear risk | Not specified |
| Blinding of participants and personnel (performance bias) | Low risk | Not feasible due to nature of intervention. Lack of blinding was not expected to have significant impact on the way main outcomes were assessed and recorded (e.g. pregnancy loss, laboratory failure), and therefore, we did not rate the risk of bias as high. |
| Blinding of outcome assessment (detection bias) | Unclear risk | Not specified |
| Incomplete outcome data (attrition bias) | Low risk | All participants accounted for |
| Selective reporting (reporting bias) | Low risk | Specified outcomes reported |
| Other bias | Low risk | Comparable groups (stated by authors) |
AC: amniocentesis
CRL: crown rump length
CVS: chorionic villus sampling
EA: early amniocentesis
G: gauge
IUGR: intrauterine growth restriction
TA: transabdominal
TC: transcervical
vs: versus
Characteristics of excluded studies [ordered by study ID]
Ir a:
| Study | Reason for exclusion |
| The trial randomised 86 women to early amniocentesis or CVS in the Uppsala trial. The data for the 86 randomised women were 'lumped together' with the data for 235 women who selected the procedure 'by choice'. Therefore, at present, we were unable to include the randomised data set in the 'intention‐to‐treat' analysis. | |
| This study evaluated the feasibility of midtrimester placental biopsy as an alternative technique of prenatal cytogenetic diagnosis. Mid‐trimester amniocentesis and placental biopsies were performed simultaneously in 92 cases. According to our protocol, this type of study design was not included. | |
| This study compared a short prophylactic treatment with progesterone after amniocentesis with untreated controls. It did not compare 2 different methods of invasive testing. | |
| This study evaluated the role of local anaesthesia in reducing pain during and immediately after the procedure. This study will be included in the Cochrane review that addresses the issue of pain relief during prenatal diagnostic tests. | |
| This study evaluated the role of local anaesthesia (1% lidocaine) versus no anaesthesia before amniocentesis in a diverse population. Immediately after the procedure, subjects were asked to assess their pain using both a Visual Analogue Scale and a 101‐point Numerical Rating Scale. This study will be included in the Cochrane review that addresses the issue of pain relief during prenatal diagnostic tests. | |
| This study evaluated the impact of providing early results in altering maternal anxiety during the waiting period, compared with a policy of telling parents that the results will be issued 'when available' (i.e. variable date). This study will be included in the Cochrane review that addresses the issue of anxiety reduction during prenatal diagnostic tests. | |
| This study compared transabdominal CVS with amniocentesis in 56 multiple pregnancies. It was not clear from the abstract whether this was a randomised study or not. | |
| This trial assessed amniocentesis for the identification of rapid markers of subclinical chorioamnionitis plus cervical cerclage versus cervical cerclage alone in women with cervical incompetence. The population and indication were outside the scope of this review. | |
| This study compared early amniocentesis (12 to 14 weeks) performed with or without amniofiltration technique (29 women in each group). The culture failure was 13.8% in the amniofiltration group compared with 10.3% in the control group. However, the method of randomisation was not described. | |
| In this study, amniocentesis was performed to assess fetal lung maturity with only 10.2% of the procedures carried out before 36 weeks' gestation. | |
| This study evaluated the impact of early reporting of the results obtained from polymerase chain reaction on amniotic fluid cells (amnio‐PCR) on anxiety levels in women with positive biochemical screening for Down syndrome. This study will be included in the Cochrane review that addresses the issue of anxiety reduction during prenatal diagnostic tests. | |
| This study evaluated the role of ultrasound immediately before genetic amniocentesis. The patients were 'alternately assigned' to the 'with ultrasound' and 'without ultrasound' groups. According to our protocol, quasi‐randomised protocols such as alternative allocations were not included. | |
| In this study, amniocentesis was performed later in pregnancy in women with proteinuric hypertension. | |
| This is an abstract of the study that compared the clinical and laboratory result of first trimester transvaginal amniocentesis with those of CVS and mid‐trimester amniocentesis. It had a matched case‐control study design. It did not meet inclusion criteria of this review. | |
| This study reported on a comparison between 15 transcervical and 15 transabdominal CVS procedures in terms of the specimen size and change in maternal serum alpha‐feto‐protein levels. Some women were selected by 'choice' and others took part in the NICH study comparing CVS and amniocentesis (Rhoads GG, Jackson LG, Schlesselman SE, de la Cruz FF, Desnick RJ, Golbus MS et al. The safety and efficacy of CVS for early prenatal diagnosis of cytogenetic abnormalities. New England Journal of Medicine 1989;320(10):609‐17). Therefore, this study did not fulfil our criteria for randomised study. | |
| This study was a part of a randomised control study performed by NICHD EATA Trial Group. It evaluated the relationship between placental penetration during amniocentesis or CVS and the development of gestational hypertension/pre‐eclampsia. | |
| This study evaluated the role of therapeutic massage in reducing pain during and immediately after the procedure. This study will be included in the Cochrane review that addresses the issue of pain relief during prenatal diagnostic tests. | |
| This study determined whether pain associated with second trimester genetic amniocentesis was decreased by using subfreezing rather than room temperature needles. This study will be included in the Cochrane review that addresses the issue of pain relief during prenatal diagnostic tests. | |
| This study evaluated the efficiency and safety of individual invasive methods of prenatal diagnosis. This study was not a randomised controlled study but was based on a population cohort of Institute for Mother and Child Care in Czech Republic. Data were represented in an abstract form for the conference proceeding. |
CVS: chorionic villus sampling
Data and analyses
| Outcome or subgroup title | No. of studies | No. of participants | Statistical method | Effect size |
| 1 All known pregnancy loss (including termination of pregnancy) Show forest plot | 1 | 4606 | Risk Ratio (M‐H, Random, 95% CI) | 1.41 [0.99, 2.00] |
| Analysis 1.1  Comparison 1 Second trimester amniocentesis (AC) versus control (no testing), Outcome 1 All known pregnancy loss (including termination of pregnancy). | ||||
| 2 Spontaneous miscarriage Show forest plot | 1 | 4606 | Risk Ratio (M‐H, Random, 95% CI) | 1.60 [1.02, 2.52] |
| Analysis 1.2  Comparison 1 Second trimester amniocentesis (AC) versus control (no testing), Outcome 2 Spontaneous miscarriage. | ||||
| 3 Non‐compliance with allocated procedure Show forest plot | 1 | 4606 | Risk Ratio (M‐H, Random, 95% CI) | 1.73 [1.03, 2.91] |
| Analysis 1.3  Comparison 1 Second trimester amniocentesis (AC) versus control (no testing), Outcome 3 Non‐compliance with allocated procedure. | ||||
| 4 Multiple insertions Show forest plot | 1 | 4606 | Risk Ratio (M‐H, Random, 95% CI) | 91.08 [5.61, 1477.53] |
| Analysis 1.4  Comparison 1 Second trimester amniocentesis (AC) versus control (no testing), Outcome 4 Multiple insertions. | ||||
| 5 Second test performed Show forest plot | 1 | 4606 | Risk Ratio (M‐H, Random, 95% CI) | 41.04 [2.48, 678.07] |
| Analysis 1.5  Comparison 1 Second trimester amniocentesis (AC) versus control (no testing), Outcome 5 Second test performed. | ||||
| 6 Laboratory failure Show forest plot | 1 | 4606 | Risk Ratio (M‐H, Random, 95% CI) | 27.02 [1.61, 454.31] |
| Analysis 1.6  Comparison 1 Second trimester amniocentesis (AC) versus control (no testing), Outcome 6 Laboratory failure. | ||||
| 7 All non‐mosaic abnormalities Show forest plot | 1 | 4593 | Risk Ratio (M‐H, Random, 95% CI) | 30.85 [1.85, 515.31] |
| Analysis 1.7  Comparison 1 Second trimester amniocentesis (AC) versus control (no testing), Outcome 7 All non‐mosaic abnormalities. | ||||
| 8 Vaginal bleeding after test Show forest plot | 1 | 4606 | Risk Ratio (M‐H, Random, 95% CI) | 0.95 [0.66, 1.37] |
| Analysis 1.8  Comparison 1 Second trimester amniocentesis (AC) versus control (no testing), Outcome 8 Vaginal bleeding after test. | ||||
| 9 Amniotic leakage after test Show forest plot | 1 | 4606 | Risk Ratio (M‐H, Random, 95% CI) | 3.90 [1.95, 7.80] |
| Analysis 1.9  Comparison 1 Second trimester amniocentesis (AC) versus control (no testing), Outcome 9 Amniotic leakage after test. | ||||
| 10 Termination of pregnancy (all) Show forest plot | 1 | 4606 | Risk Ratio (M‐H, Random, 95% CI) | 2.50 [0.97, 6.44] |
| Analysis 1.10  Comparison 1 Second trimester amniocentesis (AC) versus control (no testing), Outcome 10 Termination of pregnancy (all). | ||||
| 11 Perinatal deaths Show forest plot | 1 | 4606 | Risk Ratio (M‐H, Random, 95% CI) | 0.63 [0.28, 1.38] |
| Analysis 1.11  Comparison 1 Second trimester amniocentesis (AC) versus control (no testing), Outcome 11 Perinatal deaths. | ||||
| 12 Stillbirths Show forest plot | 1 | 4606 | Risk Ratio (M‐H, Random, 95% CI) | 0.83 [0.36, 1.93] |
| Analysis 1.12  Comparison 1 Second trimester amniocentesis (AC) versus control (no testing), Outcome 12 Stillbirths. | ||||
| 13 Neonatal deaths Show forest plot | 1 | 4606 | Risk Ratio (M‐H, Random, 95% CI) | 0.11 [0.01, 2.06] |
| Analysis 1.13  Comparison 1 Second trimester amniocentesis (AC) versus control (no testing), Outcome 13 Neonatal deaths. | ||||
| 14 All recorded deaths after viability Show forest plot | 1 | 4606 | Risk Ratio (M‐H, Random, 95% CI) | 0.63 [0.28, 1.38] |
| Analysis 1.14  Comparison 1 Second trimester amniocentesis (AC) versus control (no testing), Outcome 14 All recorded deaths after viability. | ||||
| 15 Anomalies (all recorded) Show forest plot | 1 | 4507 | Risk Ratio (M‐H, Random, 95% CI) | 0.93 [0.62, 1.39] |
| Analysis 1.15  Comparison 1 Second trimester amniocentesis (AC) versus control (no testing), Outcome 15 Anomalies (all recorded). | ||||
| 16 Talipes Show forest plot | 1 | 4507 | Risk Ratio (M‐H, Random, 95% CI) | 0.68 [0.37, 1.22] |
| Analysis 1.16  Comparison 1 Second trimester amniocentesis (AC) versus control (no testing), Outcome 16 Talipes. | ||||
| 17 Neonatal respiratory distress syndrome Show forest plot | 1 | 4507 | Risk Ratio (M‐H, Random, 95% CI) | 2.11 [1.06, 4.19] |
| Analysis 1.17  Comparison 1 Second trimester amniocentesis (AC) versus control (no testing), Outcome 17 Neonatal respiratory distress syndrome. | ||||
| Outcome or subgroup title | No. of studies | No. of participants | Statistical method | Effect size |
| 1 All known pregnancy loss (including termination of pregnancy) Show forest plot | 1 | 4334 | Risk Ratio (M‐H, Random, 95% CI) | 1.29 [1.03, 1.61] |
| Analysis 2.1  Comparison 2 Early versus second trimester amniocentesis (AC), Outcome 1 All known pregnancy loss (including termination of pregnancy). | ||||
| 2 Spontaneous miscarriage Show forest plot | 1 | 4334 | Risk Ratio (M‐H, Random, 95% CI) | 1.41 [1.00, 1.98] |
| Analysis 2.2  Comparison 2 Early versus second trimester amniocentesis (AC), Outcome 2 Spontaneous miscarriage. | ||||
| 3 Spontaneous miscarriage after test Show forest plot | 1 | 4334 | Risk Ratio (M‐H, Random, 95% CI) | 3.22 [1.88, 5.53] |
| Analysis 2.3  Comparison 2 Early versus second trimester amniocentesis (AC), Outcome 3 Spontaneous miscarriage after test. | ||||
| 4 Non‐compliance with allocated procedure Show forest plot | 1 | 4368 | Risk Ratio (M‐H, Random, 95% CI) | 0.65 [0.57, 0.75] |
| Analysis 2.4  Comparison 2 Early versus second trimester amniocentesis (AC), Outcome 4 Non‐compliance with allocated procedure. | ||||
| 5 Sampling failure Show forest plot | 1 | 629 | Risk Ratio (M‐H, Random, 95% CI) | 4.53 [0.53, 38.56] |
| Analysis 2.5  Comparison 2 Early versus second trimester amniocentesis (AC), Outcome 5 Sampling failure. | ||||
| 6 Multiple insertions Show forest plot | 1 | 4368 | Risk Ratio (M‐H, Random, 95% CI) | 2.79 [1.92, 4.04] |
| Analysis 2.6  Comparison 2 Early versus second trimester amniocentesis (AC), Outcome 6 Multiple insertions. | ||||
| 7 Second test performed Show forest plot | 1 | 4107 | Risk Ratio (M‐H, Random, 95% CI) | 8.72 [3.47, 21.91] |
| Analysis 2.7  Comparison 2 Early versus second trimester amniocentesis (AC), Outcome 7 Second test performed. | ||||
| 8 Laboratory failure Show forest plot | 1 | 4368 | Risk Ratio (M‐H, Random, 95% CI) | 9.76 [3.49, 27.26] |
| Analysis 2.8  Comparison 2 Early versus second trimester amniocentesis (AC), Outcome 8 Laboratory failure. | ||||
| 9 All non‐mosaic abnormalities Show forest plot | 1 | 4368 | Risk Ratio (M‐H, Random, 95% CI) | 1.11 [0.75, 1.66] |
| Analysis 2.9  Comparison 2 Early versus second trimester amniocentesis (AC), Outcome 9 All non‐mosaic abnormalities. | ||||
| 10 True mosaics Show forest plot | 1 | 4368 | Risk Ratio (M‐H, Random, 95% CI) | 1.00 [0.25, 4.00] |
| Analysis 2.10  Comparison 2 Early versus second trimester amniocentesis (AC), Outcome 10 True mosaics. | ||||
| 11 Maternal contamination Show forest plot | 1 | 4368 | Risk Ratio (M‐H, Random, 95% CI) | 2.00 [0.37, 10.92] |
| Analysis 2.11  Comparison 2 Early versus second trimester amniocentesis (AC), Outcome 11 Maternal contamination. | ||||
| 12 Known false negative after birth Show forest plot | 1 | Risk Ratio (M‐H, Random, 95% CI) | Subtotals only | |
| Analysis 2.12  Comparison 2 Early versus second trimester amniocentesis (AC), Outcome 12 Known false negative after birth. | ||||
| 12.1 False negative chromosomal results (excluding sex determination) | 1 | 4368 | Risk Ratio (M‐H, Random, 95% CI) | 3.00 [0.12, 73.67] |
| 12.2 Incorrect sex determination | 1 | 4368 | Risk Ratio (M‐H, Random, 95% CI) | 5.00 [0.24, 104.18] |
| 13 Reporting time Show forest plot | 1 | 4107 | Mean Difference (IV, Random, 95% CI) | 1.20 [0.89, 1.51] |
| Analysis 2.13  Comparison 2 Early versus second trimester amniocentesis (AC), Outcome 13 Reporting time. | ||||
| 14 Amniotic leakage after test Show forest plot | 1 | 4368 | Risk Ratio (M‐H, Random, 95% CI) | 2.05 [1.43, 2.94] |
| Analysis 2.14  Comparison 2 Early versus second trimester amniocentesis (AC), Outcome 14 Amniotic leakage after test. | ||||
| 15 Termination of pregnancy (all) Show forest plot | 1 | 4334 | Risk Ratio (M‐H, Random, 95% CI) | 1.26 [0.89, 1.77] |
| Analysis 2.15  Comparison 2 Early versus second trimester amniocentesis (AC), Outcome 15 Termination of pregnancy (all). | ||||
| 16 Stillbirths Show forest plot | 1 | 4334 | Risk Ratio (M‐H, Random, 95% CI) | 0.73 [0.34, 1.59] |
| Analysis 2.16  Comparison 2 Early versus second trimester amniocentesis (AC), Outcome 16 Stillbirths. | ||||
| 17 Neonatal deaths Show forest plot | 1 | 4334 | Risk Ratio (M‐H, Random, 95% CI) | 4.98 [0.58, 42.56] |
| Analysis 2.17  Comparison 2 Early versus second trimester amniocentesis (AC), Outcome 17 Neonatal deaths. | ||||
| 18 All recorded deaths after viability Show forest plot | 1 | 4334 | Risk Ratio (M‐H, Random, 95% CI) | 1.00 [0.50, 1.99] |
| Analysis 2.18  Comparison 2 Early versus second trimester amniocentesis (AC), Outcome 18 All recorded deaths after viability. | ||||
| 19 Anomalies (all recorded) Show forest plot | 1 | 4334 | Risk Ratio (M‐H, Random, 95% CI) | 1.73 [1.26, 2.38] |
| Analysis 2.19  Comparison 2 Early versus second trimester amniocentesis (AC), Outcome 19 Anomalies (all recorded). | ||||
| 20 Talipes Show forest plot | 1 | Risk Ratio (M‐H, Random, 95% CI) | Subtotals only | |
| Analysis 2.20  Comparison 2 Early versus second trimester amniocentesis (AC), Outcome 20 Talipes. | ||||
| 20.1 Talipes equinovarus | 1 | 4334 | Risk Ratio (M‐H, Random, 95% CI) | 14.43 [3.45, 60.41] |
| Outcome or subgroup title | No. of studies | No. of participants | Statistical method | Effect size |
| 1 All known pregnancy loss (including termination of pregnancy) Show forest plot | 5 | Risk Ratio (M‐H, Random, 95% CI) | Subtotals only | |
| Analysis 3.1  Comparison 3 Chorionic villus sampling (CVS) versus second trimester amniocentesis (AC), Outcome 1 All known pregnancy loss (including termination of pregnancy). | ||||
| 1.1 Transcervical CVS versus amniocentesis | 4 | 6527 | Risk Ratio (M‐H, Random, 95% CI) | 1.40 [1.09, 1.81] |
| 1.2 Transabdominal CVS versus amniocentesis | 1 | 2234 | Risk Ratio (M‐H, Random, 95% CI) | 0.90 [0.66, 1.23] |
| 1.3 CVS (any route) versus amniocentesis | 2 | 6503 | Risk Ratio (M‐H, Random, 95% CI) | 1.43 [1.22, 1.67] |
| 2 Spontaneous miscarriage Show forest plot | 4 | Risk Ratio (M‐H, Random, 95% CI) | Subtotals only | |
| Analysis 3.2  Comparison 3 Chorionic villus sampling (CVS) versus second trimester amniocentesis (AC), Outcome 2 Spontaneous miscarriage. | ||||
| 2.1 Transcervical CVS versus amniocentesis | 3 | 5506 | Risk Ratio (M‐H, Random, 95% CI) | 1.50 [1.07, 2.11] |
| 2.2 Transabdominal CVS versus amniocentesis | 1 | 2069 | Risk Ratio (M‐H, Random, 95% CI) | 0.77 [0.49, 1.21] |
| 2.3 CVS (any route) versus amniocentesis | 2 | 6280 | Risk Ratio (M‐H, Random, 95% CI) | 1.51 [1.23, 1.85] |
| 3 Spontaneous miscarriage after test Show forest plot | 3 | Risk Ratio (M‐H, Random, 95% CI) | Subtotals only | |
| Analysis 3.3  Comparison 3 Chorionic villus sampling (CVS) versus second trimester amniocentesis (AC), Outcome 3 Spontaneous miscarriage after test. | ||||
| 3.1 Transcervical CVS versus amniocentesis | 2 | 1579 | Risk Ratio (M‐H, Random, 95% CI) | 1.77 [0.28, 11.00] |
| 3.2 CVS (any route) versus amniocentesis | 1 | 3201 | Risk Ratio (M‐H, Random, 95% CI) | 3.46 [2.21, 5.42] |
| 4 Non‐compliance with allocated procedure Show forest plot | 4 | Risk Ratio (M‐H, Random, 95% CI) | Subtotals only | |
| Analysis 3.4  Comparison 3 Chorionic villus sampling (CVS) versus second trimester amniocentesis (AC), Outcome 4 Non‐compliance with allocated procedure. | ||||
| 4.1 Transcervical CVS versus amniocentesis | 3 | 4595 | Risk Ratio (M‐H, Random, 95% CI) | 0.51 [0.14, 1.87] |
| 4.2 CVS (any route) versus amniocentesis | 1 | 3197 | Risk Ratio (M‐H, Random, 95% CI) | 0.66 [0.52, 0.83] |
| 5 Sampling failure Show forest plot | 2 | Risk Ratio (M‐H, Random, 95% CI) | Subtotals only | |
| Analysis 3.5  Comparison 3 Chorionic villus sampling (CVS) versus second trimester amniocentesis (AC), Outcome 5 Sampling failure. | ||||
| 5.1 Transervical CVS versus amniocentesis | 1 | 797 | Risk Ratio (M‐H, Random, 95% CI) | 0.55 [0.26, 1.19] |
| 5.2 CVS (any route) versus amniocentesis | 1 | 3201 | Risk Ratio (M‐H, Random, 95% CI) | 3.09 [1.98, 4.82] |
| 6 Multiple insertions Show forest plot | 2 | Risk Ratio (M‐H, Random, 95% CI) | Subtotals only | |
| Analysis 3.6  Comparison 3 Chorionic villus sampling (CVS) versus second trimester amniocentesis (AC), Outcome 6 Multiple insertions. | ||||
| 6.1 Transcervical CVS versus amniocentesis | 1 | 794 | Risk Ratio (M‐H, Random, 95% CI) | 3.93 [2.72, 5.68] |
| 6.2 CVS (any route) versus amniocentesis | 1 | 2917 | Risk Ratio (M‐H, Random, 95% CI) | 4.85 [3.92, 6.01] |
| 7 Second test performed Show forest plot | 4 | Risk Ratio (M‐H, Random, 95% CI) | Subtotals only | |
| Analysis 3.7  Comparison 3 Chorionic villus sampling (CVS) versus second trimester amniocentesis (AC), Outcome 7 Second test performed. | ||||
| 7.1 Transcervical CVS versus amniocentesis | 3 | 4256 | Risk Ratio (M‐H, Random, 95% CI) | 19.63 [1.24, 309.90] |
| 7.2 CVS (any route) versus amniocentesis | 1 | 3201 | Risk Ratio (M‐H, Random, 95% CI) | 2.83 [1.94, 4.13] |
| 8 Laboratory failure Show forest plot | 3 | Risk Ratio (M‐H, Random, 95% CI) | Subtotals only | |
| Analysis 3.8  Comparison 3 Chorionic villus sampling (CVS) versus second trimester amniocentesis (AC), Outcome 8 Laboratory failure. | ||||
| 8.1 Transcervical CVS versus amniocentesis | 2 | 2792 | Risk Ratio (M‐H, Random, 95% CI) | 22.62 [3.07, 166.89] |
| 8.2 CVS (any route) versus amniocentesis | 1 | 3201 | Risk Ratio (M‐H, Random, 95% CI) | 0.77 [0.29, 2.06] |
| 9 All non‐mosaic abnormalities Show forest plot | 2 | Risk Ratio (M‐H, Random, 95% CI) | Subtotals only | |
| Analysis 3.9  Comparison 3 Chorionic villus sampling (CVS) versus second trimester amniocentesis (AC), Outcome 9 All non‐mosaic abnormalities. | ||||
| 9.1 Transcervical CVS versus amniocentesis | 2 | 2667 | Risk Ratio (M‐H, Random, 95% CI) | 1.12 [0.73, 1.72] |
| 10 True mosaics Show forest plot | 1 | Risk Ratio (M‐H, Random, 95% CI) | Subtotals only | |
| Analysis 3.10  Comparison 3 Chorionic villus sampling (CVS) versus second trimester amniocentesis (AC), Outcome 10 True mosaics. | ||||
| 10.1 Transcervical CVS versus amniocentesis | 1 | 672 | Risk Ratio (M‐H, Random, 95% CI) | 3.42 [0.14, 83.63] |
| 11 Confined mosaics Show forest plot | 1 | Risk Ratio (M‐H, Random, 95% CI) | Subtotals only | |
| Analysis 3.11  Comparison 3 Chorionic villus sampling (CVS) versus second trimester amniocentesis (AC), Outcome 11 Confined mosaics. | ||||
| 11.1 Transcervical CVS versus amniocentesis | 1 | 1995 | Risk Ratio (M‐H, Random, 95% CI) | 5.66 [1.97, 16.24] |
| 12 Maternal contamination Show forest plot | 2 | Risk Ratio (M‐H, Random, 95% CI) | Subtotals only | |
| Analysis 3.12  Comparison 3 Chorionic villus sampling (CVS) versus second trimester amniocentesis (AC), Outcome 12 Maternal contamination. | ||||
| 12.1 Transcervical CVS versus amniocentesis | 1 | 1991 | Risk Ratio (M‐H, Random, 95% CI) | 12.30 [3.81, 39.67] |
| 12.2 CVS (any route) versus amniocentesis | 1 | 3201 | Risk Ratio (M‐H, Random, 95% CI) | 8.90 [0.48, 165.26] |
| 13 Known false positive after birth Show forest plot | 3 | Risk Ratio (M‐H, Random, 95% CI) | Subtotals only | |
| Analysis 3.13  Comparison 3 Chorionic villus sampling (CVS) versus second trimester amniocentesis (AC), Outcome 13 Known false positive after birth. | ||||
| 13.1 Transcervical CVS versus amniocentesis | 2 | 2627 | Risk Ratio (M‐H, Random, 95% CI) | 4.40 [0.46, 42.38] |
| 13.2 CVS (any route) versus amniocentesis | 1 | 3201 | Risk Ratio (M‐H, Random, 95% CI) | 0.99 [0.06, 15.80] |
| 14 Known false negative after birth Show forest plot | 3 | Risk Ratio (M‐H, Random, 95% CI) | Subtotals only | |
| Analysis 3.14  Comparison 3 Chorionic villus sampling (CVS) versus second trimester amniocentesis (AC), Outcome 14 Known false negative after birth. | ||||
| 14.1 Transcervical CVS versus amniocentesis | 2 | 2627 | Risk Ratio (M‐H, Random, 95% CI) | 7.84 [0.41, 151.61] |
| 14.2 CVS (any route) versus amniocentesis | 1 | 3201 | Risk Ratio (M‐H, Random, 95% CI) | 2.97 [0.12, 72.81] |
| 15 Results given in less than 7 days (not pre‐specified) Show forest plot | 1 | Risk Ratio (M‐H, Random, 95% CI) | Subtotals only | |
| Analysis 3.15  Comparison 3 Chorionic villus sampling (CVS) versus second trimester amniocentesis (AC), Outcome 15 Results given in less than 7 days (not pre‐specified). | ||||
| 15.1 CVS (any route) versus amniocentesis | 1 | 3099 | Risk Ratio (M‐H, Random, 95% CI) | 23.52 [12.54, 44.10] |
| 16 Results given in less than 14 days (not pre‐specified) Show forest plot | 1 | Risk Ratio (M‐H, Random, 95% CI) | Subtotals only | |
| Analysis 3.16  Comparison 3 Chorionic villus sampling (CVS) versus second trimester amniocentesis (AC), Outcome 16 Results given in less than 14 days (not pre‐specified). | ||||
| 16.1 CVS (any route) versus amniocentesis | 1 | 3099 | Risk Ratio (M‐H, Random, 95% CI) | 3.96 [3.17, 4.95] |
| 17 Results given in less than 21 days (not pre‐specified) Show forest plot | 1 | Risk Ratio (M‐H, Random, 95% CI) | Subtotals only | |
| Analysis 3.17  Comparison 3 Chorionic villus sampling (CVS) versus second trimester amniocentesis (AC), Outcome 17 Results given in less than 21 days (not pre‐specified). | ||||
| 17.1 CVS (any route) versus amniocentesis | 1 | 3099 | Risk Ratio (M‐H, Random, 95% CI) | 0.72 [0.63, 0.82] |
| 18 Result given after 21 days (not pre‐specified) Show forest plot | 1 | Risk Ratio (M‐H, Random, 95% CI) | Subtotals only | |
| Analysis 3.18  Comparison 3 Chorionic villus sampling (CVS) versus second trimester amniocentesis (AC), Outcome 18 Result given after 21 days (not pre‐specified). | ||||
| 18.1 CVS (any route) versus amniocentesis | 1 | 3099 | Risk Ratio (M‐H, Random, 95% CI) | 0.33 [0.28, 0.39] |
| 19 Vaginal bleeding after test Show forest plot | 2 | Risk Ratio (M‐H, Random, 95% CI) | Subtotals only | |
| Analysis 3.19  Comparison 3 Chorionic villus sampling (CVS) versus second trimester amniocentesis (AC), Outcome 19 Vaginal bleeding after test. | ||||
| 19.1 Transcervical CVS versus amniocentesis | 2 | 3193 | Risk Ratio (M‐H, Random, 95% CI) | 11.48 [2.58, 51.08] |
| 20 Amniotic leakage after test Show forest plot | 2 | Risk Ratio (M‐H, Random, 95% CI) | Subtotals only | |
| Analysis 3.20  Comparison 3 Chorionic villus sampling (CVS) versus second trimester amniocentesis (AC), Outcome 20 Amniotic leakage after test. | ||||
| 20.1 Transabdominal CVS vs amniocentesis | 1 | 1485 | Risk Ratio (M‐H, Random, 95% CI) | 2.53 [0.81, 7.92] |
| 20.2 CVS (any route) versus amniocentesis | 1 | 3201 | Risk Ratio (M‐H, Random, 95% CI) | 0.55 [0.18, 1.64] |
| 21 Vaginal bleeding after 20 weeks Show forest plot | 2 | Risk Ratio (M‐H, Random, 95% CI) | Subtotals only | |
| Analysis 3.21  Comparison 3 Chorionic villus sampling (CVS) versus second trimester amniocentesis (AC), Outcome 21 Vaginal bleeding after 20 weeks. | ||||
| 21.1 Transcervical CVS versus amniocentesis | 1 | 797 | Risk Ratio (M‐H, Random, 95% CI) | 1.44 [0.62, 3.33] |
| 21.2 CVS (any route) versus amniocentesis | 1 | 3201 | Risk Ratio (M‐H, Random, 95% CI) | 0.99 [0.69, 1.42] |
| 22 Pre‐labour ruptured membranes before 28 weeks Show forest plot | 2 | Risk Ratio (M‐H, Random, 95% CI) | Subtotals only | |
| Analysis 3.22  Comparison 3 Chorionic villus sampling (CVS) versus second trimester amniocentesis (AC), Outcome 22 Pre‐labour ruptured membranes before 28 weeks. | ||||
| 22.1 Transcervical CVS versus amniocentesis | 1 | 722 | Risk Ratio (M‐H, Random, 95% CI) | 4.97 [1.45, 17.03] |
| 22.2 CVS (any route) versus amniocentesis | 1 | 2765 | Risk Ratio (M‐H, Random, 95% CI) | 1.60 [0.80, 3.17] |
| 23 Antenatal hospital admission Show forest plot | 2 | Risk Ratio (M‐H, Random, 95% CI) | Subtotals only | |
| Analysis 3.23  Comparison 3 Chorionic villus sampling (CVS) versus second trimester amniocentesis (AC), Outcome 23 Antenatal hospital admission. | ||||
| 23.1 Transcervical CVS versus amniocentesis | 1 | 780 | Risk Ratio (M‐H, Random, 95% CI) | 1.47 [0.81, 2.68] |
| 23.2 CVS (any route) versus amniocentesis | 1 | 3201 | Risk Ratio (M‐H, Random, 95% CI) | 0.90 [0.75, 1.08] |
| 24 Delivery before 37 weeks Show forest plot | 3 | Risk Ratio (M‐H, Random, 95% CI) | Subtotals only | |
| Analysis 3.24  Comparison 3 Chorionic villus sampling (CVS) versus second trimester amniocentesis (AC), Outcome 24 Delivery before 37 weeks. | ||||
| 24.1 Transcervical CVS versus amniocentesis | 2 | 2506 | Risk Ratio (M‐H, Random, 95% CI) | 1.29 [0.67, 2.47] |
| 24.2 CVS (any route) versus amniocentesis | 1 | 3189 | Risk Ratio (M‐H, Random, 95% CI) | 1.33 [1.13, 1.57] |
| 25 Delivery before 33 weeks Show forest plot | 1 | Risk Ratio (M‐H, Random, 95% CI) | Subtotals only | |
| Analysis 3.25  Comparison 3 Chorionic villus sampling (CVS) versus second trimester amniocentesis (AC), Outcome 25 Delivery before 33 weeks. | ||||
| 25.1 Transcervical CVS versus amniocentesis | 1 | 768 | Risk Ratio (M‐H, Random, 95% CI) | 2.16 [0.94, 4.94] |
| 26 Termination of pregnancy (all) Show forest plot | 3 | Risk Difference (M‐H, Random, 95% CI) | Subtotals only | |
| Analysis 3.26  Comparison 3 Chorionic villus sampling (CVS) versus second trimester amniocentesis (AC), Outcome 26 Termination of pregnancy (all). | ||||
| 26.1 Transcervical CVS versus amniocentesis | 2 | 3454 | Risk Difference (M‐H, Random, 95% CI) | ‐0.00 [‐0.01, 0.01] |
| 26.2 CVS (any route) versus amniocentesis | 1 | 3201 | Risk Difference (M‐H, Random, 95% CI) | 0.01 [‐0.00, 0.02] |
| 27 Perinatal deaths Show forest plot | 4 | Risk Ratio (M‐H, Random, 95% CI) | Subtotals only | |
| Analysis 3.27  Comparison 3 Chorionic villus sampling (CVS) versus second trimester amniocentesis (AC), Outcome 27 Perinatal deaths. | ||||
| 27.1 Transcervical CVS versus amniocentesis | 3 | 5521 | Risk Ratio (M‐H, Random, 95% CI) | 1.79 [0.42, 7.69] |
| 27.2 Transabdominal CVS versus amniocentesis | 1 | 2069 | Risk Ratio (M‐H, Random, 95% CI) | 1.18 [0.40, 3.51] |
| 27.3 CVS (any route) versus amniocentesis | 2 | 6280 | Risk Ratio (M‐H, Random, 95% CI) | 1.20 [0.64, 2.24] |
| 28 Stillbirths Show forest plot | 3 | Risk Ratio (M‐H, Random, 95% CI) | Subtotals only | |
| Analysis 3.28  Comparison 3 Chorionic villus sampling (CVS) versus second trimester amniocentesis (AC), Outcome 28 Stillbirths. | ||||
| 28.1 Transcervical CVS versus amniocentesis | 2 | 3454 | Risk Ratio (M‐H, Random, 95% CI) | 0.94 [0.02, 45.31] |
| 28.2 CVS (any route) versus amniocentesis | 1 | 3201 | Risk Ratio (M‐H, Random, 95% CI) | 0.99 [0.35, 2.81] |
| 29 Neonatal deaths Show forest plot | 4 | Risk Ratio (M‐H, Random, 95% CI) | Subtotals only | |
| Analysis 3.29  Comparison 3 Chorionic villus sampling (CVS) versus second trimester amniocentesis (AC), Outcome 29 Neonatal deaths. | ||||
| 29.1 Transcervical CVS versus amniocentesis | 3 | 4251 | Risk Ratio (M‐H, Random, 95% CI) | 1.63 [0.38, 7.05] |
| 29.2 CVS (any route) versus amniocentesis | 1 | 3201 | Risk Ratio (M‐H, Random, 95% CI) | 2.64 [0.70, 9.93] |
| 30 All recorded deaths after viability Show forest plot | 3 | Risk Ratio (M‐H, Random, 95% CI) | Subtotals only | |
| Analysis 3.30  Comparison 3 Chorionic villus sampling (CVS) versus second trimester amniocentesis (AC), Outcome 30 All recorded deaths after viability. | ||||
| 30.1 Transcervical CVS versus amniocentesis | 2 | 1579 | Risk Ratio (M‐H, Random, 95% CI) | 0.78 [0.02, 25.93] |
| 30.2 CVS (any route) versus amniocentesis | 1 | 3201 | Risk Ratio (M‐H, Random, 95% CI) | 1.44 [0.67, 3.09] |
| 31 Congenital anomalies (all recorded) Show forest plot | 4 | Risk Ratio (M‐H, Random, 95% CI) | Subtotals only | |
| Analysis 3.31  Comparison 3 Chorionic villus sampling (CVS) versus second trimester amniocentesis (AC), Outcome 31 Congenital anomalies (all recorded). | ||||
| 31.1 Transcervical CVS versus amniocentesis | 2 | 1408 | Risk Ratio (M‐H, Random, 95% CI) | 0.62 [0.25, 1.59] |
| 31.2 CVS (any route) versus amniocentesis | 2 | 3338 | Risk Ratio (M‐H, Random, 95% CI) | 0.77 [0.66, 0.89] |
| 32 Haemangioma Show forest plot | 1 | 182 | Risk Ratio (M‐H, Random, 95% CI) | 1.35 [0.81, 2.24] |
| Analysis 3.32  Comparison 3 Chorionic villus sampling (CVS) versus second trimester amniocentesis (AC), Outcome 32 Haemangioma. | ||||
| 33 Limb reduction defects Show forest plot | 1 | 3201 | Risk Ratio (M‐H, Random, 95% CI) | 4.95 [0.24, 102.97] |
| Analysis 3.33  Comparison 3 Chorionic villus sampling (CVS) versus second trimester amniocentesis (AC), Outcome 33 Limb reduction defects. | ||||
| 33.1 CVS (any route) versus amniocentesis | 1 | 3201 | Risk Ratio (M‐H, Random, 95% CI) | 4.95 [0.24, 102.97] |
| Outcome or subgroup title | No. of studies | No. of participants | Statistical method | Effect size |
| 1 All known pregnancy loss (including termination of pregnancy) Show forest plot | 5 | 7978 | Risk Ratio (M‐H, Random, 95% CI) | 1.16 [0.81, 1.65] |
| Analysis 4.1  Comparison 4 Transcervical versus transabdominal chorionic villus sampling (CVS), Outcome 1 All known pregnancy loss (including termination of pregnancy). | ||||
| 2 Spontaneous miscarriage Show forest plot | 4 | 3384 | Risk Ratio (M‐H, Random, 95% CI) | 1.68 [0.79, 3.58] |
| Analysis 4.2  Comparison 4 Transcervical versus transabdominal chorionic villus sampling (CVS), Outcome 2 Spontaneous miscarriage. | ||||
| 3 Spontaneous miscarriage after test Show forest plot | 3 | 1347 | Risk Ratio (M‐H, Random, 95% CI) | 1.23 [0.75, 2.04] |
| Analysis 4.3  Comparison 4 Transcervical versus transabdominal chorionic villus sampling (CVS), Outcome 3 Spontaneous miscarriage after test. | ||||
| 4 Non‐compliance with allocated procedure Show forest plot | 3 | 5187 | Risk Ratio (M‐H, Random, 95% CI) | 1.68 [0.59, 4.76] |
| Analysis 4.4  Comparison 4 Transcervical versus transabdominal chorionic villus sampling (CVS), Outcome 4 Non‐compliance with allocated procedure. | ||||
| 5 Sampling failure Show forest plot | 4 | 5231 | Risk Ratio (M‐H, Random, 95% CI) | 1.79 [1.13, 2.82] |
| Analysis 4.5  Comparison 4 Transcervical versus transabdominal chorionic villus sampling (CVS), Outcome 5 Sampling failure. | ||||
| 6 Multiple insertions Show forest plot | 2 | 1314 | Risk Ratio (M‐H, Random, 95% CI) | 2.54 [1.47, 4.42] |
| Analysis 4.6  Comparison 4 Transcervical versus transabdominal chorionic villus sampling (CVS), Outcome 6 Multiple insertions. | ||||
| 7 Second test performed Show forest plot | 1 | 1194 | Risk Ratio (M‐H, Random, 95% CI) | 1.24 [0.65, 2.37] |
| Analysis 4.7  Comparison 4 Transcervical versus transabdominal chorionic villus sampling (CVS), Outcome 7 Second test performed. | ||||
| 8 Laboratory failure Show forest plot | 1 | 1194 | Risk Ratio (M‐H, Random, 95% CI) | 2.23 [0.69, 7.22] |
| Analysis 4.8  Comparison 4 Transcervical versus transabdominal chorionic villus sampling (CVS), Outcome 8 Laboratory failure. | ||||
| 9 All non‐mosaic abnormalities Show forest plot | 1 | 2862 | Risk Ratio (M‐H, Random, 95% CI) | 1.23 [0.87, 1.75] |
| Analysis 4.9  Comparison 4 Transcervical versus transabdominal chorionic villus sampling (CVS), Outcome 9 All non‐mosaic abnormalities. | ||||
| 10 True mosaics Show forest plot | 1 | 2862 | Risk Ratio (M‐H, Random, 95% CI) | 0.92 [0.39, 2.17] |
| Analysis 4.10  Comparison 4 Transcervical versus transabdominal chorionic villus sampling (CVS), Outcome 10 True mosaics. | ||||
| 11 Confined mosaics Show forest plot | 1 | 2862 | Risk Ratio (M‐H, Random, 95% CI) | 0.85 [0.26, 2.77] |
| Analysis 4.11  Comparison 4 Transcervical versus transabdominal chorionic villus sampling (CVS), Outcome 11 Confined mosaics. | ||||
| 12 Amniotic leakage after test Show forest plot | 1 | 44 | Risk Ratio (M‐H, Random, 95% CI) | 0.28 [0.01, 6.52] |
| Analysis 4.12  Comparison 4 Transcervical versus transabdominal chorionic villus sampling (CVS), Outcome 12 Amniotic leakage after test. | ||||
| 13 Vaginal bleeding after test Show forest plot | 3 | 1358 | Risk Ratio (M‐H, Random, 95% CI) | 6.93 [0.77, 62.83] |
| Analysis 4.13  Comparison 4 Transcervical versus transabdominal chorionic villus sampling (CVS), Outcome 13 Vaginal bleeding after test. | ||||
| 14 Termination of pregnancy (all) Show forest plot | 2 | 1303 | Risk Ratio (M‐H, Random, 95% CI) | 0.83 [0.56, 1.22] |
| Analysis 4.14  Comparison 4 Transcervical versus transabdominal chorionic villus sampling (CVS), Outcome 14 Termination of pregnancy (all). | ||||
| 15 Perinatal deaths Show forest plot | 1 | 2037 | Risk Ratio (M‐H, Random, 95% CI) | 0.44 [0.11, 1.68] |
| Analysis 4.15  Comparison 4 Transcervical versus transabdominal chorionic villus sampling (CVS), Outcome 15 Perinatal deaths. | ||||
| 16 Stillbirths Show forest plot | 2 | 1227 | Risk Ratio (M‐H, Random, 95% CI) | 1.36 [0.11, 17.53] |
| Analysis 4.16  Comparison 4 Transcervical versus transabdominal chorionic villus sampling (CVS), Outcome 16 Stillbirths. | ||||
| 17 Neonatal deaths Show forest plot | 2 | 4845 | Risk Ratio (M‐H, Random, 95% CI) | 0.60 [0.14, 2.55] |
| Analysis 4.17  Comparison 4 Transcervical versus transabdominal chorionic villus sampling (CVS), Outcome 17 Neonatal deaths. | ||||
| 18 Anomalies (all recorded) Show forest plot | 2 | 3622 | Risk Ratio (M‐H, Random, 95% CI) | 0.68 [0.41, 1.12] |
| Analysis 4.18  Comparison 4 Transcervical versus transabdominal chorionic villus sampling (CVS), Outcome 18 Anomalies (all recorded). | ||||
| 19 Talipes Show forest plot | 1 | 2624 | Risk Ratio (M‐H, Random, 95% CI) | 3.21 [0.33, 30.80] |
| Analysis 4.19  Comparison 4 Transcervical versus transabdominal chorionic villus sampling (CVS), Outcome 19 Talipes. | ||||
| Outcome or subgroup title | No. of studies | No. of participants | Statistical method | Effect size |
| 1 All known pregnancy loss (including termination of pregnancy) Show forest plot | 4 | 5491 | Risk Ratio (M‐H, Random, 95% CI) | 1.15 [0.86, 1.54] |
| Analysis 5.1  Comparison 5 Early amniocentesis (AC) versus transabdominal chorionic villus sampling (CVS), Outcome 1 All known pregnancy loss (including termination of pregnancy). | ||||
| 2 Spontaneous miscarriage Show forest plot | 4 | 5491 | Risk Ratio (M‐H, Random, 95% CI) | 1.73 [1.15, 2.60] |
| Analysis 5.2  Comparison 5 Early amniocentesis (AC) versus transabdominal chorionic villus sampling (CVS), Outcome 2 Spontaneous miscarriage. | ||||
| 3 Spontaneous miscarriage after test Show forest plot | 4 | 5489 | Risk Ratio (M‐H, Random, 95% CI) | 1.71 [1.12, 2.61] |
| Analysis 5.3  Comparison 5 Early amniocentesis (AC) versus transabdominal chorionic villus sampling (CVS), Outcome 3 Spontaneous miscarriage after test. | ||||
| 4 Non‐compliance with allocated procedure Show forest plot | 4 | 5566 | Risk Ratio (M‐H, Random, 95% CI) | 0.25 [0.09, 0.72] |
| Analysis 5.4  Comparison 5 Early amniocentesis (AC) versus transabdominal chorionic villus sampling (CVS), Outcome 4 Non‐compliance with allocated procedure. | ||||
| 5 Sampling failure Show forest plot | 4 | 5566 | Risk Ratio (M‐H, Random, 95% CI) | 0.58 [0.24, 1.38] |
| Analysis 5.5  Comparison 5 Early amniocentesis (AC) versus transabdominal chorionic villus sampling (CVS), Outcome 5 Sampling failure. | ||||
| 6 Multiple insertions Show forest plot | 3 | 4445 | Risk Ratio (M‐H, Random, 95% CI) | 0.45 [0.21, 0.95] |
| Analysis 5.6  Comparison 5 Early amniocentesis (AC) versus transabdominal chorionic villus sampling (CVS), Outcome 6 Multiple insertions. | ||||
| 7 Second test performed Show forest plot | 4 | 5566 | Risk Ratio (M‐H, Random, 95% CI) | 0.63 [0.28, 1.43] |
| Analysis 5.7  Comparison 5 Early amniocentesis (AC) versus transabdominal chorionic villus sampling (CVS), Outcome 7 Second test performed. | ||||
| 8 Laboratory failure Show forest plot | 4 | 5566 | Risk Ratio (M‐H, Random, 95% CI) | 0.74 [0.34, 1.63] |
| Analysis 5.8  Comparison 5 Early amniocentesis (AC) versus transabdominal chorionic villus sampling (CVS), Outcome 8 Laboratory failure. | ||||
| 9 All non‐mosaic abnormalities Show forest plot | 4 | 5566 | Risk Ratio (M‐H, Random, 95% CI) | 0.95 [0.47, 1.90] |
| Analysis 5.9  Comparison 5 Early amniocentesis (AC) versus transabdominal chorionic villus sampling (CVS), Outcome 9 All non‐mosaic abnormalities. | ||||
| 10 True mosaics Show forest plot | 3 | 5451 | Risk Ratio (M‐H, Random, 95% CI) | 0.47 [0.10, 2.20] |
| Analysis 5.10  Comparison 5 Early amniocentesis (AC) versus transabdominal chorionic villus sampling (CVS), Outcome 10 True mosaics. | ||||
| 11 Confined mosaics Show forest plot | 4 | 5566 | Risk Ratio (M‐H, Random, 95% CI) | 0.82 [0.27, 2.47] |
| Analysis 5.11  Comparison 5 Early amniocentesis (AC) versus transabdominal chorionic villus sampling (CVS), Outcome 11 Confined mosaics. | ||||
| 12 Maternal contamination Show forest plot | 2 | 4330 | Risk Ratio (M‐H, Random, 95% CI) | 1.92 [0.02, 162.80] |
| Analysis 5.12  Comparison 5 Early amniocentesis (AC) versus transabdominal chorionic villus sampling (CVS), Outcome 12 Maternal contamination. | ||||
| 13 Known false positive after birth Show forest plot | 2 | 670 | Risk Ratio (M‐H, Random, 95% CI) | 0.36 [0.02, 8.73] |
| Analysis 5.13  Comparison 5 Early amniocentesis (AC) versus transabdominal chorionic villus sampling (CVS), Outcome 13 Known false positive after birth. | ||||
| 14 Knonw false negative after birth Show forest plot | 1 | 555 | Risk Ratio (M‐H, Fixed, 95% CI) | 0.0 [0.0, 0.0] |
| Analysis 5.14  Comparison 5 Early amniocentesis (AC) versus transabdominal chorionic villus sampling (CVS), Outcome 14 Knonw false negative after birth. | ||||
| 15 Reporting time Show forest plot | 1 | 3775 | Mean Difference (IV, Random, 95% CI) | 4.00 [3.82, 4.18] |
| Analysis 5.15  Comparison 5 Early amniocentesis (AC) versus transabdominal chorionic villus sampling (CVS), Outcome 15 Reporting time. | ||||
| 16 Vaginal bleeding after 20 weeks Show forest plot | 1 | 3698 | Risk Ratio (M‐H, Random, 95% CI) | 0.71 [0.35, 1.43] |
| Analysis 5.16  Comparison 5 Early amniocentesis (AC) versus transabdominal chorionic villus sampling (CVS), Outcome 16 Vaginal bleeding after 20 weeks. | ||||
| 17 Amniotic leakage after test Show forest plot | 3 | 4934 | Risk Ratio (M‐H, Random, 95% CI) | 3.35 [0.37, 30.09] |
| Analysis 5.17  Comparison 5 Early amniocentesis (AC) versus transabdominal chorionic villus sampling (CVS), Outcome 17 Amniotic leakage after test. | ||||
| 18 Vaginal bleeding after test Show forest plot | 3 | 4934 | Risk Ratio (M‐H, Random, 95% CI) | 0.69 [0.42, 1.12] |
| Analysis 5.18  Comparison 5 Early amniocentesis (AC) versus transabdominal chorionic villus sampling (CVS), Outcome 18 Vaginal bleeding after test. | ||||
| 19 Pre‐labour ruptured membranes before 28 weeks Show forest plot | 1 | 3698 | Risk Ratio (M‐H, Random, 95% CI) | 0.50 [0.27, 0.92] |
| Analysis 5.19  Comparison 5 Early amniocentesis (AC) versus transabdominal chorionic villus sampling (CVS), Outcome 19 Pre‐labour ruptured membranes before 28 weeks. | ||||
| 20 Delivery before 37 weeks Show forest plot | 3 | 1755 | Risk Ratio (M‐H, Random, 95% CI) | 1.16 [0.78, 1.74] |
| Analysis 5.20  Comparison 5 Early amniocentesis (AC) versus transabdominal chorionic villus sampling (CVS), Outcome 20 Delivery before 37 weeks. | ||||
| 21 Delivery before 33 weeks Show forest plot | 1 | 1121 | Risk Ratio (M‐H, Random, 95% CI) | 0.50 [0.09, 2.73] |
| Analysis 5.21  Comparison 5 Early amniocentesis (AC) versus transabdominal chorionic villus sampling (CVS), Outcome 21 Delivery before 33 weeks. | ||||
| 22 Termination of pregnancy (all) Show forest plot | 4 | 5489 | Risk Ratio (M‐H, Random, 95% CI) | 0.74 [0.45, 1.25] |
| Analysis 5.22  Comparison 5 Early amniocentesis (AC) versus transabdominal chorionic villus sampling (CVS), Outcome 22 Termination of pregnancy (all). | ||||
| 23 Perinatal deaths Show forest plot | 4 | 5428 | Risk Ratio (M‐H, Random, 95% CI) | 1.10 [0.53, 2.28] |
| Analysis 5.23  Comparison 5 Early amniocentesis (AC) versus transabdominal chorionic villus sampling (CVS), Outcome 23 Perinatal deaths. | ||||
| 24 Stillbirths Show forest plot | 4 | 5428 | Risk Ratio (M‐H, Random, 95% CI) | 1.11 [0.52, 2.36] |
| Analysis 5.24  Comparison 5 Early amniocentesis (AC) versus transabdominal chorionic villus sampling (CVS), Outcome 24 Stillbirths. | ||||
| 25 Neonatal deaths Show forest plot | 4 | 5455 | Risk Ratio (M‐H, Random, 95% CI) | 0.41 [0.05, 3.11] |
| Analysis 5.25  Comparison 5 Early amniocentesis (AC) versus transabdominal chorionic villus sampling (CVS), Outcome 25 Neonatal deaths. | ||||
| 26 All recorded deaths after viability Show forest plot | 4 | 5453 | Risk Ratio (M‐H, Random, 95% CI) | 1.18 [0.43, 3.24] |
| Analysis 5.26  Comparison 5 Early amniocentesis (AC) versus transabdominal chorionic villus sampling (CVS), Outcome 26 All recorded deaths after viability. | ||||
| 27 Anomalies (all recorded) Show forest plot | 4 | 5305 | Risk Ratio (M‐H, Random, 95% CI) | 1.14 [0.57, 2.30] |
| Analysis 5.27  Comparison 5 Early amniocentesis (AC) versus transabdominal chorionic villus sampling (CVS), Outcome 27 Anomalies (all recorded). | ||||
| 28 Talipes equinovarus Show forest plot | 4 | 5305 | Risk Ratio (M‐H, Random, 95% CI) | 3.75 [1.42, 9.88] |
| Analysis 5.28  Comparison 5 Early amniocentesis (AC) versus transabdominal chorionic villus sampling (CVS), Outcome 28 Talipes equinovarus. | ||||
| 29 Haemangioma Show forest plot | 4 | 5305 | Risk Ratio (M‐H, Random, 95% CI) | 0.75 [0.26, 2.20] |
| Analysis 5.29  Comparison 5 Early amniocentesis (AC) versus transabdominal chorionic villus sampling (CVS), Outcome 29 Haemangioma. | ||||
| 30 Neonatal respiratory distress syndrome Show forest plot | 4 | 4725 | Risk Ratio (M‐H, Random, 95% CI) | 0.91 [0.21, 3.98] |
| Analysis 5.30  Comparison 5 Early amniocentesis (AC) versus transabdominal chorionic villus sampling (CVS), Outcome 30 Neonatal respiratory distress syndrome. | ||||
| 31 Birthweight below 10th centile Show forest plot | 1 | 3618 | Risk Ratio (M‐H, Random, 95% CI) | 0.84 [0.66, 1.06] |
| Analysis 5.31  Comparison 5 Early amniocentesis (AC) versus transabdominal chorionic villus sampling (CVS), Outcome 31 Birthweight below 10th centile. | ||||
| 32 Birthweight below 5th centile Show forest plot | 2 | 629 | Risk Ratio (M‐H, Random, 95% CI) | 0.66 [0.05, 9.38] |
| Analysis 5.32  Comparison 5 Early amniocentesis (AC) versus transabdominal chorionic villus sampling (CVS), Outcome 32 Birthweight below 5th centile. | ||||
| Outcome or subgroup title | No. of studies | No. of participants | Statistical method | Effect size |
| 1 All known pregnancy loss (including termination of pregnancy) Show forest plot | 1 | 223 | Risk Ratio (M‐H, Random, 95% CI) | 0.33 [0.01, 8.02] |
| Analysis 6.1  Comparison 6 Ultrasound versus no ultrasound before second trimester amniocentesis, Outcome 1 All known pregnancy loss (including termination of pregnancy). | ||||
| 2 Spontaneous miscarriage Show forest plot | 1 | 223 | Risk Ratio (M‐H, Random, 95% CI) | 0.33 [0.01, 8.02] |
| Analysis 6.2  Comparison 6 Ultrasound versus no ultrasound before second trimester amniocentesis, Outcome 2 Spontaneous miscarriage. | ||||
| 3 Spontaneous miscarriage after test Show forest plot | 1 | 223 | Risk Ratio (M‐H, Random, 95% CI) | 0.33 [0.01, 8.02] |
| Analysis 6.3  Comparison 6 Ultrasound versus no ultrasound before second trimester amniocentesis, Outcome 3 Spontaneous miscarriage after test. | ||||
| 4 Sampling failure Show forest plot | 1 | 223 | Risk Ratio (M‐H, Random, 95% CI) | 10.90 [0.61, 194.85] |
| Analysis 6.4  Comparison 6 Ultrasound versus no ultrasound before second trimester amniocentesis, Outcome 4 Sampling failure. | ||||
| 5 Multiple insertions Show forest plot | 1 | 223 | Risk Ratio (M‐H, Random, 95% CI) | 0.67 [0.41, 1.09] |
| Analysis 6.5  Comparison 6 Ultrasound versus no ultrasound before second trimester amniocentesis, Outcome 5 Multiple insertions. | ||||
| 6 Bloody tap (not pre‐specified) Show forest plot | 1 | 223 | Risk Ratio (M‐H, Random, 95% CI) | 1.87 [0.87, 4.02] |
| Analysis 6.6  Comparison 6 Ultrasound versus no ultrasound before second trimester amniocentesis, Outcome 6 Bloody tap (not pre‐specified). | ||||

Study flow diagram.
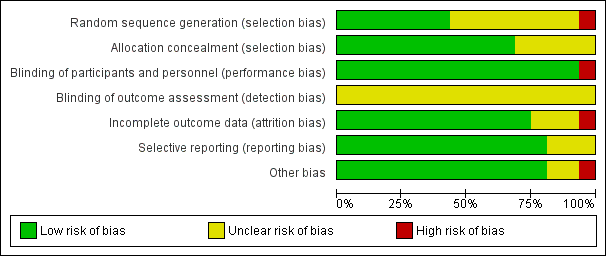
Risk of bias graph: review authors' judgements about each risk of bias domain presented as percentages across all included studies.

Risk of bias summary: review authors' judgements about each risk of bias domain for each included study.

Comparison 1 Second trimester amniocentesis (AC) versus control (no testing), Outcome 1 All known pregnancy loss (including termination of pregnancy).
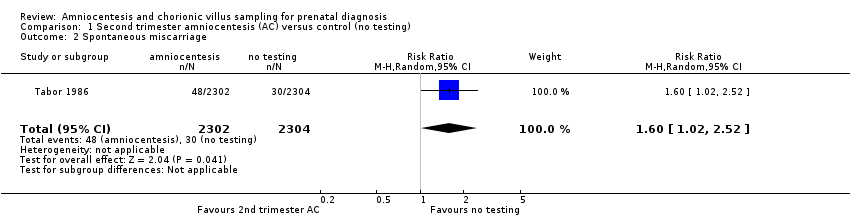
Comparison 1 Second trimester amniocentesis (AC) versus control (no testing), Outcome 2 Spontaneous miscarriage.

Comparison 1 Second trimester amniocentesis (AC) versus control (no testing), Outcome 3 Non‐compliance with allocated procedure.
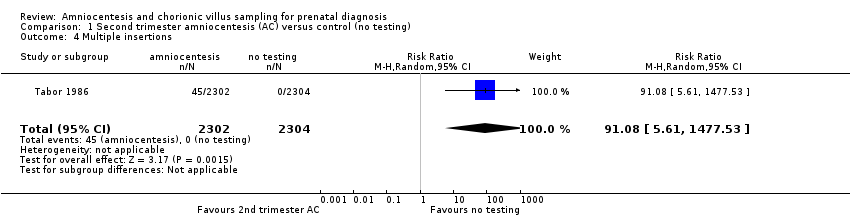
Comparison 1 Second trimester amniocentesis (AC) versus control (no testing), Outcome 4 Multiple insertions.

Comparison 1 Second trimester amniocentesis (AC) versus control (no testing), Outcome 5 Second test performed.

Comparison 1 Second trimester amniocentesis (AC) versus control (no testing), Outcome 6 Laboratory failure.

Comparison 1 Second trimester amniocentesis (AC) versus control (no testing), Outcome 7 All non‐mosaic abnormalities.

Comparison 1 Second trimester amniocentesis (AC) versus control (no testing), Outcome 8 Vaginal bleeding after test.

Comparison 1 Second trimester amniocentesis (AC) versus control (no testing), Outcome 9 Amniotic leakage after test.

Comparison 1 Second trimester amniocentesis (AC) versus control (no testing), Outcome 10 Termination of pregnancy (all).
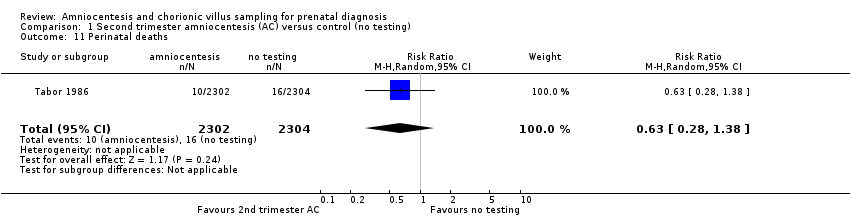
Comparison 1 Second trimester amniocentesis (AC) versus control (no testing), Outcome 11 Perinatal deaths.

Comparison 1 Second trimester amniocentesis (AC) versus control (no testing), Outcome 12 Stillbirths.

Comparison 1 Second trimester amniocentesis (AC) versus control (no testing), Outcome 13 Neonatal deaths.

Comparison 1 Second trimester amniocentesis (AC) versus control (no testing), Outcome 14 All recorded deaths after viability.

Comparison 1 Second trimester amniocentesis (AC) versus control (no testing), Outcome 15 Anomalies (all recorded).
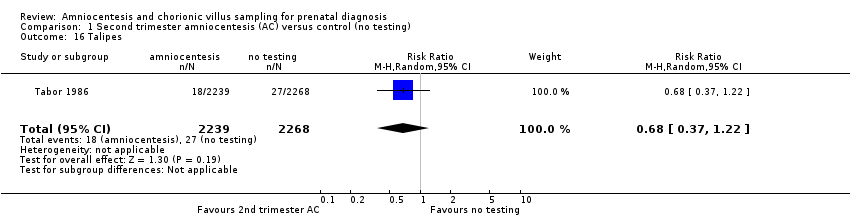
Comparison 1 Second trimester amniocentesis (AC) versus control (no testing), Outcome 16 Talipes.

Comparison 1 Second trimester amniocentesis (AC) versus control (no testing), Outcome 17 Neonatal respiratory distress syndrome.

Comparison 2 Early versus second trimester amniocentesis (AC), Outcome 1 All known pregnancy loss (including termination of pregnancy).

Comparison 2 Early versus second trimester amniocentesis (AC), Outcome 2 Spontaneous miscarriage.

Comparison 2 Early versus second trimester amniocentesis (AC), Outcome 3 Spontaneous miscarriage after test.

Comparison 2 Early versus second trimester amniocentesis (AC), Outcome 4 Non‐compliance with allocated procedure.

Comparison 2 Early versus second trimester amniocentesis (AC), Outcome 5 Sampling failure.

Comparison 2 Early versus second trimester amniocentesis (AC), Outcome 6 Multiple insertions.

Comparison 2 Early versus second trimester amniocentesis (AC), Outcome 7 Second test performed.

Comparison 2 Early versus second trimester amniocentesis (AC), Outcome 8 Laboratory failure.
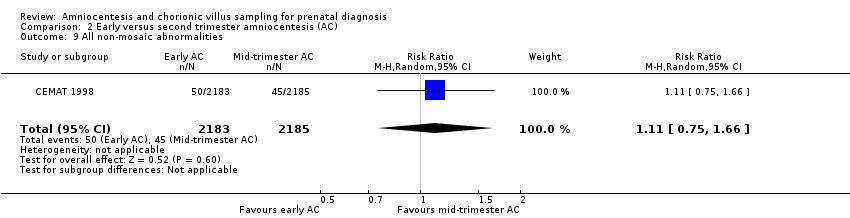
Comparison 2 Early versus second trimester amniocentesis (AC), Outcome 9 All non‐mosaic abnormalities.

Comparison 2 Early versus second trimester amniocentesis (AC), Outcome 10 True mosaics.

Comparison 2 Early versus second trimester amniocentesis (AC), Outcome 11 Maternal contamination.

Comparison 2 Early versus second trimester amniocentesis (AC), Outcome 12 Known false negative after birth.

Comparison 2 Early versus second trimester amniocentesis (AC), Outcome 13 Reporting time.
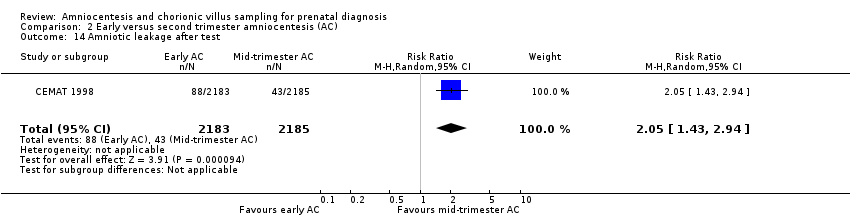
Comparison 2 Early versus second trimester amniocentesis (AC), Outcome 14 Amniotic leakage after test.

Comparison 2 Early versus second trimester amniocentesis (AC), Outcome 15 Termination of pregnancy (all).
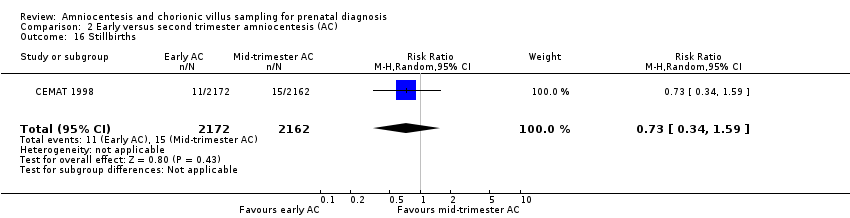
Comparison 2 Early versus second trimester amniocentesis (AC), Outcome 16 Stillbirths.

Comparison 2 Early versus second trimester amniocentesis (AC), Outcome 17 Neonatal deaths.

Comparison 2 Early versus second trimester amniocentesis (AC), Outcome 18 All recorded deaths after viability.

Comparison 2 Early versus second trimester amniocentesis (AC), Outcome 19 Anomalies (all recorded).

Comparison 2 Early versus second trimester amniocentesis (AC), Outcome 20 Talipes.

Comparison 3 Chorionic villus sampling (CVS) versus second trimester amniocentesis (AC), Outcome 1 All known pregnancy loss (including termination of pregnancy).

Comparison 3 Chorionic villus sampling (CVS) versus second trimester amniocentesis (AC), Outcome 2 Spontaneous miscarriage.

Comparison 3 Chorionic villus sampling (CVS) versus second trimester amniocentesis (AC), Outcome 3 Spontaneous miscarriage after test.

Comparison 3 Chorionic villus sampling (CVS) versus second trimester amniocentesis (AC), Outcome 4 Non‐compliance with allocated procedure.

Comparison 3 Chorionic villus sampling (CVS) versus second trimester amniocentesis (AC), Outcome 5 Sampling failure.

Comparison 3 Chorionic villus sampling (CVS) versus second trimester amniocentesis (AC), Outcome 6 Multiple insertions.
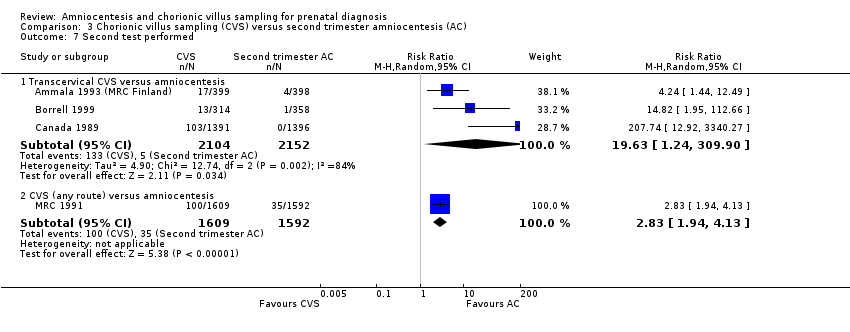
Comparison 3 Chorionic villus sampling (CVS) versus second trimester amniocentesis (AC), Outcome 7 Second test performed.

Comparison 3 Chorionic villus sampling (CVS) versus second trimester amniocentesis (AC), Outcome 8 Laboratory failure.
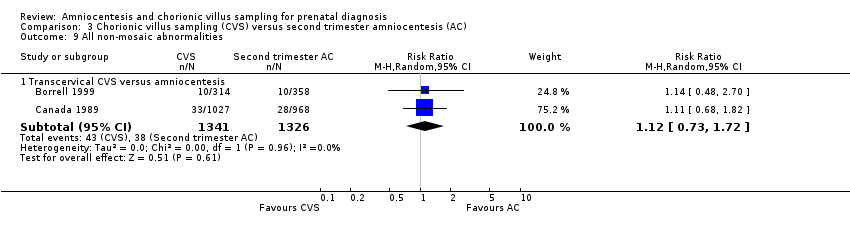
Comparison 3 Chorionic villus sampling (CVS) versus second trimester amniocentesis (AC), Outcome 9 All non‐mosaic abnormalities.

Comparison 3 Chorionic villus sampling (CVS) versus second trimester amniocentesis (AC), Outcome 10 True mosaics.
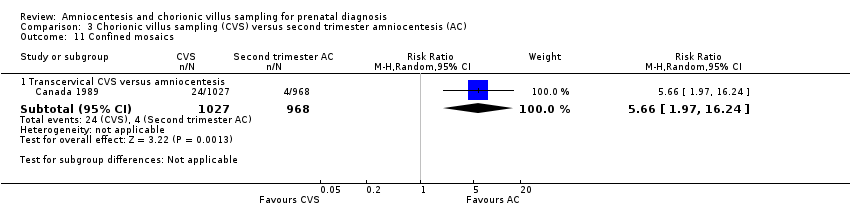
Comparison 3 Chorionic villus sampling (CVS) versus second trimester amniocentesis (AC), Outcome 11 Confined mosaics.

Comparison 3 Chorionic villus sampling (CVS) versus second trimester amniocentesis (AC), Outcome 12 Maternal contamination.
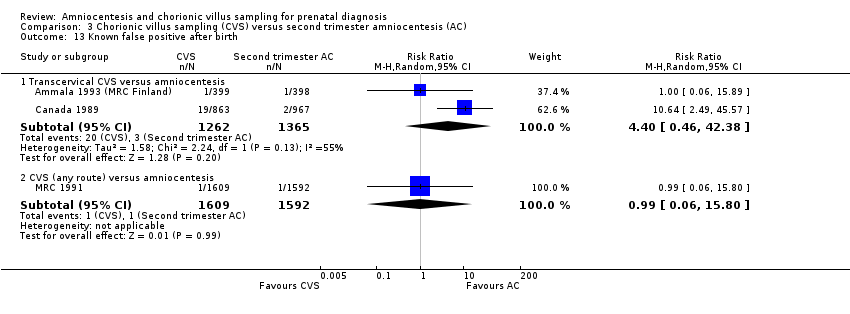
Comparison 3 Chorionic villus sampling (CVS) versus second trimester amniocentesis (AC), Outcome 13 Known false positive after birth.

Comparison 3 Chorionic villus sampling (CVS) versus second trimester amniocentesis (AC), Outcome 14 Known false negative after birth.
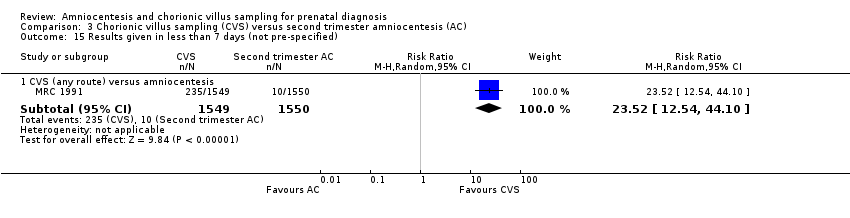
Comparison 3 Chorionic villus sampling (CVS) versus second trimester amniocentesis (AC), Outcome 15 Results given in less than 7 days (not pre‐specified).

Comparison 3 Chorionic villus sampling (CVS) versus second trimester amniocentesis (AC), Outcome 16 Results given in less than 14 days (not pre‐specified).
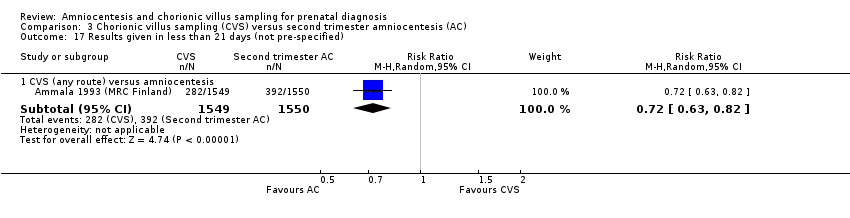
Comparison 3 Chorionic villus sampling (CVS) versus second trimester amniocentesis (AC), Outcome 17 Results given in less than 21 days (not pre‐specified).

Comparison 3 Chorionic villus sampling (CVS) versus second trimester amniocentesis (AC), Outcome 18 Result given after 21 days (not pre‐specified).

Comparison 3 Chorionic villus sampling (CVS) versus second trimester amniocentesis (AC), Outcome 19 Vaginal bleeding after test.
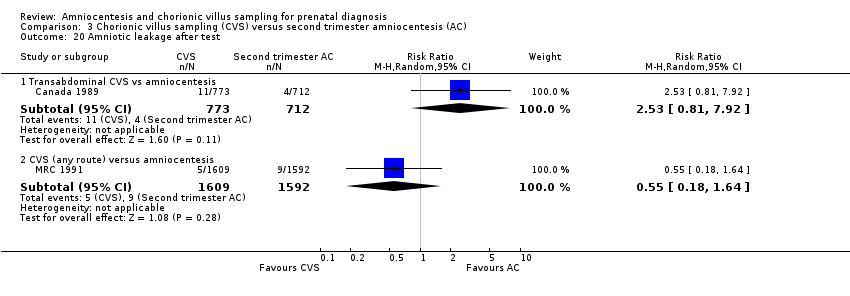
Comparison 3 Chorionic villus sampling (CVS) versus second trimester amniocentesis (AC), Outcome 20 Amniotic leakage after test.

Comparison 3 Chorionic villus sampling (CVS) versus second trimester amniocentesis (AC), Outcome 21 Vaginal bleeding after 20 weeks.
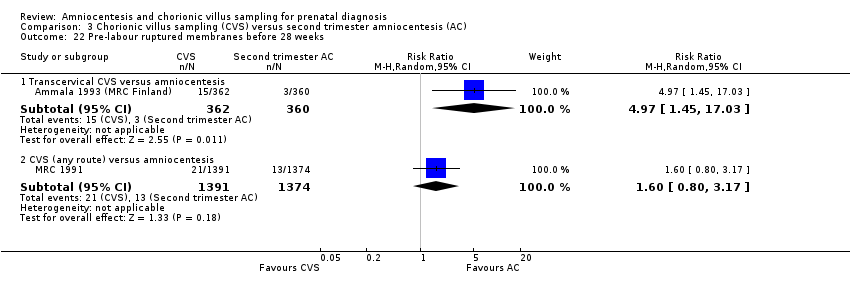
Comparison 3 Chorionic villus sampling (CVS) versus second trimester amniocentesis (AC), Outcome 22 Pre‐labour ruptured membranes before 28 weeks.
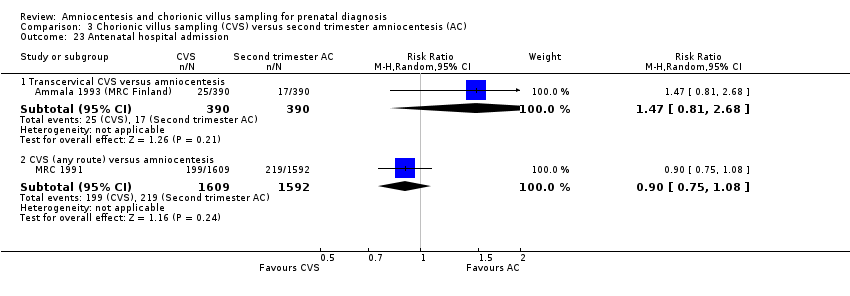
Comparison 3 Chorionic villus sampling (CVS) versus second trimester amniocentesis (AC), Outcome 23 Antenatal hospital admission.
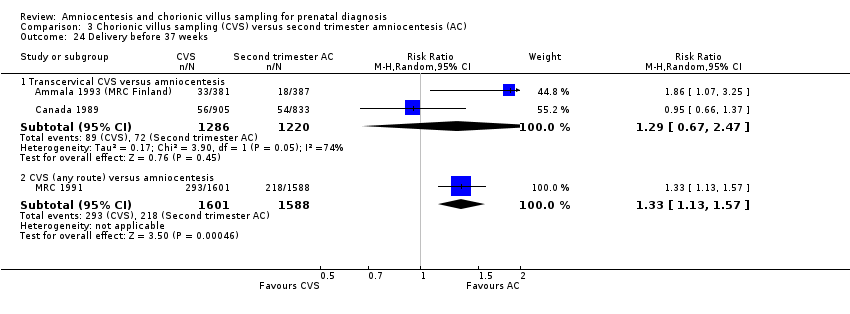
Comparison 3 Chorionic villus sampling (CVS) versus second trimester amniocentesis (AC), Outcome 24 Delivery before 37 weeks.
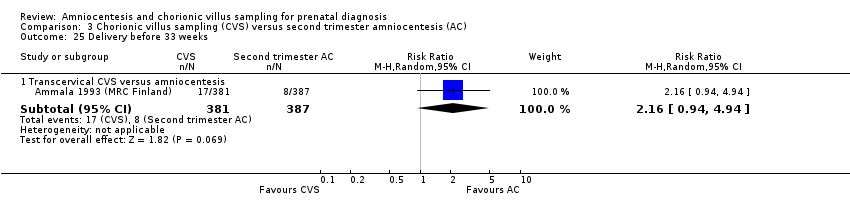
Comparison 3 Chorionic villus sampling (CVS) versus second trimester amniocentesis (AC), Outcome 25 Delivery before 33 weeks.

Comparison 3 Chorionic villus sampling (CVS) versus second trimester amniocentesis (AC), Outcome 26 Termination of pregnancy (all).

Comparison 3 Chorionic villus sampling (CVS) versus second trimester amniocentesis (AC), Outcome 27 Perinatal deaths.

Comparison 3 Chorionic villus sampling (CVS) versus second trimester amniocentesis (AC), Outcome 28 Stillbirths.

Comparison 3 Chorionic villus sampling (CVS) versus second trimester amniocentesis (AC), Outcome 29 Neonatal deaths.

Comparison 3 Chorionic villus sampling (CVS) versus second trimester amniocentesis (AC), Outcome 30 All recorded deaths after viability.

Comparison 3 Chorionic villus sampling (CVS) versus second trimester amniocentesis (AC), Outcome 31 Congenital anomalies (all recorded).
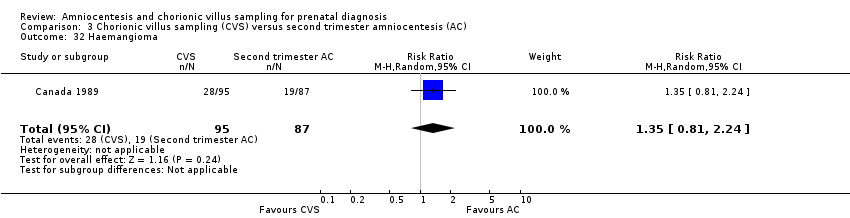
Comparison 3 Chorionic villus sampling (CVS) versus second trimester amniocentesis (AC), Outcome 32 Haemangioma.

Comparison 3 Chorionic villus sampling (CVS) versus second trimester amniocentesis (AC), Outcome 33 Limb reduction defects.
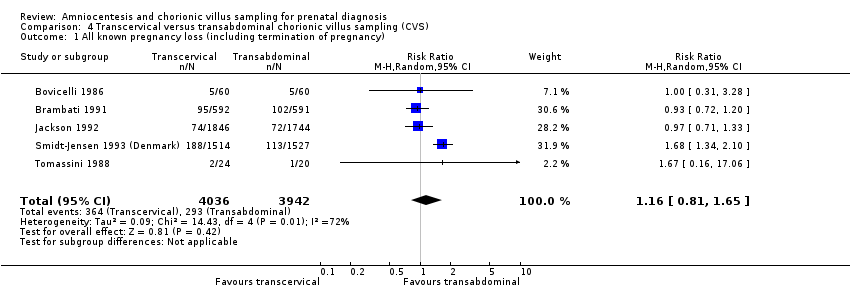
Comparison 4 Transcervical versus transabdominal chorionic villus sampling (CVS), Outcome 1 All known pregnancy loss (including termination of pregnancy).
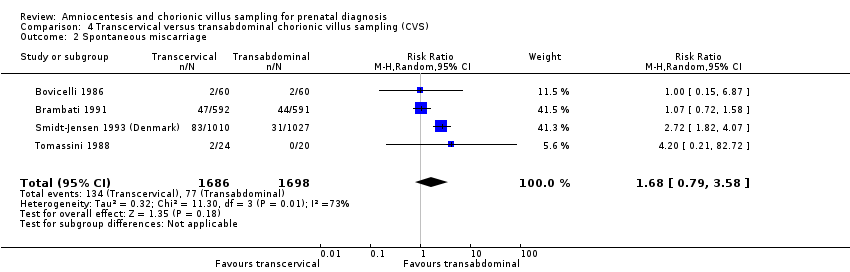
Comparison 4 Transcervical versus transabdominal chorionic villus sampling (CVS), Outcome 2 Spontaneous miscarriage.
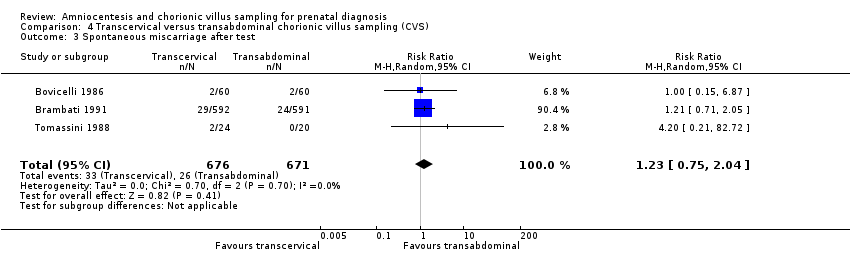
Comparison 4 Transcervical versus transabdominal chorionic villus sampling (CVS), Outcome 3 Spontaneous miscarriage after test.

Comparison 4 Transcervical versus transabdominal chorionic villus sampling (CVS), Outcome 4 Non‐compliance with allocated procedure.

Comparison 4 Transcervical versus transabdominal chorionic villus sampling (CVS), Outcome 5 Sampling failure.

Comparison 4 Transcervical versus transabdominal chorionic villus sampling (CVS), Outcome 6 Multiple insertions.

Comparison 4 Transcervical versus transabdominal chorionic villus sampling (CVS), Outcome 7 Second test performed.

Comparison 4 Transcervical versus transabdominal chorionic villus sampling (CVS), Outcome 8 Laboratory failure.

Comparison 4 Transcervical versus transabdominal chorionic villus sampling (CVS), Outcome 9 All non‐mosaic abnormalities.

Comparison 4 Transcervical versus transabdominal chorionic villus sampling (CVS), Outcome 10 True mosaics.

Comparison 4 Transcervical versus transabdominal chorionic villus sampling (CVS), Outcome 11 Confined mosaics.

Comparison 4 Transcervical versus transabdominal chorionic villus sampling (CVS), Outcome 12 Amniotic leakage after test.

Comparison 4 Transcervical versus transabdominal chorionic villus sampling (CVS), Outcome 13 Vaginal bleeding after test.

Comparison 4 Transcervical versus transabdominal chorionic villus sampling (CVS), Outcome 14 Termination of pregnancy (all).

Comparison 4 Transcervical versus transabdominal chorionic villus sampling (CVS), Outcome 15 Perinatal deaths.

Comparison 4 Transcervical versus transabdominal chorionic villus sampling (CVS), Outcome 16 Stillbirths.
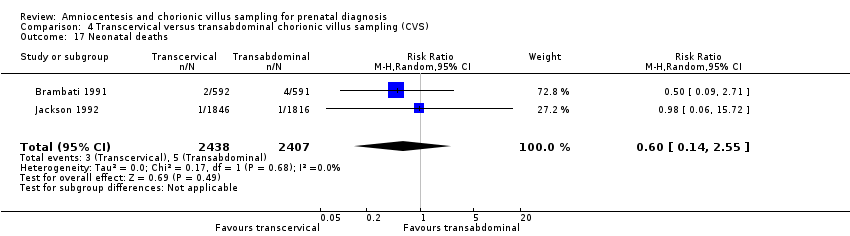
Comparison 4 Transcervical versus transabdominal chorionic villus sampling (CVS), Outcome 17 Neonatal deaths.

Comparison 4 Transcervical versus transabdominal chorionic villus sampling (CVS), Outcome 18 Anomalies (all recorded).

Comparison 4 Transcervical versus transabdominal chorionic villus sampling (CVS), Outcome 19 Talipes.
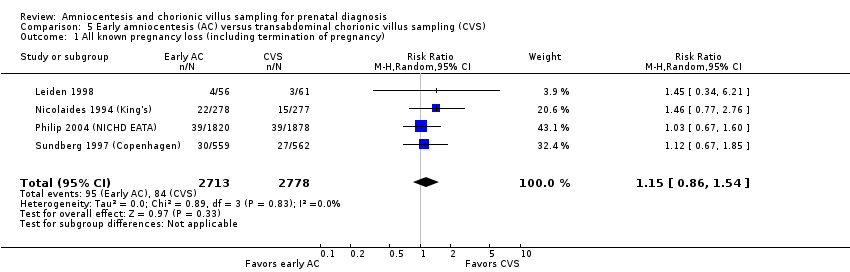
Comparison 5 Early amniocentesis (AC) versus transabdominal chorionic villus sampling (CVS), Outcome 1 All known pregnancy loss (including termination of pregnancy).

Comparison 5 Early amniocentesis (AC) versus transabdominal chorionic villus sampling (CVS), Outcome 2 Spontaneous miscarriage.

Comparison 5 Early amniocentesis (AC) versus transabdominal chorionic villus sampling (CVS), Outcome 3 Spontaneous miscarriage after test.

Comparison 5 Early amniocentesis (AC) versus transabdominal chorionic villus sampling (CVS), Outcome 4 Non‐compliance with allocated procedure.

Comparison 5 Early amniocentesis (AC) versus transabdominal chorionic villus sampling (CVS), Outcome 5 Sampling failure.
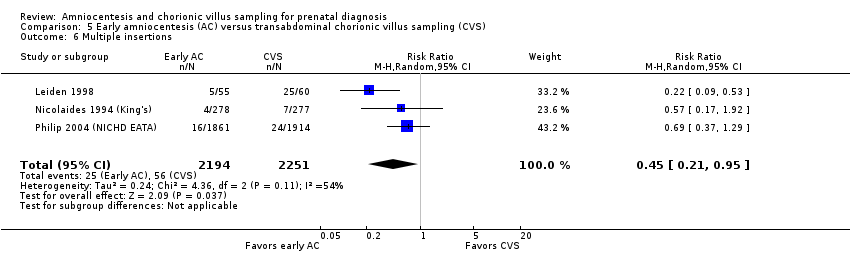
Comparison 5 Early amniocentesis (AC) versus transabdominal chorionic villus sampling (CVS), Outcome 6 Multiple insertions.
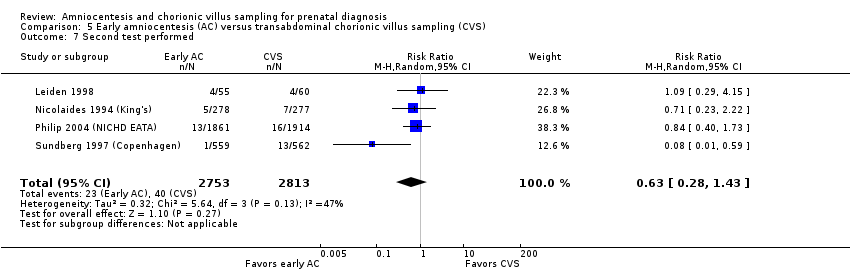
Comparison 5 Early amniocentesis (AC) versus transabdominal chorionic villus sampling (CVS), Outcome 7 Second test performed.

Comparison 5 Early amniocentesis (AC) versus transabdominal chorionic villus sampling (CVS), Outcome 8 Laboratory failure.

Comparison 5 Early amniocentesis (AC) versus transabdominal chorionic villus sampling (CVS), Outcome 9 All non‐mosaic abnormalities.

Comparison 5 Early amniocentesis (AC) versus transabdominal chorionic villus sampling (CVS), Outcome 10 True mosaics.
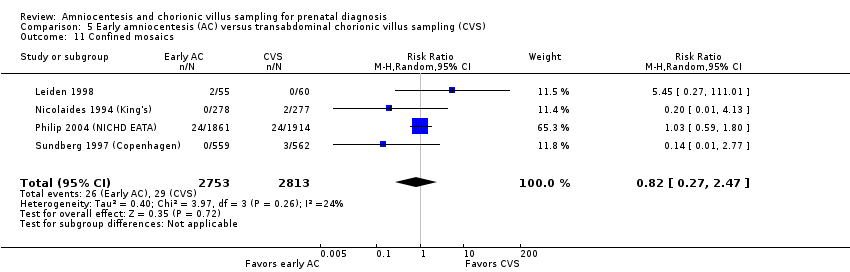
Comparison 5 Early amniocentesis (AC) versus transabdominal chorionic villus sampling (CVS), Outcome 11 Confined mosaics.

Comparison 5 Early amniocentesis (AC) versus transabdominal chorionic villus sampling (CVS), Outcome 12 Maternal contamination.
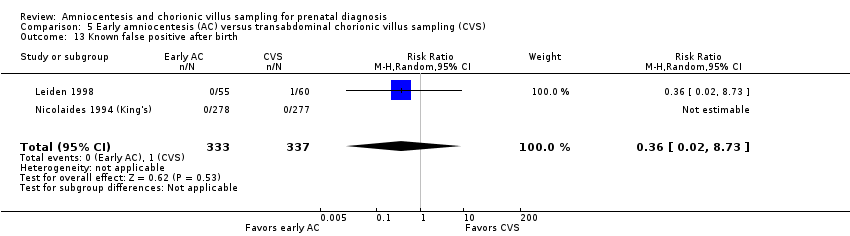
Comparison 5 Early amniocentesis (AC) versus transabdominal chorionic villus sampling (CVS), Outcome 13 Known false positive after birth.

Comparison 5 Early amniocentesis (AC) versus transabdominal chorionic villus sampling (CVS), Outcome 14 Knonw false negative after birth.
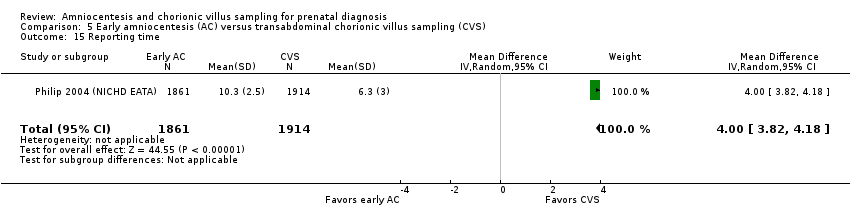
Comparison 5 Early amniocentesis (AC) versus transabdominal chorionic villus sampling (CVS), Outcome 15 Reporting time.

Comparison 5 Early amniocentesis (AC) versus transabdominal chorionic villus sampling (CVS), Outcome 16 Vaginal bleeding after 20 weeks.

Comparison 5 Early amniocentesis (AC) versus transabdominal chorionic villus sampling (CVS), Outcome 17 Amniotic leakage after test.
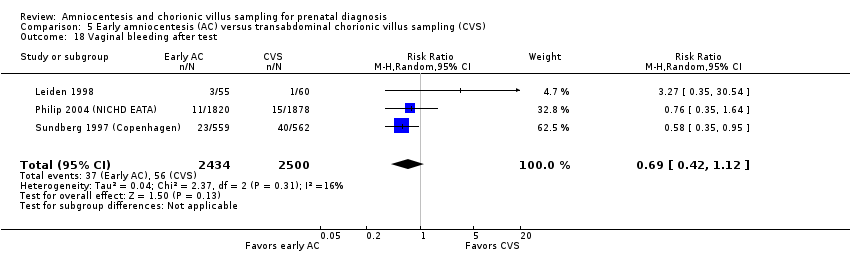
Comparison 5 Early amniocentesis (AC) versus transabdominal chorionic villus sampling (CVS), Outcome 18 Vaginal bleeding after test.

Comparison 5 Early amniocentesis (AC) versus transabdominal chorionic villus sampling (CVS), Outcome 19 Pre‐labour ruptured membranes before 28 weeks.

Comparison 5 Early amniocentesis (AC) versus transabdominal chorionic villus sampling (CVS), Outcome 20 Delivery before 37 weeks.

Comparison 5 Early amniocentesis (AC) versus transabdominal chorionic villus sampling (CVS), Outcome 21 Delivery before 33 weeks.

Comparison 5 Early amniocentesis (AC) versus transabdominal chorionic villus sampling (CVS), Outcome 22 Termination of pregnancy (all).

Comparison 5 Early amniocentesis (AC) versus transabdominal chorionic villus sampling (CVS), Outcome 23 Perinatal deaths.
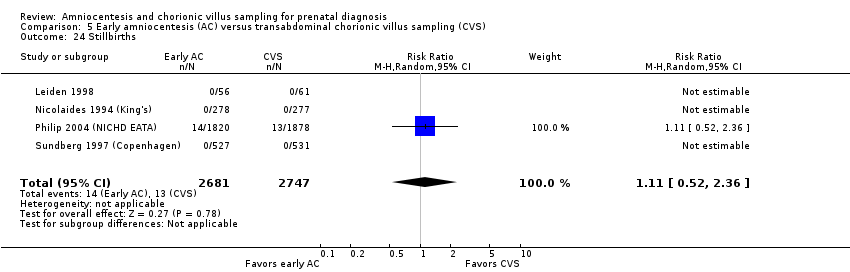
Comparison 5 Early amniocentesis (AC) versus transabdominal chorionic villus sampling (CVS), Outcome 24 Stillbirths.

Comparison 5 Early amniocentesis (AC) versus transabdominal chorionic villus sampling (CVS), Outcome 25 Neonatal deaths.

Comparison 5 Early amniocentesis (AC) versus transabdominal chorionic villus sampling (CVS), Outcome 26 All recorded deaths after viability.
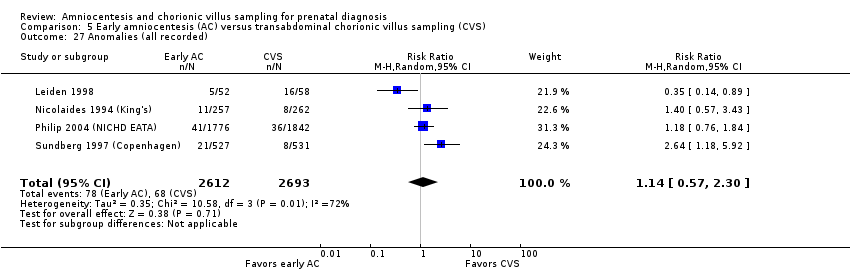
Comparison 5 Early amniocentesis (AC) versus transabdominal chorionic villus sampling (CVS), Outcome 27 Anomalies (all recorded).
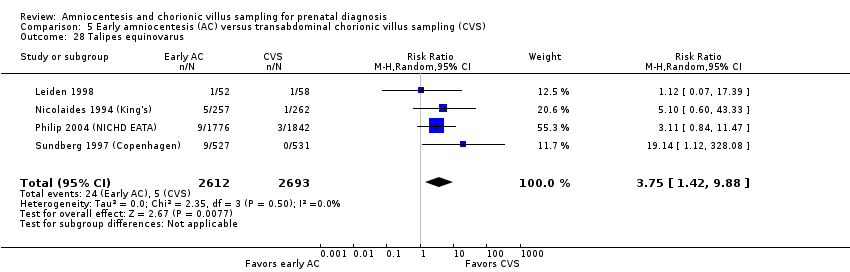
Comparison 5 Early amniocentesis (AC) versus transabdominal chorionic villus sampling (CVS), Outcome 28 Talipes equinovarus.

Comparison 5 Early amniocentesis (AC) versus transabdominal chorionic villus sampling (CVS), Outcome 29 Haemangioma.

Comparison 5 Early amniocentesis (AC) versus transabdominal chorionic villus sampling (CVS), Outcome 30 Neonatal respiratory distress syndrome.
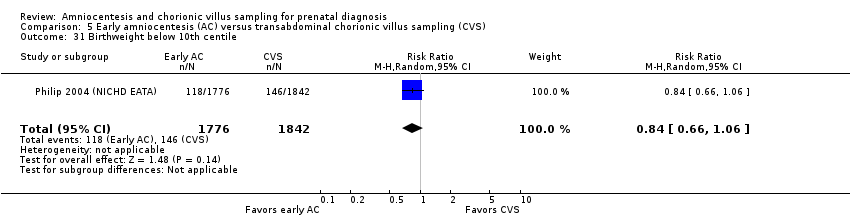
Comparison 5 Early amniocentesis (AC) versus transabdominal chorionic villus sampling (CVS), Outcome 31 Birthweight below 10th centile.

Comparison 5 Early amniocentesis (AC) versus transabdominal chorionic villus sampling (CVS), Outcome 32 Birthweight below 5th centile.

Comparison 6 Ultrasound versus no ultrasound before second trimester amniocentesis, Outcome 1 All known pregnancy loss (including termination of pregnancy).

Comparison 6 Ultrasound versus no ultrasound before second trimester amniocentesis, Outcome 2 Spontaneous miscarriage.

Comparison 6 Ultrasound versus no ultrasound before second trimester amniocentesis, Outcome 3 Spontaneous miscarriage after test.

Comparison 6 Ultrasound versus no ultrasound before second trimester amniocentesis, Outcome 4 Sampling failure.
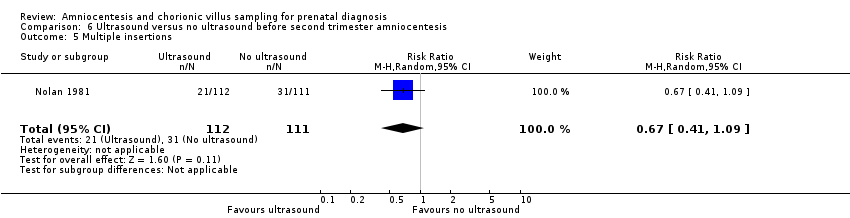
Comparison 6 Ultrasound versus no ultrasound before second trimester amniocentesis, Outcome 5 Multiple insertions.
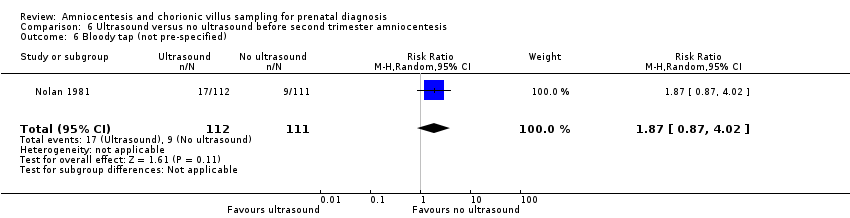
Comparison 6 Ultrasound versus no ultrasound before second trimester amniocentesis, Outcome 6 Bloody tap (not pre‐specified).
| Second trimester amniocentesis compared to control for prenatal diagnosis | ||||||
| Patient or population: prenatal diagnosis | ||||||
| Outcomes | Anticipated absolute effects* (95% CI) | Relative effect | № of participants | Quality of the evidence | Comments | |
| Risk with control | Risk with second trimester amniocentesis (AC) | |||||
| All known pregnancy loss (including termination of pregnancy) | Study population | RR 1.41 | 4606 | ⊕⊕⊕⊝ MODERATE1 | ||
| 23 per 1000 | 32 per 1000 | |||||
| Spontaneous miscarriage | Study population | RR 1.60 | 4606 | ⊕⊕⊕⊕ | ||
| 13 per 1000 | 21 per 1000 | |||||
| Sampling failure | ‐ | ‐ | ‐ | ‐ | ‐ | No trial reported this outcome |
| Laboratory failure | Study population | RR 27.02 | 4606 | ⊕⊕⊕⊕ | There were no events in the control group and only 13 in the AC group, so it was not possible to calculate the anticipated absolute effect. | |
| 0 per 1000 | 0 per 1000 | |||||
| Known false negative after birth | ‐ | ‐ | ‐ | ‐ | ‐ | No trial reported this outcome |
| Delivery before 33 weeks | ‐ | ‐ | ‐ | ‐ | ‐ | No trial reported this outcome |
| Anomalies (all recorded) | Study population | RR 0.93 | 4507 | ⊕⊕⊕⊝ | ||
| 22 per 1000 | 20 per 1000 | |||||
| *The risk in the intervention group (and its 95% confidence interval) is based on the assumed risk in the comparison group and the relative effect of the intervention (and its 95% CI). | ||||||
| GRADE Working Group grades of evidence | ||||||
| 1 Wide confidence intervals crossing the line of no effect (‐1) | ||||||
| Early compared to second trimester amniocentesis for prenatal diagnosis | ||||||
| Patient or population: prenatal diagnosis | ||||||
| Outcomes | Anticipated absolute effects* (95% CI) | Relative effect | № of participants | Quality of the evidence | Comments | |
| Risk with second trimester amniocentesis (AC) | Risk with early AC | |||||
| All known pregnancy loss (including termination of pregnancy) | Study population | RR 1.29 | 4334 | ⊕⊕⊕⊕ | ||
| 59 per 1000 | 76 per 1000 | |||||
| Spontaneous miscarriage | Study population | RR 1.41 | 4334 | ⊕⊕⊕⊝ | ||
| 25 per 1000 | 36 per 1000 | |||||
| Sampling failure | Study population | RR 4.53 | 629 | ⊕⊕⊕⊝ | ||
| 3 per 1000 | 15 per 1000 | |||||
| Laboratory failure | Study population | RR 9.76 | 4368 | ⊕⊕⊕⊕ | ||
| 2 per 1000 | 18 per 1000 | |||||
| Known false negative after birth | Study population | RR 3.00 | 4368 | ⊕⊕⊕⊝ | There were no events in the 2nd trimester AC group and only one in the early AC group, so it was not possible to calculate the anticipated absolute effect | |
| 0 per 1000 | 0 per 1000 | |||||
| Known false negative after birth ‐ Incorrect sex determination | Study population | RR 5.00 | 4368 | ⊕⊕⊕⊝ | There were no events in the 2nd trimester AC group and only 2 in the early AC group, so it was not possible to calculate the anticipated absolute effect. | |
| 0 per 1000 | 0 per 1000 | |||||
| Delivery before 33 weeks | ‐ | ‐ | ‐ | ‐ | No trial reported this outcome | |
| Anomalies (all recorded) | Study population | RR 1.73 | 4334 | ⊕⊕⊕⊕ | ||
| 27 per 1000 | 46 per 1000 | |||||
| *The risk in the intervention group (and its 95% confidence interval) is based on the assumed risk in the comparison group and the relative effect of the intervention (and its 95% CI). | ||||||
| GRADE Working Group grades of evidence | ||||||
| 1 One study, contributing 100% data, had unclear allocation concealment for one trial site, and satisfactory concealment for the other trial site (not downgraded) 2 Wide 95% confidence interval, crossing the line of no effect (‐1) | ||||||
| Chorionic villus sampling compared to second trimester amniocentesis for prenatal diagnosis | ||||||
| Patient or population: prenatal diagnosis | ||||||
| Outcomes | Anticipated absolute effects* (95% CI) | Relative effect | № of participants | Quality of the evidence | Comments | |
| Risk with second trimester amniocentesis | Risk with chorionic villus sampling | |||||
| All known pregnancy loss (including termination of pregnancy) | Study population | RR 0.90 | 2234 | ⊕⊕⊝⊝ | ||
| 70 per 1000 | 63 per 1000 | |||||
| Spontaneous miscarriage | Study population | RR 0.77 | 2069 | ⊕⊕⊝⊝ | ||
| 39 per 1000 | 30 per 1000 | |||||
| Sampling failure | ‐ | ‐ | ‐ | ‐ | ‐ | No trial reported this outcome |
| Laboratory failure | ‐ | ‐ | ‐ | ‐ | ‐ | No trial reported this outcome |
| Known false negative after birth | ‐ | ‐ | ‐ | ‐ | ‐ | No trial reported this outcome |
| Delivery before 33 weeks | ‐ | ‐ | ‐ | ‐ | ‐ | No trial reported this outcome |
| Perinatal deaths (stillbirths and neonatal deaths in the first week of life) | Study population | RR 1.18 | 2069 | ⊕⊕⊝⊝ | ||
| 6 per 1000 | 7 per 1000 | |||||
| *The risk in the intervention group (and its 95% confidence interval) is based on the assumed risk in the comparison group and the relative effect of the intervention (and its 95% CI). | ||||||
| GRADE Working Group grades of evidence | ||||||
| 1 Wide 95% confidence intervals that cross the line of no effect (‐1) 2 One study, contributing 100% data, with unclear method of randomisation (‐1) | ||||||
| Transcervical compared to transabdominal chorionic villus samplingfor prenatal diagnosis | ||||||
| Patient or population: prenatal diagnosis | ||||||
| Outcomes | Anticipated absolute effects* (95% CI) | Relative effect | № of participants | Quality of the evidence | Comments | |
| Risk with transabdominal chorionic villus sampling | Risk with transcervical chorionic villus sampling | |||||
| All known pregnancy loss (including termination of pregnancy) | Study population | RR 1.16 | 7978 | ⊕⊝⊝⊝ | ||
| 74 per 1000 | 86 per 1000 | |||||
| Spontaneous miscarriage | Study population | RR 1.68 | 3384 | ⊕⊝⊝⊝ | ||
| 45 per 1000 | 76 per 1000 | |||||
| Sampling failure | Study population | RR 1.79 | 5231 | ⊕⊕⊕⊝ | ||
| 11 per 1000 | 20 per 1000 | |||||
| Laboratory failure | Study population | RR 2.23 | 1194 | ⊕⊕⊝⊝ | ||
| 7 per 1000 | 15 per 1000 | |||||
| Known false negative after birth | ‐ | ‐ | ‐ | ‐ | ‐ | No trial reported this outcome |
| Delivery before 33 weeks | ‐ | ‐ | ‐ | ‐ | ‐ | No trial reported this outcome |
| Anomalies (all recorded) | Study population | RR 0.68 | 3622 | ⊕⊕⊝⊝ | ||
| 20 per 1000 | 14 per 1000 | |||||
| *The risk in the intervention group (and its 95% confidence interval) is based on the assumed risk in the comparison group and the relative effect of the intervention (and its 95% CI). | ||||||
| GRADE Working Group grades of evidence | ||||||
| 1 Wide 95% confidence intervals crossing the line of no effect (‐1) 2 Statistical heterogeneity I² > 60% 3 Four of five contributing studies did not specify randomisation method. All studies had design limitations. In one study, the proportion of cases where the operator deviated from the allocated procedure increased during the study (‐1) 4 Three of four studies, contributing > 95% weight, did not specify randomisation method. All studies had design limitations. In one study, the proportion of cases where the operator deviated from the allocated procedure increased during the study (‐1). 5 One study contributing data had design limitations ‐ the proportion of cases where the operator deviated from the allocated procedure increased during the study (‐1). 6 One of two contributing studies did not specify randomisation method. All studies had design limitations. In one study, the proportion of cases where the operator deviated from the allocated procedure increased during the study (‐1). | ||||||
| Early amniocentesis compared to transabdominal chorionic villus samplingfor prenatal diagnosis | ||||||
| Patient or population: prenatal diagnosis | ||||||
| Outcomes | Anticipated absolute effects* (95% CI) | Relative effect | № of participants | Quality of the evidence | Comments | |
| Risk with transabdominal chorionic villus sampling | Risk with early amniocentesis | |||||
| All known pregnancy loss (including termination of pregnancy) | Study population | RR 1.15 | 5491 | ⊕⊕⊝⊝ | ||
| 30 per 1000 | 35 per 1000 | |||||
| Spontaneous miscarriage | Study population | RR 1.73 | 5491 | ⊕⊕⊕⊝ | ||
| 13 per 1000 | 23 per 1000 | |||||
| Sampling failure | Study population | RR 0.58 (0.24 to 1.38) | 5566 | ⊕⊕⊝⊝ | ||
| 8 per 1000 | 5 per 1000 | |||||
| Laboratory failure | Study population | RR 0.74 (0.34 to 1.63) | 5566 | ⊕⊕⊝⊝ | ||
| 6 per 1000 | 4 per 1000 | |||||
| Known false negative after birth | Study population | Not estimable | 555 | ⊕⊕⊝⊝ | ||
| 0 per 1000 | 0 per 1000 | |||||
| Delivery before 33 weeks | Study population | RR 0.50 | 1121 | ⊕⊕⊝⊝ | ||
| 7 per 1000 | 4 per 1000 | |||||
| Anomalies (all recorded) | Study population | RR 1.14 | 5305 | ⊕⊝⊝⊝ | ||
| 25 per 1000 | 29 per 1000 | |||||
| *The risk in the intervention group (and its 95% confidence interval) is based on the assumed risk in the comparison group and the relative effect of the intervention (and its 95% CI). | ||||||
| GRADE Working Group grades of evidence | ||||||
| 1 Three of four studies, contributing > 50% weight of analysis, did not specify randomisation method (‐1). 2 Wide 95% confidence intervals crossing the line of no effect (‐1) 3 Randomisation method not specified (‐1) 4 One study with 555 women and no events therefore not possible to estimate risk (‐1) 5 Statistical heterogeneity I²>60% (‐1) | ||||||
| Systematic review (by first author) | Single or multiple pregnancies | Pregnancy loss rates reported % (95% CI) | Pooled procedure‐related pregnancy losses % (95% CI) |
| Twins | Total 3.84% (2.48 to 5.47) < 20 weeks 2.75% (1.28 to 4.75) < 28 weeks 3.44% (1.67 to 5.81) | ‐ | |
| Singletons | < 24 weeks 2.18% (1.61 to 2.82) | 0.22% (‐0.71 to 1.16) | |
| Singletons | Total 2.0% (1.0 to 1.7) < 24 weeks 1.3% (0.5 to 2.3) | < 14 days 0.7% (0.3 to 1.4) |
| Systematic review (by first author) | Single or multiple pregnancies | Pregnancy loss rates reported % (95% CI) | Pooled procedure‐related pregnancy losses % (95% CI) |
| Twins | Total 3.07% (1.83 to 4.61) < 20 weeks 2.25% (1.23 to 3.57) < 24 weeks 2.54% (1.43 to 3.96) < 28 weeks 1.70% (0.37 to 3.97) | ‐ | |
| Singletons | < 24 weeks 0.81% (0.58 to 1.08) | 0.11% (‐0.04 to 0.26) | |
| Singletons | Total 1.9% (1.4 to 2.5) < 24 weeks 0.9% (0.60 to 1.30) | < 14 days 0.6 (0.5‐0.7) | |
| Twins | Monochorionic 7.7% vs 1.4% (amniocentesis vs control) | < 24 weeks 3.5% (2.6 to 4.7) |
| Outcome or subgroup title | No. of studies | No. of participants | Statistical method | Effect size |
| 1 All known pregnancy loss (including termination of pregnancy) Show forest plot | 1 | 4606 | Risk Ratio (M‐H, Random, 95% CI) | 1.41 [0.99, 2.00] |
| 2 Spontaneous miscarriage Show forest plot | 1 | 4606 | Risk Ratio (M‐H, Random, 95% CI) | 1.60 [1.02, 2.52] |
| 3 Non‐compliance with allocated procedure Show forest plot | 1 | 4606 | Risk Ratio (M‐H, Random, 95% CI) | 1.73 [1.03, 2.91] |
| 4 Multiple insertions Show forest plot | 1 | 4606 | Risk Ratio (M‐H, Random, 95% CI) | 91.08 [5.61, 1477.53] |
| 5 Second test performed Show forest plot | 1 | 4606 | Risk Ratio (M‐H, Random, 95% CI) | 41.04 [2.48, 678.07] |
| 6 Laboratory failure Show forest plot | 1 | 4606 | Risk Ratio (M‐H, Random, 95% CI) | 27.02 [1.61, 454.31] |
| 7 All non‐mosaic abnormalities Show forest plot | 1 | 4593 | Risk Ratio (M‐H, Random, 95% CI) | 30.85 [1.85, 515.31] |
| 8 Vaginal bleeding after test Show forest plot | 1 | 4606 | Risk Ratio (M‐H, Random, 95% CI) | 0.95 [0.66, 1.37] |
| 9 Amniotic leakage after test Show forest plot | 1 | 4606 | Risk Ratio (M‐H, Random, 95% CI) | 3.90 [1.95, 7.80] |
| 10 Termination of pregnancy (all) Show forest plot | 1 | 4606 | Risk Ratio (M‐H, Random, 95% CI) | 2.50 [0.97, 6.44] |
| 11 Perinatal deaths Show forest plot | 1 | 4606 | Risk Ratio (M‐H, Random, 95% CI) | 0.63 [0.28, 1.38] |
| 12 Stillbirths Show forest plot | 1 | 4606 | Risk Ratio (M‐H, Random, 95% CI) | 0.83 [0.36, 1.93] |
| 13 Neonatal deaths Show forest plot | 1 | 4606 | Risk Ratio (M‐H, Random, 95% CI) | 0.11 [0.01, 2.06] |
| 14 All recorded deaths after viability Show forest plot | 1 | 4606 | Risk Ratio (M‐H, Random, 95% CI) | 0.63 [0.28, 1.38] |
| 15 Anomalies (all recorded) Show forest plot | 1 | 4507 | Risk Ratio (M‐H, Random, 95% CI) | 0.93 [0.62, 1.39] |
| 16 Talipes Show forest plot | 1 | 4507 | Risk Ratio (M‐H, Random, 95% CI) | 0.68 [0.37, 1.22] |
| 17 Neonatal respiratory distress syndrome Show forest plot | 1 | 4507 | Risk Ratio (M‐H, Random, 95% CI) | 2.11 [1.06, 4.19] |
| Outcome or subgroup title | No. of studies | No. of participants | Statistical method | Effect size |
| 1 All known pregnancy loss (including termination of pregnancy) Show forest plot | 1 | 4334 | Risk Ratio (M‐H, Random, 95% CI) | 1.29 [1.03, 1.61] |
| 2 Spontaneous miscarriage Show forest plot | 1 | 4334 | Risk Ratio (M‐H, Random, 95% CI) | 1.41 [1.00, 1.98] |
| 3 Spontaneous miscarriage after test Show forest plot | 1 | 4334 | Risk Ratio (M‐H, Random, 95% CI) | 3.22 [1.88, 5.53] |
| 4 Non‐compliance with allocated procedure Show forest plot | 1 | 4368 | Risk Ratio (M‐H, Random, 95% CI) | 0.65 [0.57, 0.75] |
| 5 Sampling failure Show forest plot | 1 | 629 | Risk Ratio (M‐H, Random, 95% CI) | 4.53 [0.53, 38.56] |
| 6 Multiple insertions Show forest plot | 1 | 4368 | Risk Ratio (M‐H, Random, 95% CI) | 2.79 [1.92, 4.04] |
| 7 Second test performed Show forest plot | 1 | 4107 | Risk Ratio (M‐H, Random, 95% CI) | 8.72 [3.47, 21.91] |
| 8 Laboratory failure Show forest plot | 1 | 4368 | Risk Ratio (M‐H, Random, 95% CI) | 9.76 [3.49, 27.26] |
| 9 All non‐mosaic abnormalities Show forest plot | 1 | 4368 | Risk Ratio (M‐H, Random, 95% CI) | 1.11 [0.75, 1.66] |
| 10 True mosaics Show forest plot | 1 | 4368 | Risk Ratio (M‐H, Random, 95% CI) | 1.00 [0.25, 4.00] |
| 11 Maternal contamination Show forest plot | 1 | 4368 | Risk Ratio (M‐H, Random, 95% CI) | 2.00 [0.37, 10.92] |
| 12 Known false negative after birth Show forest plot | 1 | Risk Ratio (M‐H, Random, 95% CI) | Subtotals only | |
| 12.1 False negative chromosomal results (excluding sex determination) | 1 | 4368 | Risk Ratio (M‐H, Random, 95% CI) | 3.00 [0.12, 73.67] |
| 12.2 Incorrect sex determination | 1 | 4368 | Risk Ratio (M‐H, Random, 95% CI) | 5.00 [0.24, 104.18] |
| 13 Reporting time Show forest plot | 1 | 4107 | Mean Difference (IV, Random, 95% CI) | 1.20 [0.89, 1.51] |
| 14 Amniotic leakage after test Show forest plot | 1 | 4368 | Risk Ratio (M‐H, Random, 95% CI) | 2.05 [1.43, 2.94] |
| 15 Termination of pregnancy (all) Show forest plot | 1 | 4334 | Risk Ratio (M‐H, Random, 95% CI) | 1.26 [0.89, 1.77] |
| 16 Stillbirths Show forest plot | 1 | 4334 | Risk Ratio (M‐H, Random, 95% CI) | 0.73 [0.34, 1.59] |
| 17 Neonatal deaths Show forest plot | 1 | 4334 | Risk Ratio (M‐H, Random, 95% CI) | 4.98 [0.58, 42.56] |
| 18 All recorded deaths after viability Show forest plot | 1 | 4334 | Risk Ratio (M‐H, Random, 95% CI) | 1.00 [0.50, 1.99] |
| 19 Anomalies (all recorded) Show forest plot | 1 | 4334 | Risk Ratio (M‐H, Random, 95% CI) | 1.73 [1.26, 2.38] |
| 20 Talipes Show forest plot | 1 | Risk Ratio (M‐H, Random, 95% CI) | Subtotals only | |
| 20.1 Talipes equinovarus | 1 | 4334 | Risk Ratio (M‐H, Random, 95% CI) | 14.43 [3.45, 60.41] |
| Outcome or subgroup title | No. of studies | No. of participants | Statistical method | Effect size |
| 1 All known pregnancy loss (including termination of pregnancy) Show forest plot | 5 | Risk Ratio (M‐H, Random, 95% CI) | Subtotals only | |
| 1.1 Transcervical CVS versus amniocentesis | 4 | 6527 | Risk Ratio (M‐H, Random, 95% CI) | 1.40 [1.09, 1.81] |
| 1.2 Transabdominal CVS versus amniocentesis | 1 | 2234 | Risk Ratio (M‐H, Random, 95% CI) | 0.90 [0.66, 1.23] |
| 1.3 CVS (any route) versus amniocentesis | 2 | 6503 | Risk Ratio (M‐H, Random, 95% CI) | 1.43 [1.22, 1.67] |
| 2 Spontaneous miscarriage Show forest plot | 4 | Risk Ratio (M‐H, Random, 95% CI) | Subtotals only | |
| 2.1 Transcervical CVS versus amniocentesis | 3 | 5506 | Risk Ratio (M‐H, Random, 95% CI) | 1.50 [1.07, 2.11] |
| 2.2 Transabdominal CVS versus amniocentesis | 1 | 2069 | Risk Ratio (M‐H, Random, 95% CI) | 0.77 [0.49, 1.21] |
| 2.3 CVS (any route) versus amniocentesis | 2 | 6280 | Risk Ratio (M‐H, Random, 95% CI) | 1.51 [1.23, 1.85] |
| 3 Spontaneous miscarriage after test Show forest plot | 3 | Risk Ratio (M‐H, Random, 95% CI) | Subtotals only | |
| 3.1 Transcervical CVS versus amniocentesis | 2 | 1579 | Risk Ratio (M‐H, Random, 95% CI) | 1.77 [0.28, 11.00] |
| 3.2 CVS (any route) versus amniocentesis | 1 | 3201 | Risk Ratio (M‐H, Random, 95% CI) | 3.46 [2.21, 5.42] |
| 4 Non‐compliance with allocated procedure Show forest plot | 4 | Risk Ratio (M‐H, Random, 95% CI) | Subtotals only | |
| 4.1 Transcervical CVS versus amniocentesis | 3 | 4595 | Risk Ratio (M‐H, Random, 95% CI) | 0.51 [0.14, 1.87] |
| 4.2 CVS (any route) versus amniocentesis | 1 | 3197 | Risk Ratio (M‐H, Random, 95% CI) | 0.66 [0.52, 0.83] |
| 5 Sampling failure Show forest plot | 2 | Risk Ratio (M‐H, Random, 95% CI) | Subtotals only | |
| 5.1 Transervical CVS versus amniocentesis | 1 | 797 | Risk Ratio (M‐H, Random, 95% CI) | 0.55 [0.26, 1.19] |
| 5.2 CVS (any route) versus amniocentesis | 1 | 3201 | Risk Ratio (M‐H, Random, 95% CI) | 3.09 [1.98, 4.82] |
| 6 Multiple insertions Show forest plot | 2 | Risk Ratio (M‐H, Random, 95% CI) | Subtotals only | |
| 6.1 Transcervical CVS versus amniocentesis | 1 | 794 | Risk Ratio (M‐H, Random, 95% CI) | 3.93 [2.72, 5.68] |
| 6.2 CVS (any route) versus amniocentesis | 1 | 2917 | Risk Ratio (M‐H, Random, 95% CI) | 4.85 [3.92, 6.01] |
| 7 Second test performed Show forest plot | 4 | Risk Ratio (M‐H, Random, 95% CI) | Subtotals only | |
| 7.1 Transcervical CVS versus amniocentesis | 3 | 4256 | Risk Ratio (M‐H, Random, 95% CI) | 19.63 [1.24, 309.90] |
| 7.2 CVS (any route) versus amniocentesis | 1 | 3201 | Risk Ratio (M‐H, Random, 95% CI) | 2.83 [1.94, 4.13] |
| 8 Laboratory failure Show forest plot | 3 | Risk Ratio (M‐H, Random, 95% CI) | Subtotals only | |
| 8.1 Transcervical CVS versus amniocentesis | 2 | 2792 | Risk Ratio (M‐H, Random, 95% CI) | 22.62 [3.07, 166.89] |
| 8.2 CVS (any route) versus amniocentesis | 1 | 3201 | Risk Ratio (M‐H, Random, 95% CI) | 0.77 [0.29, 2.06] |
| 9 All non‐mosaic abnormalities Show forest plot | 2 | Risk Ratio (M‐H, Random, 95% CI) | Subtotals only | |
| 9.1 Transcervical CVS versus amniocentesis | 2 | 2667 | Risk Ratio (M‐H, Random, 95% CI) | 1.12 [0.73, 1.72] |
| 10 True mosaics Show forest plot | 1 | Risk Ratio (M‐H, Random, 95% CI) | Subtotals only | |
| 10.1 Transcervical CVS versus amniocentesis | 1 | 672 | Risk Ratio (M‐H, Random, 95% CI) | 3.42 [0.14, 83.63] |
| 11 Confined mosaics Show forest plot | 1 | Risk Ratio (M‐H, Random, 95% CI) | Subtotals only | |
| 11.1 Transcervical CVS versus amniocentesis | 1 | 1995 | Risk Ratio (M‐H, Random, 95% CI) | 5.66 [1.97, 16.24] |
| 12 Maternal contamination Show forest plot | 2 | Risk Ratio (M‐H, Random, 95% CI) | Subtotals only | |
| 12.1 Transcervical CVS versus amniocentesis | 1 | 1991 | Risk Ratio (M‐H, Random, 95% CI) | 12.30 [3.81, 39.67] |
| 12.2 CVS (any route) versus amniocentesis | 1 | 3201 | Risk Ratio (M‐H, Random, 95% CI) | 8.90 [0.48, 165.26] |
| 13 Known false positive after birth Show forest plot | 3 | Risk Ratio (M‐H, Random, 95% CI) | Subtotals only | |
| 13.1 Transcervical CVS versus amniocentesis | 2 | 2627 | Risk Ratio (M‐H, Random, 95% CI) | 4.40 [0.46, 42.38] |
| 13.2 CVS (any route) versus amniocentesis | 1 | 3201 | Risk Ratio (M‐H, Random, 95% CI) | 0.99 [0.06, 15.80] |
| 14 Known false negative after birth Show forest plot | 3 | Risk Ratio (M‐H, Random, 95% CI) | Subtotals only | |
| 14.1 Transcervical CVS versus amniocentesis | 2 | 2627 | Risk Ratio (M‐H, Random, 95% CI) | 7.84 [0.41, 151.61] |
| 14.2 CVS (any route) versus amniocentesis | 1 | 3201 | Risk Ratio (M‐H, Random, 95% CI) | 2.97 [0.12, 72.81] |
| 15 Results given in less than 7 days (not pre‐specified) Show forest plot | 1 | Risk Ratio (M‐H, Random, 95% CI) | Subtotals only | |
| 15.1 CVS (any route) versus amniocentesis | 1 | 3099 | Risk Ratio (M‐H, Random, 95% CI) | 23.52 [12.54, 44.10] |
| 16 Results given in less than 14 days (not pre‐specified) Show forest plot | 1 | Risk Ratio (M‐H, Random, 95% CI) | Subtotals only | |
| 16.1 CVS (any route) versus amniocentesis | 1 | 3099 | Risk Ratio (M‐H, Random, 95% CI) | 3.96 [3.17, 4.95] |
| 17 Results given in less than 21 days (not pre‐specified) Show forest plot | 1 | Risk Ratio (M‐H, Random, 95% CI) | Subtotals only | |
| 17.1 CVS (any route) versus amniocentesis | 1 | 3099 | Risk Ratio (M‐H, Random, 95% CI) | 0.72 [0.63, 0.82] |
| 18 Result given after 21 days (not pre‐specified) Show forest plot | 1 | Risk Ratio (M‐H, Random, 95% CI) | Subtotals only | |
| 18.1 CVS (any route) versus amniocentesis | 1 | 3099 | Risk Ratio (M‐H, Random, 95% CI) | 0.33 [0.28, 0.39] |
| 19 Vaginal bleeding after test Show forest plot | 2 | Risk Ratio (M‐H, Random, 95% CI) | Subtotals only | |
| 19.1 Transcervical CVS versus amniocentesis | 2 | 3193 | Risk Ratio (M‐H, Random, 95% CI) | 11.48 [2.58, 51.08] |
| 20 Amniotic leakage after test Show forest plot | 2 | Risk Ratio (M‐H, Random, 95% CI) | Subtotals only | |
| 20.1 Transabdominal CVS vs amniocentesis | 1 | 1485 | Risk Ratio (M‐H, Random, 95% CI) | 2.53 [0.81, 7.92] |
| 20.2 CVS (any route) versus amniocentesis | 1 | 3201 | Risk Ratio (M‐H, Random, 95% CI) | 0.55 [0.18, 1.64] |
| 21 Vaginal bleeding after 20 weeks Show forest plot | 2 | Risk Ratio (M‐H, Random, 95% CI) | Subtotals only | |
| 21.1 Transcervical CVS versus amniocentesis | 1 | 797 | Risk Ratio (M‐H, Random, 95% CI) | 1.44 [0.62, 3.33] |
| 21.2 CVS (any route) versus amniocentesis | 1 | 3201 | Risk Ratio (M‐H, Random, 95% CI) | 0.99 [0.69, 1.42] |
| 22 Pre‐labour ruptured membranes before 28 weeks Show forest plot | 2 | Risk Ratio (M‐H, Random, 95% CI) | Subtotals only | |
| 22.1 Transcervical CVS versus amniocentesis | 1 | 722 | Risk Ratio (M‐H, Random, 95% CI) | 4.97 [1.45, 17.03] |
| 22.2 CVS (any route) versus amniocentesis | 1 | 2765 | Risk Ratio (M‐H, Random, 95% CI) | 1.60 [0.80, 3.17] |
| 23 Antenatal hospital admission Show forest plot | 2 | Risk Ratio (M‐H, Random, 95% CI) | Subtotals only | |
| 23.1 Transcervical CVS versus amniocentesis | 1 | 780 | Risk Ratio (M‐H, Random, 95% CI) | 1.47 [0.81, 2.68] |
| 23.2 CVS (any route) versus amniocentesis | 1 | 3201 | Risk Ratio (M‐H, Random, 95% CI) | 0.90 [0.75, 1.08] |
| 24 Delivery before 37 weeks Show forest plot | 3 | Risk Ratio (M‐H, Random, 95% CI) | Subtotals only | |
| 24.1 Transcervical CVS versus amniocentesis | 2 | 2506 | Risk Ratio (M‐H, Random, 95% CI) | 1.29 [0.67, 2.47] |
| 24.2 CVS (any route) versus amniocentesis | 1 | 3189 | Risk Ratio (M‐H, Random, 95% CI) | 1.33 [1.13, 1.57] |
| 25 Delivery before 33 weeks Show forest plot | 1 | Risk Ratio (M‐H, Random, 95% CI) | Subtotals only | |
| 25.1 Transcervical CVS versus amniocentesis | 1 | 768 | Risk Ratio (M‐H, Random, 95% CI) | 2.16 [0.94, 4.94] |
| 26 Termination of pregnancy (all) Show forest plot | 3 | Risk Difference (M‐H, Random, 95% CI) | Subtotals only | |
| 26.1 Transcervical CVS versus amniocentesis | 2 | 3454 | Risk Difference (M‐H, Random, 95% CI) | ‐0.00 [‐0.01, 0.01] |
| 26.2 CVS (any route) versus amniocentesis | 1 | 3201 | Risk Difference (M‐H, Random, 95% CI) | 0.01 [‐0.00, 0.02] |
| 27 Perinatal deaths Show forest plot | 4 | Risk Ratio (M‐H, Random, 95% CI) | Subtotals only | |
| 27.1 Transcervical CVS versus amniocentesis | 3 | 5521 | Risk Ratio (M‐H, Random, 95% CI) | 1.79 [0.42, 7.69] |
| 27.2 Transabdominal CVS versus amniocentesis | 1 | 2069 | Risk Ratio (M‐H, Random, 95% CI) | 1.18 [0.40, 3.51] |
| 27.3 CVS (any route) versus amniocentesis | 2 | 6280 | Risk Ratio (M‐H, Random, 95% CI) | 1.20 [0.64, 2.24] |
| 28 Stillbirths Show forest plot | 3 | Risk Ratio (M‐H, Random, 95% CI) | Subtotals only | |
| 28.1 Transcervical CVS versus amniocentesis | 2 | 3454 | Risk Ratio (M‐H, Random, 95% CI) | 0.94 [0.02, 45.31] |
| 28.2 CVS (any route) versus amniocentesis | 1 | 3201 | Risk Ratio (M‐H, Random, 95% CI) | 0.99 [0.35, 2.81] |
| 29 Neonatal deaths Show forest plot | 4 | Risk Ratio (M‐H, Random, 95% CI) | Subtotals only | |
| 29.1 Transcervical CVS versus amniocentesis | 3 | 4251 | Risk Ratio (M‐H, Random, 95% CI) | 1.63 [0.38, 7.05] |
| 29.2 CVS (any route) versus amniocentesis | 1 | 3201 | Risk Ratio (M‐H, Random, 95% CI) | 2.64 [0.70, 9.93] |
| 30 All recorded deaths after viability Show forest plot | 3 | Risk Ratio (M‐H, Random, 95% CI) | Subtotals only | |
| 30.1 Transcervical CVS versus amniocentesis | 2 | 1579 | Risk Ratio (M‐H, Random, 95% CI) | 0.78 [0.02, 25.93] |
| 30.2 CVS (any route) versus amniocentesis | 1 | 3201 | Risk Ratio (M‐H, Random, 95% CI) | 1.44 [0.67, 3.09] |
| 31 Congenital anomalies (all recorded) Show forest plot | 4 | Risk Ratio (M‐H, Random, 95% CI) | Subtotals only | |
| 31.1 Transcervical CVS versus amniocentesis | 2 | 1408 | Risk Ratio (M‐H, Random, 95% CI) | 0.62 [0.25, 1.59] |
| 31.2 CVS (any route) versus amniocentesis | 2 | 3338 | Risk Ratio (M‐H, Random, 95% CI) | 0.77 [0.66, 0.89] |
| 32 Haemangioma Show forest plot | 1 | 182 | Risk Ratio (M‐H, Random, 95% CI) | 1.35 [0.81, 2.24] |
| 33 Limb reduction defects Show forest plot | 1 | 3201 | Risk Ratio (M‐H, Random, 95% CI) | 4.95 [0.24, 102.97] |
| 33.1 CVS (any route) versus amniocentesis | 1 | 3201 | Risk Ratio (M‐H, Random, 95% CI) | 4.95 [0.24, 102.97] |
| Outcome or subgroup title | No. of studies | No. of participants | Statistical method | Effect size |
| 1 All known pregnancy loss (including termination of pregnancy) Show forest plot | 5 | 7978 | Risk Ratio (M‐H, Random, 95% CI) | 1.16 [0.81, 1.65] |
| 2 Spontaneous miscarriage Show forest plot | 4 | 3384 | Risk Ratio (M‐H, Random, 95% CI) | 1.68 [0.79, 3.58] |
| 3 Spontaneous miscarriage after test Show forest plot | 3 | 1347 | Risk Ratio (M‐H, Random, 95% CI) | 1.23 [0.75, 2.04] |
| 4 Non‐compliance with allocated procedure Show forest plot | 3 | 5187 | Risk Ratio (M‐H, Random, 95% CI) | 1.68 [0.59, 4.76] |
| 5 Sampling failure Show forest plot | 4 | 5231 | Risk Ratio (M‐H, Random, 95% CI) | 1.79 [1.13, 2.82] |
| 6 Multiple insertions Show forest plot | 2 | 1314 | Risk Ratio (M‐H, Random, 95% CI) | 2.54 [1.47, 4.42] |
| 7 Second test performed Show forest plot | 1 | 1194 | Risk Ratio (M‐H, Random, 95% CI) | 1.24 [0.65, 2.37] |
| 8 Laboratory failure Show forest plot | 1 | 1194 | Risk Ratio (M‐H, Random, 95% CI) | 2.23 [0.69, 7.22] |
| 9 All non‐mosaic abnormalities Show forest plot | 1 | 2862 | Risk Ratio (M‐H, Random, 95% CI) | 1.23 [0.87, 1.75] |
| 10 True mosaics Show forest plot | 1 | 2862 | Risk Ratio (M‐H, Random, 95% CI) | 0.92 [0.39, 2.17] |
| 11 Confined mosaics Show forest plot | 1 | 2862 | Risk Ratio (M‐H, Random, 95% CI) | 0.85 [0.26, 2.77] |
| 12 Amniotic leakage after test Show forest plot | 1 | 44 | Risk Ratio (M‐H, Random, 95% CI) | 0.28 [0.01, 6.52] |
| 13 Vaginal bleeding after test Show forest plot | 3 | 1358 | Risk Ratio (M‐H, Random, 95% CI) | 6.93 [0.77, 62.83] |
| 14 Termination of pregnancy (all) Show forest plot | 2 | 1303 | Risk Ratio (M‐H, Random, 95% CI) | 0.83 [0.56, 1.22] |
| 15 Perinatal deaths Show forest plot | 1 | 2037 | Risk Ratio (M‐H, Random, 95% CI) | 0.44 [0.11, 1.68] |
| 16 Stillbirths Show forest plot | 2 | 1227 | Risk Ratio (M‐H, Random, 95% CI) | 1.36 [0.11, 17.53] |
| 17 Neonatal deaths Show forest plot | 2 | 4845 | Risk Ratio (M‐H, Random, 95% CI) | 0.60 [0.14, 2.55] |
| 18 Anomalies (all recorded) Show forest plot | 2 | 3622 | Risk Ratio (M‐H, Random, 95% CI) | 0.68 [0.41, 1.12] |
| 19 Talipes Show forest plot | 1 | 2624 | Risk Ratio (M‐H, Random, 95% CI) | 3.21 [0.33, 30.80] |
| Outcome or subgroup title | No. of studies | No. of participants | Statistical method | Effect size |
| 1 All known pregnancy loss (including termination of pregnancy) Show forest plot | 4 | 5491 | Risk Ratio (M‐H, Random, 95% CI) | 1.15 [0.86, 1.54] |
| 2 Spontaneous miscarriage Show forest plot | 4 | 5491 | Risk Ratio (M‐H, Random, 95% CI) | 1.73 [1.15, 2.60] |
| 3 Spontaneous miscarriage after test Show forest plot | 4 | 5489 | Risk Ratio (M‐H, Random, 95% CI) | 1.71 [1.12, 2.61] |
| 4 Non‐compliance with allocated procedure Show forest plot | 4 | 5566 | Risk Ratio (M‐H, Random, 95% CI) | 0.25 [0.09, 0.72] |
| 5 Sampling failure Show forest plot | 4 | 5566 | Risk Ratio (M‐H, Random, 95% CI) | 0.58 [0.24, 1.38] |
| 6 Multiple insertions Show forest plot | 3 | 4445 | Risk Ratio (M‐H, Random, 95% CI) | 0.45 [0.21, 0.95] |
| 7 Second test performed Show forest plot | 4 | 5566 | Risk Ratio (M‐H, Random, 95% CI) | 0.63 [0.28, 1.43] |
| 8 Laboratory failure Show forest plot | 4 | 5566 | Risk Ratio (M‐H, Random, 95% CI) | 0.74 [0.34, 1.63] |
| 9 All non‐mosaic abnormalities Show forest plot | 4 | 5566 | Risk Ratio (M‐H, Random, 95% CI) | 0.95 [0.47, 1.90] |
| 10 True mosaics Show forest plot | 3 | 5451 | Risk Ratio (M‐H, Random, 95% CI) | 0.47 [0.10, 2.20] |
| 11 Confined mosaics Show forest plot | 4 | 5566 | Risk Ratio (M‐H, Random, 95% CI) | 0.82 [0.27, 2.47] |
| 12 Maternal contamination Show forest plot | 2 | 4330 | Risk Ratio (M‐H, Random, 95% CI) | 1.92 [0.02, 162.80] |
| 13 Known false positive after birth Show forest plot | 2 | 670 | Risk Ratio (M‐H, Random, 95% CI) | 0.36 [0.02, 8.73] |
| 14 Knonw false negative after birth Show forest plot | 1 | 555 | Risk Ratio (M‐H, Fixed, 95% CI) | 0.0 [0.0, 0.0] |
| 15 Reporting time Show forest plot | 1 | 3775 | Mean Difference (IV, Random, 95% CI) | 4.00 [3.82, 4.18] |
| 16 Vaginal bleeding after 20 weeks Show forest plot | 1 | 3698 | Risk Ratio (M‐H, Random, 95% CI) | 0.71 [0.35, 1.43] |
| 17 Amniotic leakage after test Show forest plot | 3 | 4934 | Risk Ratio (M‐H, Random, 95% CI) | 3.35 [0.37, 30.09] |
| 18 Vaginal bleeding after test Show forest plot | 3 | 4934 | Risk Ratio (M‐H, Random, 95% CI) | 0.69 [0.42, 1.12] |
| 19 Pre‐labour ruptured membranes before 28 weeks Show forest plot | 1 | 3698 | Risk Ratio (M‐H, Random, 95% CI) | 0.50 [0.27, 0.92] |
| 20 Delivery before 37 weeks Show forest plot | 3 | 1755 | Risk Ratio (M‐H, Random, 95% CI) | 1.16 [0.78, 1.74] |
| 21 Delivery before 33 weeks Show forest plot | 1 | 1121 | Risk Ratio (M‐H, Random, 95% CI) | 0.50 [0.09, 2.73] |
| 22 Termination of pregnancy (all) Show forest plot | 4 | 5489 | Risk Ratio (M‐H, Random, 95% CI) | 0.74 [0.45, 1.25] |
| 23 Perinatal deaths Show forest plot | 4 | 5428 | Risk Ratio (M‐H, Random, 95% CI) | 1.10 [0.53, 2.28] |
| 24 Stillbirths Show forest plot | 4 | 5428 | Risk Ratio (M‐H, Random, 95% CI) | 1.11 [0.52, 2.36] |
| 25 Neonatal deaths Show forest plot | 4 | 5455 | Risk Ratio (M‐H, Random, 95% CI) | 0.41 [0.05, 3.11] |
| 26 All recorded deaths after viability Show forest plot | 4 | 5453 | Risk Ratio (M‐H, Random, 95% CI) | 1.18 [0.43, 3.24] |
| 27 Anomalies (all recorded) Show forest plot | 4 | 5305 | Risk Ratio (M‐H, Random, 95% CI) | 1.14 [0.57, 2.30] |
| 28 Talipes equinovarus Show forest plot | 4 | 5305 | Risk Ratio (M‐H, Random, 95% CI) | 3.75 [1.42, 9.88] |
| 29 Haemangioma Show forest plot | 4 | 5305 | Risk Ratio (M‐H, Random, 95% CI) | 0.75 [0.26, 2.20] |
| 30 Neonatal respiratory distress syndrome Show forest plot | 4 | 4725 | Risk Ratio (M‐H, Random, 95% CI) | 0.91 [0.21, 3.98] |
| 31 Birthweight below 10th centile Show forest plot | 1 | 3618 | Risk Ratio (M‐H, Random, 95% CI) | 0.84 [0.66, 1.06] |
| 32 Birthweight below 5th centile Show forest plot | 2 | 629 | Risk Ratio (M‐H, Random, 95% CI) | 0.66 [0.05, 9.38] |
| Outcome or subgroup title | No. of studies | No. of participants | Statistical method | Effect size |
| 1 All known pregnancy loss (including termination of pregnancy) Show forest plot | 1 | 223 | Risk Ratio (M‐H, Random, 95% CI) | 0.33 [0.01, 8.02] |
| 2 Spontaneous miscarriage Show forest plot | 1 | 223 | Risk Ratio (M‐H, Random, 95% CI) | 0.33 [0.01, 8.02] |
| 3 Spontaneous miscarriage after test Show forest plot | 1 | 223 | Risk Ratio (M‐H, Random, 95% CI) | 0.33 [0.01, 8.02] |
| 4 Sampling failure Show forest plot | 1 | 223 | Risk Ratio (M‐H, Random, 95% CI) | 10.90 [0.61, 194.85] |
| 5 Multiple insertions Show forest plot | 1 | 223 | Risk Ratio (M‐H, Random, 95% CI) | 0.67 [0.41, 1.09] |
| 6 Bloody tap (not pre‐specified) Show forest plot | 1 | 223 | Risk Ratio (M‐H, Random, 95% CI) | 1.87 [0.87, 4.02] |