Amniocentesis y toma de muestras de vellosidades coriónicas para el diagnóstico prenatal
Información
- DOI:
- https://doi.org/10.1002/14651858.CD003252.pub2Copiar DOI

- Base de datos:
-
- Cochrane Database of Systematic Reviews
- Versión publicada:
-
- 04 septiembre 2017see what's new
- Tipo:
-
- Intervention
- Etapa:
-
- Review
- Grupo Editorial Cochrane:
-
Grupo Cochrane de Embarazo y parto
- Copyright:
-
- Copyright © 2017 The Cochrane Collaboration. Published by John Wiley & Sons, Ltd.
Cifras del artículo
Altmetric:
Citado por:
Autores
Contributions of authors
Z Alfirevic developed the protocol, interpreted the data, and wrote the original review. F Mujezinovic extracted the data and co‐wrote the original review. K Navaratnam completed the GRADE assessments for included studies and updated the review.
Sources of support
Internal sources
-
The University of Liverpool, UK.
External sources
-
No sources of support supplied
Declarations of interest
Zarko Alfirevic: Zarko Alfirevic is Director of the Harris Wellbeing Preterm Birth Centre, which is grant funded by the charity Wellbeing of Women. This grant is administered by the University of Liverpool, and Zarko Alfirevic is not paid directly. He is the principal investigator or co‐investigator on several grants from public funders, including National Institute of Health Research, British Medical Association, European Commission, and WHO. He has received research support in the past from Perkin Elmer and Alere for research related to pre‐eclampsia and preterm birth prevention. These grants were administered by his employers and ZA did not benefit directly. ZA is also a Co‐coordinating Editor of Cochrane Pregnancy and Childbirth.
Kate Navaratnam: none known.
Faris Mujezinovic: none known.
Acknowledgements
We are grateful to Sarah Ayers from the National Perinatal Epidemiology Unit in Oxford for providing unpublished data from the MRC 1991 and Ammala 1993 (MRC Finland) trials and to Frank Vandenbussche and Helen Nagel for useful additional information and unpublished data from Leiden 1998. Earlier drafts of this review were improved following useful comments by Amy Durban (USA) and Gill Gyte (UK) who were our consumer referees, Professor Martin Whittle who was one of the peer reviewers, and Simon Gates, statistical adviser to the Cochrane Pregnancy and Childbirth Group.
We would like to thank Sara Brigham who extracted data and co‐wrote the first version of this review and Karin Sundberg, who was an author on previous versions of this review.
This project was supported by the National Institute for Health Research, via Cochrane Infrastructure funding to Cochrane Pregnancy and Childbirth. The views and opinions expressed therein are those of the authors and do not necessarily reflect those of the Systematic Reviews Programme, NIHR, NHS or the Department of Health.
Version history
| Published | Title | Stage | Authors | Version |
| 2017 Sep 04 | Amniocentesis and chorionic villus sampling for prenatal diagnosis | Review | Zarko Alfirevic, Kate Navaratnam, Faris Mujezinovic | |
| 2003 Jul 21 | Amniocentesis and chorionic villus sampling for prenatal diagnosis | Review | Zarko Alfirevic, Faris Mujezinovic, Karin Sundberg | |
Differences between protocol and review
Methods updated to the current standard methods text for Cochrane Pregnancy and Childbirth. Searches of ClinicalTrials.gov and the WHO International Clinical Trials Registry Platform (ICTRP) were added.
Five 'Summary of findings' tables were incorporated. Primary and secondary outcomes were specified.
The following outcomes were not pre‐specified in the protocol:
-
Results given in less than 7 days (not pre‐specified)
-
Results given in less than 14 days (not pre‐specified)
-
Results given in less than 21 days (not pre‐specified)
-
Results given after 21 days (not pre‐specified)
-
Not wanting another baby at 22 weeks' gestation (not pre‐specified)
Keywords
MeSH
Medical Subject Headings (MeSH) Keywords
Medical Subject Headings Check Words
Female; Humans; Pregnancy;
PICO

Study flow diagram.
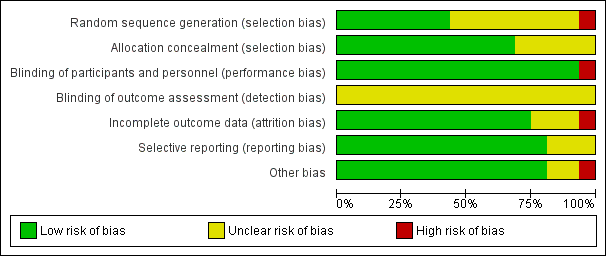
Risk of bias graph: review authors' judgements about each risk of bias domain presented as percentages across all included studies.

Risk of bias summary: review authors' judgements about each risk of bias domain for each included study.

Comparison 1 Second trimester amniocentesis (AC) versus control (no testing), Outcome 1 All known pregnancy loss (including termination of pregnancy).
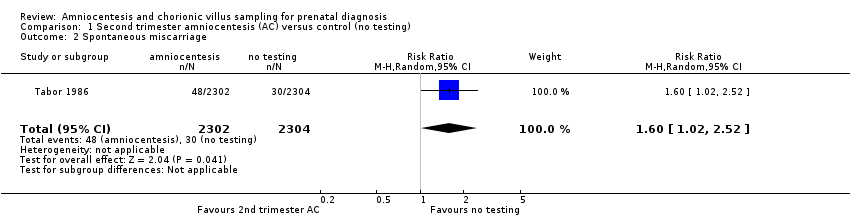
Comparison 1 Second trimester amniocentesis (AC) versus control (no testing), Outcome 2 Spontaneous miscarriage.

Comparison 1 Second trimester amniocentesis (AC) versus control (no testing), Outcome 3 Non‐compliance with allocated procedure.
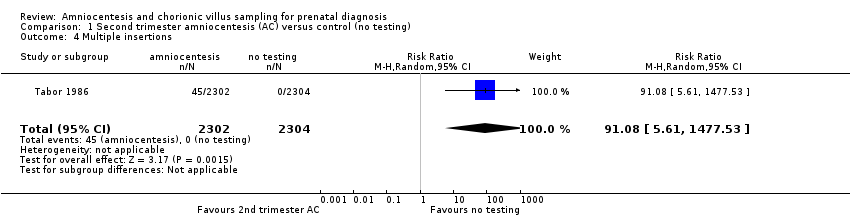
Comparison 1 Second trimester amniocentesis (AC) versus control (no testing), Outcome 4 Multiple insertions.

Comparison 1 Second trimester amniocentesis (AC) versus control (no testing), Outcome 5 Second test performed.

Comparison 1 Second trimester amniocentesis (AC) versus control (no testing), Outcome 6 Laboratory failure.

Comparison 1 Second trimester amniocentesis (AC) versus control (no testing), Outcome 7 All non‐mosaic abnormalities.

Comparison 1 Second trimester amniocentesis (AC) versus control (no testing), Outcome 8 Vaginal bleeding after test.

Comparison 1 Second trimester amniocentesis (AC) versus control (no testing), Outcome 9 Amniotic leakage after test.

Comparison 1 Second trimester amniocentesis (AC) versus control (no testing), Outcome 10 Termination of pregnancy (all).
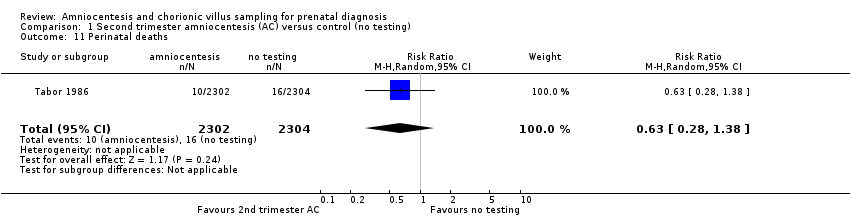
Comparison 1 Second trimester amniocentesis (AC) versus control (no testing), Outcome 11 Perinatal deaths.

Comparison 1 Second trimester amniocentesis (AC) versus control (no testing), Outcome 12 Stillbirths.

Comparison 1 Second trimester amniocentesis (AC) versus control (no testing), Outcome 13 Neonatal deaths.

Comparison 1 Second trimester amniocentesis (AC) versus control (no testing), Outcome 14 All recorded deaths after viability.

Comparison 1 Second trimester amniocentesis (AC) versus control (no testing), Outcome 15 Anomalies (all recorded).
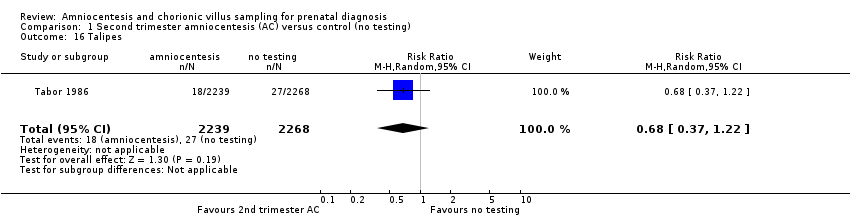
Comparison 1 Second trimester amniocentesis (AC) versus control (no testing), Outcome 16 Talipes.

Comparison 1 Second trimester amniocentesis (AC) versus control (no testing), Outcome 17 Neonatal respiratory distress syndrome.

Comparison 2 Early versus second trimester amniocentesis (AC), Outcome 1 All known pregnancy loss (including termination of pregnancy).

Comparison 2 Early versus second trimester amniocentesis (AC), Outcome 2 Spontaneous miscarriage.

Comparison 2 Early versus second trimester amniocentesis (AC), Outcome 3 Spontaneous miscarriage after test.

Comparison 2 Early versus second trimester amniocentesis (AC), Outcome 4 Non‐compliance with allocated procedure.

Comparison 2 Early versus second trimester amniocentesis (AC), Outcome 5 Sampling failure.

Comparison 2 Early versus second trimester amniocentesis (AC), Outcome 6 Multiple insertions.

Comparison 2 Early versus second trimester amniocentesis (AC), Outcome 7 Second test performed.

Comparison 2 Early versus second trimester amniocentesis (AC), Outcome 8 Laboratory failure.
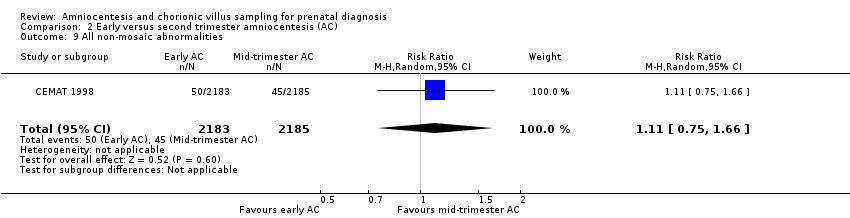
Comparison 2 Early versus second trimester amniocentesis (AC), Outcome 9 All non‐mosaic abnormalities.

Comparison 2 Early versus second trimester amniocentesis (AC), Outcome 10 True mosaics.

Comparison 2 Early versus second trimester amniocentesis (AC), Outcome 11 Maternal contamination.

Comparison 2 Early versus second trimester amniocentesis (AC), Outcome 12 Known false negative after birth.

Comparison 2 Early versus second trimester amniocentesis (AC), Outcome 13 Reporting time.
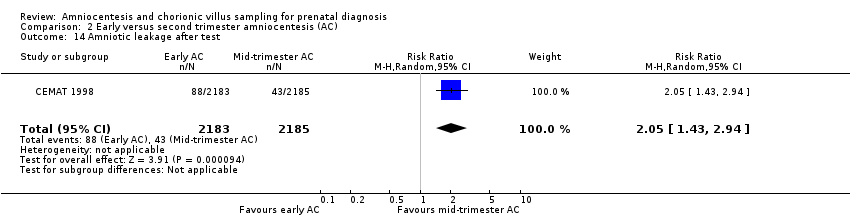
Comparison 2 Early versus second trimester amniocentesis (AC), Outcome 14 Amniotic leakage after test.

Comparison 2 Early versus second trimester amniocentesis (AC), Outcome 15 Termination of pregnancy (all).
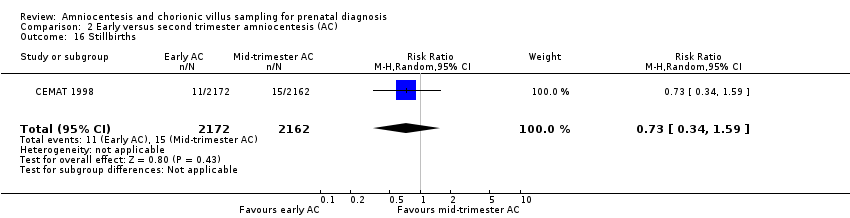
Comparison 2 Early versus second trimester amniocentesis (AC), Outcome 16 Stillbirths.

Comparison 2 Early versus second trimester amniocentesis (AC), Outcome 17 Neonatal deaths.

Comparison 2 Early versus second trimester amniocentesis (AC), Outcome 18 All recorded deaths after viability.

Comparison 2 Early versus second trimester amniocentesis (AC), Outcome 19 Anomalies (all recorded).

Comparison 2 Early versus second trimester amniocentesis (AC), Outcome 20 Talipes.

Comparison 3 Chorionic villus sampling (CVS) versus second trimester amniocentesis (AC), Outcome 1 All known pregnancy loss (including termination of pregnancy).

Comparison 3 Chorionic villus sampling (CVS) versus second trimester amniocentesis (AC), Outcome 2 Spontaneous miscarriage.

Comparison 3 Chorionic villus sampling (CVS) versus second trimester amniocentesis (AC), Outcome 3 Spontaneous miscarriage after test.

Comparison 3 Chorionic villus sampling (CVS) versus second trimester amniocentesis (AC), Outcome 4 Non‐compliance with allocated procedure.

Comparison 3 Chorionic villus sampling (CVS) versus second trimester amniocentesis (AC), Outcome 5 Sampling failure.

Comparison 3 Chorionic villus sampling (CVS) versus second trimester amniocentesis (AC), Outcome 6 Multiple insertions.
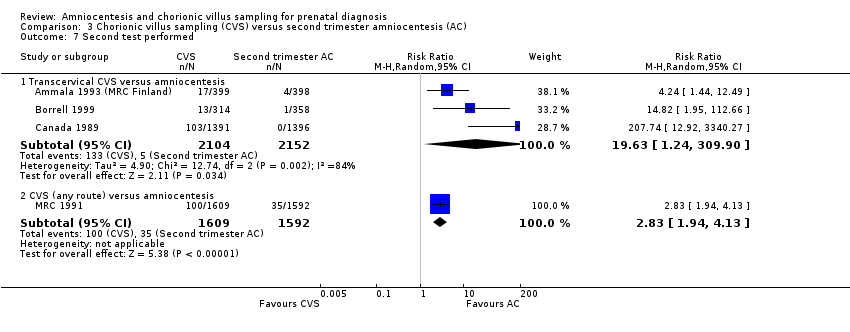
Comparison 3 Chorionic villus sampling (CVS) versus second trimester amniocentesis (AC), Outcome 7 Second test performed.

Comparison 3 Chorionic villus sampling (CVS) versus second trimester amniocentesis (AC), Outcome 8 Laboratory failure.
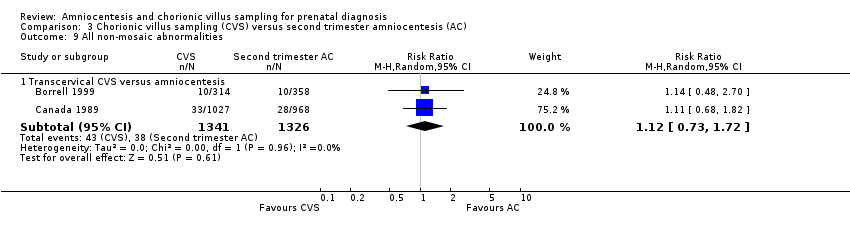
Comparison 3 Chorionic villus sampling (CVS) versus second trimester amniocentesis (AC), Outcome 9 All non‐mosaic abnormalities.

Comparison 3 Chorionic villus sampling (CVS) versus second trimester amniocentesis (AC), Outcome 10 True mosaics.
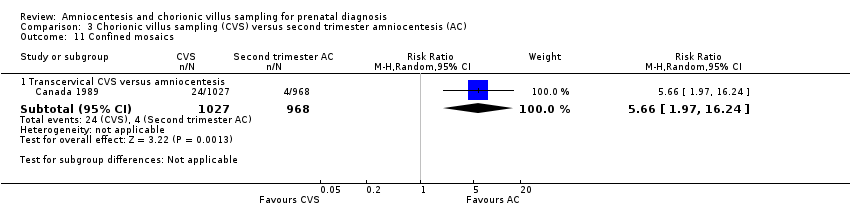
Comparison 3 Chorionic villus sampling (CVS) versus second trimester amniocentesis (AC), Outcome 11 Confined mosaics.

Comparison 3 Chorionic villus sampling (CVS) versus second trimester amniocentesis (AC), Outcome 12 Maternal contamination.
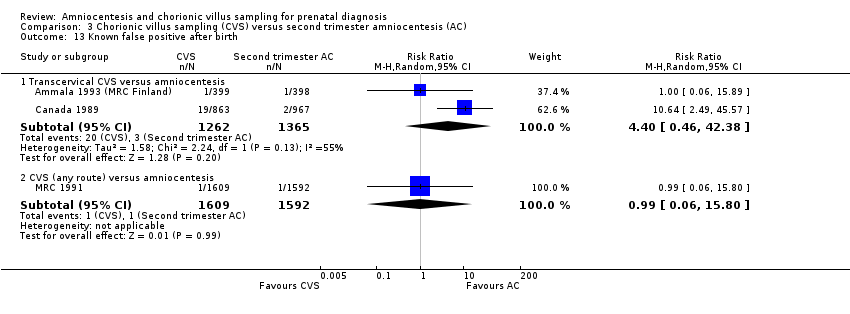
Comparison 3 Chorionic villus sampling (CVS) versus second trimester amniocentesis (AC), Outcome 13 Known false positive after birth.

Comparison 3 Chorionic villus sampling (CVS) versus second trimester amniocentesis (AC), Outcome 14 Known false negative after birth.
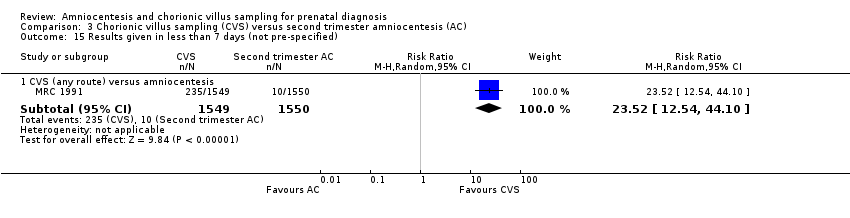
Comparison 3 Chorionic villus sampling (CVS) versus second trimester amniocentesis (AC), Outcome 15 Results given in less than 7 days (not pre‐specified).

Comparison 3 Chorionic villus sampling (CVS) versus second trimester amniocentesis (AC), Outcome 16 Results given in less than 14 days (not pre‐specified).
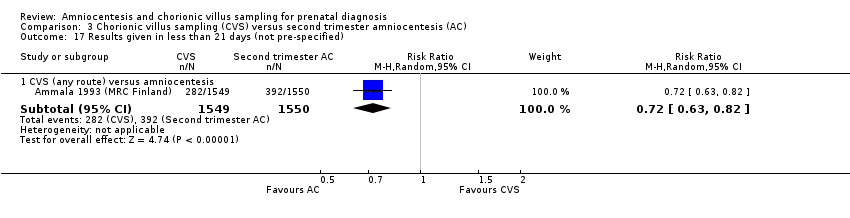
Comparison 3 Chorionic villus sampling (CVS) versus second trimester amniocentesis (AC), Outcome 17 Results given in less than 21 days (not pre‐specified).

Comparison 3 Chorionic villus sampling (CVS) versus second trimester amniocentesis (AC), Outcome 18 Result given after 21 days (not pre‐specified).

Comparison 3 Chorionic villus sampling (CVS) versus second trimester amniocentesis (AC), Outcome 19 Vaginal bleeding after test.
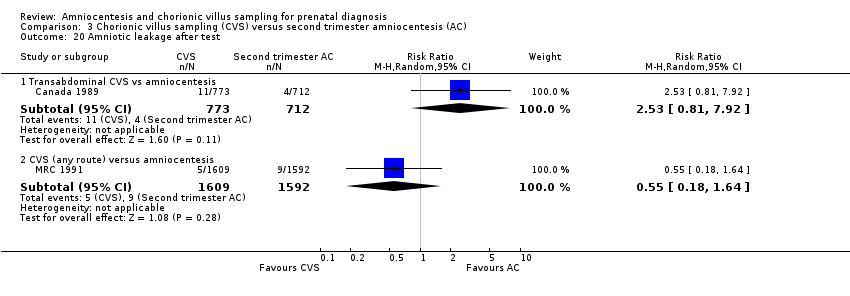
Comparison 3 Chorionic villus sampling (CVS) versus second trimester amniocentesis (AC), Outcome 20 Amniotic leakage after test.

Comparison 3 Chorionic villus sampling (CVS) versus second trimester amniocentesis (AC), Outcome 21 Vaginal bleeding after 20 weeks.
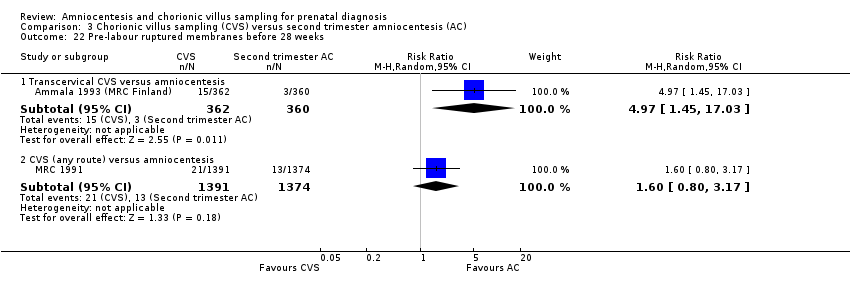
Comparison 3 Chorionic villus sampling (CVS) versus second trimester amniocentesis (AC), Outcome 22 Pre‐labour ruptured membranes before 28 weeks.
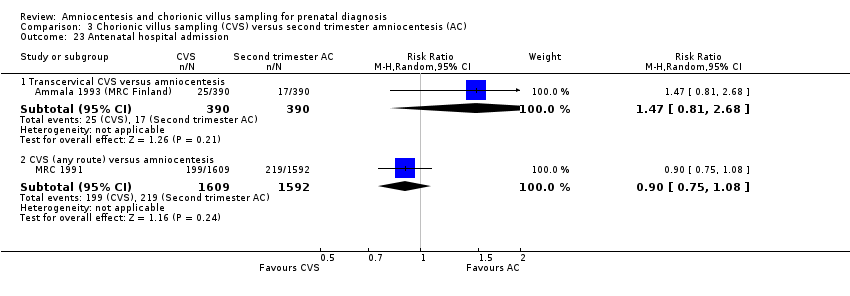
Comparison 3 Chorionic villus sampling (CVS) versus second trimester amniocentesis (AC), Outcome 23 Antenatal hospital admission.
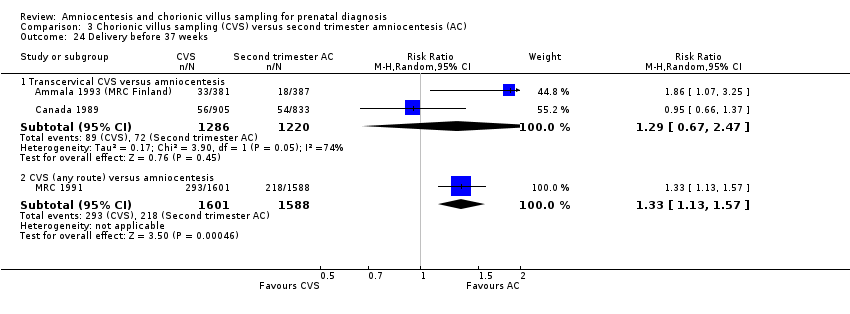
Comparison 3 Chorionic villus sampling (CVS) versus second trimester amniocentesis (AC), Outcome 24 Delivery before 37 weeks.
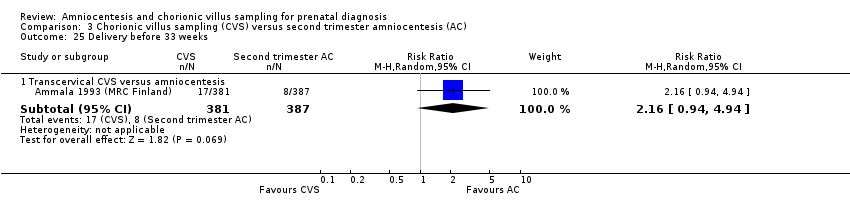
Comparison 3 Chorionic villus sampling (CVS) versus second trimester amniocentesis (AC), Outcome 25 Delivery before 33 weeks.

Comparison 3 Chorionic villus sampling (CVS) versus second trimester amniocentesis (AC), Outcome 26 Termination of pregnancy (all).

Comparison 3 Chorionic villus sampling (CVS) versus second trimester amniocentesis (AC), Outcome 27 Perinatal deaths.

Comparison 3 Chorionic villus sampling (CVS) versus second trimester amniocentesis (AC), Outcome 28 Stillbirths.

Comparison 3 Chorionic villus sampling (CVS) versus second trimester amniocentesis (AC), Outcome 29 Neonatal deaths.

Comparison 3 Chorionic villus sampling (CVS) versus second trimester amniocentesis (AC), Outcome 30 All recorded deaths after viability.

Comparison 3 Chorionic villus sampling (CVS) versus second trimester amniocentesis (AC), Outcome 31 Congenital anomalies (all recorded).
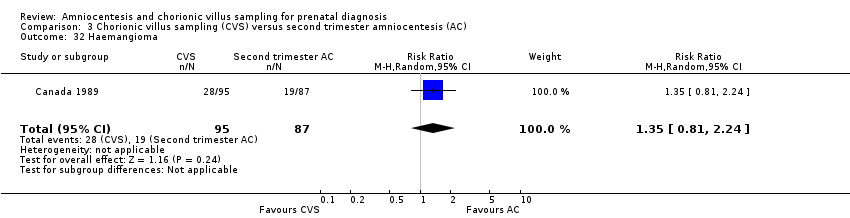
Comparison 3 Chorionic villus sampling (CVS) versus second trimester amniocentesis (AC), Outcome 32 Haemangioma.

Comparison 3 Chorionic villus sampling (CVS) versus second trimester amniocentesis (AC), Outcome 33 Limb reduction defects.
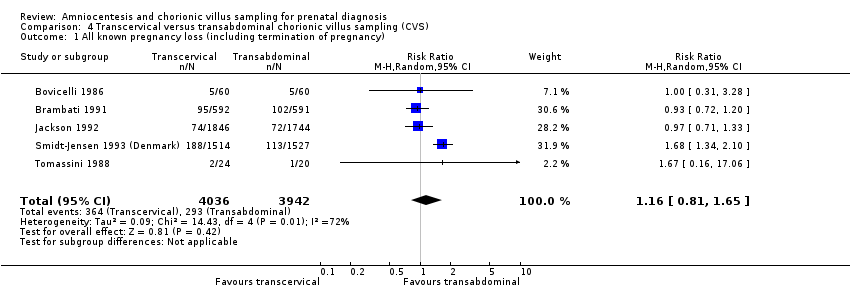
Comparison 4 Transcervical versus transabdominal chorionic villus sampling (CVS), Outcome 1 All known pregnancy loss (including termination of pregnancy).
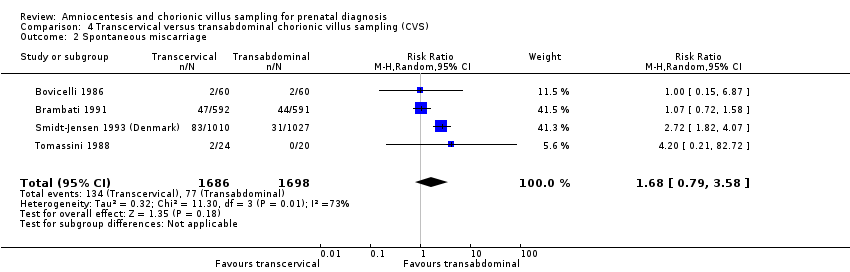
Comparison 4 Transcervical versus transabdominal chorionic villus sampling (CVS), Outcome 2 Spontaneous miscarriage.
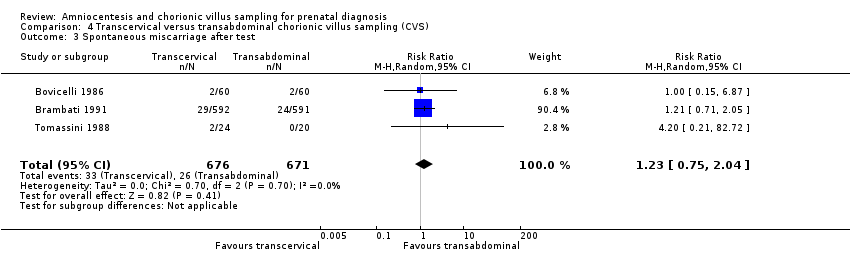
Comparison 4 Transcervical versus transabdominal chorionic villus sampling (CVS), Outcome 3 Spontaneous miscarriage after test.

Comparison 4 Transcervical versus transabdominal chorionic villus sampling (CVS), Outcome 4 Non‐compliance with allocated procedure.

Comparison 4 Transcervical versus transabdominal chorionic villus sampling (CVS), Outcome 5 Sampling failure.

Comparison 4 Transcervical versus transabdominal chorionic villus sampling (CVS), Outcome 6 Multiple insertions.

Comparison 4 Transcervical versus transabdominal chorionic villus sampling (CVS), Outcome 7 Second test performed.

Comparison 4 Transcervical versus transabdominal chorionic villus sampling (CVS), Outcome 8 Laboratory failure.

Comparison 4 Transcervical versus transabdominal chorionic villus sampling (CVS), Outcome 9 All non‐mosaic abnormalities.

Comparison 4 Transcervical versus transabdominal chorionic villus sampling (CVS), Outcome 10 True mosaics.

Comparison 4 Transcervical versus transabdominal chorionic villus sampling (CVS), Outcome 11 Confined mosaics.

Comparison 4 Transcervical versus transabdominal chorionic villus sampling (CVS), Outcome 12 Amniotic leakage after test.

Comparison 4 Transcervical versus transabdominal chorionic villus sampling (CVS), Outcome 13 Vaginal bleeding after test.

Comparison 4 Transcervical versus transabdominal chorionic villus sampling (CVS), Outcome 14 Termination of pregnancy (all).

Comparison 4 Transcervical versus transabdominal chorionic villus sampling (CVS), Outcome 15 Perinatal deaths.

Comparison 4 Transcervical versus transabdominal chorionic villus sampling (CVS), Outcome 16 Stillbirths.
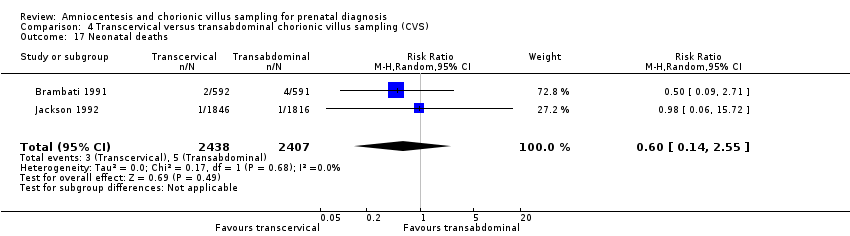
Comparison 4 Transcervical versus transabdominal chorionic villus sampling (CVS), Outcome 17 Neonatal deaths.

Comparison 4 Transcervical versus transabdominal chorionic villus sampling (CVS), Outcome 18 Anomalies (all recorded).

Comparison 4 Transcervical versus transabdominal chorionic villus sampling (CVS), Outcome 19 Talipes.
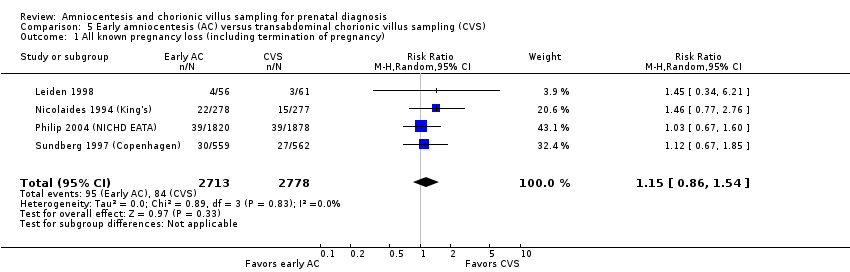
Comparison 5 Early amniocentesis (AC) versus transabdominal chorionic villus sampling (CVS), Outcome 1 All known pregnancy loss (including termination of pregnancy).

Comparison 5 Early amniocentesis (AC) versus transabdominal chorionic villus sampling (CVS), Outcome 2 Spontaneous miscarriage.

Comparison 5 Early amniocentesis (AC) versus transabdominal chorionic villus sampling (CVS), Outcome 3 Spontaneous miscarriage after test.

Comparison 5 Early amniocentesis (AC) versus transabdominal chorionic villus sampling (CVS), Outcome 4 Non‐compliance with allocated procedure.

Comparison 5 Early amniocentesis (AC) versus transabdominal chorionic villus sampling (CVS), Outcome 5 Sampling failure.
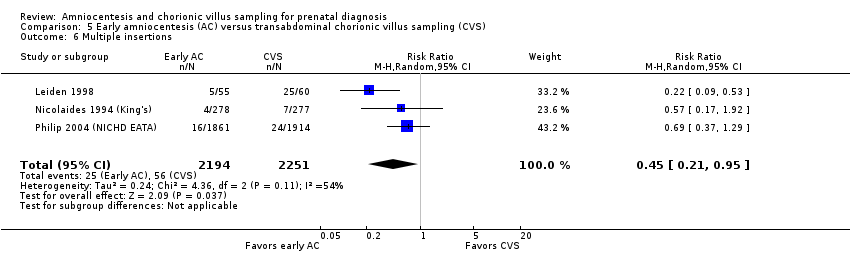
Comparison 5 Early amniocentesis (AC) versus transabdominal chorionic villus sampling (CVS), Outcome 6 Multiple insertions.
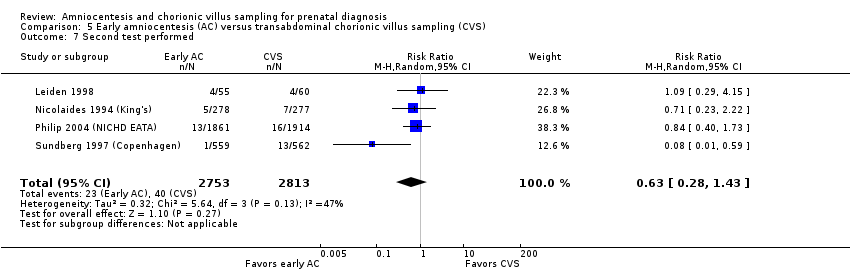
Comparison 5 Early amniocentesis (AC) versus transabdominal chorionic villus sampling (CVS), Outcome 7 Second test performed.

Comparison 5 Early amniocentesis (AC) versus transabdominal chorionic villus sampling (CVS), Outcome 8 Laboratory failure.

Comparison 5 Early amniocentesis (AC) versus transabdominal chorionic villus sampling (CVS), Outcome 9 All non‐mosaic abnormalities.

Comparison 5 Early amniocentesis (AC) versus transabdominal chorionic villus sampling (CVS), Outcome 10 True mosaics.
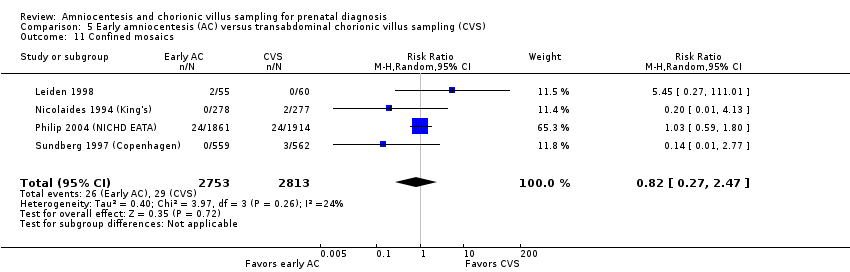
Comparison 5 Early amniocentesis (AC) versus transabdominal chorionic villus sampling (CVS), Outcome 11 Confined mosaics.

Comparison 5 Early amniocentesis (AC) versus transabdominal chorionic villus sampling (CVS), Outcome 12 Maternal contamination.
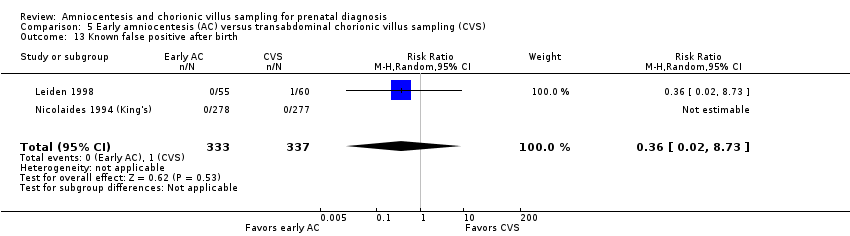
Comparison 5 Early amniocentesis (AC) versus transabdominal chorionic villus sampling (CVS), Outcome 13 Known false positive after birth.

Comparison 5 Early amniocentesis (AC) versus transabdominal chorionic villus sampling (CVS), Outcome 14 Knonw false negative after birth.
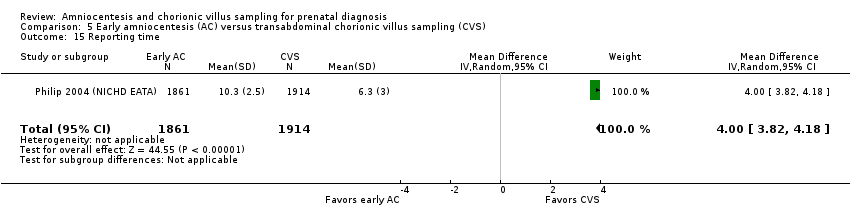
Comparison 5 Early amniocentesis (AC) versus transabdominal chorionic villus sampling (CVS), Outcome 15 Reporting time.

Comparison 5 Early amniocentesis (AC) versus transabdominal chorionic villus sampling (CVS), Outcome 16 Vaginal bleeding after 20 weeks.

Comparison 5 Early amniocentesis (AC) versus transabdominal chorionic villus sampling (CVS), Outcome 17 Amniotic leakage after test.
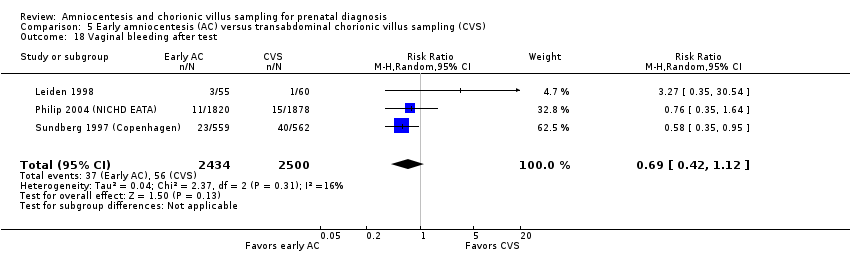
Comparison 5 Early amniocentesis (AC) versus transabdominal chorionic villus sampling (CVS), Outcome 18 Vaginal bleeding after test.

Comparison 5 Early amniocentesis (AC) versus transabdominal chorionic villus sampling (CVS), Outcome 19 Pre‐labour ruptured membranes before 28 weeks.

Comparison 5 Early amniocentesis (AC) versus transabdominal chorionic villus sampling (CVS), Outcome 20 Delivery before 37 weeks.

Comparison 5 Early amniocentesis (AC) versus transabdominal chorionic villus sampling (CVS), Outcome 21 Delivery before 33 weeks.

Comparison 5 Early amniocentesis (AC) versus transabdominal chorionic villus sampling (CVS), Outcome 22 Termination of pregnancy (all).

Comparison 5 Early amniocentesis (AC) versus transabdominal chorionic villus sampling (CVS), Outcome 23 Perinatal deaths.
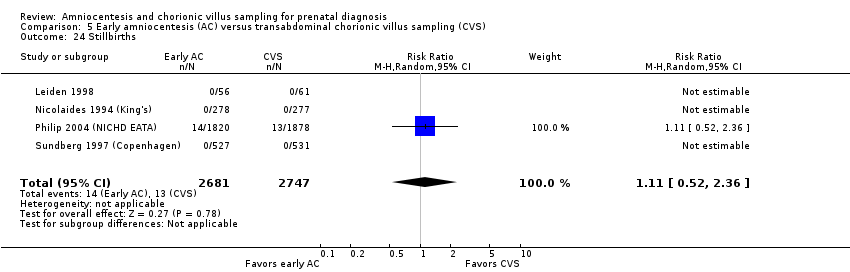
Comparison 5 Early amniocentesis (AC) versus transabdominal chorionic villus sampling (CVS), Outcome 24 Stillbirths.

Comparison 5 Early amniocentesis (AC) versus transabdominal chorionic villus sampling (CVS), Outcome 25 Neonatal deaths.

Comparison 5 Early amniocentesis (AC) versus transabdominal chorionic villus sampling (CVS), Outcome 26 All recorded deaths after viability.
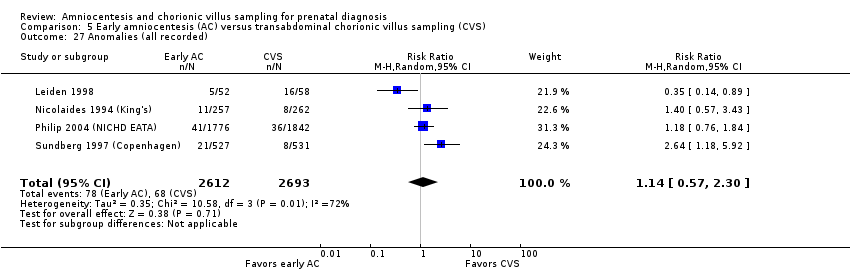
Comparison 5 Early amniocentesis (AC) versus transabdominal chorionic villus sampling (CVS), Outcome 27 Anomalies (all recorded).
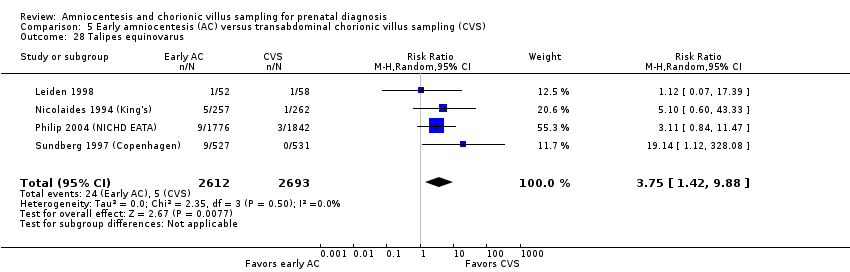
Comparison 5 Early amniocentesis (AC) versus transabdominal chorionic villus sampling (CVS), Outcome 28 Talipes equinovarus.

Comparison 5 Early amniocentesis (AC) versus transabdominal chorionic villus sampling (CVS), Outcome 29 Haemangioma.

Comparison 5 Early amniocentesis (AC) versus transabdominal chorionic villus sampling (CVS), Outcome 30 Neonatal respiratory distress syndrome.
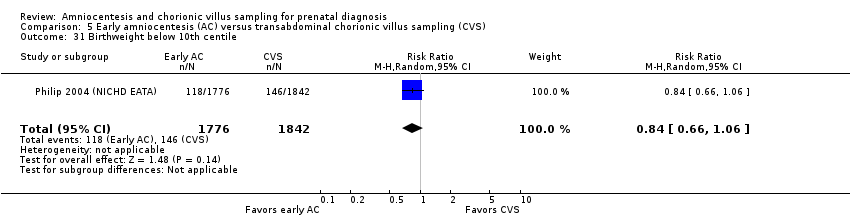
Comparison 5 Early amniocentesis (AC) versus transabdominal chorionic villus sampling (CVS), Outcome 31 Birthweight below 10th centile.

Comparison 5 Early amniocentesis (AC) versus transabdominal chorionic villus sampling (CVS), Outcome 32 Birthweight below 5th centile.

Comparison 6 Ultrasound versus no ultrasound before second trimester amniocentesis, Outcome 1 All known pregnancy loss (including termination of pregnancy).

Comparison 6 Ultrasound versus no ultrasound before second trimester amniocentesis, Outcome 2 Spontaneous miscarriage.

Comparison 6 Ultrasound versus no ultrasound before second trimester amniocentesis, Outcome 3 Spontaneous miscarriage after test.

Comparison 6 Ultrasound versus no ultrasound before second trimester amniocentesis, Outcome 4 Sampling failure.
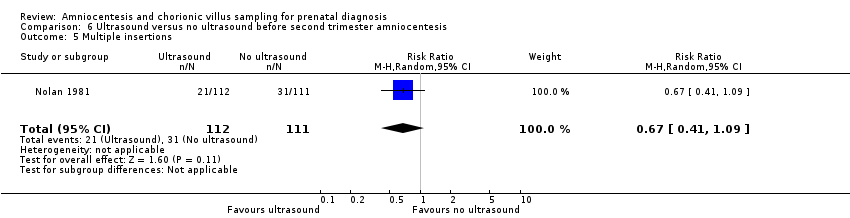
Comparison 6 Ultrasound versus no ultrasound before second trimester amniocentesis, Outcome 5 Multiple insertions.
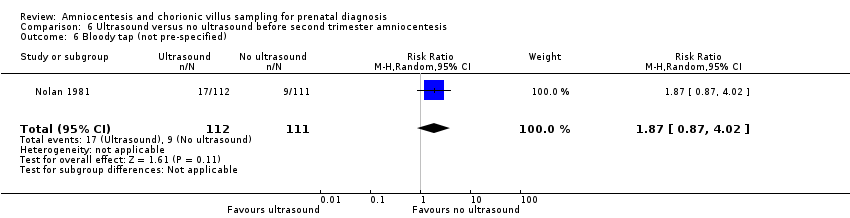
Comparison 6 Ultrasound versus no ultrasound before second trimester amniocentesis, Outcome 6 Bloody tap (not pre‐specified).
| Second trimester amniocentesis compared to control for prenatal diagnosis | ||||||
| Patient or population: prenatal diagnosis | ||||||
| Outcomes | Anticipated absolute effects* (95% CI) | Relative effect | № of participants | Quality of the evidence | Comments | |
| Risk with control | Risk with second trimester amniocentesis (AC) | |||||
| All known pregnancy loss (including termination of pregnancy) | Study population | RR 1.41 | 4606 | ⊕⊕⊕⊝ MODERATE1 | ||
| 23 per 1000 | 32 per 1000 | |||||
| Spontaneous miscarriage | Study population | RR 1.60 | 4606 | ⊕⊕⊕⊕ | ||
| 13 per 1000 | 21 per 1000 | |||||
| Sampling failure | ‐ | ‐ | ‐ | ‐ | ‐ | No trial reported this outcome |
| Laboratory failure | Study population | RR 27.02 | 4606 | ⊕⊕⊕⊕ | There were no events in the control group and only 13 in the AC group, so it was not possible to calculate the anticipated absolute effect. | |
| 0 per 1000 | 0 per 1000 | |||||
| Known false negative after birth | ‐ | ‐ | ‐ | ‐ | ‐ | No trial reported this outcome |
| Delivery before 33 weeks | ‐ | ‐ | ‐ | ‐ | ‐ | No trial reported this outcome |
| Anomalies (all recorded) | Study population | RR 0.93 | 4507 | ⊕⊕⊕⊝ | ||
| 22 per 1000 | 20 per 1000 | |||||
| *The risk in the intervention group (and its 95% confidence interval) is based on the assumed risk in the comparison group and the relative effect of the intervention (and its 95% CI). | ||||||
| GRADE Working Group grades of evidence | ||||||
| 1 Wide confidence intervals crossing the line of no effect (‐1) | ||||||
| Early compared to second trimester amniocentesis for prenatal diagnosis | ||||||
| Patient or population: prenatal diagnosis | ||||||
| Outcomes | Anticipated absolute effects* (95% CI) | Relative effect | № of participants | Quality of the evidence | Comments | |
| Risk with second trimester amniocentesis (AC) | Risk with early AC | |||||
| All known pregnancy loss (including termination of pregnancy) | Study population | RR 1.29 | 4334 | ⊕⊕⊕⊕ | ||
| 59 per 1000 | 76 per 1000 | |||||
| Spontaneous miscarriage | Study population | RR 1.41 | 4334 | ⊕⊕⊕⊝ | ||
| 25 per 1000 | 36 per 1000 | |||||
| Sampling failure | Study population | RR 4.53 | 629 | ⊕⊕⊕⊝ | ||
| 3 per 1000 | 15 per 1000 | |||||
| Laboratory failure | Study population | RR 9.76 | 4368 | ⊕⊕⊕⊕ | ||
| 2 per 1000 | 18 per 1000 | |||||
| Known false negative after birth | Study population | RR 3.00 | 4368 | ⊕⊕⊕⊝ | There were no events in the 2nd trimester AC group and only one in the early AC group, so it was not possible to calculate the anticipated absolute effect | |
| 0 per 1000 | 0 per 1000 | |||||
| Known false negative after birth ‐ Incorrect sex determination | Study population | RR 5.00 | 4368 | ⊕⊕⊕⊝ | There were no events in the 2nd trimester AC group and only 2 in the early AC group, so it was not possible to calculate the anticipated absolute effect. | |
| 0 per 1000 | 0 per 1000 | |||||
| Delivery before 33 weeks | ‐ | ‐ | ‐ | ‐ | No trial reported this outcome | |
| Anomalies (all recorded) | Study population | RR 1.73 | 4334 | ⊕⊕⊕⊕ | ||
| 27 per 1000 | 46 per 1000 | |||||
| *The risk in the intervention group (and its 95% confidence interval) is based on the assumed risk in the comparison group and the relative effect of the intervention (and its 95% CI). | ||||||
| GRADE Working Group grades of evidence | ||||||
| 1 One study, contributing 100% data, had unclear allocation concealment for one trial site, and satisfactory concealment for the other trial site (not downgraded) 2 Wide 95% confidence interval, crossing the line of no effect (‐1) | ||||||
| Chorionic villus sampling compared to second trimester amniocentesis for prenatal diagnosis | ||||||
| Patient or population: prenatal diagnosis | ||||||
| Outcomes | Anticipated absolute effects* (95% CI) | Relative effect | № of participants | Quality of the evidence | Comments | |
| Risk with second trimester amniocentesis | Risk with chorionic villus sampling | |||||
| All known pregnancy loss (including termination of pregnancy) | Study population | RR 0.90 | 2234 | ⊕⊕⊝⊝ | ||
| 70 per 1000 | 63 per 1000 | |||||
| Spontaneous miscarriage | Study population | RR 0.77 | 2069 | ⊕⊕⊝⊝ | ||
| 39 per 1000 | 30 per 1000 | |||||
| Sampling failure | ‐ | ‐ | ‐ | ‐ | ‐ | No trial reported this outcome |
| Laboratory failure | ‐ | ‐ | ‐ | ‐ | ‐ | No trial reported this outcome |
| Known false negative after birth | ‐ | ‐ | ‐ | ‐ | ‐ | No trial reported this outcome |
| Delivery before 33 weeks | ‐ | ‐ | ‐ | ‐ | ‐ | No trial reported this outcome |
| Perinatal deaths (stillbirths and neonatal deaths in the first week of life) | Study population | RR 1.18 | 2069 | ⊕⊕⊝⊝ | ||
| 6 per 1000 | 7 per 1000 | |||||
| *The risk in the intervention group (and its 95% confidence interval) is based on the assumed risk in the comparison group and the relative effect of the intervention (and its 95% CI). | ||||||
| GRADE Working Group grades of evidence | ||||||
| 1 Wide 95% confidence intervals that cross the line of no effect (‐1) 2 One study, contributing 100% data, with unclear method of randomisation (‐1) | ||||||
| Transcervical compared to transabdominal chorionic villus samplingfor prenatal diagnosis | ||||||
| Patient or population: prenatal diagnosis | ||||||
| Outcomes | Anticipated absolute effects* (95% CI) | Relative effect | № of participants | Quality of the evidence | Comments | |
| Risk with transabdominal chorionic villus sampling | Risk with transcervical chorionic villus sampling | |||||
| All known pregnancy loss (including termination of pregnancy) | Study population | RR 1.16 | 7978 | ⊕⊝⊝⊝ | ||
| 74 per 1000 | 86 per 1000 | |||||
| Spontaneous miscarriage | Study population | RR 1.68 | 3384 | ⊕⊝⊝⊝ | ||
| 45 per 1000 | 76 per 1000 | |||||
| Sampling failure | Study population | RR 1.79 | 5231 | ⊕⊕⊕⊝ | ||
| 11 per 1000 | 20 per 1000 | |||||
| Laboratory failure | Study population | RR 2.23 | 1194 | ⊕⊕⊝⊝ | ||
| 7 per 1000 | 15 per 1000 | |||||
| Known false negative after birth | ‐ | ‐ | ‐ | ‐ | ‐ | No trial reported this outcome |
| Delivery before 33 weeks | ‐ | ‐ | ‐ | ‐ | ‐ | No trial reported this outcome |
| Anomalies (all recorded) | Study population | RR 0.68 | 3622 | ⊕⊕⊝⊝ | ||
| 20 per 1000 | 14 per 1000 | |||||
| *The risk in the intervention group (and its 95% confidence interval) is based on the assumed risk in the comparison group and the relative effect of the intervention (and its 95% CI). | ||||||
| GRADE Working Group grades of evidence | ||||||
| 1 Wide 95% confidence intervals crossing the line of no effect (‐1) 2 Statistical heterogeneity I² > 60% 3 Four of five contributing studies did not specify randomisation method. All studies had design limitations. In one study, the proportion of cases where the operator deviated from the allocated procedure increased during the study (‐1) 4 Three of four studies, contributing > 95% weight, did not specify randomisation method. All studies had design limitations. In one study, the proportion of cases where the operator deviated from the allocated procedure increased during the study (‐1). 5 One study contributing data had design limitations ‐ the proportion of cases where the operator deviated from the allocated procedure increased during the study (‐1). 6 One of two contributing studies did not specify randomisation method. All studies had design limitations. In one study, the proportion of cases where the operator deviated from the allocated procedure increased during the study (‐1). | ||||||
| Early amniocentesis compared to transabdominal chorionic villus samplingfor prenatal diagnosis | ||||||
| Patient or population: prenatal diagnosis | ||||||
| Outcomes | Anticipated absolute effects* (95% CI) | Relative effect | № of participants | Quality of the evidence | Comments | |
| Risk with transabdominal chorionic villus sampling | Risk with early amniocentesis | |||||
| All known pregnancy loss (including termination of pregnancy) | Study population | RR 1.15 | 5491 | ⊕⊕⊝⊝ | ||
| 30 per 1000 | 35 per 1000 | |||||
| Spontaneous miscarriage | Study population | RR 1.73 | 5491 | ⊕⊕⊕⊝ | ||
| 13 per 1000 | 23 per 1000 | |||||
| Sampling failure | Study population | RR 0.58 (0.24 to 1.38) | 5566 | ⊕⊕⊝⊝ | ||
| 8 per 1000 | 5 per 1000 | |||||
| Laboratory failure | Study population | RR 0.74 (0.34 to 1.63) | 5566 | ⊕⊕⊝⊝ | ||
| 6 per 1000 | 4 per 1000 | |||||
| Known false negative after birth | Study population | Not estimable | 555 | ⊕⊕⊝⊝ | ||
| 0 per 1000 | 0 per 1000 | |||||
| Delivery before 33 weeks | Study population | RR 0.50 | 1121 | ⊕⊕⊝⊝ | ||
| 7 per 1000 | 4 per 1000 | |||||
| Anomalies (all recorded) | Study population | RR 1.14 | 5305 | ⊕⊝⊝⊝ | ||
| 25 per 1000 | 29 per 1000 | |||||
| *The risk in the intervention group (and its 95% confidence interval) is based on the assumed risk in the comparison group and the relative effect of the intervention (and its 95% CI). | ||||||
| GRADE Working Group grades of evidence | ||||||
| 1 Three of four studies, contributing > 50% weight of analysis, did not specify randomisation method (‐1). 2 Wide 95% confidence intervals crossing the line of no effect (‐1) 3 Randomisation method not specified (‐1) 4 One study with 555 women and no events therefore not possible to estimate risk (‐1) 5 Statistical heterogeneity I²>60% (‐1) | ||||||
| Systematic review (by first author) | Single or multiple pregnancies | Pregnancy loss rates reported % (95% CI) | Pooled procedure‐related pregnancy losses % (95% CI) |
| Twins | Total 3.84% (2.48 to 5.47) < 20 weeks 2.75% (1.28 to 4.75) < 28 weeks 3.44% (1.67 to 5.81) | ‐ | |
| Singletons | < 24 weeks 2.18% (1.61 to 2.82) | 0.22% (‐0.71 to 1.16) | |
| Singletons | Total 2.0% (1.0 to 1.7) < 24 weeks 1.3% (0.5 to 2.3) | < 14 days 0.7% (0.3 to 1.4) |
| Systematic review (by first author) | Single or multiple pregnancies | Pregnancy loss rates reported % (95% CI) | Pooled procedure‐related pregnancy losses % (95% CI) |
| Twins | Total 3.07% (1.83 to 4.61) < 20 weeks 2.25% (1.23 to 3.57) < 24 weeks 2.54% (1.43 to 3.96) < 28 weeks 1.70% (0.37 to 3.97) | ‐ | |
| Singletons | < 24 weeks 0.81% (0.58 to 1.08) | 0.11% (‐0.04 to 0.26) | |
| Singletons | Total 1.9% (1.4 to 2.5) < 24 weeks 0.9% (0.60 to 1.30) | < 14 days 0.6 (0.5‐0.7) | |
| Twins | Monochorionic 7.7% vs 1.4% (amniocentesis vs control) | < 24 weeks 3.5% (2.6 to 4.7) |
| Outcome or subgroup title | No. of studies | No. of participants | Statistical method | Effect size |
| 1 All known pregnancy loss (including termination of pregnancy) Show forest plot | 1 | 4606 | Risk Ratio (M‐H, Random, 95% CI) | 1.41 [0.99, 2.00] |
| 2 Spontaneous miscarriage Show forest plot | 1 | 4606 | Risk Ratio (M‐H, Random, 95% CI) | 1.60 [1.02, 2.52] |
| 3 Non‐compliance with allocated procedure Show forest plot | 1 | 4606 | Risk Ratio (M‐H, Random, 95% CI) | 1.73 [1.03, 2.91] |
| 4 Multiple insertions Show forest plot | 1 | 4606 | Risk Ratio (M‐H, Random, 95% CI) | 91.08 [5.61, 1477.53] |
| 5 Second test performed Show forest plot | 1 | 4606 | Risk Ratio (M‐H, Random, 95% CI) | 41.04 [2.48, 678.07] |
| 6 Laboratory failure Show forest plot | 1 | 4606 | Risk Ratio (M‐H, Random, 95% CI) | 27.02 [1.61, 454.31] |
| 7 All non‐mosaic abnormalities Show forest plot | 1 | 4593 | Risk Ratio (M‐H, Random, 95% CI) | 30.85 [1.85, 515.31] |
| 8 Vaginal bleeding after test Show forest plot | 1 | 4606 | Risk Ratio (M‐H, Random, 95% CI) | 0.95 [0.66, 1.37] |
| 9 Amniotic leakage after test Show forest plot | 1 | 4606 | Risk Ratio (M‐H, Random, 95% CI) | 3.90 [1.95, 7.80] |
| 10 Termination of pregnancy (all) Show forest plot | 1 | 4606 | Risk Ratio (M‐H, Random, 95% CI) | 2.50 [0.97, 6.44] |
| 11 Perinatal deaths Show forest plot | 1 | 4606 | Risk Ratio (M‐H, Random, 95% CI) | 0.63 [0.28, 1.38] |
| 12 Stillbirths Show forest plot | 1 | 4606 | Risk Ratio (M‐H, Random, 95% CI) | 0.83 [0.36, 1.93] |
| 13 Neonatal deaths Show forest plot | 1 | 4606 | Risk Ratio (M‐H, Random, 95% CI) | 0.11 [0.01, 2.06] |
| 14 All recorded deaths after viability Show forest plot | 1 | 4606 | Risk Ratio (M‐H, Random, 95% CI) | 0.63 [0.28, 1.38] |
| 15 Anomalies (all recorded) Show forest plot | 1 | 4507 | Risk Ratio (M‐H, Random, 95% CI) | 0.93 [0.62, 1.39] |
| 16 Talipes Show forest plot | 1 | 4507 | Risk Ratio (M‐H, Random, 95% CI) | 0.68 [0.37, 1.22] |
| 17 Neonatal respiratory distress syndrome Show forest plot | 1 | 4507 | Risk Ratio (M‐H, Random, 95% CI) | 2.11 [1.06, 4.19] |
| Outcome or subgroup title | No. of studies | No. of participants | Statistical method | Effect size |
| 1 All known pregnancy loss (including termination of pregnancy) Show forest plot | 1 | 4334 | Risk Ratio (M‐H, Random, 95% CI) | 1.29 [1.03, 1.61] |
| 2 Spontaneous miscarriage Show forest plot | 1 | 4334 | Risk Ratio (M‐H, Random, 95% CI) | 1.41 [1.00, 1.98] |
| 3 Spontaneous miscarriage after test Show forest plot | 1 | 4334 | Risk Ratio (M‐H, Random, 95% CI) | 3.22 [1.88, 5.53] |
| 4 Non‐compliance with allocated procedure Show forest plot | 1 | 4368 | Risk Ratio (M‐H, Random, 95% CI) | 0.65 [0.57, 0.75] |
| 5 Sampling failure Show forest plot | 1 | 629 | Risk Ratio (M‐H, Random, 95% CI) | 4.53 [0.53, 38.56] |
| 6 Multiple insertions Show forest plot | 1 | 4368 | Risk Ratio (M‐H, Random, 95% CI) | 2.79 [1.92, 4.04] |
| 7 Second test performed Show forest plot | 1 | 4107 | Risk Ratio (M‐H, Random, 95% CI) | 8.72 [3.47, 21.91] |
| 8 Laboratory failure Show forest plot | 1 | 4368 | Risk Ratio (M‐H, Random, 95% CI) | 9.76 [3.49, 27.26] |
| 9 All non‐mosaic abnormalities Show forest plot | 1 | 4368 | Risk Ratio (M‐H, Random, 95% CI) | 1.11 [0.75, 1.66] |
| 10 True mosaics Show forest plot | 1 | 4368 | Risk Ratio (M‐H, Random, 95% CI) | 1.00 [0.25, 4.00] |
| 11 Maternal contamination Show forest plot | 1 | 4368 | Risk Ratio (M‐H, Random, 95% CI) | 2.00 [0.37, 10.92] |
| 12 Known false negative after birth Show forest plot | 1 | Risk Ratio (M‐H, Random, 95% CI) | Subtotals only | |
| 12.1 False negative chromosomal results (excluding sex determination) | 1 | 4368 | Risk Ratio (M‐H, Random, 95% CI) | 3.00 [0.12, 73.67] |
| 12.2 Incorrect sex determination | 1 | 4368 | Risk Ratio (M‐H, Random, 95% CI) | 5.00 [0.24, 104.18] |
| 13 Reporting time Show forest plot | 1 | 4107 | Mean Difference (IV, Random, 95% CI) | 1.20 [0.89, 1.51] |
| 14 Amniotic leakage after test Show forest plot | 1 | 4368 | Risk Ratio (M‐H, Random, 95% CI) | 2.05 [1.43, 2.94] |
| 15 Termination of pregnancy (all) Show forest plot | 1 | 4334 | Risk Ratio (M‐H, Random, 95% CI) | 1.26 [0.89, 1.77] |
| 16 Stillbirths Show forest plot | 1 | 4334 | Risk Ratio (M‐H, Random, 95% CI) | 0.73 [0.34, 1.59] |
| 17 Neonatal deaths Show forest plot | 1 | 4334 | Risk Ratio (M‐H, Random, 95% CI) | 4.98 [0.58, 42.56] |
| 18 All recorded deaths after viability Show forest plot | 1 | 4334 | Risk Ratio (M‐H, Random, 95% CI) | 1.00 [0.50, 1.99] |
| 19 Anomalies (all recorded) Show forest plot | 1 | 4334 | Risk Ratio (M‐H, Random, 95% CI) | 1.73 [1.26, 2.38] |
| 20 Talipes Show forest plot | 1 | Risk Ratio (M‐H, Random, 95% CI) | Subtotals only | |
| 20.1 Talipes equinovarus | 1 | 4334 | Risk Ratio (M‐H, Random, 95% CI) | 14.43 [3.45, 60.41] |
| Outcome or subgroup title | No. of studies | No. of participants | Statistical method | Effect size |
| 1 All known pregnancy loss (including termination of pregnancy) Show forest plot | 5 | Risk Ratio (M‐H, Random, 95% CI) | Subtotals only | |
| 1.1 Transcervical CVS versus amniocentesis | 4 | 6527 | Risk Ratio (M‐H, Random, 95% CI) | 1.40 [1.09, 1.81] |
| 1.2 Transabdominal CVS versus amniocentesis | 1 | 2234 | Risk Ratio (M‐H, Random, 95% CI) | 0.90 [0.66, 1.23] |
| 1.3 CVS (any route) versus amniocentesis | 2 | 6503 | Risk Ratio (M‐H, Random, 95% CI) | 1.43 [1.22, 1.67] |
| 2 Spontaneous miscarriage Show forest plot | 4 | Risk Ratio (M‐H, Random, 95% CI) | Subtotals only | |
| 2.1 Transcervical CVS versus amniocentesis | 3 | 5506 | Risk Ratio (M‐H, Random, 95% CI) | 1.50 [1.07, 2.11] |
| 2.2 Transabdominal CVS versus amniocentesis | 1 | 2069 | Risk Ratio (M‐H, Random, 95% CI) | 0.77 [0.49, 1.21] |
| 2.3 CVS (any route) versus amniocentesis | 2 | 6280 | Risk Ratio (M‐H, Random, 95% CI) | 1.51 [1.23, 1.85] |
| 3 Spontaneous miscarriage after test Show forest plot | 3 | Risk Ratio (M‐H, Random, 95% CI) | Subtotals only | |
| 3.1 Transcervical CVS versus amniocentesis | 2 | 1579 | Risk Ratio (M‐H, Random, 95% CI) | 1.77 [0.28, 11.00] |
| 3.2 CVS (any route) versus amniocentesis | 1 | 3201 | Risk Ratio (M‐H, Random, 95% CI) | 3.46 [2.21, 5.42] |
| 4 Non‐compliance with allocated procedure Show forest plot | 4 | Risk Ratio (M‐H, Random, 95% CI) | Subtotals only | |
| 4.1 Transcervical CVS versus amniocentesis | 3 | 4595 | Risk Ratio (M‐H, Random, 95% CI) | 0.51 [0.14, 1.87] |
| 4.2 CVS (any route) versus amniocentesis | 1 | 3197 | Risk Ratio (M‐H, Random, 95% CI) | 0.66 [0.52, 0.83] |
| 5 Sampling failure Show forest plot | 2 | Risk Ratio (M‐H, Random, 95% CI) | Subtotals only | |
| 5.1 Transervical CVS versus amniocentesis | 1 | 797 | Risk Ratio (M‐H, Random, 95% CI) | 0.55 [0.26, 1.19] |
| 5.2 CVS (any route) versus amniocentesis | 1 | 3201 | Risk Ratio (M‐H, Random, 95% CI) | 3.09 [1.98, 4.82] |
| 6 Multiple insertions Show forest plot | 2 | Risk Ratio (M‐H, Random, 95% CI) | Subtotals only | |
| 6.1 Transcervical CVS versus amniocentesis | 1 | 794 | Risk Ratio (M‐H, Random, 95% CI) | 3.93 [2.72, 5.68] |
| 6.2 CVS (any route) versus amniocentesis | 1 | 2917 | Risk Ratio (M‐H, Random, 95% CI) | 4.85 [3.92, 6.01] |
| 7 Second test performed Show forest plot | 4 | Risk Ratio (M‐H, Random, 95% CI) | Subtotals only | |
| 7.1 Transcervical CVS versus amniocentesis | 3 | 4256 | Risk Ratio (M‐H, Random, 95% CI) | 19.63 [1.24, 309.90] |
| 7.2 CVS (any route) versus amniocentesis | 1 | 3201 | Risk Ratio (M‐H, Random, 95% CI) | 2.83 [1.94, 4.13] |
| 8 Laboratory failure Show forest plot | 3 | Risk Ratio (M‐H, Random, 95% CI) | Subtotals only | |
| 8.1 Transcervical CVS versus amniocentesis | 2 | 2792 | Risk Ratio (M‐H, Random, 95% CI) | 22.62 [3.07, 166.89] |
| 8.2 CVS (any route) versus amniocentesis | 1 | 3201 | Risk Ratio (M‐H, Random, 95% CI) | 0.77 [0.29, 2.06] |
| 9 All non‐mosaic abnormalities Show forest plot | 2 | Risk Ratio (M‐H, Random, 95% CI) | Subtotals only | |
| 9.1 Transcervical CVS versus amniocentesis | 2 | 2667 | Risk Ratio (M‐H, Random, 95% CI) | 1.12 [0.73, 1.72] |
| 10 True mosaics Show forest plot | 1 | Risk Ratio (M‐H, Random, 95% CI) | Subtotals only | |
| 10.1 Transcervical CVS versus amniocentesis | 1 | 672 | Risk Ratio (M‐H, Random, 95% CI) | 3.42 [0.14, 83.63] |
| 11 Confined mosaics Show forest plot | 1 | Risk Ratio (M‐H, Random, 95% CI) | Subtotals only | |
| 11.1 Transcervical CVS versus amniocentesis | 1 | 1995 | Risk Ratio (M‐H, Random, 95% CI) | 5.66 [1.97, 16.24] |
| 12 Maternal contamination Show forest plot | 2 | Risk Ratio (M‐H, Random, 95% CI) | Subtotals only | |
| 12.1 Transcervical CVS versus amniocentesis | 1 | 1991 | Risk Ratio (M‐H, Random, 95% CI) | 12.30 [3.81, 39.67] |
| 12.2 CVS (any route) versus amniocentesis | 1 | 3201 | Risk Ratio (M‐H, Random, 95% CI) | 8.90 [0.48, 165.26] |
| 13 Known false positive after birth Show forest plot | 3 | Risk Ratio (M‐H, Random, 95% CI) | Subtotals only | |
| 13.1 Transcervical CVS versus amniocentesis | 2 | 2627 | Risk Ratio (M‐H, Random, 95% CI) | 4.40 [0.46, 42.38] |
| 13.2 CVS (any route) versus amniocentesis | 1 | 3201 | Risk Ratio (M‐H, Random, 95% CI) | 0.99 [0.06, 15.80] |
| 14 Known false negative after birth Show forest plot | 3 | Risk Ratio (M‐H, Random, 95% CI) | Subtotals only | |
| 14.1 Transcervical CVS versus amniocentesis | 2 | 2627 | Risk Ratio (M‐H, Random, 95% CI) | 7.84 [0.41, 151.61] |
| 14.2 CVS (any route) versus amniocentesis | 1 | 3201 | Risk Ratio (M‐H, Random, 95% CI) | 2.97 [0.12, 72.81] |
| 15 Results given in less than 7 days (not pre‐specified) Show forest plot | 1 | Risk Ratio (M‐H, Random, 95% CI) | Subtotals only | |
| 15.1 CVS (any route) versus amniocentesis | 1 | 3099 | Risk Ratio (M‐H, Random, 95% CI) | 23.52 [12.54, 44.10] |
| 16 Results given in less than 14 days (not pre‐specified) Show forest plot | 1 | Risk Ratio (M‐H, Random, 95% CI) | Subtotals only | |
| 16.1 CVS (any route) versus amniocentesis | 1 | 3099 | Risk Ratio (M‐H, Random, 95% CI) | 3.96 [3.17, 4.95] |
| 17 Results given in less than 21 days (not pre‐specified) Show forest plot | 1 | Risk Ratio (M‐H, Random, 95% CI) | Subtotals only | |
| 17.1 CVS (any route) versus amniocentesis | 1 | 3099 | Risk Ratio (M‐H, Random, 95% CI) | 0.72 [0.63, 0.82] |
| 18 Result given after 21 days (not pre‐specified) Show forest plot | 1 | Risk Ratio (M‐H, Random, 95% CI) | Subtotals only | |
| 18.1 CVS (any route) versus amniocentesis | 1 | 3099 | Risk Ratio (M‐H, Random, 95% CI) | 0.33 [0.28, 0.39] |
| 19 Vaginal bleeding after test Show forest plot | 2 | Risk Ratio (M‐H, Random, 95% CI) | Subtotals only | |
| 19.1 Transcervical CVS versus amniocentesis | 2 | 3193 | Risk Ratio (M‐H, Random, 95% CI) | 11.48 [2.58, 51.08] |
| 20 Amniotic leakage after test Show forest plot | 2 | Risk Ratio (M‐H, Random, 95% CI) | Subtotals only | |
| 20.1 Transabdominal CVS vs amniocentesis | 1 | 1485 | Risk Ratio (M‐H, Random, 95% CI) | 2.53 [0.81, 7.92] |
| 20.2 CVS (any route) versus amniocentesis | 1 | 3201 | Risk Ratio (M‐H, Random, 95% CI) | 0.55 [0.18, 1.64] |
| 21 Vaginal bleeding after 20 weeks Show forest plot | 2 | Risk Ratio (M‐H, Random, 95% CI) | Subtotals only | |
| 21.1 Transcervical CVS versus amniocentesis | 1 | 797 | Risk Ratio (M‐H, Random, 95% CI) | 1.44 [0.62, 3.33] |
| 21.2 CVS (any route) versus amniocentesis | 1 | 3201 | Risk Ratio (M‐H, Random, 95% CI) | 0.99 [0.69, 1.42] |
| 22 Pre‐labour ruptured membranes before 28 weeks Show forest plot | 2 | Risk Ratio (M‐H, Random, 95% CI) | Subtotals only | |
| 22.1 Transcervical CVS versus amniocentesis | 1 | 722 | Risk Ratio (M‐H, Random, 95% CI) | 4.97 [1.45, 17.03] |
| 22.2 CVS (any route) versus amniocentesis | 1 | 2765 | Risk Ratio (M‐H, Random, 95% CI) | 1.60 [0.80, 3.17] |
| 23 Antenatal hospital admission Show forest plot | 2 | Risk Ratio (M‐H, Random, 95% CI) | Subtotals only | |
| 23.1 Transcervical CVS versus amniocentesis | 1 | 780 | Risk Ratio (M‐H, Random, 95% CI) | 1.47 [0.81, 2.68] |
| 23.2 CVS (any route) versus amniocentesis | 1 | 3201 | Risk Ratio (M‐H, Random, 95% CI) | 0.90 [0.75, 1.08] |
| 24 Delivery before 37 weeks Show forest plot | 3 | Risk Ratio (M‐H, Random, 95% CI) | Subtotals only | |
| 24.1 Transcervical CVS versus amniocentesis | 2 | 2506 | Risk Ratio (M‐H, Random, 95% CI) | 1.29 [0.67, 2.47] |
| 24.2 CVS (any route) versus amniocentesis | 1 | 3189 | Risk Ratio (M‐H, Random, 95% CI) | 1.33 [1.13, 1.57] |
| 25 Delivery before 33 weeks Show forest plot | 1 | Risk Ratio (M‐H, Random, 95% CI) | Subtotals only | |
| 25.1 Transcervical CVS versus amniocentesis | 1 | 768 | Risk Ratio (M‐H, Random, 95% CI) | 2.16 [0.94, 4.94] |
| 26 Termination of pregnancy (all) Show forest plot | 3 | Risk Difference (M‐H, Random, 95% CI) | Subtotals only | |
| 26.1 Transcervical CVS versus amniocentesis | 2 | 3454 | Risk Difference (M‐H, Random, 95% CI) | ‐0.00 [‐0.01, 0.01] |
| 26.2 CVS (any route) versus amniocentesis | 1 | 3201 | Risk Difference (M‐H, Random, 95% CI) | 0.01 [‐0.00, 0.02] |
| 27 Perinatal deaths Show forest plot | 4 | Risk Ratio (M‐H, Random, 95% CI) | Subtotals only | |
| 27.1 Transcervical CVS versus amniocentesis | 3 | 5521 | Risk Ratio (M‐H, Random, 95% CI) | 1.79 [0.42, 7.69] |
| 27.2 Transabdominal CVS versus amniocentesis | 1 | 2069 | Risk Ratio (M‐H, Random, 95% CI) | 1.18 [0.40, 3.51] |
| 27.3 CVS (any route) versus amniocentesis | 2 | 6280 | Risk Ratio (M‐H, Random, 95% CI) | 1.20 [0.64, 2.24] |
| 28 Stillbirths Show forest plot | 3 | Risk Ratio (M‐H, Random, 95% CI) | Subtotals only | |
| 28.1 Transcervical CVS versus amniocentesis | 2 | 3454 | Risk Ratio (M‐H, Random, 95% CI) | 0.94 [0.02, 45.31] |
| 28.2 CVS (any route) versus amniocentesis | 1 | 3201 | Risk Ratio (M‐H, Random, 95% CI) | 0.99 [0.35, 2.81] |
| 29 Neonatal deaths Show forest plot | 4 | Risk Ratio (M‐H, Random, 95% CI) | Subtotals only | |
| 29.1 Transcervical CVS versus amniocentesis | 3 | 4251 | Risk Ratio (M‐H, Random, 95% CI) | 1.63 [0.38, 7.05] |
| 29.2 CVS (any route) versus amniocentesis | 1 | 3201 | Risk Ratio (M‐H, Random, 95% CI) | 2.64 [0.70, 9.93] |
| 30 All recorded deaths after viability Show forest plot | 3 | Risk Ratio (M‐H, Random, 95% CI) | Subtotals only | |
| 30.1 Transcervical CVS versus amniocentesis | 2 | 1579 | Risk Ratio (M‐H, Random, 95% CI) | 0.78 [0.02, 25.93] |
| 30.2 CVS (any route) versus amniocentesis | 1 | 3201 | Risk Ratio (M‐H, Random, 95% CI) | 1.44 [0.67, 3.09] |
| 31 Congenital anomalies (all recorded) Show forest plot | 4 | Risk Ratio (M‐H, Random, 95% CI) | Subtotals only | |
| 31.1 Transcervical CVS versus amniocentesis | 2 | 1408 | Risk Ratio (M‐H, Random, 95% CI) | 0.62 [0.25, 1.59] |
| 31.2 CVS (any route) versus amniocentesis | 2 | 3338 | Risk Ratio (M‐H, Random, 95% CI) | 0.77 [0.66, 0.89] |
| 32 Haemangioma Show forest plot | 1 | 182 | Risk Ratio (M‐H, Random, 95% CI) | 1.35 [0.81, 2.24] |
| 33 Limb reduction defects Show forest plot | 1 | 3201 | Risk Ratio (M‐H, Random, 95% CI) | 4.95 [0.24, 102.97] |
| 33.1 CVS (any route) versus amniocentesis | 1 | 3201 | Risk Ratio (M‐H, Random, 95% CI) | 4.95 [0.24, 102.97] |
| Outcome or subgroup title | No. of studies | No. of participants | Statistical method | Effect size |
| 1 All known pregnancy loss (including termination of pregnancy) Show forest plot | 5 | 7978 | Risk Ratio (M‐H, Random, 95% CI) | 1.16 [0.81, 1.65] |
| 2 Spontaneous miscarriage Show forest plot | 4 | 3384 | Risk Ratio (M‐H, Random, 95% CI) | 1.68 [0.79, 3.58] |
| 3 Spontaneous miscarriage after test Show forest plot | 3 | 1347 | Risk Ratio (M‐H, Random, 95% CI) | 1.23 [0.75, 2.04] |
| 4 Non‐compliance with allocated procedure Show forest plot | 3 | 5187 | Risk Ratio (M‐H, Random, 95% CI) | 1.68 [0.59, 4.76] |
| 5 Sampling failure Show forest plot | 4 | 5231 | Risk Ratio (M‐H, Random, 95% CI) | 1.79 [1.13, 2.82] |
| 6 Multiple insertions Show forest plot | 2 | 1314 | Risk Ratio (M‐H, Random, 95% CI) | 2.54 [1.47, 4.42] |
| 7 Second test performed Show forest plot | 1 | 1194 | Risk Ratio (M‐H, Random, 95% CI) | 1.24 [0.65, 2.37] |
| 8 Laboratory failure Show forest plot | 1 | 1194 | Risk Ratio (M‐H, Random, 95% CI) | 2.23 [0.69, 7.22] |
| 9 All non‐mosaic abnormalities Show forest plot | 1 | 2862 | Risk Ratio (M‐H, Random, 95% CI) | 1.23 [0.87, 1.75] |
| 10 True mosaics Show forest plot | 1 | 2862 | Risk Ratio (M‐H, Random, 95% CI) | 0.92 [0.39, 2.17] |
| 11 Confined mosaics Show forest plot | 1 | 2862 | Risk Ratio (M‐H, Random, 95% CI) | 0.85 [0.26, 2.77] |
| 12 Amniotic leakage after test Show forest plot | 1 | 44 | Risk Ratio (M‐H, Random, 95% CI) | 0.28 [0.01, 6.52] |
| 13 Vaginal bleeding after test Show forest plot | 3 | 1358 | Risk Ratio (M‐H, Random, 95% CI) | 6.93 [0.77, 62.83] |
| 14 Termination of pregnancy (all) Show forest plot | 2 | 1303 | Risk Ratio (M‐H, Random, 95% CI) | 0.83 [0.56, 1.22] |
| 15 Perinatal deaths Show forest plot | 1 | 2037 | Risk Ratio (M‐H, Random, 95% CI) | 0.44 [0.11, 1.68] |
| 16 Stillbirths Show forest plot | 2 | 1227 | Risk Ratio (M‐H, Random, 95% CI) | 1.36 [0.11, 17.53] |
| 17 Neonatal deaths Show forest plot | 2 | 4845 | Risk Ratio (M‐H, Random, 95% CI) | 0.60 [0.14, 2.55] |
| 18 Anomalies (all recorded) Show forest plot | 2 | 3622 | Risk Ratio (M‐H, Random, 95% CI) | 0.68 [0.41, 1.12] |
| 19 Talipes Show forest plot | 1 | 2624 | Risk Ratio (M‐H, Random, 95% CI) | 3.21 [0.33, 30.80] |
| Outcome or subgroup title | No. of studies | No. of participants | Statistical method | Effect size |
| 1 All known pregnancy loss (including termination of pregnancy) Show forest plot | 4 | 5491 | Risk Ratio (M‐H, Random, 95% CI) | 1.15 [0.86, 1.54] |
| 2 Spontaneous miscarriage Show forest plot | 4 | 5491 | Risk Ratio (M‐H, Random, 95% CI) | 1.73 [1.15, 2.60] |
| 3 Spontaneous miscarriage after test Show forest plot | 4 | 5489 | Risk Ratio (M‐H, Random, 95% CI) | 1.71 [1.12, 2.61] |
| 4 Non‐compliance with allocated procedure Show forest plot | 4 | 5566 | Risk Ratio (M‐H, Random, 95% CI) | 0.25 [0.09, 0.72] |
| 5 Sampling failure Show forest plot | 4 | 5566 | Risk Ratio (M‐H, Random, 95% CI) | 0.58 [0.24, 1.38] |
| 6 Multiple insertions Show forest plot | 3 | 4445 | Risk Ratio (M‐H, Random, 95% CI) | 0.45 [0.21, 0.95] |
| 7 Second test performed Show forest plot | 4 | 5566 | Risk Ratio (M‐H, Random, 95% CI) | 0.63 [0.28, 1.43] |
| 8 Laboratory failure Show forest plot | 4 | 5566 | Risk Ratio (M‐H, Random, 95% CI) | 0.74 [0.34, 1.63] |
| 9 All non‐mosaic abnormalities Show forest plot | 4 | 5566 | Risk Ratio (M‐H, Random, 95% CI) | 0.95 [0.47, 1.90] |
| 10 True mosaics Show forest plot | 3 | 5451 | Risk Ratio (M‐H, Random, 95% CI) | 0.47 [0.10, 2.20] |
| 11 Confined mosaics Show forest plot | 4 | 5566 | Risk Ratio (M‐H, Random, 95% CI) | 0.82 [0.27, 2.47] |
| 12 Maternal contamination Show forest plot | 2 | 4330 | Risk Ratio (M‐H, Random, 95% CI) | 1.92 [0.02, 162.80] |
| 13 Known false positive after birth Show forest plot | 2 | 670 | Risk Ratio (M‐H, Random, 95% CI) | 0.36 [0.02, 8.73] |
| 14 Knonw false negative after birth Show forest plot | 1 | 555 | Risk Ratio (M‐H, Fixed, 95% CI) | 0.0 [0.0, 0.0] |
| 15 Reporting time Show forest plot | 1 | 3775 | Mean Difference (IV, Random, 95% CI) | 4.00 [3.82, 4.18] |
| 16 Vaginal bleeding after 20 weeks Show forest plot | 1 | 3698 | Risk Ratio (M‐H, Random, 95% CI) | 0.71 [0.35, 1.43] |
| 17 Amniotic leakage after test Show forest plot | 3 | 4934 | Risk Ratio (M‐H, Random, 95% CI) | 3.35 [0.37, 30.09] |
| 18 Vaginal bleeding after test Show forest plot | 3 | 4934 | Risk Ratio (M‐H, Random, 95% CI) | 0.69 [0.42, 1.12] |
| 19 Pre‐labour ruptured membranes before 28 weeks Show forest plot | 1 | 3698 | Risk Ratio (M‐H, Random, 95% CI) | 0.50 [0.27, 0.92] |
| 20 Delivery before 37 weeks Show forest plot | 3 | 1755 | Risk Ratio (M‐H, Random, 95% CI) | 1.16 [0.78, 1.74] |
| 21 Delivery before 33 weeks Show forest plot | 1 | 1121 | Risk Ratio (M‐H, Random, 95% CI) | 0.50 [0.09, 2.73] |
| 22 Termination of pregnancy (all) Show forest plot | 4 | 5489 | Risk Ratio (M‐H, Random, 95% CI) | 0.74 [0.45, 1.25] |
| 23 Perinatal deaths Show forest plot | 4 | 5428 | Risk Ratio (M‐H, Random, 95% CI) | 1.10 [0.53, 2.28] |
| 24 Stillbirths Show forest plot | 4 | 5428 | Risk Ratio (M‐H, Random, 95% CI) | 1.11 [0.52, 2.36] |
| 25 Neonatal deaths Show forest plot | 4 | 5455 | Risk Ratio (M‐H, Random, 95% CI) | 0.41 [0.05, 3.11] |
| 26 All recorded deaths after viability Show forest plot | 4 | 5453 | Risk Ratio (M‐H, Random, 95% CI) | 1.18 [0.43, 3.24] |
| 27 Anomalies (all recorded) Show forest plot | 4 | 5305 | Risk Ratio (M‐H, Random, 95% CI) | 1.14 [0.57, 2.30] |
| 28 Talipes equinovarus Show forest plot | 4 | 5305 | Risk Ratio (M‐H, Random, 95% CI) | 3.75 [1.42, 9.88] |
| 29 Haemangioma Show forest plot | 4 | 5305 | Risk Ratio (M‐H, Random, 95% CI) | 0.75 [0.26, 2.20] |
| 30 Neonatal respiratory distress syndrome Show forest plot | 4 | 4725 | Risk Ratio (M‐H, Random, 95% CI) | 0.91 [0.21, 3.98] |
| 31 Birthweight below 10th centile Show forest plot | 1 | 3618 | Risk Ratio (M‐H, Random, 95% CI) | 0.84 [0.66, 1.06] |
| 32 Birthweight below 5th centile Show forest plot | 2 | 629 | Risk Ratio (M‐H, Random, 95% CI) | 0.66 [0.05, 9.38] |
| Outcome or subgroup title | No. of studies | No. of participants | Statistical method | Effect size |
| 1 All known pregnancy loss (including termination of pregnancy) Show forest plot | 1 | 223 | Risk Ratio (M‐H, Random, 95% CI) | 0.33 [0.01, 8.02] |
| 2 Spontaneous miscarriage Show forest plot | 1 | 223 | Risk Ratio (M‐H, Random, 95% CI) | 0.33 [0.01, 8.02] |
| 3 Spontaneous miscarriage after test Show forest plot | 1 | 223 | Risk Ratio (M‐H, Random, 95% CI) | 0.33 [0.01, 8.02] |
| 4 Sampling failure Show forest plot | 1 | 223 | Risk Ratio (M‐H, Random, 95% CI) | 10.90 [0.61, 194.85] |
| 5 Multiple insertions Show forest plot | 1 | 223 | Risk Ratio (M‐H, Random, 95% CI) | 0.67 [0.41, 1.09] |
| 6 Bloody tap (not pre‐specified) Show forest plot | 1 | 223 | Risk Ratio (M‐H, Random, 95% CI) | 1.87 [0.87, 4.02] |