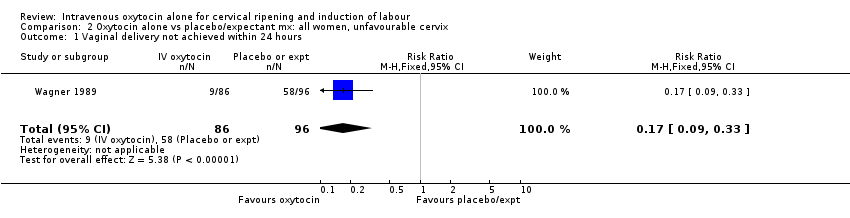
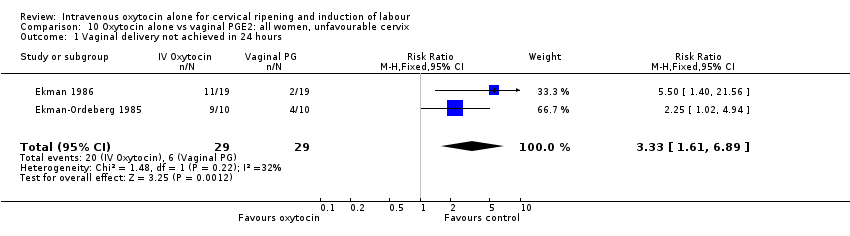
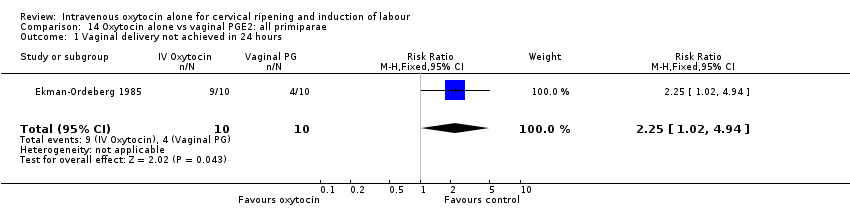
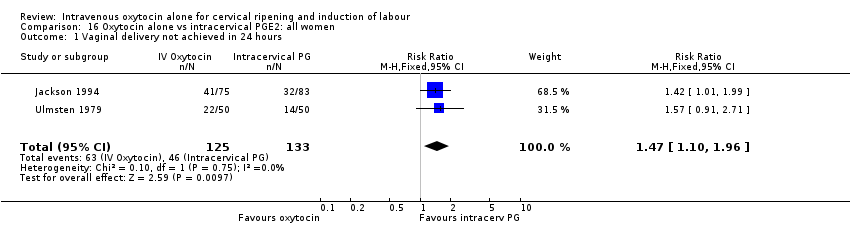
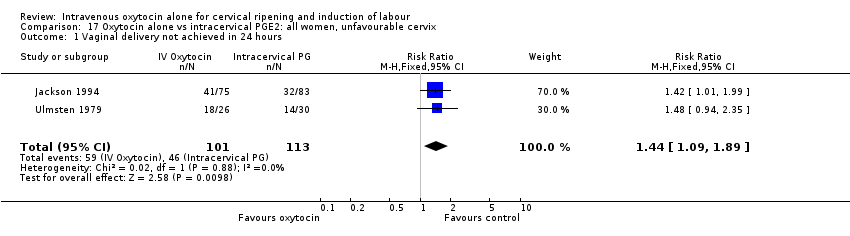
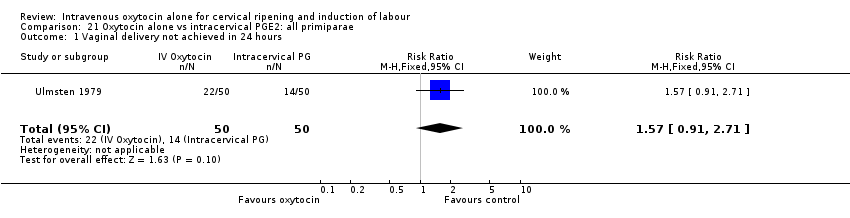
| 1 Vaginal delivery not achieved in 24 hours Show forest plot | 3 | 260 | Risk Ratio (M‐H, Fixed, 95% CI) | 1.77 [1.31, 2.38] |
|
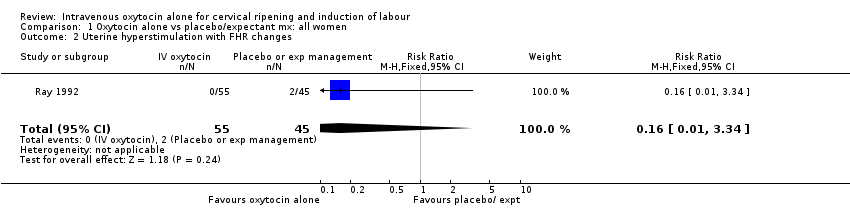
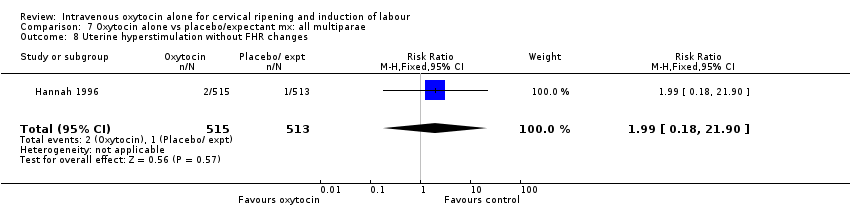
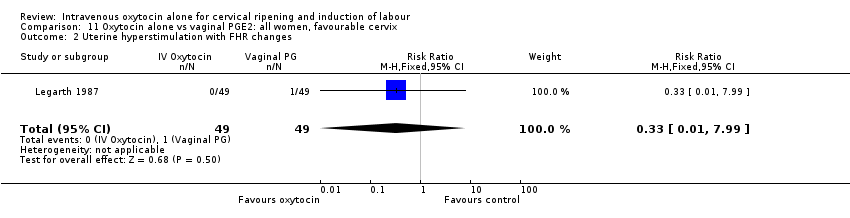
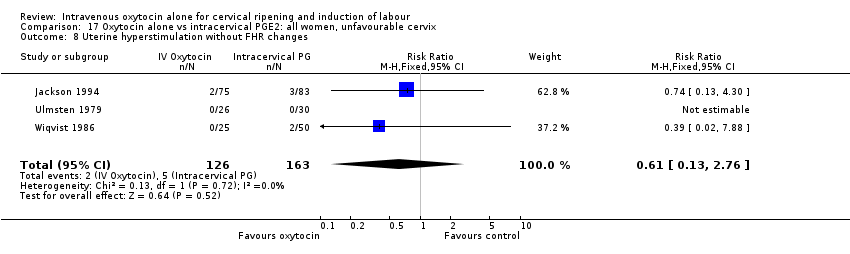
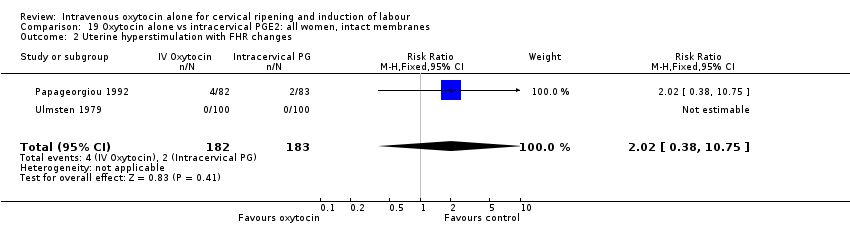
| 2 Uterine hyperstimulation with FHR changes Show forest plot | 8 | 843 | Risk Ratio (M‐H, Fixed, 95% CI) | 0.35 [0.04, 3.28] |
|
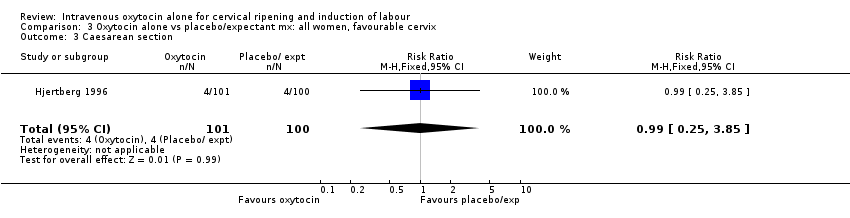
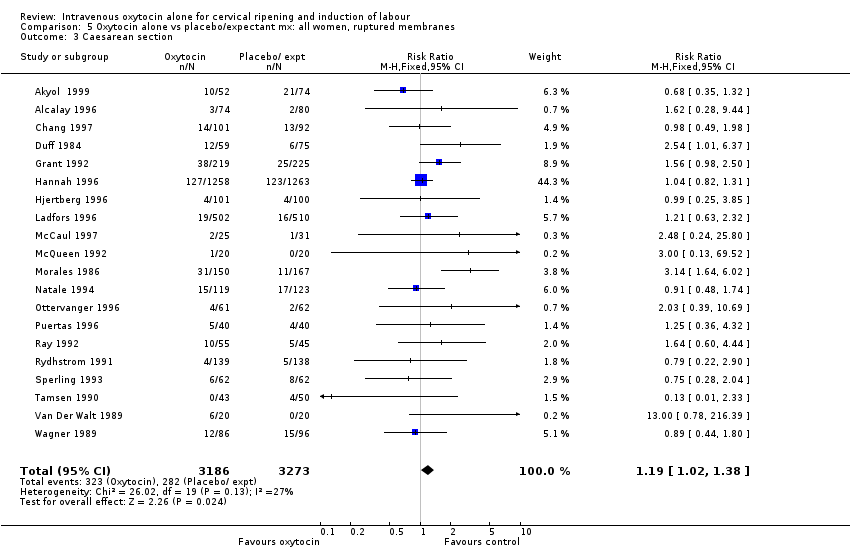
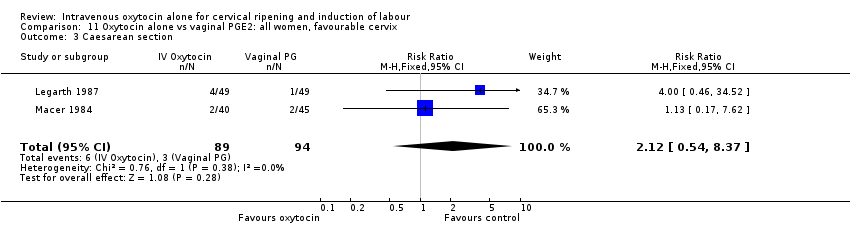
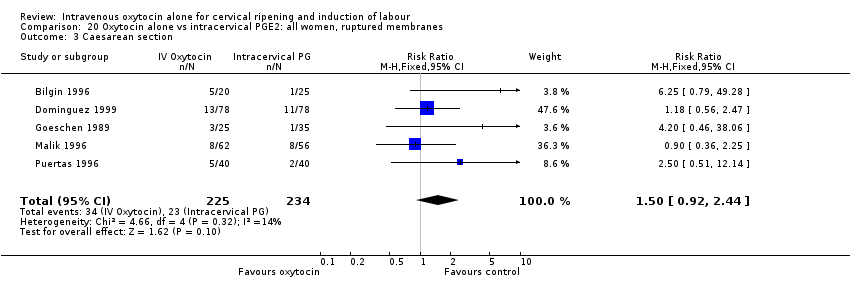
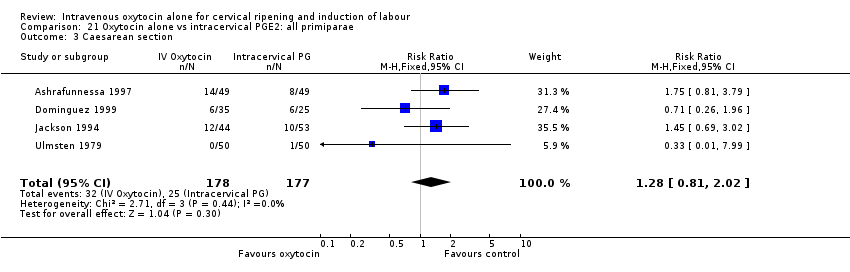
| 3 Caesarean section Show forest plot | 26 | 4514 | Risk Ratio (M‐H, Fixed, 95% CI) | 1.11 [0.94, 1.30] |
|
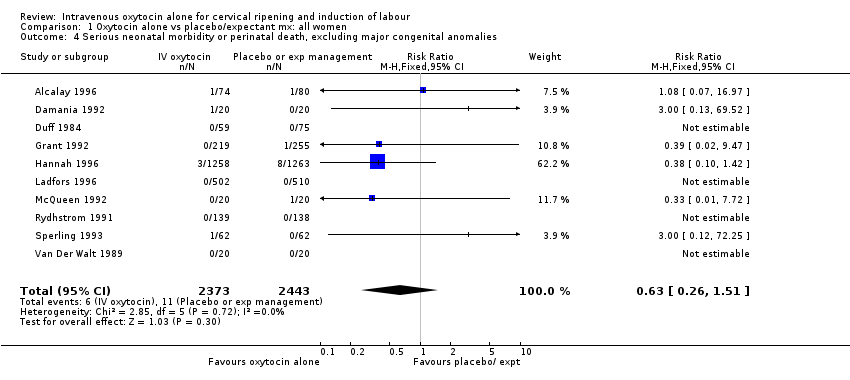
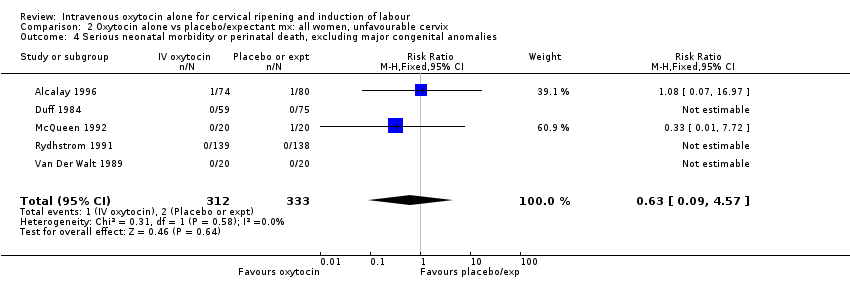
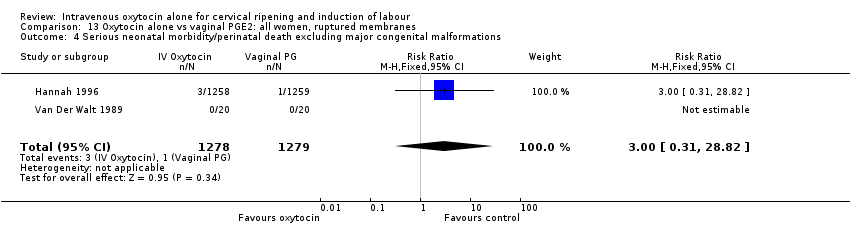
| 4 Serious neonatal morbidity/perinatal death excluding major congenital malformations Show forest plot | 3 | 2759 | Risk Ratio (M‐H, Fixed, 95% CI) | 3.00 [0.31, 28.82] |
|
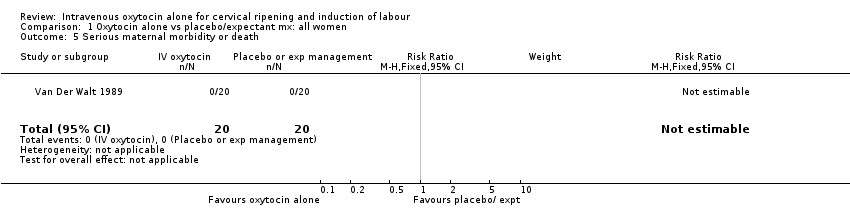
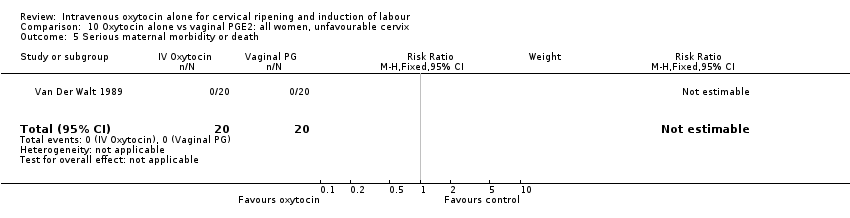
| 5 Serious maternal morbidity or death Show forest plot | 3 | 175 | Risk Ratio (M‐H, Fixed, 95% CI) | 0.37 [0.02, 8.93] |
|
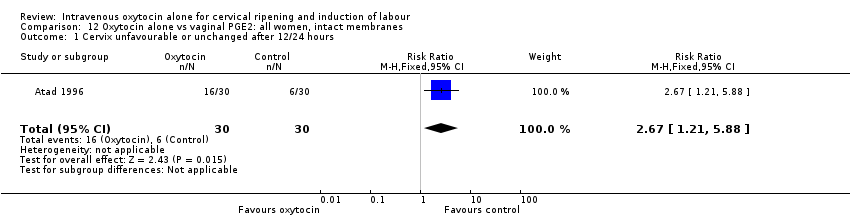
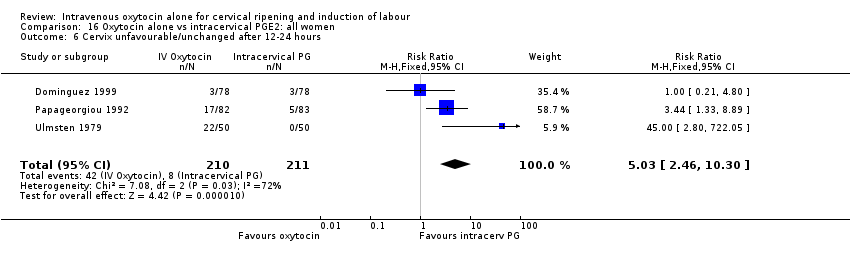
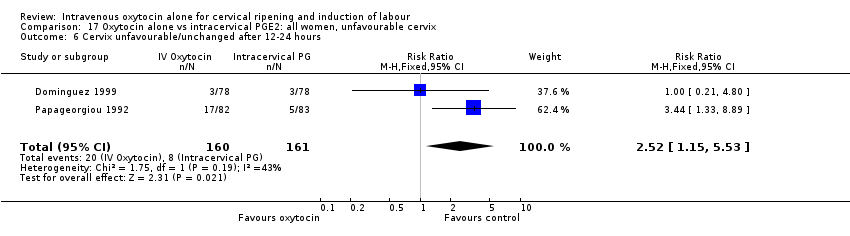
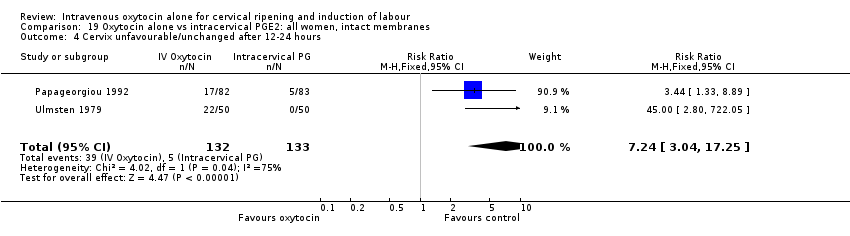
| 6 Cervix unfavourable/unchanged after 12‐24 hours Show forest plot | 5 | 323 | Risk Ratio (M‐H, Fixed, 95% CI) | 2.42 [1.43, 4.09] |
|
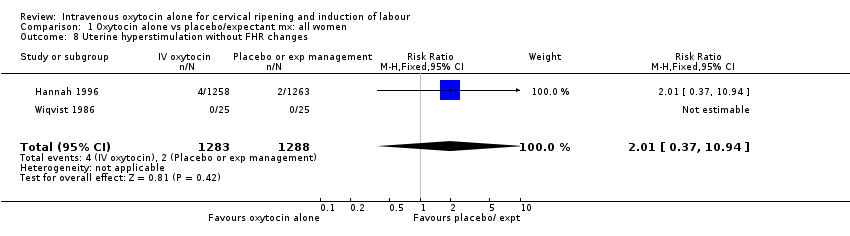
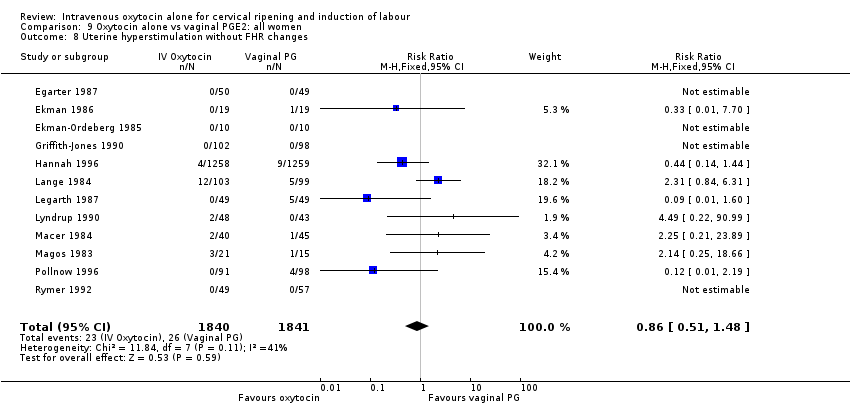
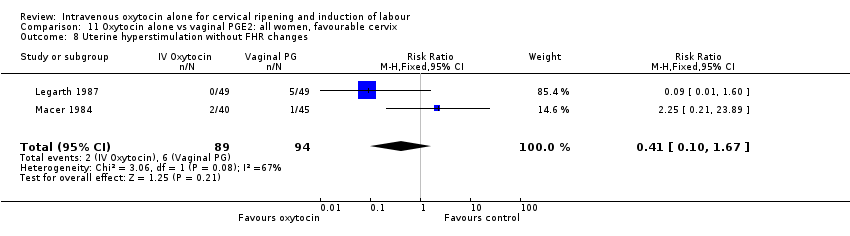
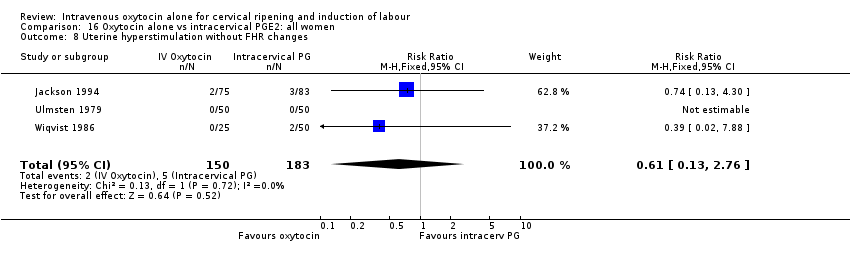
| 8 Uterine hyperstimulation without FHR changes Show forest plot | 12 | 3681 | Risk Ratio (M‐H, Fixed, 95% CI) | 0.86 [0.51, 1.48] |
|
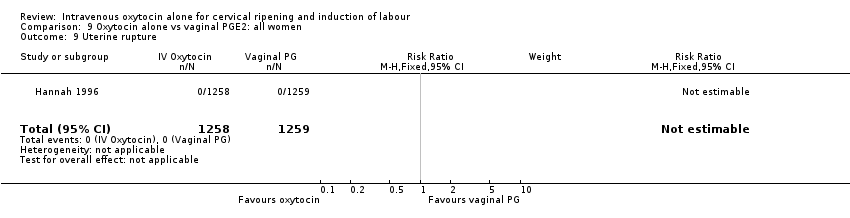
| 9 Uterine rupture Show forest plot | 1 | 2517 | Risk Ratio (M‐H, Fixed, 95% CI) | 0.0 [0.0, 0.0] |
|
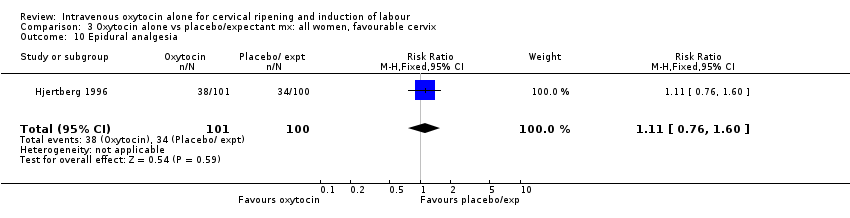
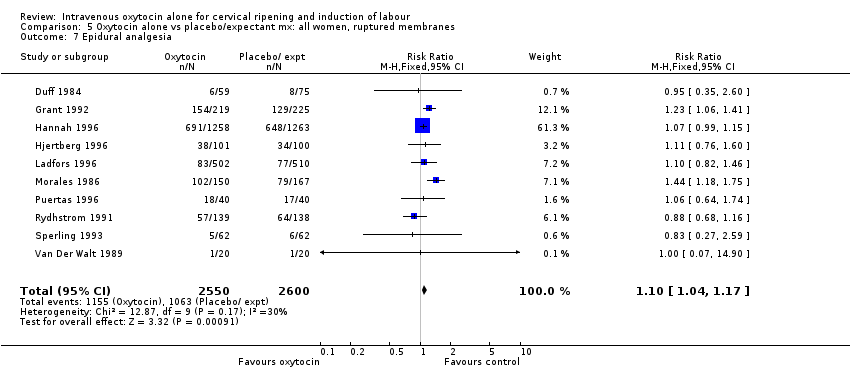
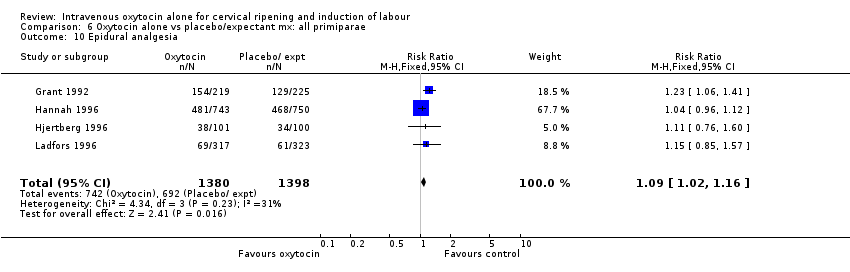
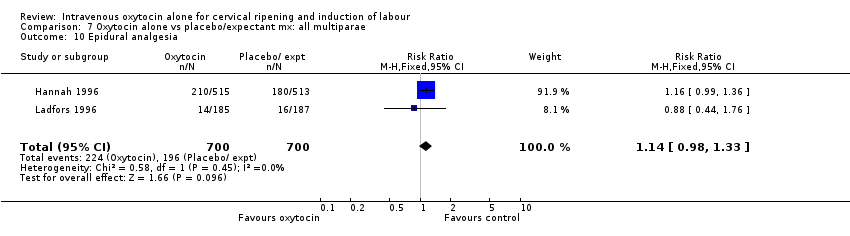
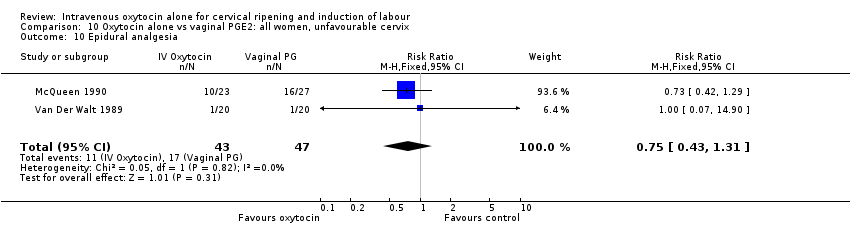
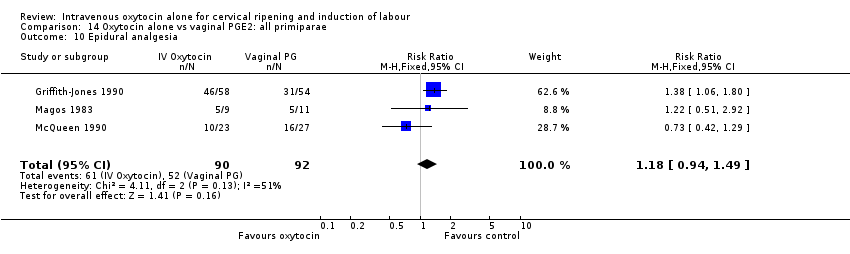
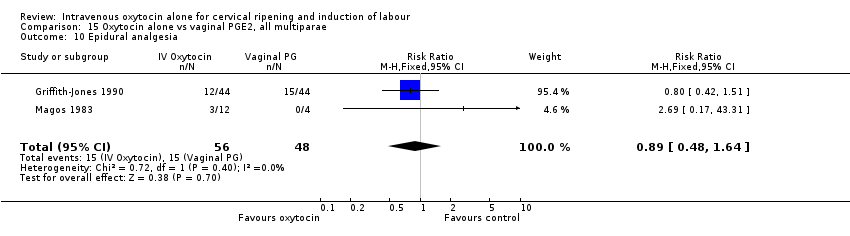
| 10 Epidural analgesia Show forest plot | 6 | 2949 | Risk Ratio (M‐H, Fixed, 95% CI) | 1.09 [1.01, 1.17] |
|
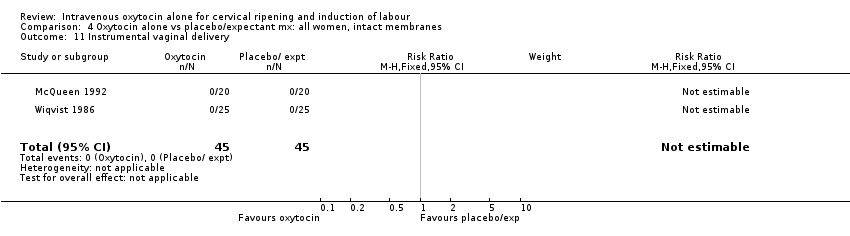
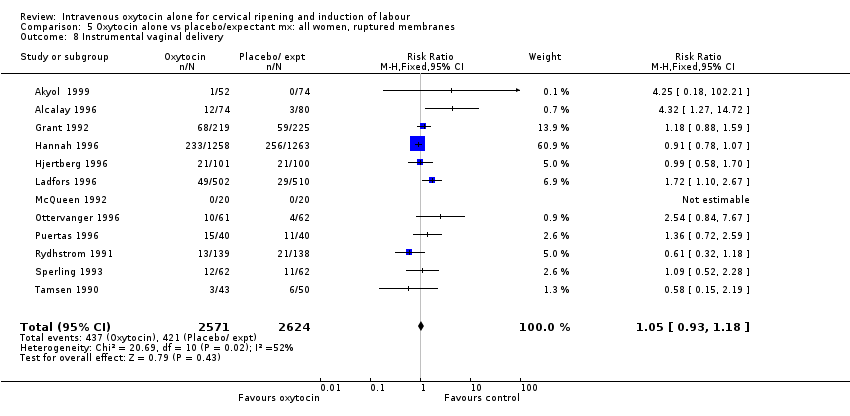
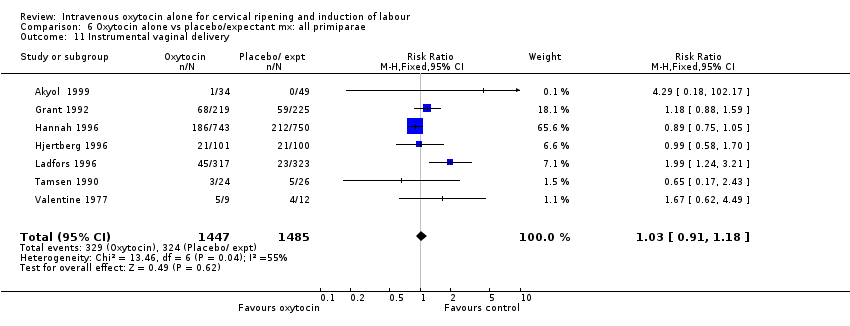
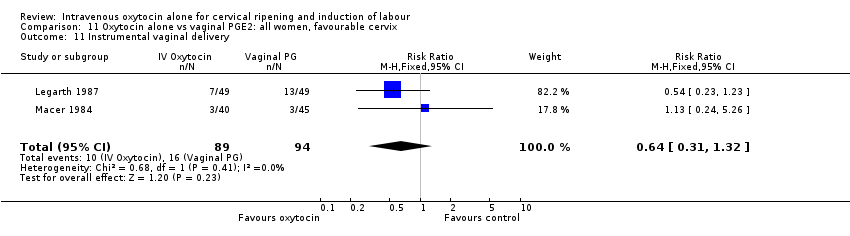
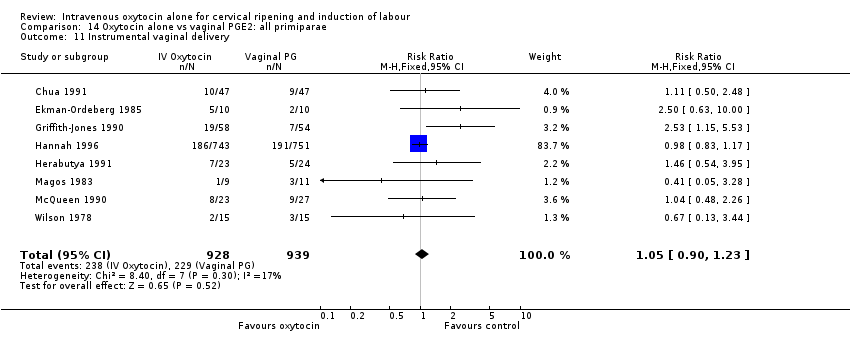
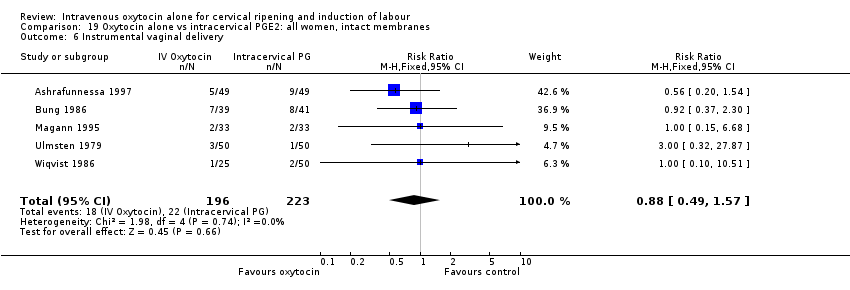
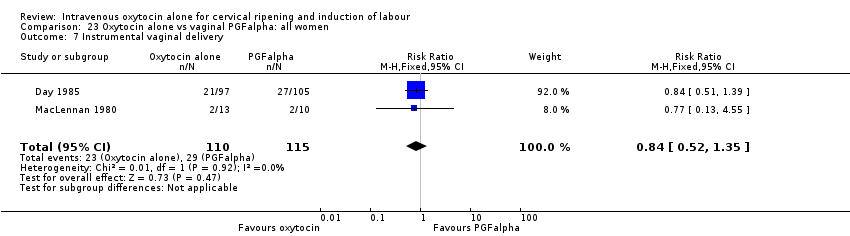
| 11 Instrumental vaginal delivery Show forest plot | 18 | 3894 | Risk Ratio (M‐H, Fixed, 95% CI) | 1.00 [0.88, 1.15] |
|
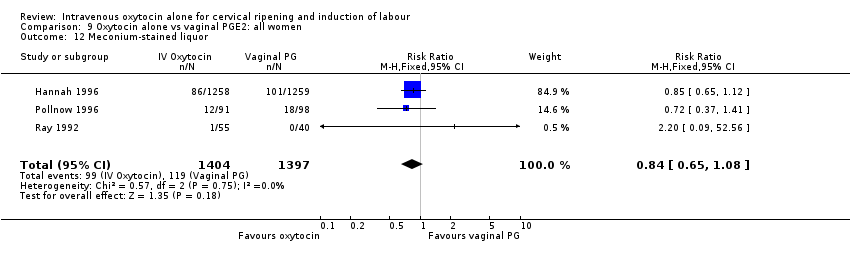
| 12 Meconium‐stained liquor Show forest plot | 3 | 2801 | Risk Ratio (M‐H, Fixed, 95% CI) | 0.84 [0.65, 1.08] |
|
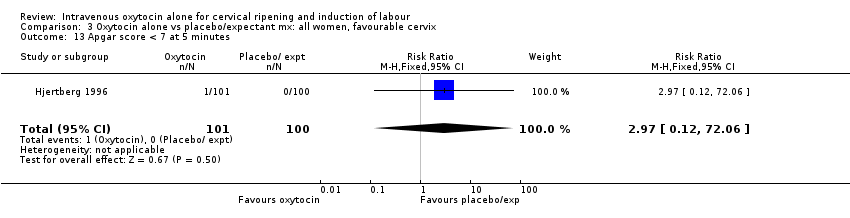
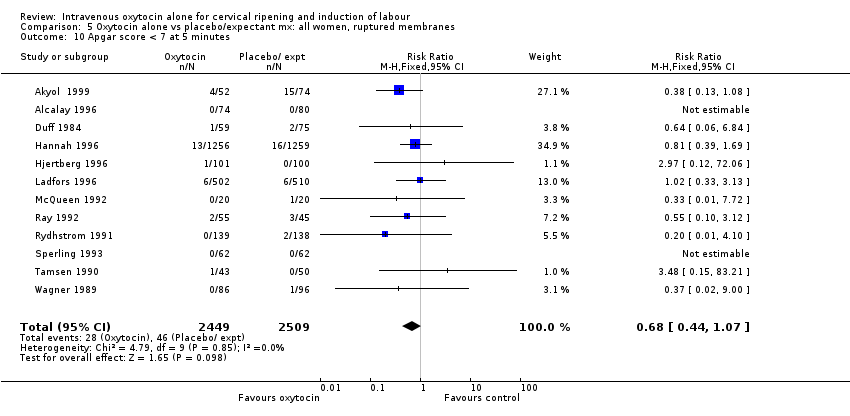
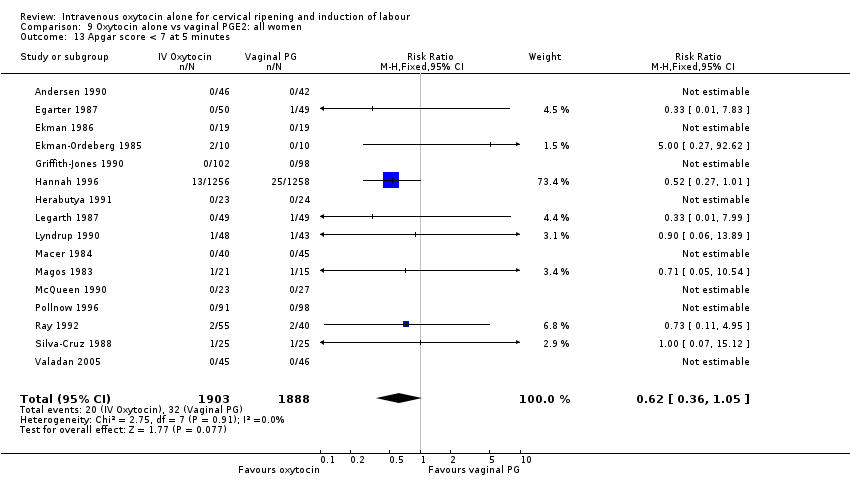
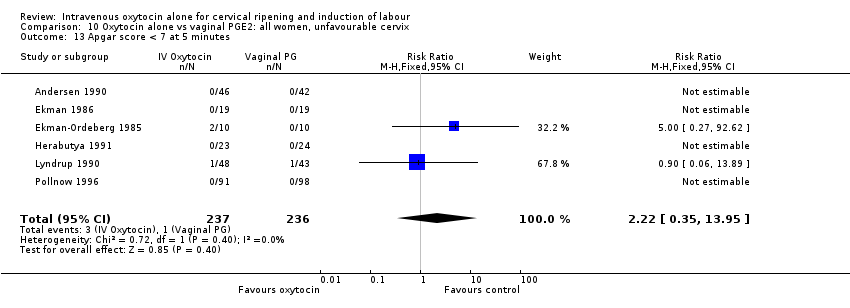
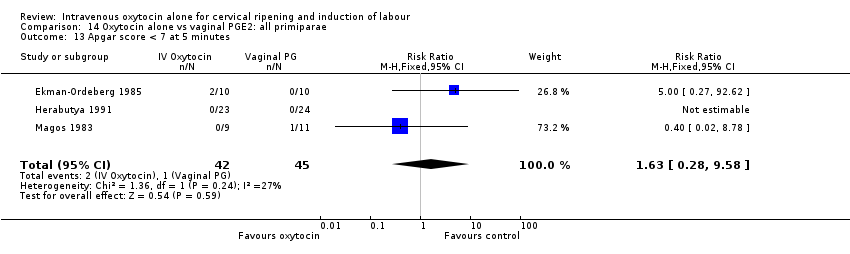
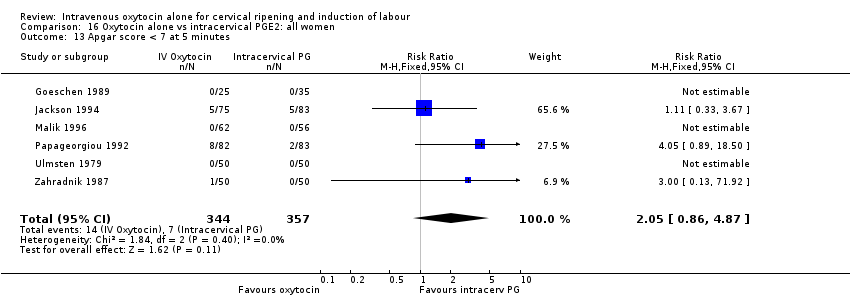
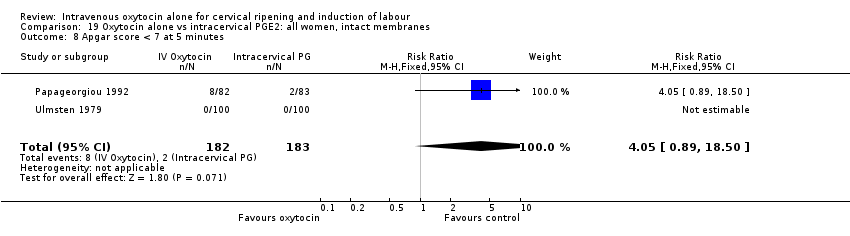
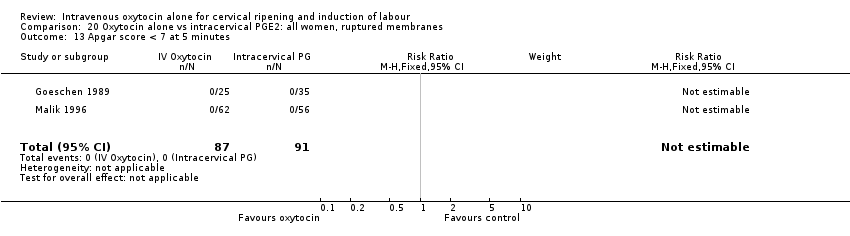
| 13 Apgar score < 7 at 5 minutes Show forest plot | 16 | 3791 | Risk Ratio (M‐H, Fixed, 95% CI) | 0.62 [0.36, 1.05] |
|
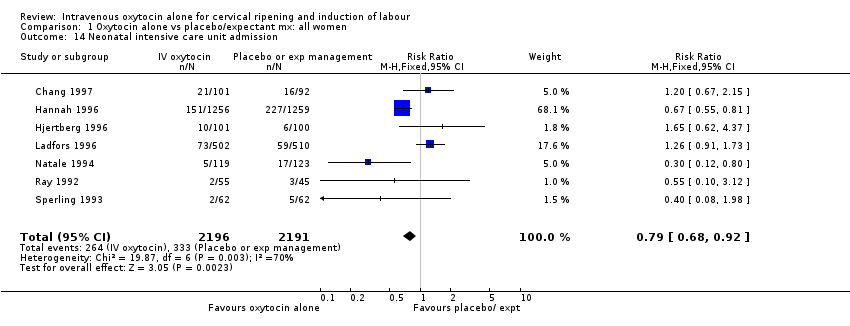
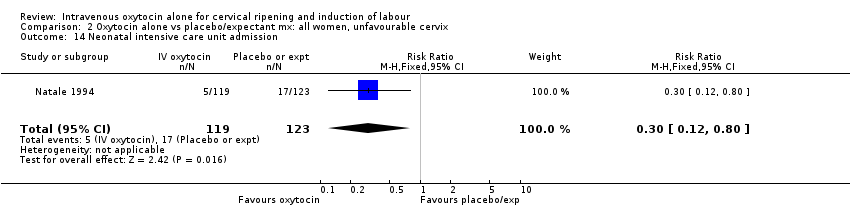
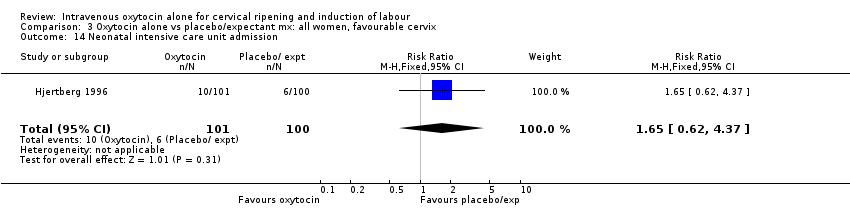
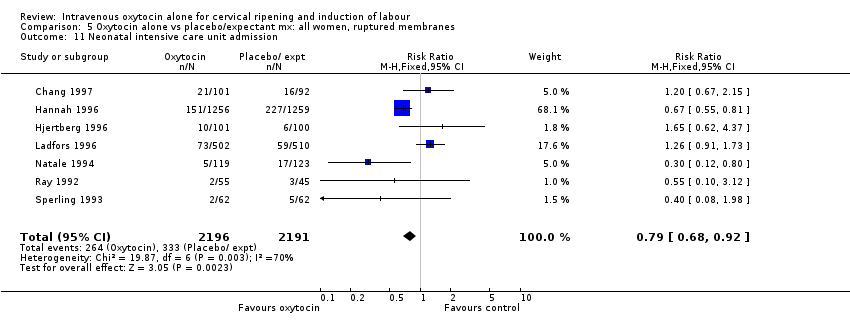
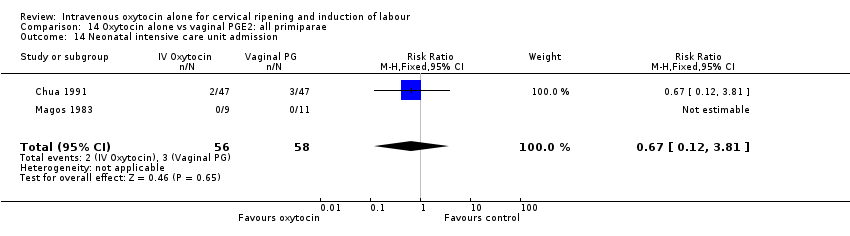
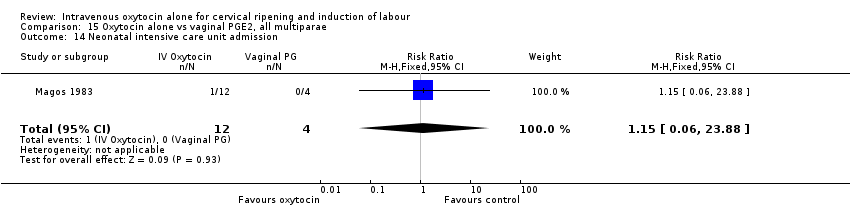
| 14 Neonatal intensive care unit admission Show forest plot | 5 | 2845 | Risk Ratio (M‐H, Fixed, 95% CI) | 0.85 [0.70, 1.04] |
|
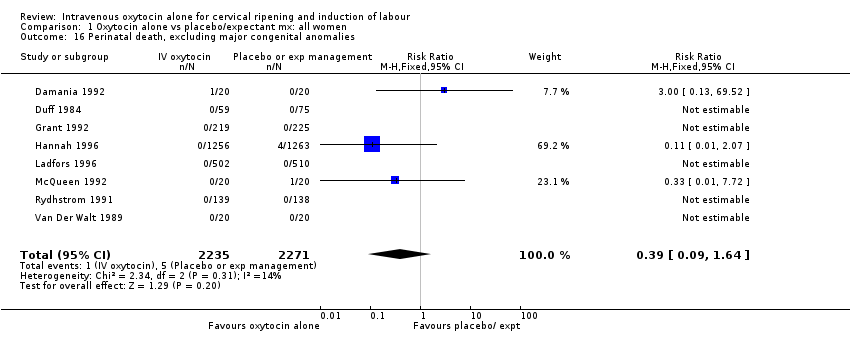
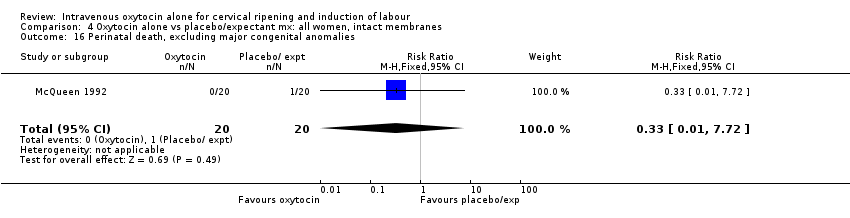
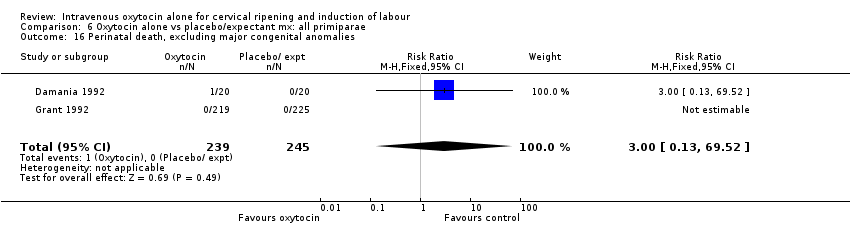
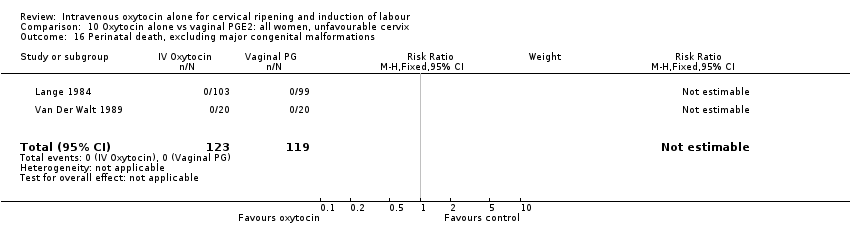
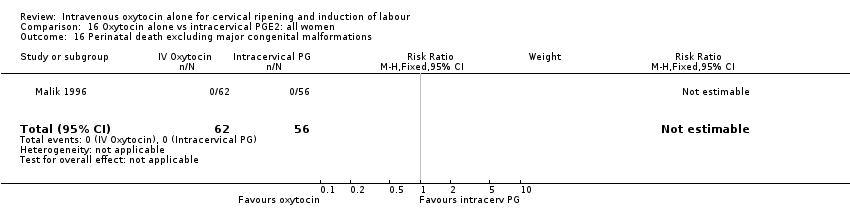
| 16 Perinatal death, excluding major congenital malformations Show forest plot | 3 | 2757 | Risk Ratio (M‐H, Fixed, 95% CI) | 0.0 [0.0, 0.0] |
|
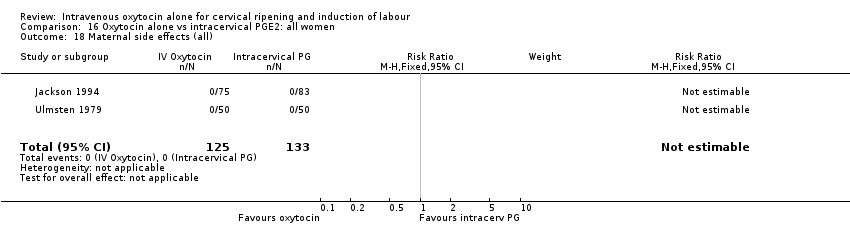
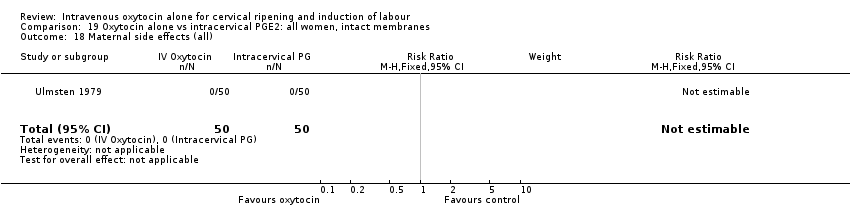
| 18 Maternal side effects (all) Show forest plot | 3 | 223 | Risk Ratio (M‐H, Fixed, 95% CI) | 0.64 [0.29, 1.41] |
|
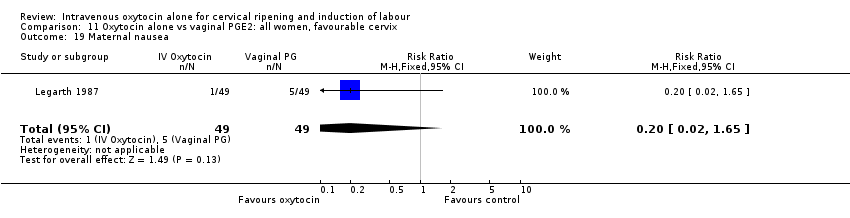
| 19 Maternal nausea Show forest plot | 4 | 260 | Risk Ratio (M‐H, Fixed, 95% CI) | 0.23 [0.05, 1.07] |
|
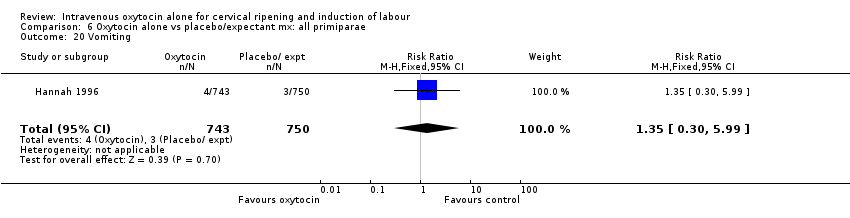
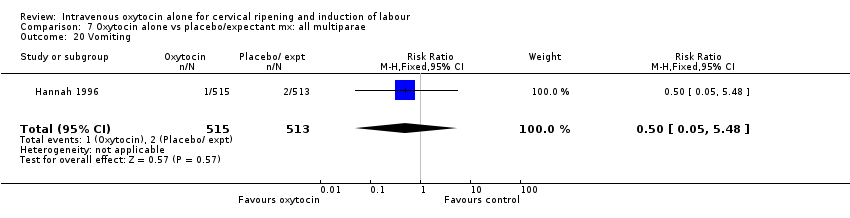
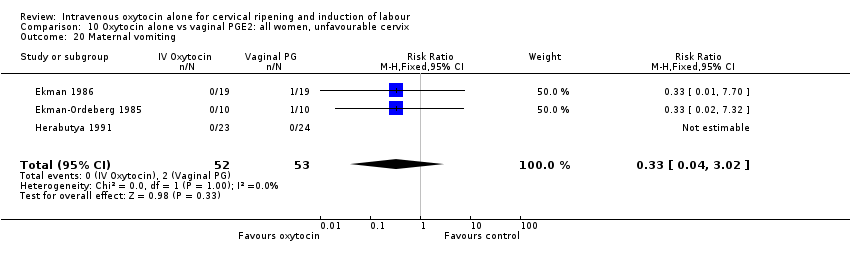
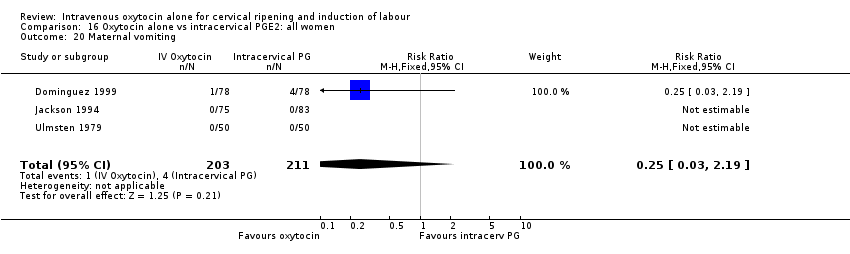
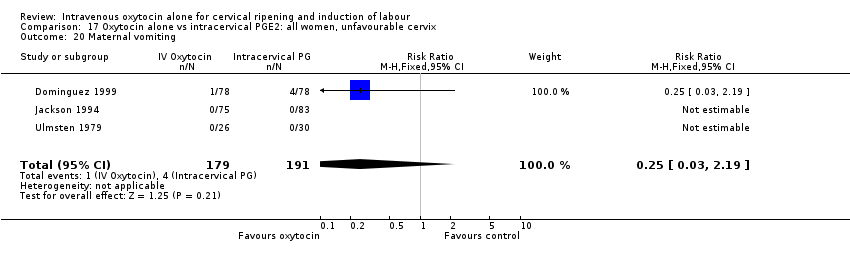
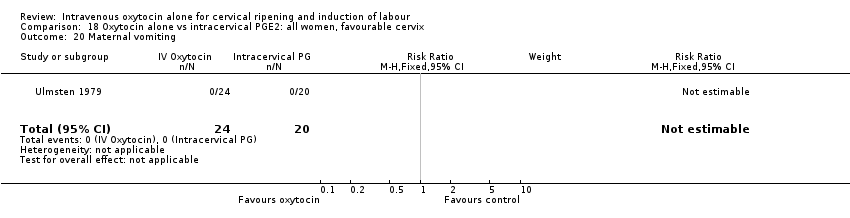
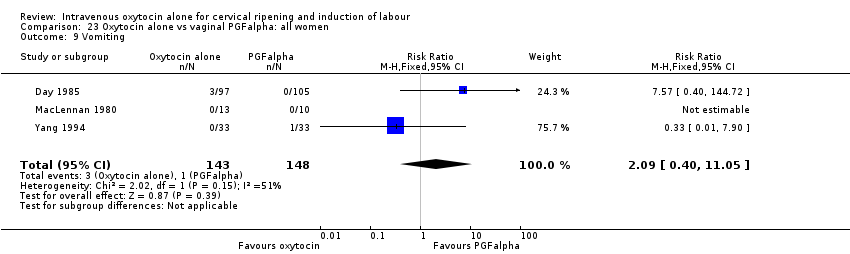
| 20 Maternal vomiting Show forest plot | 4 | 2622 | Risk Ratio (M‐H, Fixed, 95% CI) | 0.75 [0.26, 2.14] |
|
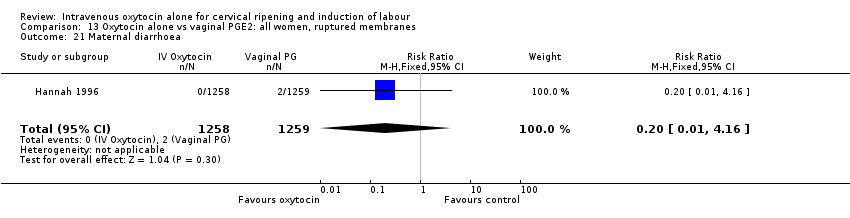
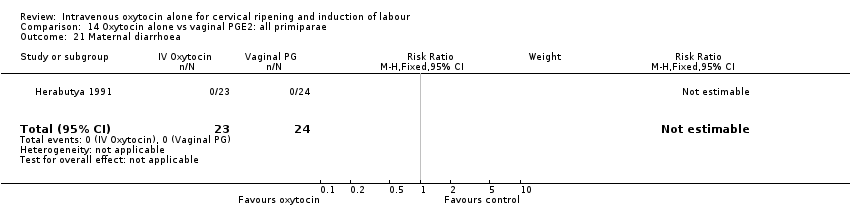
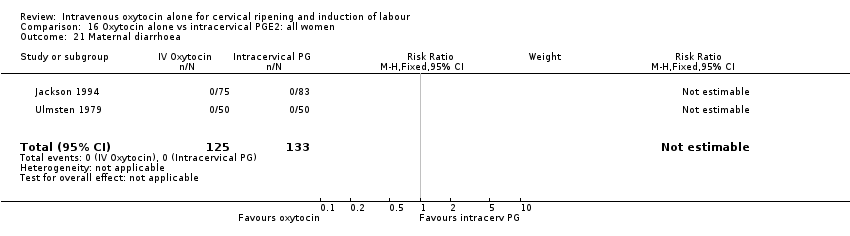
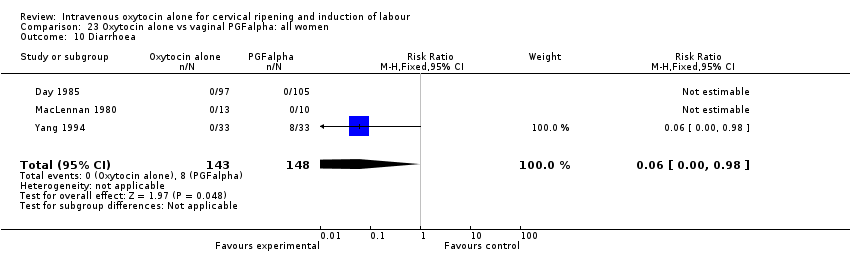
| 21 Maternal diarrhoea Show forest plot | 3 | 2602 | Risk Ratio (M‐H, Fixed, 95% CI) | 0.20 [0.01, 4.16] |
|
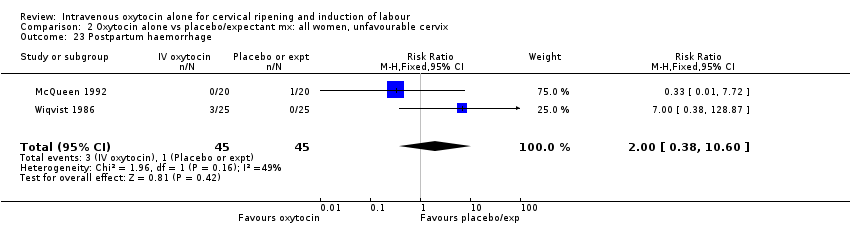
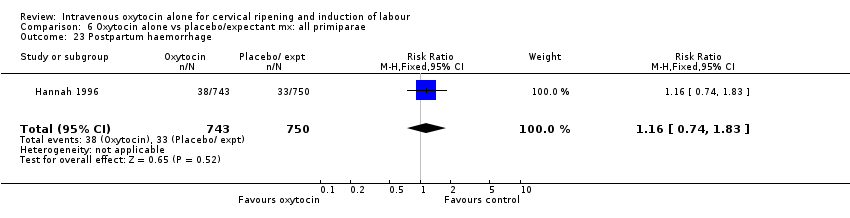
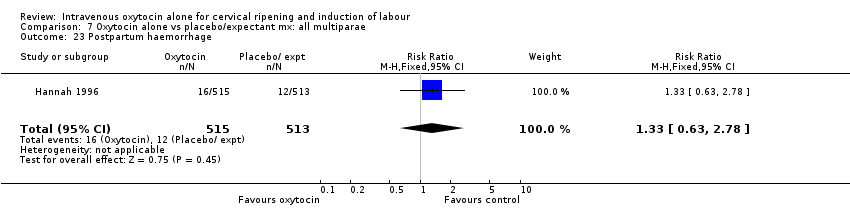
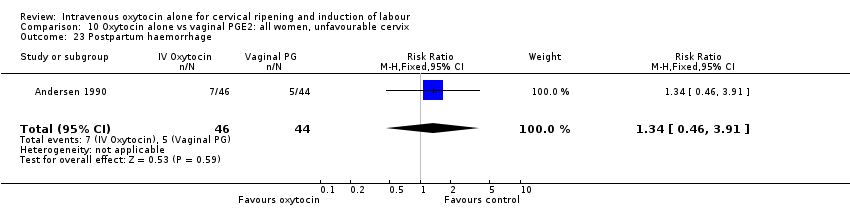
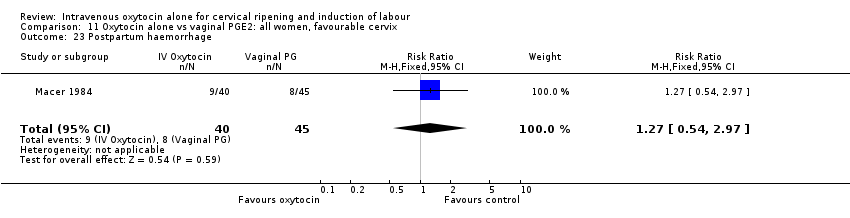
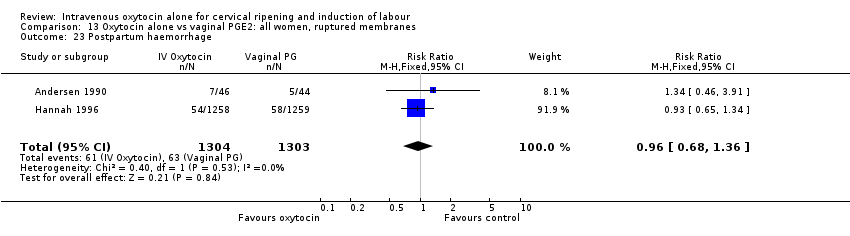
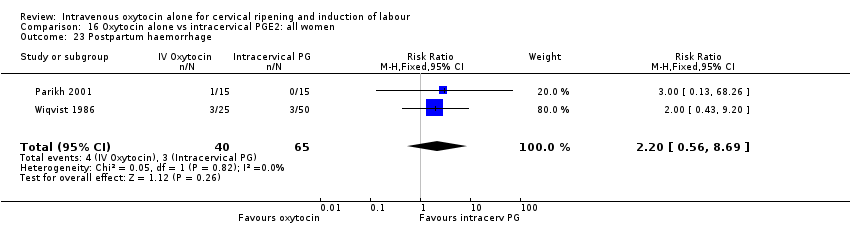
| 23 Postpartum haemorrhage Show forest plot | 3 | 2692 | Risk Ratio (M‐H, Fixed, 95% CI) | 1.00 [0.73, 1.37] |
|
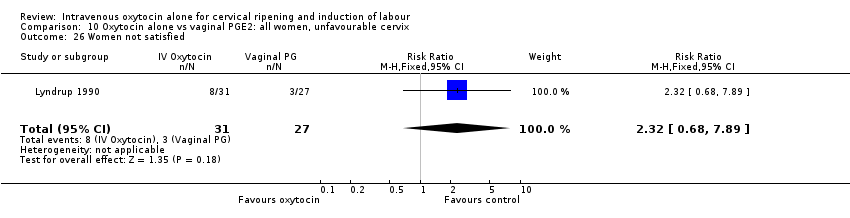
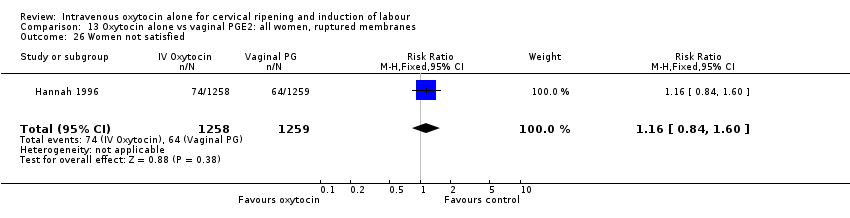
| 26 Women not satisfied Show forest plot | 3 | 2663 | Risk Ratio (M‐H, Fixed, 95% CI) | 1.30 [0.96, 1.77] |
|
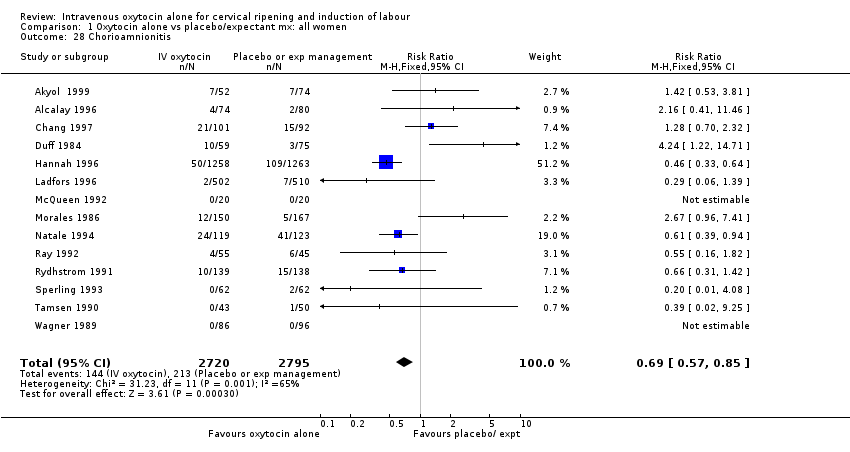
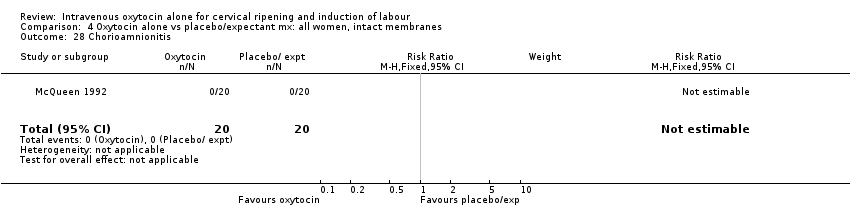
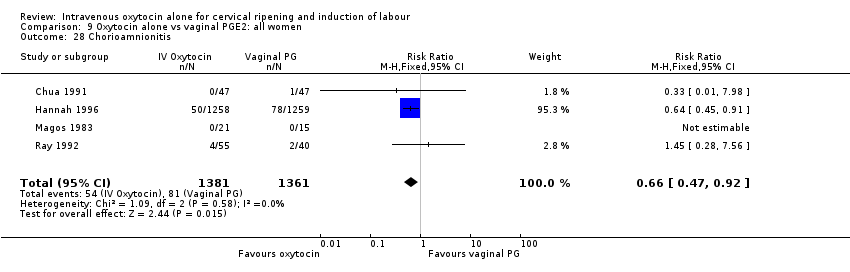
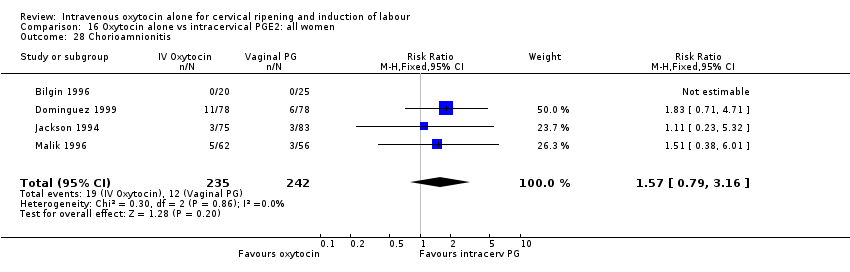
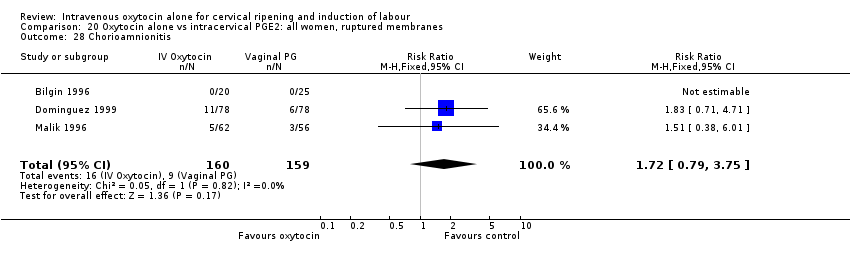
| 28 Chorioamnionitis Show forest plot | 4 | 2742 | Risk Ratio (M‐H, Fixed, 95% CI) | 0.66 [0.47, 0.92] |
|
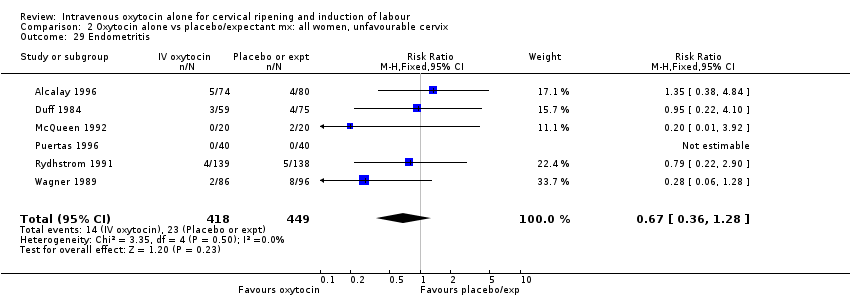
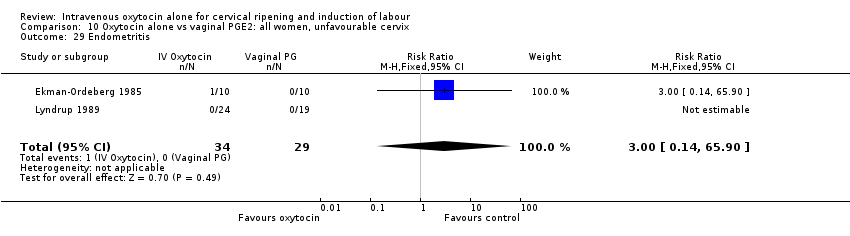
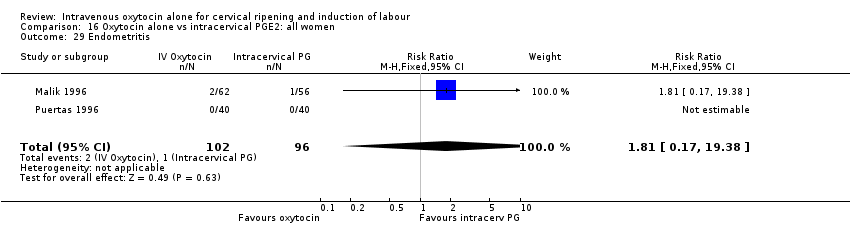
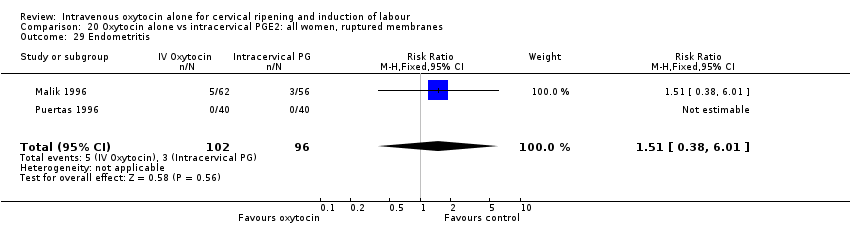
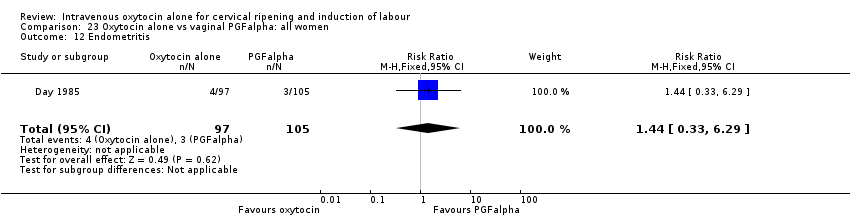
| 29 Endometritis Show forest plot | 6 | 2805 | Risk Ratio (M‐H, Fixed, 95% CI) | 0.84 [0.54, 1.32] |
|
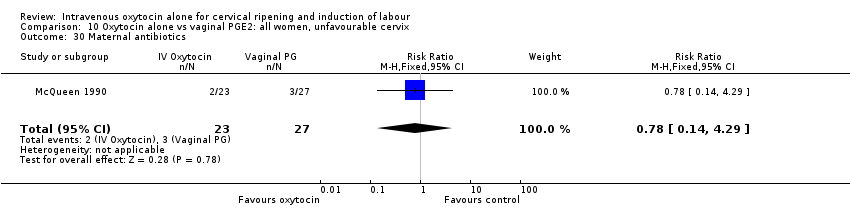
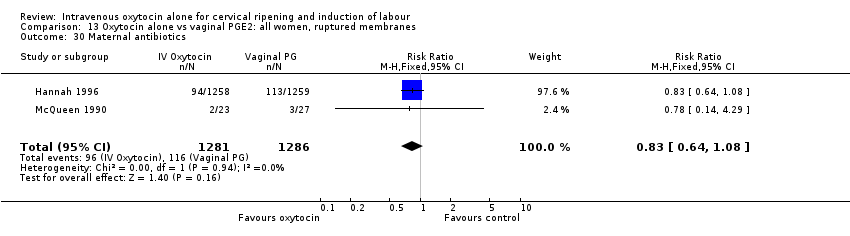
| 30 Maternal antibiotics Show forest plot | 2 | 2567 | Risk Ratio (M‐H, Fixed, 95% CI) | 0.83 [0.64, 1.08] |
|
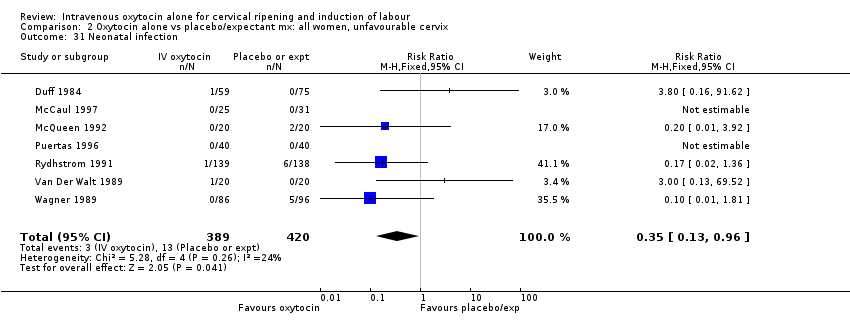
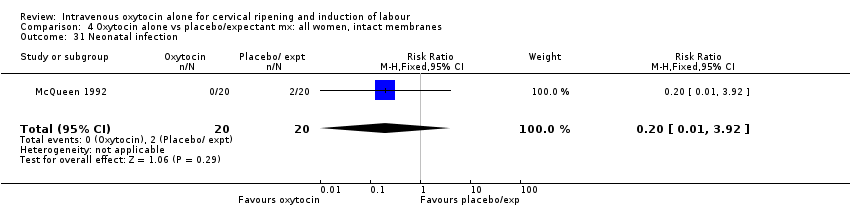
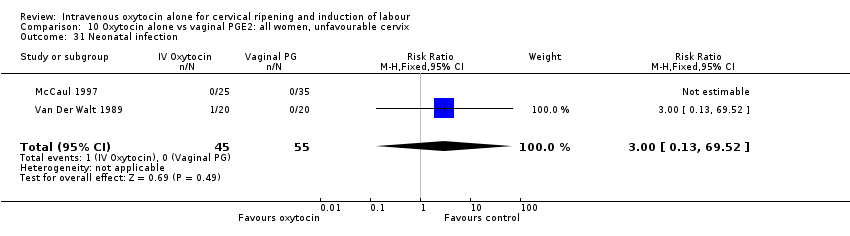
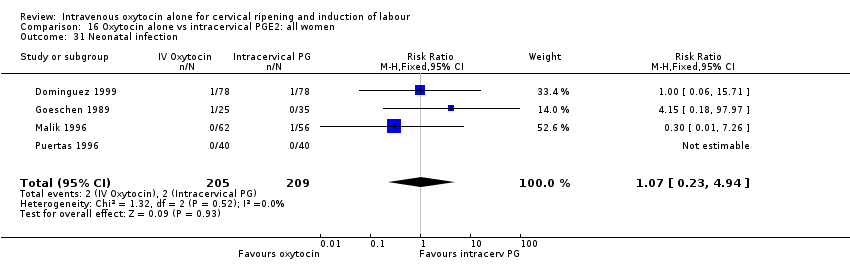
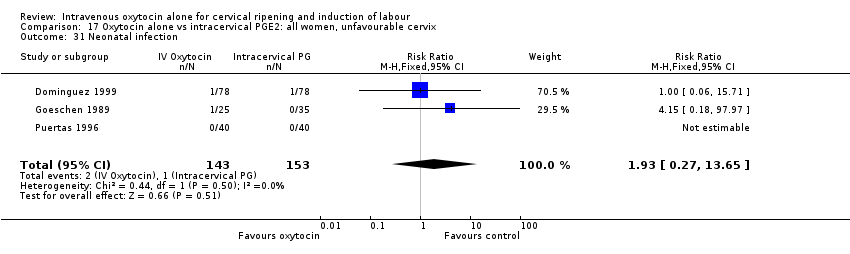
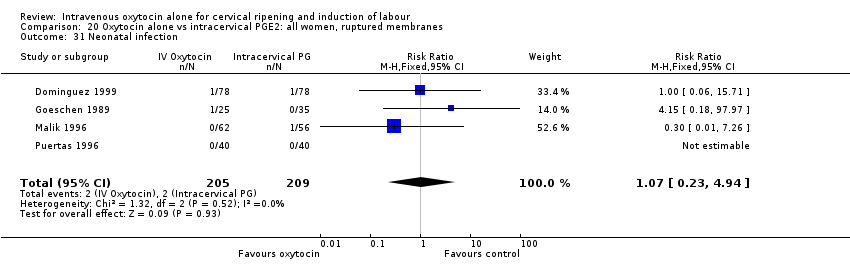
| 31 Neonatal infection Show forest plot | 7 | 2948 | Risk Ratio (M‐H, Fixed, 95% CI) | 0.68 [0.42, 1.09] |
|
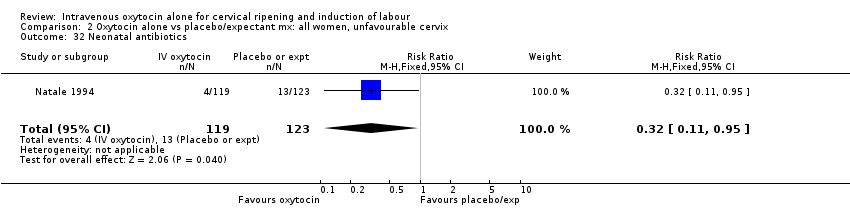
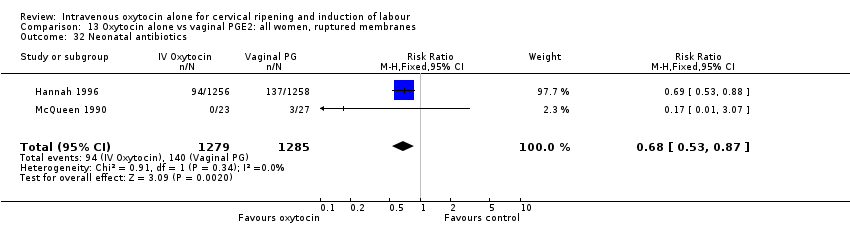
| 32 Neonatal antibiotics Show forest plot | 2 | 2564 | Risk Ratio (M‐H, Fixed, 95% CI) | 0.68 [0.53, 0.87] |
|
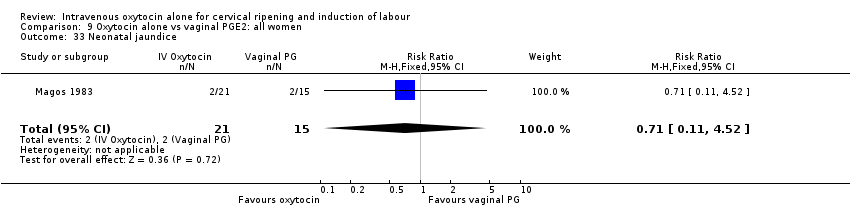
| 33 Neonatal jaundice Show forest plot | 1 | 36 | Risk Ratio (M‐H, Fixed, 95% CI) | 0.71 [0.11, 4.52] |
|
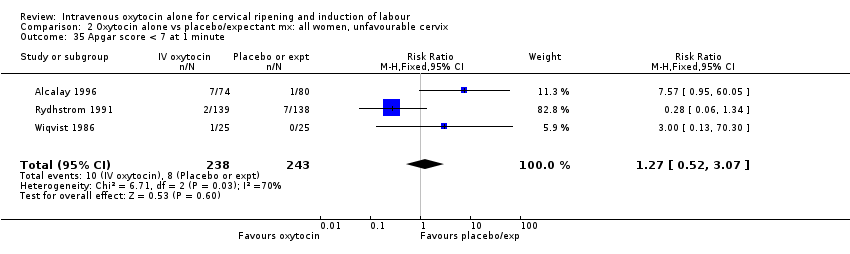
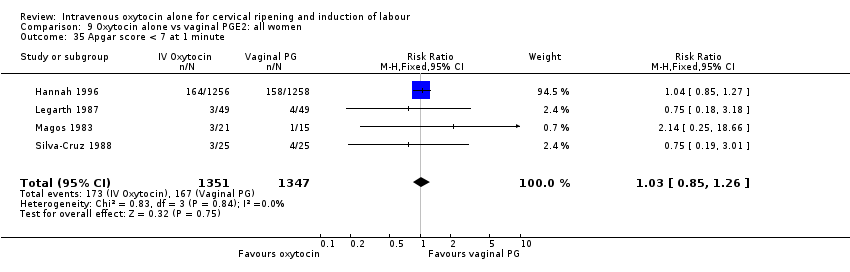
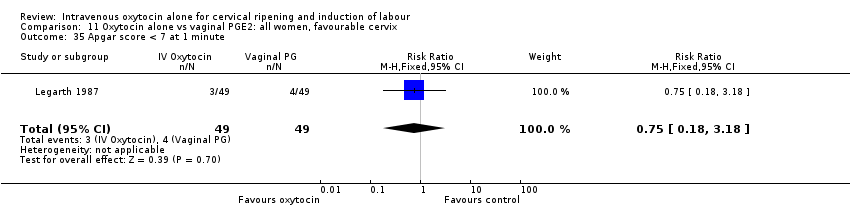
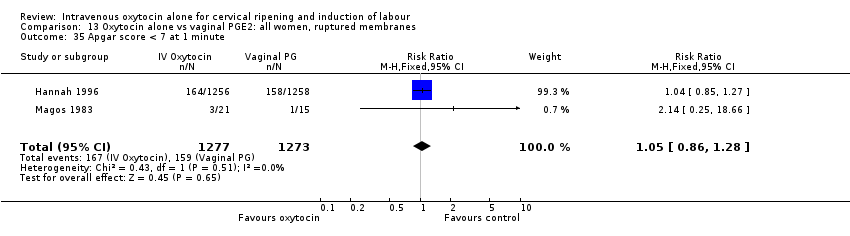
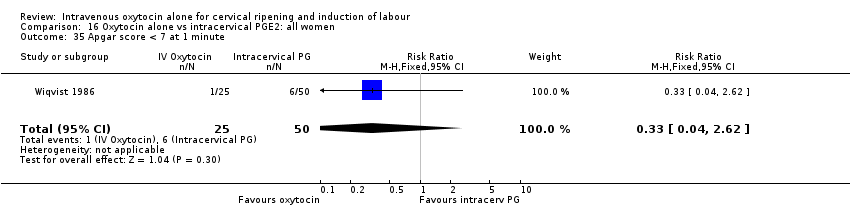
| 35 Apgar score < 7 at 1 minute Show forest plot | 4 | 2698 | Risk Ratio (M‐H, Fixed, 95% CI) | 1.03 [0.85, 1.26] |
|