Formas de administración de los antibióticos para las infecciones urinarias graves sintomáticas
Referencias
References to studies included in this review
References to studies excluded from this review
Additional references
References to other published versions of this review
Characteristics of studies
Characteristics of included studies [ordered by study ID]
Ir a:
| Methods | Prospective RCT at a tertiary care centre. | |
| Participants | INCLUSION CRITERIA EXCLUSION CRITERIA | |
| Interventions | TREATMENT GROUP 1 TREATMENT GROUP 2 | |
| Outcomes | 1. Clinical and bacteriological cure after 48 hours. | |
| Notes | Of 95 patients who met the inclusion criteria, 87 were enrolled (6 gave no consent, 2 were not petitioned). | |
| Risk of bias | ||
| Bias | Authors' judgement | Support for judgement |
| Allocation concealment (selection bias) | Low risk | A ‐ Adequate |
| Methods | Prospective RCT. | |
| Participants | INCLUSION CRITERIA EXCLUSION CRITERIA | |
| Interventions | GROUP 1 GROUP 2 | |
| Outcomes | 1. Clinical cure rate at end of therapy (clinical cure or improvement at end of therapy, bacteriologic eradication 5 to 9 days after therapy end). | |
| Notes | Of 63 patients enrolled, 23 were excluded from evaluation because of missing/sterile urine culture before or after therapy (20), pathogen resistant to study drug (2) or renal impairment (1). | |
| Risk of bias | ||
| Bias | Authors' judgement | Support for judgement |
| Allocation concealment (selection bias) | Low risk | A ‐ Adequate |
| Methods | Prospective RCT. | |
| Participants | INCLUSION CRITERIA EXCLUSION CRITERIA | |
| Interventions | GROUP 1 GROUP 2 | |
| Outcomes | 1. Number of patients with fever > 48 hours. | |
| Notes | No patient flow diagram. | |
| Risk of bias | ||
| Bias | Authors' judgement | Support for judgement |
| Allocation concealment (selection bias) | Unclear risk | B ‐ Unclear |
| Methods | Prospective, multicentre RCT. | |
| Participants | INCLUSION CRITERIA EXCLUSION CRITERIA | |
| Interventions | GROUP 1 GROUP 2 CO INTERVENTIONS | |
| Outcomes | 1. Cure rate defined as no clinical signs and bacteriological eradication 48 hours after end of treatment (n, %) and after interval of 20 to 30 days. | |
| Notes | Of 169 patients who met the inclusion criteria, 147 were randomised. | |
| Risk of bias | ||
| Bias | Authors' judgement | Support for judgement |
| Allocation concealment (selection bias) | Low risk | A ‐ Adequate |
| Methods | Prospective RCT at Paediatric University Hospital. | |
| Participants | INCLUSION CRITERIA | |
| Interventions | GROUP 1 GROUP 2 | |
| Outcomes | 1. Cure rate: defined as resolution of all signs and symptoms and eradication of pathogen at end of treatment and after 3 weeks. | |
| Notes | Symptoms of UTI not further specified. | |
| Risk of bias | ||
| Bias | Authors' judgement | Support for judgement |
| Allocation concealment (selection bias) | Unclear risk | B ‐ Unclear |
| Methods | Prospective, multicentre RCT. | |
| Participants | INCLUSION CRITERIA EXCLUSION CRITERIA | |
| Interventions | GROUP 1 GROUP 2 | |
| Outcomes | 1. Cessation of fever (hours, mean ± SD). | |
| Notes | Three children were not randomised because they were deemed too sick. | |
| Risk of bias | ||
| Bias | Authors' judgement | Support for judgement |
| Allocation concealment (selection bias) | Low risk | A ‐ Adequate |
| Methods | Prospective RCT at University hospital. | |
| Participants | INCLUSION CRITERIA EXCLUSION CRITERIA | |
| Interventions | GROUP 1 GROUP 2 CO INTERVENTIONS | |
| Outcomes | 1. Clinical cure during first 3 days. | |
| Notes | Of 120 patients enrolled, 1 patient each group had negative urine culture at beginning, 9 patients had no urine culture at beginning, 2 patients of Group 1 were given IV therapy because of sepsis, but all were analysed according to randomisation nevertheless (ITT). | |
| Risk of bias | ||
| Bias | Authors' judgement | Support for judgement |
| Allocation concealment (selection bias) | Low risk | A ‐ Adequate |
| Methods | Prospective, multicentre RCT at 4 community care centres. | |
| Participants | INCLUSION CRITERIA EXCLUSION CRITERIA | |
| Interventions | GROUP 1 GROUP 2 | |
| Outcomes | 1. Cessation of fever (days, mean, CI). | |
| Notes | Of 163 enrolled, 22 patients (11/group) were excluded from analysis. Of those, 19 patients did not fulfil inclusion criteria retrospectively, 2 had incomplete outcome data, 1 withdrew consent. 2 patients of each group had received other antibiotics within 24 hours before study begin and had negative urine culture at inclusion. | |
| Risk of bias | ||
| Bias | Authors' judgement | Support for judgement |
| Allocation concealment (selection bias) | Low risk | A ‐ Adequate |
| Methods | Prospective multicentre RCT. | |
| Participants | INCLUSION CRITERIA EXCLUSION CRITERIA | |
| Interventions | GROUP 1 GROUP 2 | |
| Outcomes | 1. Cessation of fever (hours mean, SD) | |
| Notes | Abstract only plus information from www.clinicaltrials.gov. | |
| Risk of bias | ||
| Bias | Authors' judgement | Support for judgement |
| Allocation concealment (selection bias) | Low risk | A ‐ Adequate |
| Methods | Prospective multicentre RCT. | |
| Participants | INCLUSION CRITERIA EXCLUSION CRITERIA | |
| Interventions | GROUP 1 GROUP 2 | |
| Outcomes | 1. Number of patients with renal scarring (DMSA) after 6 months. | |
| Notes | Of 365 children initially enrolled and randomised, 346 had an acute DMSA scan. | |
| Risk of bias | ||
| Bias | Authors' judgement | Support for judgement |
| Allocation concealment (selection bias) | Low risk | A ‐ Adequate |
| Methods | Prospective RCT in a tertiary care centre. | |
| Participants | INCLUSION CRITERIA EXCLUSION CRITERIA | |
| Interventions | GROUP 1 GROUP 2 | |
| Outcomes | 1. Combined clinical and microbiological cure rate at end of therapy. | |
| Notes | Of 30/30 patients enrolled, only 24 (group 1) received switch therapy. | |
| Risk of bias | ||
| Bias | Authors' judgement | Support for judgement |
| Allocation concealment (selection bias) | Unclear risk | B ‐ Unclear |
| Methods | Prospective RCT. | |
| Participants | INCLUSION CRITERIA EXCLUSION CRITERIA | |
| Interventions | GROUP 1 GROUP 2 | |
| Outcomes | 1. Bacteriological cure rate at end of treatment and after 4 week interval (n, %). | |
| Notes | Of 100 enrolled, 18 patients were excluded before or after randomisation (unclear). | |
| Risk of bias | ||
| Bias | Authors' judgement | Support for judgement |
| Allocation concealment (selection bias) | Unclear risk | B ‐ Unclear |
| Methods | Prospective multicentre RCT. | |
| Participants | INCLUSION CRITERIA EXCLUSION CRITERIA | |
| Interventions | GROUP 1 GROUP 2 | |
| Outcomes | 1. Clinical cure rate at end of therapy. | |
| Notes | Of 97 patients enrolled, 2 patients of parenteral group were excluded from analysis because of negative urine culture at beginning. | |
| Risk of bias | ||
| Bias | Authors' judgement | Support for judgement |
| Allocation concealment (selection bias) | Unclear risk | B ‐ Unclear |
| Methods | Prospective RCT at a tertiary care centre. | |
| Participants | INCLUSION CRITERIA EXCLUSION CRITERIA | |
| Interventions | GROUP 1 GROUP 2 | |
| Outcomes | 1. Clinical cure rate under therapy (after 3 days). | |
| Notes | Of 144 patients enrolled with clinical symptoms of UTI, 51 (group 1) and 54 (group 2) had a positive urine culture (others were excluded after randomisation). | |
| Risk of bias | ||
| Bias | Authors' judgement | Support for judgement |
| Allocation concealment (selection bias) | Unclear risk | B ‐ Unclear |
| Methods | Prospective RCT at a tertiary care centre. | |
| Participants | INCLUSION CRITERIA EXCLUSION CRITERIA | |
| Interventions | GROUP 1 GROUP 2 | |
| Outcomes | 1. Bacteriological cure rate at end of therapy (day 14). | |
| Notes | Of 100 patients, 64 were excluded before randomisation because of recurrent UTI (9), anatomical abnormalities (5), chronic disease (2), failure to notify (4), normal DMSA scan at beginning (18), negative urine culture (26). | |
| Risk of bias | ||
| Bias | Authors' judgement | Support for judgement |
| Allocation concealment (selection bias) | Unclear risk | B ‐ Unclear |
UTI ‐ urinary tract infection
Characteristics of excluded studies [ordered by study ID]
Ir a:
| Study | Reason for exclusion |
| Not an RCT (retrospective cohort study). | |
| RCT. | |
| RCT. | |
| RCT. | |
| Not an RCT. | |
| Not an RCT. | |
| RCT. | |
| RCT. | |
| RCT. | |
| RCT. | |
| Not an RCT. | |
| RCT. | |
| RCT. | |
| Stratified RCT. | |
| RCT. | |
| RCT. | |
| Not an RCT (sequential therapy group). | |
| RCT. | |
| RCT. | |
| RCT. | |
| Not an RCT. | |
| RCT. | |
| RCT. | |
| Not an RCT (retrospective cohort study). | |
| RCT. | |
| RCT. | |
| RCT. | |
| RCT. | |
| RCT. | |
| RCT. | |
| Not an RCT (pharmacokinetic study). | |
| Not an RCT (retrospective cohort study). | |
| Not an RCT (retrospective study). | |
| RCT. |
Data and analyses
| Outcome or subgroup title | No. of studies | No. of participants | Statistical method | Effect size |
| 1 Fever after 48 hours Show forest plot | 1 | Risk Ratio (M‐H, Random, 95% CI) | Totals not selected | |
| Analysis 1.1  Comparison 1 Switch versus parenteral therapy, Outcome 1 Fever after 48 hours. | ||||
| 2 Bacteriological cure under therapy Show forest plot | 1 | Risk Ratio (M‐H, Random, 95% CI) | Totals not selected | |
| Analysis 1.2  Comparison 1 Switch versus parenteral therapy, Outcome 2 Bacteriological cure under therapy. | ||||
| 3 Clinical cure at end of treatment Show forest plot | 2 | 137 | Risk Ratio (M‐H, Random, 95% CI) | 1.01 [0.94, 1.10] |
| Analysis 1.3  Comparison 1 Switch versus parenteral therapy, Outcome 3 Clinical cure at end of treatment. | ||||
| 4 Bacteriological cure at end of treatment Show forest plot | 2 | 76 | Risk Ratio (M‐H, Random, 95% CI) | 1.02 [0.92, 1.13] |
| Analysis 1.4  Comparison 1 Switch versus parenteral therapy, Outcome 4 Bacteriological cure at end of treatment. | ||||
| 5 Clinical and bacteriological cure at end of treatment Show forest plot | 4 | 294 | Risk Ratio (M‐H, Random, 95% CI) | 0.99 [0.94, 1.04] |
| Analysis 1.5  Comparison 1 Switch versus parenteral therapy, Outcome 5 Clinical and bacteriological cure at end of treatment. | ||||
| 6 Reinfection at end of treatment Show forest plot | 1 | Risk Ratio (M‐H, Random, 95% CI) | Totals not selected | |
| Analysis 1.6  Comparison 1 Switch versus parenteral therapy, Outcome 6 Reinfection at end of treatment. | ||||
| 7 Clinical and bacteriological cure after interval Show forest plot | 3 | 219 | Risk Ratio (M‐H, Random, 95% CI) | 0.99 [0.89, 1.11] |
| Analysis 1.7  Comparison 1 Switch versus parenteral therapy, Outcome 7 Clinical and bacteriological cure after interval. | ||||
| 7.1 Paediatric studies | 2 | 138 | Risk Ratio (M‐H, Random, 95% CI) | 1.03 [0.96, 1.10] |
| 7.2 Adult studies | 1 | 81 | Risk Ratio (M‐H, Random, 95% CI) | 0.92 [0.73, 1.16] |
| 8 Relapse after interval Show forest plot | 3 | 203 | Risk Ratio (M‐H, Random, 95% CI) | 2.79 [0.30, 25.67] |
| Analysis 1.8  Comparison 1 Switch versus parenteral therapy, Outcome 8 Relapse after interval. | ||||
| 9 Reinfection after interval Show forest plot | 4 | 239 | Risk Ratio (M‐H, Random, 95% CI) | 0.76 [0.30, 1.90] |
| Analysis 1.9  Comparison 1 Switch versus parenteral therapy, Outcome 9 Reinfection after interval. | ||||
| 10 Renal scarring (DMSA scan) after 6 months Show forest plot | 1 | Risk Ratio (M‐H, Random, 95% CI) | Totals not selected | |
| Analysis 1.10  Comparison 1 Switch versus parenteral therapy, Outcome 10 Renal scarring (DMSA scan) after 6 months. | ||||
| 11 Adverse events Show forest plot | 4 | 292 | Risk Ratio (M‐H, Random, 95% CI) | 0.85 [0.19, 3.83] |
| Analysis 1.11  Comparison 1 Switch versus parenteral therapy, Outcome 11 Adverse events. | ||||
| 11.1 Pediatric studies | 3 | 195 | Risk Ratio (M‐H, Random, 95% CI) | 0.67 [0.30, 1.53] |
| 11.2 Adult studies | 1 | 97 | Risk Ratio (M‐H, Random, 95% CI) | 12.24 [0.71, 211.37] |
| Outcome or subgroup title | No. of studies | No. of participants | Statistical method | Effect size |
| 1 Clinical and bacteriological cure under therapy Show forest plot | 3 | 599 | Risk Ratio (M‐H, Random, 95% CI) | 1.00 [0.98, 1.02] |
| Analysis 2.1  Comparison 2 Oral versus switch therapy, Outcome 1 Clinical and bacteriological cure under therapy. | ||||
| 2 Clinical and bacteriological cure at end of treatment Show forest plot | 1 | Risk Ratio (M‐H, Random, 95% CI) | Totals not selected | |
| Analysis 2.2  Comparison 2 Oral versus switch therapy, Outcome 2 Clinical and bacteriological cure at end of treatment. | ||||
| 3 Reinfection at end of treatment Show forest plot | 1 | Risk Ratio (M‐H, Random, 95% CI) | Totals not selected | |
| Analysis 2.3  Comparison 2 Oral versus switch therapy, Outcome 3 Reinfection at end of treatment. | ||||
| 4 Relapse at end of treatment Show forest plot | 1 | Risk Ratio (M‐H, Random, 95% CI) | Totals not selected | |
| Analysis 2.4  Comparison 2 Oral versus switch therapy, Outcome 4 Relapse at end of treatment. | ||||
| 5 Clinical and bacteriological cure rate after interval Show forest plot | 3 | 493 | Risk Ratio (M‐H, Random, 95% CI) | 0.97 [0.93, 1.01] |
| Analysis 2.5  Comparison 2 Oral versus switch therapy, Outcome 5 Clinical and bacteriological cure rate after interval. | ||||
| 6 Reinfection after interval Show forest plot | 2 | Risk Ratio (M‐H, Random, 95% CI) | Subtotals only | |
| Analysis 2.6  Comparison 2 Oral versus switch therapy, Outcome 6 Reinfection after interval. | ||||
| 6.1 Symptomatic superinfection | 1 | 287 | Risk Ratio (M‐H, Random, 95% CI) | 0.67 [0.27, 1.67] |
| 6.2 Symptomatic and asymptomatic superinfection | 2 | 341 | Risk Ratio (M‐H, Random, 95% CI) | 0.64 [0.29, 1.42] |
| 7 Relapse after interval Show forest plot | 1 | Risk Ratio (M‐H, Random, 95% CI) | Totals not selected | |
| Analysis 2.7  Comparison 2 Oral versus switch therapy, Outcome 7 Relapse after interval. | ||||
| 8 Renal scarring (DMSA scan) after 6 months Show forest plot | 2 | 424 | Risk Ratio (M‐H, Random, 95% CI) | 0.87 [0.35, 2.16] |
| Analysis 2.8  Comparison 2 Oral versus switch therapy, Outcome 8 Renal scarring (DMSA scan) after 6 months. | ||||
| 9 Mean time to cessation of fever (hours) Show forest plot | 3 | 834 | Mean Difference (IV, Random, 95% CI) | 0.40 [‐2.94, 3.74] |
| Analysis 2.9  Comparison 2 Oral versus switch therapy, Outcome 9 Mean time to cessation of fever (hours). | ||||
| 10 Adverse events Show forest plot | 2 | 506 | Risk Ratio (M‐H, Random, 95% CI) | 0.96 [0.06, 15.02] |
| Analysis 2.10  Comparison 2 Oral versus switch therapy, Outcome 10 Adverse events. | ||||
| Outcome or subgroup title | No. of studies | No. of participants | Statistical method | Effect size |
| 1 Bacteriological cure at end of treatment Show forest plot | 1 | Risk Ratio (M‐H, Random, 95% CI) | Totals not selected | |
| Analysis 3.1  Comparison 3 Oral versus parenteral therapy, Outcome 1 Bacteriological cure at end of treatment. | ||||
| 2 Bacteriological cure after interval Show forest plot | 1 | Risk Ratio (M‐H, Random, 95% CI) | Totals not selected | |
| Analysis 3.2  Comparison 3 Oral versus parenteral therapy, Outcome 2 Bacteriological cure after interval. | ||||
| Outcome or subgroup title | No. of studies | No. of participants | Statistical method | Effect size |
| 1 Clinical cure under therapy Show forest plot | 2 | 225 | Risk Ratio (M‐H, Random, 95% CI) | 0.93 [0.86, 1.02] |
| Analysis 4.1  Comparison 4 Single shot/oral versus switch therapy, Outcome 1 Clinical cure under therapy. | ||||
| 2 Bacterial cure under therapy Show forest plot | 1 | Risk Ratio (M‐H, Random, 95% CI) | Totals not selected | |
| Analysis 4.2  Comparison 4 Single shot/oral versus switch therapy, Outcome 2 Bacterial cure under therapy. | ||||
| 3 Mean time to cessation of fever (days) Show forest plot | 1 | Mean Difference (IV, Random, 95% CI) | Totals not selected | |
| Analysis 4.3  Comparison 4 Single shot/oral versus switch therapy, Outcome 3 Mean time to cessation of fever (days). | ||||
| 4 Mean time of clinical symptoms (days) Show forest plot | 1 | Mean Difference (IV, Random, 95% CI) | Totals not selected | |
| Analysis 4.4  Comparison 4 Single shot/oral versus switch therapy, Outcome 4 Mean time of clinical symptoms (days). | ||||
| 5 Clinical cure at end of therapy Show forest plot | 1 | Risk Ratio (M‐H, Random, 95% CI) | Totals not selected | |
| Analysis 4.5  Comparison 4 Single shot/oral versus switch therapy, Outcome 5 Clinical cure at end of therapy. | ||||
| 6 Bacterial cure at end of therapy Show forest plot | 1 | Risk Ratio (M‐H, Random, 95% CI) | Totals not selected | |
| Analysis 4.6  Comparison 4 Single shot/oral versus switch therapy, Outcome 6 Bacterial cure at end of therapy. | ||||
| 7 Adverse events Show forest plot | 2 | 225 | Risk Ratio (M‐H, Random, 95% CI) | 4.00 [0.46, 34.75] |
| Analysis 4.7  Comparison 4 Single shot/oral versus switch therapy, Outcome 7 Adverse events. | ||||
| Outcome or subgroup title | No. of studies | No. of participants | Statistical method | Effect size |
| 1 Clinical and bacteriological cure under therapy Show forest plot | 1 | Risk Ratio (M‐H, Random, 95% CI) | Totals not selected | |
| Analysis 5.1  Comparison 5 Single shot/oral versus oral therapy, Outcome 1 Clinical and bacteriological cure under therapy. | ||||
| 2 Bacteriological cure under therapy Show forest plot | 1 | Risk Ratio (M‐H, Random, 95% CI) | Totals not selected | |
| Analysis 5.2  Comparison 5 Single shot/oral versus oral therapy, Outcome 2 Bacteriological cure under therapy. | ||||
| 3 Reinfection or relapse after interval Show forest plot | 1 | Risk Ratio (M‐H, Random, 95% CI) | Totals not selected | |
| Analysis 5.3  Comparison 5 Single shot/oral versus oral therapy, Outcome 3 Reinfection or relapse after interval. | ||||
| 4 Adverse events Show forest plot | 1 | Risk Ratio (M‐H, Random, 95% CI) | Totals not selected | |
| Analysis 5.4  Comparison 5 Single shot/oral versus oral therapy, Outcome 4 Adverse events. | ||||
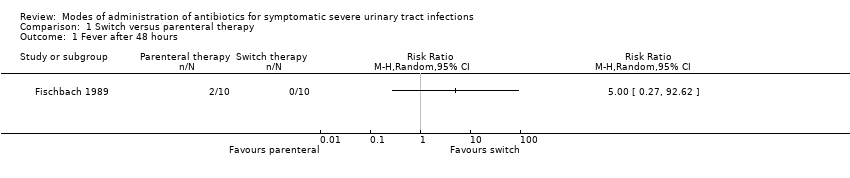
Comparison 1 Switch versus parenteral therapy, Outcome 1 Fever after 48 hours.

Comparison 1 Switch versus parenteral therapy, Outcome 2 Bacteriological cure under therapy.

Comparison 1 Switch versus parenteral therapy, Outcome 3 Clinical cure at end of treatment.
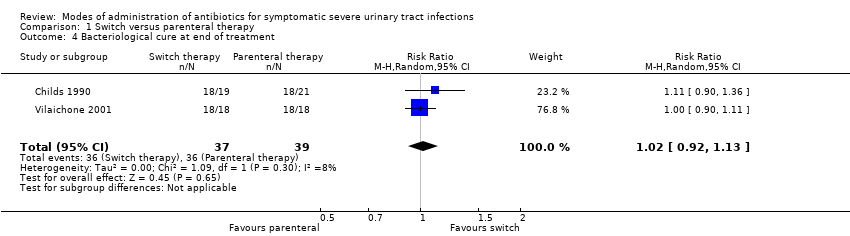
Comparison 1 Switch versus parenteral therapy, Outcome 4 Bacteriological cure at end of treatment.
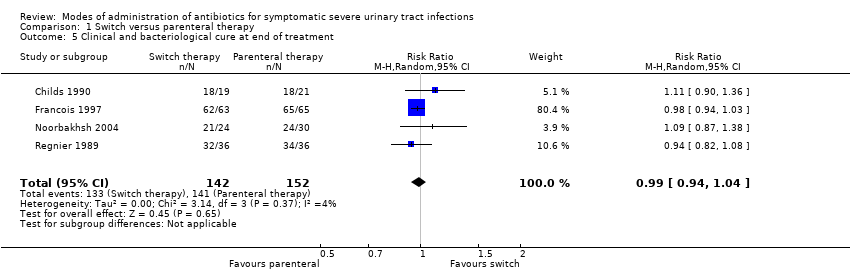
Comparison 1 Switch versus parenteral therapy, Outcome 5 Clinical and bacteriological cure at end of treatment.

Comparison 1 Switch versus parenteral therapy, Outcome 6 Reinfection at end of treatment.

Comparison 1 Switch versus parenteral therapy, Outcome 7 Clinical and bacteriological cure after interval.
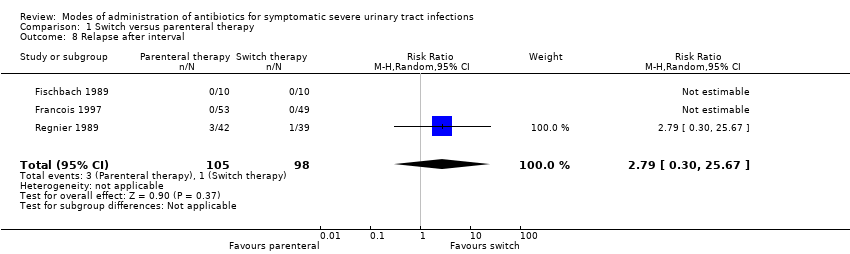
Comparison 1 Switch versus parenteral therapy, Outcome 8 Relapse after interval.

Comparison 1 Switch versus parenteral therapy, Outcome 9 Reinfection after interval.

Comparison 1 Switch versus parenteral therapy, Outcome 10 Renal scarring (DMSA scan) after 6 months.

Comparison 1 Switch versus parenteral therapy, Outcome 11 Adverse events.

Comparison 2 Oral versus switch therapy, Outcome 1 Clinical and bacteriological cure under therapy.

Comparison 2 Oral versus switch therapy, Outcome 2 Clinical and bacteriological cure at end of treatment.

Comparison 2 Oral versus switch therapy, Outcome 3 Reinfection at end of treatment.

Comparison 2 Oral versus switch therapy, Outcome 4 Relapse at end of treatment.
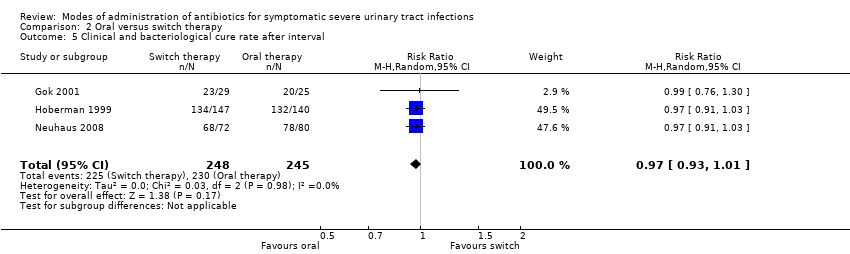
Comparison 2 Oral versus switch therapy, Outcome 5 Clinical and bacteriological cure rate after interval.

Comparison 2 Oral versus switch therapy, Outcome 6 Reinfection after interval.

Comparison 2 Oral versus switch therapy, Outcome 7 Relapse after interval.
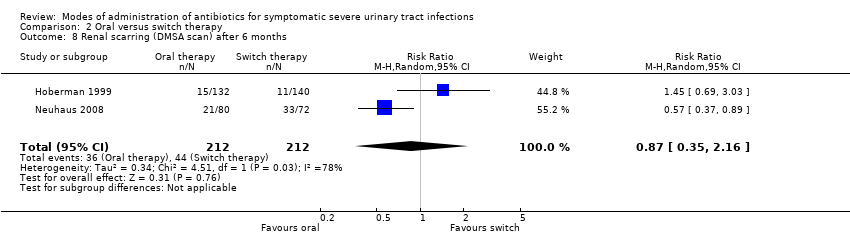
Comparison 2 Oral versus switch therapy, Outcome 8 Renal scarring (DMSA scan) after 6 months.
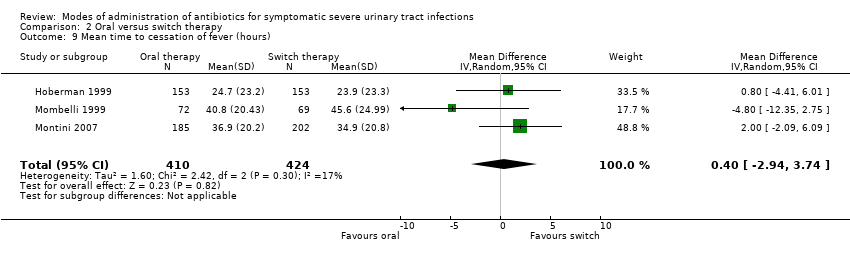
Comparison 2 Oral versus switch therapy, Outcome 9 Mean time to cessation of fever (hours).

Comparison 2 Oral versus switch therapy, Outcome 10 Adverse events.

Comparison 3 Oral versus parenteral therapy, Outcome 1 Bacteriological cure at end of treatment.

Comparison 3 Oral versus parenteral therapy, Outcome 2 Bacteriological cure after interval.
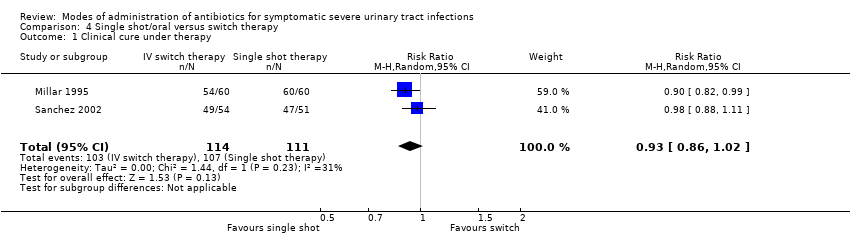
Comparison 4 Single shot/oral versus switch therapy, Outcome 1 Clinical cure under therapy.
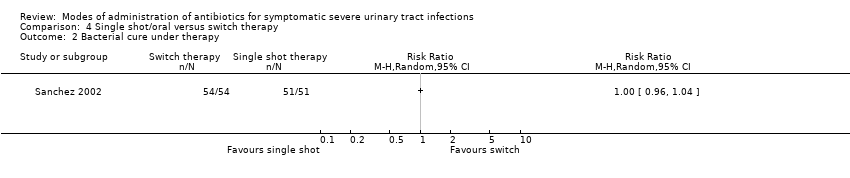
Comparison 4 Single shot/oral versus switch therapy, Outcome 2 Bacterial cure under therapy.
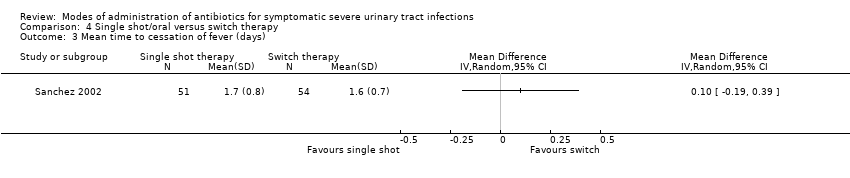
Comparison 4 Single shot/oral versus switch therapy, Outcome 3 Mean time to cessation of fever (days).

Comparison 4 Single shot/oral versus switch therapy, Outcome 4 Mean time of clinical symptoms (days).

Comparison 4 Single shot/oral versus switch therapy, Outcome 5 Clinical cure at end of therapy.

Comparison 4 Single shot/oral versus switch therapy, Outcome 6 Bacterial cure at end of therapy.

Comparison 4 Single shot/oral versus switch therapy, Outcome 7 Adverse events.
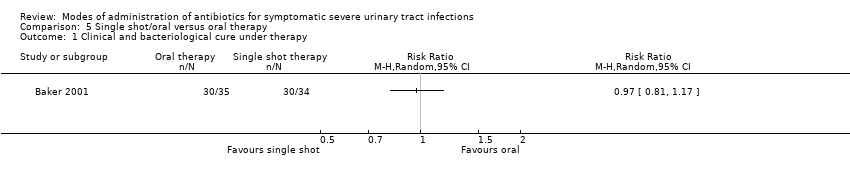
Comparison 5 Single shot/oral versus oral therapy, Outcome 1 Clinical and bacteriological cure under therapy.
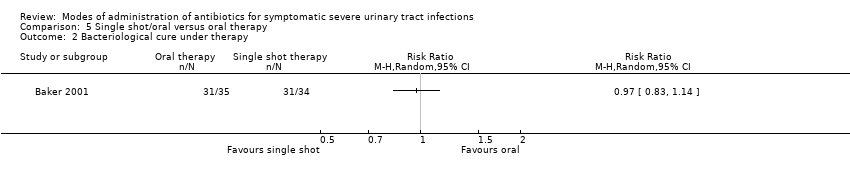
Comparison 5 Single shot/oral versus oral therapy, Outcome 2 Bacteriological cure under therapy.
Comparison 5 Single shot/oral versus oral therapy, Outcome 3 Reinfection or relapse after interval.

Comparison 5 Single shot/oral versus oral therapy, Outcome 4 Adverse events.
| Study ID | Concealed allocation | Blinding patients | Blinding clinicians | Blinding outcomes | Intention‐to‐treat | Enrolled/evaluated | Dropouts |
| Adequate | No | Yes | Yes | No | 87/69 | 4/73 (5%) | |
| Adequate | No | No | Not stated | No | 63/40 | 7/63 (11%) | |
| Unclear | No | No | Not stated | Not stated | ?/20 | 0% | |
| Adequate | No | No | Not stated (blinded in case of ambiguity and resolution by third party) | No | 147/128 | Group 1: 7 (11%) | |
| Unclear | No | No | Not stated | Not stated | ?/54 | Unclear | |
| Adequate | No | No | Yes | Yes | 306/306‐272 (depending on outcome) | Group 1: 21 (14%) Group 2: 13 (8%) | |
| Adequate | No | No | Yes | Yes | 120/110 | Group 1: 3 (5%) Group 2: 7 (12%) | |
| Adequate | No | No | Yes | No | 163/141 | 2/141 (1%) | |
| Adequate | No | No | Not stated | Not stated | 387(=88% sample size)/387 | 0% | |
| Adequate | No | No | Yes | No | 365/152 | 86/365 (24% | |
| Unclear | No | No | Yes | No | 60/54 | 0% | |
| Unclear | No | No | Not stated | No (Unclear) | 100/82 (number included in this review: 38) | 0% | |
| Unclear | No | No | Not stated | No | 97/95 (81 after interval) | Group 1: 6 (12.5%) Group 2: 8 (17%) | |
| Unclear | No | No | Not stated | No | 144/105 | 0% | |
| Unclear | No | No | Not stated | Yes | 36/36 | 0% |
| Outcome or subgroup title | No. of studies | No. of participants | Statistical method | Effect size |
| 1 Fever after 48 hours Show forest plot | 1 | Risk Ratio (M‐H, Random, 95% CI) | Totals not selected | |
| 2 Bacteriological cure under therapy Show forest plot | 1 | Risk Ratio (M‐H, Random, 95% CI) | Totals not selected | |
| 3 Clinical cure at end of treatment Show forest plot | 2 | 137 | Risk Ratio (M‐H, Random, 95% CI) | 1.01 [0.94, 1.10] |
| 4 Bacteriological cure at end of treatment Show forest plot | 2 | 76 | Risk Ratio (M‐H, Random, 95% CI) | 1.02 [0.92, 1.13] |
| 5 Clinical and bacteriological cure at end of treatment Show forest plot | 4 | 294 | Risk Ratio (M‐H, Random, 95% CI) | 0.99 [0.94, 1.04] |
| 6 Reinfection at end of treatment Show forest plot | 1 | Risk Ratio (M‐H, Random, 95% CI) | Totals not selected | |
| 7 Clinical and bacteriological cure after interval Show forest plot | 3 | 219 | Risk Ratio (M‐H, Random, 95% CI) | 0.99 [0.89, 1.11] |
| 7.1 Paediatric studies | 2 | 138 | Risk Ratio (M‐H, Random, 95% CI) | 1.03 [0.96, 1.10] |
| 7.2 Adult studies | 1 | 81 | Risk Ratio (M‐H, Random, 95% CI) | 0.92 [0.73, 1.16] |
| 8 Relapse after interval Show forest plot | 3 | 203 | Risk Ratio (M‐H, Random, 95% CI) | 2.79 [0.30, 25.67] |
| 9 Reinfection after interval Show forest plot | 4 | 239 | Risk Ratio (M‐H, Random, 95% CI) | 0.76 [0.30, 1.90] |
| 10 Renal scarring (DMSA scan) after 6 months Show forest plot | 1 | Risk Ratio (M‐H, Random, 95% CI) | Totals not selected | |
| 11 Adverse events Show forest plot | 4 | 292 | Risk Ratio (M‐H, Random, 95% CI) | 0.85 [0.19, 3.83] |
| 11.1 Pediatric studies | 3 | 195 | Risk Ratio (M‐H, Random, 95% CI) | 0.67 [0.30, 1.53] |
| 11.2 Adult studies | 1 | 97 | Risk Ratio (M‐H, Random, 95% CI) | 12.24 [0.71, 211.37] |
| Outcome or subgroup title | No. of studies | No. of participants | Statistical method | Effect size |
| 1 Clinical and bacteriological cure under therapy Show forest plot | 3 | 599 | Risk Ratio (M‐H, Random, 95% CI) | 1.00 [0.98, 1.02] |
| 2 Clinical and bacteriological cure at end of treatment Show forest plot | 1 | Risk Ratio (M‐H, Random, 95% CI) | Totals not selected | |
| 3 Reinfection at end of treatment Show forest plot | 1 | Risk Ratio (M‐H, Random, 95% CI) | Totals not selected | |
| 4 Relapse at end of treatment Show forest plot | 1 | Risk Ratio (M‐H, Random, 95% CI) | Totals not selected | |
| 5 Clinical and bacteriological cure rate after interval Show forest plot | 3 | 493 | Risk Ratio (M‐H, Random, 95% CI) | 0.97 [0.93, 1.01] |
| 6 Reinfection after interval Show forest plot | 2 | Risk Ratio (M‐H, Random, 95% CI) | Subtotals only | |
| 6.1 Symptomatic superinfection | 1 | 287 | Risk Ratio (M‐H, Random, 95% CI) | 0.67 [0.27, 1.67] |
| 6.2 Symptomatic and asymptomatic superinfection | 2 | 341 | Risk Ratio (M‐H, Random, 95% CI) | 0.64 [0.29, 1.42] |
| 7 Relapse after interval Show forest plot | 1 | Risk Ratio (M‐H, Random, 95% CI) | Totals not selected | |
| 8 Renal scarring (DMSA scan) after 6 months Show forest plot | 2 | 424 | Risk Ratio (M‐H, Random, 95% CI) | 0.87 [0.35, 2.16] |
| 9 Mean time to cessation of fever (hours) Show forest plot | 3 | 834 | Mean Difference (IV, Random, 95% CI) | 0.40 [‐2.94, 3.74] |
| 10 Adverse events Show forest plot | 2 | 506 | Risk Ratio (M‐H, Random, 95% CI) | 0.96 [0.06, 15.02] |
| Outcome or subgroup title | No. of studies | No. of participants | Statistical method | Effect size |
| 1 Bacteriological cure at end of treatment Show forest plot | 1 | Risk Ratio (M‐H, Random, 95% CI) | Totals not selected | |
| 2 Bacteriological cure after interval Show forest plot | 1 | Risk Ratio (M‐H, Random, 95% CI) | Totals not selected | |
| Outcome or subgroup title | No. of studies | No. of participants | Statistical method | Effect size |
| 1 Clinical cure under therapy Show forest plot | 2 | 225 | Risk Ratio (M‐H, Random, 95% CI) | 0.93 [0.86, 1.02] |
| 2 Bacterial cure under therapy Show forest plot | 1 | Risk Ratio (M‐H, Random, 95% CI) | Totals not selected | |
| 3 Mean time to cessation of fever (days) Show forest plot | 1 | Mean Difference (IV, Random, 95% CI) | Totals not selected | |
| 4 Mean time of clinical symptoms (days) Show forest plot | 1 | Mean Difference (IV, Random, 95% CI) | Totals not selected | |
| 5 Clinical cure at end of therapy Show forest plot | 1 | Risk Ratio (M‐H, Random, 95% CI) | Totals not selected | |
| 6 Bacterial cure at end of therapy Show forest plot | 1 | Risk Ratio (M‐H, Random, 95% CI) | Totals not selected | |
| 7 Adverse events Show forest plot | 2 | 225 | Risk Ratio (M‐H, Random, 95% CI) | 4.00 [0.46, 34.75] |
| Outcome or subgroup title | No. of studies | No. of participants | Statistical method | Effect size |
| 1 Clinical and bacteriological cure under therapy Show forest plot | 1 | Risk Ratio (M‐H, Random, 95% CI) | Totals not selected | |
| 2 Bacteriological cure under therapy Show forest plot | 1 | Risk Ratio (M‐H, Random, 95% CI) | Totals not selected | |
| 3 Reinfection or relapse after interval Show forest plot | 1 | Risk Ratio (M‐H, Random, 95% CI) | Totals not selected | |
| 4 Adverse events Show forest plot | 1 | Risk Ratio (M‐H, Random, 95% CI) | Totals not selected | |