Espesante de alimentos para neonatos de hasta seis meses de edad con reflujo gastroesofágico
Información
- DOI:
- https://doi.org/10.1002/14651858.CD003211.pub2Copiar DOI

- Base de datos:
-
- Cochrane Database of Systematic Reviews
- Versión publicada:
-
- 05 diciembre 2017see what's new
- Tipo:
-
- Intervention
- Etapa:
-
- Review
- Grupo Editorial Cochrane:
-
Grupo Cochrane de Neonatología
- Copyright:
-
- Copyright © 2017 The Cochrane Collaboration. Published by John Wiley & Sons, Ltd.
Cifras del artículo
Altmetric:
Citado por:
Autores
Contributions of authors
T'ng Chang Kwok: undertook literature searching and critical appraisal of studies, wrote review.
Shalini Ojha: undertook literature searching and critical appraisal of studies, co‐wrote review.
Jon Dorling: oversaw the project, resolved differences that occurred during the review, co‐wrote review.
Sources of support
Internal sources
-
Academic Division of Child Health, University of Nottingham, UK.
External sources
-
Cochrane Neonatal Review Group, Canada.
-
National Institute for Health Research, UK.
Editorial support for Cochrane Neonatal has been funded by a UK National Institute of Health Research Grant (NIHR) Cochrane Programme Grant (13/89/12). The views expressed in this publication are those of the authors and not necessarily those of the National Health Service (NHS), the NIHR, or the UK Department of Health.
Declarations of interest
T'ng Chang Kwok: none to declare.
Shalini Ojha: none to declare.
Jon Dorling: none to declare.
Acknowledgements
We would like to thank the Cochrane Neonatal Review Group for help with literature review. We would also like to thank Prof Vandenplas, Prof Moya, Prof Vanderhoof, Dr Miller, Prof Carroccio, and Dr Tolia for providing further information regarding their trials that was not published in the original manuscript.
Version history
| Published | Title | Stage | Authors | Version |
| 2017 Dec 05 | Feed thickener for infants up to six months of age with gastro‐oesophageal reflux | Review | T'ng Chang Kwok, Shalini Ojha, Jon Dorling | |
| 2002 Jul 22 | Feed thickener for newborn infants with gastro‐oesophageal reflux | Review | Rae‐Chi Huang, David Forbes, Mark W Davies | |
Differences between protocol and review
We have made the following changes since the last update of the review in 2002.
-
We expanded the age criteria for the participants from 'full‐term infants less than 28 days and preterm infants up to 44 weeks corrected age’ to ‘full‐term infants less than six months and preterm infants up to six months corrected age’, because the majority of infants present with uncomplicated reflux only after the first two to three weeks of life (Meunier 2014; Vandenplas 2009; Vandenplas 2015). Reassurance and parental education is the usual first‐line management for uncomplicated reflux (Vandenplas 2015), and feed thickeners are rarely started in the first 28 days of life. We used the six‐month cut‐off due to the natural progression of GOR, which is believed to start improving by six months of age, when the infant starts on a more solid diet and achieves neurodevelopmental maturation to maintain a more upright posture (Nelson 1997).
-
We included Gaviscon Infant (alginate preparation without antacid) as an eligible intervention for inclusion in the review. We excluded other preparations of Gaviscon or alginate with antacid components. Gaviscon Infant works primarily by thickening the feed and does not have antacid properties, unlike other preparations of Gaviscon. We performed a subgroup analysis to determine if the results differed when trials investigating Gaviscon Infant as feed thickener were excluded.
-
We streamlined the primary outcomes to three outcome measures that we felt to be important to parents, caregivers, and clinicians. They were: i) regurgitation, posseting, or vomiting; ii) failure to thrive; and iii) reflux index. We analysed the remaining outcome measures as secondary outcome measures.
-
We also noted number of episodes per day of: i) regurgitation, posseting, vomiting, or haematemesis; ii) respiratory symptoms (cough, apnoeas, and recurrent oxygen desaturation); and iii) bradycardias as continuous and separate outcomes. We used change from baseline measurements in preference to final measurements.
-
We did not assess cough as a side effect of feed thickener, as it was already considered to be a symptom of GOR.
-
We carried out sensitivity analyses to explore the effect of change from baseline versus endpoint values on the analysis.
Keywords
MeSH
Medical Subject Headings (MeSH) Keywords
Medical Subject Headings Check Words
Humans; Infant; Infant, Newborn;
PICO
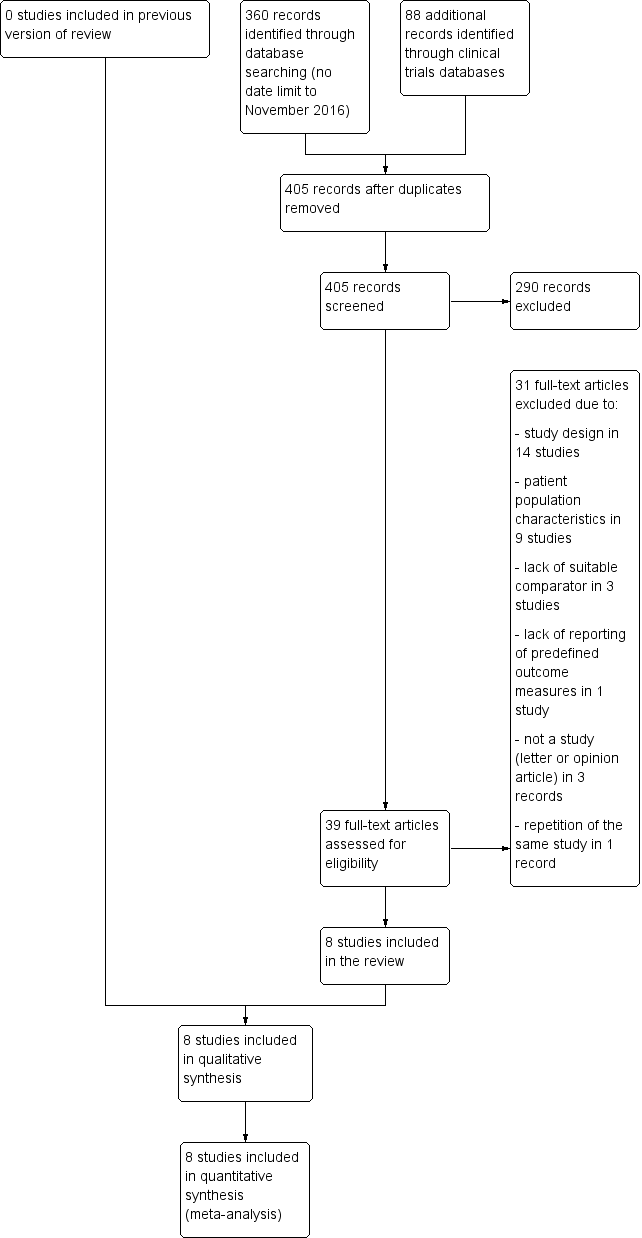
Study flow diagram.
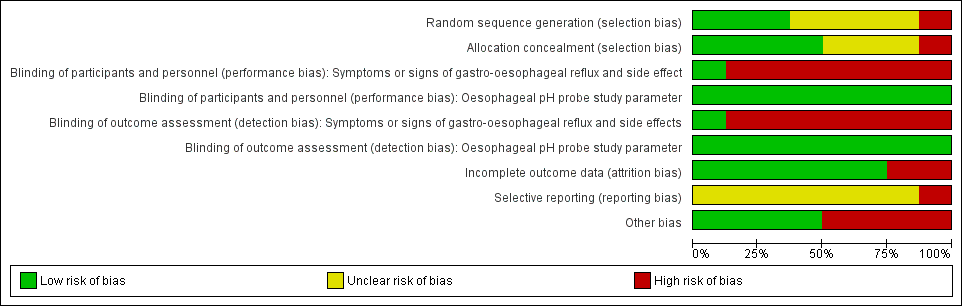
Risk of bias graph: review authors' judgements about each risk of bias item presented as percentages across all included studies.

Forest plot of comparison: 1 Regurgitation, posseting, or vomiting, outcome: 1.1 Number of episodes per day.
Assumptions
1. There was insufficient information in Chao 2007 to report the change of baseline value, hence we used the endpoint data instead. Change from baseline value was used for the remaining five studies, where P value was used to determine the standard deviation for the change from baseline value.
2. Frequency of regurgitation rather than vomiting was used for the Xinias 2005 study.
3. In Miller 1999, median number of episodes of regurgitation was reported rather than the mean value. As the sample size was more than 25, it was assumed that median and mean were similar (Hozo 2005), and the standard deviation for the mean difference was obtained using the reported P value (Higgins 2011).
4. We halved control groups for Hegar 2008 and Moya 1999, as these were three‐arm trials involving one control and two intervention arms.
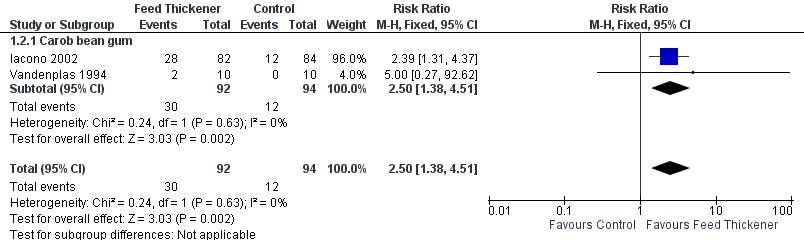
Forest plot of comparison: 1 Regurgitation, posseting, or vomiting, outcome: 1.2 Proportion of asymptomatic infants.

Forest plot of comparison: 2 Oesophageal pH probe study parameters, outcome: 2.1 Reflux index (percentage of time pH < 4).
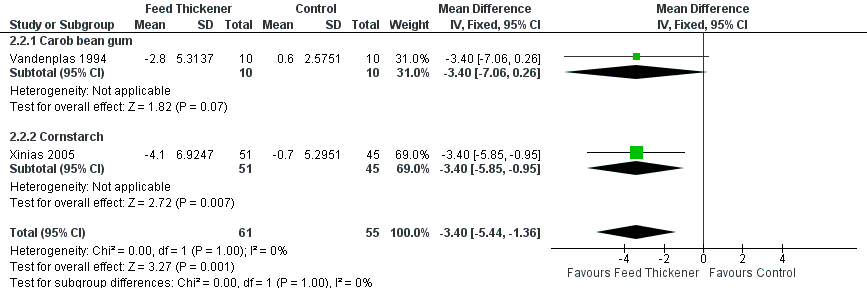
Forest plot of comparison: 2 Oesophageal pH probe study parameters, outcome: 2.2 Number of reflux episodes lasting > 5 minutes.
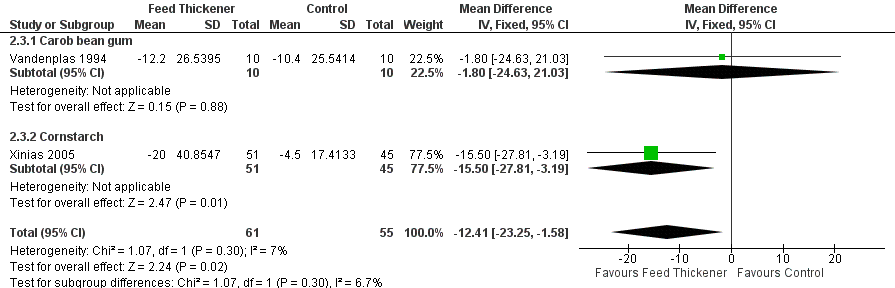
Forest plot of comparison: 2 Oesophageal pH probe study parameters, outcome: 2.3 Duration of longest reflux episode (minutes).
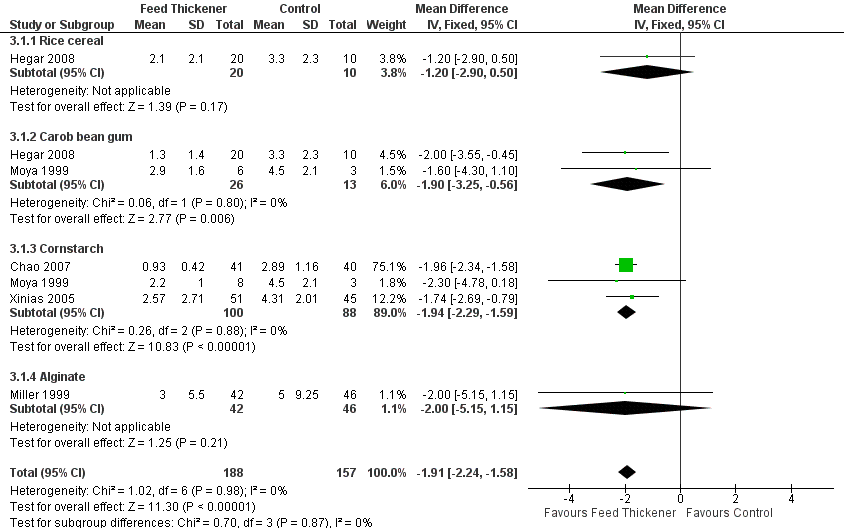
Forest plot of comparison: 3 Sensitivity analysis, outcome: 3.1 Endpoint value ‐ number of episodes of regurgitation, posseting, or vomiting per day.

Comparison 1 Regurgitation, posseting, or vomiting, Outcome 1 Number of episodes per day.

Comparison 1 Regurgitation, posseting, or vomiting, Outcome 2 Proportion of asymptomatic infants.

Comparison 2 Oesophageal pH probe study parameters, Outcome 1 Reflux Index (percentage of time pH < 4).

Comparison 2 Oesophageal pH probe study parameters, Outcome 2 Number of reflux episodes lasting > 5 minutes.
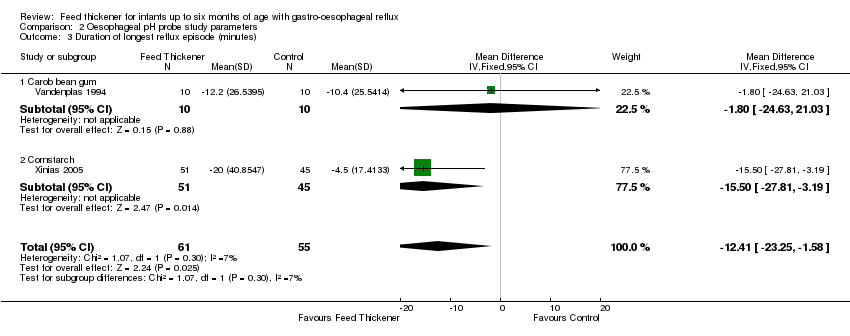
Comparison 2 Oesophageal pH probe study parameters, Outcome 3 Duration of longest reflux episode (minutes).

Comparison 3 Sensitivity analysis, Outcome 1 Endpoint value ‐ number of episodes of regurgitation, posseting, or vomiting per day.
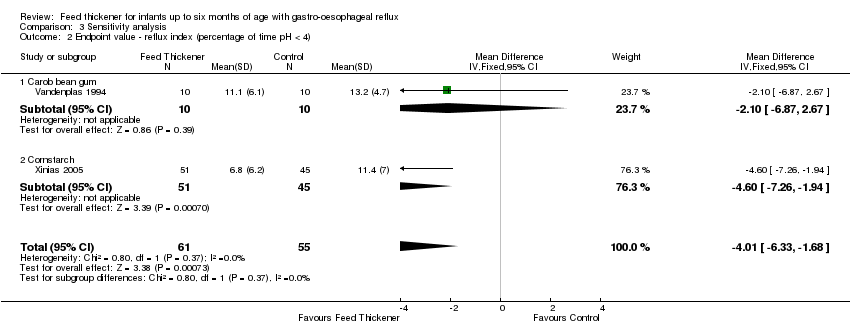
Comparison 3 Sensitivity analysis, Outcome 2 Endpoint value ‐ reflux index (percentage of time pH < 4).
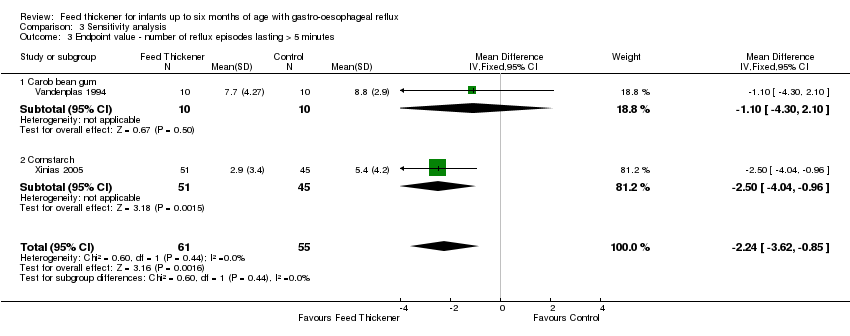
Comparison 3 Sensitivity analysis, Outcome 3 Endpoint value ‐ number of reflux episodes lasting > 5 minutes.
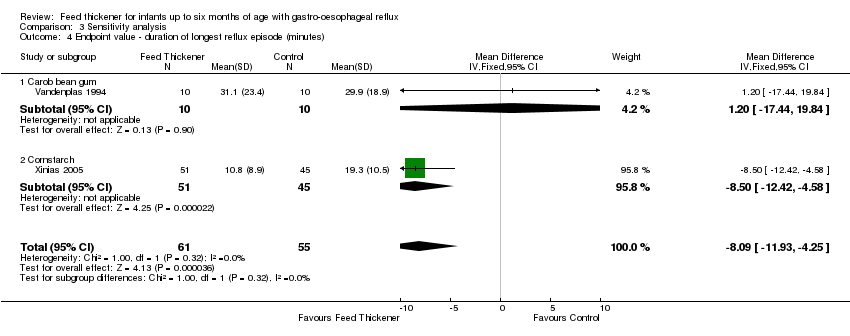
Comparison 3 Sensitivity analysis, Outcome 4 Endpoint value ‐ duration of longest reflux episode (minutes).
| Feed thickener compared to control for infants up to 6 months of age with gastro‐oesophageal reflux | ||||||
| Patient or population: Formula‐fed healthy term infants up to 6 months of age with gastro‐oesophageal reflux | ||||||
| Outcomes | Anticipated absolute effects* (95% CI) | Relative effect | № of participants | Quality of the evidence | Comments | |
| Risk with control | Risk with feed thickener | |||||
| Number of episodes of regurgitation or vomiting per day | The mean number of episodes of regurgitation or vomiting per day was 3 episodes per day. | MD 1.97 episodes per day lower | ‐ | 442 | ⊕⊕⊕⊝ | Change from baseline value was used for 5 studies. Endpoint value was used for the remaining study due to insufficient data (Chao 2007). Frequency of regurgitation value was used in preference to frequency of vomiting in 1 study (Xinias 2005). |
| Proportion of infants without regurgitation or vomiting at the end of intervention period (asymptomatic infants) | Study population | RR 2.50 | 186 | ⊕⊕⊝⊝ | ||
| 128 per 1000 | 319 per 1000 | |||||
| Reflux index (percentage of time pH < 4) assessed with oesophageal pH probe study | The mean reflux index was 12%. | MD 5.08% lower | ‐ | 116 | ⊕⊕⊝⊝ | Higher reflux index indicates higher percentage of total time that oesophageal pH is less than 4. |
| Number of reflux episodes lasting > 5 minutes assessed with oesophageal pH probe study | The mean number of reflux episodes lasting > 5 minutes was 6 episodes. | MD 3.4 episodes lower | ‐ | 116 | ⊕⊕⊝⊝ | |
| Duration of longest reflux episode | The mean duration of longest reflux episode was 20 minutes. | MD 12.41 minutes lower | ‐ | 116 | ⊕⊕⊝⊝ | |
| Diarrhoea | ‐ | ‐ | 511 | ⊕⊕⊝⊝ | Insufficient data to perform analysis. No difference in diarrhoea incidence or stooling frequency in 4 studies. 17% of infants in the intervention group in Iacono 2002 and 10% of total infants in Hegar 2008 withdrew due to diarrhoea. | |
| *The risk in the intervention group (and its 95% CI) is based on the assumed risk in the comparison group and the relative effect of the intervention (and its 95% CI). | ||||||
| GRADE Working Group grades of evidence | ||||||
| 1Downgraded one level for serious study limitation. There was unclear risk of bias for allocation concealment and high risk of bias for blinding, as frequency of regurgitation was dependent on parental report, who were likely to note the higher viscosity of the thickened formula. | ||||||
| Outcome or subgroup title | No. of studies | No. of participants | Statistical method | Effect size |
| 1 Number of episodes per day Show forest plot | 6 | 442 | Mean Difference (IV, Fixed, 95% CI) | ‐1.97 [‐2.32, ‐1.61] |
| 1.1 Rice cereal | 2 | 127 | Mean Difference (IV, Fixed, 95% CI) | ‐1.43 [‐3.36, 0.49] |
| 1.2 Carob bean gum | 2 | 39 | Mean Difference (IV, Fixed, 95% CI) | ‐1.47 [‐3.13, 0.19] |
| 1.3 Cornstarch | 3 | 188 | Mean Difference (IV, Fixed, 95% CI) | ‐1.98 [‐2.35, ‐1.61] |
| 1.4 Alginate | 1 | 88 | Mean Difference (IV, Fixed, 95% CI) | ‐3.5 [‐6.07, ‐0.93] |
| 2 Proportion of asymptomatic infants Show forest plot | 2 | 186 | Risk Ratio (M‐H, Fixed, 95% CI) | 2.50 [1.38, 4.51] |
| 2.1 Carob bean gum | 2 | 186 | Risk Ratio (M‐H, Fixed, 95% CI) | 2.50 [1.38, 4.51] |
| Outcome or subgroup title | No. of studies | No. of participants | Statistical method | Effect size |
| 1 Reflux Index (percentage of time pH < 4) Show forest plot | 2 | 116 | Mean Difference (IV, Fixed, 95% CI) | ‐5.08 [‐8.89, ‐1.28] |
| 1.1 Carob bean gum | 1 | 20 | Mean Difference (IV, Fixed, 95% CI) | ‐3.90 [‐9.36, 1.56] |
| 1.2 Cornstarch | 1 | 96 | Mean Difference (IV, Fixed, 95% CI) | ‐6.20 [‐11.50, ‐0.90] |
| 2 Number of reflux episodes lasting > 5 minutes Show forest plot | 2 | 116 | Mean Difference (IV, Fixed, 95% CI) | ‐3.40 [‐5.44, ‐1.36] |
| 2.1 Carob bean gum | 1 | 20 | Mean Difference (IV, Fixed, 95% CI) | ‐3.4 [‐7.06, 0.26] |
| 2.2 Cornstarch | 1 | 96 | Mean Difference (IV, Fixed, 95% CI) | ‐3.40 [‐5.85, ‐0.95] |
| 3 Duration of longest reflux episode (minutes) Show forest plot | 2 | 116 | Mean Difference (IV, Fixed, 95% CI) | ‐12.41 [‐23.25, ‐1.58] |
| 3.1 Carob bean gum | 1 | 20 | Mean Difference (IV, Fixed, 95% CI) | ‐1.80 [‐24.63, 21.03] |
| 3.2 Cornstarch | 1 | 96 | Mean Difference (IV, Fixed, 95% CI) | ‐15.5 [‐27.81, ‐3.19] |
| Outcome or subgroup title | No. of studies | No. of participants | Statistical method | Effect size |
| 1 Endpoint value ‐ number of episodes of regurgitation, posseting, or vomiting per day Show forest plot | 5 | 345 | Mean Difference (IV, Fixed, 95% CI) | ‐1.91 [‐2.24, ‐1.58] |
| 1.1 Rice cereal | 1 | 30 | Mean Difference (IV, Fixed, 95% CI) | ‐1.20 [‐2.90, 0.50] |
| 1.2 Carob bean gum | 2 | 39 | Mean Difference (IV, Fixed, 95% CI) | ‐1.90 [‐3.25, ‐0.56] |
| 1.3 Cornstarch | 3 | 188 | Mean Difference (IV, Fixed, 95% CI) | ‐1.94 [‐2.29, ‐1.59] |
| 1.4 Alginate | 1 | 88 | Mean Difference (IV, Fixed, 95% CI) | ‐2.0 [‐5.15, 1.15] |
| 2 Endpoint value ‐ reflux index (percentage of time pH < 4) Show forest plot | 2 | 116 | Mean Difference (IV, Fixed, 95% CI) | ‐4.01 [‐6.33, ‐1.68] |
| 2.1 Carob bean gum | 1 | 20 | Mean Difference (IV, Fixed, 95% CI) | ‐2.10 [‐6.87, 2.67] |
| 2.2 Cornstarch | 1 | 96 | Mean Difference (IV, Fixed, 95% CI) | ‐4.60 [‐7.26, ‐1.94] |
| 3 Endpoint value ‐ number of reflux episodes lasting > 5 minutes Show forest plot | 2 | 116 | Mean Difference (IV, Fixed, 95% CI) | ‐2.24 [‐3.62, ‐0.85] |
| 3.1 Carob bean gum | 1 | 20 | Mean Difference (IV, Fixed, 95% CI) | ‐1.10 [‐4.30, 2.10] |
| 3.2 Cornstarch | 1 | 96 | Mean Difference (IV, Fixed, 95% CI) | ‐2.50 [‐4.04, ‐0.96] |
| 4 Endpoint value ‐ duration of longest reflux episode (minutes) Show forest plot | 2 | 116 | Mean Difference (IV, Fixed, 95% CI) | ‐8.09 [‐11.93, ‐4.25] |
| 4.1 Carob bean gum | 1 | 20 | Mean Difference (IV, Fixed, 95% CI) | 1.20 [‐17.44, 19.84] |
| 4.2 Cornstarch | 1 | 96 | Mean Difference (IV, Fixed, 95% CI) | ‐8.5 [‐12.42, ‐4.58] |