Intervenciones médicas para el glaucoma de ángulo abierto primario y la hipertensión ocular
Referencias
References to studies included in this review
References to studies excluded from this review
References to studies awaiting assessment
Additional references
Characteristics of studies
Characteristics of included studies [ordered by study ID]
Ir a:
| Methods | RCT. | |
| Participants | 47 participants with newly diagnosed OAG or OHT. | |
| Interventions | Timolol 0.5% twice daily. | |
| Outcomes | Incidence of optic cup enlargement or disc haemorrhage (stereophoto). | |
| Notes | Mean follow up 33 months. | |
| Risk of bias | ||
| Bias | Authors' judgement | Support for judgement |
| Allocation concealment? | Low risk | A ‐ Adequate |
| Methods | RCT. | |
| Participants | 20 people with POAG. | |
| Interventions | Timolol 0.5% twice daily. | |
| Outcomes | Change of visual field mean sensitivity, IOP. | |
| Notes | 2 years follow up | |
| Risk of bias | ||
| Bias | Authors' judgement | Support for judgement |
| Allocation concealment? | Unclear risk | B ‐ Unclear |
| Methods | RCT. | |
| Participants | 19 people with OHT or POAG (n=5). | |
| Interventions | Timolol 0.5& twice daily. | |
| Outcomes | Change of visual field mean sensitivity. | |
| Notes | 4 years follow up. | |
| Risk of bias | ||
| Bias | Authors' judgement | Support for judgement |
| Allocation concealment? | Unclear risk | B ‐ Unclear |
| Methods | RCT. | |
| Participants | 68 people with POAG, proportion of PEX and PDS unknown. | |
| Interventions | Timolol 0.5% BID. | |
| Outcomes | Change in visual field mean defect. | |
| Notes | 2 years follow up. | |
| Risk of bias | ||
| Bias | Authors' judgement | Support for judgement |
| Allocation concealment? | Unclear risk | B ‐ Unclear |
| Methods | RCT. | |
| Participants | 1081 people with OHT. | |
| Interventions | Dorzolamide 2% 3 times daily. | |
| Outcomes | Incidence of reproducible visual field defects. | |
| Notes | Median follow up 55.3 months. | |
| Risk of bias | ||
| Bias | Authors' judgement | Support for judgement |
| Allocation concealment? | Low risk | A ‐ Adequate |
| Methods | RCT. | |
| Participants | 107 participants with OHT. | |
| Interventions | Timolol 0.5% twice daily. | |
| Outcomes | Incidence of IOP above 32 mmHg on two separate occasions. | |
| Notes | Mean follow up was 56 months in timolol group and 51 months in untreated group. | |
| Risk of bias | ||
| Bias | Authors' judgement | Support for judgement |
| Allocation concealment? | Low risk | A ‐ Adequate |
| Methods | RCT. | |
| Participants | 36 people with OAG. | |
| Interventions | Timolol 0.5% twice daily. | |
| Outcomes | Change of visual field mean sensitivity. | |
| Notes | 12 months follow up. | |
| Risk of bias | ||
| Bias | Authors' judgement | Support for judgement |
| Allocation concealment? | Unclear risk | B ‐ Unclear |
| Methods | RCT. | |
| Participants | 120 patients with OAG (72 were evaluated). | |
| Interventions | Timolol 0.5% twice daily. | |
| Outcomes | Change of visual field mean sensitivity. | |
| Notes | 12 months follow up. | |
| Risk of bias | ||
| Bias | Authors' judgement | Support for judgement |
| Allocation concealment? | Low risk | A ‐ Adequate |
| Methods | RCT. | |
| Participants | 51 participants with OAG or OHT (1 patient). | |
| Interventions | Timolol 0.5% twice daily. | |
| Outcomes | IOP control. | |
| Notes | Allocation concealment deemed likely, based on double‐masked design. | |
| Risk of bias | ||
| Bias | Authors' judgement | Support for judgement |
| Allocation concealment? | Low risk | A ‐ Adequate |
| Methods | RCT. | |
| Participants | 90 people with OHT, 37% (timolol group) and 23% (placebo group) had PEX or PDS. | |
| Interventions | Timolol 0,5% twice daily. | |
| Outcomes | Incidence of glaucomatous visual field defect. | |
| Notes | 10 years follow up, for better comparability with the other trials data concerning 5 years follow up were used for meta‐analysis. | |
| Risk of bias | ||
| Bias | Authors' judgement | Support for judgement |
| Allocation concealment? | Low risk | A ‐ Adequate |
| Methods | RCT. | |
| Participants | 44 participants, all Caucasian. | |
| Interventions | Timolol 0.5% twice daily. | |
| Outcomes | Change of visual field mean sensitivity and mean defect. | |
| Notes | Allocation concealment deemed likely, based on double‐masked design. | |
| Risk of bias | ||
| Bias | Authors' judgement | Support for judgement |
| Allocation concealment? | Low risk | A ‐ Adequate |
| Methods | RCT. | |
| Participants | 356 participants with OHT. | |
| Interventions | Betaxolol 0.5% twice daily. | |
| Outcomes | Incidence of reproducible glaucomatous visual field defect. | |
| Notes | Median follow‐up time 60 months (for those completing the trial). | |
| Risk of bias | ||
| Bias | Authors' judgement | Support for judgement |
| Allocation concealment? | Low risk | A ‐ Adequate |
| Methods | RCT. | |
| Participants | 62 participants with OHT (6% with PEX). | |
| Interventions | Timolol 0.25% or 0.5% twice daily. | |
| Outcomes | Incidence of reproducible glaucomatous visual field defect (Goldmann kinetic and static perimetry with Humphrey 30‐2 and Octopus 32). | |
| Notes | Mean follow up 56.1 months. | |
| Risk of bias | ||
| Bias | Authors' judgement | Support for judgement |
| Allocation concealment? | Low risk | A ‐ Adequate |
| Methods | RCT. | |
| Participants | 1636 participants with OHT. | |
| Interventions | Any topical medical antiglaucomatous treatment. | |
| Outcomes | Incidence of reproducible visual field defects or reproducible deterioration of optic discs attributable to POAG. | |
| Notes | Median follow up 6 years. | |
| Risk of bias | ||
| Bias | Authors' judgement | Support for judgement |
| Allocation concealment? | Low risk | A ‐ Adequate |
| Methods | RCT. | |
| Participants | 20 participants with OHT. | |
| Interventions | Timolol 0.5% twice daily. | |
| Outcomes | Incidence of glaucomatous visual field defect. | |
| Notes | Allocation concealment deemed likely, based on double‐masked design. | |
| Risk of bias | ||
| Bias | Authors' judgement | Support for judgement |
| Allocation concealment? | Low risk | A ‐ Adequate |
| Methods | RCT. | |
| Participants | 483 participants with POAG (55%) or OHT. | |
| Interventions | Brimonidine 0.2% twice daily. | |
| Outcomes | IOP. | |
| Notes | Allocation concealment deemed likely, based on double‐masked design. | |
| Risk of bias | ||
| Bias | Authors' judgement | Support for judgement |
| Allocation concealment? | Low risk | A ‐ Adequate |
| Methods | RCT. | |
| Participants | 391 participants with OAG or OHT (65%). | |
| Interventions | Levobunolol 0.5% twice daily. | |
| Outcomes | IOP. | |
| Notes | Allocation concealment deemed likely, based on double‐masked design. | |
| Risk of bias | ||
| Bias | Authors' judgement | Support for judgement |
| Allocation concealment? | Low risk | A ‐ Adequate |
| Methods | RCT. | |
| Participants | 26 paricipants with OHT. | |
| Interventions | Levobunolol 0.5% twice daily. | |
| Outcomes | IOP. | |
| Notes | 24 months follow up, but considerable attrition at 24 months. | |
| Risk of bias | ||
| Bias | Authors' judgement | Support for judgement |
| Allocation concealment? | Unclear risk | B ‐ Unclear |
| Methods | RCT. | |
| Participants | 137 people with OHT. | |
| Interventions | Timolol 0.5% twice daily. | |
| Outcomes | Incidence of reproducible visual field defect. | |
| Notes | 6 years follow up. | |
| Risk of bias | ||
| Bias | Authors' judgement | Support for judgement |
| Allocation concealment? | Unclear risk | B ‐ Unclear |
| Methods | RCT. | |
| Participants | 374 people with POAG (62%) or OHT (only 188 participants examined with perimetry twice). | |
| Interventions | Brimonidine 0.2% twice daily. | |
| Outcomes | IOP. | |
| Notes | 1 year follow up. | |
| Risk of bias | ||
| Bias | Authors' judgement | Support for judgement |
| Allocation concealment? | Low risk | A ‐ Adequate |
| Methods | RCT. | |
| Participants | 37 participants with OHT. | |
| Interventions | Timolol 0,5% twice daily. | |
| Outcomes | Change of optic disk cupping (photogrammetric measurement). | |
| Notes | Study duration 2 years, but effective mean duration 1.5 years. | |
| Risk of bias | ||
| Bias | Authors' judgement | Support for judgement |
| Allocation concealment? | Low risk | A ‐ Adequate |
| Methods | RCT. | |
| Participants | 36 people with POAG. | |
| Interventions | Timolol 0.25% or 0.5% twice daily (adjustment according to IOP). | |
| Outcomes | IOP control. | |
| Notes | Study duration 17 months. Due to early miotic intolerance, the follow‐up groups comprised 14 patients on pilocarpine, as compared to 22 patients on timolol. The number of originally included subjects is not stated. | |
| Risk of bias | ||
| Bias | Authors' judgement | Support for judgement |
| Allocation concealment? | Unclear risk | B ‐ Unclear |
| Methods | RCT. | |
| Participants | 39 participants with POAG. | |
| Interventions | Timolol 0.5% ophthalmic gel‐forming solution once daily. | |
| Outcomes | Change in RNFL thickness (ellipse average, superior average, temporal average, inferior average, nasal average). | |
| Notes | Study duration 2 years. | |
| Risk of bias | ||
| Bias | Authors' judgement | Support for judgement |
| Allocation concealment? | Unclear risk | B ‐ Unclear |
| Methods | RCT. | |
| Participants | 189 people with POAG. | |
| Interventions | Timolol 0.25% or 0.5% twice daily (adjustment according to IOP). | |
| Outcomes | Change of visual field mean sensitivity. | |
| Notes | Study duration 2 years. Observer masked status is questionable because of miosis. | |
| Risk of bias | ||
| Bias | Authors' judgement | Support for judgement |
| Allocation concealment? | Unclear risk | B ‐ Unclear |
| Methods | RCT. | |
| Participants | 153 participants with newly diagnosed OAG. | |
| Interventions | Timolol 0.25% twice daily. | |
| Outcomes | Change of visual field mean deviation. | |
| Notes | Median follow up: timolol group 42 months, betaxolol group 24 months, carteolol group 36 months. | |
| Risk of bias | ||
| Bias | Authors' judgement | Support for judgement |
| Allocation concealment? | Low risk | A ‐ Adequate |
| Methods | RCT. | |
| Participants | 34 participants with OHT and open angles and 25 participants with OHT and narrow angles. | |
| Interventions | Timolol 0.5% twice daily one eye. | |
| Outcomes | Incidence of glaucomatous visual field defects or optic disc damage. | |
| Notes | 6 years follow‐up. | |
| Risk of bias | ||
| Bias | Authors' judgement | Support for judgement |
| Allocation concealment? | Unclear risk | B ‐ Unclear |
c/d ratio: cup to disk ratio
IOP: intraocular pressure
MD: mean defect
mmHG: millimetres mercury
OAG: open angle glaucoma
OHT: ocular hypertension
PDS: pigment dispersion syndrome
PEX: pseudoexfoliation
CLV: corrected loss variation
POAG: primary open angle glaucoma
RCT: randomised controlled trial
RNFL: retinal nerve fibre layer
SAP: standard automated perimetry
Characteristics of excluded studies [ordered by study ID]
Ir a:
| Study | Reason for exclusion |
| 60% of the included patients had NTG. | |
| This RCT included patients with OAG irrespectively to their IOP. Almost 50% of the subjects were NTG patients. Additionally the trial included also patients with PEX. The study intervention also included laser treatment in one group. | |
| The study compares medical treatment with no treatment. The treatment allowed use of timolol, pilocarpine and a supplementation with acetazolamide. | |
| This trial included both NTG and POAG with elevated IOP |
IOP: intraocular pressure
NTG: normal tension glaucoma
OAG: open angle glaucoma
POAG: primary open angle glaucoma
PEX: pseudoexfoliation
RCT: randomised controlled trial
Data and analyses
| Outcome or subgroup title | No. of studies | No. of participants | Statistical method | Effect size |
| 1 Incidence of visual field defect progression Show forest plot | 8 | 935 | Peto Odds Ratio (Peto, Fixed, 95% CI) | 0.67 [0.45, 1.00] |
| Analysis 1.1  Comparison 1 Beta‐blockers versus placebo or untreated, Outcome 1 Incidence of visual field defect progression. | ||||
| 1.1 Timolol versus placebo or untreated | 7 | 579 | Peto Odds Ratio (Peto, Fixed, 95% CI) | 0.66 [0.41, 1.05] |
| 1.2 Betaxolol versus placebo or untreated | 1 | 356 | Peto Odds Ratio (Peto, Fixed, 95% CI) | 0.70 [0.32, 1.51] |
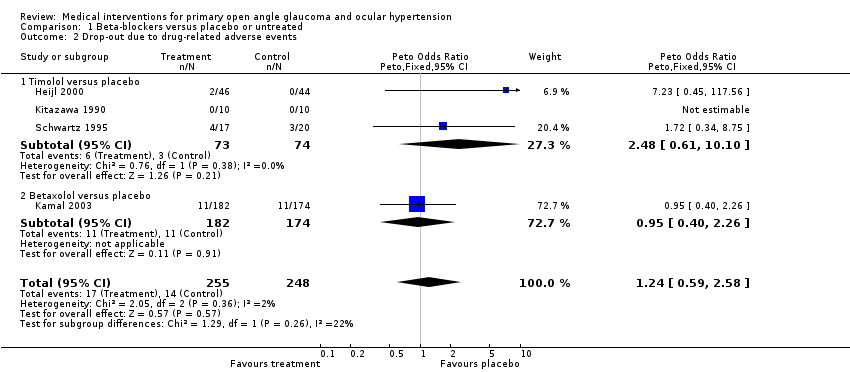
| 2 Drop‐out due to drug‐related adverse events Show forest plot | 4 | 503 | Peto Odds Ratio (Peto, Fixed, 95% CI) | 1.24 [0.59, 2.58] |
| Analysis 1.2  Comparison 1 Beta‐blockers versus placebo or untreated, Outcome 2 Drop‐out due to drug‐related adverse events. | ||||
| 2.1 Timolol versus placebo | 3 | 147 | Peto Odds Ratio (Peto, Fixed, 95% CI) | 2.48 [0.61, 10.10] |
| 2.2 Betaxolol versus placebo | 1 | 356 | Peto Odds Ratio (Peto, Fixed, 95% CI) | 0.95 [0.40, 2.26] |
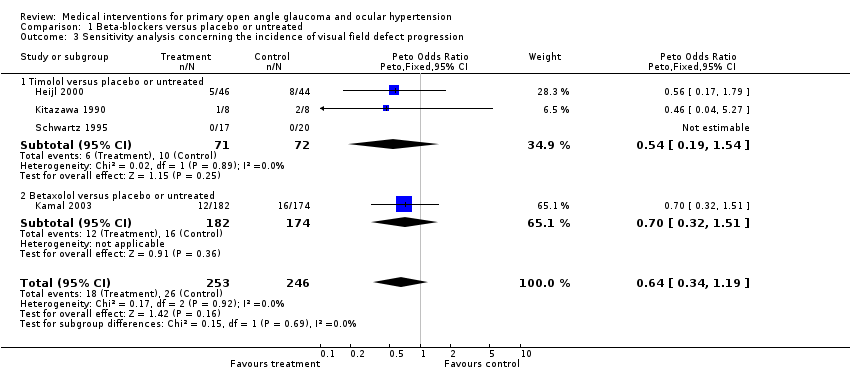
| 3 Sensitivity analysis concerning the incidence of visual field defect progression Show forest plot | 4 | 499 | Peto Odds Ratio (Peto, Fixed, 95% CI) | 0.64 [0.34, 1.19] |
| Analysis 1.3  Comparison 1 Beta‐blockers versus placebo or untreated, Outcome 3 Sensitivity analysis concerning the incidence of visual field defect progression. | ||||
| 3.1 Timolol versus placebo or untreated | 3 | 143 | Peto Odds Ratio (Peto, Fixed, 95% CI) | 0.54 [0.19, 1.54] |
| 3.2 Betaxolol versus placebo or untreated | 1 | 356 | Peto Odds Ratio (Peto, Fixed, 95% CI) | 0.70 [0.32, 1.51] |
| 4 Long‐term studies concerning the incidence of visual field progression Show forest plot | 6 | 882 | Peto Odds Ratio (Peto, Fixed, 95% CI) | 0.67 [0.45, 1.01] |
| Analysis 1.4  Comparison 1 Beta‐blockers versus placebo or untreated, Outcome 4 Long‐term studies concerning the incidence of visual field progression. | ||||
| Outcome or subgroup title | No. of studies | No. of participants | Statistical method | Effect size |
| 1 Incidence of visual field defect progression Show forest plot | 2 | 171 | Peto Odds Ratio (Peto, Fixed, 95% CI) | 0.18 [0.05, 0.62] |
| Analysis 2.1  Comparison 2 Comparison of timolol and carteolol, Outcome 1 Incidence of visual field defect progression. | ||||
| Outcome or subgroup title | No. of studies | No. of participants | Statistical method | Effect size |
| 1 Incidence of visual field defect progression Show forest plot | 2 | 290 | Peto Odds Ratio (Peto, Fixed, 95% CI) | 2.20 [1.17, 4.14] |
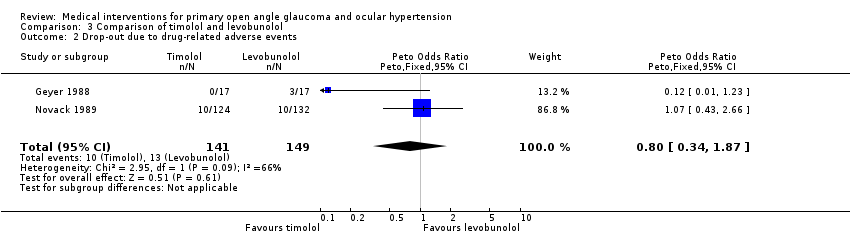
| Analysis 3.1  Comparison 3 Comparison of timolol and levobunolol, Outcome 1 Incidence of visual field defect progression. | ||||
| 2 Drop‐out due to drug‐related adverse events Show forest plot | 2 | 290 | Peto Odds Ratio (Peto, Fixed, 95% CI) | 0.80 [0.34, 1.87] |
| Analysis 3.2  Comparison 3 Comparison of timolol and levobunolol, Outcome 2 Drop‐out due to drug‐related adverse events. | ||||
| Outcome or subgroup title | No. of studies | No. of participants | Statistical method | Effect size |
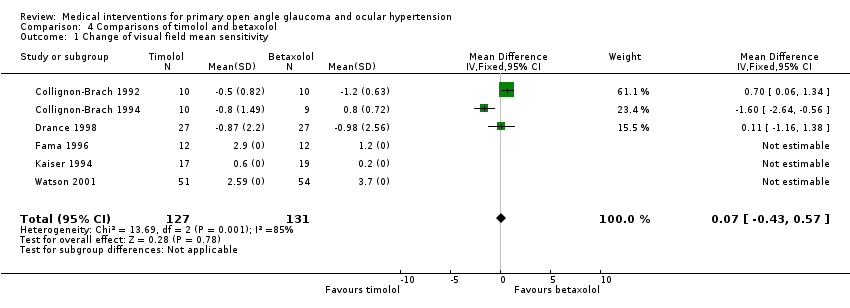
| 1 Change of visual field mean sensitivity Show forest plot | 6 | 258 | Mean Difference (IV, Fixed, 95% CI) | 0.07 [‐0.43, 0.57] |
| Analysis 4.1  Comparison 4 Comparisons of timolol and betaxolol, Outcome 1 Change of visual field mean sensitivity. | ||||
| 2 Drop‐out due to drug‐related adverse events Show forest plot | 5 | 238 | Peto Odds Ratio (Peto, Fixed, 95% CI) | 2.40 [1.04, 5.53] |
| Analysis 4.2  Comparison 4 Comparisons of timolol and betaxolol, Outcome 2 Drop‐out due to drug‐related adverse events. | ||||
| Outcome or subgroup title | No. of studies | No. of participants | Statistical method | Effect size |
| 1 Incidence of visual field defect progression Show forest plot | 2 | 671 | Peto Odds Ratio (Peto, Fixed, 95% CI) | 1.11 [0.60, 2.04] |
| Analysis 5.1  Comparison 5 Comparison of timolol and brimonidine, Outcome 1 Incidence of visual field defect progression. | ||||
| 2 Drop‐out due to drug‐related adverse events Show forest plot | 3 | 957 | Peto Odds Ratio (Peto, Fixed, 95% CI) | 0.21 [0.14, 0.31] |
| Analysis 5.2  Comparison 5 Comparison of timolol and brimonidine, Outcome 2 Drop‐out due to drug‐related adverse events. | ||||
| Outcome or subgroup title | No. of studies | No. of participants | Statistical method | Effect size |
| 1 Incidence of visual field defect progression Show forest plot | 10 | 3648 | Peto Odds Ratio (Peto, Fixed, 95% CI) | 0.62 [0.47, 0.81] |
| Analysis 6.1  Comparison 6 All treatments versus placebo or untreated, Outcome 1 Incidence of visual field defect progression. | ||||
| 2 Sensitivity analysis concerning the incidence of visual field progression Show forest plot | 6 | 3212 | Odds Ratio (M‐H, Fixed, 95% CI) | 0.58 [0.42, 0.81] |
| Analysis 6.2  Comparison 6 All treatments versus placebo or untreated, Outcome 2 Sensitivity analysis concerning the incidence of visual field progression. | ||||
| 3 Sensitivity analysis concerning the incidence of visual field progression; without OHTS study Show forest plot | 5 | 1576 | Odds Ratio (M‐H, Fixed, 95% CI) | 0.66 [0.44, 0.98] |
| Analysis 6.3  Comparison 6 All treatments versus placebo or untreated, Outcome 3 Sensitivity analysis concerning the incidence of visual field progression; without OHTS study. | ||||

Comparison 1 Beta‐blockers versus placebo or untreated, Outcome 1 Incidence of visual field defect progression.
Comparison 1 Beta‐blockers versus placebo or untreated, Outcome 2 Drop‐out due to drug‐related adverse events.
Comparison 1 Beta‐blockers versus placebo or untreated, Outcome 3 Sensitivity analysis concerning the incidence of visual field defect progression.

Comparison 1 Beta‐blockers versus placebo or untreated, Outcome 4 Long‐term studies concerning the incidence of visual field progression.

Comparison 2 Comparison of timolol and carteolol, Outcome 1 Incidence of visual field defect progression.

Comparison 3 Comparison of timolol and levobunolol, Outcome 1 Incidence of visual field defect progression.
Comparison 3 Comparison of timolol and levobunolol, Outcome 2 Drop‐out due to drug‐related adverse events.
Comparison 4 Comparisons of timolol and betaxolol, Outcome 1 Change of visual field mean sensitivity.

Comparison 4 Comparisons of timolol and betaxolol, Outcome 2 Drop‐out due to drug‐related adverse events.

Comparison 5 Comparison of timolol and brimonidine, Outcome 1 Incidence of visual field defect progression.

Comparison 5 Comparison of timolol and brimonidine, Outcome 2 Drop‐out due to drug‐related adverse events.

Comparison 6 All treatments versus placebo or untreated, Outcome 1 Incidence of visual field defect progression.

Comparison 6 All treatments versus placebo or untreated, Outcome 2 Sensitivity analysis concerning the incidence of visual field progression.
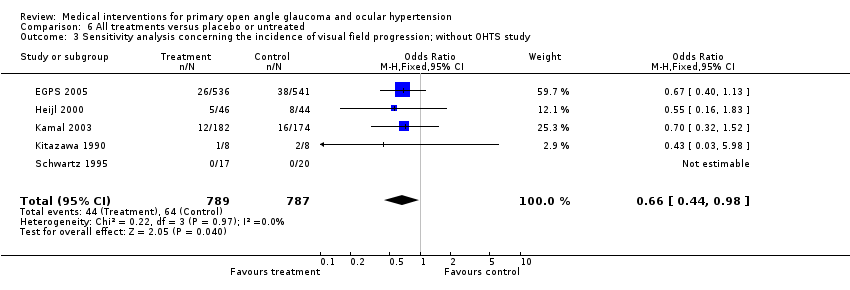
Comparison 6 All treatments versus placebo or untreated, Outcome 3 Sensitivity analysis concerning the incidence of visual field progression; without OHTS study.
| Criteria | Number of trials |
| Allocation concealment adequate | 16 / 26 |
| Baseline comparability stated | 19 / 26 |
| Analysis: intention‐to‐treat | 9 / 26 |
| Withdrawals adequately reported | 17 / 26 |
| Drop‐out rate below 10% | 1 / 26 |
| Low methodological quality | 16 / 26 |
| Comparison | POAG | OHT | POAG & OHT | Drop‐out due to AE |
| Beta‐blockers vs. placebo or untreated | 0.67 (0.45 to 1.00; n=935) | 1.24 (0.59 to 2.58; n=503) | ||
| Longterm trials | 0.67 (0.45 to 1.01; n=882) | |||
| Sensitivity analysis | 0.64 (0.34 to 1.19; n=499) | |||
| Timolol vs. placebo or untreated | 0.66 (0.41 to 1.05; n=579) | 2.48 (0.61 to 10.10; n=147) | ||
| Timolo vs. carteolol | 0.18 (0.05 to 0.62; n=171) + | |||
| Timolol vs. levobunolol | 2.20 (1.17 to 4.14; n=290) # | 0.80 (0.34 to 1.87; n=290) | ||
| Timolol vs. betaxolol | 0.07dB (‐0.43dB to 0.57dB; n=158) $ | 2.40 (1.04 to 5.53; n=238) § | ||
| Timolol vs. brimonidine | 1.11 (0.60 to 2.04; n=671) | 0.21 (0.14 to 0.31; n=957) ++ | ||
| All treatment vs. placebo or untreated | 0.62 (0.47 to 0.81; n=3648) | |||
| Sensitivity analysis | 0.58 (0.42 to 0.81; n=3212) | |||
| Sensitivity analysis without OHTS | 0.66 (0.44 to 0.98; n=1576) | |||
| + favours timolol; # favours levobunolol; | $ 14 participants with OHT included | § favours betaxolol | ++ favours timolol |
| Outcome or subgroup title | No. of studies | No. of participants | Statistical method | Effect size |
| 1 Incidence of visual field defect progression Show forest plot | 8 | 935 | Peto Odds Ratio (Peto, Fixed, 95% CI) | 0.67 [0.45, 1.00] |
| 1.1 Timolol versus placebo or untreated | 7 | 579 | Peto Odds Ratio (Peto, Fixed, 95% CI) | 0.66 [0.41, 1.05] |
| 1.2 Betaxolol versus placebo or untreated | 1 | 356 | Peto Odds Ratio (Peto, Fixed, 95% CI) | 0.70 [0.32, 1.51] |
| 2 Drop‐out due to drug‐related adverse events Show forest plot | 4 | 503 | Peto Odds Ratio (Peto, Fixed, 95% CI) | 1.24 [0.59, 2.58] |
| 2.1 Timolol versus placebo | 3 | 147 | Peto Odds Ratio (Peto, Fixed, 95% CI) | 2.48 [0.61, 10.10] |
| 2.2 Betaxolol versus placebo | 1 | 356 | Peto Odds Ratio (Peto, Fixed, 95% CI) | 0.95 [0.40, 2.26] |
| 3 Sensitivity analysis concerning the incidence of visual field defect progression Show forest plot | 4 | 499 | Peto Odds Ratio (Peto, Fixed, 95% CI) | 0.64 [0.34, 1.19] |
| 3.1 Timolol versus placebo or untreated | 3 | 143 | Peto Odds Ratio (Peto, Fixed, 95% CI) | 0.54 [0.19, 1.54] |
| 3.2 Betaxolol versus placebo or untreated | 1 | 356 | Peto Odds Ratio (Peto, Fixed, 95% CI) | 0.70 [0.32, 1.51] |
| 4 Long‐term studies concerning the incidence of visual field progression Show forest plot | 6 | 882 | Peto Odds Ratio (Peto, Fixed, 95% CI) | 0.67 [0.45, 1.01] |
| Outcome or subgroup title | No. of studies | No. of participants | Statistical method | Effect size |
| 1 Incidence of visual field defect progression Show forest plot | 2 | 171 | Peto Odds Ratio (Peto, Fixed, 95% CI) | 0.18 [0.05, 0.62] |
| Outcome or subgroup title | No. of studies | No. of participants | Statistical method | Effect size |
| 1 Incidence of visual field defect progression Show forest plot | 2 | 290 | Peto Odds Ratio (Peto, Fixed, 95% CI) | 2.20 [1.17, 4.14] |
| 2 Drop‐out due to drug‐related adverse events Show forest plot | 2 | 290 | Peto Odds Ratio (Peto, Fixed, 95% CI) | 0.80 [0.34, 1.87] |
| Outcome or subgroup title | No. of studies | No. of participants | Statistical method | Effect size |
| 1 Change of visual field mean sensitivity Show forest plot | 6 | 258 | Mean Difference (IV, Fixed, 95% CI) | 0.07 [‐0.43, 0.57] |
| 2 Drop‐out due to drug‐related adverse events Show forest plot | 5 | 238 | Peto Odds Ratio (Peto, Fixed, 95% CI) | 2.40 [1.04, 5.53] |
| Outcome or subgroup title | No. of studies | No. of participants | Statistical method | Effect size |
| 1 Incidence of visual field defect progression Show forest plot | 2 | 671 | Peto Odds Ratio (Peto, Fixed, 95% CI) | 1.11 [0.60, 2.04] |
| 2 Drop‐out due to drug‐related adverse events Show forest plot | 3 | 957 | Peto Odds Ratio (Peto, Fixed, 95% CI) | 0.21 [0.14, 0.31] |
| Outcome or subgroup title | No. of studies | No. of participants | Statistical method | Effect size |
| 1 Incidence of visual field defect progression Show forest plot | 10 | 3648 | Peto Odds Ratio (Peto, Fixed, 95% CI) | 0.62 [0.47, 0.81] |
| 2 Sensitivity analysis concerning the incidence of visual field progression Show forest plot | 6 | 3212 | Odds Ratio (M‐H, Fixed, 95% CI) | 0.58 [0.42, 0.81] |
| 3 Sensitivity analysis concerning the incidence of visual field progression; without OHTS study Show forest plot | 5 | 1576 | Odds Ratio (M‐H, Fixed, 95% CI) | 0.66 [0.44, 0.98] |