Memantina para la demencia
Resumen
Antecedentes
La memantina es un antagonista no competitivo de afinidad moderada por los receptores NMDA del glutamato. Su uso está autorizado en la enfermedad de Alzheimer (EA) moderada y grave; en los EE.UU., también se utiliza sin prescripción para la EA leve.
Objetivos
Determinar la eficacia y la seguridad de la memantina en los pacientes con demencia. Evaluar si la memantina agrega un efecto beneficioso en los pacientes que ya reciben inhibidores de la colinesterasa (ChEI).
Métodos de búsqueda
Se hicieron búsquedas en ALOIS, registro especializado del Grupo Cochrane de Demencia y Trastornos Cognitivos (Cochrane Dementia and Cognitive Improvement Group's register of trials) (http://www.medicine.ox.ac.uk/alois/) hasta el 25 marzo 2018. Se examinaron los registros de ensayos clínicos, los comunicados de prensa y los posters de los fabricantes de memantina; así como los sitios web de FDA, EMEA y NICE. Se estableció contacto con autores y empresas para obtener información faltante.
Criterios de selección
Ensayos aleatorios doble ciego, de grupos paralelos, controlados con placebo, de memantina para pacientes con demencia.
Obtención y análisis de los datos
Se agruparon y analizaron los datos de cuatro dominios clínicos a través de diferentes etiologías y gravedades de la demencia y para la EA con agitación. Se evaluó la repercusión de la duración del estudio, la gravedad y el uso concomitante de ChEI. Por lo tanto, los análisis se limitaron a las dosis autorizadas (20 mg/día o 28 mg liberación prolongada) y a los datos de seguimiento a los seis a siete meses, y se analizaron por separado los resultados de la EA leve y moderada a grave.
Los resultados de eficacia se transformaron en diferencia en puntos en las escalas particulares de resultado.
Resultados principales
Para todos los tipos de demencia, hubo datos disponibles de casi 10 000 participantes en 44 ensayos incluidos, la mayoría con riesgo bajo o incierto de sesgo. Para casi la mitad de los estudios, los datos relevantes se obtuvieron de fuentes no publicadas. La mayoría de los ensayos (29 en 7885 participantes) se realizó en pacientes con EA.
1. EA moderada a grave (con o sin ChEI concomitante). Evidencia de certeza alta de hasta 14 estudios con alrededor de 3700 participantes muestra de forma consistente un beneficio clínico pequeño de la memantina versus placebo: clasificación clínica global (CCG): 0,21 puntos en la CIBIC‐Plus (intervalo de confianza [IC] del 95%: 0,14 a 0,30); funcionalidad cognitiva (FC): 3,11 puntos en la Severe Impairment Battery (SIB) (IC del 95%: 2,42 a 3,92); desempeño en las actividades cotidianas (AC): 1,09 puntos en la escala ADL19 (IC del 95%: 0,62 a 1,64); y comportamiento y estado de ánimo: 1,84 puntos en el Neuropsychiatric Inventory (NPI) (IC del 95%: 1,05 a 2,76). Puede no haber diferencias en la cantidad de pacientes que interrumpen la administración de memantina en comparación con placebo: cociente de riesgos (CR) 0,93 (IC del 95%: 0,83 a 1,04) correspondiente a 13 pacientes menos por 1000 (IC del 95%: 31 menos a 7 más). Aunque hay evidencia de certeza moderada de que menos pacientes que toman memantina presentan agitación como un evento adverso: CR 0,81 (IC del 95%: 0,66 a 0,99) (25 pacientes menos por 1000; IC del 95%: 1 a 44 menos), también hay evidencia de certeza moderada de tres estudios adicionales que indica que la memantina no es beneficiosa como tratamiento para la agitación (p.ej., Cohen‐Mansfield Agitation Inventory: beneficio clínico de 0,50 puntos en el CMAI; IC del 95%: ‐3,71 a 4,71).
La presencia de un ChEI concomitante no repercute sobre la diferencia entre la memantina y placebo, con posibles excepciones para el resultado comportamiento y estado de ánimo (efecto más grande en los pacientes que toman ChEI) y el resultado FC (efecto más pequeño).
2. EA leve (Mini Mental State Examination [MMSE] 20 a 23): evidencia de certeza principalmente moderada sobre la base de subgrupos post hoc de hasta cuatro estudios con alrededor de 600 participantes indica que es posible que no hay diferencias entre memantina y placebo en la FC: 0,21 puntos de ADAS‐Cog (IC del 95%: ‐0,95 a 1,38); desempeño en las actividades cotidianas (AC): ‐0,07 puntos en la escala ADL23 (IC del 95%: ‐1,80 a 1,66); y comportamiento y estado de ánimo: ‐0,29 puntos en el NPI (IC del 95%: ‐2,16 a 1,58). Hay menos certeza en la evidencia de la CCG, que también indica que puede no haber diferencias: 0,09 puntos en la CIBIC‐Plus (IC del 95%: ‐0,12 a 0,30). La memantina (en comparación con placebo) puede aumentar la cantidad de pacientes que interrumpen el tratamiento debido a los eventos adversos (CR 2,12; IC del 95%: 1,03 a 4,39).
3. Demencia vascular leve a moderada. evidencia de certeza moderada y baja de dos estudios con alrededor de 750 participantes indica que probablemente hay un beneficio clínico pequeño en la FC: 2,15 puntos en la ADAS‐Cog (IC del 95%: 1,05 a 3,25); podría haber un beneficio clínico pequeño en el comportamiento y el estado de ánimo: 0,47 puntos en la NOSGER disturbing behaviour (IC del 95%: 0,07 a 0,87); probablemente ninguna diferencia en la CCG: 0,03 puntos en la CIBIC‐Plus (IC del 95%: ‐0,28 a 0,34); y podría no haber diferencias en las actividades cotidianas: 0,11 puntos en la subescala NOSGER II self‐care (IC del 95%: ‐0,35 a 0,54) o en la cantidad de pacientes que interrumpen el tratamiento: CR 1,05 (IC del 95%: 0,83 a 1,34).
Hay limitada evidencia de la eficacia, principalmente de certeza baja o muy baja, para otros tipos de demencia (enfermedad de Parkinson y demencia de cuerpos de Lewy [en las cuales se puede mostrar un beneficio clínico pequeño en la CCG; cuatro estudios con 319 pacientes]; demencia frontotemporal [dos estudios con 133 pacientes]; y Complejo de demencia asociado al SIDA [un estudio con 140 pacientes]).
Hay evidencia de certeza alta que no muestra diferencias entre memantina y placebo en la proporción que presenta al menos un evento adverso: CR 1,03 (IC del 95%: 1,00 a 1,06); el CR no difiere entre las etiologías o las gravedades de la demencia. Al combinar los datos disponibles de todos los ensayos, hay evidencia de certeza moderada de que es 1,6 veces más probable que la memantina provoque mareo en comparación con placebo (6,1% versus 3,9%), evidencia de certeza baja de que aumenta 1,3 veces el riesgo de cefalea (5,5% versus 4,3%), pero evidencia de certeza alta de ninguna diferencia en las caídas.
Conclusiones de los autores
Se encontraron diferencias importantes en la eficacia de la memantina en la EA leve en comparación con la EA moderada a grave. Hay un beneficio clínico pequeño de la memantina en los pacientes con EA moderada a grave, que se presenta independientemente de si además reciben un ChEI, pero no ocurre así en los pacientes con EA leve.
La heterogeneidad clínica en la EA hace que sea poco probable que algún fármaco único tenga un tamaño grande del efecto y significa que la farmacoterapia óptima puede incluir fármacos múltiples, cada uno con un tamaño del efecto que puede ser menor que la diferencia mínima clínicamente importante.
Se necesita un ensayo de larga duración definitivo en la EA leve para establecer si comenzar más temprano la administración de memantina sería beneficioso a largo plazo y seguro: en la actualidad la evidencia está en contra, a pesar de ser la práctica habitual. Se necesita un ensayo de larga duración en la EA moderada a grave para establecer si el beneficio persiste más allá de los seis meses.
PICO
Resumen en términos sencillos
Memantina como tratamiento para la demencia
Pregunta de la revisión
Se ha revisado la evidencia sobre la memantina, que es uno de los fármacos principales para tratar a los pacientes con demencia. Se deseaba determinar si la memantina puede desacelerar el curso de la demencia y si es de alguna manera perjudicial. También se deseaba saber si el agregado de la memantina a otros fármacos para la demencia proporciona un efecto extra.
Antecedentes
El tipo más frecuente de demencia es la enfermedad de Alzheimer (EA), seguida de la demencia vascular. De una a dos personas en 100 presentan EA a la edad de 65 años y esta tasa se duplica cada cinco años. La demencia incluye la pérdida de la memoria, dificultades con el pensamiento y a menudo provoca cambios en el estado de ánimo y el comportamiento.
Existen dos tipos principales de tratamiento: los fármacos inhibidores de la acetilcolinesterasa (ChEI) y la memantina. Estos fármacos actúan de manera diferente y se deseaba determinar si administrar juntos los dos tipos de fármacos funcionaría mejor que los fármacos ChEI por sí solos.
Características de los estudios
Se buscaron todos los estudios relevantes con un diseño fiable (ensayos controlados aleatorios) y que compararon memantina con placebo en cada tipo de demencia. Se encontraron 44 estudios con 10 000 pacientes. La mayoría de los estudios (29 en 7885 pacientes) se realizaron en pacientes con EA. La mayoría de los estudios se realizaron de manera adecuada, pero algunos no se informaron bien y se obtuvo información adicional de las compañías farmacéuticas. Los resultados se analizaron por separado en los pacientes con demencia leve y en los pacientes con demencia moderada a grave.
Resultados clave
La memantina tiene un efecto beneficioso pequeño en los pacientes con EA moderada a grave. Este beneficio afecta al pensamiento, la capacidad de continuar las actividades diarias normales y la gravedad de los problemas del comportamiento y del estado de ánimo. En general, los pacientes con EA moderada a grave la toleran bien, pero en algunos casos puede provocar mareos.
Un resultado importante es que el agregado de la memantina al tratamiento establecido con ChEI también da lugar a menos deterioro que placebo.
Sin embargo, en los pacientes con EA leve, la memantina probablemente no es mejor que placebo. La evidencia es principalmente de calidad moderada.
En la demencia vascular, dos estudios con alrededor de 750 pacientes indicaron que probablemente tiene un efecto beneficioso pequeño sobre las dificultades en el pensamiento, el comportamiento y el estado de ánimo y podría haber menos agitación con la memantina en comparación con placebo. Esta evidencia es de calidad baja a moderada.
Calidad de la evidencia
En general, la evidencia sobre la memantina para la EA es de calidad alta y proviene de muchos ensayos en miles de pacientes. Se puede tener confianza en los resultados para la EA, pero se tiene menos confianza para los pacientes con otros tipos de demencia.
Este resumen en términos sencillos está actualizado hasta marzo de 2018.
Conclusiones de los autores
Summary of findings
| Memantine 20 mg or equivalent compared to placebo for moderate‐to‐severe Alzheimer's disease (AD) 24‐ to 30‐week data. OC | ||||||
| Population: Alzheimer's disease (AD), moderate‐to‐severe | ||||||
| Continuous outcomes | Score with placebo (median) | Mean improvement in change score between memantine and placebo | SMD (95% CI) meta‐analysis findings | № of participants | Certainty of the evidence | Comments |
| Clinical Global (CIBIC+) | Median CIBIC+ score was 4.60 3 (i.e. deterioration with time) | MD: 0.21 (0.14 to 0.30) | ‐0.20 (‐0.28 to ‐0.13) | 2797 | ⊕⊕⊕⊕ | SMD as a negative outcome Converted to CIBIC+ scale; median SD(pooled) = 1.06. |
| Cognitive Function (SIB) | Median SIB score at baseline: 75.2. Median change from baseline (positive scale): ‐2.4 4 (i.e. deterioration with time) | MD: 3.11 (2.42 to 3.92) | ‐0.27 (‐0.34 to ‐0.21) | 3337 | ⊕⊕⊕⊕ | SMD as a negative outcome (Analysis 1.2). Converted to SIB scale (and scale direction inverted); median SD (pooled) = 11.53. |
| Functional performance on activities of daily living: ADCS‐ADL19 | Median ADCS‐ADL19 score at baseline: 33.2 Median change from baseline (positive scale): ‐2.8 5 (i.e. deterioration with time) | MD: 1.09 (0.62 to 1.64) | ‐0.16 (‐0.24 to ‐0.09) | 2687 | ⊕⊕⊕⊕ | SMD for decline in ADL (a negative outcome) (Analysis 1.3). Converted to ADCS‐ADL19 scale (and scale direction inverted); median SD(pooled) = 6.84. |
| Behaviour and Mood (NPI) 144‐point scale | The median baseline NPI score was 17.0. Median change from baseline (negative scale): 2.80 6 (i.e. deterioration with time) | MD: 1.84 (1.05 to 2.76) | ‐0.14 (‐0.21 to ‐0.08) | 3674 | ⊕⊕⊕⊕ | SMD as a negative outcome Converted to NPI scale; median SD(pooled) = 13.15. |
| Binary outcomes | Anticipated absolute effects | Relative effect | № of participants | Certainty of the evidence | Comments | |
| Risk with placebo (median) | Risk with memantine | |||||
| All‐cause discontinuation | 182 per 1000 | 169 per 1000 | RR 0.93 | 5087 924 events | ⊕⊕⊕⊕ | RR and median control group risk in people with moderate‐to‐severe AD without agitation (Analysis 16.5). |
| Difference: 13 fewer people per 1000 discontinued treatment for any cause (95% CI 31 fewer to 7 more) | ||||||
| Number suffering at least one adverse event | 716 per 1000 | 737 per 1000 | RR 1.03 | 8033 5371 events | ⊕⊕⊕⊕ | RR from all studies (Analysis 9.3). Median control group risk for moderate‐to‐severe AD studies (Analysis 1.7). |
| Difference: 21 more people per 1000 suffered adverse events | ||||||
| Number suffering at least one serious adverse event | 114 per 1000 | 104 per 1000 (93 to 116) | RR 0.91 | 6482 (19 RCTs) 918 events | ⊕⊕⊕⊕ | RR and median control risk from all AD studies (except those with agitation) (from Analysis 8.10) |
| Difference: 10 fewer people per 1000 suffered serious adverse events (95% CI 21 fewer to 2 more) | ||||||
| Number suffering agitation as an adverse event | 129 per 1000 | 104 per 1000 | RR 0.81 | 4395 321 events | ⊕⊕⊕⊝ | RR from all AD studies (apart from those in people with agitation) (Analysis 8.11). Median control group risk for moderate‐to‐severe AD studies (Analysis 1.9). |
| Difference: 25 fewer people per 1000 suffered agitation as an adverse event | ||||||
| *The risk in the intervention group (and its 95% confidence interval) is based on the assumed risk in the comparison group and the relative effect of the intervention (and its 95% CI). | ||||||
| GRADE Working Group grades of evidence | ||||||
| 1 Some inconsistency in point estimates, but not enough to downgrade 2 Some inconsistency in point estimates (downgrade once) 3 Median control group values for 8 studies reporting CIBIC+ (Asada 2011a (IE3501); Bakchine 2008 (99679) SG; Grossberg 2008 (MD‐50); Peskind 2004 (MD‐10) SG; Porsteinsson 2008(MD‐12)S; Reisberg 2003 (9605); Tariot 2004 (MD‐02); van Dyck 2007 (MD‐01)) 4 Median control group baseline scores and median control group change from baseline for 5 studies reporting SIB (Grossberg 2008 (MD‐50); Reisberg 2003 (9605); Tariot 2004 (MD‐02); van Dyck 2007 (MD‐01); Wang 2013) 5 Median control group baseline scores and median control group change from baseline for the 4 studies reporting ADCS‐ADL19 (Grossberg 2008 (MD‐50); Reisberg 2003 (9605);Tariot 2004 (MD‐02); van Dyck 2007 (MD‐01)) 6 Median control group baseline scores and median control group change from baseline for the 10 studies reporting NPI (Bakchine 2008 (99679) SG; Dysken 2014 SG; Grossberg 2008 (MD‐50); Howard 2012 (DOMINO‐AD); Peskind 2004 (MD‐10) SG; Porsteinsson 2008(MD‐12)S; Reisberg 2003 (9605); Tariot 2004 (MD‐02); van Dyck 2007 (MD‐01); Wang 2013) | ||||||
| Memantine 20 mg compared to placebo for mild‐to‐moderate vascular dementia. six‐month studies | ||||||
| Population: vascular dementia, mild‐to‐moderate severity | ||||||
| Continuous outcomes | Score with placebo (mean) | Mean improvement in change score between memantine and placebo | SMD (95% CI) meta‐analysis findings | № of participants | Certainty of the evidence | Comments |
| Clinical Global: (CIBIC+) | CIBIC+ score (i.e. no change with time) | MD: 0.03 (‐0,28 to 0.34) | ‐0.02 (‐0.23 to 0.19) | 757 | ⊕⊕⊕⊝ | SMD as a negative outcome; random effects (Analysis 5.1). Converted to CIBIC+ scale; SD(pooled) = 1.46. |
| Cognitive function: ADAS‐Cog | Mean ADAS‐Cog score at baseline was 23.6. Mean change from (i.e. deterioration with time) | MD: 2.15 (1.05 to 3.25) | ‐0.32 (‐0.48 to ‐0.15) | 569 | ⊕⊕⊕⊝ | Analysed as mean difference (Analysis 5.2) [SMD as a negative outcome Analysis 8.2] |
| Performance on ADL (NOSGER self care subscale) Subscale 5 points | Baseline scores not reported. Change from baseline i.e. deterioration with time | MD: 0.11 (‐0.35 to 0.54) | ‐0.04 (‐0.20 to 0.13) | 542 | ⊕⊕⊝⊝ | SMD for decline in ADL (a negative outcome) (Analysis 5.3). Converted to NOSGER II self‐care subscale (Wilcock 2002 (9202)) SD(pooled) = 2.69. |
| Behaviour: NOSGER disturbing behaviour subscale Subscale 5 points | Baseline scores not reported. Change from baseline for the NOSGER i.e. deterioration with time | MD: 0.47 (0.07 to 0.87) | ‐0.20 (‐0.37 to ‐0.03) | 542 | ⊕⊕⊝⊝ | SMD as a negative outcome (Analysis 5.4). Converted to NOSGER II disturbing behaviour subscale (Wilcock 2002 (9202)) SD(pooled) = 2.34. |
| Binary outcomes | Anticipated absolute effects | Relative effect | № of participants | Certainty of the evidence | Comments | |
| Risk with placebo (median) | Risk with memantine | |||||
| All‐cause discontinuation | 218 per 1000 | 229 per 1000 | RR 1.05 | 900 678 events | ⊕⊕⊝⊝ | RR and control group risk for studies in people with vascular dementia (Analysis 5.6.) |
| Difference: 11 more people per 1000 discontinued treatment for any cause (95% CI 37 fewer to 74 more) | ||||||
| Number suffering at least one adverse event | 742 per 1000 | 764 per 1000 | RR 1.03 | 8033 5371 events | ⊕⊕⊕⊕ | RR from all studies (Analysis 9.3). Control group risk taken from studies in vascular dementia (Analysis 5.8) |
| Difference: 22 more people per 1000 suffered adverse events | ||||||
| Number suffering at least one serious adverse event | 211 per 1000 | 173 per 1000 (95% CI 131 to 230) | RR 0.82 (0.62 to 1.09) | 900 (2 RCTs) 162 events | ⊕⊕⊝⊝ | RR and control group risk from vascular dementia studies (Analysis 8.10) |
| Difference: 38 fewer people per 1000 suffered serious adverse events (95% CI 80 fewer to 19 more) | ||||||
| Number suffering agitation as an adverse event | 77 per 1000 | 44 per 1000 | RR 0.57 | 900 54 events | ⊕⊕⊝⊝ | RR and control group risk from vascular dementia studies (Analysis 5.9); random effects |
| Difference: 33 fewer people per 1000 suffered agitation as an adverse event | ||||||
| *The risk in the intervention group (and its 95% confidence interval) is based on the assumed risk in the comparison group and the relative effect of the intervention (and its 95% CI). | ||||||
| GRADE Working Group grades of evidence | ||||||
| 1 Inconsistency in point estimates (and I² = 48%); some imprecision (95% CI crossed null and was consistent with benefit and no difference) but may be consequence of inconsistency (downgraded once overall) 2 Majority of the information at high risk of bias (downgrade once). Some inconsistency (but insufficient to downgrade) 3 Majority of the information at high risk of bias for 2 domains (downgrade twice) 4 Majority of the information at high risk of bias (downgrade once); some inconsistency and some imprecision (crossed null and 1.25) (downgrade once) 5 Majority of the information at high risk of bias (downgrade once); imprecision (162 events and crossed both 0.75 and null)) (downgrade once) 6 Majority of the information at high risk of bias (downgrade once); imprecision (only 54 events) (downgrade once) | ||||||
Antecedentes
Descripción de la afección
Esta revisión abarca el efecto de la memantina en la demencia de todas las etiologías.
La enfermedad de Alzheimer (EA) es la causa más común de demencia; se encuentra en al menos el 70% de las autopsias de pacientes que padecen demencia. La prevalencia de esta enfermedad es aproximadamente del 1% al 2% a los 65 años, pero se duplica cada cinco años hasta por lo menos los 90 años de edad (Qiu 2009). La enfermedad es progresiva. Para los objetivos de los ensayos de fármacos, los pacientes con EA que tienen una puntuación en el brief mini mental state examination (MMSE) mayor de 20 se han considerado con EA leve. Sin embargo, la combinación de la pérdida de la memoria, la desorientación y la pérdida frecuente de la percepción que acompaña este estadio hace que el efecto sobre los cuidadores a menudo esté muy lejos de ser "leve". No es poco frecuente que los pacientes necesiten el ingreso en hogares de atención en este estadio. La EA moderada se ha definido como la que presentan los pacientes con una puntuación en el MMSE de 20 a 10. En este rango, los pacientes se deterioran más rápidamente. La deficiencia en la capacidad de los pacientes de realizar las tareas diarias es marcada, y es obvia durante una conversación incluso breve. Cuando los pacientes han progresado a una puntuación en el MMSE de 10 o menos (demencia "grave"), los déficits son profundos y se requiere una supervisión de 24 horas. Aproximadamente el 70% de los pacientes con EA requiere el ingreso en hogares de atención.
Además de la edad, el factor de riesgo más importante para el desarrollo de la EA es la presencia del gen ApoE4, que está presente en el 17% al 30% de la población. Otros factores de riesgo incluyen todos los riesgos vasculares (diabetes, hipertensión, colesterol alto, falta de ejercicio), cualquier lesión cerebral (traumatismo o accidente cerebrovascular) y el sexo femenino (Patterson 2007; Sibbett 2017).
Los estudios cerebrales en modelos celulares y animales, genéticos, de neuroimagen, clínicos y posmortem han sido importantes para comprender mejor muchos de los cambios que ocurren en los cerebros de los pacientes con EA. La pérdida de las células nerviosas y la interrupción de los sistemas de neurotransmisión se extienden a muchas áreas cerebrales, en particular el hipocampo y la corteza cerebral. La agregación de fragmentos de péptido de la proteína precursora del amiloide, que probablemente mantiene las células nerviosas lo suficiente unidas como para que las señales se transmitan entre ellas, provoca el mal funcionamiento de los procesos dentro de las células. Fuera de las neuronas se desarrollan grandes depósitos de estos fragmentos, las placas amiloides, que se asocian con una respuesta inflamatoria leve. Sin embargo, la eliminación de las placas existentes no parece dar lugar a mejoría en los síntomas, por lo que no está claro en qué medida las placas amiloides son la causa de la EA o la consecuencia de otro trastorno más importante. Dentro de las neuronas, el transporte de los componentes celulares se interrumpe porque tau, que ayuda a mantener unida la estructura de los microtúbulos, se fosforila y forma "entramados" en el filamento helicoidal pareado. Ningún fármaco que afecte este proceso ha probado tener efectos beneficiosos sobre los síntomas. La función colinérgica, que media la atención, tiende a estar deteriorada en los pacientes con EA. Lo anterior se puede corregir de forma parcial por los inhibidores de la colinesterasa (ChEI), que reducen el deterioro de la acetilcolina.
La demencia vascular, en la que la disminución cognitiva se atribuye a alguna forma de lesión vascular, habitualmente isquémica, es la segunda causa más común de demencia en las sociedades occidentales. El desarrollo de una definición válida, aparte de la EA, ha sido problemático. Es una enfermedad heterogénea y las manifestaciones clínicas difieren dependiendo del tamaño y de la ubicación de las lesiones cerebrovasculares. En estudios de autopsias, se informó que la demencia "mixta" por EA y vascular es responsable del 0% al 55% de los casos de demencia. Además de ocurrir debido a una simple coincidencia, la EA y la demencia vascular pueden tener factores etiológicos y patogénicos en común. (Kalaria 1999). En comparación con la EA, los pacientes con demencia mixta muestran una alta frecuencia de estado de ánimo depresivo, hallazgos sensoriales o motores focales y alteraciones de la marcha aunque el cuadro neuropsicológico no es particular. Con el uso de criterios que exigen evidencia de imagenología de lesiones vasculares discretas y un evento clínico asociado con disminución cognitiva, o evidencia de enfermedad marcada de los vasos sanguíneos pequeños, la demencia vascular afecta del 1% al 20% de las personas de 65 años de edad o más.
La demencia de la enfermedad de Parkinson (DEP) y la demencia de cuerpos de Lewy (DCL) están estrechamente relacionadas. La principal distinción clínica es por la definición: los pacientes con DEP han presentado parkinsonismo un año o más antes de desarrollar demencia, mientras que en la DCL la aparición de demencia y parkinsonismo son más cercanas en el tiempo. Algunos pacientes con DCL no muestran signos de parkinsonismo. Ambos grupos tienen mayores probabilidades de presentar alucinaciones visuales, fluctuaciones marcadas en la capacidad funcional y trastorno del comportamiento del sueño REM (movimientos rápidos de los ojos).
Descripción de la intervención
La memantina se sintetizó por primera vez en Eli Lilly como un agente para disminuir los niveles elevados de azúcar en la sangre, aunque no resultó efectiva. Desde entonces se ha analizado en más de 100 ensayos controlados aleatorios en una variedad amplia de afecciones neurológicas y psiquiátricas, incluida la demencia de diferentes tipos, la depresión, el dolor neuropático, la enfermedad de Parkinson y el autismo.
En 1972, Merz solicitó una patente alemana de la memantina como un posible tratamiento para una variedad amplia de enfermedades cerebrovasculares, citando la evidencia de la reducción en la degeneración y la pérdida de las células nerviosas después de isquemia experimentalmente inducida en modelos animales. En 1975 y 1978, se otorgaron patentes a Alemania y EE.UU. respectivamente. (Parsons 1999). Esta base para la patente original de la memantina (Bormann 1991), que debía expirar en abril de 2010, fue impugnada por los fabricantes del fármaco genérico (Forest 2007). Forest y Merz lograron un acuerdo para proporcionar licencias a Amneal, Cobalt, Dr. Reddy’s, Lupin, Orchid, Sun, Teva, Upsher−Smith, y Wockhardt que permitía a estas empresas al lanzamiento de versiones genéricas de "Namenda" tres meses antes de la expiración de la patente original (Forest 2010a). Sin embargo, en marzo de 2009, la Patent and Trademark Office de los Estados Unidos expidió un Aviso de Resolución Definitiva que señalaba que, después de la revisión del cronograma reglamentario para la aprobación, Namenda tenía derecho a una extensión del término de la patente hasta abril de 2015 y la patente finalmente expiró en octubre de 2015. La memantina genérica está ahora disponible, pero en 2010 la Food and Drug Administration (FDA) de los EE.UU. otorgó una licencia para una preparación de Namenda XR 28 mg de liberación prolongada, en dosis única (Forest 2010b). La patente de este fármaco expira en setiembre de 2029.
La European Agency for the Evaluation of Medical Products (EMEA) aprobó la memantina en febrero de 2002 para el tratamiento de la "enfermedad de Alzheimer moderadamente grave a grave" (EMEA 2004) y en 2003 por la FDA para el tratamiento de la EA moderada a grave (MMSE hasta 14) (Anonymous 2003; Forest 2003). En 2006, la EMEA amplió la indicación a la "EA moderada a grave" (MMSE hasta 19) (EMEA 2006). En junio de 2008, la EMEA concedió una licencia para el régimen de dosis de 20 mg una vez al día (EMEA 2008). Las solicitudes a la FDA y la EMEA para licencias para el tratamiento de la EA leve a moderada han sido infructuosas (Forest 2005b; Lundbeck 2005).
La memantina no se ha aprobado para la demencia vascular o los estadios más tempranos de la EA en ninguna de estas jurisdicciones.
La memantina se comercializa como Axura por Merz, como Ebixa por Lundbeck en Europa, como Namenda por Forest en Norteamérica y como Mamary por Daiichi Asubio en Japón. En 2010, la memantina tenía participación en el 34,8% de los mercados de los EE.UU. de fármacos para la EA (Forest 2010a). Las ventas mundiales anuales exceden los USD 1000 000 000. En 2015, el precio de la memantina en el Reino Unido para el NHS disminuyó en el 94%. Las tasas de prescripción en Inglaterra aumentaron de aproximadamente 100 000 ítems dispensados en 2011 a 784 000 (a un costo de £5 400 000) en 2015 (Prescriptions England 2016).
En mayo de 2015, Actavis lanzó Namzaric (una combinación a dosis fija de 28 mg de memantina de liberación prolongada y el ChEI donepezilo 10 mg) para los pacientes con EA moderada a grave, después de la aprobación de la FDA en diciembre de 2014.
De qué manera podría funcionar la intervención
La memantina es un antagonista de afinidad baja de los receptores N‐metil‐D‐aspartato (NMDA) del glutamato. El L‐glutamato es el principal neurotransmisor excitatorio del sistema nervioso central ya que cumple un papel en la transmisión neural, el aprendizaje, los procesos de la memoria y la plasticidad neuronal (Sucher 1996). La actividad fisiológica del glutamato se requiere para la actividad cerebral normal, por lo que no puede eliminarse por completo (Kornhuber 1997). El hipocampo y otras regiones cerebrales que están afectados en la EA son ricos en receptores de glutamato de la clase NMDA. La consolidación de nuevos recuerdos también se media a través de estos receptores.
La excitación excesiva inducida por el glutamato, que da lugar al flujo excesivo de calcio en las neuronas a través de los receptores NMDA, desempeña una función en la patogenia de la EA y en el daño debido a un accidente cerebrovascular isquémico (Cacabelos 1999). Las acciones clínicas de la memantina se pueden mediar al prevenir esta exitotoxicidad.
Las respuestas inducidas por los receptores NMDA pueden depender de la ubicación de los receptores. La estimulación de los receptores NMDA sinápticos, que actúa principalmente mediante la señalización nuclear Ca(2+), provoca la acumulación de un "escudo" neuroprotector, mientras que la estimulación de los receptores NMDA extrasinápticos promueve la muerte celular (Hardingham 2010) y aumenta la producción de amiloides (Bordji 2010). La distinta farmacodinamia de la memantina en los receptores NMDA sinápticos y extrasinápticos puede significar que hay una "ventana terapéutica" de la memantina a dosis donde la inhibición de los receptores extrasinápticos es mayor que la de los receptores sinápticos (Hardingham 2010). La inhibición de ambos subtipos ocurre a dosis mayores.
Es posible que el efecto de la memantina esté relacionado con la reducción de la fosforilación tau (Degerman Gunnarsson 2007) o de la toxicidad amiloide (Song 2008).
La memantina también preserva el estado de energía cerebral durante la hipoglucemia experimentalmente inducida en pacientes sanos (Willenborg 2011). Aunque este efecto podría estar relacionado con sus acciones en la demencia, todavía está por establecer.
Por qué es importante realizar esta revisión
Primero, desde la última actualización de esta revisión en 2006, el National Institute for Health and Care Excellence (NICE) del Reino Unido, sobre la base de la evaluación de 2011 (TA 217), ha revisado una recomendación anterior de que la memantina no es suficientemente coste‐efectiva para justificar su prescripción en el National Health Service (NHS) del Reino Unido y emitió recomendaciones nuevas que definen su uso (NICE 2011). En una actualización adicional en 2015, NICE señaló que "no se identificó nada nuevo que afectara las recomendaciones 1.1; 1.2" (relacionadas con la memantina). De forma simultánea a la actualización de esta revisión Cochrane, la guía clínica de NICE para la demencia (CG 42) se actualizó de forma parcial para hacer una revisión adicional del efecto de dos temas relevantes para esta revisión de memantina: el tratamiento concurrente con memantina e inhibidores de la colinesterasa (ChEI), y la memantina para las demencias que no son por EA. La guía no actualizó las recomendaciones 1.1 y 1.2 (NICE 2018). El Grupo Cochrane de Demencia y Trastornos Cognitivos está interesado en esta guía y los autores de esta revisión han compartido los datos y la síntesis de la evidencia con NICE.
Por lo tanto, las recomendaciones del Reino Unido con respecto a la monoterapia con memantina (TA 217 recomendaciones 1.1 y 1.2) se mantienen sin cambio: o sea, la memantina debe estar disponible como gasto público para los pacientes que (a) presentan EA moderada y son intolerantes, o tienen una contraindicación a los ChEI o (b) presentan EA grave. El Comité de Evaluación también concluyó que "si las escalas cognitivas no son apropiadas para evaluar la necesidad de tratamiento, o para continuar el tratamiento, entonces los médicos deben utilizar otro método apropiado de evaluación".
La decisión actualizada de NICE 2011 se basó en la consideración de los datos de cuatro estudios, con hincapié en la significación estadística. Su análisis mostró un beneficio significativo en la funcionalidad cognitiva evaluada con la Severe Impairment Battery (SIB) a los tres meses, pero no a los seis meses. Dos estudios proporcionaron datos de la evaluación de las actividades cotidianas (AC) mediante la escala Alzheimer's Disease Cooperative Study ‐ Activities of Daily Living (ADCS‐ADL)19 y mostraron una significación marginal a los seis meses. No se observaron efectos estadísticamente significativos sobre el comportamiento. El modelo de NICE indicó que la memantina retrasó el tiempo hasta la necesidad de asistencia institucional en 0,8 meses. Por lo tanto, la decisión de NICE 2015 de transferir las recomendaciones 1.1 y 1.2 a su "lista estática de evaluaciones de tecnologías" se tomó sobre la base de relativamente pocos estudios de la efectividad clínica. En la actualidad la memantina es genérica, por lo que se afectará su coste‐efectividad.
La guía original de NICE de 2011 también concluyó que había "falta de evidencia de la eficacia clínica adicional (del tratamiento concurrente con ChEI) en comparación con la monoterapia con memantina" (NICE 2011). Sin embargo, este aspecto de TA se actualizó recientemente en la guía de 2018 recién publicada (NICE 2018), que recomienda que en los pacientes con un diagnóstico establecido de EA que ya reciben un ChEI, la memantina se debe considerar además en la enfermedad moderada y asimismo ofrecerse en la enfermedad grave (NICE 2018). Todavía persiste una falta de transparencia debido a la decisión de no actualizar las recomendaciones para la monoterapia y existe la confusión potencial que surge de fusionar las viejas y las nuevas recomendaciones. La guía de la British Association for Psychopharmacology indica que hay "evidencia de tipo I [es decir, que se basa en metanálisis de ECA] del agregado de la memantina a un inhibidor de la colinesterasa" (O'Brien 2017).
Segundo, el German Institute for Quality and Efficiency in Healthcare (IQWIG) ha revisado las conclusiones sobre la memantina. En 2009, concluyeron que "no hay pruebas científicas de que los pacientes con enfermedad de Alzheimer moderada o grave se beneficien de los fármacos que contienen el agente memantina". Su última búsqueda de estudios en los registros fue en enero de 2009. Se incluyeron finalmente los datos de nueve estudios con 16 a 28 semanas de duración. El IQWIG señaló la falta de "análisis fiables de los pacientes que responden al tratamiento", lo que impide comprender si "más pacientes del grupo de memantina observan una mejoría perceptible en los síntomas en comparación con el grupo placebo" y argumenta que "no fue posible deducir una prueba de un efecto relevante" sobre la clasificación clínica global porque, aunque muestra un beneficio significativo (diferencia de medias estandarizada [DME] 0,18; intervalo de confianza [IC] del 95%: 0,05 a 0,3), el límite de confianza inferior cayó por debajo del umbral de 0,2. La mayoría de los estudios incluidos recopilaron datos sobre la cantidad de atención requerida ("utilización de los recursos"), pero no estuvieron disponibles. Sin embargo, en respuesta, en 2011 Merz presentó resultados post hoc sobre los análisis de los pacientes que responden al tratamiento que dieron lugar a cambios en las conclusiones del IQWIG (IQWIG 2011), "Los datos proporcionan pruebas de un beneficio de la memantina en los pacientes con enfermedad de Alzheimer con respecto a la prevención de un deterioro relevante en la funcionalidad cognitiva. En las actividades cotidianas, teniendo en cuenta que los criterios de respuesta no son claros, así como el menor tamaño concurrente del efecto, los datos indican un beneficio de la memantina".
Tercero, el Ministro para la Salud de Francia suprimió todos los fármacos utilizados para la EA desde agosto de 2018 (memantina y los ChEI, donepezilo, galantamina y rivastigmina) y señaló que "Los fármacos disponibles a principios de 2018 para la enfermedad de Alzheimer tienen solo una eficacia mínima y transitoria. También son difíciles de utilizar debido a los efectos adversos desproporcionados y a las muchas interacciones con otros fármacos. Ninguno de los fármacos disponibles ha mostrado desacelerar la progresión hacia la dependencia; no obstante, todos conllevan un riesgo de efectos adversos potencialmente mortales e interacciones medicamentosas graves". Esta supresión significa que el sistema de seguro de salud nacional ya no reembolsa el costo de los fármacos (Prescrire 2018). La guía de demencia francesa se actualizó al mismo tiempo e indicó que el "servicio médico" no fue suficiente para justificar el apoyo nacional, aunque señala la autorización de comercialización y declara que los fármacos pueden ser prescritos de acuerdo con el resumen de las características del producto (HAS 2018).
Cuarto, muchos pacientes en Norteamérica toman memantina fuera de los términos de la licencia, quizás al considerar que "si funciona para la EA moderada debe funcionar para la EA leve". En 2006, se le prescribió al 19% de los pacientes con EA leve, a pesar del hecho de que en 2005 la FDA no aprobó una solicitud suplementaria de nuevo fármaco (sNDA) realizada por Forest Labs que buscaba la aprobación específica de comercialización para la indicación de EA leve (McManus 2006). Principalmente en los centros académicos que comprenden la Alzheimer Disease Neuroimaging Initiative (ADNI) el 45,7% de los pacientes con EA leve recibían memantina (Schneider 2011a). Casi el 40% de los neurólogos de los EE.UU. informan prescribir la memantina al menos en ocasiones a los pacientes con deficiencia cognitiva leve (Roberts 2010).
Quinto, los reglamentos que rigen la publicación de los resultados de los ensayos han cambiado desde la última actualización de esta revisión en 2006. En la actualidad los ensayos realizados por patrocinadores de los EE.UU. tienen que informarse en registros clínicos en el transcurso de un año de haber recopilado los últimos datos del último participante del ensayo. Esta mayor transparencia ha dado lugar a que estén disponibles datos que no han sido revisados por pares, y a la posibilidad de identificar datos que se obtuvieron, pero que todavía no están disponibles ("desconocidos conocidos"). La inclusión de datos de registro no revisados por pares en el metanálisis reduce el riesgo de sesgo debido a la publicación selectiva. También ayuda a solucionar el incumplimiento del contrato ético con los participantes del ensayo y sus familias, que se presenta cuando los datos permanecen sin publicarse: por lo general están de acuerdo en participar convencidos de que la experiencia contribuirá a que el conocimiento esté públicamente disponible.
Sexto, las estrategias farmacológicas para controlar algunos de los cambios conductuales asociados con la demencia tienen un beneficio bajo, a menudo tienen efectos secundarios y se utilizan en exceso. La considerable actividad de comercialización, en especial en los 2000, confirmó que la memantina podría ser una alternativa.
Séptimo, puede haber una ventana terapéutica de la memantina que repercuta sobre el momento en que se prescribe la memantina. Ensayos sobre la deficiencia cognitiva en la esclerosis múltiple han encontrado de forma sistemática un empeoramiento relacionado con la dosis de los síntomas neurológicos y psiquiátricos (Lovera 2010; Peyro‐Saint‐Paul 2016; Villoslada 2009), consistente con un trabajo preclínico que indica la posibilidad de una ventana terapéutica (Hardingham 2010). En la ADNI, Schneider 2011a y colegas encontraron que los pacientes que recibían memantina y ChEI tuvieron un deterioro más rápido en las escalas MMSE y Clinical Dementia Rating (CDR) (pero no en la Alzheimer's Disease Assessment Scale ‐ Cognitive subscale [ADAS‐Cog] o un cuestionario funcional) que los que recibían ChEI solo. Aunque probablemente se debió a que la memantina comenzó a ser administrada de forma temprana por médicos que observaron que los pacientes tenían un deterioro más rápido, y los resultados de las dos escalas cognitivas no son del todo consistentes, el resultado también es consistente con un efecto adverso de la memantina en la EA temprana.
Por lo tanto, es importante realizar esta revisión para investigar estas preguntas sin respuesta y estas inconsistencias, y proporcionar información clara.
Objetivos
El objetivo primario de la revisión es evaluar la eficacia y la seguridad de la memantina para el tratamiento de la demencia, como lo indicaron los ensayos clínicos en los que participaron pacientes con enfermedad de Alzheimer, demencia vascular, demencia mixta u otras formas de demencia. Además, la revisión intenta evaluar si la memantina agrega un beneficio a los pacientes que ya reciben inhibidores de la colinesterasa (ChEI).
Métodos
Criterios de inclusión de estudios para esta revisión
Tipos de estudios
Se incluyeron estudios para el análisis en esta revisión si cumplían con los siguientes criterios.
-
Asignación doble ciego al tratamiento con placebo o memantina, en grupos paralelos, controlado con placebo, con asignación al azar y sin factores de confusión
-
Se especificaron los criterios de selección de las muestras y el diagnóstico utilizó los criterios establecidos (p.ej., los criterios del Diagnostic and Statistical Manual of Mental Disorders [DSM] o la International Classification of Diseases [ICD])
-
Se especificaron los instrumentos de resultado
-
Se especificó la duración
También se incluyeron los estudios de los que se sabía que existían datos, pero que no estaban disponibles en los informes publicados, para poder evaluar la repercusión potencial del sesgo de publicación.
Los ensayos aleatorios doble ciego de memantina para la deficiencia cognitiva que no cumplieron con los criterios de inclusión (p.ej., en participantes con deficiencia cognitiva leve o los estudios de comparación directa) se tratan brevemente en "Estudios excluidos".
Tipos de participantes
Pacientes con enfermedad de Alzheimer, demencia vascular, mixta u otros tipos de demencia de todos los tipos de gravedad, tratados en el hospital o de manera ambulatoria.
Tipos de intervenciones
La memantina a cualquier dosis y por cualquier vía de administración. Aunque existe evidencia de que 20 mg una vez al día se tolera tan bien como 10 mg dos veces al día, ahora también está disponible una forma farmacéutica de liberación prolongada a una dosis "equivalente" (28 mg). Debido a esta equivalencia, y a la existencia de una licencia, se incluyó en los análisis de las dosis y las indicaciones autorizadas.
Tipos de medida de resultado
Los resultados primarios de interés incluyeron los siguientes.
-
Clasificación clínica global
-
Funcionalidad cognitiva
-
Desempeño funcional en las actividades cotidianas (AC)
-
Trastornos de la conducta
-
Incidencia de abandonos y eventos adversos
También se buscaron datos sobre los siguientes resultados pragmáticos.
-
Efecto sobre la carga del cuidador
-
Calidad de vida
-
Internación
-
Costes
Métodos de búsqueda para la identificación de los estudios
Búsquedas electrónicas
We searched ALOIS (www.medicine.ox.ac.uk/alois) ‐ the Cochrane Dementia and Cognitive Improvement Group’s Specialized Register on 25 March 2018. We used the Advanced search, with the following search terms: memantine, D‐145, DMAA, DRG‐0267, ebixa, abixa, axura, akatinol, memox and namenda.
ALOIS is maintained by the Information Specialists of the Cochrane Dementia Group and contains studies in the areas of dementia prevention, dementia treatment and cognitive enhancement in healthy people. The studies are identified from:
-
monthly searches of a number of major healthcare databases: MEDLINE, Embase, CINAHL, PsycINFO and LILACS;
-
monthly searches of a number of national and international trial registers: ISRCTN; UMIN (Japan's Trial Registry); ICTRP / WHO portal (which covers ClinicalTrials.gov; ISRCTN; the Chinese Clinical Trials Register; the German Clinical Trials Register; the Iranian Registry of Clinical Trials and the Netherlands National Trials Register, plus others);
-
quarterly search of the Cochrane Library’s Central Register of Controlled Trials (CENTRAL)
-
six‐monthly searches of a number of grey literature sources: ISI Web of Knowledge Conference Proceedings; Index to Theses; Australasian Digital Theses.
To view a list of all sources searched for ALOIS see About ALOIS on the ALOIS web site.
Details of the search strategies used for the retrieval of reports of trials from the healthcare databases, from Cochrane CENTRAL and from conference proceedings can be viewed in the ‘methods used in reviews’ section within the editorial information section of the Dementia and Cognitive Improvement Group.
We carried out additional searches in many of the sources listed above to cover the timeframe from the last searches performed for ALOIS to ensure that the search for the review was as up‐to‐date as possible. The search strategies used can be seen in Appendix 1.
We searched press releases from Merz, Lundbeck and Forest Laboratories (April 2017) and examined all releases pertaining to memantine.
The Forest, Lundbeck and JAPIC clinical trials registry and ClinicalTrials.gov were re‐examined for the final time in April 2017.
Búsqueda de otros recursos
All conference posters sponsored by Forest Laboratories, Merz or Lundbeck presented before end 2009 were provided through the medical information department of Merz..
We wrote to authors, Lundbeck, Forest, Merz and Daiichi Asubio for details about various studies as detailed in Characteristics of included studies.
Additionally, we were aware of conference posters reporting data from the Fox 2012 (MAGD) study. Review author RMcS had access to additional data from the Howard 2012 (DOMINO‐AD) study ‐ therefore we also included this information.
Obtención y análisis de los datos
Selección de los estudios
For this update, the abstracts of references newly retrieved by the search since the search conducted for the previously published version of this review were read by review authors MW, ER, JD or LF and checked by RMcS. Any disparity in the final lists was resolved by discussion in order to arrive at the final list of included studies.
Evaluación del riesgo de sesgo de los estudios incluidos
For all studies conducted since the introduction of ICH‐GCP (International Council for Harmonisation of Technical Requirements for Pharmaceuticals for Human Use ‐ Good Clinical Practice), we assumed that sequence generation, allocation concealment and blinding were all adequate and carried a low risk of bias. This was informed by prior findings, which were confirmed in the current review, of a low incidence of side‐effects which could potentially unmask allocation.
Incomplete outcome data due to participant dropout is a very common problem in dementia trials. We recorded the number of participants in each arm who did not have outcome data at the measurement point, alongside the reasons for 'missingness', and we calculated for each arm the proportion missing of those randomised. We used this approach to missing data, regardless of the method of analysis (see Dealing with missing data). In assessing risk of attrition bias for the continuous efficacy outcomes, we considered the following factors: the level of missing data, the difference between groups and the reasons for missingness. We also took into account whether the approach to missing data (e.g. observed case (OC) or last observation carried forward (LOCF)) gave different effect estimates. For the adverse events dichotomous outcome, we compared the proportions missing in each group with each other and with the adverse event risk. If there were substantial differential missing data or the missing data proportion was comparable with the adverse events risk, we rated the risk of attrition bias as high.
A further common problem is reporting bias, in which positive trials, or positive results within trials, are preferentially reported. We used funnel plots to assess whether results reported solely in trial registries were more likely to be positive than those published in peer review literature, or whether there were likely to be 'unknown unknowns': trials whose existence was not apparent despite the systematic searching. We noted in the 'Risk of bias' tables when outcomes had not been reported at all, but did not assign high risk of outcome reporting bias. Instead, we presented the results in forest plots for those studies that were known to exist, but for which no data were available. This approach did not alter estimates of effect size but was designed to show the extent of the ‘known unknowns’. In the absence of definitive information, we assumed that the numbers in the placebo and drug arms were the same. Then, for GRADE assessment, we considered downgrading on risk of bias if the potential contribution from missing studies could affect the summary statistics for studies with available data for that outcome.
Medidas del efecto del tratamiento
As described in Types of outcome measures, the analysis is focused on the five domains of clinical global, cognitive function, performance on activities of daily living (ADL) function, behaviour and adverse events. The measures used are described in more detail in Appendix 2. Table 1 details which measures were used in the AD and vascular dementia studies. For data on adverse events, we sought the numbers in each treatment group and the numbers experiencing the outcome of interest.
For analysis, we transformed the data so that all outcomes were treated as negative (i.e. a higher score indicating a worse result), as is usual in the dementia field. We transformed data for individual scales for some outcomes, but for the outcome, functional performance on ADL ‐ a positive outcome ‐ we converted the positive emphasis into a negative one, analysing the outcome as a 'lack of functional performance on ADL' and reversing the sign of the change scores. For the purposes of analysis, we have described the outcome as a 'decline in ADL'.
For interpretation of this outcome, however, we discuss the clinical effect in terms of the functionality itself, reporting the performance on ADL (so, a mean difference of 1.07 points between memantine and placebo is a clinical benefit).
Manejo de los datos faltantes
People with dementia often drop out from studies. The treatment of such missing data is controversial. The options include: (1) ignore participants who drop out and present data only on those who complete the trial and the final assessment ('completers' ‐ closely related to 'observed case' (people who had an observation at the end point) and 'per protocol' analyses); (2) impute a value of 'no change from baseline' for those who were randomised but dropped out; (3) carry forward the last value obtained from whatever time point, as if it were the value for the final time point (last observation carried forward (LOCF)); (4) include people who have dropped out of the trial but have been encouraged to return for scheduled assessments ('retrieved dropouts'); or (5) use mixed methods to take into account the data at several time points.
In dementia, which is characterised by progressive decline, the final (latest) scores for participants who drop out early will, on average, be closer to the baseline values (i.e.less severe) than for those who do not. The use of LOCF in ChEI trials has been criticised because the higher dropout rates on drug meant that it inflated estimates of the drug effect. However, when dropout rates are lower in those taking the active drug than amongst those taking placebo, the LOCF technique yields a more conservative estimate of the size of the effect of the drug than analysis of 'observed cases'. Given that a lower dropout rate on drug probably reflects a beneficial effect of the drug, this is illogical and suggests that preference for the LOCF strategy in such cases reflects either misunderstanding or mere conservatism. The 'retrieved dropout' approach may reflect better the effectiveness of the drug, but large amounts of missing data, especially differential missing data, can still lead to more conservative results. Imputation of 'no change from baseline' is the most conservative analytical strategy. The high rates of dropout in dementia trials due to factors such as caregiver and patient physical ill health mean that the use of any of these strategies reduces the power of studies to show any effect, even if real. If these results are applied in cost‐effectiveness modelling, the benefit of a drug will be underestimated because of underestimated efficacy, and also because the costs incurred by those who do not continue the drug or placebo will be less.
Because of this controversy, peer reviewed publications typically present both OC and LOCF analyses. This is not the case with summary results presented in trial registries, and in the memantine trials, registries usually, but not invariably, present OC data.
In this review, we planned to use OC analyses wherever possible, but in some analyses, we had to pool trials reporting OC and LOCF data. This is made explicit in the footnotes of the relevant forest plots. We assessed the impact of this OC approach in a sensitivity analysis, which compared the results of analyses based on the two main approaches (OC and LOCF). The sensitivity analysis supported our strategy of using OC analyses in the rest of the review. We reported explicitly the degree of missing data in the Characteristics of included studies. Where mixed methods or area‐under‐the curve methods were reported by study authors, we extracted results from these analyses only if OC results were unavailable. For the Howard 2012 (DOMINO‐AD) study, a per protocol analysis was conducted (this excluded participants who received less than 70% of their treatment) and we used this analysis in preference to retrieved dropout, mixed‐methods analysis or imputation methods, as being the closest to OC.
Síntesis de los datos
We used standard Cochrane meta‐analysis methods through RevMan 5.3. Data for the meta‐analyses were the reported raw data for each study. The data required for each trial and each outcome for continuous data were the mean change from baseline, the standard deviation of the mean change, and the number of participants for each treatment group. Where changes from baseline were not reported, we extracted the mean, standard deviation and the number of participants for each treatment group at study end. For the global impression of change outcome, the endpoint itself is of clinical relevance as all participants are by definition at the same baseline score. For some studies, we calculated th standard deviation (same for each group) using the P value for the mean difference (MD); this allowed analysis of the data using the standardised mean difference (SMD).
The summary statistics calculated by meta‐analysis of the continuous outcomes were (i) the MD, with its 95% confidence interval (CI), used when the pooled trials had the same rating scale or test, and (ii) the SMD ‐ the absolute MD divided by the standard deviation ‐ when the trials used different rating scales to assess a particular domain. Where different scales had different directions, we reversed the signs for the mean change from baseline values before conducting meta‐analysis (for example, in the ADAS‐Cog and SIB scales for cognitive impairment, higher values indicate greater and less impairment, respectively ‐ see Appendix 2 ‐ so we reversed the signs for results on the SIB scale).
At the outset, we conducted separate analyses for dementia of different aetiologies (AD; vascular dementia; Parkinson's disease dementia (PDD) or dementia with Lewy bodies (DLB); Frontotemporal dementia (FTD) and AIDS Dementia Complex).
As described in the section Dealing with missing data, we used the OC approach to missing data, wherever possible, but otherwise used what was reported by the study authors.
We initially combined all trials in AD, regardless of trial duration, severity of dementia or the presence of concomitant cholinesterase inhibitor (ChEI), and then examined these factors in pre‐specified subgroup analyses.
Análisis de subgrupos e investigación de la heterogeneidad
We assessed heterogeneity using the I² statistic (Higgins 2011) and by inspecting forest plots. An I² of more than 50% suggests that studies within an analysis may not be sufficiently similar for pooling to be valid. In such circumstances, we conducted sensitivity and subgroup analyses to examine the cause of the heterogeneity. We also examined the variability of the point estimates and the overlap of the confidence intervals, when I² values were less than 50%. Where there was evidence of heterogeneity we explored this further. Where heterogeneity could not be explained and an I² exceeded 35%, we used a random‐effects model instead of a fixed‐effect model.
For this update of the review, we explored, in subgroup analyses, the influence of the following characteristics, which were not specified in the original protocol.
-
Trial duration (< six months; six to seven months; > seven months)
-
Severity or stage of AD (mild versus moderate‐to‐severe)
-
Effect of concomitant ChEI
We also conducted meta‐regression using STATA (STATA 2013), considering the factors severity and presence of concomitant ChEIs.
Methods for subgroup analysis: mild versus moderate‐to‐severe disease
Only one study in AD investigated the effects of memantine solely in people with mild dementia, but, of our primary outcomes, only cognitive function at 12 months follow‐up was reported (Holland 2013). Some other studies randomised people with mild‐to‐moderate AD (MMSE 10‐23) but data were also available for separate subgroups of participants, either in the published study report or in a published industry‐produced meta‐analysis (Winblad 2007). The latter reported OC results separately for the subgroup of participants with moderate dementia, giving results for three mild‐to‐moderate AD studies (Bakchine 2008 (99679); Peskind 2004 (MD‐10); Porsteinsson 2008 (MD‐12). Comparison of these results with the full mild‐to‐moderate OC results allowed us to estimate the effect of memantine in mild AD. OC data for the three mild‐to‐moderate trials were kindly provided by Forest Laboratories.
To obtain the sample sizes and mean effects for the mild AD subgroup (MMSE from 20 to 23), we subtracted values for the moderate AD subgroup (MMSE 11 to 19), weighted by sample size, from the measures for all participants (MMSE from 11 to 23) (Schneider 2011b). We calculated standard deviations of the change scores for the mild subgroup using a standard formula for pooling standard deviations (Higgins 2011). We also obtained separate results for the Dysken 2014 study for six‐month data for the mild and moderate subgroups (author communication).
None of these four trials in people with mild‐to‐moderate dementia stratified the participants by severity before randomising and therefore there may be imbalance in the patient characteristics across the intervention groups for a particular subpopulation (i.e. risk of selection bias). We noted this post‐hoc splitting in the 'Risk of bias' assessments.
Análisis de sensibilidad
We conducted three sensitivity analyses, either to examine assumptions or to investigate risk of bias.
-
We assessed the impact of using an OC approach, by comparing the results of analyses based on the two main approaches (OC and LOCF).
-
We also examined the effect of high risk of bias, by conducting a sensitivity analysis in which we excluded from the analysis studies with high risk of bias for at least one domain.
-
We also examined the effect of using the results from post‐hoc subgroups for moderate severity AD, investigating the removal of such studies from the analysis of memantine versus placebo in moderate‐to‐severe AD.
'Summary of findings' table
We present the main results of the review in 'Summary of findings' tables. These tables present key information concerning the certainty of the evidence and the magnitude of the effects of the interventions examined for the main outcomes (Schünemann 2011a). 'Summary of findings' tables also include an overall grading of the evidence related to each of the main outcomes using the GRADE (Grading of Recommendations Assessment, Development and Evaluation) approach. The GRADE approach defines the certainty (formerly 'quality') of a body of evidence as the extent to which one can be confident that an estimate of effect or association is close to the true quantity of specific interest. The certainty of a body of evidence involves consideration of within‐study risk of bias, directness of evidence, heterogeneity, precision of effect estimates and risk of publication bias (Schünemann 2011b). We present the following outcomes in the 'Summary of findings' tables, with a separate table for each key comparison or population group.
-
Clinical global rating
-
Cognitive function
-
Performance on activities of daily living (ADL)
-
Behaviour and mood
-
Discontinuation (all‐cause)
-
Adverse events and serious adverse events
-
Agitation
'Back transformation' for continuous outcomes
Where an SMD analysis was conducted for continuous outcomes, we presented 'back transformed' effect estimates as the MD with its 95% CI: we transformed the overall standardised effect size to an approximate equivalent score on a particular scale for ease of interpretation (Higgins 2011). This involved multiplying the SMD by the median standard deviation for studies using a particular scale, calculated using the method of Hedges adjusted 'g'. We did this separately for each population and outcome.
In some cases (for example, ADL), the most appropriate scale was positive (i.e. the maximum score represented a better result), which potentially led to interpretation difficulties, so in the summary tables we report the baseline scores and the change from baseline on the original scales, but give the back‐transformed MD as absolute values representing improvement; the summary statistics from the analyses are also given (as negative outcomes, see Measures of treatment effect).
We analysed all continuous outcomes except clinical global rating using change scores, so for the 'Summary of Findings' Tables, we presented the control group value in two ways: firstly, as the median of the control group baseline scores for studies reporting that scale; and, secondly, as the median change from baseline for the control group.
For dichotomous outcomes, we calculated the absolute risk difference (RD) for the appropriate population using the median control group risk for those studies and the risk ratio (RR) for the analysis. For some outcomes (e.g. adverse events), we calculated the RR across studies in all populations because there were no differences between types or severities of dementia; this maximised the precision.
Assessing imprecision
Most of the efficacy outcomes are continuous variables, often reported on different scales. Effect estimates are generally small, but in the dementia field even a small improvement is considered important. Therefore, when assessing imprecision, we used a 'default' value of 400 participants as the optimal information size (OIS) (Guyatt 2011). If the evidence was based on fewer than 400 participants, we considered downgrading for imprecision. If there were more than 400 participants, we downgraded only if the 95% CI crossed the null (zero for MD or SMD) and if the CI included what might be an important benefit or harm or both. This decision was made by agreement between two review authors.
For assessing imprecision for dichotomous outcomes, we took into account the number of participants, the number of events, whether the CI crossed a risk ratio of 0.75 or 1.25 (GRADE 'default' values) and the CI around the absolute RD (Guyatt 2011).
Results
Description of studies
Studies are described in detail in Characteristics of included studies; Characteristics of excluded studies. In the former table, we report one four‐arm study four times: as two comparisons of memantine versus placebo (with or without vitamin E in both arms), and as post‐hoc subgroups for moderate and mild Alzheimer's disease (AD) for each of these comparisons (Dysken 2014). Four other studies reported results for severity subgroups and for these studies we have also extracted data and assessed risk of bias separately for the subgroups (Bakchine 2008 (99679); Peskind 2004 (MD‐10); Porsteinsson 2008 (MD‐12); Winblad 1999 (9403)). Summary details of the participants at baseline are given in Table 2 for the AD studies. Only three studies had fewer than 50% females ((Dysken 2014 ‐ 3%; Holland 2013 ‐ 35%; Ashford 2011 (95722) ‐ 38%). Most studies had a mean age between 70 and 80 years, exceptions were older participants in the Forest 2006 (MD‐22) study (mean 85 years) and the Fox 2012 (MAGD) study (mean 84 years) and younger participants in the Wang 2013 study (mean 65 years).
| Study | Number randomised | Diagnosis | Severity of disease | Mean age | Mean MMSE | % female | duration (weeks) |
| MODERATE‐TO‐SEVERE AD | |||||||
| 432 | AD | moderately severe‐to‐severe | not stated | ˜9.9 | not stated | 24 | |
| 165 | AD Nursing home | moderate‐to‐severe | 85.3 | ˜11.3 | 85 | 24 | |
| 34 | AD agitation | moderate‐to‐severe | 79.6 | 3‐18 | 80 | 12 | |
| 153 | AD agitation | moderate‐to‐severe MMSE < 20 | 84.1 | 7.5 | 72 | 12 | |
| 369 | AD agitation | moderate‐to‐severe | ˜74.9 | 11.9 | ˜58.3 | 24 | |
| 677 | AD | moderate‐to‐severe | 76.5 | 10.8 | 72 | 24 | |
| 265 | AD | moderate | ˜74.9 | 10‐19 | 58 | 12 | |
| 207 | AD | moderate‐to‐severe MMSE 5‐14 | 73.4 | ˜10.3 | 72 | 24 | |
| 295 | AD | moderate‐to‐severe (52% severe 5 to 9) | 77.1 | 9.1 | 65 | 52 | |
| 15 | AD | moderate‐to‐severe | 76.5 | ˜14.5 | 87 | 26 | |
| 250 | AD | MMSE 5‐18 | 72.3 | 11.8 | 60 | 16 | |
| 546 | AD | moderate‐to‐severe | ˜78.5 | ˜10.8 | ˜72.8 | 24 | |
| 252 | AD | moderately severe‐to‐severe | 76.1 | 7.9 | 67 | 28 | |
| 404 | AD | moderate‐to‐severe | 75.5 | 9.9 | 64.8 | 24 | |
| 350 | AD | moderate‐to‐severe | 78.2 | ˜10.1 | 71.4 | 24 | |
| 79 | AD | severe | ˜74.2 | 6.7 | ˜67 | 12 | |
| MILD‐TO‐MODERATE AD | |||||||
| 367 | AD | mild‐to‐moderate MMSE 10‐23 | not stated | 10‐23 | not stated | 24 | |
| 13 | AD | mild‐ to‐moderate | 76 | ˜21 | 38 | 52 | |
| 470 | AD | mild‐to‐moderate 11‐23 | 74 | ˜18.7 | 65 | 26 | |
| 307 and 306 (vit E) | AD | mild‐to‐moderate | ˜79.1 | 20.8 | ˜3 | 5 years | |
| 26 | AD | mild | 79.3 | ˜27.9 | 35 | 52 | |
| 226 | AD | mild‐to‐moderate | ˜72.4 | ˜22.2 | ˜63.7 | 52 | |
| 403 | AD | mild‐to‐moderate | 77.5 | 17.1 | 58.8 | 24 | |
| 432 | AD | mild‐to‐moderate | ˜75.5 | ˜16.8 | ˜52 | 24 | |
| 37 | AD | mild‐to‐moderate | 76.2 | 19.0 | 64 | 52 | |
| 22 | AD | mild‐to‐moderate | ˜65 | ˜12.1 | 64 | 22 | |
| 277 | AD | moderate | 74 | 16.8 | 57 | 52 | |
Results of the search
The searches generated a total of 3262 results. After de‐duplication and first assessment based on title and abstract screening, we obtained 264 in full text (Figure 1). We excluded 113 studies (see Characteristics of excluded studies). We added 32 new randomised controlled trials (RCTs) to the 12 studies in the previous 2006 update. Overall, these 44 studies were described in 148 reports. We are also aware of three ongoing studies (see Characteristics of ongoing studies).

Study flow diagram of studies identified
Included studies
Forty‐four studies fulfilled the inclusion criteria, comprising 9811 participants (Aarsland 2009; Asada 2011 (MA3301); Asada 2011a (IE3501); Ashford 2011 (95722); Bakchine 2008 (99679); Boxer 2013; Ditzler 1991; Dysken 2014; Emre 2010 (11018); Forest 2006 (MD‐22); Forest 2006 (MD‐23); Fox 2012 (MAGD); Herrmann 2012 (10158); Gortelmeyer 1992; Grossberg 2008 (MD‐50); Hofbauer 2009 (MD‐71); Holland 2013; Homma 2007 (IE2101); Howard 2012 (DOMINO‐AD); Leroi 2009; Lorenzi 2011 (SC05‐03); Lundbeck 2006 (10116); Lundbeck 2006 (99817); Marsh 2009 PDD; Medina 2011; Merz 2003 (MRZ‐9104); Merz 2003 (MRZ‐9105); Merz 2003 (MRZ‐9206); Nakamura 2016; Orgogozo 2002 (9408); Pantev 1993; Peskind 2004 (MD‐10); Peters 2015 (MEGACOMBI2); Porsteinsson 2008 (MD‐12); Reisberg 2003 (9605); Schifitto 2007; Schmidt 2008; Tariot 2004 (MD‐02); van Dyck 2007 (MD‐01); Vercelletto 2011; Wang 2013; Wilcock 2002 (9202); Wilkinson 2012 (10112); Winblad 1999 (9403)). The mean sample size was 223 and the median and range were 182.5 (13 to 677); 20 studies had more than 200 participants. Seven studies were reported solely as registry data or via author communication (Asada 2011 (MA3301); Forest 2006 (MD‐22); Forest 2006 (MD‐23); Lundbeck 2006 (99817); Marsh 2009 PDD; Merz 2003 (MRZ‐9105); Merz 2003 (MRZ‐9206)); and we obtained responses to requests for further information from the authors (or companies) of 16 studies (Asada 2011a (IE3501); Asada 2011 (MA3301); Bakchine 2008 (99679); Herrmann 2012 (10158); Grossberg 2008 (MD‐50); Homma 2007 (IE2101); Howard 2012 (DOMINO‐AD); Lundbeck 2006 (10116); Lundbeck 2006 (99817); Merz 2003 (MRZ‐9104); Merz 2003 (MRZ‐9105); Merz 2003 (MRZ‐9206); Peskind 2004 (MD‐10); Porsteinsson 2008 (MD‐12); Schmidt 2008; Wilkinson 2012 (10112)).
We have not been able to identify the results or any associated publications or announcements belonging to four studies: Lundbeck 2006 (99817) was a 12‐week study in Taiwan of 47 people with AD; Merz 2003 (MRZ‐9105) was a 12‐week study in Portugal of 27 people with 'primary dementia'; Merz 2003 (MRZ‐9104) was a 13‐week study in France of 56 people with AD; and Merz 2003 (MRZ‐9206) was a 14‐week study in Sweden of 56 people with vascular dementia.
Trial duration varied from six weeks to 2.27 years (mean), with the majority of studies having a duration of six months. Fourteen studies had a duration of less than six months (Ditzler 1991; Forest 2006 (MD‐23); Fox 2012 (MAGD); Gortelmeyer 1992; Hofbauer 2009 (MD‐71); Leroi 2009; Lundbeck 2006 (10116); Lundbeck 2006 (99817); Merz 2003 (MRZ‐9104); Merz 2003 (MRZ‐9105); Merz 2003 (MRZ‐9206); Pantev 1993; Schifitto 2007; Winblad 1999 (9403)). Eight studies reported results at 12 months or longer (Ashford 2011 (95722); Dysken 2014; Holland 2013; Howard 2012 (DOMINO‐AD); Peters 2015 (MEGACOMBI2); Schmidt 2008; Vercelletto 2011; Wilkinson 2012 (10112)), and of these, one provided interim results at 30 weeks (Howard 2012 (DOMINO‐AD)); and three at six months (Dysken 2014; Peters 2015 (MEGACOMBI2); Schmidt 2008).
Fifteen trials were conducted in North America: including 14 in the USA (Ashford 2011 (95722); Boxer 2013; Dysken 2014; Forest 2006 (MD‐22); Forest 2006 (MD‐23), Holland 2013; Marsh 2009 PDD; Medina 2011; Peskind 2004 (MD‐10); Porsteinsson 2008 (MD‐12); Reisberg 2003 (9605); Schifitto 2007; Tariot 2004 (MD‐02); van Dyck 2007 (MD‐01)), and one in Canada (Herrmann 2012 (10158)). Twenty trials were conducted in Europe, including four in the UK (Fox 2012 (MAGD); Howard 2012 (DOMINO‐AD); Leroi 2009; Wilcock 2002 (9202)); four in Germany (Ditzler 1991; Gortelmeyer 1992; Pantev 1993; Peters 2015 (MEGACOMBI2)); two in France (Merz 2003 (MRZ‐9104); Vercelletto 2011); one each in Austria (Schmidt 2008); Italy (Lorenzi 2011 (SC05‐03)); Latvia (Winblad 1999 (9403)); Portugal (Merz 2003 (MRZ‐9105)); Sweden (Merz 2003 (MRZ‐9206)); and five in more than one European country (Aarsland 2009; Bakchine 2008 (99679); Emre 2010 (11018); Orgogozo 2002 (9408); Wilkinson 2012 (10112)). Four trials were conducted in Japan (Asada 2011 (MA3301); Asada 2011a (IE3501); Homma 2007 (IE2101); Nakamura 2016); two in China (Lundbeck 2006 (10116); Wang 2013); and one in Taiwan (Lundbeck 2006 (99817)). The other two studies were international trials (Grossberg 2008 (MD‐50); Hofbauer 2009 (MD‐71)).
Funding
All studies had some funding from industry, with one exception (Schifitto 2007), although in three trials the only input was the provision of drugs and the main sponsors were the UK Medical Research Council; the US Veterans Affairs Co‐operative Studies Program and the Bundesministerium fűr Bildung und Forschung (respectively, Howard 2012 (DOMINO‐AD)Dysken 2014 and Peters 2015 (MEGACOMBI2)).
Eleven trials were sponsored by Merz Pharmaceuticals GmbH, Germany (Ditzler 1991; Gortelmeyer 1992; Merz 2003 (MRZ‐9104); Merz 2003 (MRZ‐9105); Merz 2003 (MRZ‐9206); Orgogozo 2002 (9408); Pantev 1993; Reisberg 2003 (9605); Schmidt 2008; Wilcock 2002 (9202); Winblad 1999 (9403). Fourteen trials were sponsored by Forest Laboratories Inc, US (Ashford 2011 (95722); Boxer 2013; Forest 2006 (MD‐22); Forest 2006 (MD‐23); Grossberg 2008 (MD‐50); Hofbauer 2009 (MD‐71); Holland 2013; Marsh 2009 PDD; Medina 2011; Peskind 2004 (MD‐10); Porsteinsson 2008 (MD‐12); Tariot 2004 (MD‐02); van Dyck 2007 (MD‐01)); and this company also provided drugs for one trial (Dysken 2014).
Twelve trials were sponsored by H. Lundbeck A/S, Denmark (Aarsland 2009; Bakchine 2008 (99679); Emre 2010 (11018); Fox 2012 (MAGD); Herrmann 2012 (10158); Leroi 2009; Lorenzi 2011 (SC05‐03); Lundbeck 2006 (10116); Lundbeck 2006 (99817); Vercelletto 2011; Wang 2013); and this company also provided drugs for one trial (Howard 2012 (DOMINO‐AD)). One trial was sponsored by both Merz and Lundbeck (Wilkinson 2012 (10112)).
Four trials were sponsored by Daiichi Sankyo Co. Ltd, Japan (Asada 2011 (MA3301); Asada 2011a (IE3501); Homma 2007 (IE2101); Nakamura 2016).
Patient characteristics
Diagnosis
The diagnosis of dementia was established using the latest versions of the Diagnostic and Statistical Manual of Mental Disorders (DSM III‐R; DSM IV) in 17 studies (Aarsland 2009; Asada 2011a (IE3501); Ashford 2011 (95722); Bakchine 2008 (99679); Emre 2010 (11018); Gortelmeyer 1992; Grossberg 2008 (MD‐50); Homma 2007 (IE2101); Leroi 2009; Marsh 2009 PDD; Orgogozo 2002 (9408); Pantev 1993; Reisberg 2003 (9605); Schmidt 2008; Wang 2013; Wilcock 2002 (9202); Winblad 1999 (9403)). Eleven other studies included people diagnosed with probable AD (McKhann 1984), according to the criteria of the National Institute of Neurologic, Communicative Disorders and Stroke and Alzheimer's Disease and Related Disorders Association (NINCDS‐ADRDA) (Asada 2011 (MA3301); Fox 2012 (MAGD); Herrmann 2012 (10158); Lorenzi 2011 (SC05‐03); Nakamura 2016; Peskind 2004 (MD‐10); Peters 2015 (MEGACOMBI2); Porsteinsson 2008 (MD‐12); Tariot 2004 (MD‐02); van Dyck 2007 (MD‐01); Wilkinson 2012 (10112)); and two studies included people diagnosed with probable or possible AD according to the same criteria (Dysken 2014; Howard 2012 (DOMINO‐AD)). The other studies did not report diagnosis by these criteria.
Type and severity of dementia
Almost all the studies measured severity of dementia as defined by scores on the Mini Mental State Examination (MMSE) (Folstein 1975). Three exceptions used the Sandoz Clinical Assessment Geriatric Scale (SCAG) (Ditzler 1991; Gortelmeyer 1992; Pantev 1993).
Twenty‐eight studies were in people with AD (Asada 2011 (MA3301); Asada 2011a (IE3501); Ashford 2011 (95722); Bakchine 2008 (99679); Dysken 2014; Forest 2006 (MD‐22); Forest 2006 (MD‐23); Fox 2012 (MAGD); Herrmann 2012 (10158); Grossberg 2008 (MD‐50); Hofbauer 2009 (MD‐71); Holland 2013; Homma 2007 (IE2101); Howard 2012 (DOMINO‐AD); Lorenzi 2011 (SC05‐03); Lundbeck 2006 (10116); Lundbeck 2006 (99817); Merz 2003 (MRZ‐9104); Nakamura 2016; Peskind 2004 (MD‐10); Peters 2015 (MEGACOMBI2); Porsteinsson 2008 (MD‐12); Reisberg 2003 (9605); Schmidt 2008; Tariot 2004 (MD‐02); van Dyck 2007 (MD‐01); Wang 2013; Wilkinson 2012 (10112)). We also included a subpopulation from a further study (Winblad 1999 (9403) AD), which reported an AD subgroup from the study Winblad 1999 (9403). These studies randomised a total of 7885 participants with AD.
Of these AD studies, one was in people with mild AD (Holland 2013); nine were in people with mild‐to‐moderate AD (Asada 2011 (MA3301); Ashford 2011 (95722); Bakchine 2008 (99679); Dysken 2014; Lundbeck 2006 (99817); Peskind 2004 (MD‐10); Peters 2015 (MEGACOMBI2); Porsteinsson 2008 (MD‐12); Schmidt 2008); two were in people with moderate AD (Hofbauer 2009 (MD‐71); Wilkinson 2012 (10112)); 15 were in people with moderate‐to‐severe AD (Asada 2011a (IE3501); Forest 2006 (MD‐22); Forest 2006 (MD‐23); Fox 2012 (MAGD); Herrmann 2012 (10158); Grossberg 2008 (MD‐50); Homma 2007 (IE2101); Howard 2012 (DOMINO‐AD); Lorenzi 2011 (SC05‐03); Lundbeck 2006 (10116); Nakamura 2016; Reisberg 2003 (9605); Tariot 2004 (MD‐02); van Dyck 2007 (MD‐01); Wang 2013); and we were unable to establish the severity in one study (Merz 2003 (MRZ‐9104)). Three of these studies reporting mean MMSE scores at baseline had a mean score of less than 10, suggesting that at least 50% of participants had severe AD (Fox 2012 (MAGD); Howard 2012 (DOMINO‐AD); Reisberg 2003 (9605)); the Winblad 1999 (9403) AD subgroup was selected to have a MMSE score below 10. One of the mild‐to‐moderate AD studies had a mean MMSE score of 22, so most people had mild dementia (Peters 2015 (MEGACOMBI2)).
Three studies involved people with vascular dementia, defined by the NINDS‐AIREN criteria (Merz 2003 (MRZ‐9206); Orgogozo 2002 (9408); Wilcock 2002 (9202)); 956 participants were randomised. One of these studies was in people with 'moderately severe' dementia (but reported no results) (Merz 2003 (MRZ‐9206)) and the other two studies recruited people with mild‐to‐moderate dementia.
Three short, phase II trials of four to six weeks in 213 participants included both AD and vascular dementia in various proportions (Ditzler 1991; Gortelmeyer 1992; Winblad 1999 (9403)); the Hachinski score was used to differentiate between AD and vascular dementia. Two further studies included both AD and vascular dementia, but there is no record of an attempt to distinguish the different types of dementia (Merz 2003 (MRZ‐9105); Pantev 1993). Two studies included people with mild‐to‐moderate dementia (Ditzler 1991; Gortelmeyer 1992); participants in one study had severe dementia (Winblad 1999 (9403)); participants in one study were equally divided between mild, moderate and severe disease (Pantev 1993); and one study reported "mild to‐moderate severe stages of primary dementia" (Merz 2003 (MRZ‐9105)).
The remaining studies included participants with other types of dementia: four studies in 319 participants with Parkinson's disease dementia (PDD) or dementia with Lewy bodies (DLB) (Aarsland 2009; Emre 2010 (11018), Leroi 2009; Marsh 2009 PDD); two studies in 133 participants with frontotemporal dementia (FTD) (Boxer 2013; Vercelletto 2011); one study in 140 participants with HIV AIDS dementia complex (Schifitto 2007); and one study in 50 participants with Huntingdon's Disease (this study, however, presented no useable data) (Medina 2011).
Three studies stated they selectively included patients with agitation (Forest 2006 (MD‐23); Fox 2012 (MAGD); Herrmann 2012 (10158)); 556 participants were randomised. One of these studies investigated treatment for those with agitation living in the community (Forest 2006 (MD‐23)); this study was terminated after recruiting only 34 participants, but reported these results. A second study recruited participants living in the community, who were specifically selected for the presence of agitation and aggression at baseline (Herrmann 2012 (10158)); the trial was prematurely terminated because of difficulty in recruitment (only recruiting 82% of the planned participants), but reported results. The third study of institutionalised patients with agitation specified a primary outcome of Cohen‐Mansfield Agitation Index (CMAI) score at six weeks (Fox 2012 (MAGD)).
Interventions assessed
The majority of studies randomised participants to memantine at its licensed dose of 20 mg daily (or placebo). One study used an extended release preparation of 28 mg/day, equivalent to 20 mg daily (Grossberg 2008 (MD‐50)). Two studies investigated a dose of 10 mg/day memantine versus placebo (Ashford 2011 (95722); Winblad 1999 (9403)); and two other studies included a 10 mg/day arm, alongside 20 mg/day and placebo (Asada 2011 (MA3301); Homma 2007 (IE2101)).
Seven studies compared the efficacy and safety of memantine (versus placebo) in people who were already receiving stable treatment with donepezil (Dysken 2014; Herrmann 2012 (10158); Grossberg 2008 (MD‐50); Lorenzi 2011 (SC05‐03); Nakamura 2016; Porsteinsson 2008 (MD‐12);Tariot 2004 (MD‐02)). Five other studies included some participants who were already on cholinesterase inhibitors (ChEIs): 72% (Wilkinson 2012 (10112)); 50% (Marsh 2009 PDD); 86% for memantine and 67% for placebo (Ashford 2011 (95722)); 19% and 23% (Fox 2012 (MAGD)); and 18% and 14% (Leroi 2009). Two other studies allowed the continuation of stable ChEIs, but did not state the proportions involved (Hofbauer 2009 (MD‐71); Holland 2013). One study was in people who were anti‐dementia drug naive at baseline and were randomised to memantine plus galantamine (a ChEI) versus placebo plus galantamine (Peters 2015 (MEGACOMBI2)).
One study actively discontinued ChEIs before starting memantine or placebo (Bakchine 2008 (99679); another had participants who had ChEIs discontinued because of a lack of efficacy (Schmidt 2008). One four‐arm study included 295 participants who were on stable ChEIs, but were being considered for a change of drug treatment; the participants were randomised to discontinue or continue donepezil, as well as randomising to memantine or placebo (Howard 2012 (DOMINO‐AD)). One study did not permit ChEIs within 30 days of the trial, although 55% had prior use of donepezil (Peskind 2004 (MD‐10)). Another study reported previous use of drugs for dementia by the participants, but without specifying types (Winblad 1999 (9403)).
One four‐arm study randomised 613 participants to concurrent vitamin E or placebo, as well as randomising to memantine or placebo (Dysken 2014).
Outcome measures
The range of outcome measures used in the studies is summarised in Table 1.
Adverse events (AEs) were reported in various ways: the number of people with any AE (at least one per person); the number with at least one serious AE (SAE) and results were also given separately for the number of people with specific AEs (agitation, insomnia, confusion (as an AE), depression, headache, hypertension, dizziness, fall, accidental injury, urinary incontinence, diarrhoea and influenza‐like symptoms). For these specific AEs, registry data were commonly presented separately for AEs and SAEs, but it was unclear whether there was overlap between the set of participants with a specific outcome recorded as an AE and the set of participants with that outcome recorded as an SAE. Therefore, we used results for the AE set only unless the outcome was solely reported as SAEs.
Adverse events across all diagnoses and durations are reported in Effects of interventions, section 5 and also separately for each diagnosis. These analyses were restricted to the 20 mg/day or equivalent dose of memantine.
Excluded studies
We excluded 115 studies (Figure 1) at the full‐text stage. Details are given in the Characteristics of excluded studies table, but the main reasons for exclusion were: 15 were not RCTs; 18 were not double‐blinded; the population in 16 studies did not have dementia (or not solely dementia participants); 16 studies were not placebo controlled; 24 were post‐hoc analyses or had inappropriate ways of combining data; and eight studies compared memantine with other interventions. We obtained the full papers for 11 systematic reviews in order to check the references, but there was no new information found (systematic reviews that did provide additional information were added as references to the included studies).
Risk of bias in included studies
A detailed analysis of the risks of bias for each study can be found in Characteristics of included studies. 'Risk of bias' domain ratings are shown per study in Figure 2 and percentage contributions for each domain are shown in Figure 3.
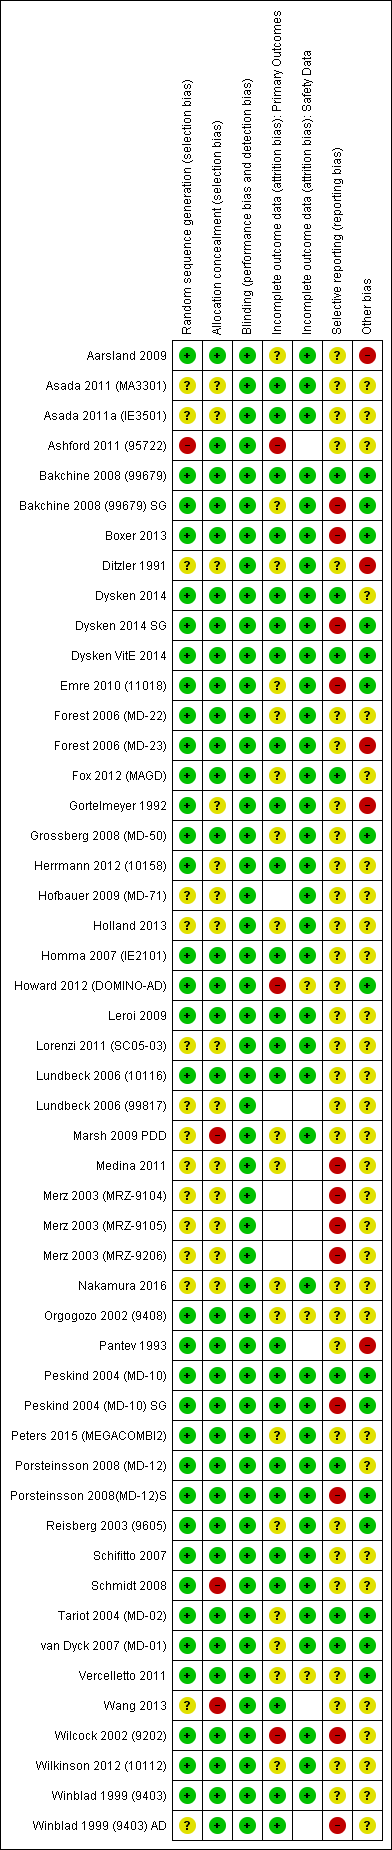
'Risk of bias' summary: review authors' judgements about each risk of bias item for each included study.
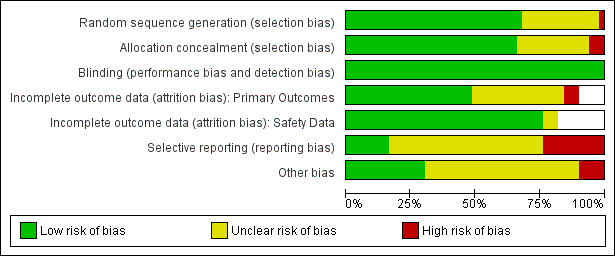
'Risk of bia's graph: review authors' judgements about each risk of bias item presented as percentages across all included studies.
Allocation
We assessed four studies to be at high risk of selection bias because of large differences in outcome at baseline that were as large or larger than the effect size for most outcomes (Aarsland 2009; Ashford 2011 (95722); Marsh 2009 PDD; Wang 2013); e.g. in one study (Wang 2013), 15.3 points baseline difference in Severe Impairment Battery (SIB), four points for MMSE, three points for Neuropsychiatric Inventory (NPI). The Aarsland 2009 study had baseline differences despite adequate methods of sequence generation and allocation concealment, and this is recorded as 'other' risk of bias. We considered one study to be at high risk of bias because of differences in the levels of concurrent neuroleptic medications: 33% in the placebo group and 28% in the memantine group, and because of a 10‐point difference in activities of daily living (ADL) at baseline (Schmidt 2008).
Other studies reporting differences at baseline for particular outcomes that are comparable with the effect estimate are considered in the results sections for those outcomes.
Blinding
All studies were double blinded ‐ this was an inclusion criterion ‐ and all were at low risk of bias for this domain.
Incomplete outcome data
We considered three studies to have a high risk of attrition bias for the efficacy outcomes of the review: one very small study had missing data of 43% (memantine) and 0% (placebo) (Ashford 2011 (95722)); a second study reported a per protocol analysis at 30 weeks for which excluded data were: 45% (memantine), 60% (placebo); 30% (memantine + donepezil) and 32% (placebo + donepezil); sensitivity analyses comparing the per protocol analysis with a 'completed follow‐up' analysis showed some differences in effect estimate (Howard 2012 (DOMINO‐AD)). The third study also reported a per protocol analysis for which excluded data were 35% (memantine) and 43% (placebo) (Wilcock 2002 (9202)).
Selective reporting
We considered four studies to be at high risk of bias for selective reporting of outcomes: one study decided post hoc to reduce the Clinical Global Impression of Change (CGIC) values to three categories (Boxer 2013); the second did not report the numbers of participants for the observed case (OC) analysis and we had to make assumptions (Emre 2010 (11018)); and the third reported missing scores for some participants that were not explained ( Nurse's Observational Scale for Geriatric Patients (NOSGER) outcomes) (Wilcock 2002 (9202)). Where other studies did not report outcomes or did not provide sufficient data to analyse, we included these studies in the appropriate forest plots and estimated their contribution to the whole meta‐analysis, as described in the Assessment of risk of bias in included studies section.
We also assessed the five studies that reported post‐hoc subgroups to be at high risk of outcome reporting bias for those subpopulations (Bakchine 2008 (99679) SG; Dysken 2014 SG; Peskind 2004 (MD‐10) SG; Porsteinsson 2008(MD‐12)S; Winblad 1999 (9403) AD).
Other potential sources of bias
We recorded three other studies as having high risk of bias because they had an outdated diagnosis of AD (Ditzler 1991; Gortelmeyer 1992; Pantev 1993). We considered one study to be at high risk of bias because the trial was terminated early without explanation given (Forest 2006 (MD‐23)).
Overall risk of bias
The overall risk of bias for most studies was either unclear or low (Figure 2). We considered three studies to have low risk of bias for all domains (Bakchine 2008 (99679); Dysken VitE 2014; Peskind 2004 (MD‐10)).
We assessed two studies to be at high risk of bias for at least two domains (Ashford 2011 (95722); Wilcock 2002 (9202) for NOSGER outcomes), and 11 other studies to be at high risk of bias for one domain (Aarsland 2009; Boxer 2013; Ditzler 1991; Emre 2010 (11018); Forest 2006 (MD‐23); Gortelmeyer 1992; Howard 2012 (DOMINO‐AD); Marsh 2009 PDD; Pantev 1993; Schmidt 2008; Wang 2013). We considered post‐hoc subgroups of five studies to be at high risk of bias for one domain (Bakchine 2008 (99679) SG; Dysken 2014 SG; Peskind 2004 (MD‐10) SG; Porsteinsson 2008(MD‐12)S; Winblad 1999 (9403) AD).
Effects of interventions
See: Summary of findings for the main comparison Moderate‐to‐severe AD, six to seven months; Summary of findings 2 Vascular dementia ‐ mild‐to‐moderate severity. six months
We present the efficacy results according to the aetiology of the dementia in sections 1 to 3 below. We compare effects across different types of dementia in section 4. We describe safety data, including discontinuation (all‐cause and that due to adverse events) and adverse events outcomes in section 5 for all aetiologies of dementia, represented on the same forest plots, with analyses featuring separate subgroups.
We conducted the main analyses as observed case (OC), for the reasons discussed in the Dealing with missing data section, and also tested the OC approach in sensitivity analyses in comparison with the last observation carried forward (LOCF) approach (Appendix 3).
We produce a 'Summary of findings' table for most sections (summary of findings Table for the main comparison; summary of findings Table 2; Table 3; Table 4; Table 5; Table 6; Table 7; Table 8). We generally analysed the efficacy outcomes as standardised mean difference (SMD), but back‐transformed to a common scale. Similarly, for dichotomous (safety) outcomes, we calculated the absolute risk difference (RD) for the relevant population. In doing so, we reported safety outcomes either for all trials of memantine (across all aetiologies) or for separate sub‐populations, depending on the safety outcome concerned.
| Memantine 20 mg or equivalent compared to placebo, with concomitant ChEI, for moderate‐to‐severe AD. 24‐30 week data. OC | ||||||
| Population: Alzheimer's disease, moderate‐to‐severe | ||||||
| Continuous outcomes | Score with placebo (median) | Mean improvement in change score between memantine and placebo | SMD (95% CI) meta‐analysis findings | № of participants | Certainty of the evidence | Comments |
| Clinical Global (CIBIC+) | The median CIBIC+ score was 4.5 3 (i.e. deterioration with time) | MD: 0.21 (0.06 to 0.36) | ‐0.21 (‐0.32 to ‐0.09) | 1125 | ⊕⊕⊕⊝ | Analysed as mean difference. Random effects (Analysis 2.8) [SMD as a negative outcome (Analysis 2.1)] |
| Cognitive Function (SIB) | Mean SIB score at baseline: 77.6. Mean change from baseline (positive scale): ‐1.2 4 (i.e. slight deterioration with time) | MD: 2.48 (1.45 to 3.41) | ‐0.24 (‐0.33 to ‐0.14) | 1852 | ⊕⊕⊕⊕ | SMD as a negative outcome Converted to SIB scale (and scale direction inverted); median SD(pooled) = 10.34. |
| Performance on ADL: (ADCS‐ADL19) | Mean ADCS‐ADL19 score at baseline: 34.3. Mean change from baseline (positive scale): ‐2.2 5 (i.e. deterioration over time) | MD: 0.95 (0.22 to 1.76) | ‐0.13 (‐0.24 to ‐0.03) | 1319 | ⊕⊕⊕⊕ | SMD for decline in ADL as a negative outcome (Analysis 2.3) Converted to ADCS‐ADL19 scale (and scale direction inverted); median SD(pooled) = 7.33. |
| Behaviour and Mood (NPI) 144‐point scale | Median baseline NPI score was 16.5. Median change from baseline (negative scale): 2.80 6 (i.e. deterioration with time) | MD: 2.20 (1.10 to 3.29) | ‐0.18 (‐0.27 to ‐0.09) | 1855 | ⊕⊕⊕⊕ | SMD as a negative outcome (Analysis 2.4) Converted to NPI scale; median SD(pooled) = 12.20 |
| Binary outcomes | Anticipated absolute effects | Relative effect | № of participants | Certainty of the evidence | Comments | |
| Risk with placebo (median) | Risk with memantine | |||||
| All‐cause discontinuation | 168 per 1000 | 156 per 1000 | RR 0.93 | 5087 | ⊕⊕⊕⊕ | RR for all moderate‐to‐severe AD studies (apart from those with agitation) (Analysis 16.5). Median control group risk for 6 studies in 2089 people with moderate‐to‐severe AD without agitation, receiving ChEIs (Analysis 2.9) |
| Difference: 12 fewer people per 1000 discontinued treatment for any cause (95% CI 29 fewer to 7 more) | ||||||
| Number suffering at least one adverse event | 639 per 1000 | 658 per 1000 | RR 1.03 | 8033 5371 events | ⊕⊕⊕⊕ | RR from all studies (Analysis 9.3). Median control group risk for moderate‐to‐severe AD studies in people receiving ChEIs (Analysis 2.11) |
| Difference: 19 more people per 1000 suffered adverse events | ||||||
| Number suffering at least one serious adverse event | 114 per 1000 | 104 per 1000 (93 to 116) | RR 0.91 | 6482 (19 RCTs) 918 events | ⊕⊕⊕⊕ | RR and median control risk from all AD studies (except those with agitation) (from Analysis 8.10) |
| Difference: 10 fewer people per 1000 suffered serious adverse events (95% CI 21 fewer to 2 more) | ||||||
| Number suffering agitation as an adverse event | 45 per 1000 | 41 per 1000 | RR 0.92 | 1225 3 79 events | ⊕⊕⊝⊝ | RR and median control group risk for studies in people with moderate‐to‐severe AD without agitation, receiving ChEIs (Analysis 2.13) |
| Difference: 4 fewer people per 1000 suffered agitation as an adverse event | ||||||
| *The risk in the intervention group (and its 95% confidence interval) is based on the assumed risk in the comparison group and the relative effect of the intervention (and its 95% CI). We adopt the convention that a negative mean difference always means an improvement (i.e. favouring memantine) | ||||||
| GRADE Working Group grades of evidence | ||||||
1 Some inconsistency or variation in the point estimates (downgraded once for inconsistency)
2 79 events; imprecision around relative effect (CI crossing 1.25 and 0.75)(downgraded twice)
3 Median control group values for 3 studies reporting CIBIC+ (Grossberg 2008 (MD‐50); Porsteinsson 2008(MD‐12)S; Tariot 2004 (MD‐02))
4 Mean control group baseline scores and mean control group change from baseline for 2 studies reporting SIB (Grossberg 2008 (MD‐50); Tariot 2004 (MD‐02))
5 Mean control group baseline scores and mean control group change from baseline for the 2 studies reporting ADCS‐ADL19 (Grossberg 2008 (MD‐50); Tariot 2004 (MD‐02))
6 Median control group baseline scores and median control group change from baseline for the 5 studies reporting NPI (Dysken 2014 SG; Grossberg 2008 (MD‐50); Howard 2012 (DOMINO‐AD); Porsteinsson 2008(MD‐12)S; Tariot 2004 (MD‐02))
| Memantine 20 mg or equivalent compared to placebo, monotherapy, for moderate‐to‐severe AD. 24‐to 30‐week data observed case (OC) | ||||||
| Population: Alzheimer's disease, moderate‐to‐severe | ||||||
| Outcomes | Score with placebo (median) | Mean improvement in change score between memantine and placebo | SMD (95% CI) meta‐analysis findings | № of participants | Certainty of the evidence | Comments |
| Clinical Global 7‐point Likert scale | The median CIBIC+ score was 4.64 3 (i.e. deterioration with time) | MD: 0.22 (0.11 to 0.33) | ‐0.20 (‐0.30 to ‐0.10) | 1672 | ⊕⊕⊕⊕ | SMD as a negative outcome (Analysis 2.1). Converted to CIBIC+ scale; median SD(pooled) = 1.09. |
| Cognitive Function 100‐point scale | Median SIB score at baseline: 68.3. Median change from baseline (positive scale): ‐5.6 4 (i.e. deterioration with time) | MD: 3.97 (2.77 to | ‐0.33 (‐0.43 to ‐0.23) | 1485 | ⊕⊕⊕⊕ | SMD as a negative outcome (Analysis 2.2) Converted to SIB scale (and scale direction inverted); median SD(pooled) = 12.04. |
| Performance on ADL | Mean ADCS‐ADL19 score at baseline: 30.5. Mean change from baseline (positive scale): ‐4.15 (i.e. deterioration with time) | MD: 1.33 (0.20 to 2.00) | ‐0.20 (‐0.30 to ‐0.09) | 1368 | ⊕⊕⊕⊕ | SMD for decline in ADL as a negative outcome (Analysis 2.3) Converted to ADCS‐ADL19 scale (and scale direction inverted); median SD(pooled) = 6.67. |
| Behaviour and Mood (NPI) 144‐point scale | Median baseline NPI score was 18.5. Median change from baseline (negative scale): 1.95 6 (i.e. slight deterioration with time) | MD: 1.57 (0.16 to 2.98) | ‐0.10 (‐0.19 to ‐0.01) | 1819 | ⊕⊕⊕⊕ | SMD as a negative outcome (Analysis 2.4) Converted to NPI scale; median SD(pooled) = 15.70. |
| Binary outcomes | Anticipated absolute effects | Relative effect | № of participants | Certainty of the evidence | Comments | |
| Risk with placebo (median) | Risk with memantine | |||||
| All‐cause discontinuation | 188 per 1000 | 175 per 1000 | RR 0.93 | 5087 924 events | ⊕⊕⊕⊕ | RR for all studies in people with moderate‐to‐severe AD (apart from those with agitation) (Analysis 16.5). Median control group risk for 10 studies in 2459 people with moderate‐to‐severe AD without agitation, receiving monotherapy (Analysis 2.9) |
| Difference: 13 fewer people per 1000 discontinued treatment for any cause (95% CI 32 fewer to 8 more) | ||||||
| Number suffering at least one adverse event | 760 per 1000 | 783 per 1000 | RR 1.03 | 8033 5371 events | ⊕⊕⊕⊕ | RR from all studies (Analysis 9.3).Median control group risk for moderate‐to‐severe AD studies in people receiving monotherapy (Analysis 2.11) |
| Difference: 23 more people per 1000 suffered adverse events | ||||||
| Number suffering at least one serious adverse event | 114 per 1000 | 104 per 1000 (93 to 116) | RR 0.91 | 6482 (19 RCTs) 918 events | ⊕⊕⊕⊕ | RR and median control risk from all AD studies (except those with agitation) (from Analysis 8.10) |
| Difference: 10 fewer people per 1000 suffered serious adverse events (95% CI 21 fewer to 2 more) | ||||||
| Number suffering agitation as an adverse event | 164 per 1000 | 112 per 1000 | RR 0.68 | 1016 154 events | ⊕⊕⊕⊝ | RR and median control group risk for studies in people with moderate‐to‐severe AD without agitation, receiving monotherapy (Analysis 2.13) |
| Difference: 52 fewer people per 1000 suffered agitation as an adverse event | ||||||
| *The risk in the intervention group (and its 95% confidence interval) is based on the assumed risk in the comparison group and the relative effect of the intervention (and its 95% CI). | ||||||
| GRADE Working Group grades of evidence | ||||||
1 Some inconsistency in point estimates, but insufficient to downgrade
2 Some imprecision (193 events and borderline for CI crossing 1; CI crossed 0.75) and some inconsistency in point estimates ‐ downgrade once overall
3 Median control group values for 4 studies reporting CIBIC+ (Bakchine 2008 (99679) SG; Peskind 2004 (MD‐10) SG; Reisberg 2003 (9605); van Dyck 2007 (MD‐01))
4 Median control group baseline scores and mean control group change from baseline for 3 studies reporting SIB (Reisberg 2003 (9605); van Dyck 2007 (MD‐01); Wang 2013)
5 Mean control group baseline scores and mean control group change from baseline for the 2 studies reporting ADCS‐ADL19 (Reisberg 2003 (9605); van Dyck 2007 (MD‐01))
6 Median control group baseline scores and median control group change from baseline for the 4 studies reporting NPI (Howard 2012 (DOMINO‐AD); Reisberg 2003 (9605); van Dyck 2007 (MD‐01); Wang 2013)
| Memantine 20 mg or equivalent compared to placebo, for moderate‐to‐severe AD, selected for agitation | ||||||
| Population: Alzheimer's disease, moderate‐to‐severe, selected for agitation | ||||||
| Outcomes | Score with placebo (median) | Mean improvement in change score between memantine and placebo | SMD (95% CI) meta‐analysis findings | № of participants | Certainty of the evidence | Comments |
| Clinical Global 7‐point Likert scale | The CIBIC+ score from one study was 4.63 5 (i.e. deterioration with time) | MD: 0.14 (‐0.17 to 0.44) (random effects) 24 week study only: MD: ‐0.05 (‐0.35 to 0.25) (Herrmann 2012 (10158)) | ‐0.11 (‐0.34 to 0.13) (random effects) | 443 24 week study: 275 participants | ⊕⊕⊝⊝ | SMD as a negative outcome (Analysis 3.5). Heterogeneity between 12 weeks (2 studies) and 24 weeks. Converted to CIBIC+ scale; SD(pooled) = 1.29 (Herrmann 2012 (10158)). |
| Cognitive Function 100‐point scale | Mean SIB score at baseline: 68.1. Median change from baseline (positive scale): ‐5.23 6 (i.e. deterioration with time) | MD: 4.34 (‐5.89 to 24 week study only: MD: ‐0.48 (‐2.57 to 1.61) (Herrmann 2012 (10158)) | ‐0.24 (‐0.84 to 0.36) (random effects) | 453 | ⊕⊝⊝⊝ | Analysed as mean difference (Analysis 3.6). [SMD as a negative outcome] |
| Performance on ADL | Mean ADCS‐ADL19 score at baseline: 32.5. Mean change from baseline (positive scale): ‐1.087 (i.e. slight deterioration with time) | MD: ‐1.48 (‐3.15 to 0.19) | 0.21 (‐0.02 to 0.43) | 309 | ⊕⊕⊝⊝ | Analysed as mean difference (Analysis 3.7) [SMD for decline in ADL as a negative outcome] |
| Behaviour and Mood (NPI) 144‐point scale | Median baseline NPI score was 33.3. Median change from baseline (negative scale): ‐8.6 8 (i.e. improvement with time) | MD: 1.51 (‐5.03 to 8.05) (random effects) | ‐0.07 (‐0.41 to 0.27) (random effects) | 470 | ⊕⊝⊝⊝ | Analysed as mean difference (random effects) (Analysis 3.8) [SMD as a negative outcome] |
| Agitation (Cohen Mansfield Agitation Inventory) range 29 ‐ 203 points | Mean baseline CMAI score was 57.7 Mean change from baseline (negative score) was ‐6.19 (i.e. improvement with time) | MD: 0.50 (‐3.71 to 4.71) (random effects) 2 studies in 422 participants | 0.11 (‐0.12 to 0.33) 2 studies in 306 participants | 455 (3 RCTs) | ⊕⊕⊕⊝ | MD and SMD as negative outcomes One study reported final scores (Fox 2012 (MAGD)), so not included in SMD. One study reported CMAI‐C (Forest 2006 (MD‐23)), so not included in MD meta‐analysis |
| Binary outcomes | Anticipated absolute effects | Relative effect | № of participants | Certainty of the evidence | Comments | |
| Risk with placebo (median) | Risk with memantine | |||||
| All‐cause discontinuation | 171 per 1000 | 188 per 1000 | RR 1.10 (0.79 to 1.52) | 555 113 events | ⊕⊕⊕⊝ | RR for all 3 studies in people with moderate‐to‐severe AD selected for agitation (Analysis 3.9). Median control group risk for 3 studies in 555 people with moderate‐to‐severe AD selected for agitation (Analysis 3.9) |
| Difference: 17 more people per 1000 discontinued treatment for any cause (95% CI 36 fewer to 89 more) | ||||||
| Number suffering at least one adverse event | 600 per 1000 | 618 per 1000 | RR 1.03 | 8033 5371 events | ⊕⊕⊕⊕ | RR from all studies (Analysis 9.3).Mean control group risk for 2 moderate‐to‐severe AD studies in people selected for agitation (Analysis 3.11) |
| Difference: 18 more people per 1000 suffered adverse events | ||||||
| *The risk in the intervention group (and its 95% confidence interval) is based on the assumed risk in the comparison group and the relative effect of the intervention (and its 95% CI). | ||||||
| GRADE Working Group grades of evidence | ||||||
1 Inconsistency in point estimates between 24 week and 12 week studies (downgrade once); imprecision (crossed null and SMD 0.30) (downgrade once)
2 Inconsistency between 24 week and 12 week studies (I² =90%) (downgrade twice); imprecision (very wide CI crossing SMD +0.30 and ‐0.30 (downgrade twice)
3 Imprecision (crossed null and SMD 0.40) (downgrade once); some inconsistency in point estimates and risk of bias from baseline differences (downgrade once across the two domains)
4 Inconsistency (I² = 62%, P = 0.07) (downgrade once); risk of bias (due to baseline differences) (downgrade once); imprecision (wide CI: SMD crossing ‐0.2 and 0.4) (downgrade twice)
5 Control group value for 1 study reporting CIBIC+ (Herrmann 2012 (10158)))
6 Mean control group baseline scores and mean control group change from baseline for 2 studies reporting SIB (Fox 2012 (MAGD); Herrmann 2012 (10158))
7 Mean control group baseline scores and mean control group change from baseline for the 2 studies reporting ADCS‐ADL19 (Forest 2006 (MD‐23); Herrmann 2012 (10158))
8 Median control group baseline scores and median control group change from baseline for the 3 studies reporting NPI (Forest 2006 (MD‐23); Fox 2012 (MAGD); Herrmann 2012 (10158))
9 Mean control group baseline scores and mean control group change from baseline for the 2 studies reporting CMAI (Fox 2012 (MAGD); Herrmann 2012 (10158))
10 Some inconsistency for two studies reporting CMAI and some imprecision (SMD crossing 0.3 and null) (downgrade once overall)
11 Imprecision (113 events) (downgrade once)
| Memantine 20 mg compared to placebo for mild AD (MMSE 20‐23) observed case (OC) ‐ six‐month studies for dementia | ||||||
| Population: mild Alzheimer's disease | ||||||
| Continuous outcomes | Score with placebo | Mean improvement in change score between memantine and placebo | SMD (95% CI) meta‐analysis findings | № of participants | Certainty of the evidence | Comments |
| Clinical Global (CIBIC+) | Median CIBIC+ score | MD: 0.09 (‐0.12 to 0.30) | ‐0.08 (‐0.27 to 0.12) | 427 | ⊕⊕⊝⊝ | Analysed as mean difference (Analysis 4.1). [SMD as a negative outcome (Analysis 16.1)] |
| Cognitive function (ADAS‐Cog) | Baseline ADAS‐Cog scores not reported. Median change from baseline in ADAS‐Cog score (negative scale): ‐1.7 6 (i.e. improvement with time) | MD: 0.21 (‐0.95 to 1.38) | ‐0.03 (‐0.19 to 0.13) | 619 | ⊕⊕⊕⊝ | Analysed as mean difference (Analysis 4.2). [SMD as a negative outcome (Analysis 16.2).] |
| Performance on ADL (ADCS‐ADL23) | Baseline ADL scores not reported. Median change from | MD: ‐0.07 (‐1.80 to 1.66) | 0.02 (‐0.14 to 0.18) | 621 | ⊕⊕⊕⊝ | Analysed as mean difference for decline in ADL (Analysis 4.3). [SMD as a negative outcome (Analysis 16.3)] Direction of scale reversed for ADL outcome. |
| Behaviour and mood: (NPI) | Baseline NPI scores not reported. Median change from baseline in NPI was ‐2.4 (i.e. slight improvement with time) 8 | MD: ‐0.29 (‐2.16 to 1.58) | 0.02 (‐0.14 to 0.18) | 621 | ⊕⊕⊕⊝ | Analysed as mean difference. [SMD as a negative outcome (Analysis 16.4)]. |
| Binary outcomes | Anticipated absolute effects | Relative effect | № of participants | Certainty of the evidence | Comments | |
| Risk with placebo (median) | Risk with memantine | |||||
| All‐cause discontinuation | 100 per 1000 | 174 per 1000 | RR 1.74 | 528 72 events | ⊕⊝⊝⊝ | RR and median control group risk for mild AD studies (Analysis 16.5) |
| Difference: 74 more people per 1000 discontinued treatment for any cause (95% CI 8 to 181 more) | ||||||
| Number suffering at least one adverse event | 429 per 1000 | 442 per 1000 | RR 1.03 | 8033 5371 events | ⊕⊕⊕⊕ | RR from all studies (Analysis 9.3).Control group risk taken from Holland 2013 study |
| Difference: 13 more people per 1000 suffered adverse events | ||||||
| Number suffering at least one serious adverse event | 114 per 1000 | 104 per 1000 (93 to 116) | RR 0.91 | 6482 (19 RCTs) 918 events | ⊕⊕⊕⊕ | RR and median control risk from all AD studies (except those with agitation) (from Analysis 8.10) |
| Difference: 10 fewer people per 1000 suffered serious adverse events (95% CI 21 fewer to 2 more) | ||||||
| Number suffering agitation as an adverse event | Outcome not reported by any study | 0 RCTs | ||||
| *The risk in the intervention group (and its 95% confidence interval) is based on the assumed risk in the comparison group and the relative effect of the intervention (and its 95% CI). | ||||||
| GRADE Working Group grades of evidence | ||||||
1 All studies are post‐hoc subgroups (downgrade once on risk of bias); imprecision ‐ 427 patients and SMD estimate crosses null and is consistent with appreciable benefit and no benefit (downgrade once)
2 All studies are post‐hoc subgroups (downgrade once on risk of bias)
3 All studies are post‐hoc subgroups (downgrade once on risk of bias) and some inconsistency in the point estimates (but not sufficient to downgrade)
4 Majority of the information from post‐hoc subgroups (downgrade once on risk of bias); imprecision: 72 events, and CI crossed 1.25 (downgrade once); inconsistency (I² = 49%) downgrade once
5 Median control group values for 3 studies reporting CIBIC+ (Bakchine 2008 (99679) SG; Peskind 2004 (MD‐10) SG; Porsteinsson 2008(MD‐12)S)
6 Median control group change from baseline for 4 studies reporting ADAS‐Cog (Bakchine 2008 (99679) SG; Dysken 2014 SG; Peskind 2004 (MD‐10) SG; Porsteinsson 2008(MD‐12)S)
7 Median control group change from baseline for the 4 studies reporting ADCS‐ADL23 (Bakchine 2008 (99679) SG; Dysken 2014 SG; Peskind 2004 (MD‐10) SG; Porsteinsson 2008(MD‐12)S)
8 Median control group change from baseline for the 4 studies reporting NPI (Bakchine 2008 (99679) SG; Dysken 2014 SG; Peskind 2004 (MD‐10) SG; Porsteinsson 2008(MD‐12)S)
| Memantine compared to placebo for Parkinson's disease dementia (PDD) and Dementia with Lewy Bodies (DLB) | ||||||
| Population: Parkinson's disease dementia (PDD) and dementia with Lewy bodies (DLB) | ||||||
| Continuous outcomes | Score with placebo (median) | Mean improvement in change score between memantine and placebo | SMD (95% CI) meta‐analysis findings | № of participants | Certainty of the evidence | Comments |
| Clinical Global (CIBIC+) 7‐point Likert scale | CIBIC+ score from 1 study was 4.1 (i.e. no change) | MD: 0.49 (0.13 to 0.83) | ‐0.35 (‐0.60 to ‐0.09) | 243 | ⊕⊕⊝⊝ | SMD as a negative outcome Back transformed to CIBIC+ scale using SD(pooled) = 1.39 (from 1 study (Marsh 2009 PDD)). |
| Cognitive Function: (MMSE) 30‐point scale | MMSE score: 20.0 (at 24 weeks). Change from baseline (positive scale): ‐0.5 (i.e. slight deterioration with time) (one study) | MD: 1.9 (0.07 to 3.73) | ‐0.50(‐1.00 to 0.00) | 63 | ⊕⊝⊝⊝ | One study at 24 weeks and one at 16 weeks only for this outcome; highly heterogeneous. So 24 week study reported only (Aarsland 2009). MMSE scale direction was reversed (Analysis 6.2) |
| Performance on ADL (ADCS‐ADL23) 78‐point scale | ADCS‐ADL23 score at baseline: 48 Change from baseline (positive scale): ‐0.1 (i.e. no change with time) (one study) | MD: 3.07 (‐1.25 to 7.4) | ‐0.27 (‐0.67 to 0.07) | 243 | ⊕⊝⊝⊝ | SMD decline in ADL as a negative outcome (Analysis 6.3). Random effects. Back transformed to ADCS‐ADL23 scale, using results from one study (Emre 2010 (11018)). SD(pooled) = 11.38. |
| Behaviour and Mood (NPI) 144‐point scale | Median NPI score at baseline: 13.0 Median change from baseline (negative scale): 1.4 | MD: 2.18 (‐1.21 to 5.57) | ‐0.18 (‐0.43 to 0.07) | 242 | ⊕⊕⊝⊝ | Random effects. Analysed as mean difference (Analysis 6.4). [SMD as a negative outcome (Analysis 8.4)] |
| Binary outcomes | Anticipated absolute effects | Relative effect | № of participants | Certainty of the evidence | Comments | |
| Risk with placebo (median) | Risk with memantine | |||||
| All‐cause discontinuation | 201 per 1000 | 169 per 1000 | RR 0.84 | 312 64 events | ⊕⊕⊝⊝ | RR and control group risk from PDD or DLB studies (Analysis 6.5) |
| Difference: 32 fewer people per 1000 discontinued treatment for any cause | ||||||
| Number suffering at least one adverse event | 500 per 1000 | 515 per 1000 | RR 1.03 | 8033 5371 events | ⊕⊕⊕⊕ | RR from all studies (Analysis 9.3). Median control group risk for PDD or DLB studies (Analysis 6.7). |
| Difference: 15 more people per 1000 suffered adverse events | ||||||
| Number suffering at least one serious adverse event | 86 per 1000 | 123 per 1000 (59 to 255) | RR 1.43 | 220 (2 RCTs) 26 events | ⊕⊕⊝⊝ | RR and control group risk from PDD or DLB studies (Analysis 8.10) |
| Difference: 37 more people per 1000 suffered serious adverse events (95% CI 27 fewer to 169 more) | ||||||
| Number suffering agitation as an adverse event | Outcome not reported for either study | 0 RCTs | ||||
| *The risk in the intervention group (and its 95% confidence interval) is based on the assumed risk in the comparison group and the relative effect of the intervention (and its 95% CI). | ||||||
| GRADE Working Group grades of evidence | ||||||
1 Majority of the information at high risk of bias and number of patients estimated (downgrade once); imprecision ‐ 243 patients (below optimal information size) (downgrade once)
2 Reporting bias (2 larger studies did not report outcome) and high risk of bias for remaining study (downgrade once), inconsistency with 16 weeks study high (I² = 75%) (downgrade once), imprecision (only 63 patients, wide CI) (downgrade once)
3 Majority of information at high risk of bias (downgrade once), inconsistency in point estimates (I² = 40%) (downgrade once) and imprecision (243 participants and CI crossed null and consistent with both benefit and no difference) (downgrade once)
4 Majority of information at high risk of bias (downgrade once), some inconsistency in point estimates (I² = 20%) (not downgraded) and imprecision (243 patients; CI crossed null and included benefit and no difference) (downgrade once)
5 Imprecision: CI crossed both 1.25 and 0.75, and CI fairly wide around absolute effect (downgrade twice)
| Memantine compared to placebo for Frontotemporal dementia (FTD) | ||||||
| Population: frontotemporal dementia | ||||||
| Continuous outcomes | Score with placebo (median) | Mean improvement in change score between memantine and placebo | SMD (95% CI) meta‐analysis findings | № of participants | Certainty of the evidence | Comments |
| Clinical Global (CGIC) 7‐point Likert scale | CGIC score from 1 study was 4.8 (i.e. deterioration with time) | MD: 0.56 (‐0.11 to 1.21) | ‐0.31 (‐0.67 to 0.06) | 117 | ⊕⊕⊝⊝ | SMD as a negative outcome Back transformed to CGIC scale using SD (pooled) = 1.80 (from 1 study (Boxer 2013). |
| Cognitive Function: (MMSE) 30‐point scale | MMSE score: 25.1 (at 26 weeks). Change from baseline (positive scale): ‐0.9 (i.e. deterioration with time) (one study) | MD ‐0.30 (‐1.83 to 1.23) | 0.09 (‐0.35 to 0.52) | 81 | ⊕⊝⊝⊝ | One study at 6 months and one at 12 months for this outcome; some heterogeneity so 6‐month study reported only (Boxer 2013) (Analysis 7.2). MMSE scale direction was reversed. |
| Performance on ADL % DAD score = yes at 12 months | Baseline score: 58.3%. Change from baseline (positive scale): ‐19.5% (i.e. deterioration) (one study) | MD: 12.10% (‐1.40 to 25.60) | ‐ | 39 | ⊕⊝⊝⊝ | Decline in ADL not reported in either study. Percentage with DAD score = yes reported in Vercelletto 2011 at 12 months. |
| Behaviour and Mood (NPI) 144‐point scale | NPI score at baseline: 21.5. Change from baseline (negative scale): 0.3 | MD: 3.16 (‐3.61 to 8.01) | ‐0.17 (‐0.62 to 0.28) | 115 | ⊕⊕⊝⊝ | Analysed as mean difference (Analysis 7.3). Baseline score and change from baseline for 26‐week study (Boxer 2013). [SMD as a negative outcome (Analysis 8.4)] |
| Binary outcomes | Anticipated absolute effects | Relative effect (95% CI) | № of participants | Certainty of the evidence | Comments | |
| Risk with placebo (median) | Risk with memantine | |||||
| All‐cause discontinuation | 71 per 1000 | 109 per 1000 | RR 1.54 (0.54 to 4.06) | 133 15 events | ⊕⊕⊝⊝ | RR from FTD studies; control group risk from 26 week study (Analysis 7.4) |
| Difference: 38 more people per 1000 discontinued treatment for any cause (95% CI 33 fewer to 217 more) | ||||||
| Number suffering at least one adverse event | 667 per 1000 | 687 per 1000 | RR 1.03 | 8033 5371 events | ⊕⊕⊕⊕ | RR from all studies (Analysis 9.3).Control group risk for 26‐week FTD study |
| Difference: 20 more people per 1000 | ||||||
| Number suffering at least one severe adverse event | 48 per 1000 | 34 per 1000 (14 to 80) | RR 0.71 | 133 (2 RCTs) 17 events | ⊕⊕⊝⊝ | RR and control group risk from FTD study at 26 weeks (Analysis 8.10) |
| Difference: 14 fewer people per 1000 | ||||||
| Number suffering agitation as an adverse event | 48 per 1000 | 10 per 1000 (0.5 to 208) | RR 0.21 | 81 (1 RCT) | ⊕⊝⊝⊝ | RR and control group risk from FTD study at 26 weeks (Analysis 7.8) |
| Difference: 38 fewer people per 1000 | ||||||
| *The risk in the intervention group (and its 95% confidence interval) is based on the assumed risk in the comparison group and the relative effect of the intervention (and its 95% CI). | ||||||
| GRADE Working Group grades of evidence | ||||||
1 Majority of the information at high risk of bias (downgrade once); imprecision ‐ 117 patients (below optimal information size) (downgrade once)
2 Inconsistency in point estimates (I² = 23%) (downgrade once) and Imprecision (122 patients and wide confidence interval) (downgrade twice)
3 Imprecision (39 participants and CI crossed null and consistent with both benefit and no difference) (downgrade twice); indirect outcome (percentage DAD score at 12 months) and borderline high risk of bias (differential missing data) (downgrade once)
4 Some inconsistency in point estimates and Imprecision (122 patients and wide confidence interval) (downgrade twice overall)
5 Inconsistency in point estimates (downgrade once); Imprecision: 15 events and CI crossed both 1.25 and 0.75 (downgrade twice)
6 Imprecision: 17 events and wide CI (downgrade twice)
7 Imprecision: 2 events and very wide CI (downgrade twice): high risk of bias ‐ number discontinuing treatment greater than number of events (downgrade twice)
1. Alzheimer's disease (AD)
1.1. Results for all studies in people with AD: trial selection
Twenty‐nine studies reported the effect of memantine in people with AD, however, we did not include five of these studies in the main analyses: three studies concerned participants selected for agitation or aggression and we treated this group separately because we considered this to be a different sub‐population (see section 1.4) (Forest 2006 (MD‐23); Fox 2012 (MAGD); Herrmann 2012 (10158). Secondly, it was necessary to analyse the main efficacy outcomes using the SMD because the studies employed different scales; therefore, we had to exclude from the efficacy analyses two studies reporting only final values (Ashford 2011 (95722); Lorenzi 2011 (SC05‐03)). In addition, in a post‐hoc decision, we excluded from the analyses results for two of the four arms in one study: the comparison of memantine versus placebo, in the presence of vitamin E (Dysken VitE 2014). This was because a negative interaction between memantine and vitamin E was identified by the authors for their primary outcome (decline in activities of daily living (ADL), P = 0.03), which persisted at all time points in the four‐arm study. Finally, for one study, there was a discrepancy in the one‐year results between the unpublished poster (which reported standard deviations) and the full paper (which did not) for their ADL outcome, so we also omitted this study for the outcome, decline in ADL (Schmidt 2008).
We therefore included data from 24 trials in 7102 randomised participants with AD, using the OC approach to missing data, whenever possible. For most outcomes, there was too much heterogeneity to make overall statements of effect, therefore we investigated the heterogeneity in sensitivity and subgroup analyses, examining risk of bias, trial duration, memantine dose, concomitant cholinesterase inhibitors (ChEIs) and severity of AD. Details are reported in Appendix 4 .
In a sensitivity analysis, we found that exclusion of the trials at high risk of bias for one or more domains generally made little difference to the heterogeneity, so all 24 studies were included in subgroup analyses (Appendix 4.1).
Following subgroup analyses (Appendix 4), we firstly restricted the main analyses (below) to those with the licensed memantine dose of 20 mg per day or a daily 28 mg extended release tablet, and to a duration of six to seven months. This meant that some studies were excluded from the analyses: four short‐term studies in 658 participants (Hofbauer 2009 (MD‐71); Lundbeck 2006 (10116); Merz 2003 (MRZ‐9104); Winblad 1999 (9403) AD); and three longer‐term studies in 334 participants that did not report interim results at six to seven months (Ashford 2011 (95722); Holland 2013; Wilkinson 2012 (10112)); these studies only reported results for the cognitive function outcome. Additionally, we did not include in the main analyses the 10 mg/day arms from two studies (Asada 2011 (MA3301); Homma 2007 (IE2101)). This left 17 studies in 5813 randomised participants.
Secondly, on the basis of subgroup analyses and meta‐regression addressing both severity and the presence or absence of ChEIs, we concluded that it was necessary to stratify the studies by severity of AD, and to later investigate residual heterogeneity in the moderate‐to‐severe population (Appendix 4; Appendix 5; Appendix 6). In the test for subgroup differences, there were large differences relating to disease severity, both between mild‐to‐moderate and moderate‐to‐severe AD and between mild and moderate‐to‐severe AD. We analysed and reported separately results for mild dementia and moderate‐to‐severe dementia because these represent the categories for the licensed indications. These analyses include post‐hoc subgroups for mild and moderate AD obtained from studies in people with mild‐to‐moderate AD. We had to omit from the main analyses three studies in 468 participants with mild‐to‐moderate AD because they did not report separately results for mild and moderate populations (Asada 2011 (MA3301); Peters 2015 (MEGACOMBI2); Schmidt 2008). Subgroup analyses also showed that any impact from the presence of ChEIs was small.
All subgroup analyses investigated the impact of different study factors on the effect estimate (i.e. the difference in mean change‐from‐baseline scores between memantine and placebo). However, we also observed differences according to severity in the change from baseline for the placebo group alone; this was found for all outcomes except clinical global (which appeared to be independent of severity). There was increased efficacy of memantine (versus placebo) with increasing severity of disease, but this occurred alongside deterioration in the placebo group for the moderate and severe populations and improvement for the mild population.
In the rest of this section, we report results for the following sub‐populations: Section 1.2 reports the results for all participants with moderate‐to‐severe AD, with the exception of studies in patients selected for agitation. Section 1.3 examines the effect of concomitant ChEIs in people with moderate‐to‐severe AD. Section 1.4 covers the effect of memantine versus placebo in patients with agitation (who also had moderate‐to‐severe AD). Finally, section 1.5 summarises the evidence for people with mild dementia. We do not discuss separately results for moderate and severe AD in the main section, but analyses based on post‐hoc subgroups are given in Appendix 4. Each sub‐section includes the individual results for the efficacy outcomes, GRADE certainty ratings and a summary.
1.2. Effect of memantine in people with moderate‐to‐severe AD at six to seven months; OC
1.2.1. Effect of memantine (20 mg to 28 mg/day) versus placebo (irrespective of whether additionally taking a cholinesterase inhibitor)
Fifteen studies met the inclusion criteria and contributed data from approximately 3700 analysed participants (Asada 2011a (IE3501); Bakchine 2008 (99679) SG; Dysken 2014 SG; Forest 2006 (MD‐22); Grossberg 2008 (MD‐50); Homma 2007 (IE2101); Howard 2012 (DOMINO‐AD); Lorenzi 2011 (SC05‐03); Nakamura 2016; Peskind 2004 (MD‐10) SG; Porsteinsson 2008(MD‐12)S; Reisberg 2003 (9605); Tariot 2004 (MD‐02); van Dyck 2007 (MD‐01); Wang 2013). Four of these studies provided post‐hoc data for moderate severity AD participants (Bakchine 2008 (99679) SG; Dysken 2014 SG; Peskind 2004 (MD‐10) SG; Porsteinsson 2008(MD‐12)S).
Not all studies reported all the outcomes: for the efficacy outcomes,10 studies contributed data to the clinical global outcome, 13 to cognitive function, 11 to decline in ADL and 14 to the behaviour and mood outcome. Thirteen studies reported all‐cause discontinuation and 12 withdrawal due to adverse events, but considerably fewer studies reported adverse events: nine studies (72% of all participants) reported the proportion of participants with at least one adverse event; nine studies (77% of all participants) reported the proportion with serious adverse events and six studies (61% of all participants) reported the proportion with agitation.
The evidence for this section is summarised in summary of findings Table for the main comparison, which covers both efficacy and safety outcomes; a negative SMD (or MD value means that the effect favours memantine.
-
Clinical global rating (Analysis 1.1): high‐certainty evidence: meta‐analysis of 10 studies in 2797 participants gave an SMD of ‐0.20 (95% CI ‐0.28 to ‐0.13), favouring memantine.
-
Cognitive function (Analysis 1.2): high‐certainty evidence: meta‐analysis of 13 studies in 3337 participants gave an SMD of ‐0.27 (95% CI ‐0.34 to ‐0.21); there was some variation in the point estimates (I² = 30%, P = 0.14).
-
Decline in ADL (Analysis 1.3): high‐certainty evidence: meta‐analysis of 11 studies in 2687 participants gave an SMD ‐0.16 (95% CI ‐0.24 to ‐0.09).
-
Behaviour and mood (Analysis 1.4) high‐certainty evidence: meta‐analysis of 14 studies in 3674 participants gave an SMD of ‐0.14 (95% CI ‐0.21 to ‐0.08); there was some variability in the point estimates (but I² = 8%, P = 0.36).
-
All‐cause discontinuation, discontinuation due to adverse events, adverse events and serious adverse events are reported in section 5.
Funnel plots for the primary outcomes are shown in Figure 4; Figure 5; Figure 6; Figure 7 and for all‐cause discontinuation in Figure 8. There appeared to be no suggestion of publication bias. There may be some asymmetry in the funnel plot for the number of people with at least one adverse event (Figure 9), but probably not sufficient to downgrade the evidence on the basis of publication bias.

Funnel plot of comparison: 1 Memantine 20 mg or equivalent vs placebo for moderate‐to‐severe Alzheimer's disease. 24‐30 week data. OC, outcome: 1.1 Clinical Global.

Funnel plot of comparison: 1 Memantine 20 mg or equivalent vs placebo for moderate‐to‐severe Alzheimer's disease. 24‐30 week data. OC, outcome: 1.2 Cognitive Function.
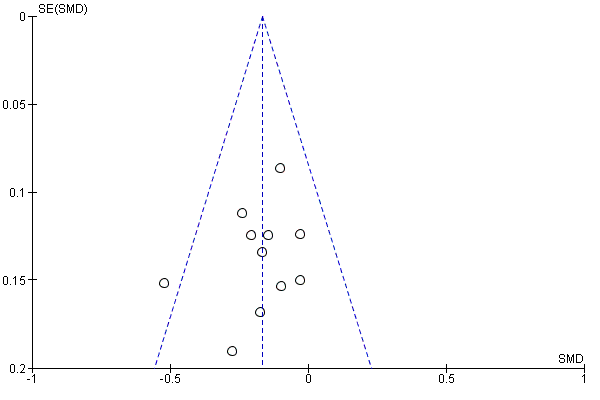
Funnel plot of comparison: 1 Memantine 20 mg or equivalent vs placebo for moderate‐to‐severe Alzheimer's disease. 24‐30 week data. OC, outcome: 1.3 Decline in ADL.
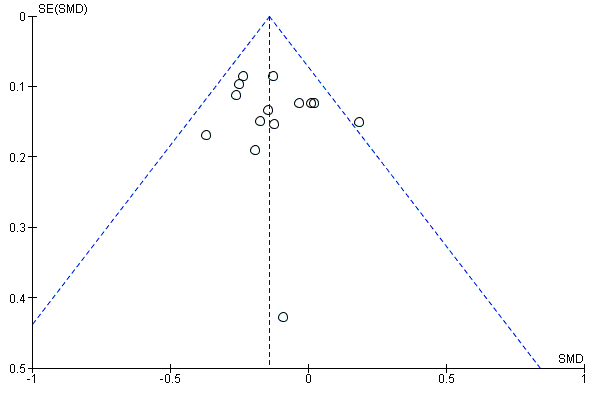
Funnel plot of comparison: 1 Memantine 20 mg or equivalent vs placebo for moderate‐to‐severe Alzheimer's disease. 24‐30 week data. OC, outcome: 1.4 Behaviour and Mood.

Funnel plot of comparison: 1 Memantine 20 mg or equivalent vs placebo for moderate‐to‐severe Alzheimer's disease. 24‐30 week data. OC, outcome: 1.5 All‐cause discontinuation.

Funnel plot of comparison: 12 Adverse reactions ‐ Memantine vs placebo for mild to severe dementia. All diagnoses, all durations, outcome: 12.3 Number suffering at least one adverse event.
1.2.2. Summary of results transformed to an appropriate scale
High‐certainty evidence from up to 14 studies in around 3700 participants shows a small clinical benefit for memantine versus placebo in each of the following outcomes: clinical global rating (MD benefit: 0.21 Clinician's Interview‐Based Impression of Change (CIBIC)+ points, 95% CI 0.14 to 0.30); cognitive function (MD benefit: 3.11 SIB points, 95% CI 2.42 to 3.92); performance on ADL (MD benefit: 1.09 ADL19 points, 95% CI 0.62 to 1.64); and behaviour and mood (MD benefit: 1.84 NPI points, 95% CI 1.05 to 2.76). (summary of findings Table for the main comparison).
There are similar numbers of people with adverse events in both groups, and memantine (compared with placebo) shows little difference in the number of people discontinuing treatment: RR 0.93 (95% CI 0.83 to 1.04), which corresponds to 13 fewer people discontinuing per 1000, 95% CI 31 fewer to 7 more. There is probably a reduction in the number with agitation as an adverse event (25 fewer per 1000; 95% CI 1 to 44 fewer).
1.3. Effect of memantine 20 mg or equivalent versus placebo in people with moderate‐to‐severe AD six to seven months, receiving concomitant ChEI or receiving monotherapy
An important objective of this review was to determine whether memantine (versus placebo) gave additional benefits for people already on ChEIs. In this section, firstly, we report the results of pre‐specified subgroup analyses by concomitant ChEI for the moderate‐to‐severe AD population. Statistically, there were no significant differences between the results for the two subgroups (with and without ChEI) ‐ see section 1.3.1, but, for the interested reader, we also report results separately for the population receiving ChEIs in section 1.3.2 and results for the monotherapy subgroup in section 1.3.3.
1.3.1. Effect of memantine 20 mg or equivalent: subgroup analysis according to the presence or absence of concomitant ChEI
We conducted subgroup analyses for the four efficacy outcomes to investigate any differences in the effect of memantine (versus placebo) between memantine as monotherapy or with concomitant ChEI. We examined both between‐trial and within‐trial subgroup analyses (see Appendix 6). The results for patients receiving monotherapy and for those receiving concomitant ChEI are summarised in Table 9 for all outcomes (Analysis 2.1; Analysis 2.2; Analysis 2.3; Analysis 2.4; Analysis 2.5; Analysis 2.6; Analysis 2.7).
| Number of Studies | Number of Participants | Standardised Effect Estimate | Heterogeneity (I²) | Test for | |||||||||
| Domain | All | with ChEI | no ChEI | All | with ChEI | no ChEI | All | with ChEI | no ChEI | All | with ChEI | no ChEI | |
| Clinical Global | 10 | 3 | 7 | 2797 | 1125 | 1672 | ‐0.20 | ‐0.21 (‐0.32 to ‐0.09) | ‐0.20 (‐0.30 to ‐0.10) | 0% | 13% | 0% | I² = 0%, P = 0.99 |
| Cognitive Function | 14 | 6 | 8 | 3337 | 1852 | 1485 | ‐0.28 (‐0.35 to ‐0.21) | ‐0.24 (‐0.33 to ‐0.14) | ‐0.33 (‐0.43 to ‐0.23) | 33% | 13% | 41% | I² = 44%, P = 0.18 |
| Decline in Living (Analysis 2.3) | 12 | 5 | 7 | 2687 | 1319 | 1368 | ‐0.17 (‐0.24 to ‐0.09) | ‐0.13 (‐0.24 to ‐0.03) | ‐0.20 (‐0.30 to ‐0.09) | 0% | 0% | 10% | I² = 0%, P = 0.43 |
| Behaviour and Mood | 15 | 6 | 9 | 3674 | 1855 | 1819 | ‐0.14 (‐0.21 to ‐0.08) | ‐0.18 (‐0.27 to ‐0.09) | ‐0.10 (‐0.19 to ‐0.01) | 6% | 10% | 0% | I² = 35%, P = 0.21 |
| All‐cause discontinuation | 15 | 6 | 10 | 4548 | 2089 | 2459 | RR 0.93 (0.82 to 1.05) | RR 0.94 (0.78 to 1.13) | RR 0.92 (0.78 to 1.08) | 9% | 61% | 0% | I² = 0%, P = 0.83 |
| Adverse events | 9 | 3 | 6 | 3390 | 1625 | 1765 | RR 1.02 (0.98 to 1.06) | RR 1.05 (0.98 to 1.12) | RR 0.99 (0.94 to 1.04) | 23% | 13% | 0% | I² = 46%, P = 0.17 |
| Agitation as an adverse event | 10 | 5 | 6 | 3854 | 1965 | 1889 | RR 0.79 (0.64 to 0.97) | RR 0.93 (0.65 to 1.31) | RR 0.72 (0.55 to 0.93) | 0% | 0% | 15% | I² = 25.1%, P = 0.25 |
Six studies were conducted on patients with moderate‐to‐severe disease receiving ChEI therapy, these were:
Dysken 2014: patients were on ongoing ChEI therapy with any ChEI (donepezil, rivastigmine or galantamine), as maintenance dosage for at least 4 weeks
Grossberg 2008 (MD‐50): patients were on ongoing ChEI therapy with a stable dose of any ChEI for 3 months or longer, patients must remain on the same dose throughout the study.
Howard 2012 (DOMINO‐AD): patients were on ongoing ChEI therapy with donepezil for at least 3 months and had received a dose of 10 mg for at least the previous
6 weeks. Patients were randomised to continue or discontinue donepezil. The patient’s prescribing clinician was considering a change in drug treatment.
Nakamura 2016: patients had been on donepezil for at least four weeks when recruited and then had 12 weeks single blind observation period on donepezil. Only those stable continued to the double blind period.
Porsteinsson 2008 (MD‐12): patients were on ongoing ChEI therapy with any ChEI for 6 months or longer, and a stable dosing regimen for 3 months or longer (donepezil 5‐10 mg/day; rivastigmine 6, 9 or 12 mg/day; galantamine 16 or 24 mg/day)
Tariot 2004 (MD‐02): patients were on ongoing ChEI therapy with donepezil for more than 6 months before entry into the trial and at a stable dose (5‐10mg/day) for at least 3 months.
The test for subgroup differences showed no significant difference between memantine monotherapy and memantine with concomitant ChEI (for the comparison of memantine versus placebo) for any of the primary efficacy outcomes, although there was a non‐significant difference between subgroups for the behaviour and mood outcome (I² = 35.2%, P = 0.21), and for the cognitive function outcome (I² = 44.2%, P = 0.18). For the behaviour and mood outcome, the subgroup results suggested a slightly larger effect of memantine versus placebo in the presence of concomitant ChEI (SMD ‐0.18, 95% CI ‐0.27 to ‐0.09) than in its absence (SMD ‐0.10, 95% CI ‐0.19 to ‐0.01), whereas for the cognitive function outcome, there was a slightly smaller effect in the presence of ChEI (SMD ‐0.24, 95% CI ‐0.33 to ‐0.14) compared with monotherapy (SMD ‐0.33, 95% CI ‐0.43 to ‐0,23). The forest plots for these analyses (Analysis 2.1; Analysis 2.2; Analysis 2.3; Analysis 2.4) are ordered within subgroups in decreasing order of mean study severity (MMSE) and we note that for the behaviour and mood outcome, an alternative explanation for the heterogeneity could be severity of disease (Appendix 4.5).
The safety outcomes showed no significant impact of concomitant ChEI (Analysis 2.9; Analysis 2.10; Analysis 2.11; Analysis 2.12; Analysis 2.13). There was a non‐significant result in the test for subgroup differences for adverse events overall (I² = 46% and P = 0.17), however, this is likely to occur because the confidence intervals for the subgroups are small; the numerical difference is minimal: the ChEI subgroup is RR 1.05 (95% CI 0.98 to 1.12) and monotherapy is RR 0.99 (95%CI 0.94 to 1.04), both indicating no difference between memantine and placebo. For agitation as an adverse event, the test for subgroup differences was I² = 20.9% and P = 0.26, there was probably no difference between memantine and placebo for the ChEI subgroup (RR 0.92, 95% CI 0.60 to 1.40), but for the monotherapy subgroup there was probably a reduction in agitation (RR 0.68, 95% CI 0.51 to 0.91).
The within‐trial subgroup analyses suffered from large and differential levels of missing data and it was uncertain whether there was a difference between subgroups with and without ChEIs (Howard 2012 (DOMINO‐AD)). Low‐certainty evidence (downgraded for risk of bias and imprecision) from one study, which randomised 149 participants to memantine plus continued donepezil versus memantine plus placebo and donepezil discontinued, suggested there may be a larger effect for the two drugs together compared with memantine monotherapy for cognitive function: MD benefit: 1.34 MMSE points (95% CI 0.19 to 2.49), i.e. it may be better to add memantine than to switch to memantine (Howard 2012 (DOMINO‐AD)).
1.3.2. Effect of memantine versus placebo in people with moderate‐to‐severe AD, receiving concomitant ChEIs
We report results of analyses restricted to studies in participants receiving ChEIs. Six studies analysed results from 1855 participants (Dysken 2014 SG; Grossberg 2008 (MD‐50); Howard 2012 (DOMINO‐AD); Nakamura 2016; Porsteinsson 2008(MD‐12)S; Tariot 2004 (MD‐02)). Two of these studies were reported as post‐hoc subgroups for moderate AD, taken from trials in people with mild‐to‐moderate AD (Dysken 2014 SG; Porsteinsson 2008(MD‐12)S).
The evidence for this section is summarised in the additional 'Summary of findings' Table 3, which covers both efficacy and safety outcomes.
Results were as follows. We analysed one outcome (clinical global) as the mean difference (MD) (rather than SMD) because all studies used the same scale; a negative SMD (or MD) value means that the effect favours memantine. In the forest plots, studies are shown in decreasing order of severity (MMSE).
-
Clinical global rating, CIBIC+ (Analysis 2.8): moderate‐certainty evidence (downgraded for inconsistency): meta‐analysis of three studies in 1125 participants gave an MD (random effects) of ‐0.21 (95% CI ‐0.36 to ‐0.06), favouring memantine. There was some heterogeneity in the point estimates (and I² = 32%, P = 0.23).
-
Cognitive function (Analysis 2.2): high‐certainty evidence: meta‐analysis of 6 studies in 1852 participants gave an SMD of ‐0.24 (95% CI ‐0.33 to ‐0.14).
-
Decline in ADL (Analysis 2.3): high‐certainty evidence: meta‐analysis of 5 studies in 1319 participants gave an SMD of ‐0.13 (95% CI ‐0.24 to ‐0.03).
-
Behaviour and mood (Analysis 2.4): high‐certainty evidence : meta‐analysis of 6 studies in 1855 participants gave an SMD of ‐0.18 (‐0.27 to ‐0.09). There was unimportant heterogeneity (I² = 10%, P = 0.35).
-
All‐cause discontinuation, discontinuation due to adverse events, adverse events and serious adverse events are reported in section 5 and Table 3.
1.3.3. Effect of memantine versus placebo in people with moderate‐to‐severe AD, receiving monotherapy
In this section, we report results of analyses restricted to studies in participants receiving monotherapy. Nine studies analysed results from 2215 participants (Asada 2011a (IE3501); Bakchine 2008 (99679) SG; Forest 2006 (MD‐22); Homma 2007 (IE2101); Howard 2012 (DOMINO‐AD); Peskind 2004 (MD‐10) SG; Reisberg 2003 (9605); van Dyck 2007 (MD‐01); Wang 2013). Two of these studies were reported as post‐hoc subgroups for moderate AD, taken from trials in people with mild‐to‐moderate AD (Bakchine 2008 (99679) SG; Peskind 2004 (MD‐10) SG).
The evidence for this section is summarised in the additional 'Summary of findings' Table 4, which covers both efficacy and safety outcomes. Results were as follows. Forest plots show studies in decreasing order of severity; a negative SMD (or MD) value means that the effect favours memantine.
-
Clinical global rating, CIBIC+ (Analysis 2.1): high‐certainty evidence: meta‐analysis of 7 studies in 1672 participants gave an SMD of ‐0.20 (95% CI ‐0.30 to ‐0.10), favouring memantine.
-
Cognitive function (Analysis 2.2): high‐certainty evidence: meta‐analysis of 8 studies in 1485 participants gave an SMD of ‐0.33 (95% CI ‐0.43 to ‐0.23). There is some heterogeneity in the point estimates, but apart from one study, the results are consistent with a benefit for memantine and were not downgraded for inconsistency (I² = 41%, P = 0.11).
-
Decline in ADL (Analysis 2.3): high‐certainty evidence: meta‐analysis of 7 studies in 1368 participants gave an SMD of ‐0.20 (95% CI ‐0.30 to ‐0.09).
-
Behaviour and mood, NPI (Analysis 2.9): high‐certainty evidence: meta‐analysis of 9 studies in 1819 participants gave an SMD of ‐0.10 (95% CI ‐0.19 to ‐0.01).
-
All‐cause discontinuation, discontinuation due to adverse events, adverse events and serious adverse events are reported in section 5 and Table 4.
1.3.4. Summary of results transformed to an appropriate scale
For people receiving concomitant ChEI
Mainly high‐, and moderate‐certainty evidence from up to six studies in around 1850 participants taking cholinesterase inhibitors shows a small clinical benefit for memantine versus placebo in cognitive function (MD benefit: 2.48 SIB points, 95% CI 1.45 to 3.41), performance on ADL (MD benefit: 0.95 ADL19 points, 95% CI 0.22 to 1.76) and behaviour and mood (MD benefit: 2.20 NPI points, 95% CI 1.10 to 3.29); and probably a small clinical benefit in clinical global rating (MD benefit: 0.21 CIBIC+ points, 95% CI 0.06 to 0.36) (Table 3).
There are similar numbers of people with adverse events in both groups. Memantine (compared with placebo) shows little difference in the number of people discontinuing treatment for any cause (12 fewer per 1000, 95% CI 29 fewer to 7 more), and there is probably no difference between interventions in the number with agitation as an adverse event (4 fewer per 1000, 95% CI 18 more to 18 fewer).
For people receiving monotherapy
High‐certainty evidence from up to nine studies in around 1800 participants shows a small clinical benefit for memantine versus placebo in all efficacy outcomes: clinical global rating (MD benefit:0.22 CIBIC+ points, 95% CI 0.11 to 0.33); cognitive function (MD benefit: 3.97 SIB points, 95% CI 2.77 to 5.18); performance on ADL (MD benefit:1.33 ADL19 points, 95% CI 0.20 to 2.00) and behaviour and mood (MD benefit:1.57 NPI points, 95% CI 0.16 to 2.98) (Table 4).
There are similar numbers of people with adverse events in both groups. Memantine (compared with placebo) shows little difference in the number of people discontinuing treatment for any cause (13 fewer per 1000, 95% CI 32 fewer to 8 more), and there is probably also a reduction in the number with agitation as an adverse event (52 fewer per 1000, 95% CI 15 to 80 fewer) (compare agitation in people receiving concomitant ChEI).
Test for subgroup differences
The test for subgroup differences between trials in which participants did and did not receive concomitant ChEI showed no significant differences, but three outcomes had non‐significant differences: cognitive function (I² = 44%), behaviour and mood (I² = 35%), and agitation as an adverse event (I² = 21%). For behaviour and mood, the effect of memantine appeared to be larger in people receiving ChEI, and for cognitive function the effect appeared larger in the monotherapy group. However, it was not clear that these differences could be attributed to concomitant ChEI, and severity may still play a role. For agitation as an adverse event, memantine monotherapy appeared to effect a reduction in the number of people with agitation, but memantine did not appear to add anything to existing effects with cholinesterase inhibitors.
1.4. Effect of memantine in people with moderate‐to‐severe AD with agitation; OC
1.4.1. Effect of memantine versus placebo in people with moderate‐to‐severe AD, with agitation
Three studies investigated the effect of memantine versus placebo in 556 randomised participants with agitation (Forest 2006 (MD‐23); Fox 2012 (MAGD); Herrmann 2012 (10158)); one study was unpublished (Forest 2006 (MD‐23)). Agitation was defined variously as: NPI > 12 with a score on the NPI agitation–aggression item of at least 1 (Herrmann 2012 (10158)); at least two weeks history of behavioural disturbance, and agitation judged by their clinical team to require intervention, with a Cohen Mansfield Agitation Inventory (CMAI) score ≥ 45 (Fox 2012 (MAGD)); and a score on the NPI agitation–aggression item of at least 4 (Forest 2006 (MD‐23)). All studies recruited people with moderate‐to‐severe AD, although the mean MMSE scores differed: one study had a mean score of 7.5 (inclusion ≤ 19) (Fox 2012 (MAGD)); the second had a mean of 11.9 (range 5 to 15) (Herrmann 2012 (10158)); and the third did not state the mean, but the range was 3 to 18 (Forest 2006 (MD‐23)). Two studies included participants on ChEIs (Forest 2006 (MD‐23); Herrmann 2012 (10158)); and the other had about 20% participants on ChEIs (Fox 2012 (MAGD)). One of the three studies was in institutionalised patients (Fox 2012 (MAGD)).
Two studies had a duration of 12 weeks (Forest 2006 (MD‐23); Fox 2012 (MAGD)); and the other was 24 weeks. Two of these studies were terminated prematurely, one after recruiting only 34 participants (Forest 2006 (MD‐23)); and the other because of difficulties in recruitment (the 369 participants formed 82% of the planned recruited sample) (Herrmann 2012 (10158)). One study had the primary aim of reducing agitation (Fox 2012 (MAGD)), and the other two aimed to investigate the efficacy of memantine in an agitated population (Forest 2006 (MD‐23); Herrmann 2012 (10158)). All three studies reported the effect of memantine on agitation using the CMAI, but one used the community version (Forest 2006 (MD‐23)).
We did not extract data from two reviews reporting on post‐hoc agitated subgroups because the data for individual trials were not available in a useful format (Gaultier 2005; Wilcock Post‐Hoc 3RCTs 2008). However, we discuss the findings from these studies in the Agreements and disagreements with other studies or reviews) and note the disagreement.
We analysed all efficacy outcomes except clinical global rating as the mean difference (rather than SMD) because all studies used the same scale; a negative SMD (or MD) value means that the effect favours memantine (Table 5).
Two main outcome measures were used to investigate agitation: the CMAI score (range 29 to 203) (or the CMAI‐community score in the Forest 2006 (MD‐23)) study; and the agitation–aggression subscale of the NPI. Analyses were subgrouped by time point (12 weeks and 24 weeks); we reported both the results for the pooled analysis and the 24‐week study alone, in order both to be consistent with the approach to duration in AD, and also to avoid reducing the analysis to only one study; a negative SMD (or MD) value means that the effect favours memantine.
-
CMAI: the three studies varied in the CMAI scale used and how they reported the results (one only reported final values), so we did not combine all studies in either an SMD analysis or as the MD. Instead, we meta‐analysed the two CMAI studies using the MD (Fox 2012 (MAGD); Herrmann 2012 (10158)) (Analysis 3.1) and also carried out meta‐analysis for the two studies reporting change scores using the SMD (Forest 2006 (MD‐23); Herrmann 2012 (10158)) (Analysis 3.2).
-
Meta‐analysis of 2 studies in 306 participants: moderate‐certainty evidence (downgraded once for imprecision) gave an SMD of 0.11 (‐0.12 to 0.33).
-
Meta‐analysis of 2 studies in 422 participants: moderate‐certainty evidence (downgraded once for inconsistency; I² = 48% and P = 0.16) gave a mean difference of ‐0.50 (‐4.71 to 3.71) (random effects).
-
The 24‐week study (1 study in 273 participants): low‐certainty evidence (downgraded once for imprecision and once for inconsistency with the other studies) gave an MD of 0.90 (95% CI ‐1.29 to 3.09) on the CMAI long form scale (range 29 ‐ 203, with a clinically important difference of about 40), i.e. no difference between interventions (Herrmann 2012 (10158)).
-
Baseline levels were: 43.3 and 41.3 (Forest 2006 (MD‐23)); 68.3 for both groups (Fox 2012 (MAGD)); and 46.8 and 47.0 (Herrmann 2012 (10158)).
-
There was no inconsistency between the two studies in people receiving concomitant ChEI.
-
-
NPI subscale for agitation–aggression (Analysis 3.3); this outcome was only reported for the short‐term studies ‐ very low‐certainty evidence (downgraded once each for risk of bias, imprecision and indirectness): meta‐analysis of 2 studies in 146 participants gave an MD of ‐0.39 (95% CI ‐1.90 to 1.13) (Forest 2006 (MD‐23); Fox 2012 (MAGD)).
Two studies also reported the proportion with agitation as a treatment emergent adverse event (TEAE); a risk ratio (RR) less than 1 means the effect favours memantine.
-
Proportion with agitation as a TEAE (Analysis 3.4).
-
Meta‐analysis of 2 studies in 403 participants, 24 events, participants in both studies receiving concomitant ChEI: low‐certainty evidence (downgraded for imprecision twice) gave a RR of 2.39 (95% CI 1.04 to 5.50). This effect was consistent across the two studies (I² = 0%, P = 0.60).
-
The 24‐week study (369 participants, 22 events): low‐certainty evidence (downgraded on imprecision twice) gave a RR of 2.20 (95% CI 0.92 to 5.27), i.e. about twice as many participants on memantine and ChEI had agitation compared with participants on ChEI plus placebo.
-
Results for the four other efficacy outcomes are shown below. All are reported as negative outcomes; a negative SMD (or MD) value means that the effect favours memantine.
-
Clinical global rating (Analysis 3.5).
-
Meta‐analysis of 3 studies in 443 participants: low‐certainty evidence (downgraded for inconsistency and imprecision) gave an SMD (random effects) of ‐0.11 (95% CI ‐0.34 to 0.13). There is heterogeneity in the point estimates between the 12‐week and 24‐week studies (although I² = 25%, P = 0.26).
-
The 24‐week study (275 participants): low‐certainty evidence (downgraded on inconsistency with other studies and imprecision) gave an MD of 0.05 (95% CI ‐0.25 to 0.35) for the CIBIC+ scale.
-
-
Cognitive function; SIB (Analysis 3.6).
-
The two studies gave very different results.There is substantial heterogeneity (I² = 90%, P = 0.002), and therefore results are reported separately.
-
At 12 weeks (1 study, 129 participants): the MD is ‐10.00 (95% CI ‐16.15 to ‐3.85).
-
The 24‐week study (324 participants): very low‐certainty evidence (downgraded twice on inconsistency with the other study and imprecision) gave an MD of 0.48 (95% CI ‐1.61 to 2.57).
-
-
Decline in ADL; ADCS‐ADL19 (Analysis 3.7).
-
Meta‐analysis of 2 studies in 309 participants receiving ChEI: low‐certainty evidence (downgraded once for imprecision and once overall for some inconsistency and risk of bias (baseline difference)): gave an MD of 1.48 (95% CI ‐0.19 to 3.15). There was heterogeneity in the point estimates (although I² = 0%, P = 0.40).
-
The 24‐week study (276 participants): low‐certainty evidence (downgraded for risk of bias and imprecision) gave an MD of 1.80 (95% CI ‐0.03 to 3.63). The difference at baseline for that study (276 participants) was 1.10 units lower for memantine (i.e. memantine more severe) (Herrmann 2012 (10158)),
-
-
Behaviour and mood, NPI total (Analysis 3.8).
-
Meta‐analysis of 3 studies in 470 participants: very low‐certainty evidence (downgraded once each for risk of bias (baseline difference), inconsistency and imprecision): gave a random effects MD of ‐1.51 (95% CI ‐8.05 to 5.03). There was heterogeneity in both the 12‐week studies' subgroup (I² = 57%, P = 0.13) and overall (I² = 62%, P = 0.07), but no differences between durations. In each study there were large baseline differences between the values for memantine and placebo, which for two studies were comparable with the effect estimate.
-
The 24‐week study (324 participants): very low‐certainty evidence (downgraded on imprecision, inconsistency and risk of bias) gave an MD of 1.23 (95% CI ‐2.19 to 4.65). The difference in NPI at baseline for that study was 1.70 units higher for memantine (i.e. more severe), which is larger than the effect estimate.
-
-
All‐cause discontinuation, discontinuation due to adverse events, adverse events and serious adverse events are reported in section 5.
The results for studies with and without patients with agitation are compared in Table 10.
| Patients not selected for agitation (with moderate‐to‐severe AD) | Patients selected for agitation | |||||
| With / without ChEI | No ChEI | With ChEI | With / without ChEI, mainly with | With ChEI | With / without ChEI ‐ | |
| Clinical global (SMD) | ‐0.20 (‐0.28 to ‐0.13) n = 10 studies; 2797 patients I² = 0%, P = 0.86 | ‐0.20 (‐0.30 to ‐0.10) n = 7; 1672 patients I² = 0%, P = 0.88 | ‐0.21 (‐0.32 to ‐0.09) n = 3; 1125 patients I² = 13%, P = 0.32 | ‐0.11 (‐0.34 to 0.13) n = 3; 443 patients I² = 25%, P = 0.26 | 0.04 (‐0.20 to 0.28) n = 1; 324 patients | ‐0.28 (‐0.59 to 0.02) n = 2; 168 patients I² = 0%, P = 0.96 |
| Cognitive function (SMD) | ‐0.28 (‐0.35 to ‐0.21) n = 13; 3337 patients I² = 30%, P = 0.14 | ‐0.33 (‐0.43 to ‐0.23) n = 8; 1485 patients I² = 41%, P = 0.11 | ‐0.24 (‐0.33 to ‐0.14) n = 6; 1852 patients I² = 13%, P = 0.33 | Not pooled I² = 90%, P = 0.002 | 0.05 (‐0.17 to 0.27) n = 1, 324 patients | ‐0.56 (‐0.92 to ‐0.21) n = 1; 129 patients (with ˜20% ChEI) |
| Decline in ADL (SMD) | ‐0.17 (‐0.24 to ‐0.09) n = 11; 2687 patients I² = 0%, P = 0.582 | ‐0.20 (‐0.30 to ‐0.09) n = 7; 1368 patients I² = 10%, P = 0.36 | ‐0.13 (‐0.24 to ‐0.03) n = 5; 1319 patients I² = 0%, P = 0.69 | 0.21 (‐0.02 to 0.43) n = 2; 309 patients I² = 0%, P = 0.40 | 0.23 (‐0.01 to 0.47) n = 1; 276 patients | ‐0.02 (‐0.70 to 0.67) n = 1; 33 patients (with ChEI) |
| Behaviour and mood (SMD) | ‐0.14 (‐0.21 to ‐0.08) n = 14; 3674 patients I² =6%, P = 0.39 | ‐0.10 (‐0.19 to ‐0.01) n = 9; 1819 patients I² = 0%, P = 0.46 | ‐0.18 (‐0.27 to ‐0.09) n = 6; 1855 patients I² = 10%, P = 0.35 | ‐0.07 (‐0.41 to 0.27) n = 3; 470 patients I² = 62%, P = 0.07 | 0.08 (‐0.14 to 0.30) n = 1; 324 patients | ‐0.20 (‐0.69 to 0.29) n = 2; 146 patients I² = 43%, P = 0.19 |
| CMAI (SMD) | ‐0.21 (‐0.45 to 0.04) n = 1; 261 patients | 0.11 (‐0.12 to 0.33) n = 2; 306 patients I² = 0%, P = 0.77 | 0.10 (‐0.14 to 0.33) n = 1; 273 patients | CMAI (final values): SMD: ‐0.19 (‐0.52 to 0.13) CMAI (community): SMD: 0.21 (‐0.48 to 0.89) n = 1; 33 patients | ||
| Proportion with agitation (RR) | 0.76 (0.601 to 0.96) 6 studies; 2 241 patients I² = 0%, P = 0.67 | 0.68 (0.51, 0.91) 4 studies; 1016 patients I² = 0%, P = 0.59 | 0.92 (0.54 to 1.31) 3 studies; 1225 patients I² = 0% and 0.85 | RR 2.39 (1.04 to 5.50) 2 studies; 403 patients I² = 0%, P = 0.60 | 2.20 (0.92 to 5.27) 1 study; 369 patients | 5.00 (0.26 to 97.00) 1 study; 34 patients (with ChEI) |
1.4.2. Summary of results transformed to an appropriate scale
The evidence was mainly of low or very low certainty for this patient group. Three studies in around 550 participants compared memantine and placebo in people with moderate‐to‐severe disease with agitation, but only one of these studies had a duration of six to seven months (Herrmann 2012 (10158)). One of the short‐term studies had more severe agitation at baseline compared with the other two studies, and this same study only had 20% of participants on ChEIs (Fox 2012 (MAGD)), whereas the other two studies had all on ChEIs. For the outcomes of CMAI, clinical global and cognitive function, there is inconsistency between the 24‐week and 12‐week studies. For these outcomes, we reported the meta‐analysis results and also gave the results for the 24‐week study alone, with the evidence for the latter downgraded due to inconsistency with the other study results. The results are summarised below in terms of relative improvement for memantine versus placebo for consistency with the other summary sections.
Low‐certainty evidence from one study in 275 people suggested there may have been no difference between memantine and placebo, either for clinical global rating: MD (relative improvement) = ‐0.05 CIBIC+ points, 95% CI ‐0.35 to 0.25; or for cognitive function: MD (relative improvement) = ‐0.48, 95% CI ‐2.57 to 1.61. For performance on ADL, there may be no difference between memantine (with ChEI) and placebo (with ChEI): MD (relative improvement) = ‐1.48 ADL19 points, 95% CI ‐3.15 to 0.19 (2 studies in 309 people). It is very uncertain whether there is a difference between memantine and placebo for the behaviour and mood outcome: MD (relative improvement) = +1.51 NPI points, 95% CI ‐5.03 to 8.05.
Regarding agitation, there is moderate‐certainty evidence from two studies (422 participants) to suggest there is probably no difference between memantine and placebo on the agitation CMAI scale: MD (relative improvement) = 0.50 CMAI points, 95% CI ‐3.71 to 4.71: this is a very small change for the CMAI scale. The evidence on the NPI agitation–aggression subscale was not reported (although measured) for the 24 week study and the remaining evidence is of very low certainty.
The proportion reporting agitation as a TEAE in two studies (403 participants) may be doubled in those receiving memantine (plus ChEI) compared with placebo (plus ChEI) (RR 2.39, 95% CI 1.04 to 5.50). We assume that the proportion with agitation reflects increases in the severity of agitation in this patient group; baseline levels were not reported, but the proportions at 24 weeks in the two groups in the larger study were relatively small (8% for memantine and 4% placebo) (Herrmann 2012 (10158)). These proportions are similar to the ranges for the moderate‐to‐severe AD groups (0% to18% memantine and 3% to 22% placebo). Additionally, the larger study reported differences at baseline ‐ the memantine group had higher levels of antipsychotic medication (24% versus 20%) and there was a centre effect (Herrmann 2012 (10158)).
There are similar numbers of people with adverse events in both groups, and memantine (compared with placebo) probably shows little difference in the number of people discontinuing treatment (RR 1.10, 95% CI 0.79 to 1.52, which corresponds to 17 fewer per 1000, 95% CI 36 fewer to 89 more).
1.5. Effect of memantine 20 mg in people with mild AD at six months
1.5.1. Effect of memantine versus placebo in people with mild AD
Four studies contributed data from post‐hoc subgroups (Bakchine 2008 (99679) SG; Dysken 2014 SG; Peskind 2004 (MD‐10) SG; Porsteinsson 2008(MD‐12)S); (see section Subgroup analysis and investigation of heterogeneity). Of the 1396 participants analysed in the four mild‐to‐moderate AD trials, 621 (44%) had mild AD. Two studies gave concomitant ChEIs (Dysken 2014 SG, Porsteinsson 2008(MD‐12)S). One additional study recruited 26 participants with mild AD and reported cognitive function at 12 months ((Holland 2013)). One further study in 195 participants was considered in sensitivity analyses because it had a mean MMSE score of around 22 and the participants were anti‐dementia treatment naive (Peters 2015 (MEGACOMBI2)). The addition of this study reinforced the efficacy results (see Appendix 4.5.2).
The evidence for this section is summarised in the additional summary of findings Table 6. Results are shown below; a negative SMD (or MD) value means that the effect favours memantine.
-
Clinical global rating, CIBIC+ (Analysis 4.1): low‐certainty evidence (downgraded once on risk of bias because post‐hoc subgroups and once on imprecision): meta‐analysis of 3 studies in 427 participants gave an MD of ‐0.09 (95% CI ‐0.30 to 0.12).
-
Cognitive function, ADAS‐Cog (Analysis 4.2): moderate‐certainty evidence (downgraded once on risk of bias): meta‐analysis of 4 studies in 619 participants gave an MD of ‐0.21 (95% CI ‐1.38 to 0.95).
-
Decline in ADL, ADCS‐ADL23 (Analysis 4.3): moderate‐certainty evidence (downgraded once on risk of bias): meta‐analysis of 4 studies in 621 participants gave an MD of 0.07 (95% CI ‐1.66 to 1.80). There was some heterogeneity in point estimates (but I² = 3%, P = 0.38).
-
Behaviour and mood, NPI (Analysis 4.4): moderate‐certainty evidence (downgraded once on risk of bias): meta‐analysis of 4 studies in 621 participants gave an MD of 0.29 (95% CI ‐1.58 to 2.16).
One additional trial was conducted in 26 participants with mild AD, but only gave data for MMSE ‐ and only final values were reported at 12 months (Holland 2013). Very low‐certainty evidence (downgraded for imprecision (twice) and indirectness) gave an MD (negative outcome) of ‐1.15 (95% CI ‐3.47 to 1.17), favouring memantine, however, the baseline difference was ‐0.46. Addition of the Peters 2015 (MEGACOMBI2) study to the meta‐analyses for cognitive function and decline in ADL showed very similar SMD results, but narrower CIs (Appendix 4.5.2).
All‐cause discontinuation, discontinuation due to adverse events and adverse events are reported in section 5. Serious adverse events were not reported separately for people with mild dementia.
1.5.2. Summary of results transformed to an appropriate scale
The results are summarised in terms of the relative improvement for memantine versus placebo, for consistency with the other summary sections. Mainly moderate‐certainty evidence based on post‐hoc subgroups from up to four studies in around 600 participants suggests there is probably no difference between memantine and placebo for three of the efficacy outcomes: cognitive function: MD (relative improvement) = 0.21 ADAS‐Cog points, 95% CI ‐0.95 to 1.38; performance on ADL: MD (relative improvement): ‐0.07 ADL 23 points, 95% CI ‐1.80 to 1.66; and behaviour and mood: MD (relative improvement) = ‐0.29 NPI points, 95% CI ‐2.16 to 1.58, and there may be no difference for clinical global rating: MD (relative improvement) = 0.09 CIBIC+ points, 95% CI ‐0.12 to 0.30 (low‐certainty evidence) (Table 6).
For the cognitive function and behaviour and mood outcomes, we observed an average improvement over time for the placebo groups, but little or no change over time for the decline in ADL and clinical global outcomes (Appendix 4.5.2.2): for placebo, the median of the standardised mean change from baseline was: cognitive function ‐0.20, range ‐0.38 to 0.11 and behaviour and mood ‐0.16, range ‐0.33 to ‐0.10). This improvement with placebo is in contrast to the results for people with moderate‐to‐severe disease (see section 1.2.2 and Appendix 4.5.2.2).
There are similar numbers of people with adverse events in both groups, but memantine (compared with placebo) may give an increase in the number of people discontinuing treatment because of adverse events: RR 2.12 (95% CI 1.03 to 4.39), which corresponds to 33 more per 1000 (95% CI 1 to 100 more). The evidence is of very low certainty regarding all‐cause discontinuation (74 more people per 1000 discontinued treatment, 95% CI 8 to 181 more), and agitation was not reported in these studies.
2. Vascular dementia
2.1. Effect of memantine in people with mild‐to‐moderate vascular dementia at six to seven months; OC or per protocol
2.1.1 Effect of memantine (20 mg/day) versus placebo
Three studies randomised 956 participants with vascular dementia (Merz 2003 (MRZ‐9206); Orgogozo 2002 (9408); Wilcock 2002 (9202)); but only two of these contributed data (Orgogozo 2002 (9408); Wilcock 2002 (9202); 900 randomised participants). Both studies were in people with mild‐to‐moderate dementia, and neither study appeared to allow concurrent ChEIs. Participants were randomised to 20 mg/day memantine versus placebo for 28 weeks. The two studies used different scales for each outcome except cognitive function (for which both studies used ADAS‐Cog). The decline in ADL, and the behaviour and mood outcomes used the Nurse's Observational Scale for Geriatric Patients (NOSGER) subscales (Appendix 2), but one study used the revised version (NOSGER II) and were presented as per protocol analyses (Wilcock 2002 (9202)). Consequently, we analysed all outcomes as SMD, with the exception of cognitive function.
The evidence for this section is summarised in summary of findings Table 2, which covers both efficacy and safety outcomes.
Results are shown below; a negative SMD (or MD) value means that the effect favours memantine.
-
Clinical Global (Analysis 5.1): moderate‐certainty evidence (downgraded for inconsistency): meta‐analysis of 2 studies in 757 analysed participants gave a random effects SMD of ‐0.02 (95% CI ‐0.23 to 0.19). There is some heterogeneity (I² = 48%, P = 0.16).
-
Cognitive function, ADAS‐Cog (Analysis 5.2): moderate‐certainty evidence (downgraded for risk of bias): meta‐analysis of 2 studies in 569 participants gave an MD of ‐2.15 (95% CI ‐3.25 to ‐1.05). There is some heterogeneity in the point estimates (and I² = 12%, P = 0.29), but this was insufficient to downgrade on inconsistency.
-
Decline in ADL on the NOSGER self‐care subscale (Analysis 5.3): low‐certainty evidence (downgraded twice overall for risk of bias and unclear scale direction for one study): meta‐analysis of 2 studies in 542 participants gave an SMD of ‐0.04 (95% CI ‐0.20 to 0.13).
-
Behaviour and mood on the NOSGER disturbing behaviour subscale (Analysis 5.4): low‐certainty evidence (downgraded twice for risk of bias): meta‐analysis of 2 studies in 541 participants gave an SMD of ‐0.20 (95% CI ‐0.37 to ‐0.03).
Post‐hoc subgroup analyses by severity were also conducted for an FDA report for the cognitive function outcome: results were reported for both trials, separated at an MMSE score of 14 into mild‐to‐moderate and moderate‐to‐severe. Analysis 5.5 (fixed effect) shows the test for subgroup differences to be significant (I² = 72.5, P = 0.06), with a bigger effect in the moderate‐to‐severe subgroup (ADAS‐Cog MD ‐4.51, 95% CI ‐7.21 to ‐1.81) than in the mild‐to‐moderate subgroup (MD ‐1.64, 95% CI ‐2.83 to ‐0.45).
2.1.2. Summary of results transformed to an appropriate scale
Moderate‐ and low‐certainty evidence from two studies in around 750 participants with vascular dementia gave mixed results for the comparison of memantine and placebo. There is probably a small clinical benefit for cognitive function: MD benefit = 2.15 ADAS‐Cog points, 95% CI 1.05 to 3.25, and there may be a small clinical benefit on the NOSGER disturbing behaviour outcome: MD benefit = 0.47 NOSGER points, 95% CI 0.07 to 0.87. However, there is probably no difference between memantine and placebo in clinical global rating: MD benefit = 0.03 CIBIC+ points, 95% CI ‐0.28 to 0.34, and there may be no difference in performance on ADL: MD benefit = 0.11 NOSGER II self‐care subscale points, 95% CI ‐0.35 to 0.54.
There are similar numbers of people with adverse events in both groups, and there may be no difference in the numbers of people discontinuing treatment RR 1.05 (95% CI 0.83 to 1.34), which corresponds to 11 fewer people per 1000 (95% CI 37 fewer to 74 more). There may be fewer people with agitation as an adverse event for memantine compared with placebo RR 0.57 (95% CI 0.33 to 0.97) (i.e., 33 fewer per 1000, 95% CI 2 to 52 fewer).
A post‐hoc subgroup analysis by severity suggested that memantine (versus placebo) may have had a bigger effect for cognitive function in people with moderate‐to‐ severe vascular dementia (MMSE ≥14) than in people with mild‐to‐moderate vascular dementia. The test for subgroup differences was significant (I² = 72.5%, P = 0.06), although this was a post‐hoc analysis.
3. Other forms of dementia
3.1. Effect of memantine in people with Parkinson’s disease dementia (PDD) or dementia Lewy bodies (DLB)
3.1.1. Effect of memantine (20 mg/day) versus placebo
Four studies in 319 randomised participants with PDD or DLB met the inclusion criteria (Aarsland 2009; Emre 2010 (11018); Leroi 2009; Marsh 2009 PDD); two studies were solely in participants with PDD (Leroi 2009;Marsh 2009 PDD); and the other two were in a mixed PDD–DLB population: one study had more PDD participants (memantine group 50%, placebo 61%) (Aarsland 2009); and the other had 65% with PDD in the memantine group and 59% in the placebo group (Emre 2010 (11018)). The severity of dementia was mild‐to‐moderate, with mean MMSE scores of ˜22 (Marsh 2009 PDD); ˜21 (Emre 2010 (11018)); ˜20 (Aarsland 2009); and ˜19 (Leroi 2009). Some studies gave the participants concomitant ChEIs: one study had 47% in the memantine group and 63% for placebo (Aarsland 2009); one did not permit ChEIs (Emre 2010 (11018)); one had 18.2% (memantine) and 14.2% (placebo) (Leroi 2009); and the other did not state the proportions (Marsh 2009 PDD). Only one study reported OC results (Emre 2010 (11018)). All outcomes were analysed as SMD apart from cognitive function and behaviour–mood. One study reported results at 16 weeks (Leroi 2009); the others were at 24 weeks. We report results for the 24‐week studies, unless there was only one 24‐week study, in which case the 16‐week study was considered.
The evidence for this section is summarised in 'Summary of findings' Table 7, which covers both efficacy and safety outcomes. Results are shown below; a negative SMD (or MD) value means that the effect favours memantine.
-
Clinical Global (Analysis 6.1): low‐certainty evidence (downgraded once each for risk of bias and imprecision): meta‐analysis of 3 studies in 243 participants gave an SMD of ‐0.35 (95% CI ‐0.60 to ‐0.09). There was a little heterogeneity in the point estimates (I² = 15%, P = 0.31).
-
Cognitive function, MMSE (Analysis 6.2): very low‐certainty evidence (downgraded once each for risk of bias, inconsistency with the 16‐week study and imprecision): one study in 63 participants gave an MD of ‐1.90 (95% CI ‐3.73 to ‐0.07). There was substantial heterogeneity between this study and the study reporting results at 16 weeks (I² = 75%, P = 0.05).
-
Decline in ADL (Analysis 6.3): very low‐certainty evidence (downgraded once each on risk of bias, inconsistency and imprecision): meta‐analysis of 3 studies in 243 participants gave a random effects SMD of ‐0.27 (95% CI ‐0.65 to 0.11). There was some heterogeneity (I² = 40%, P = 0.19).
-
Behaviour and mood, NPI (Analysis 6.4): low‐certainty evidence (downgraded once on each of risk of bias and imprecision or inconsistency): meta‐analysis of 3 studies in 242 participants) gave a random effects MD of ‐2.18 (95% CI ‐5.57 to 1.21). There was some heterogeneity in the point estimates (I² = 20%, P = 0.29).
-
All‐cause discontinuation, discontinuation due to adverse events, adverse events and serious adverse events are reported in section 5.
3.1.2. Summary of results transformed to an appropriate scale
Low‐ and very low‐certainty evidence from up to 3 studies in around 250 participants suggested that, for memantine versus placebo in people with PDD or DLB, there may be a small clinical benefit in clinical global rating (MD benefit: 0.49 CIBIC+ points, 95% CI 0.13 to 0.83) and in behaviour and mood (although the confidence interval was consistent with both no effect and benefit) (MD benefit: 2.18 NPI points, 95% CI ‐1.21 to 5.57). Evidence for all other efficacy outcomes is of very low certainty. There may be fewer people discontinuing treatment RR 0.84 (95% CI 0.55 to 1.28), which corresponds to 32 fewer per 1000 (95% CI 90 fewer to 56 more).
3.2. Effect of memantine in people with frontotemporal dementia (FTD)
3.2.1. Effect of memantine (20 mg/day) versus placebo in people with FTD
Two studies in 133 randomised participants with FTD were included (Boxer 2013; Vercelletto 2011). Both studies were in people with mild dementia and both prohibited the use of ChEIs. One study (52 participants) reported at 52 weeks (Vercelletto 2011), and the other (81 participants) at 26 weeks (Boxer 2013); both are included in the meta‐analyses, but where there was heterogeneity, we reported only the 26‐week (single study) results.
The evidence for this section is summarised in 'Summary of findings' Table 8, which covers both efficacy and safety outcomes. Results are shown below; a negative SMD (or MD) value means that the effect favours memantine.
-
Clinical global rating (Analysis 7.1): low‐certainty evidence (downgraded once each for risk of bias and imprecision): meta‐analysis of 2 studies in 117 participants gave an SMD of ‐0.31 (95% CI ‐0.67 to 0.06). The single study at 26 weeks (76 participants) had an MD (CGIC) of ‐0.40 (95% CI ‐1.23 to 0.43) (low‐certainty evidence).
-
Cognitive function, MMSE (Analysis 7.2): very low‐certainty evidence (downgraded twice for imprecision and once for inconsistency): meta‐analysis of 2 studies in 122 participants gave a random effects MD (negative outcome is an improvement) of ‐0.23 (95% CI ‐2.03 to 1.56). The single study at 26 weeks (81 participants) had an MD of 0.30 (95% CI ‐1.23 to 1.83), low‐certainty evidence (downgraded twice for imprecision).
-
Decline in ADL ‐ outcome reported only for one study (Vercelletto 2011), as the percentage DAD score = yes
-
Behaviour and mood, NPI (Analysis 7.3): low‐certainty evidence (downgraded twice overall for imprecision and some inconsistency): meta‐analysis of 2 studies in 115 participants gave an MD of ‐3.16 (95% CI ‐8.06 to 1.74). For the single study at 26 weeks: MD (NPI) = ‐2.20 (95% CI ‐8.01 to 3.61) (low‐certainty evidence (downgraded twice on imprecision)).
-
All‐cause discontinuation, discontinuation due to adverse events, adverse events and serious adverse events are reported in section 5.
3.2.2 Summary of results transformed to an appropriate scale
Mainly low‐certainty evidence from 2 studies in around 120 participants suggests there may be a small clinical benefit in clinical global rating (MD benefit: 0.56 CGIC points, 95% CI ‐1.21 to 0.11) and in behaviour and mood (MD benefit: 3.16 NPI points, 95% CI ‐3.61 to 8.01) for memantine versus placebo in people with FTD. There may be no difference in cognitive function (MD benefit for one study: ‐0.30 MMSE points, 95% CI ‐1.83 to 1.23). However, for all of the efficacy outcomes, there is uncertainty and the confidence interval is consistent with more than one conclusion. There may be more discontinuation in the memantine group (compared with placebo) for this population (RR 1.54, 95% CI 0.54 to 4.06).
3.3. Effect of memantine in people with AIDS‐related dementia complex (ADC)
Only one study currently fulfilled the inclusion criteria of this review with regard to the use of memantine in ADC ((Schifitto 2007)). The study randomised a total of 140 participants to 40 mg/day memantine or placebo. Only the cognitive function outcome was reported for 48 and 45 participants, respectively, as measured by a summary neuropsychological test score, averaged over eight measures (NPZ‐8). The authors reported the percentage improvement from baseline at 16 weeks: MD 43.0% (95% CI ‐19.2 to 105.2), in favour of memantine (low‐certainty evidence because of imprecision).
The number of adverse events (not the number of participants with adverse events) were similar in each arm: 116 in the memantine arm and 106 in the placebo arm. low‐certainty evidence (downgraded twice for imprecision) suggested that for all‐cause discontinuation, there may be no difference between memantine and placebo (1 study 140 participants, 28 events) RR 1.00 (95% CI 0.52 to 1.94). Similarly for discontinuation due to adverse events (1 study 140 participants, 14 events) RR 1.00 (95% CI 0.37 to 2.70). Further investigation into the use of memantine in ADC would be warranted.
4. Comparison of effects in different types of dementia
4.1 Memantine versus placebo, all severities ‐ efficacy analyses at six‐seven months
The results of the efficacy analyses for six to seven months for each type of dementia, separated by severity are summarised in Analysis 8.1; Analysis 8.2; Analysis 8.3; Analysis 8.4. These analyses only include studies with a duration of six to seven months, so some types of dementia are represented only by single studies: AD with agitation (Herrmann 2012 (10158)); FTD (Boxer 2013); and, for cognitive function, PDD or DLB (Aarsland 2009).
The evidence for AD (apart from the studies in people with agitation) was mainly of high certainty and moderate for the mild subpopulation. The evidence certainty was moderate to low for vascular dementia and mainly low for FTD. For PDD or DLB and AD participants with agitation, the evidence certainty was low or very low.
Within these limitations, the following observations can be made for the efficacy outcomes; this section does not further address evidence certainty.
Clinical global rating (Analysis 8.1): memantine (versus placebo) gives a small improvement in clinical global rating in all types and severities of dementia, with the exception of AD with agitation (single study) and vascular dementia. In the latter two types, there seems to be no difference between memantine and placebo. There may be a smaller effect in people with mild AD than in people with moderate‐to‐severe AD, but severity does not seem very important for this outcome.
Cognitive function: memantine (versus placebo) gives an improvement in cognitive function for AD (moderate‐to‐severe), vascular dementia and PDD or DLB (single study). Single studies in people with AD plus agitation and FTD suggested there may have been no difference between interventions. There is a significantly larger effect of memantine (versus placebo) in the moderate‐to‐severe AD population compared with that in mild AD ‐ such that memantine probably has no effect on cognitive function in people with mild AD, whereas an effect is observed in the moderate‐to‐severe population. The effect size in mild‐to‐moderate DLB or PDD (single study) and in mild‐to‐moderate vascular dementia appears to be similar to that in moderate‐severe AD (Analysis 8.2). Further trends towards increased efficacy with severity are indicated in Analysis 5.5 for vascular dementia and (Appendix 4) for AD.
Decline in ADL (Analysis 8.3): memantine (versus placebo) gives an improvement in performance on ADL in AD (moderate‐to‐severe) and PDD or DLB, but there may be no effect in vascular dementia and a deterioration in ADL performance for AD with agitation (single study). There is a significantly larger effect of memantine (versus placebo) in participants with moderate‐to‐severe AD compared with mild AD ‐ such that memantine probably has no effect on ADL in people with mild AD, but a small effect in people with moderate‐to‐severe AD. The effect in mild‐to‐moderate DLB or PDD again appears to be similar to that in moderate‐to‐severe AD.
Behaviour and mood (Analysis 8.4): memantine (versus placebo) appears to give an improvement in behaviour and mood for all types of dementia, with the exception of mild AD and AD with agitation (single study), for which there may be no difference between interventions. There is a significantly larger effect of memantine (versus placebo) in participants with moderate‐to‐severe AD versus mild AD ‐ such that memantine probably has no effect on behaviour and mood in people with mild AD. The effect in each of the other types of dementia (vascular dementia, DLB or PDD and FTD (one study) for mild‐to‐moderate dementia appears to be similar to that in moderate‐to‐severe AD (Analysis 8.4). There appears to be a trend towards increased efficacy with increased severity (Appendix 4), but this was an aggregate level subgroup analysis.
Agitation: the CMAI score has been compared in a limited way between AD patients, with versus without agitation at baseline (Table 10). Memantine (versus placebo) appears to result in fewer people with agitation in most types of dementia, with the exception of AD patients with agitation, for which memantine may give more severe agitation (Analysis 8.5) (see section 5.2.3 below). The effect on agitation of memantine versus placebo appears to be larger in people with moderate‐to‐severe AD compared with mild‐to‐moderate AD (Analysis 8.5), and also seems more effective in monotherapy compared with concomitant ChEI (Analysis 8.6). Results for this outcome were not given for the mild post‐hoc subgroup.
5. Adverse effects
We report results for all types of dementia and all durations for the 20 mg/day dose or equivalent. Forty‐one studies met these dose inclusion criteria in 8960 randomised participants. However, not all studies reported all outcomes and four of these remaining studies did not report any safety outcomes (Lundbeck 2006 (99817); Merz 2003 (MRZ‐9104); Merz 2003 (MRZ‐9105); Merz 2003 (MRZ‐9206)).
5.1. All‐cause discontinuation and discontinuation due to adverse events
The results of the discontinuation analyses for all studies are shown in Analysis 9.1 and Analysis 9.2, regardless of study duration, but split by dementia type and severity in Analysis 8.7 and Analysis 8.8 (three studies in mild‐to‐moderate disease were excluded from this analysis: Asada 2011 (MA3301); Peters 2015 (MEGACOMBI2); Schmidt 2008. Differences between studies in participants with or without ChEI are shown in Analysis 2.9 and Analysis 2.10 (for which three studies were excluded from the analysis because a proportion of participants were treated with ChEI ‐ Hofbauer 2009 (MD‐71); Holland 2013; Wilkinson 2012 (10112)); all study durations were permitted.
5.1.1. All‐cause discontinuation
All‐cause discontinuation was reported in 36 studies that included 8752 participants (1600 events). Overall, there is no difference between memantine and placebo: RR 0.99 (95% CI 0.91 to 1.08) (Analysis 9.1). There may be slight heterogeneity in the point estimates, but I² = 0%, P = 0.79. However, Analysis 8.7 suggests there are differences across dementia types and severities, and this is reinforced in AD, which shows a highly significant result in the test for subgroup differences (I² = 83.8% and P = 0.01) when comparing mild disease (RR 1.74, 95% CI 1.08 to 2.81) and moderate‐to‐severe disease (RR 0.93, 0.83 to 1.04).
We therefore report the results for this outcome separately for each dementia type and severity in the 'Summary of findings' tables for sections 1 to 3. For the moderate‐to‐severe AD group, there was no significant difference between the results for monotherapy and those for concomitant ChEI (Analysis 2.9) and so we report the combined moderate‐to‐severe results (test for subgroup differences I² = 0%, P = 0.83).
5.1.2. Discontinuation due to adverse events
Discontinuation due to adverse events was reported in 32 studies that included 8271 participants (779 events). Overall, there is little difference between memantine and placebo: RR 1.06 (95% CI 0.92 to 1.21) (Analysis 9.2). There is some heterogeneity in the point estimates, but I² = 0%, P = 0.64. Analysis 8.8 suggests there may be differences in discontinuation due to adverse events across dementia types and severities, and for AD there is a significant result in the test for subgroup differences between mild and moderate‐to‐severe disease (I² = 78.5% and P = 0.03). For the moderate‐to‐severe subgroup, there is no difference between the results for monotherapy and those for concomitant ChEI (Analysis 2.10; test for subgroup differences: I² = 0%, P = 0.65).
A previous finding of this review was that all‐cause discontinuation appeared to be less in participants taking memantine. This is only partially supported in this update by the six‐month trials of moderate‐to‐severe AD, which suggest a slight benefit (Analysis 1.5). However, for populations in which memantine has little effectiveness, there may be more people discontinuing the drug compared with placebo.
5.2. Adverse events
The adverse effects profile and tolerability were good.
5.2.1. Number with at least one adverse event
Twenty‐nine studies (of 41 possible) in 8033 participants reported the number of participants with at least one adverse event (Analysis 9.3); this is 90% of the available participants. Meta‐analysis showed no difference between memantine and placebo, which appeared consistent across studies: RR 1.03 (95% CI 1.00 to 1.06), I² = 0%, P = 0.60 (5371 events).
Analysis 8.9 shows a subgroup analysis by severity (mild‐to‐moderate and moderate‐to‐severe) and type of dementia and there are no significant differences between subgroups. Sensitivity analysis, excluding studies at overall high risk of bias had little effect. An analysis of studies in AD patients with moderate‐to‐severe disease and without agitation at baseline showed there is no significant difference between the results for monotherapy (RR 0.99, 95% CI 0.94 to 1.04) and those for concomitant ChEI (RR 1.05, 95% CI 0.98 to 1.12). (Analysis 2.11). The test for subgroup differences was I² = 46.0%, P = 0.17), but this is probably due to the narrow confidence intervals as a consequence of a large number of participants, On the basis of the similarity of the different subgroup findings, we used AE results for the full dataset for every type and severity of dementia.
5.2.2. Number with at least one serious adverse event
Twenty‐seven studies in 8138 participants reported the number with at least one serious adverse event (Analysis 9.4); this was 93% of all available participants. Meta‐analysis shows little difference between memantine and placebo: RR 0.92 (95% CI 0.83 to 1.02), I² = 0%, P = 0.71 (1157 events). Analysis 8.10 shows subgroups by both type and severity of dementia. There appear to be some differences by type of dementia, but no dependence on severity amongst the AD studies without agitation. Additionally, there is no significant difference between the results for monotherapy and those for concomitant ChEI in people with moderate‐to‐severe disease (Analysis 2.12). Therefore, in sections 1 to 4 we report this outcome separately for the different types of dementia, but combine the results for the AD studies (apart from those with agitation).
5.2.3. Number with agitation as an adverse event
Nineteen studies in 5933 participants reported the number of participants with agitation (Analysis 9.5); this was 68% of all available participants. Data on agitation were mainly reported as 'serious adverse events' or 'adverse events' in ClinicalTrials.gov or as registry data (see footnotes to the forest plots). Meta‐analysis suggests that fewer participants have agitation if they are taking memantine compared with placebo: RR 0.84 (95% CI 0.71 to 1.01) (424 events). There is some heterogeneity, I² = 32%, P = 0.09. Subgrouping by severity and type of dementia in Analysis 8.5 showed there were some differences by type of dementia, but the subdivision into mild‐to‐moderate and moderate‐to‐severe AD is not warranted, particularly because it was dependent on one study in people with moderate AD ((Wilkinson 2012 (10112)). There are no agitation data for the post‐hoc subgroups of mild and moderate AD.
In the AD population with agitation at baseline, there may be twice as many participants with agitation as a treatment emergent adverse event at six months for memantine compared with those on placebo, whereas memantine appears to be protective for agitation in people with AD without agitation at baseline (test for subgroup differences I² = 84%, P = 0.01) (Analysis 8.5) (low‐certainty evidence).
There may be different effects in the presence compared with the absence of ChEIs (Analysis 2.13; test for subgroup differences: I² = 20.9, P = 0.26). The results suggest less agitation for memantine (versus placebo) for the monotherapy subgroup (RR 0.68, 95% CI 0.51 to 0.91) and some heterogeneity, but little difference for concurrent therapy with ChEI (RR 0.92, 95% CI 0.60 to 1.40). Therefore, we reported this outcome separately in the summary of findings tables for sections 1 to 3 for other types of dementia; we combined the results for the AD studies across all severities (apart from those with agitation), but reported separately the results for studies in people receiving concomitant ChEI.
The collection of 'agitation as an adverse event' is not a good way to assess the impact of interventions on incident agitation, particularly for the studies in patients with agitation at baseline. Nevertheless, we have included these results in Analysis 8.11 for completeness, but have reported agitation as an efficacy outcome in section 1.4.
5.2.4. Number with specific adverse events
Results for other adverse events are shown in Table 11 and in Analysis 9.6 (insomnia); Analysis 9.7 (confusion); Analysis 9.8 (depression); Analysis 9.9 (headache); Analysis 9.10 (hypertension); Analysis 9.11 (dizziness); Analysis 9.12 (falls); Analysis 9.13 (accidental injury); Analysis 9.14 (urinary incontinence); Analysis 9.15 (diarrhoea) and Analysis 9.16 (influenza‐type symptoms).
| Adverse event | Number of studies (participants) | RR (95% CI) | Heterogeneity (I²) | GRADE rating |
| Insomnia (Analysis 9.6) | 19 (5354), 221 events | 0.93 (0.73 to 1.20) | I² = 14%, P = 0.29 | LOW (downgraded on imprecision and reporting bias < 70% patients had AE data) |
| Confusion (Analysis 9.7) | 13 (4509), 167 events | 1.23 (0.91 to 1.65) | I² = 0%, P = 0.51 | LOW (downgraded on imprecision and reporting bias < 70% patients had AE data) |
| Depression (Analysis 9.8) | 10 (3052), 83 events | 1.06 (0.70 to 1.60) | I² = 0%, P = 0.60 | VERY LOW (downgraded on imprecision (twice), inconsistency in point estimates (once) and reporting bias <40% patients had AE data (twice)) |
| Headache (Analysis 9.9) | 16 (4889), 240 events | 1.29 (1.00 to 1.66) | I² = 9%,P = 0.36 | LOW (downgraded on imprecision (once) and reporting bias <70% patients had AE data) |
| Hypertension (Analysis 9.10) | 8 (3175), 87 events | 1.76 (1.14 to 2.70) | I² = 1%, P = 0.42 | VERY LOW (downgraded on imprecision (twice), inconsistency in point estimates (once) and reporting bias <40% patients had AE data (twice)) |
| Dizziness (Analysis 9.11) | 19 (6395), 323 events | 1.59 (1.28 to 1.98) | I² = 0%, P = 0.49 | MODERATE (downgraded on inconsistency in point estimates) |
| Falls (Analysis 9.12) | 20 (6743), 589 events | 0.98 (0.84 to 1.13) | I² = 0%, P = 0.84 | HIGH |
| Accidental injury (Analysis 9.13) | 10 (3813), 214 events | 0.81 (0.62 to 1.05) | I² = 0%, P = 0.81 | VERY LOW (downgraded on imprecision (once) and twice on reporting bias (< 50% patients and 1 in 4 studies) |
| Urinary incontinence (Analysis 9.14) | 8 (2724), 76 events | 1.12 (0.73 to 1.72) | I² = 0%, P = 0.83 | VERY LOW (downgraded on imprecision (twice), inconsistency in point estimates (once) and reporting bias <4 0% patients had AE data (twice)) |
| Diarrhoea (Analysis 9.15) | 18 (6186), 318 events | 0.82 (0.66 to 1.02) | I² = 0%, P = 0.58 | LOW (downgraded on imprecision (once), some inconsistency in point estimates and reporting bias <70% patients had AE data (once further)) |
| Influenza‐like symptoms (Analysis 9.16) | 7 (2836), 129 events | 1.21 (0.87 to 1.70) | I² = 0%, P = 0.97 | VERY LOW (downgraded on imprecision (once), and reporting bias < 40% patients and 1/6 studies had AE data (twice)) |
The evidence on specific adverse events was generally of low‐ or very low‐certainty, mainly because relatively few studies reported the outcomes and we felt there was risk of reporting bias (Table 11).
Memantine is probably 1.6 times more likely than placebo to result in dizziness (RR 1.59, 95% CI 1.28 to 1.98) (moderate‐certainty) and may be 1.2 times more likely to result in confusion (RR 1.23, 95% CI 0.91 to 1.65) and 1.3 times more likely to give headache (RR 1.29, 95% CI 1.00 to 1.66) (low certainty). Memantine may be 1.2 times less likely than placebo to result in diarrhoea (RR 0.82, 95% CI 0.66 to 1.02) (low certainty). There is no difference between interventions for the incidence of falls (RR 0.98, 95% CI 0.84 to 1.13) (high‐certainty evidence). There is uncertainty about the other adverse events recorded.
Discusión
Resumen de los resultados principales
En esta sección se analizaron los resultados relacionados con los dos objetivos de la revisión: evaluar la eficacia y la seguridad de la memantina para el tratamiento de la demencia de diferentes etiologías y, en segundo lugar, evaluar si la memantina agrega un beneficio en los pacientes que ya reciben inhibidores de la colinesterasa (ChEI).
A) Eficacia y seguridad de la memantina
La memantina muestra un pequeño beneficio clínico importante sobre placebo en algunas poblaciones, pero no en otras. En particular, hay un beneficio en la enfermedad de Alzheimer (EA) moderada a grave en los cuatro resultados de eficacia y en algunos resultados de la demencia vascular. Probablemente no hay beneficio en la EA leve y no se sabe si hay algún efecto en los pacientes con agitación que presentan enfermedad moderada a grave. Más adelante se proporciona un resumen de los resultados de eficacia.
En toda la revisión no se encontraron diferencias entre memantina y placebo en la cantidad de pacientes con al menos un evento adverso, independientemente de la etiología o la gravedad de la demencia (cociente de riesgos [CR] 1,03; intervalo de confianza [IC] del 95%: 1,00 a 1,06). En general, la evidencia sobre los eventos adversos específicos es de certeza baja o muy baja, sobre todo porque relativamente pocos estudios informaron los resultados y se consideró que hubo riesgo de sesgo de informe. Dicho esto, podría ser que la memantina tenga 1,59 (IC del 95%: 1,28 a 1,98) veces más probabilidades que placebo de provocar mareo (6,1% versus 3,9%) y puede ser 1,29 (IC del 95%: 1,00 a 1,66) veces más probable que provoque cefalea (5,5% versus 4,3%). La memantina puede tener 1,2 veces menos probabilidades que placebo de provocar diarrea (CR 0,82; IC del 95%: 0,66 a 1,02). No hay diferencias entre las intervenciones en la incidencia de caídas.
La interrupción (por todas las causas) varía según la gravedad de la enfermedad y puede tener una relación inversa con la efectividad. Por ejemplo, la interrupción en los participantes con EA leve (CR 1,74; IC del 95%: 1,08 a 2,81) es muy diferente a la de los participantes con EA moderada a grave: (CR 0,93; IC del 95%: 0,83 a 1,04).
1. Enfermedad de Alzheimer (EA)
La eficacia de la memantina varía según la gravedad de la enfermedad.
En la EA moderada a grave, la evidencia de hasta 14 estudios con alrededor de 3700 participantes muestra que hay un beneficio clínico pequeño de la memantina con respecto a placebo en cada uno de los principales resultados de eficacia. Aproximadamente un número similar de pacientes que reciben memantina y placebo interrumpen el tratamiento y es probable una reducción en el número con agitación como un evento adverso. Estas diferencias entre la memantina y placebo son efectos beneficiosos pequeños pero importantes, y se conoce que son fiables (ver Calidad de la evidencia). Se acompañan de un número similar de pacientes que interrumpen el tratamiento y probablemente hay una reducción en los pacientes con agitación.
En los pacientes con EA leve, se utilizó la evidencia de subgrupos post hoc dentro de cuatro estudios en pacientes con enfermedad leve a moderada. Aunque los ensayos se realizaron en una población con enfermedad leve a moderada, la homologación y el tratamiento de la EA se estratifican en categorías leve y moderada a grave, por lo que fue necesario aislar de esta manera la evidencia sobre la población leve. Un estudio pequeño se realizó de manera exclusiva en pacientes con enfermedad leve, pero no proporcionó información suficiente para investigar el efecto de la memantina en esta población (y hubo preocupaciones con respecto a las capacidades motrices). La evidencia de hasta cuatro estudios con alrededor de 600 participantes indicó que puede no haber diferencias entre memantina y placebo en la clasificación clínica global y probablemente no hay diferencias en los otros tres resultados de eficacia. Puede haber un aumento en la cantidad de pacientes que interrumpen el tratamiento debido a los eventos adversos, que puede no ser sorprendente debido a la falta de eficacia. En la población con EA leve, se observó una mejoría promedio con el transcurso del tiempo en la funcionalidad cognitiva y en el comportamiento y el estado de ánimo en los grupos placebo (cambio mediano a partir del valor inicial). No se sabe si esta mejoría es un efecto real o una regresión estadística a la media; es posible que la mejoría se pueda relacionar con que los participantes están en un ensayo.
También se investigó por separado el efecto de la memantina en pacientes con EA moderada a grave, que se seleccionaron por la agitación. Solo un estudio tuvo resultados a los seis meses, pero también se analizaron otros dos estudios con un seguimiento de tres meses para investigar si el estudio de seis meses fue un valor atípico. Esta evidencia fue principalmente de certeza baja o muy baja y, dentro de estas limitaciones, indicó que podría haber poco o ningún efecto de la memantina en esta población para los resultados de la clasificación clínica global, la funcionalidad cognitiva y el desempeño en las actividades cotidianas (AC); la evidencia para el comportamiento y el estado de ánimo fue de certeza muy baja. Hubo evidencia de certeza moderada de la puntuación del Cohen‐Mansfield Agitation Index (CMAI) para la agitación, que indicó que probablemente no hubo diferencias entre memantina y placebo. La proporción que informó la agitación como un evento adverso (EA) nuevo del tratamiento en dos estudios (403 participantes) se puede duplicar en los pacientes seleccionados por la agitación que reciben memantina (más ChEI) en comparación con placebo (más ChEI). Lo anterior difiere en los pacientes con EA con enfermedad moderada a grave que no fueron seleccionados por la agitación, y en los que la proporción que informa agitación se reduce con la memantina. En general no se tiene confianza en estos resultados, pero se considerara que se necesitan estudios de investigación adicionales para determinar si la memantina es verdaderamente inefectiva en una población con agitación, y se reconoce que los ensayos en esta población que presenta agitación son difíciles de realizar.
2. Demencia vascular
Evidencia de certeza moderada y baja de dos estudios con alrededor de 750 participantes con demencia vascular proporcionó resultados contradictorios para la comparación de memantina y placebo. Probablemente hay un beneficio clínico pequeño en la funcionalidad cognitiva y podría haber un beneficio clínico pequeño en el resultado de la Nurse's Observational Scale for Geriatric Patients (NOSGER) disturbing behaviour. Sin embargo, probablemente no hay diferencias entre memantina y placebo en la clasificación clínica global y puede no haber diferencias en el desempeño en las actividades cotidianas (AC). Puede no haber diferencias en la cantidad de pacientes que interrumpieron el tratamiento y puede haber menos pacientes con agitación como un evento adverso de la memantina en comparación con placebo.
Un análisis de subgrupos post hoc por la gravedad indicó que la memantina (versus placebo) puede tener un efecto mayor en la funcionalidad cognitiva en los pacientes con demencia vascular moderada a grave (Mini Mental State Examination (MMSE) ≥14) que en los pacientes con demencia vascular leve a moderada. La prueba para las diferencias de subgrupos fue significativa (I² = 72,5%, p = 0,06), aunque este fue un análisis post hoc.
3. Otras formas de demencia
Demencia de la enfermedad de Parkinson (DEP) y demencia de cuerpos de Lewy (DCL): evidencia de certeza baja y muy baja de hasta tres estudios con alrededor de 250 participantes indica que, comparada con placebo en pacientes con DEP o DCL, la memantina podría tener un beneficio clínico pequeño en la clasificación clínica global y en el comportamiento y el estado de ánimo (aunque el intervalo de confianza fue consistente con ningún efecto y beneficio). La evidencia de todos los otros resultados de eficacia fue de certeza muy baja. Podría haber menos pacientes que interrumpan el tratamiento.
Demencia frontotemporal (DFT): evidencia principalmente de certeza baja de dos estudios con alrededor de 120 participantes indica que podría haber un beneficio clínico pequeño en la función clínica global y en el comportamiento y el estado de ánimo con la memantina, comparada con placebo, para los pacientes con DFT. Puede no haber diferencias en la funcionalidad cognitiva. Sin embargo, en todos los resultados de eficacia hay incertidumbre y el intervalo de confianza es consistente con más de una conclusión. Puede haber más interrupciones en el grupo de memantina (en comparación con placebo) en esta población, pero una vez más el IC es amplio.
Complejo de demencia asociado al SIDA (CDS): solo se identificó un estudio con 140 participantes que indicó que puede haber una mejoría en la puntuación cognitiva (Neuropsychological Z score [NPZ]‐8) a las 16 semanas y que la interrupción por todas las causas puede ser similar con memantina y placebo.
B) Beneficio de la memantina en los que ya reciben inhibidores de la colinesterasa (ChEI)
En el segundo objetivo se examinó si la memantina podría tener un beneficio gradual en los pacientes que ya reciben ChEI. Este tema se examinó al investigar si hubo diferentes efectos relacionados con la presencia o la ausencia de ChEI concomitante en los pacientes donde la memantina fue más eficaz que placebo (es decir, EA moderada a grave).
EA moderada a grave, con ChEI concomitante: seis ensayos con alrededor de 1850 pacientes mostraron un beneficio clínico pequeño de la memantina versus placebo en la funcionalidad cognitiva, el desempeño en las actividades cotidianas (AC) y el comportamiento y el estado de ánimo; y probablemente hay un beneficio clínico pequeño en la clasificación clínica global. Hubo un número similar de pacientes con eventos adversos en ambos grupos (CR 1,03; IC del 95%: 1,00 a 1,06). Un número similar de pacientes que reciben memantina y un ChEI interrumpen el tratamiento en comparación con los que reciben placebo y un ChEI, y puede haber poca o ninguna diferencia entre las intervenciones en el número de pacientes con agitación como un evento adverso.
Hubo resultados similares de eficacia en los pacientes que reciben monoterapia con memantina, excepto que el efecto beneficioso en comparación con placebo es más pequeño con la monoterapia para el resultado de comportamiento y estado de ánimo y mayor para el resultado de funcionalidad cognitiva (Tabla 10). A diferencia de los pacientes que reciben un ChEI concomitante, los pacientes que reciben monoterapia con memantina probablemente tienen menos agitación que los que reciben placebo.
Los análisis de subgrupos entre los ensayos que compararon la presencia y ausencia de ChEI concomitante indican que no hay diferencias significativas entre la monoterapia y el tratamiento concurrente con ChEI concomitante (para la comparación de memantina versus placebo) en cualquiera de los resultados primarios de eficacia, aunque hay una diferencia no significativa entre los subgrupos en el resultado de funcionalidad cognitiva (I² = 44%, p = 0,18) y en el resultado de comportamiento y estado de ánimo (I² = 35%, P = 0,21). Estos análisis de subgrupos son comparaciones no aleatorias entre diferentes grupos de estudios y no investigan los posibles factores de confusión, como la gravedad de la enfermedad. La única evidencia de comparación aleatoria directa fue de certeza baja: un estudio asignó al azar a 149 participantes a memantina más donepezilo continuo versus memantina más placebo, con interrupción del donepezilo. El estudio estuvo afectado por la falta de datos diferenciales, pero puede haber un efecto beneficioso al administrar ambos fármacos en comparación con la monoterapia con memantina en la funcionalidad cognitiva, es decir, puede ser mejor agregar memantina que cambiar a memantina.
Compleción y aplicabilidad general de las pruebas
Los pacientes con demencia reclutados en los ensayos farmacológicos no suelen ser representativos de las poblaciones clínicas típicas. Con frecuencia los reclutados no presentan comorbilidades físicas, tienen un mejor apoyo psicosocial y tienen menos probabilidades de presentar síntomas neurosiquiátricos, lo que puede atenuar el deterioro y su repercusión funcional.
Los estudios fueron demasiado cortos y pequeños como para esperar que mostraran un efecto de la memantina sobre la expectativa de vida. Es posible que el fármaco prolongue el tiempo total de deterioro sin reducir la carga personal o social de la enfermedad (Dresser 2000).Los beneficios de retrasar la progresión de la enfermedad de Alzheimer en los últimos estadios pueden generar controversias (Post 1997).
La confiabilidad de la distinción entre la demencia vascular y la de Alzheimer no es alta: la mayoría de los pacientes con demencia vascular, en especial los que presentan demencia grave tienen una patología de Alzheimer adicional. Lo anterior limita la aplicabilidad de los resultados de los ensayos de la demencia vascular leve a moderada a los pacientes con demencia vascular grave.
Los análisis de los pacientes que responden al tratamiento no se presentan de forma sistemática, aunque los datos de todos los ensayos estén disponibles. Sin embargo, un metanálisis de los pacientes que responden al tratamiento basado en seis ensayos encontró que un 10% más de los pacientes tratados con placebo, comparados con los pacientes tratados con memantina, mostraron algún empeoramiento clínico (Wilkinson Post‐Hoc 6RCTs 2007). Hubo una diferencia similar en las tasas de empeoramiento clínico marcado.
Las medidas de función ejecutiva son difíciles de evaluar en los pacientes con demencia más avanzada y, en general, no se analizan bien en los ensayos de EA que utilizan la Alzheimer's Disease Assessment Scale ‐ Cognitive subscale (ADAS‐Cog) y no se incluyeron en los ensayos de demencia vascular (Roman 1999).
Las listas detalladas de las reacciones farmacológicas adversas se informan con poca frecuencia, por lo que hay una posibilidad teórica de sesgo de publicación. Los reguladores requieren un informe detallado. Aunque los detalles de estos informes a los reguladores son confidenciales, probablemente los cambios en el "Resumen de las características del producto" sean una fuente más confiable de información sobre los efectos adversos poco frecuentes que los datos agrupados en las revisiones sistemáticas.
Calidad de la evidencia
La evidencia para la EA es principalmente de certeza alta (con la excepción de los estudios en pacientes seleccionados por la agitación), lo que significa que se puede estar muy seguro de los resultados, que se resumieron a través de muchos estudios con un gran número de participantes. La evidencia para la EA leve se obtuvo a partir de subgrupos post hoc en los ensayos, con datos proporcionados por las compañías farmacéuticas, pero esta evidencia es todavía de certeza moderada.
La certeza de la evidencia es moderada a baja para la demencia vascular y principalmente baja para la DFT. Para la DEP o la DCL y los participantes con EA y agitación, la certeza de la evidencia es principalmente baja o muy baja.
Los autores de esta revisión han hecho todo lo posible para obtener datos de los estudios que no se han publicado de manera completa o de los que ha habido retrasos en la publicación. Este trabajo ha aumentado mucho el volumen de la evidencia disponible; no obstante, los resultados de algunos estudios todavía no son de dominio público y podría haber sesgo de publicación. Los gráficos en embudo de los principales resultados de eficacia y de la interrupción por todas las causas no parecieron indicar sesgo de estudios pequeños. Puede que se haya encontrado alguna asimetría para el resultado de eventos adversos. Casi todos los ensayos fueron financiados por compañías farmacéuticas.
Sesgos potenciales en el proceso de revisión
En el análisis de los datos se ha realizado una serie de análisis de subgrupos y estratificaciones. Desde un principio, los estudios se estratificaron por el tipo de demencia, pero posteriormente se realizaron comparaciones entre las etiologías como una forma de verificación. La estratificación pareció ser apropiada para los resultados de eficacia y algunos resultados de seguridad, pero los resultados de los eventos adversos de todos los estudios se combinaron porque no se encontraron diferencias en los eventos adversos entre los subgrupos diagnósticos. Se investigó la duración del estudio, la dosis de memantina y el tipo de análisis (caso observado [CO] versus última observación realizada [LOCF, por su sigla en inglés]) y los análisis principales se limitaron a una duración de seis meses y a las dosis autorizadas, y también se prefirió analizar los datos de los CO. Se han documentado los razonamientos para tomar todas estas decisiones, pero podrían ser una fuente de sesgo.
Los datos se dividieron según la gravedad en EA leve y moderada a grave, sobre la base de los análisis de subgrupos y el pragmatismo relacionado con los requisitos de homologación actual. Estos análisis de subgrupos parecieron proporcionar evidencia convincente, pero aún son comparaciones no aleatorias y pudieran estar afectados por otros factores de confusión. Luego el conjunto de datos de moderada a grave se dividió de forma adicional para investigar el efecto de ChEI concomitante, y esta división adicional podría haber dado lugar a un error aleatorio. Por este motivo (y por la falta de evidencia de una diferencia entre la monoterapia y el tratamiento dual), se prefirió utilizar los resultados de todos los estudios, independientemente del uso de ChEI.
Los datos de la EA leve se calcularon a partir de los datos publicados de los ensayos en pacientes con enfermedad leve a moderada y las compañías farmacéuticas proporcionaron datos de subgrupos de los pacientes con enfermedad moderada. Estos datos son de subgrupos post hoc, por lo que puede haber diferencias entre los grupos de intervención en las características iniciales. Habría sido preferible estratificar a los pacientes por la gravedad y luego asignarlos de forma aleatoria a los tratamientos, pero los autores de los ensayos no realizaron esta estratificación. Dicho esto, hay un gran número de participantes y la división entre la enfermedad leve y moderada fue predeterminada, de manera que probablemente esta es una limitación menor.
También se tomaron algunas decisiones post hoc, por ejemplo, tratar por separado los estudios en pacientes con EA seleccionados por la agitación y excluir del análisis dos brazos aleatorios de un estudio debido a una interacción informada por el estudio de la memantina con la vitamina E. En el primer caso, se consideró que los pacientes seleccionados por la agitación eran suficientemente diferentes de otros pacientes con EA y que no se deberían incluir en los mismos análisis, y en el segundo caso se pensó que la modificación del efecto podría haber introducido heterogeneidad injustificada. Estas decisiones podrían haber provocado que se sobrestimaran los resultados para la EA.
Se ha sido transparente acerca de los enfoques seguidos en esta revisión y no se considera que la posibilidad de sesgo sea alta.
Acuerdos y desacuerdos con otros estudios o revisiones
Esta revisión Cochrane actualizada tiene sobre todo similitudes con el trabajo anterior, pero también algunas diferencias. La presente revisión se ha centrado en las guías clínicas o las evaluaciones de tecnologías para la demencia, así como en revisiones sistemáticas recientes de memantina. El foco principal ha estado en la EA, al considerar la cantidad de estudios incluidos, el enfoque a la monoterapia y el tratamiento concurrente, las maneras de tratar los datos faltantes, los efectos de la gravedad y la repercusión de la agitación.
Se han incluido 32 estudios nuevos (en comparación con 2006), varios con datos no publicados proporcionados por los autores de los estudios o las compañías farmacéuticas. También se incluyeron resultados de subgrupos post hoc, que informaron los análisis de categorías de la EA leve y moderada a grave. Se han realizado metanálisis de los resultados de considerablemente más estudios de EA que los que se incluyeron en la evaluación de tecnologías de NICE, que tuvo cuatro ensayos de monoterapia y dos ensayos de tratamiento dual (NICE 2011); y, por lo tanto, esta revisión tiene más estadísticas de resumen precisas. En la EA moderada a grave, lo anterior significa que todos los resultados principales de eficacia muestran beneficios pequeños que son estadísticamente significativos, a diferencia de los resultados en gran parte no significativos de TA 217 ‐ que se equipararon con ningún efecto (ver Por qué es importante realizar esta revisión).
Los análisis de esta revisión demostraron que el efecto beneficioso obtenido de la monoterapia versus placebo en la EA moderada a grave es muy similar al obtenido en los ensayos de tratamiento dual, y la prueba para las diferencias de subgrupos no es significativa. Por lo tanto, en los metanálisis se han incluido todos los ensayos, independientemente de la presencia o la ausencia de ChEI. Esta conclusión acerca de la eficacia del tratamiento dual contrasta con la conclusión de la evaluación NICE, que señaló que hubo una falta de evidencia de eficacia clínica adicional (del tratamiento concurrente con ChEI) en comparación con la monoterapia con memantina (NICE 2011). Desde 2011 se han realizado muchos estudios nuevos de la memantina en la EA, lo que ha dado lugar a revisiones sistemáticas más actualizadas, y NICE ahora ha publicado una actualización de la guía de demencia en junio de 2018 (NICE 2018). Esta bibliografía reciente se analiza a continuación.
En los últimos tres años se han publicado tres revisiones sistemáticas en la EA, dos de monoterapia con memantina (Chen 2017; Matsunaga 2015), y una de tratamiento dual (Matsunaga 2015b). Estas revisiones tuvieron conclusiones similares a las de la presente revisión en la mayoría de los resultados, aunque los autores incluyeron estudios que informaron sobre participantes con EA leve y estudios que no tenían un comparador placebo, y también utilizaron los enfoques LOCF para los datos faltantes. Una revisión sistemática adicional incluyó tres estudios de tratamiento dual e indicó beneficios significativos cuando el análisis se limitó a la EA moderada a grave (Muayqil 2012). También se identificó una revisión reciente de estudios predominantemente chinos, que comparó el tratamiento concurrente con donepezilo; sin embargo, la mayoría de los estudios no incluyeron un placebo (Chen 2017). Es de señalar que la FDA concedió una licencia para el tratamiento combinado en pacientes estabilizados con 10 mg de donepezilo una vez al día en diciembre de 2014 y en 2015 se lanzó un producto farmacéutico combinado.
El efecto de la gravedad también se identificó en otras dos revisiones sistemáticas (Di Santo 2013; Kishi 2017): una de estas mostró una mayor eficacia al aumentar la gravedad, al igual que esta revisión, pero solo incluyó seis ensayos (Di Santo 2013). La otra revisión de 30 estudios de EA (que incluyó estudios sin un comparador placebo) estableció conclusiones similares a las de la presente revisión con respecto a la gravedad, pero no investigó el efecto de la memantina en la EA leve (Kishi 2017).
La guía de demencia NICE se actualizó concurrentemente con la actualización de esta revisión Cochrane (NICE 2018); esta revisión ha compartido los datos con los elaboradores de la guía, y el Grupo Cochrane de Demencia y Trastornos Cognitivos es una parte registrada interesada en esta guía. La guía es una actualización importante de la guía original y actualiza algunos aspectos de TA 217. La guía conservó la estratificación original de TA para los análisis de la monoterapia y el tratamiento dual y actualizó los análisis del tratamiento dual al incluir estudios adicionales; sin embargo, los análisis de la monoterapia no se han actualizado (NICE 2018). La actualización ha revisado las recomendaciones para los "pacientes que ya reciben un ChEI", en los cuales ahora los médicos deberían considerar la posibilidad de agregar la memantina al ChEI en el caso de los pacientes con enfermedad moderada, así como ofrecer memantina además del ChEI a los pacientes con enfermedad grave (NICE 2018). La evidencia en esta revisión Cochrane apoya (y de hecho ha informado) las recomendaciones de ofrecer tratamiento dual, pero se considera que las recomendaciones de la monoterapias también se deberían haber examinado, en especial porque hay muchos estudios nuevos y actualmente la memantina es genérica. También preocupa que la combinación de las viejas y nuevas recomendaciones en la nueva guía pueda dar lugar a confusión en los médicos. Por ejemplo, en la enfermedad grave, la recomendación no modificada para la monoterapia es ofrecer memantina (y no ChEI); no obstante, la recomendación nueva en el tratamiento dual es para el caso de los pacientes que "ya reciben un ChEI". Además, la guía 2018 no es explícita en si el tratamiento combinado se debe ofrecer como tratamiento de primera línea en los pacientes que se presentan con enfermedad moderada o grave.
Una revisión sistemática de guías clínicas informó las recomendaciones de 12 guías de calidad moderada a alta (Ngo 2015). Los autores señalaron que había desacuerdo entre dos guías en cuanto al beneficio de la memantina en la EA leve, pero había acuerdo en cuanto a su uso en la demencia moderada a grave. También señalaron las recomendaciones contradictorias entre cuatro guías con respecto al apoyo al tratamiento con ChEI combinado con memantina en la demencia moderada a grave.
El Ministro para la Salud de Francia suprimió de manera reciente la memantina y los ChEI, el donepezilo, la galantamina y la rivastigmina (HAS 2018), y señaló que "es mejor concentrarse en ayudar a organizar las actividades cotidianas y mantener la actividad, así como en el apoyo y la ayuda de los que te rodean", Esta supresión se basó en el trabajo realizado por la Haute Autorité de Santé (HAS), que señaló en 2016 después de revisar la evidencia, "Los nuevos datos confirman que la eficacia de los fármacos para el tratamiento sintomático de la enfermedad de Alzheimer es, en el mejor de los casos, moderada. Esta eficacia se establece solo a corto plazo, principalmente sobre los trastornos cognitivos, en estudios clínicos controlados con placebo cuya relevancia clínica y aplicabilidad a la vida real no son seguras. Los pacientes de estos estudios son de hecho son más jóvenes que los tratados en la práctica real y, a diferencia de estos, no tienen comorbilidades ni riesgos de interacciones medicamentosas. Además, todavía no se han establecido los efectos sobre los trastornos de conducta, la calidad de vida, el tiempo hasta ingresar en una institución, la mortalidad, la carga de morbilidad para los cuidadores... Sin embargo, los datos acumulados desde la comercialización de los fármacos confirman el riesgo de aparición de efectos secundarios indeseables (digestivos, cardiovasculares o trastornos neuropsiquiátricos, como los más notables) potencialmente graves, que pueden alterar la calidad de vida" (HAS 2016, traducción). La declaración de 2018 fue menos mesurada, y señaló que "Ninguno de los fármacos disponibles ha mostrado desacelerar la progresión hacia la dependencia; no obstante, todos conllevan un riesgo de efectos adversos potencialmente mortales e interacciones medicamentosas graves" (Prescrire 2018) (ver Por qué es importante realizar esta revisión).
HAS basó sus conclusiones de la eficacia de la memantina en la revisión Matsunaga 2015 de la monoterapia y en una revisión anterior escrita por uno de los revisores de la presente revisión para el tratamiento dual (Farrimond 2012), que coinciden plenamente con las conclusiones de esta revisión de memantina, pero ambas revisiones difieren con respecto a las actividades cotidianas (HAS Annexe 2016). HAS consideró que los beneficios "no eran clínicamente relevantes" y señaló que no hay diferencias en las actividades cotidianas con el tratamiento dual. Estas conclusiones no están apoyadas por la revisión actual de memantina ni por la revisión y el análisis de coste‐efectividad de la guía NICE (NICE 2018). Se considera que los beneficios graduales pequeños de los ChEI y la memantina en todos los resultados a los seis meses de seguimiento, cada uno con un tamaño del efecto que puede ser menor que la diferencia mínima clínicamente importante, no significan falta de relevancia clínica. Como se señala anteriormente, se coincide en que los participantes reclutados en los ensayos farmacológicos no suelen ser representativos de las poblaciones clínicas típicas.
Segundo, las autoridades francesas examinaron detalladamente los datos de los efectos adversos de los ChEI y la memantina mediante los metanálisis de los ensayos clínicos, el resumen de las características de los productos (RCP) y (para los EA poco frecuentes) los estudios observacionales y los análisis de las bases de datos de farmacovigilancia (HAS Annexe 2016). La HAS informó que en los ensayos clínicos controlados con placebo más pacientes interrumpieron la administración del donepezilo 10 mg que de placebo debido a los efectos adversos, pero la HAS no informó este hallazgo para otros ChEI ni para la memantina. Sin embargo, en la revisión actual de memantina se ha observado una diferencia de subgrupos significativa en este resultado entre los pacientes con enfermedad leve (mayor interrupción de la memantina) y con enfermedad moderada a grave (sin diferencia en comparación con placebo) (vea la sección A anteriormente). El informe de la HAS incluyó algunos estudios observacionales, uno de los cuales comparó memantina y tres ChEI (pero no tuvo datos sobre los pacientes sin tratar) (Fosbøl 2012). Este estudio muy grande realizado en los EE.UU. y Dinamarca informó un riesgo mayor para la cohorte danesa (en los análisis ajustados) de infarto de miocardio y muerte cardíaca con la memantina (en comparación con donepezilo) y un riesgo más pequeño de síncope y bloqueo atrioventricular, pero no hubo diferencias en la cohorte de EE.UU. en cuanto a la hospitalización por eventos cardíacos. En ambas cohortes la mortalidad por todas las causas fue mayor en los pacientes que recibían memantina. Los autores concluyeron que el mayor riesgo de eventos cardiovasculares en la cohorte danesa en usuarios de memantina y tratamiento dual probablemente está relacionado con la selección de los participantes más enfermos, porque en Dinamarca estos tratamientos se reservan para los individuos con demencia más grave. También observaron la falta de datos comparativos (con placebo / ningún tratamiento) y señalaron que "ningún estudio clínico ha encontrado signos cardiovasculares de interés clínico" (Fosbøl 2012). HAS también proporciona datos de farmacovigilancia (como informes de casos) e indica los cambios hechos a los RCP de los distintos fármacos: los datos sobre donepezilo versus placebo fueron inconsistentes para la mortalidad en pacientes con demencia vascular; puede haber un mayor riesgo de prolongación del intervalo QT con la galantamina y puede haber un mayor riesgo de infarto de miocardio, accidente cerebrovascular y taquicardia ventricular polimórfica tipo torsade de pointes con la rivastigmina. Un estudio muy grande de farmacovigilancia de la base de datos de la OMS, VigiBase, de más de 58 países, investigó todos los ChEI y observó que con frecuencia se informaron eventos cardiovasculares graves, por lo que indicó que es probable que con anterioridad se haya subestimado su importancia y recomendó tener cuidado al prescribir estos fármacos, en especial porque los pacientes con enfermedad de Alzheimer con frecuencia son frágiles y reciben otros fármacos (Krӧger 2015). La HAS tiene poco que decir acerca de la farmacovigilancia de la memantina, excepto que la hepatitis se agregó al RCP, pero coincide con la presente revisión sobre los resultados de los efectos adversos de los ensayos clínicos. En vez de tratar la memantina por separado de los ChEI, la HAS hizo declaraciones sobre la seguridad aplicada a los fármacos para la demencia en general (HAS Annexe 2016). Al final se considera que no hay evidencia suficiente para apoyar una declaración sólida sobre los eventos adversos (HAS 2016) ni para pensar que la memantina, que tiene una forma de acción diferente de los ChEI, se debe considerar por separado.
La HAS recomienda la atención y el apoyo a los individuos en lugar de las farmacoterapias, en vez de incluir las farmacoterapias como parte de un paquete general de atención. No parece haber examinado la evidencia sobre este tema.
En general, se considera que la evidencia obtenida a partir de esta revisión y de la revisión de los datos franceses sobre los efectos adversos hace surgir interrogantes acerca de lo apropiado de la política de supresión tomada por el gobierno francés. Ya se señaló en esta revisión que la supresión significa que el sistema de seguro de salud nacional ya no reembolsa el costo de los fármacos (Prescrire 2018), pero que los fármacos se pueden prescribir según el resumen de las características del producto (HAS 2018). Esto puede ser confuso para los médicos y dar lugar a desigualdades en el sistema de asistencia sanitaria.
La revisión de la evidencia del efecto de la memantina en los pacientes con EA moderada a grave seleccionados por la agitación indicó que la memantina puede no ser efectiva en esta población, pero la evidencia es de certeza baja o muy baja. Los resultados de esta revisión contrastan con dos análisis post hoc (Gaultier 2005; Wilcock Post‐Hoc 3RCTs 2008); este último analizó los datos de pacientes individuales (DPI) de tres ensayos controlados aleatorios (ECA) en esta revisión (Reisberg 2003 [9605]; Tariot 2004 (MD‐02); van Dyck 2007 (MD‐01)); y seleccionó solo los datos de una "población conductualmente perturbada", definida como una puntuación 0 en cualquiera de los tres síntomas del NPI de agitación–agresión, delirio y alucinaciones al inicio. Los datos se integraron en una base de datos única y luego se analizaron; no se informó el metanálisis y se dijo que los datos se habían "agrupado", lo que indica que la asignación al azar no se mantuvo. El estudio encontró un beneficio significativo de la memantina en cada uno de los resultados de eficacia a los seis meses, pero la confiabilidad no está clara. Una segunda revisión (Gaultier 2005); informó por separado los datos de dos ECA de la presente revisión (Reisberg 2003 [9605]; Tariot 2004 [MD‐02]), y, de uno de los estudios con monoterapia con memantina (Reisberg 2003 [9605]) proporcionó resultados de subgrupos post hoc de participantes con agitación y sin agitación al inicio. Del otro estudio (que tuvo tratamiento dual) no se presentaron resultados. La revisión señaló que en los pacientes con agitación al inicio (definida de manera similar que en Wilcock Post‐Hoc 3 ECA 2008 y que incluyó alrededor del 60% de la población), hubo una mejoría significativa en los síntomas de agitación con la memantina en comparación con placebo que no coincide con los resultados de la presente revisión, pero es de señalar que este es un resultado diferentes al de la presente revisión (mejoría versus empeoramiento de los síntomas). En los pacientes sin agitación al inicio se señaló que hubo significativamente menos síntomas de agitación nuevos con la memantina. En general puede haber algunas diferencias con los resultados anteriores, pero toda la evidencia de la eficacia es de certeza baja o muy baja y se necesitan estudios de investigación adicionales de los tratamientos alternativos en este grupo importante de pacientes.
Finalmente, se observaron algunas diferencias entre esta revisión Cochrane y la guía NICE 2018 en los tipos de demencia diferentes de la EA (NICE 2018). En los pacientes con demencia vascular, la guía NICE recomienda que los ChEI o la memantina se deben considerar solo si presentan EA o DEP/DCL concomitantes. Sin embargo, esta revisión Cochrane ha identificado beneficios clínicos pequeños en la funcionalidad cognitiva y en el comportamiento y el estado de ánimo en pacientes diagnosticados con demencia vascular, y hay un análisis post hoc que indica que puede haber mayores beneficios en los pacientes con enfermedad más grave. En los pacientes con DFT, la guía recomienda que los ChEI y la memantina no se deben ofrecer (una recomendación fuerte), y señala que por lo general no hay un déficit colinérgico en los pacientes con DFT, que no hay evidencia de beneficio y también cita la posibilidad de efectos adversos, aunque no observa diferencias entre memantina y placebo. Puede ser que la guía haya combinado los resultados de los ChEI con los de la memantina, y en esta revisión se observó que la memantina tiene un mecanismo de acción no colinérgico y es posible que sea beneficiosa, aunque a partir de evidencia de certeza baja o muy baja. En los pacientes con DEP o DCL, la guía examinó la evidencia para DEP y DCL por separado y pareció establecer las conclusiones sobre la base de una falta de significación estadística. La guía recomendó que la memantina se debe considerar solo si los ChEI no se toleran o están contraindicados, lo que, aunque es consistente con los resultados de la presente revisión de evidencia de certeza baja o muy baja en este grupo de pacientes, tiene una fuerza que va más allá de la evidencia.

Study flow diagram of studies identified

'Risk of bias' summary: review authors' judgements about each risk of bias item for each included study.

'Risk of bia's graph: review authors' judgements about each risk of bias item presented as percentages across all included studies.

Funnel plot of comparison: 1 Memantine 20 mg or equivalent vs placebo for moderate‐to‐severe Alzheimer's disease. 24‐30 week data. OC, outcome: 1.1 Clinical Global.

Funnel plot of comparison: 1 Memantine 20 mg or equivalent vs placebo for moderate‐to‐severe Alzheimer's disease. 24‐30 week data. OC, outcome: 1.2 Cognitive Function.

Funnel plot of comparison: 1 Memantine 20 mg or equivalent vs placebo for moderate‐to‐severe Alzheimer's disease. 24‐30 week data. OC, outcome: 1.3 Decline in ADL.

Funnel plot of comparison: 1 Memantine 20 mg or equivalent vs placebo for moderate‐to‐severe Alzheimer's disease. 24‐30 week data. OC, outcome: 1.4 Behaviour and Mood.
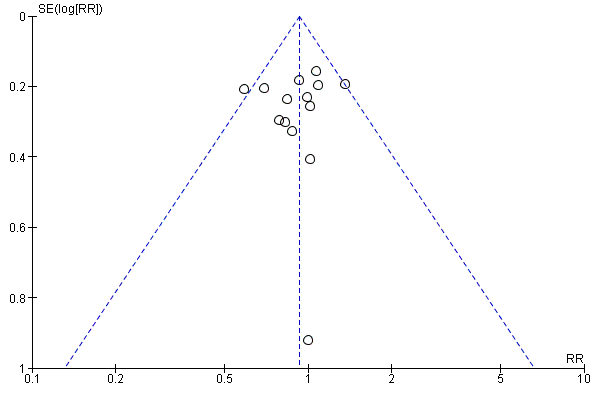
Funnel plot of comparison: 1 Memantine 20 mg or equivalent vs placebo for moderate‐to‐severe Alzheimer's disease. 24‐30 week data. OC, outcome: 1.5 All‐cause discontinuation.

Funnel plot of comparison: 12 Adverse reactions ‐ Memantine vs placebo for mild to severe dementia. All diagnoses, all durations, outcome: 12.3 Number suffering at least one adverse event.
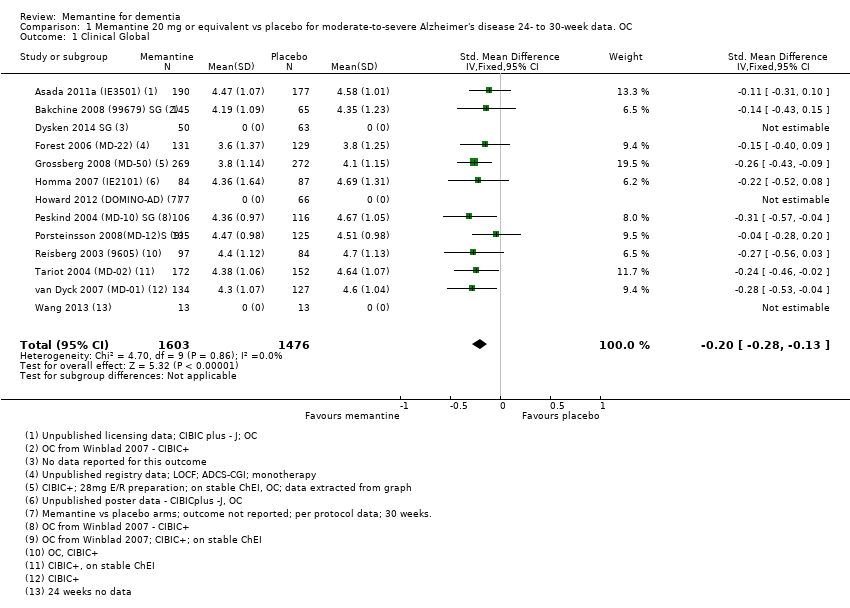
Comparison 1 Memantine 20 mg or equivalent vs placebo for moderate‐to‐severe Alzheimer's disease 24‐ to 30‐week data. OC, Outcome 1 Clinical Global.

Comparison 1 Memantine 20 mg or equivalent vs placebo for moderate‐to‐severe Alzheimer's disease 24‐ to 30‐week data. OC, Outcome 2 Cognitive Function.

Comparison 1 Memantine 20 mg or equivalent vs placebo for moderate‐to‐severe Alzheimer's disease 24‐ to 30‐week data. OC, Outcome 3 Decline in ADL.

Comparison 1 Memantine 20 mg or equivalent vs placebo for moderate‐to‐severe Alzheimer's disease 24‐ to 30‐week data. OC, Outcome 4 Behaviour and Mood.

Comparison 1 Memantine 20 mg or equivalent vs placebo for moderate‐to‐severe Alzheimer's disease 24‐ to 30‐week data. OC, Outcome 5 All‐cause discontinuation.
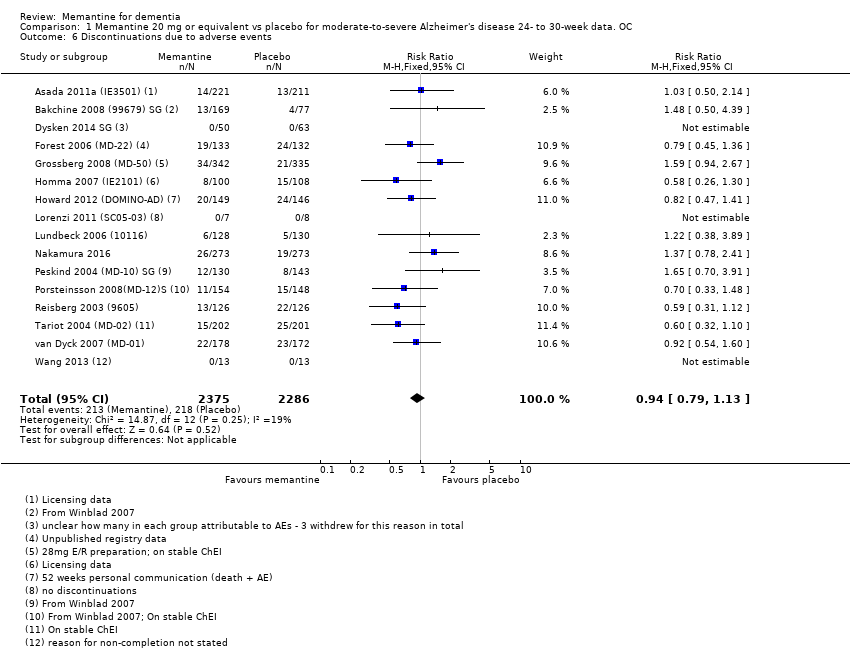
Comparison 1 Memantine 20 mg or equivalent vs placebo for moderate‐to‐severe Alzheimer's disease 24‐ to 30‐week data. OC, Outcome 6 Discontinuations due to adverse events.

Comparison 1 Memantine 20 mg or equivalent vs placebo for moderate‐to‐severe Alzheimer's disease 24‐ to 30‐week data. OC, Outcome 7 Number suffering at least one adverse event.
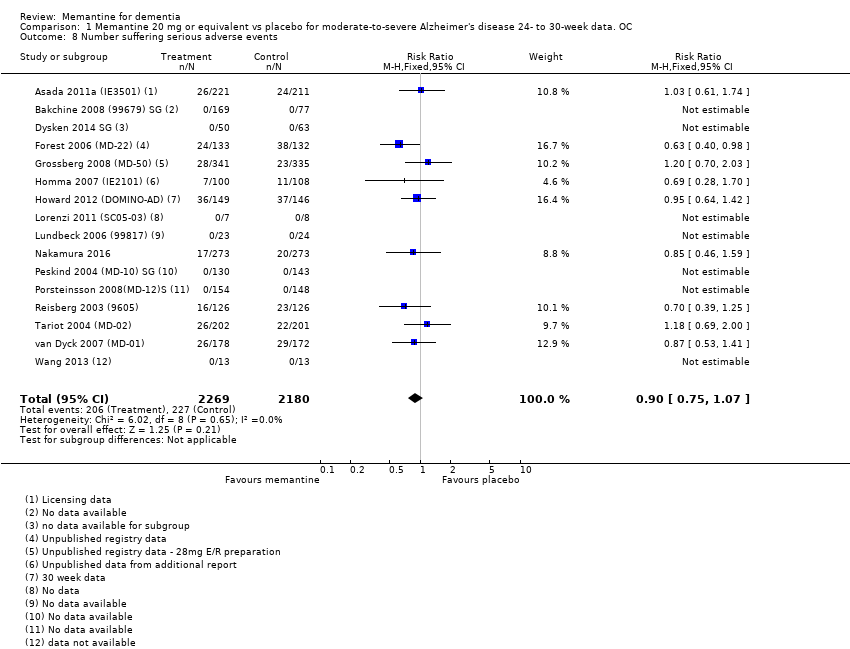
Comparison 1 Memantine 20 mg or equivalent vs placebo for moderate‐to‐severe Alzheimer's disease 24‐ to 30‐week data. OC, Outcome 8 Number suffering serious adverse events.

Comparison 1 Memantine 20 mg or equivalent vs placebo for moderate‐to‐severe Alzheimer's disease 24‐ to 30‐week data. OC, Outcome 9 Number suffering agitation as an adverse event.

Comparison 2 Memantine 20 mg or equivalent vs placebo in patients taking versus not taking cholinesterase inhibitors with moderate to severe Alzheimer's disease 24‐ to 30‐week data, Outcome 1 Clinical Global: subgroup analysis by +/‐ ChEI.

Comparison 2 Memantine 20 mg or equivalent vs placebo in patients taking versus not taking cholinesterase inhibitors with moderate to severe Alzheimer's disease 24‐ to 30‐week data, Outcome 2 Cognitive Function subgroup analysis by +/‐ ChEI.

Comparison 2 Memantine 20 mg or equivalent vs placebo in patients taking versus not taking cholinesterase inhibitors with moderate to severe Alzheimer's disease 24‐ to 30‐week data, Outcome 3 Decline in ADL: subgroup analysis by +/‐ ChEI.

Comparison 2 Memantine 20 mg or equivalent vs placebo in patients taking versus not taking cholinesterase inhibitors with moderate to severe Alzheimer's disease 24‐ to 30‐week data, Outcome 4 Behaviour and Mood: subgroup analysis by +/‐ ChEI.

Comparison 2 Memantine 20 mg or equivalent vs placebo in patients taking versus not taking cholinesterase inhibitors with moderate to severe Alzheimer's disease 24‐ to 30‐week data, Outcome 5 Cognitive function (sMMSE):subgroup analysis within randomised study ‐ per protocol.

Comparison 2 Memantine 20 mg or equivalent vs placebo in patients taking versus not taking cholinesterase inhibitors with moderate to severe Alzheimer's disease 24‐ to 30‐week data, Outcome 6 Decline in ADL (BADL): subgroup analysis within randomised study ‐ per protocol.

Comparison 2 Memantine 20 mg or equivalent vs placebo in patients taking versus not taking cholinesterase inhibitors with moderate to severe Alzheimer's disease 24‐ to 30‐week data, Outcome 7 NPI: subgroup analysis within randomised study ‐ per protocol.

Comparison 2 Memantine 20 mg or equivalent vs placebo in patients taking versus not taking cholinesterase inhibitors with moderate to severe Alzheimer's disease 24‐ to 30‐week data, Outcome 8 Clinical Global: CIBIC+ mean difference; ChEI subgroup.
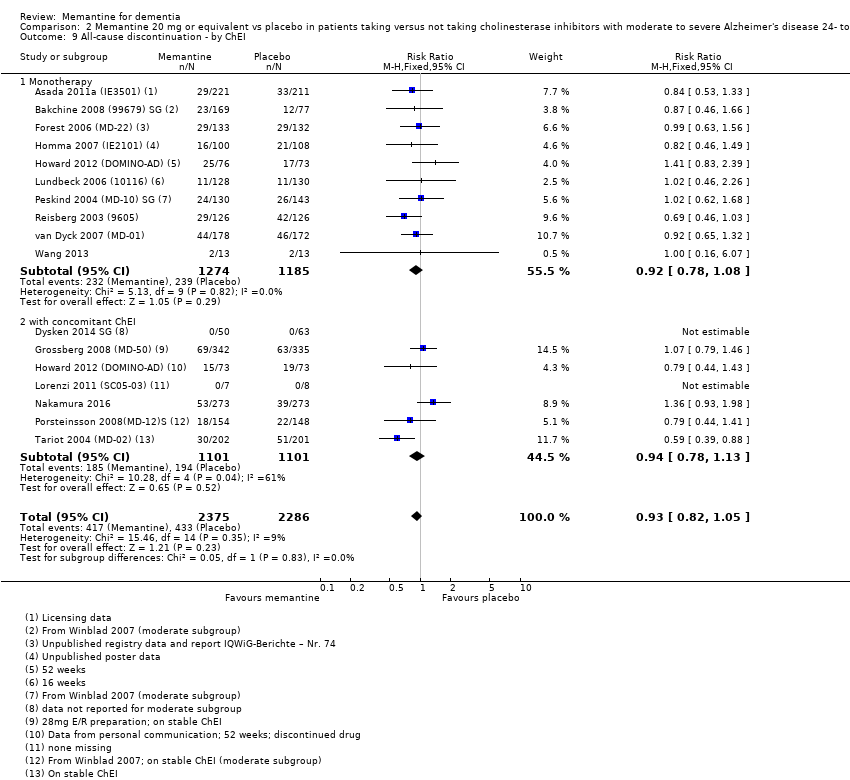
Comparison 2 Memantine 20 mg or equivalent vs placebo in patients taking versus not taking cholinesterase inhibitors with moderate to severe Alzheimer's disease 24‐ to 30‐week data, Outcome 9 All‐cause discontinuation ‐ by ChEI.

Comparison 2 Memantine 20 mg or equivalent vs placebo in patients taking versus not taking cholinesterase inhibitors with moderate to severe Alzheimer's disease 24‐ to 30‐week data, Outcome 10 Discontinuations due to adverse events ‐ by ChEI.
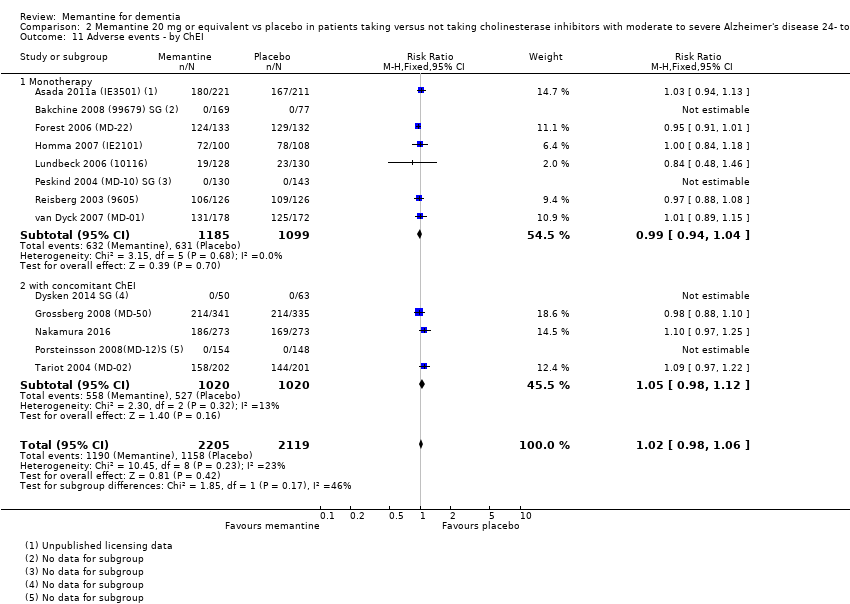
Comparison 2 Memantine 20 mg or equivalent vs placebo in patients taking versus not taking cholinesterase inhibitors with moderate to severe Alzheimer's disease 24‐ to 30‐week data, Outcome 11 Adverse events ‐ by ChEI.

Comparison 2 Memantine 20 mg or equivalent vs placebo in patients taking versus not taking cholinesterase inhibitors with moderate to severe Alzheimer's disease 24‐ to 30‐week data, Outcome 12 Serious adverse events ‐ by ChEI.

Comparison 2 Memantine 20 mg or equivalent vs placebo in patients taking versus not taking cholinesterase inhibitors with moderate to severe Alzheimer's disease 24‐ to 30‐week data, Outcome 13 Number suffering agitation as an adverse event ‐ by ChEI.

Comparison 2 Memantine 20 mg or equivalent vs placebo in patients taking versus not taking cholinesterase inhibitors with moderate to severe Alzheimer's disease 24‐ to 30‐week data, Outcome 14 Memantine + donepezil vs memantine + placebo.
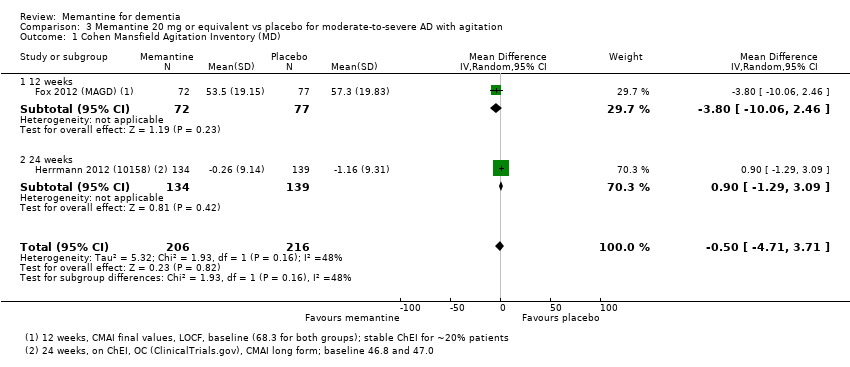
Comparison 3 Memantine 20 mg or equivalent vs placebo for moderate‐to‐severe AD with agitation, Outcome 1 Cohen Mansfield Agitation Inventory (MD).

Comparison 3 Memantine 20 mg or equivalent vs placebo for moderate‐to‐severe AD with agitation, Outcome 2 Cohen Mansfield Agitation Inventory (SMD).

Comparison 3 Memantine 20 mg or equivalent vs placebo for moderate‐to‐severe AD with agitation, Outcome 3 NPI agitation subscale.
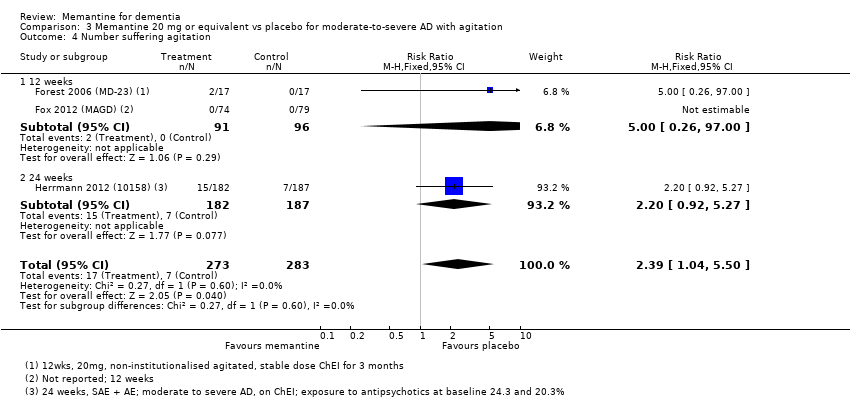
Comparison 3 Memantine 20 mg or equivalent vs placebo for moderate‐to‐severe AD with agitation, Outcome 4 Number suffering agitation.
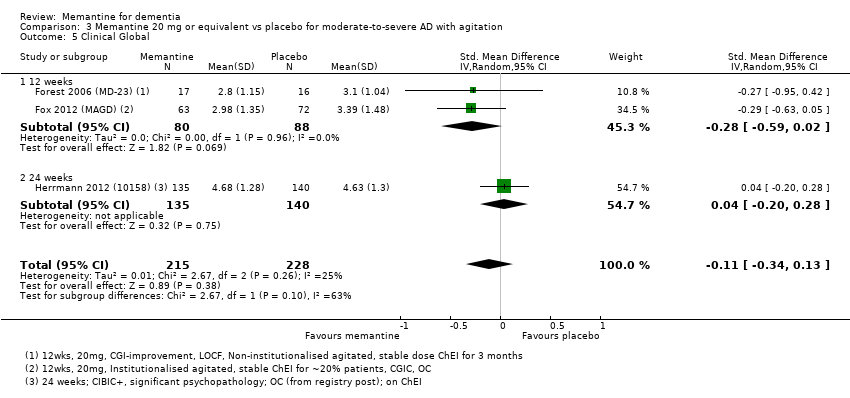
Comparison 3 Memantine 20 mg or equivalent vs placebo for moderate‐to‐severe AD with agitation, Outcome 5 Clinical Global.
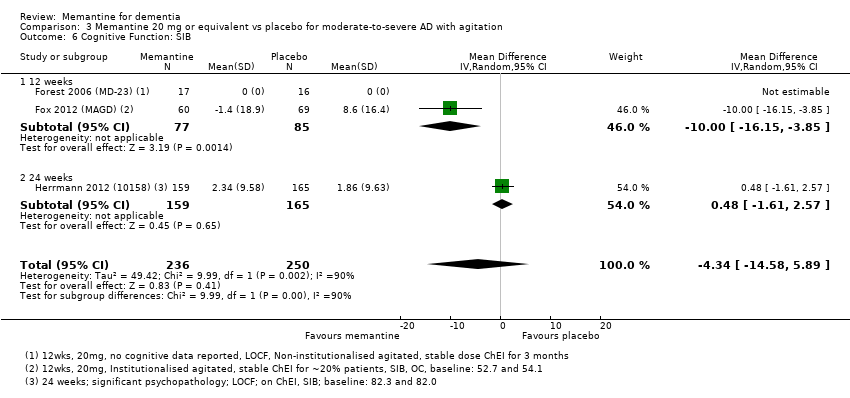
Comparison 3 Memantine 20 mg or equivalent vs placebo for moderate‐to‐severe AD with agitation, Outcome 6 Cognitive Function: SIB.

Comparison 3 Memantine 20 mg or equivalent vs placebo for moderate‐to‐severe AD with agitation, Outcome 7 Decline in ADL: ADCS‐ADL19.

Comparison 3 Memantine 20 mg or equivalent vs placebo for moderate‐to‐severe AD with agitation, Outcome 8 Behaviour and Mood.

Comparison 3 Memantine 20 mg or equivalent vs placebo for moderate‐to‐severe AD with agitation, Outcome 9 All‐cause discontinuation.

Comparison 3 Memantine 20 mg or equivalent vs placebo for moderate‐to‐severe AD with agitation, Outcome 10 Discontinuations due to adverse events.
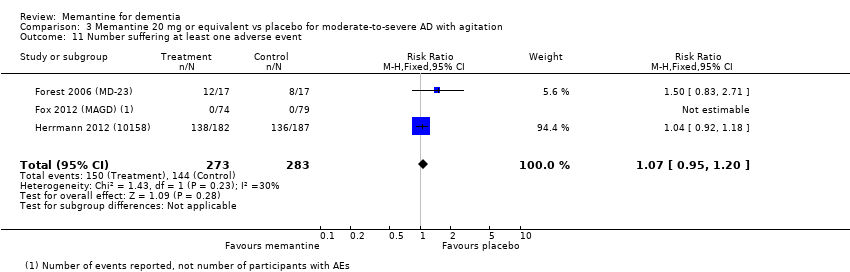
Comparison 3 Memantine 20 mg or equivalent vs placebo for moderate‐to‐severe AD with agitation, Outcome 11 Number suffering at least one adverse event.
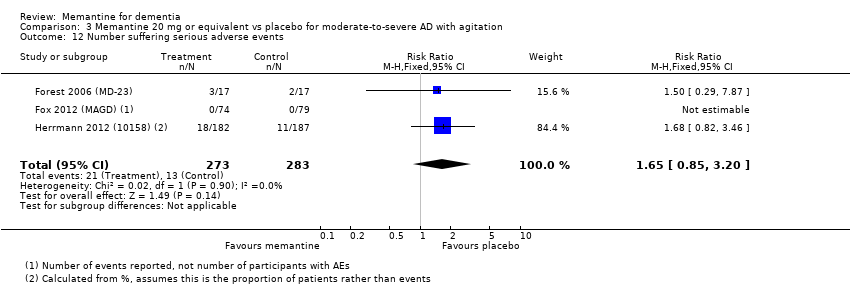
Comparison 3 Memantine 20 mg or equivalent vs placebo for moderate‐to‐severe AD with agitation, Outcome 12 Number suffering serious adverse events.

Comparison 4 Memantine 20 mg vs placebo for mild AD (MMSE 20‐23) OC six‐month studies, Outcome 1 Clinical global: CIBIC+.
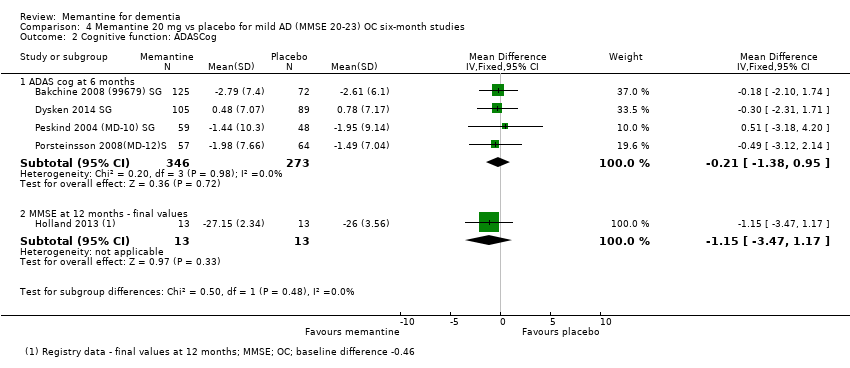
Comparison 4 Memantine 20 mg vs placebo for mild AD (MMSE 20‐23) OC six‐month studies, Outcome 2 Cognitive function: ADASCog.
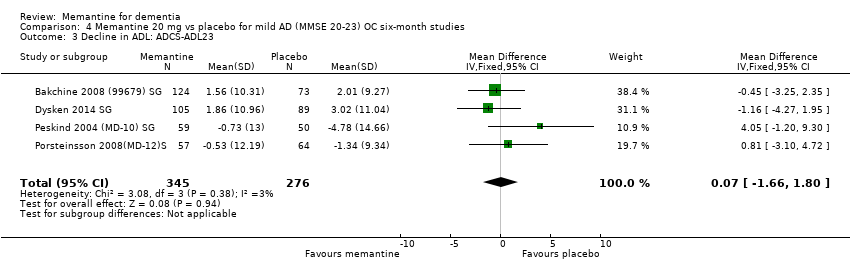
Comparison 4 Memantine 20 mg vs placebo for mild AD (MMSE 20‐23) OC six‐month studies, Outcome 3 Decline in ADL: ADCS‐ADL23.

Comparison 4 Memantine 20 mg vs placebo for mild AD (MMSE 20‐23) OC six‐month studies, Outcome 4 Behaviour and mood: NPI.

Comparison 5 Memantine 20 mg vs placebo for mild‐to‐moderate vascular dementia. Six‐month studies, Outcome 1 Clinical Global: CGI.

Comparison 5 Memantine 20 mg vs placebo for mild‐to‐moderate vascular dementia. Six‐month studies, Outcome 2 Cognitive function: ADAS‐Cog.
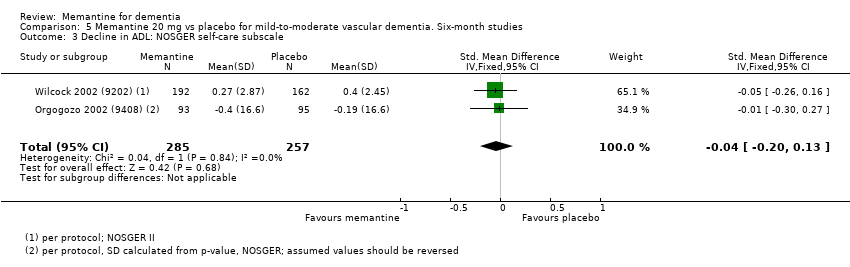
Comparison 5 Memantine 20 mg vs placebo for mild‐to‐moderate vascular dementia. Six‐month studies, Outcome 3 Decline in ADL: NOSGER self‐care subscale.

Comparison 5 Memantine 20 mg vs placebo for mild‐to‐moderate vascular dementia. Six‐month studies, Outcome 4 Behaviour: NOSGER disturbing behaviour subscale.

Comparison 5 Memantine 20 mg vs placebo for mild‐to‐moderate vascular dementia. Six‐month studies, Outcome 5 Cognitive function: ADAS‐Cog: post‐hoc subgroup analysis.
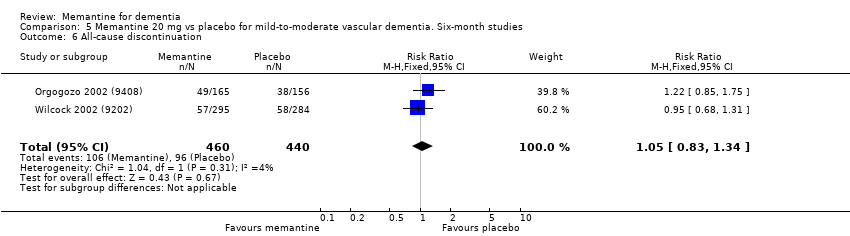
Comparison 5 Memantine 20 mg vs placebo for mild‐to‐moderate vascular dementia. Six‐month studies, Outcome 6 All‐cause discontinuation.

Comparison 5 Memantine 20 mg vs placebo for mild‐to‐moderate vascular dementia. Six‐month studies, Outcome 7 Discontinuation due to adverse events.

Comparison 5 Memantine 20 mg vs placebo for mild‐to‐moderate vascular dementia. Six‐month studies, Outcome 8 Number suffering at least one adverse event.

Comparison 5 Memantine 20 mg vs placebo for mild‐to‐moderate vascular dementia. Six‐month studies, Outcome 9 Number suffering agitation as an adverse event.

Comparison 6 Memantine vs placebo for Parkinson's disease dementia (PDD) and dementia with Lewy bodies (DLB). ITT‐LOCF Data, Outcome 1 Clinical Global (24 weeks).
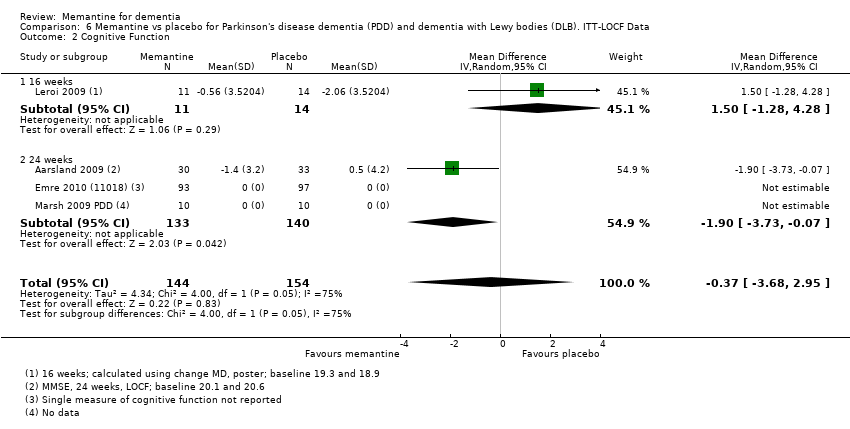
Comparison 6 Memantine vs placebo for Parkinson's disease dementia (PDD) and dementia with Lewy bodies (DLB). ITT‐LOCF Data, Outcome 2 Cognitive Function.

Comparison 6 Memantine vs placebo for Parkinson's disease dementia (PDD) and dementia with Lewy bodies (DLB). ITT‐LOCF Data, Outcome 3 Decline in ADL (24 weeks).

Comparison 6 Memantine vs placebo for Parkinson's disease dementia (PDD) and dementia with Lewy bodies (DLB). ITT‐LOCF Data, Outcome 4 Behaviour and Mood: NPI.

Comparison 6 Memantine vs placebo for Parkinson's disease dementia (PDD) and dementia with Lewy bodies (DLB). ITT‐LOCF Data, Outcome 5 All‐cause discontinuation.

Comparison 6 Memantine vs placebo for Parkinson's disease dementia (PDD) and dementia with Lewy bodies (DLB). ITT‐LOCF Data, Outcome 6 Discontinuation due to adverse events.

Comparison 6 Memantine vs placebo for Parkinson's disease dementia (PDD) and dementia with Lewy bodies (DLB). ITT‐LOCF Data, Outcome 7 Number suffering at least one adverse event.
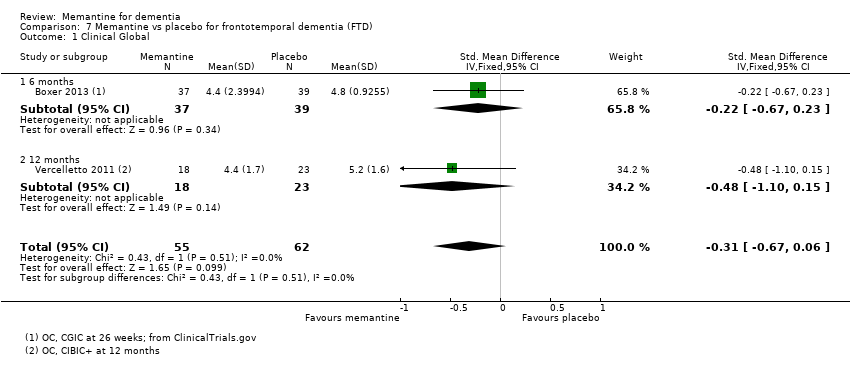
Comparison 7 Memantine vs placebo for frontotemporal dementia (FTD), Outcome 1 Clinical Global.
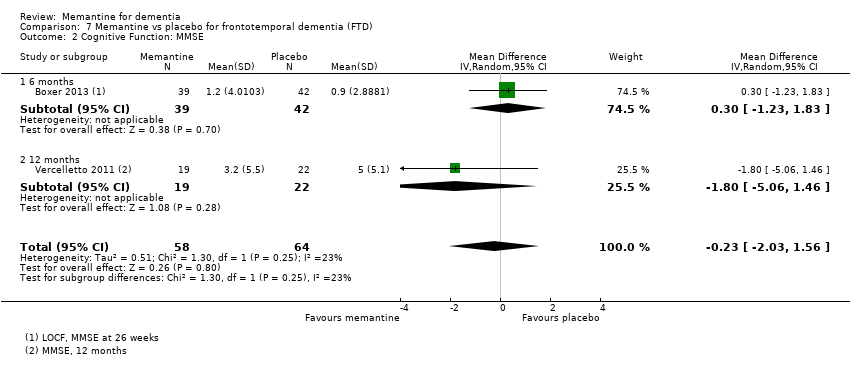
Comparison 7 Memantine vs placebo for frontotemporal dementia (FTD), Outcome 2 Cognitive Function: MMSE.

Comparison 7 Memantine vs placebo for frontotemporal dementia (FTD), Outcome 3 Behaviour and Mood: Neuropsychiatric Inventory (NPI) Total.
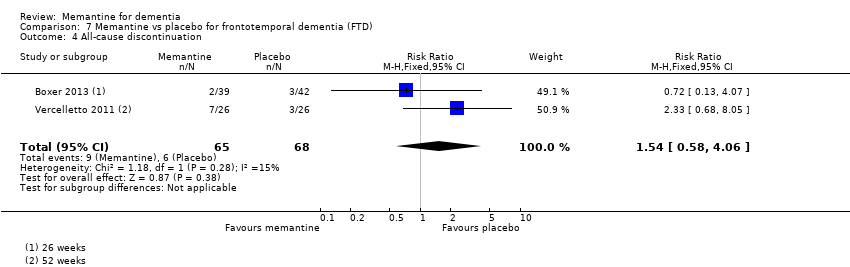
Comparison 7 Memantine vs placebo for frontotemporal dementia (FTD), Outcome 4 All‐cause discontinuation.

Comparison 7 Memantine vs placebo for frontotemporal dementia (FTD), Outcome 5 Discontinuation due to adverse events.
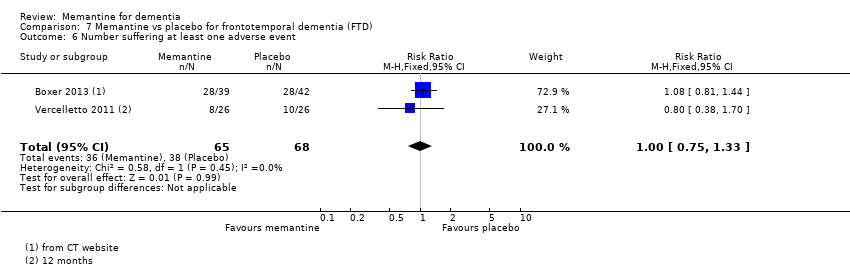
Comparison 7 Memantine vs placebo for frontotemporal dementia (FTD), Outcome 6 Number suffering at least one adverse event.

Comparison 7 Memantine vs placebo for frontotemporal dementia (FTD), Outcome 7 Number suffering at serious adverse events.

Comparison 7 Memantine vs placebo for frontotemporal dementia (FTD), Outcome 8 Number suffering agitation as an adverse event.
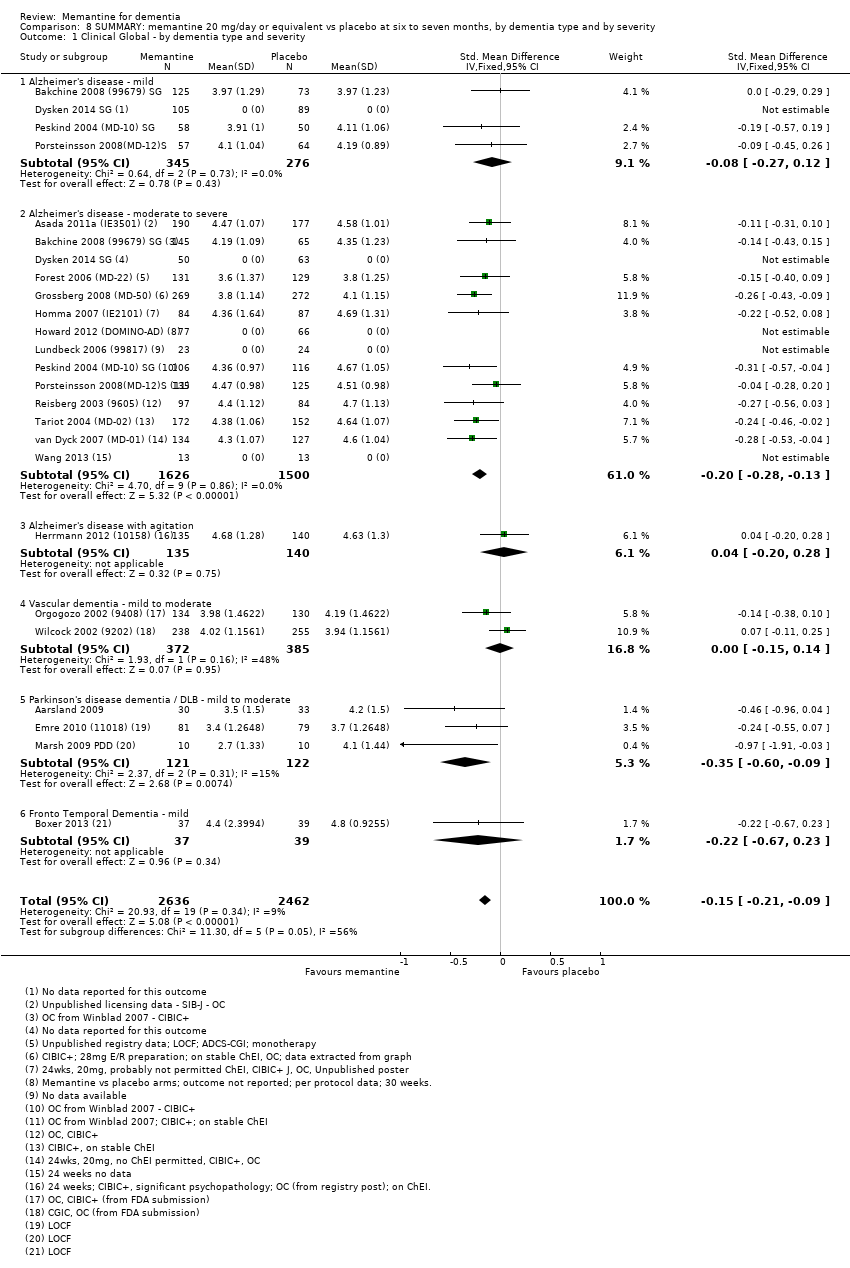
Comparison 8 SUMMARY: memantine 20 mg/day or equivalent vs placebo at six to seven months, by dementia type and by severity, Outcome 1 Clinical Global ‐ by dementia type and severity.

Comparison 8 SUMMARY: memantine 20 mg/day or equivalent vs placebo at six to seven months, by dementia type and by severity, Outcome 2 Cognitive Function ‐ by dementia type and severity.
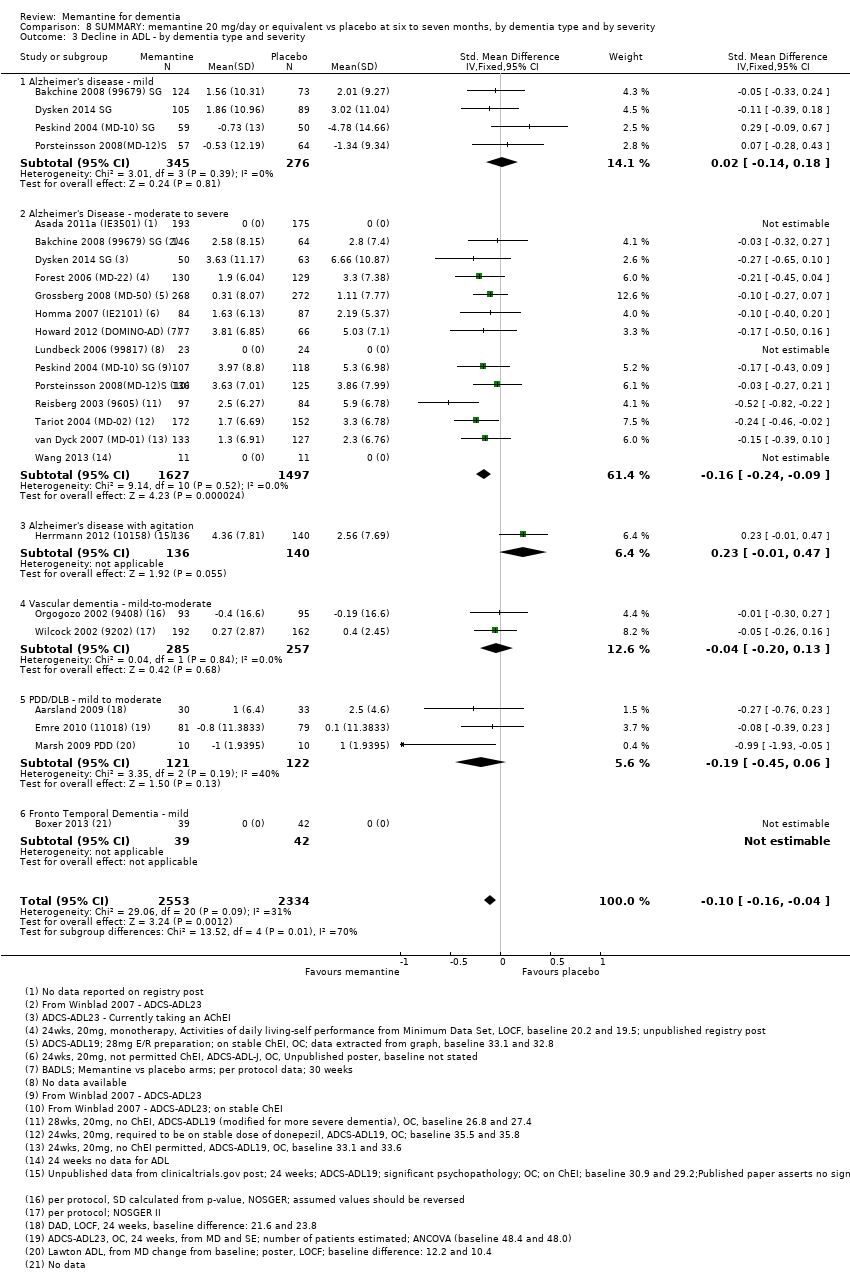
Comparison 8 SUMMARY: memantine 20 mg/day or equivalent vs placebo at six to seven months, by dementia type and by severity, Outcome 3 Decline in ADL ‐ by dementia type and severity.
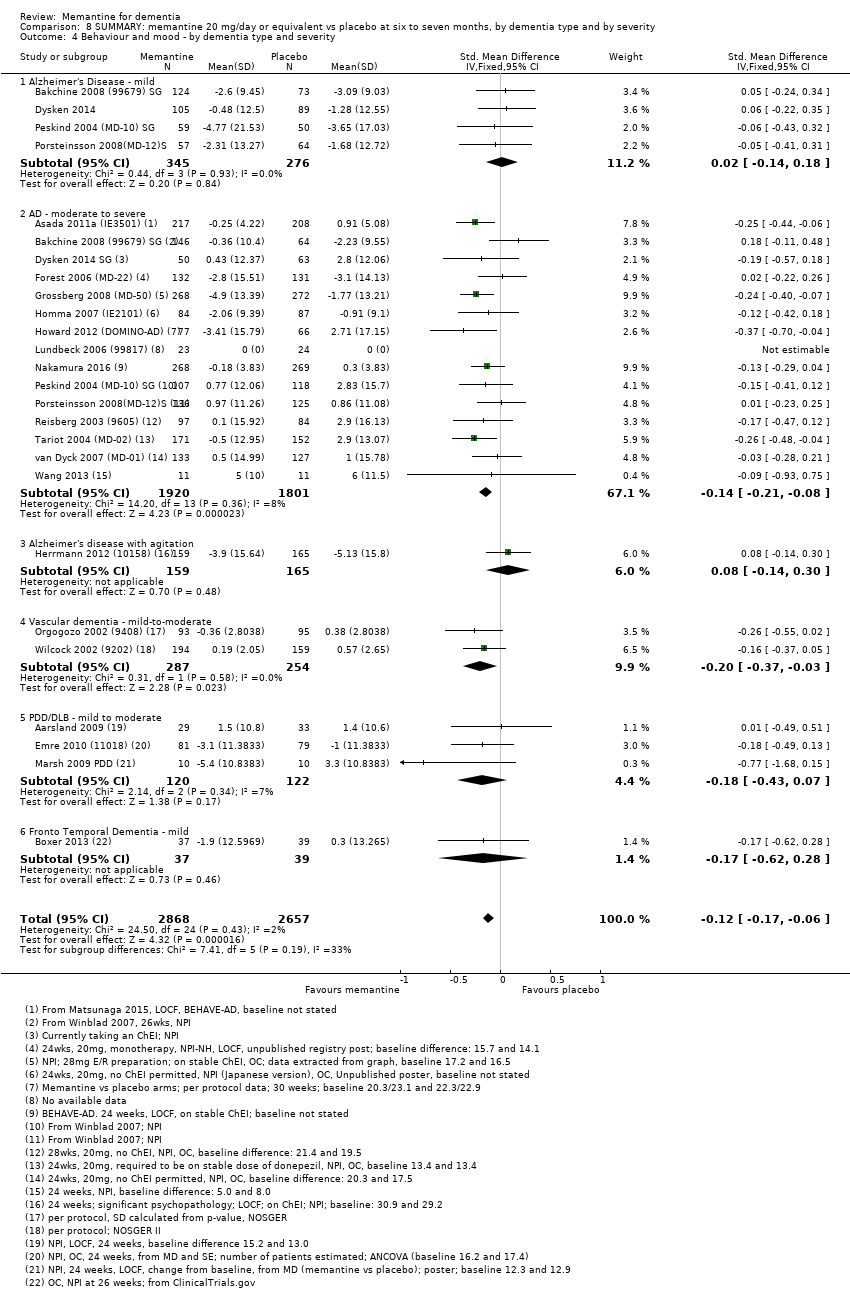
Comparison 8 SUMMARY: memantine 20 mg/day or equivalent vs placebo at six to seven months, by dementia type and by severity, Outcome 4 Behaviour and mood ‐ by dementia type and severity.
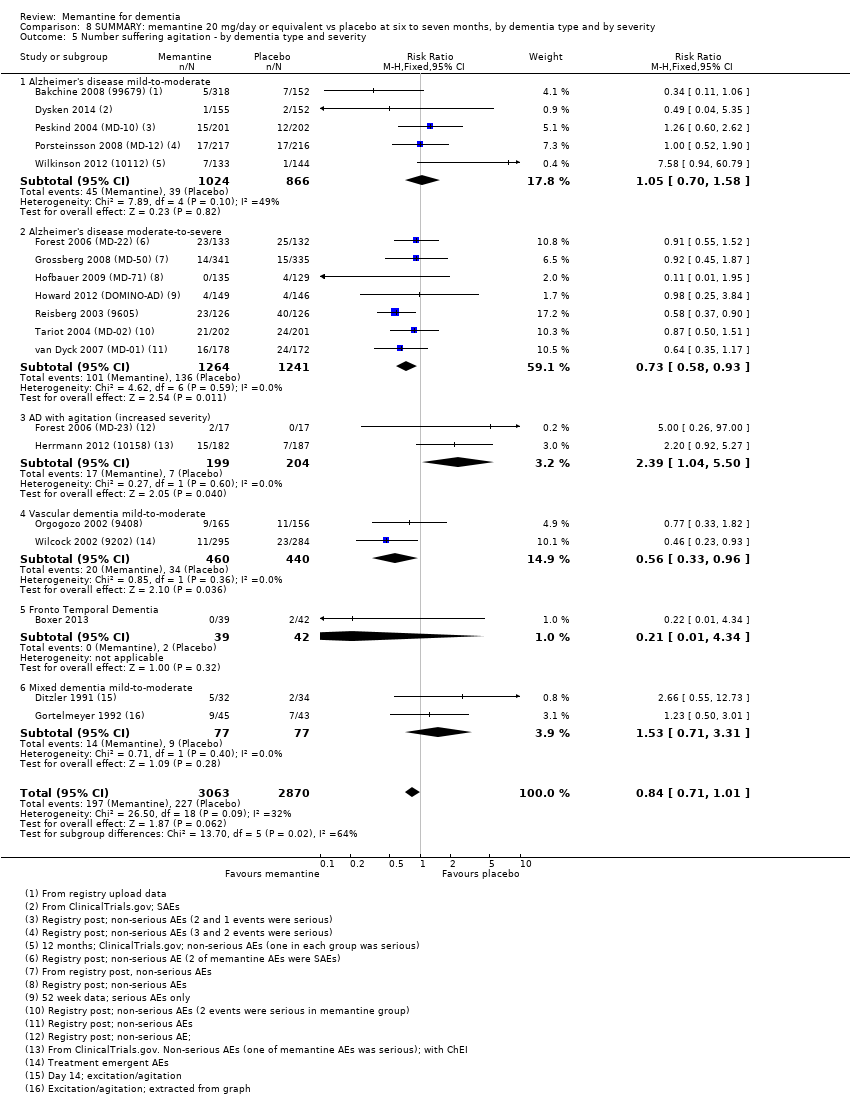
Comparison 8 SUMMARY: memantine 20 mg/day or equivalent vs placebo at six to seven months, by dementia type and by severity, Outcome 5 Number suffering agitation ‐ by dementia type and severity.

Comparison 8 SUMMARY: memantine 20 mg/day or equivalent vs placebo at six to seven months, by dementia type and by severity, Outcome 6 Number suffering agitation ‐ by dementia type and ChEI.
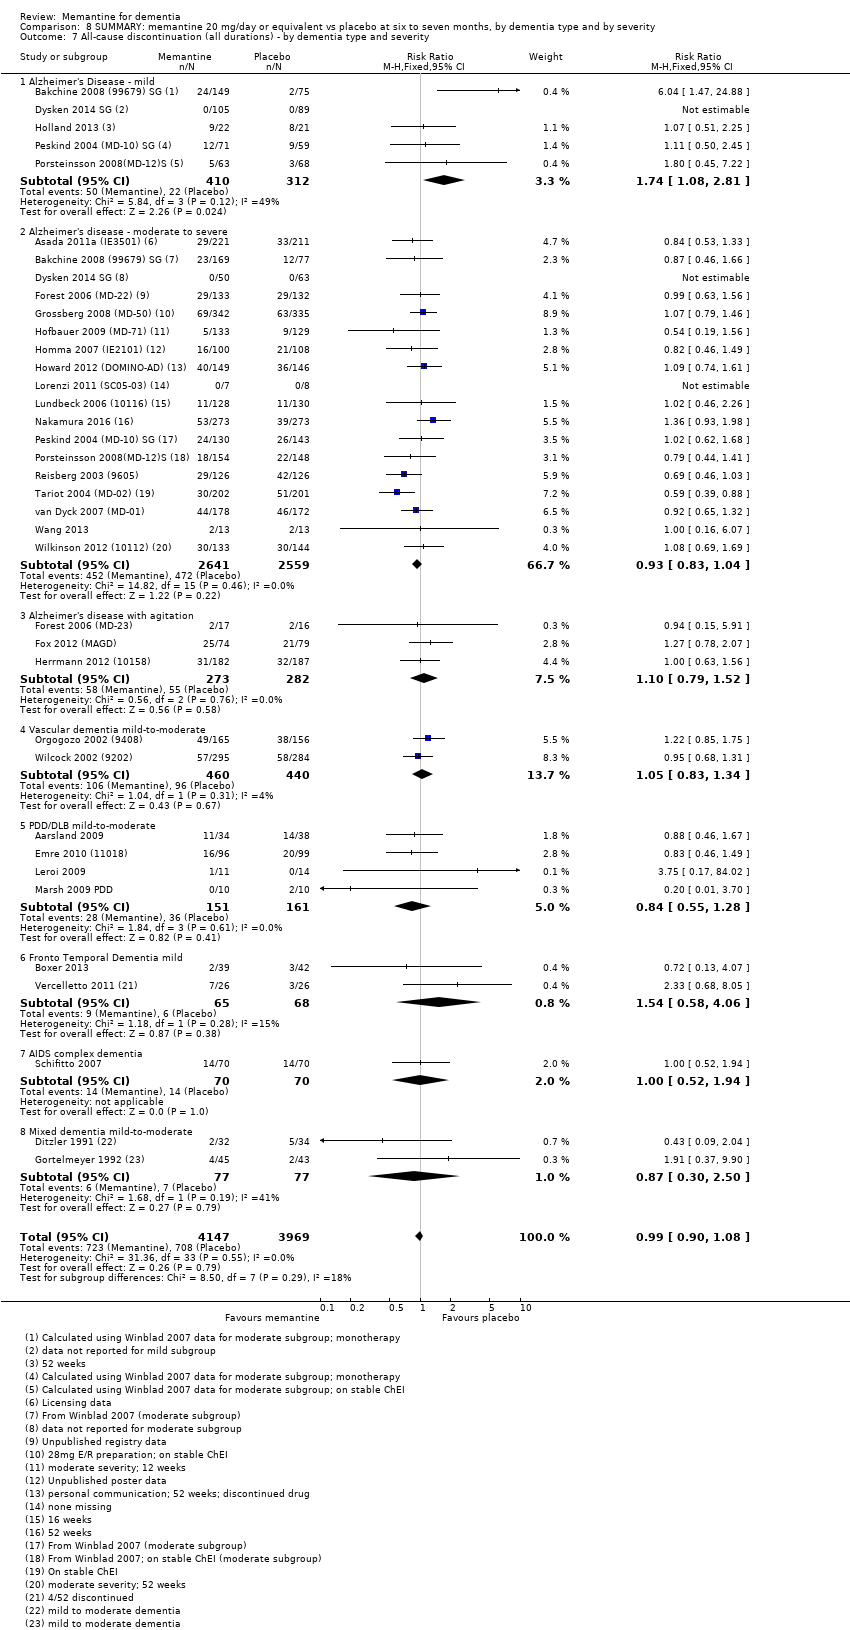
Comparison 8 SUMMARY: memantine 20 mg/day or equivalent vs placebo at six to seven months, by dementia type and by severity, Outcome 7 All‐cause discontinuation (all durations) ‐ by dementia type and severity.

Comparison 8 SUMMARY: memantine 20 mg/day or equivalent vs placebo at six to seven months, by dementia type and by severity, Outcome 8 Discontinuation due to adverse events ‐ by dementia type and severity.
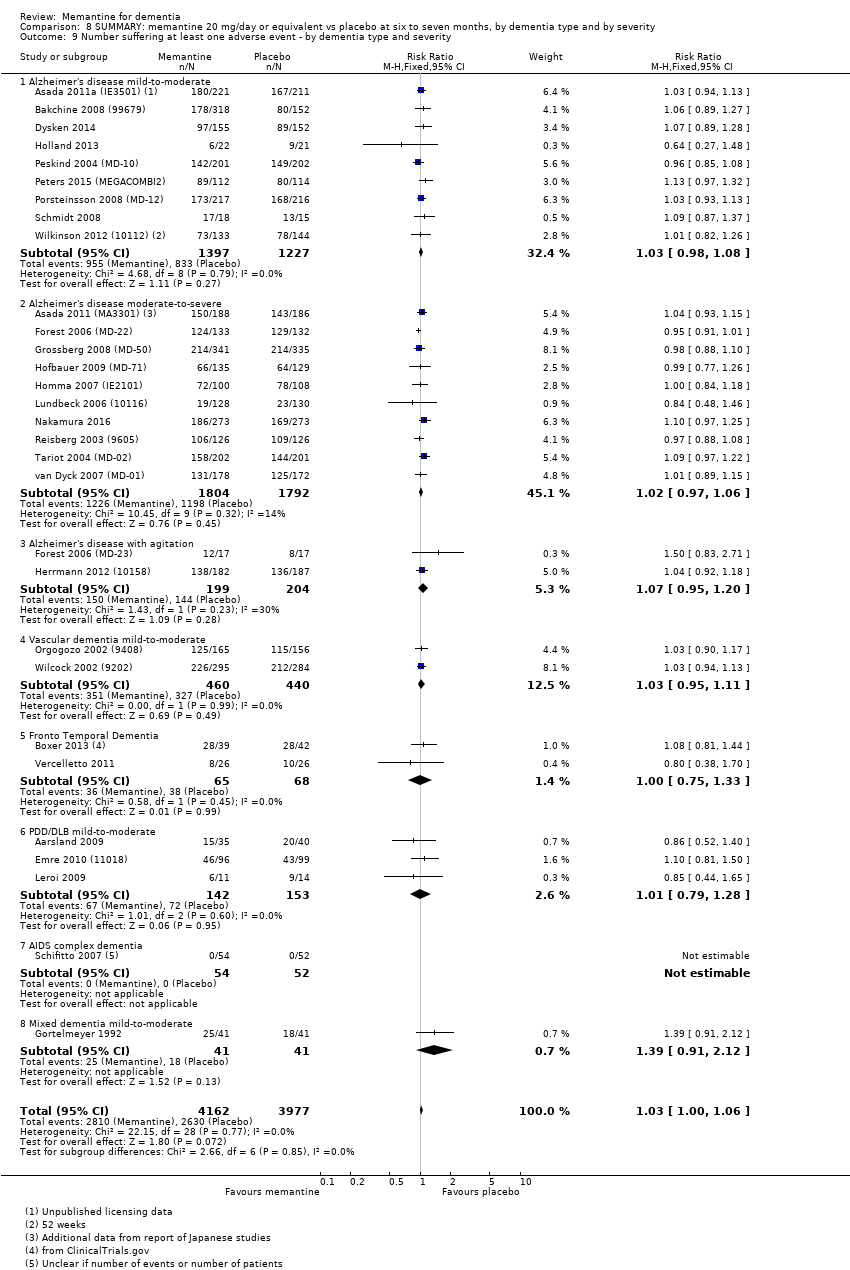
Comparison 8 SUMMARY: memantine 20 mg/day or equivalent vs placebo at six to seven months, by dementia type and by severity, Outcome 9 Number suffering at least one adverse event ‐ by dementia type and severity.
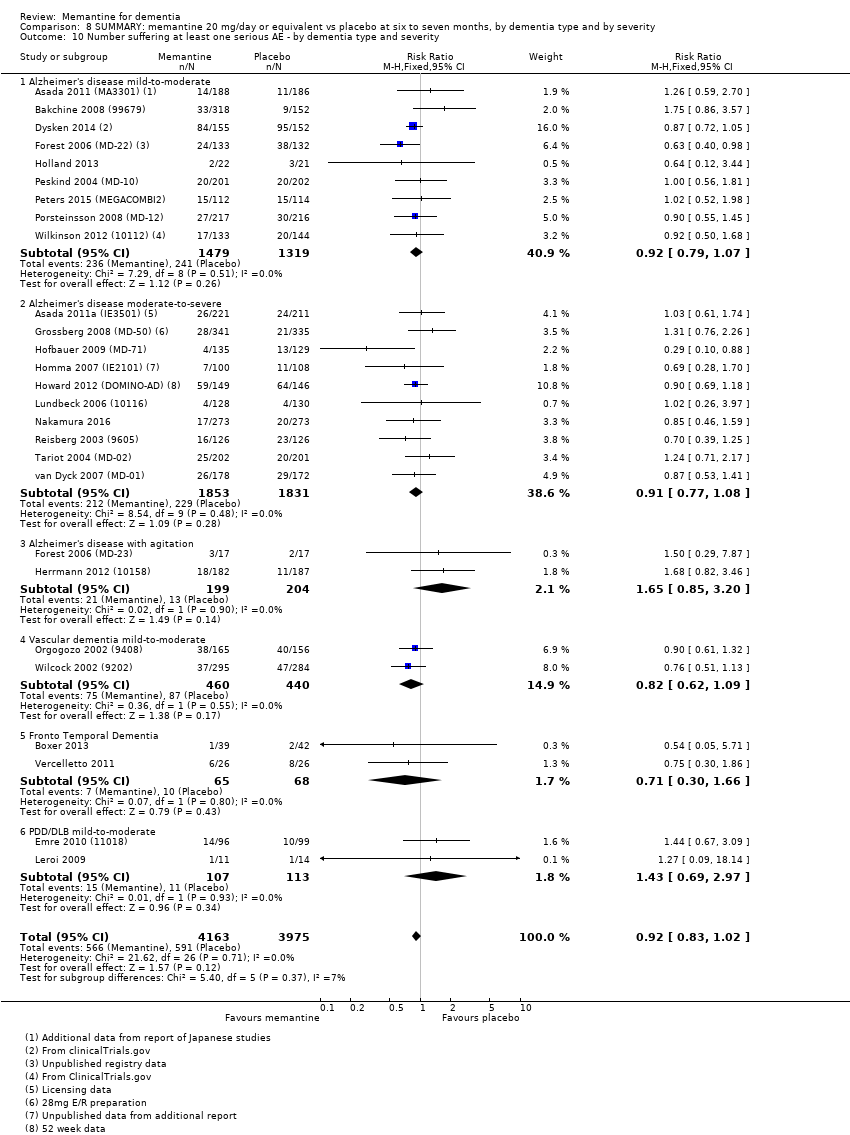
Comparison 8 SUMMARY: memantine 20 mg/day or equivalent vs placebo at six to seven months, by dementia type and by severity, Outcome 10 Number suffering at least one serious AE ‐ by dementia type and severity.
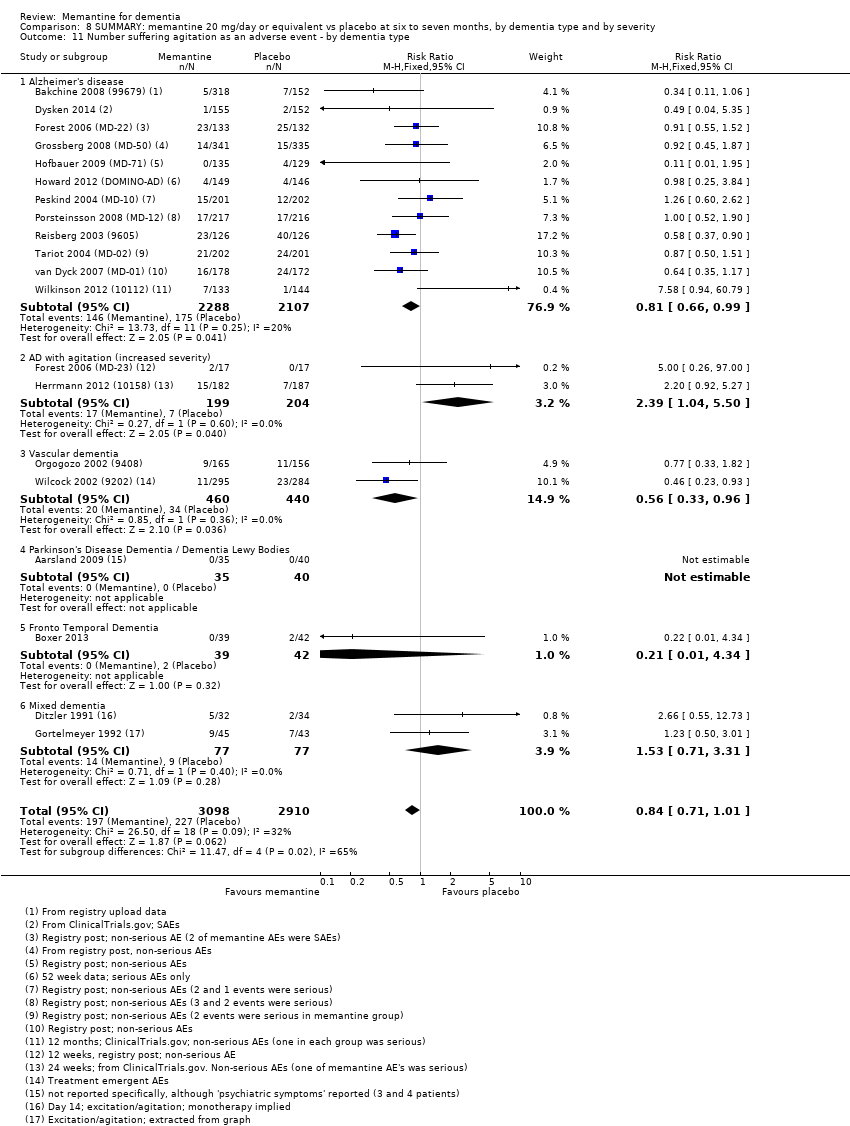
Comparison 8 SUMMARY: memantine 20 mg/day or equivalent vs placebo at six to seven months, by dementia type and by severity, Outcome 11 Number suffering agitation as an adverse event ‐ by dementia type.

Comparison 9 Adverse reactions: memantine vs placebo for mild to severe dementia. All diagnoses, all durations, Outcome 1 All‐cause discontinuation.

Comparison 9 Adverse reactions: memantine vs placebo for mild to severe dementia. All diagnoses, all durations, Outcome 2 Discontinuation due to adverse events.

Comparison 9 Adverse reactions: memantine vs placebo for mild to severe dementia. All diagnoses, all durations, Outcome 3 Number suffering at least one adverse event.

Comparison 9 Adverse reactions: memantine vs placebo for mild to severe dementia. All diagnoses, all durations, Outcome 4 Number suffering serious adverse events.

Comparison 9 Adverse reactions: memantine vs placebo for mild to severe dementia. All diagnoses, all durations, Outcome 5 Number suffering agitation as an adverse event.
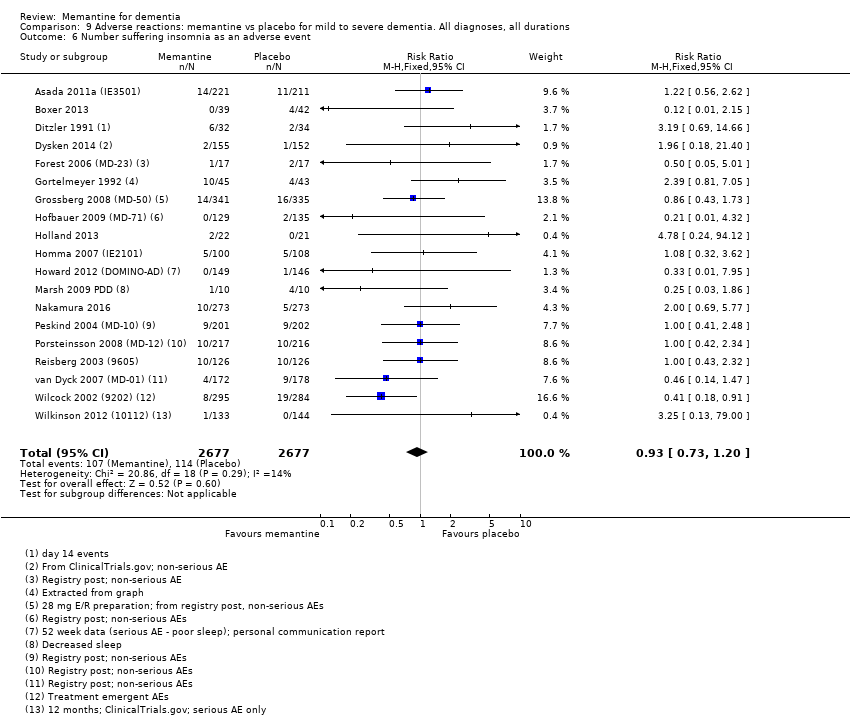
Comparison 9 Adverse reactions: memantine vs placebo for mild to severe dementia. All diagnoses, all durations, Outcome 6 Number suffering insomnia as an adverse event.

Comparison 9 Adverse reactions: memantine vs placebo for mild to severe dementia. All diagnoses, all durations, Outcome 7 Number suffering confusion as an adverse event.
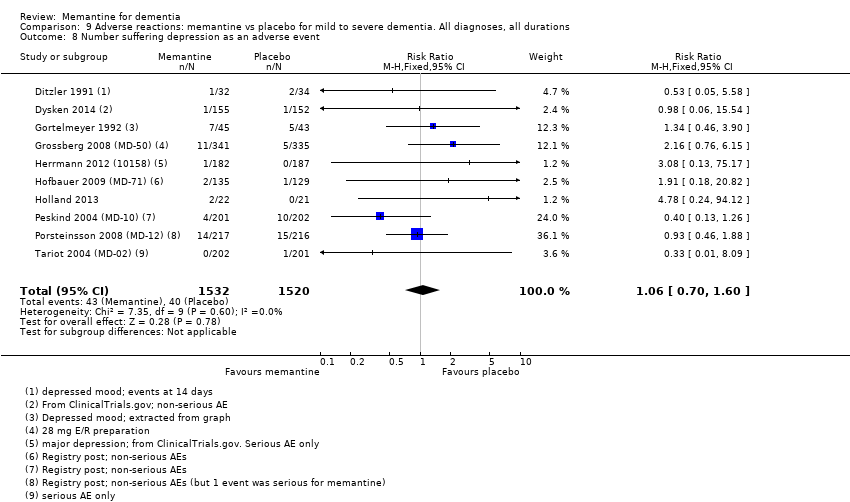
Comparison 9 Adverse reactions: memantine vs placebo for mild to severe dementia. All diagnoses, all durations, Outcome 8 Number suffering depression as an adverse event.

Comparison 9 Adverse reactions: memantine vs placebo for mild to severe dementia. All diagnoses, all durations, Outcome 9 Number suffering headache as an adverse event.

Comparison 9 Adverse reactions: memantine vs placebo for mild to severe dementia. All diagnoses, all durations, Outcome 10 Number suffering hypertension as an adverse event.

Comparison 9 Adverse reactions: memantine vs placebo for mild to severe dementia. All diagnoses, all durations, Outcome 11 Number suffering dizziness as an adverse event.

Comparison 9 Adverse reactions: memantine vs placebo for mild to severe dementia. All diagnoses, all durations, Outcome 12 Number suffering falls as an adverse event.
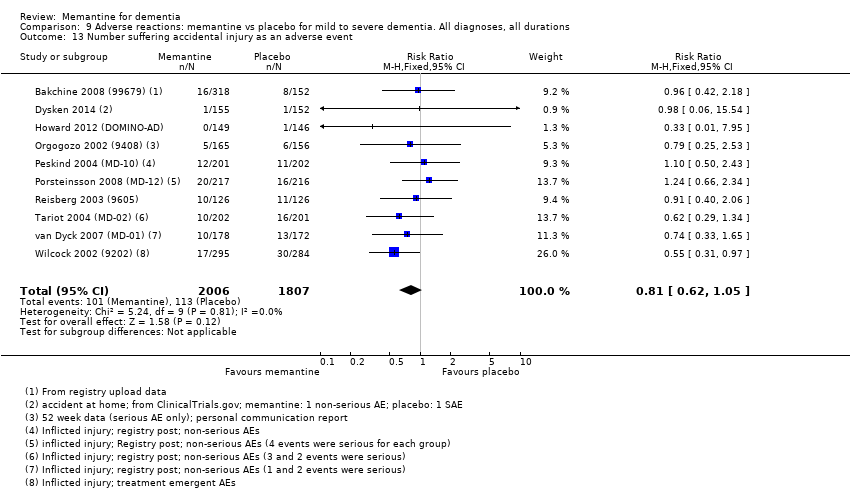
Comparison 9 Adverse reactions: memantine vs placebo for mild to severe dementia. All diagnoses, all durations, Outcome 13 Number suffering accidental injury as an adverse event.

Comparison 9 Adverse reactions: memantine vs placebo for mild to severe dementia. All diagnoses, all durations, Outcome 14 Number suffering urinary incontinence as an adverse event.

Comparison 9 Adverse reactions: memantine vs placebo for mild to severe dementia. All diagnoses, all durations, Outcome 15 Number suffering diarrhoea as an adverse event.
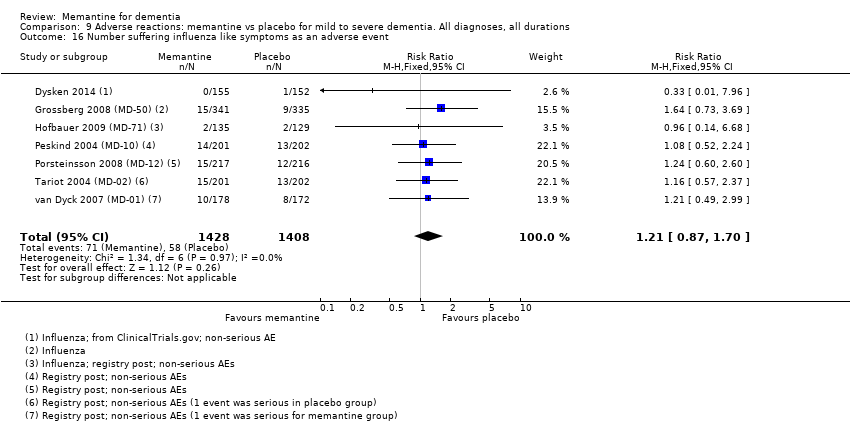
Comparison 9 Adverse reactions: memantine vs placebo for mild to severe dementia. All diagnoses, all durations, Outcome 16 Number suffering influenza like symptoms as an adverse event.
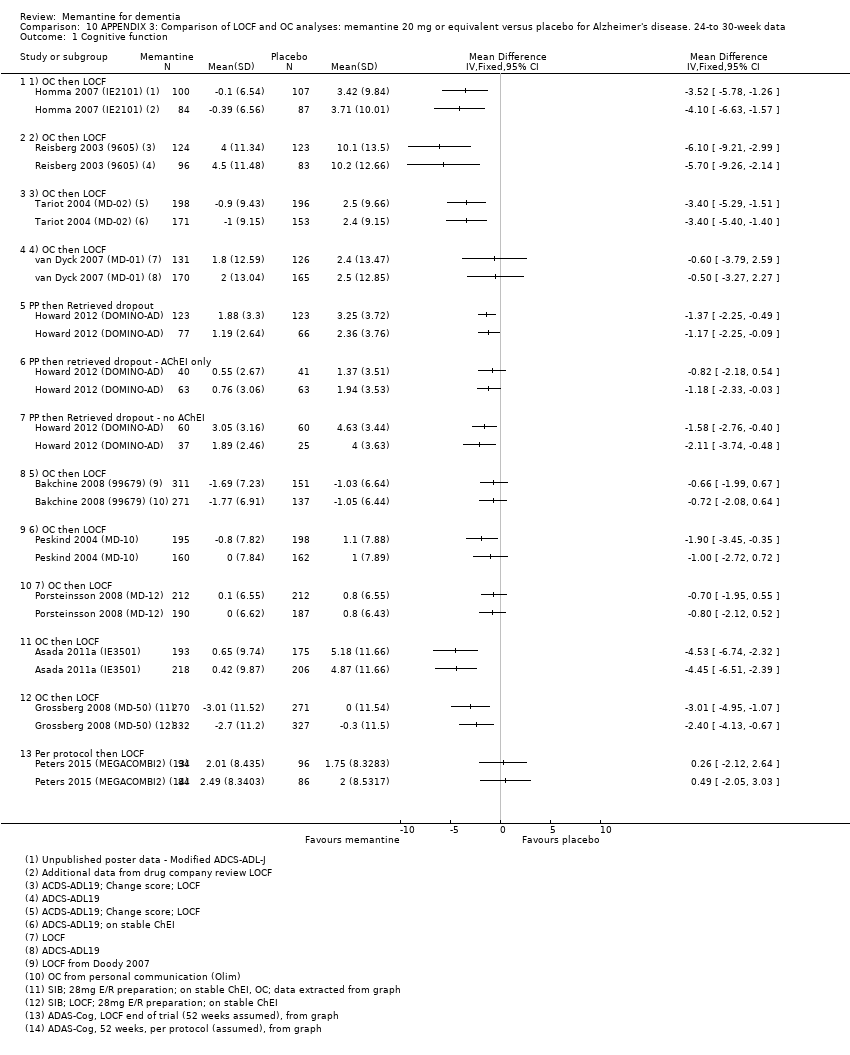
Comparison 10 APPENDIX 3: Comparison of LOCF and OC analyses: memantine 20 mg or equivalent versus placebo for Alzheimer's disease. 24‐to 30‐week data, Outcome 1 Cognitive function.

Comparison 10 APPENDIX 3: Comparison of LOCF and OC analyses: memantine 20 mg or equivalent versus placebo for Alzheimer's disease. 24‐to 30‐week data, Outcome 2 Decline in ADL: ADCS‐ADL19/23.

Comparison 10 APPENDIX 3: Comparison of LOCF and OC analyses: memantine 20 mg or equivalent versus placebo for Alzheimer's disease. 24‐to 30‐week data, Outcome 3 Cognitive Function: SIB/ADASCog/MMSE.

Comparison 10 APPENDIX 3: Comparison of LOCF and OC analyses: memantine 20 mg or equivalent versus placebo for Alzheimer's disease. 24‐to 30‐week data, Outcome 4 Decline in Activities of Daily Living.
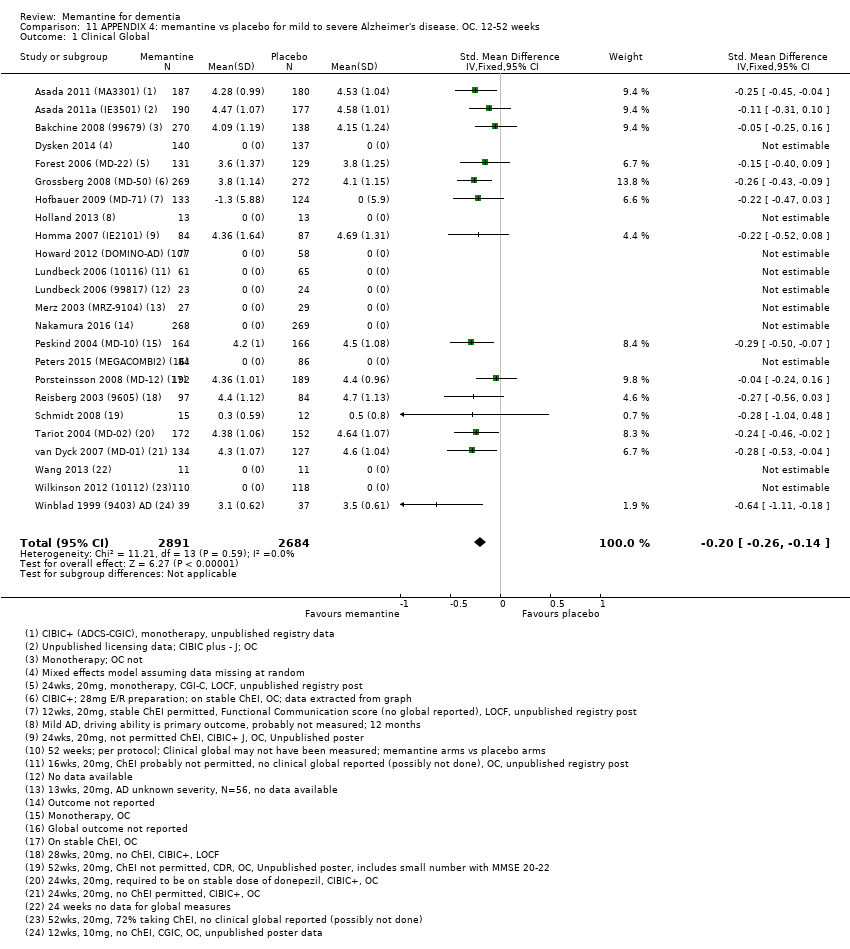
Comparison 11 APPENDIX 4: memantine vs placebo for mild to severe Alzheimer's disease. OC. 12‐52 weeks, Outcome 1 Clinical Global.

Comparison 11 APPENDIX 4: memantine vs placebo for mild to severe Alzheimer's disease. OC. 12‐52 weeks, Outcome 2 Cognitive Function.

Comparison 11 APPENDIX 4: memantine vs placebo for mild to severe Alzheimer's disease. OC. 12‐52 weeks, Outcome 3 Decline in ADL.
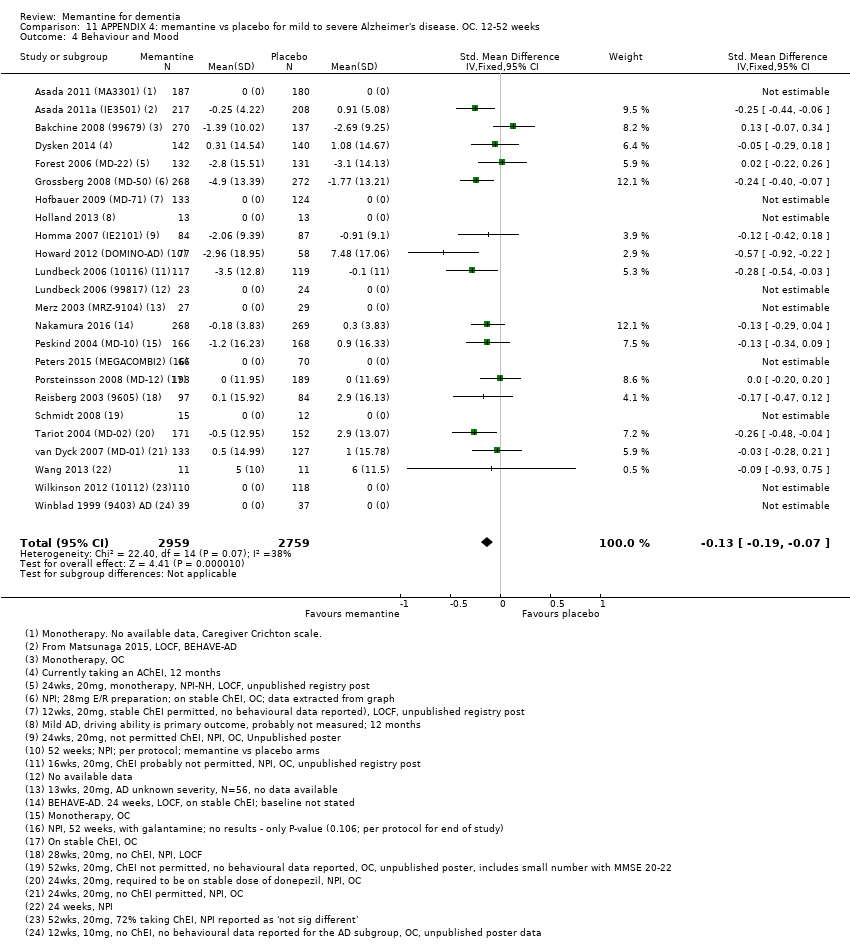
Comparison 11 APPENDIX 4: memantine vs placebo for mild to severe Alzheimer's disease. OC. 12‐52 weeks, Outcome 4 Behaviour and Mood.

Comparison 11 APPENDIX 4: memantine vs placebo for mild to severe Alzheimer's disease. OC. 12‐52 weeks, Outcome 5 Clinical Global ‐ sensitivity analysis for high RoB.

Comparison 11 APPENDIX 4: memantine vs placebo for mild to severe Alzheimer's disease. OC. 12‐52 weeks, Outcome 6 Cognitive Function ‐ sensitivity analysis for high risk of bias.

Comparison 11 APPENDIX 4: memantine vs placebo for mild to severe Alzheimer's disease. OC. 12‐52 weeks, Outcome 7 Decline in ADL ‐ sensitivity analysis on high RoB.

Comparison 11 APPENDIX 4: memantine vs placebo for mild to severe Alzheimer's disease. OC. 12‐52 weeks, Outcome 8 Behaviour and Mood ‐ sensitivity analysis on high RoB.

Comparison 12 APPENDIX 4: subgroup analysis by duration: memantine 20 mg or equivalent vs placebo for mild‐to‐severe Alzheimer's disease. OC. 12‐52 weeks, Outcome 1 Clinical Global ‐ CIBIC Plus, CGI‐I, or ADCS‐CGIC.

Comparison 12 APPENDIX 4: subgroup analysis by duration: memantine 20 mg or equivalent vs placebo for mild‐to‐severe Alzheimer's disease. OC. 12‐52 weeks, Outcome 2 Cognitive Function.
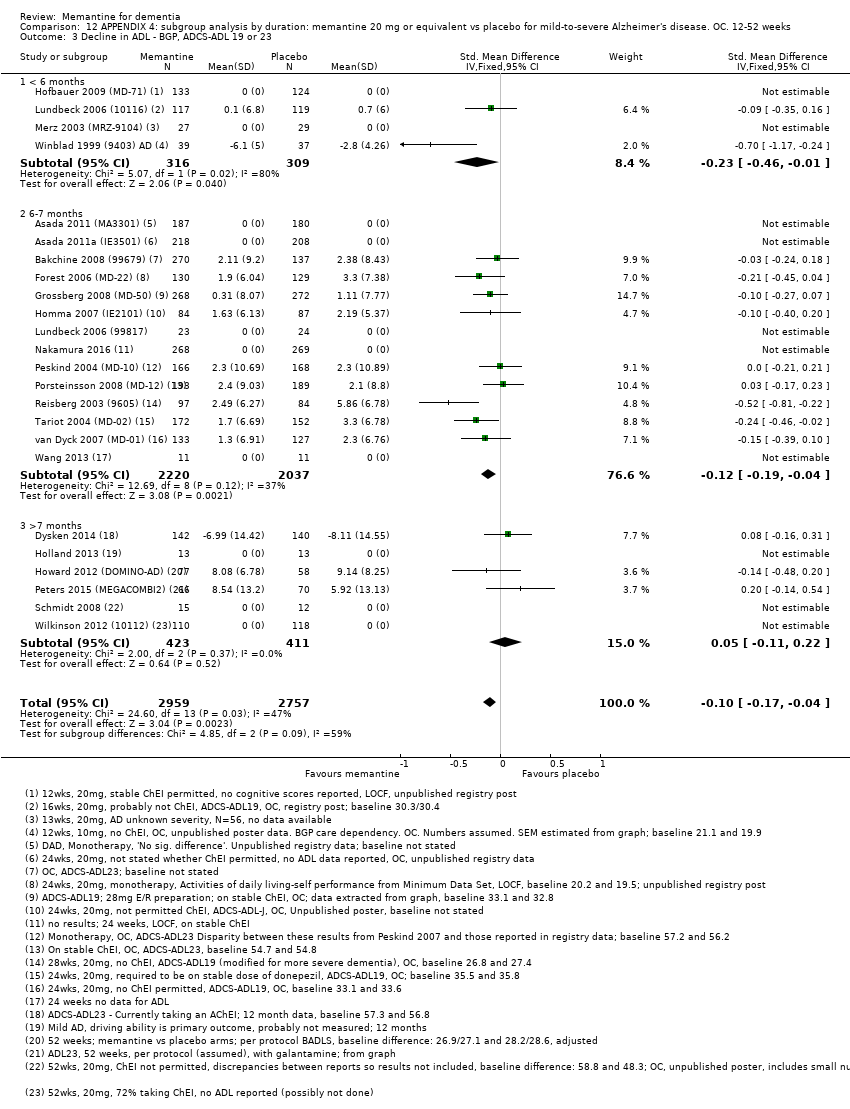
Comparison 12 APPENDIX 4: subgroup analysis by duration: memantine 20 mg or equivalent vs placebo for mild‐to‐severe Alzheimer's disease. OC. 12‐52 weeks, Outcome 3 Decline in ADL ‐ BGP, ADCS‐ADL 19 or 23.
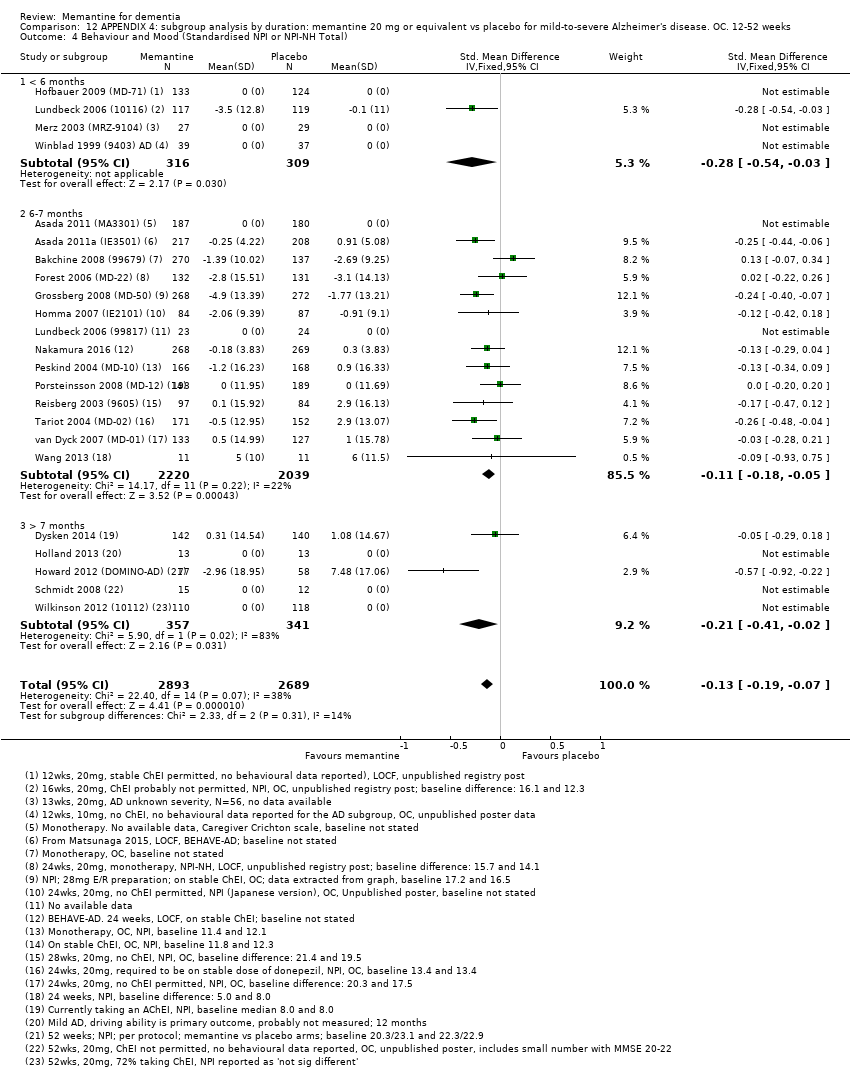
Comparison 12 APPENDIX 4: subgroup analysis by duration: memantine 20 mg or equivalent vs placebo for mild‐to‐severe Alzheimer's disease. OC. 12‐52 weeks, Outcome 4 Behaviour and Mood (Standardised NPI or NPI‐NH Total).

Comparison 13 APPENDIX 4: memantine 10 mg versus 20 mg memantine for Alzheimer's disease (12‐24 weeks), Outcome 1 Clinical Global; 10mg versus 20mg.

Comparison 13 APPENDIX 4: memantine 10 mg versus 20 mg memantine for Alzheimer's disease (12‐24 weeks), Outcome 2 Cognitive function; 10mg vs 20 mg.

Comparison 13 APPENDIX 4: memantine 10 mg versus 20 mg memantine for Alzheimer's disease (12‐24 weeks), Outcome 3 Decline in ADL; 10mg versus 20mg.

Comparison 13 APPENDIX 4: memantine 10 mg versus 20 mg memantine for Alzheimer's disease (12‐24 weeks), Outcome 4 Behaviour and mood; 10mg versus 20mg.

Comparison 13 APPENDIX 4: memantine 10 mg versus 20 mg memantine for Alzheimer's disease (12‐24 weeks), Outcome 5 Clinical Global.
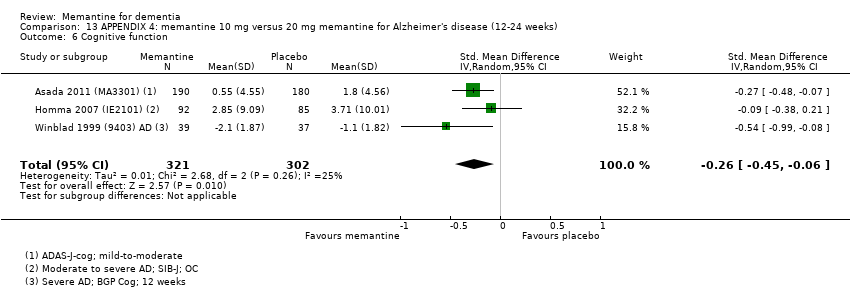
Comparison 13 APPENDIX 4: memantine 10 mg versus 20 mg memantine for Alzheimer's disease (12‐24 weeks), Outcome 6 Cognitive function.

Comparison 13 APPENDIX 4: memantine 10 mg versus 20 mg memantine for Alzheimer's disease (12‐24 weeks), Outcome 7 Decline in activities of daily living.

Comparison 13 APPENDIX 4: memantine 10 mg versus 20 mg memantine for Alzheimer's disease (12‐24 weeks), Outcome 8 Behaviour and mood.

Comparison 14 APPENDIX 4: subgroup analysis by presence/absence of ChEI; 20 mg; six to seven months, Outcome 1 Clinical Global: subgroup analysis by +/‐ ChEI.
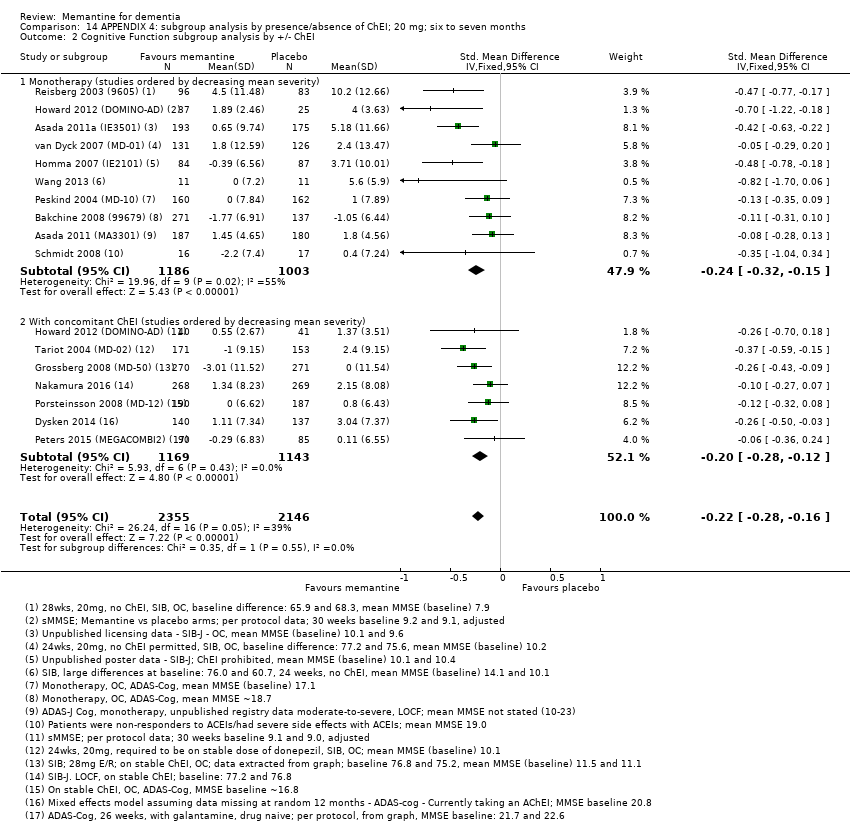
Comparison 14 APPENDIX 4: subgroup analysis by presence/absence of ChEI; 20 mg; six to seven months, Outcome 2 Cognitive Function subgroup analysis by +/‐ ChEI.

Comparison 14 APPENDIX 4: subgroup analysis by presence/absence of ChEI; 20 mg; six to seven months, Outcome 3 Decline in ADL subgroup analysis by +/‐ ChEI.
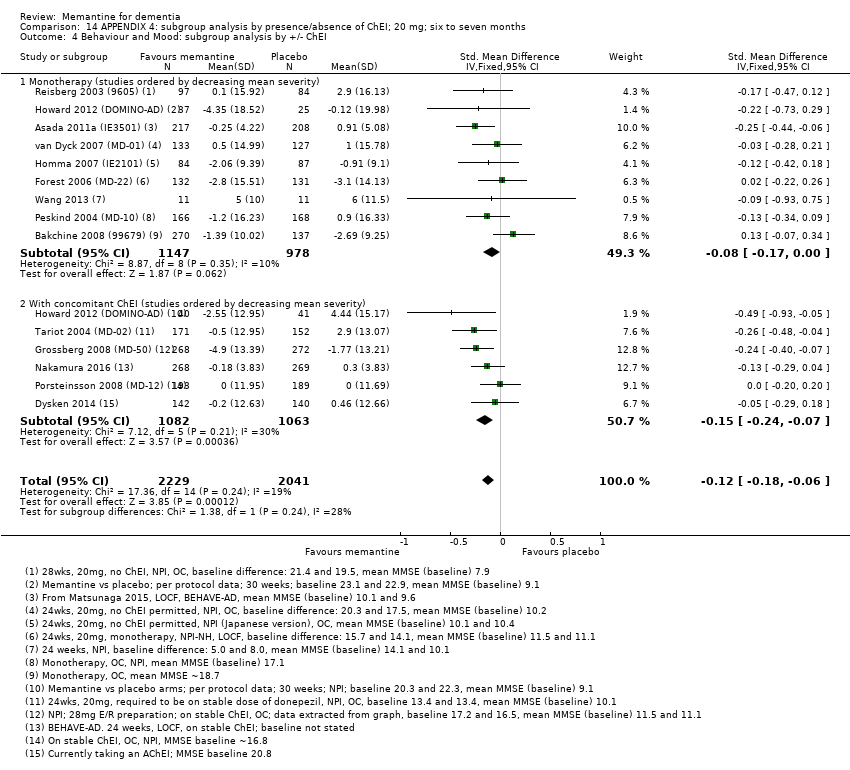
Comparison 14 APPENDIX 4: subgroup analysis by presence/absence of ChEI; 20 mg; six to seven months, Outcome 4 Behaviour and Mood: subgroup analysis by +/‐ ChEI.
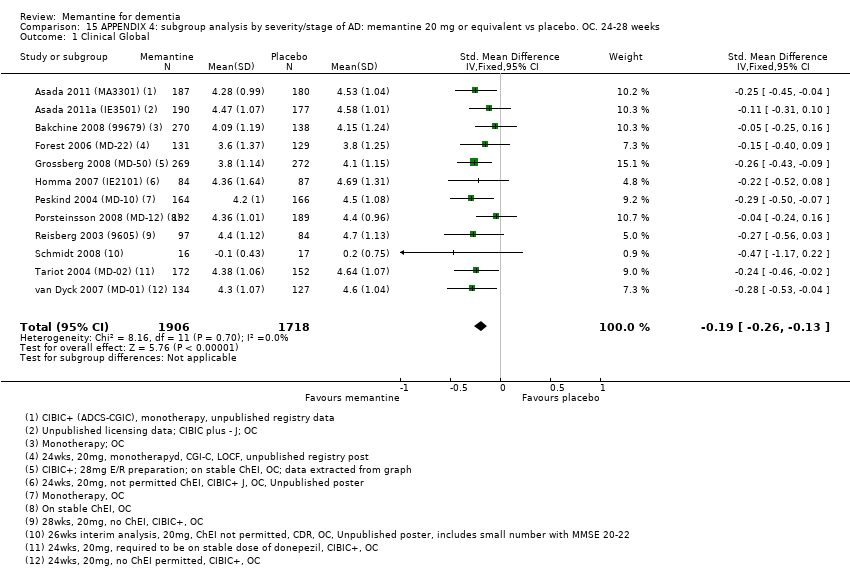
Comparison 15 APPENDIX 4: subgroup analysis by severity/stage of AD: memantine 20 mg or equivalent vs placebo. OC. 24‐28 weeks, Outcome 1 Clinical Global.

Comparison 15 APPENDIX 4: subgroup analysis by severity/stage of AD: memantine 20 mg or equivalent vs placebo. OC. 24‐28 weeks, Outcome 2 Cognitive Function.

Comparison 15 APPENDIX 4: subgroup analysis by severity/stage of AD: memantine 20 mg or equivalent vs placebo. OC. 24‐28 weeks, Outcome 3 Decline in ADL.
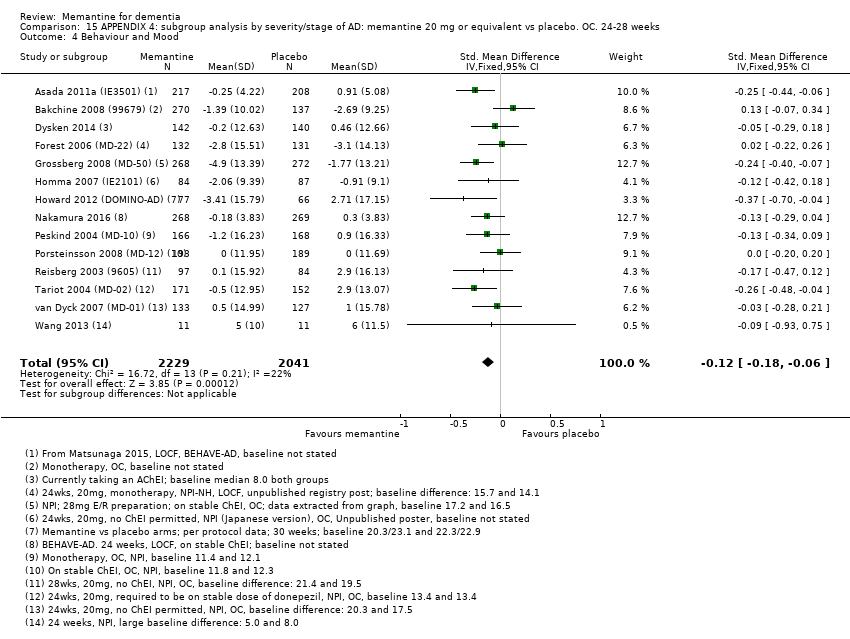
Comparison 15 APPENDIX 4: subgroup analysis by severity/stage of AD: memantine 20 mg or equivalent vs placebo. OC. 24‐28 weeks, Outcome 4 Behaviour and Mood.

Comparison 15 APPENDIX 4: subgroup analysis by severity/stage of AD: memantine 20 mg or equivalent vs placebo. OC. 24‐28 weeks, Outcome 5 Clinical Global.

Comparison 15 APPENDIX 4: subgroup analysis by severity/stage of AD: memantine 20 mg or equivalent vs placebo. OC. 24‐28 weeks, Outcome 6 Cognitive Function.
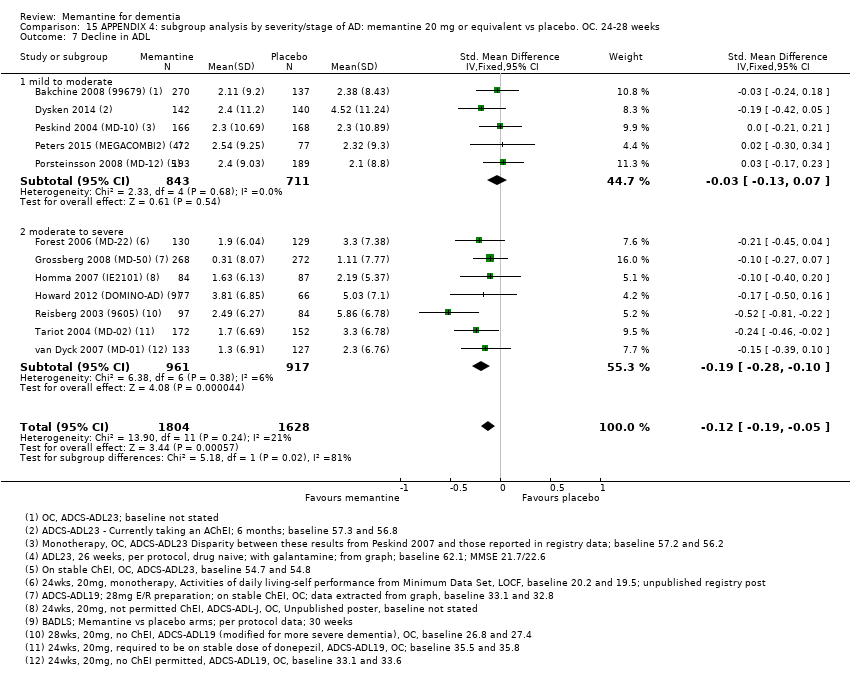
Comparison 15 APPENDIX 4: subgroup analysis by severity/stage of AD: memantine 20 mg or equivalent vs placebo. OC. 24‐28 weeks, Outcome 7 Decline in ADL.
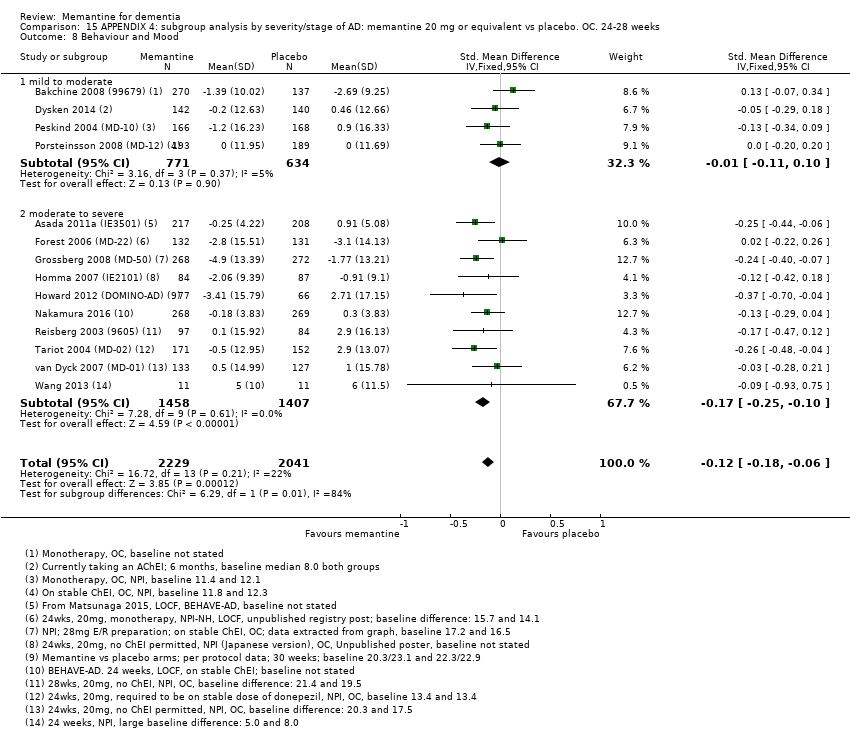
Comparison 15 APPENDIX 4: subgroup analysis by severity/stage of AD: memantine 20 mg or equivalent vs placebo. OC. 24‐28 weeks, Outcome 8 Behaviour and Mood.

Comparison 15 APPENDIX 4: subgroup analysis by severity/stage of AD: memantine 20 mg or equivalent vs placebo. OC. 24‐28 weeks, Outcome 9 All‐cause discontinuation, by type of disease and severity.

Comparison 15 APPENDIX 4: subgroup analysis by severity/stage of AD: memantine 20 mg or equivalent vs placebo. OC. 24‐28 weeks, Outcome 10 Discontinuation due to adverse events, by disease type and severity.
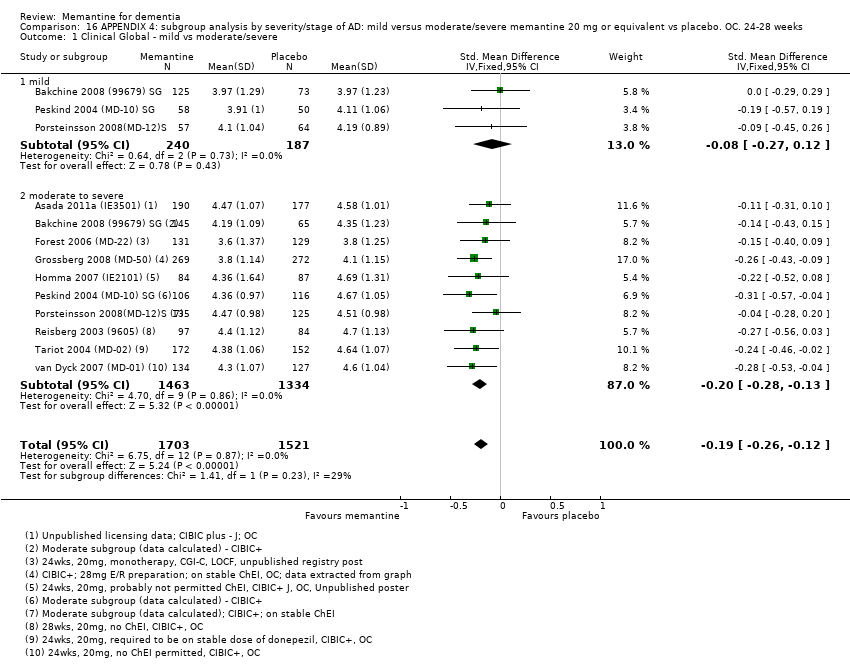
Comparison 16 APPENDIX 4: subgroup analysis by severity/stage of AD: mild versus moderate/severe memantine 20 mg or equivalent vs placebo. OC. 24‐28 weeks, Outcome 1 Clinical Global ‐ mild vs moderate/severe.
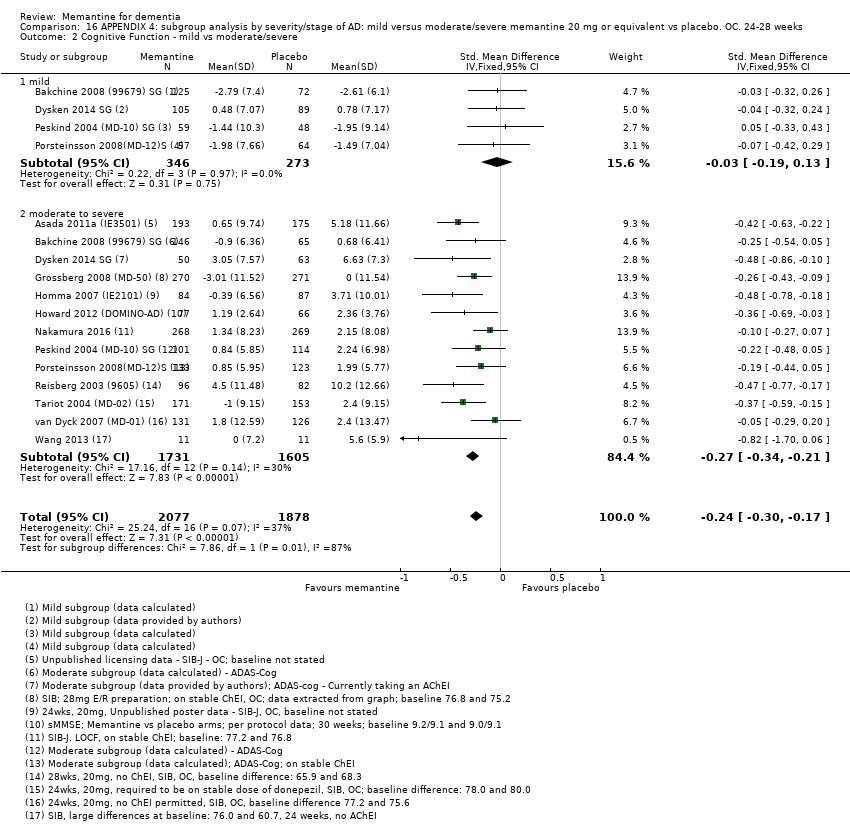
Comparison 16 APPENDIX 4: subgroup analysis by severity/stage of AD: mild versus moderate/severe memantine 20 mg or equivalent vs placebo. OC. 24‐28 weeks, Outcome 2 Cognitive Function ‐ mild vs moderate/severe.
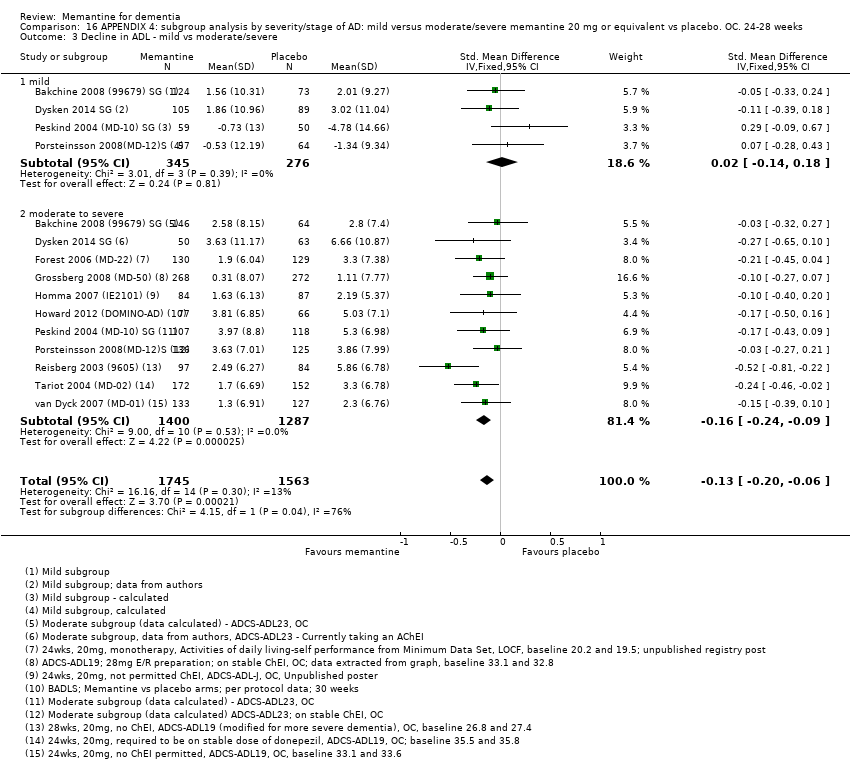
Comparison 16 APPENDIX 4: subgroup analysis by severity/stage of AD: mild versus moderate/severe memantine 20 mg or equivalent vs placebo. OC. 24‐28 weeks, Outcome 3 Decline in ADL ‐ mild vs moderate/severe.

Comparison 16 APPENDIX 4: subgroup analysis by severity/stage of AD: mild versus moderate/severe memantine 20 mg or equivalent vs placebo. OC. 24‐28 weeks, Outcome 4 Behaviour and Mood ‐ mild vs moderate/severe.
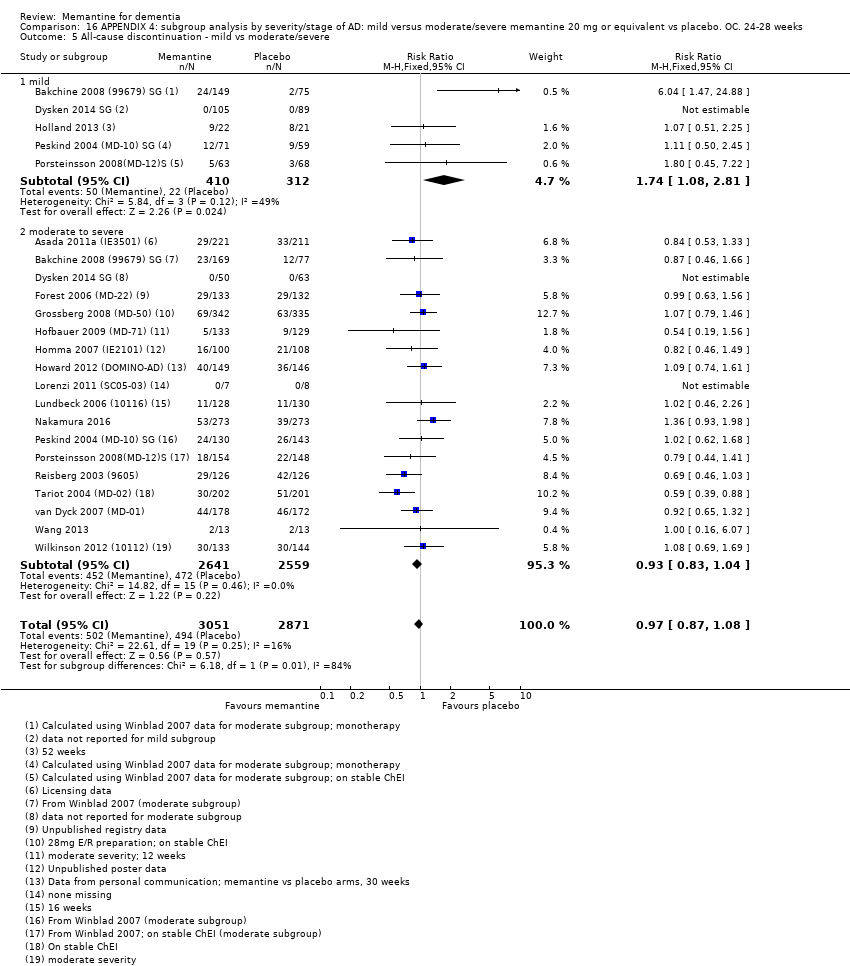
Comparison 16 APPENDIX 4: subgroup analysis by severity/stage of AD: mild versus moderate/severe memantine 20 mg or equivalent vs placebo. OC. 24‐28 weeks, Outcome 5 All‐cause discontinuation ‐ mild vs moderate/severe.
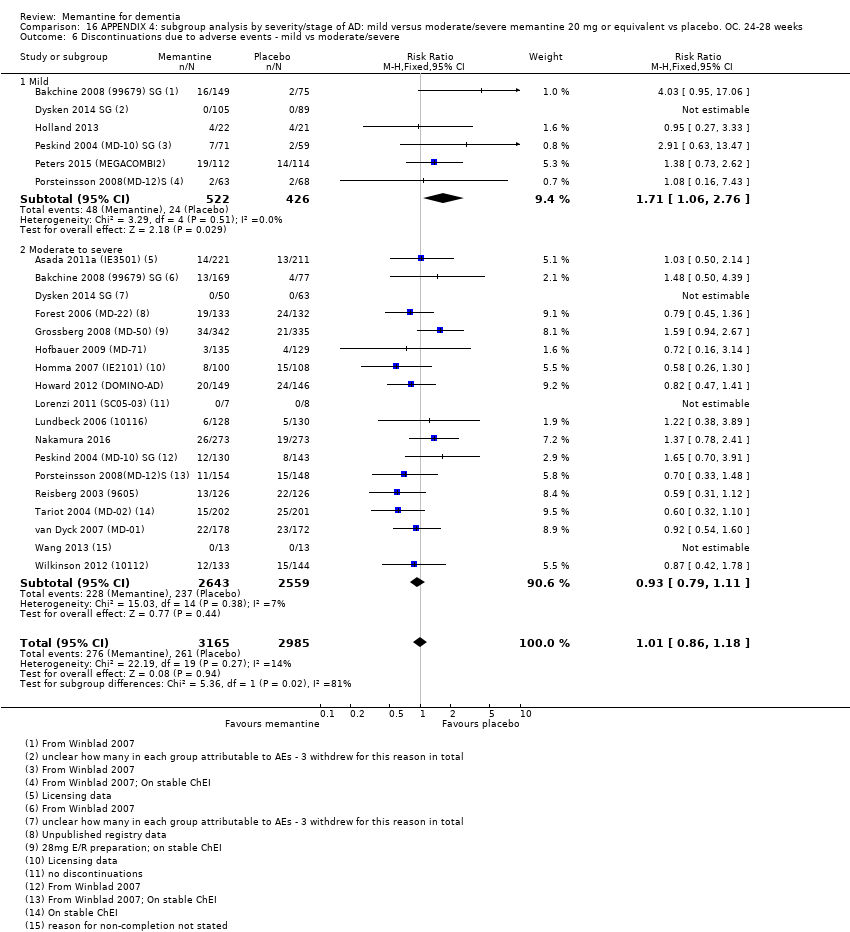
Comparison 16 APPENDIX 4: subgroup analysis by severity/stage of AD: mild versus moderate/severe memantine 20 mg or equivalent vs placebo. OC. 24‐28 weeks, Outcome 6 Discontinuations due to adverse events ‐ mild vs moderate/severe.
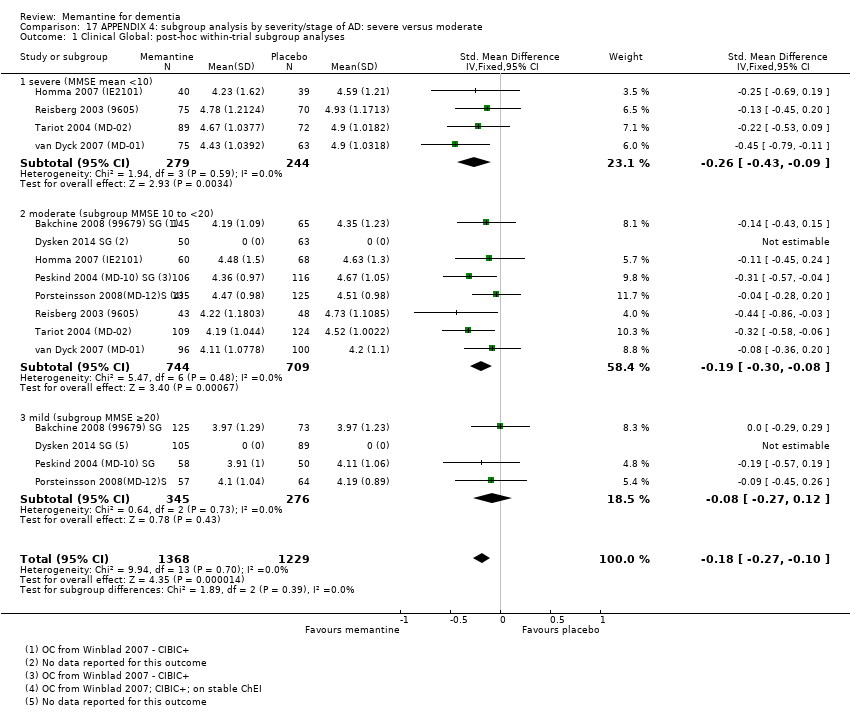
Comparison 17 APPENDIX 4: subgroup analysis by severity/stage of AD: severe versus moderate, Outcome 1 Clinical Global: post‐hoc within‐trial subgroup analyses.

Comparison 17 APPENDIX 4: subgroup analysis by severity/stage of AD: severe versus moderate, Outcome 2 Cognitive Function: post‐hoc within‐trial subgroup analyses.

Comparison 17 APPENDIX 4: subgroup analysis by severity/stage of AD: severe versus moderate, Outcome 3 Decline in ADL: post‐hoc within‐trial subgroup analyses.

Comparison 17 APPENDIX 4: subgroup analysis by severity/stage of AD: severe versus moderate, Outcome 4 Clinical Global: by severity of disease.
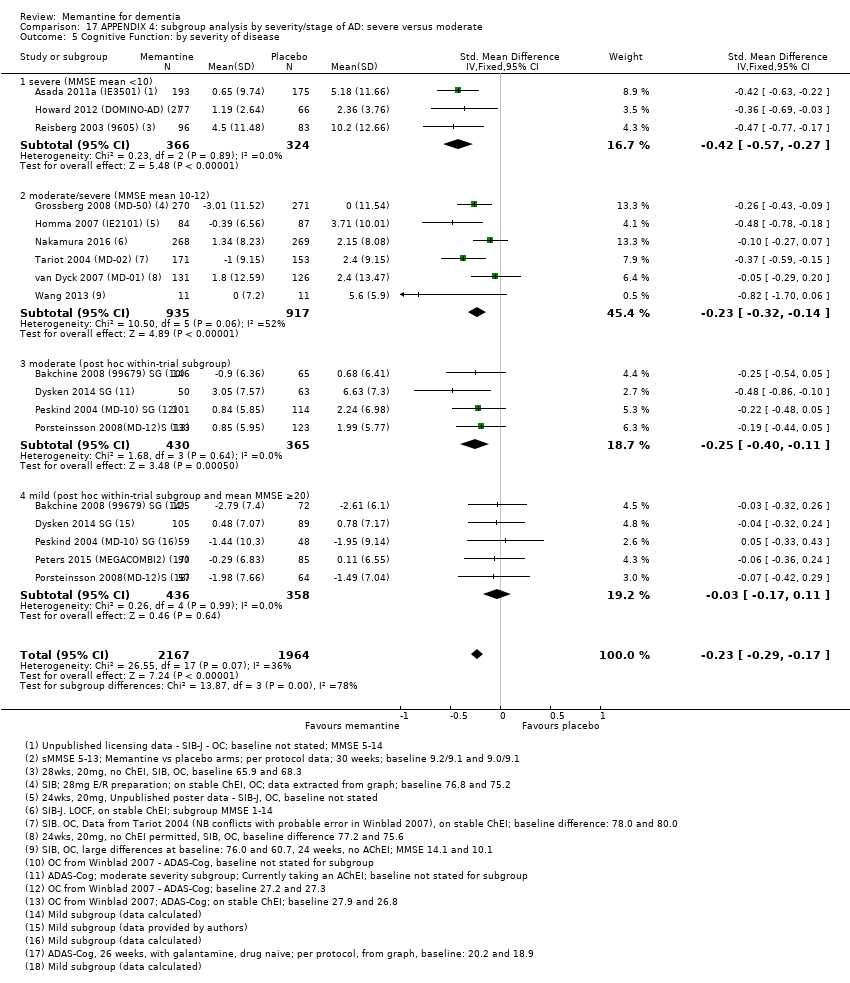
Comparison 17 APPENDIX 4: subgroup analysis by severity/stage of AD: severe versus moderate, Outcome 5 Cognitive Function: by severity of disease.

Comparison 17 APPENDIX 4: subgroup analysis by severity/stage of AD: severe versus moderate, Outcome 6 Decline in ADL: by severity of disease.
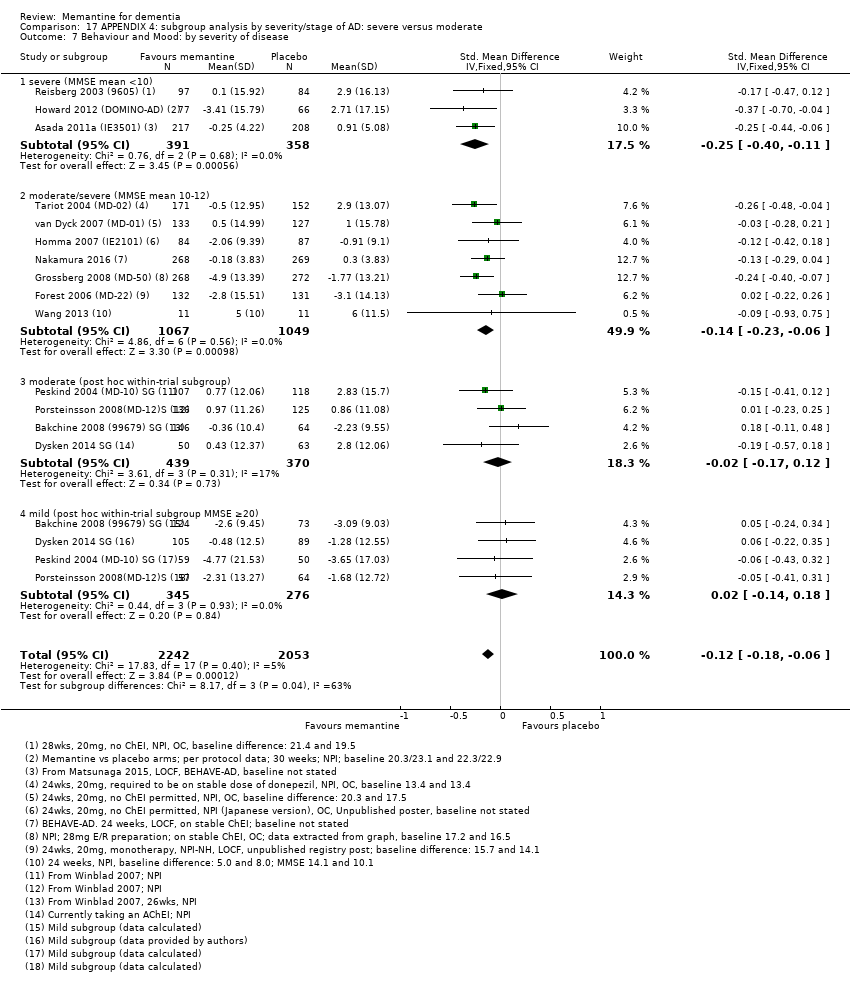
Comparison 17 APPENDIX 4: subgroup analysis by severity/stage of AD: severe versus moderate, Outcome 7 Behaviour and Mood: by severity of disease.
| Memantine 20 mg or equivalent compared to placebo for moderate‐to‐severe Alzheimer's disease (AD) 24‐ to 30‐week data. OC | ||||||
| Population: Alzheimer's disease (AD), moderate‐to‐severe | ||||||
| Continuous outcomes | Score with placebo (median) | Mean improvement in change score between memantine and placebo | SMD (95% CI) meta‐analysis findings | № of participants | Certainty of the evidence | Comments |
| Clinical Global (CIBIC+) | Median CIBIC+ score was 4.60 3 (i.e. deterioration with time) | MD: 0.21 (0.14 to 0.30) | ‐0.20 (‐0.28 to ‐0.13) | 2797 | ⊕⊕⊕⊕ | SMD as a negative outcome Converted to CIBIC+ scale; median SD(pooled) = 1.06. |
| Cognitive Function (SIB) | Median SIB score at baseline: 75.2. Median change from baseline (positive scale): ‐2.4 4 (i.e. deterioration with time) | MD: 3.11 (2.42 to 3.92) | ‐0.27 (‐0.34 to ‐0.21) | 3337 | ⊕⊕⊕⊕ | SMD as a negative outcome (Analysis 1.2). Converted to SIB scale (and scale direction inverted); median SD (pooled) = 11.53. |
| Functional performance on activities of daily living: ADCS‐ADL19 | Median ADCS‐ADL19 score at baseline: 33.2 Median change from baseline (positive scale): ‐2.8 5 (i.e. deterioration with time) | MD: 1.09 (0.62 to 1.64) | ‐0.16 (‐0.24 to ‐0.09) | 2687 | ⊕⊕⊕⊕ | SMD for decline in ADL (a negative outcome) (Analysis 1.3). Converted to ADCS‐ADL19 scale (and scale direction inverted); median SD(pooled) = 6.84. |
| Behaviour and Mood (NPI) 144‐point scale | The median baseline NPI score was 17.0. Median change from baseline (negative scale): 2.80 6 (i.e. deterioration with time) | MD: 1.84 (1.05 to 2.76) | ‐0.14 (‐0.21 to ‐0.08) | 3674 | ⊕⊕⊕⊕ | SMD as a negative outcome Converted to NPI scale; median SD(pooled) = 13.15. |
| Binary outcomes | Anticipated absolute effects | Relative effect | № of participants | Certainty of the evidence | Comments | |
| Risk with placebo (median) | Risk with memantine | |||||
| All‐cause discontinuation | 182 per 1000 | 169 per 1000 | RR 0.93 | 5087 924 events | ⊕⊕⊕⊕ | RR and median control group risk in people with moderate‐to‐severe AD without agitation (Analysis 16.5). |
| Difference: 13 fewer people per 1000 discontinued treatment for any cause (95% CI 31 fewer to 7 more) | ||||||
| Number suffering at least one adverse event | 716 per 1000 | 737 per 1000 | RR 1.03 | 8033 5371 events | ⊕⊕⊕⊕ | RR from all studies (Analysis 9.3). Median control group risk for moderate‐to‐severe AD studies (Analysis 1.7). |
| Difference: 21 more people per 1000 suffered adverse events | ||||||
| Number suffering at least one serious adverse event | 114 per 1000 | 104 per 1000 (93 to 116) | RR 0.91 | 6482 (19 RCTs) 918 events | ⊕⊕⊕⊕ | RR and median control risk from all AD studies (except those with agitation) (from Analysis 8.10) |
| Difference: 10 fewer people per 1000 suffered serious adverse events (95% CI 21 fewer to 2 more) | ||||||
| Number suffering agitation as an adverse event | 129 per 1000 | 104 per 1000 | RR 0.81 | 4395 321 events | ⊕⊕⊕⊝ | RR from all AD studies (apart from those in people with agitation) (Analysis 8.11). Median control group risk for moderate‐to‐severe AD studies (Analysis 1.9). |
| Difference: 25 fewer people per 1000 suffered agitation as an adverse event | ||||||
| *The risk in the intervention group (and its 95% confidence interval) is based on the assumed risk in the comparison group and the relative effect of the intervention (and its 95% CI). | ||||||
| GRADE Working Group grades of evidence | ||||||
| 1 Some inconsistency in point estimates, but not enough to downgrade 2 Some inconsistency in point estimates (downgrade once) 3 Median control group values for 8 studies reporting CIBIC+ (Asada 2011a (IE3501); Bakchine 2008 (99679) SG; Grossberg 2008 (MD‐50); Peskind 2004 (MD‐10) SG; Porsteinsson 2008(MD‐12)S; Reisberg 2003 (9605); Tariot 2004 (MD‐02); van Dyck 2007 (MD‐01)) 4 Median control group baseline scores and median control group change from baseline for 5 studies reporting SIB (Grossberg 2008 (MD‐50); Reisberg 2003 (9605); Tariot 2004 (MD‐02); van Dyck 2007 (MD‐01); Wang 2013) 5 Median control group baseline scores and median control group change from baseline for the 4 studies reporting ADCS‐ADL19 (Grossberg 2008 (MD‐50); Reisberg 2003 (9605);Tariot 2004 (MD‐02); van Dyck 2007 (MD‐01)) 6 Median control group baseline scores and median control group change from baseline for the 10 studies reporting NPI (Bakchine 2008 (99679) SG; Dysken 2014 SG; Grossberg 2008 (MD‐50); Howard 2012 (DOMINO‐AD); Peskind 2004 (MD‐10) SG; Porsteinsson 2008(MD‐12)S; Reisberg 2003 (9605); Tariot 2004 (MD‐02); van Dyck 2007 (MD‐01); Wang 2013) | ||||||
| Memantine 20 mg compared to placebo for mild‐to‐moderate vascular dementia. six‐month studies | ||||||
| Population: vascular dementia, mild‐to‐moderate severity | ||||||
| Continuous outcomes | Score with placebo (mean) | Mean improvement in change score between memantine and placebo | SMD (95% CI) meta‐analysis findings | № of participants | Certainty of the evidence | Comments |
| Clinical Global: (CIBIC+) | CIBIC+ score (i.e. no change with time) | MD: 0.03 (‐0,28 to 0.34) | ‐0.02 (‐0.23 to 0.19) | 757 | ⊕⊕⊕⊝ | SMD as a negative outcome; random effects (Analysis 5.1). Converted to CIBIC+ scale; SD(pooled) = 1.46. |
| Cognitive function: ADAS‐Cog | Mean ADAS‐Cog score at baseline was 23.6. Mean change from (i.e. deterioration with time) | MD: 2.15 (1.05 to 3.25) | ‐0.32 (‐0.48 to ‐0.15) | 569 | ⊕⊕⊕⊝ | Analysed as mean difference (Analysis 5.2) [SMD as a negative outcome Analysis 8.2] |
| Performance on ADL (NOSGER self care subscale) Subscale 5 points | Baseline scores not reported. Change from baseline i.e. deterioration with time | MD: 0.11 (‐0.35 to 0.54) | ‐0.04 (‐0.20 to 0.13) | 542 | ⊕⊕⊝⊝ | SMD for decline in ADL (a negative outcome) (Analysis 5.3). Converted to NOSGER II self‐care subscale (Wilcock 2002 (9202)) SD(pooled) = 2.69. |
| Behaviour: NOSGER disturbing behaviour subscale Subscale 5 points | Baseline scores not reported. Change from baseline for the NOSGER i.e. deterioration with time | MD: 0.47 (0.07 to 0.87) | ‐0.20 (‐0.37 to ‐0.03) | 542 | ⊕⊕⊝⊝ | SMD as a negative outcome (Analysis 5.4). Converted to NOSGER II disturbing behaviour subscale (Wilcock 2002 (9202)) SD(pooled) = 2.34. |
| Binary outcomes | Anticipated absolute effects | Relative effect | № of participants | Certainty of the evidence | Comments | |
| Risk with placebo (median) | Risk with memantine | |||||
| All‐cause discontinuation | 218 per 1000 | 229 per 1000 | RR 1.05 | 900 678 events | ⊕⊕⊝⊝ | RR and control group risk for studies in people with vascular dementia (Analysis 5.6.) |
| Difference: 11 more people per 1000 discontinued treatment for any cause (95% CI 37 fewer to 74 more) | ||||||
| Number suffering at least one adverse event | 742 per 1000 | 764 per 1000 | RR 1.03 | 8033 5371 events | ⊕⊕⊕⊕ | RR from all studies (Analysis 9.3). Control group risk taken from studies in vascular dementia (Analysis 5.8) |
| Difference: 22 more people per 1000 suffered adverse events | ||||||
| Number suffering at least one serious adverse event | 211 per 1000 | 173 per 1000 (95% CI 131 to 230) | RR 0.82 (0.62 to 1.09) | 900 (2 RCTs) 162 events | ⊕⊕⊝⊝ | RR and control group risk from vascular dementia studies (Analysis 8.10) |
| Difference: 38 fewer people per 1000 suffered serious adverse events (95% CI 80 fewer to 19 more) | ||||||
| Number suffering agitation as an adverse event | 77 per 1000 | 44 per 1000 | RR 0.57 | 900 54 events | ⊕⊕⊝⊝ | RR and control group risk from vascular dementia studies (Analysis 5.9); random effects |
| Difference: 33 fewer people per 1000 suffered agitation as an adverse event | ||||||
| *The risk in the intervention group (and its 95% confidence interval) is based on the assumed risk in the comparison group and the relative effect of the intervention (and its 95% CI). | ||||||
| GRADE Working Group grades of evidence | ||||||
| 1 Inconsistency in point estimates (and I² = 48%); some imprecision (95% CI crossed null and was consistent with benefit and no difference) but may be consequence of inconsistency (downgraded once overall) 2 Majority of the information at high risk of bias (downgrade once). Some inconsistency (but insufficient to downgrade) 3 Majority of the information at high risk of bias for 2 domains (downgrade twice) 4 Majority of the information at high risk of bias (downgrade once); some inconsistency and some imprecision (crossed null and 1.25) (downgrade once) 5 Majority of the information at high risk of bias (downgrade once); imprecision (162 events and crossed both 0.75 and null)) (downgrade once) 6 Majority of the information at high risk of bias (downgrade once); imprecision (only 54 events) (downgrade once) | ||||||
| Study | Clinical Global | Cognitive function | Decline in ADL | Behaviour and mood | ||||||||||
| CIBIC‐Plus | CGIC/ | CDR | ADAS‐ | SIB | MMSE | ADCS‐ | ADL‐19 | BADLS | BGP | DAD | NPI | BEHAVE | Other | |
| Alzheimers' disease studies | X | |||||||||||||
| X | X | Japanese versions. DAD, Caregiver‐rated Crichton Scale, MMSE, CDR | ||||||||||||
| X | X | X | Japanese versions | |||||||||||
| X | MMSE | |||||||||||||
| X | X | X | X | |||||||||||
| X | X | X | MMSE, Caregiver activity survey | |||||||||||
| X | X | X | NPI nursing home version; CMAI | |||||||||||
| X | X | X | CMAI, NPI‐Agitation | |||||||||||
| X | X | X | CMAI, MMSE, QOL‐AD, incidence of agitation | |||||||||||
| X | X | X | X | CMAI | ||||||||||
| X | X | X | X | |||||||||||
| FLCI, ASHA FACS (caregiver assessment) | ||||||||||||||
| X | DriveABLE On‐Road Test, MMSE | |||||||||||||
| X | X | X | X | Japanese versions.MMSE, FAST, BEHAVE‐AD. ADL scale not stated | ||||||||||
| X | X | X | EQ‐5D, GHQ‐12 | |||||||||||
| X | Final values only, no change scores | |||||||||||||
| X | X | X | MMSE | |||||||||||
| X | X | Japanese versions; Crichton scale | ||||||||||||
| X | X | X | X | |||||||||||
| X | X | X | CDR sum of boxes | |||||||||||
| X | X | X | X | |||||||||||
| X | X | X | X | FAST; ADL modified for severe dementia | ||||||||||
| X | X | X | X | MMSE; ADL scale not stated | ||||||||||
| X | X | X | X | |||||||||||
| X | X | X | X | FAST | ||||||||||
| X | X | MMSE, ADAS‐Cog | ||||||||||||
| X | X | Change in total brain volume, Agitation | ||||||||||||
| Vascular Dementia or dementia syndrome | ||||||||||||||
| X (PGI scale) | X | Physician's Global Impression, Syndrom Kurztest, SCAG; ADL scale not stated | ||||||||||||
| X | X | GBS, Tapping test, Trace test, SCAG; modified ADL | ||||||||||||
| X | X | X (NOSGER) | X (NOSGER) | CGIC, GBS, MMSE, NOSGER subscales for self‐care ADL and disturbing behaviour | ||||||||||
| X | Global assessment of clinical efficacy, NOSIE‐Index, SCAG | |||||||||||||
| X | X | X (NOSGER) | X (NOSGER) | NOSGER subscales for self‐care ADL and disturbing behaviour | ||||||||||
| X | X (BGP | X | D‐scale, AD subgroup also reported | |||||||||||
| Study | Number randomised | Diagnosis | Severity of disease | Mean age | Mean MMSE | % female | duration (weeks) |
| MODERATE‐TO‐SEVERE AD | |||||||
| 432 | AD | moderately severe‐to‐severe | not stated | ˜9.9 | not stated | 24 | |
| 165 | AD Nursing home | moderate‐to‐severe | 85.3 | ˜11.3 | 85 | 24 | |
| 34 | AD agitation | moderate‐to‐severe | 79.6 | 3‐18 | 80 | 12 | |
| 153 | AD agitation | moderate‐to‐severe MMSE < 20 | 84.1 | 7.5 | 72 | 12 | |
| 369 | AD agitation | moderate‐to‐severe | ˜74.9 | 11.9 | ˜58.3 | 24 | |
| 677 | AD | moderate‐to‐severe | 76.5 | 10.8 | 72 | 24 | |
| 265 | AD | moderate | ˜74.9 | 10‐19 | 58 | 12 | |
| 207 | AD | moderate‐to‐severe MMSE 5‐14 | 73.4 | ˜10.3 | 72 | 24 | |
| 295 | AD | moderate‐to‐severe (52% severe 5 to 9) | 77.1 | 9.1 | 65 | 52 | |
| 15 | AD | moderate‐to‐severe | 76.5 | ˜14.5 | 87 | 26 | |
| 250 | AD | MMSE 5‐18 | 72.3 | 11.8 | 60 | 16 | |
| 546 | AD | moderate‐to‐severe | ˜78.5 | ˜10.8 | ˜72.8 | 24 | |
| 252 | AD | moderately severe‐to‐severe | 76.1 | 7.9 | 67 | 28 | |
| 404 | AD | moderate‐to‐severe | 75.5 | 9.9 | 64.8 | 24 | |
| 350 | AD | moderate‐to‐severe | 78.2 | ˜10.1 | 71.4 | 24 | |
| 79 | AD | severe | ˜74.2 | 6.7 | ˜67 | 12 | |
| MILD‐TO‐MODERATE AD | |||||||
| 367 | AD | mild‐to‐moderate MMSE 10‐23 | not stated | 10‐23 | not stated | 24 | |
| 13 | AD | mild‐ to‐moderate | 76 | ˜21 | 38 | 52 | |
| 470 | AD | mild‐to‐moderate 11‐23 | 74 | ˜18.7 | 65 | 26 | |
| 307 and 306 (vit E) | AD | mild‐to‐moderate | ˜79.1 | 20.8 | ˜3 | 5 years | |
| 26 | AD | mild | 79.3 | ˜27.9 | 35 | 52 | |
| 226 | AD | mild‐to‐moderate | ˜72.4 | ˜22.2 | ˜63.7 | 52 | |
| 403 | AD | mild‐to‐moderate | 77.5 | 17.1 | 58.8 | 24 | |
| 432 | AD | mild‐to‐moderate | ˜75.5 | ˜16.8 | ˜52 | 24 | |
| 37 | AD | mild‐to‐moderate | 76.2 | 19.0 | 64 | 52 | |
| 22 | AD | mild‐to‐moderate | ˜65 | ˜12.1 | 64 | 22 | |
| 277 | AD | moderate | 74 | 16.8 | 57 | 52 | |
| Memantine 20 mg or equivalent compared to placebo, with concomitant ChEI, for moderate‐to‐severe AD. 24‐30 week data. OC | ||||||
| Population: Alzheimer's disease, moderate‐to‐severe | ||||||
| Continuous outcomes | Score with placebo (median) | Mean improvement in change score between memantine and placebo | SMD (95% CI) meta‐analysis findings | № of participants | Certainty of the evidence | Comments |
| Clinical Global (CIBIC+) | The median CIBIC+ score was 4.5 3 (i.e. deterioration with time) | MD: 0.21 (0.06 to 0.36) | ‐0.21 (‐0.32 to ‐0.09) | 1125 | ⊕⊕⊕⊝ | Analysed as mean difference. Random effects (Analysis 2.8) [SMD as a negative outcome (Analysis 2.1)] |
| Cognitive Function (SIB) | Mean SIB score at baseline: 77.6. Mean change from baseline (positive scale): ‐1.2 4 (i.e. slight deterioration with time) | MD: 2.48 (1.45 to 3.41) | ‐0.24 (‐0.33 to ‐0.14) | 1852 | ⊕⊕⊕⊕ | SMD as a negative outcome Converted to SIB scale (and scale direction inverted); median SD(pooled) = 10.34. |
| Performance on ADL: (ADCS‐ADL19) | Mean ADCS‐ADL19 score at baseline: 34.3. Mean change from baseline (positive scale): ‐2.2 5 (i.e. deterioration over time) | MD: 0.95 (0.22 to 1.76) | ‐0.13 (‐0.24 to ‐0.03) | 1319 | ⊕⊕⊕⊕ | SMD for decline in ADL as a negative outcome (Analysis 2.3) Converted to ADCS‐ADL19 scale (and scale direction inverted); median SD(pooled) = 7.33. |
| Behaviour and Mood (NPI) 144‐point scale | Median baseline NPI score was 16.5. Median change from baseline (negative scale): 2.80 6 (i.e. deterioration with time) | MD: 2.20 (1.10 to 3.29) | ‐0.18 (‐0.27 to ‐0.09) | 1855 | ⊕⊕⊕⊕ | SMD as a negative outcome (Analysis 2.4) Converted to NPI scale; median SD(pooled) = 12.20 |
| Binary outcomes | Anticipated absolute effects | Relative effect | № of participants | Certainty of the evidence | Comments | |
| Risk with placebo (median) | Risk with memantine | |||||
| All‐cause discontinuation | 168 per 1000 | 156 per 1000 | RR 0.93 | 5087 | ⊕⊕⊕⊕ | RR for all moderate‐to‐severe AD studies (apart from those with agitation) (Analysis 16.5). Median control group risk for 6 studies in 2089 people with moderate‐to‐severe AD without agitation, receiving ChEIs (Analysis 2.9) |
| Difference: 12 fewer people per 1000 discontinued treatment for any cause (95% CI 29 fewer to 7 more) | ||||||
| Number suffering at least one adverse event | 639 per 1000 | 658 per 1000 | RR 1.03 | 8033 5371 events | ⊕⊕⊕⊕ | RR from all studies (Analysis 9.3). Median control group risk for moderate‐to‐severe AD studies in people receiving ChEIs (Analysis 2.11) |
| Difference: 19 more people per 1000 suffered adverse events | ||||||
| Number suffering at least one serious adverse event | 114 per 1000 | 104 per 1000 (93 to 116) | RR 0.91 | 6482 (19 RCTs) 918 events | ⊕⊕⊕⊕ | RR and median control risk from all AD studies (except those with agitation) (from Analysis 8.10) |
| Difference: 10 fewer people per 1000 suffered serious adverse events (95% CI 21 fewer to 2 more) | ||||||
| Number suffering agitation as an adverse event | 45 per 1000 | 41 per 1000 | RR 0.92 | 1225 3 79 events | ⊕⊕⊝⊝ | RR and median control group risk for studies in people with moderate‐to‐severe AD without agitation, receiving ChEIs (Analysis 2.13) |
| Difference: 4 fewer people per 1000 suffered agitation as an adverse event | ||||||
| *The risk in the intervention group (and its 95% confidence interval) is based on the assumed risk in the comparison group and the relative effect of the intervention (and its 95% CI). We adopt the convention that a negative mean difference always means an improvement (i.e. favouring memantine) | ||||||
| GRADE Working Group grades of evidence | ||||||
| 1 Some inconsistency or variation in the point estimates (downgraded once for inconsistency) 2 79 events; imprecision around relative effect (CI crossing 1.25 and 0.75)(downgraded twice) 3 Median control group values for 3 studies reporting CIBIC+ (Grossberg 2008 (MD‐50); Porsteinsson 2008(MD‐12)S; Tariot 2004 (MD‐02)) 4 Mean control group baseline scores and mean control group change from baseline for 2 studies reporting SIB (Grossberg 2008 (MD‐50); Tariot 2004 (MD‐02)) 5 Mean control group baseline scores and mean control group change from baseline for the 2 studies reporting ADCS‐ADL19 (Grossberg 2008 (MD‐50); Tariot 2004 (MD‐02)) 6 Median control group baseline scores and median control group change from baseline for the 5 studies reporting NPI (Dysken 2014 SG; Grossberg 2008 (MD‐50); Howard 2012 (DOMINO‐AD); Porsteinsson 2008(MD‐12)S; Tariot 2004 (MD‐02)) | ||||||
| Memantine 20 mg or equivalent compared to placebo, monotherapy, for moderate‐to‐severe AD. 24‐to 30‐week data observed case (OC) | ||||||
| Population: Alzheimer's disease, moderate‐to‐severe | ||||||
| Outcomes | Score with placebo (median) | Mean improvement in change score between memantine and placebo | SMD (95% CI) meta‐analysis findings | № of participants | Certainty of the evidence | Comments |
| Clinical Global 7‐point Likert scale | The median CIBIC+ score was 4.64 3 (i.e. deterioration with time) | MD: 0.22 (0.11 to 0.33) | ‐0.20 (‐0.30 to ‐0.10) | 1672 | ⊕⊕⊕⊕ | SMD as a negative outcome (Analysis 2.1). Converted to CIBIC+ scale; median SD(pooled) = 1.09. |
| Cognitive Function 100‐point scale | Median SIB score at baseline: 68.3. Median change from baseline (positive scale): ‐5.6 4 (i.e. deterioration with time) | MD: 3.97 (2.77 to | ‐0.33 (‐0.43 to ‐0.23) | 1485 | ⊕⊕⊕⊕ | SMD as a negative outcome (Analysis 2.2) Converted to SIB scale (and scale direction inverted); median SD(pooled) = 12.04. |
| Performance on ADL | Mean ADCS‐ADL19 score at baseline: 30.5. Mean change from baseline (positive scale): ‐4.15 (i.e. deterioration with time) | MD: 1.33 (0.20 to 2.00) | ‐0.20 (‐0.30 to ‐0.09) | 1368 | ⊕⊕⊕⊕ | SMD for decline in ADL as a negative outcome (Analysis 2.3) Converted to ADCS‐ADL19 scale (and scale direction inverted); median SD(pooled) = 6.67. |
| Behaviour and Mood (NPI) 144‐point scale | Median baseline NPI score was 18.5. Median change from baseline (negative scale): 1.95 6 (i.e. slight deterioration with time) | MD: 1.57 (0.16 to 2.98) | ‐0.10 (‐0.19 to ‐0.01) | 1819 | ⊕⊕⊕⊕ | SMD as a negative outcome (Analysis 2.4) Converted to NPI scale; median SD(pooled) = 15.70. |
| Binary outcomes | Anticipated absolute effects | Relative effect | № of participants | Certainty of the evidence | Comments | |
| Risk with placebo (median) | Risk with memantine | |||||
| All‐cause discontinuation | 188 per 1000 | 175 per 1000 | RR 0.93 | 5087 924 events | ⊕⊕⊕⊕ | RR for all studies in people with moderate‐to‐severe AD (apart from those with agitation) (Analysis 16.5). Median control group risk for 10 studies in 2459 people with moderate‐to‐severe AD without agitation, receiving monotherapy (Analysis 2.9) |
| Difference: 13 fewer people per 1000 discontinued treatment for any cause (95% CI 32 fewer to 8 more) | ||||||
| Number suffering at least one adverse event | 760 per 1000 | 783 per 1000 | RR 1.03 | 8033 5371 events | ⊕⊕⊕⊕ | RR from all studies (Analysis 9.3).Median control group risk for moderate‐to‐severe AD studies in people receiving monotherapy (Analysis 2.11) |
| Difference: 23 more people per 1000 suffered adverse events | ||||||
| Number suffering at least one serious adverse event | 114 per 1000 | 104 per 1000 (93 to 116) | RR 0.91 | 6482 (19 RCTs) 918 events | ⊕⊕⊕⊕ | RR and median control risk from all AD studies (except those with agitation) (from Analysis 8.10) |
| Difference: 10 fewer people per 1000 suffered serious adverse events (95% CI 21 fewer to 2 more) | ||||||
| Number suffering agitation as an adverse event | 164 per 1000 | 112 per 1000 | RR 0.68 | 1016 154 events | ⊕⊕⊕⊝ | RR and median control group risk for studies in people with moderate‐to‐severe AD without agitation, receiving monotherapy (Analysis 2.13) |
| Difference: 52 fewer people per 1000 suffered agitation as an adverse event | ||||||
| *The risk in the intervention group (and its 95% confidence interval) is based on the assumed risk in the comparison group and the relative effect of the intervention (and its 95% CI). | ||||||
| GRADE Working Group grades of evidence | ||||||
| 1 Some inconsistency in point estimates, but insufficient to downgrade 2 Some imprecision (193 events and borderline for CI crossing 1; CI crossed 0.75) and some inconsistency in point estimates ‐ downgrade once overall 3 Median control group values for 4 studies reporting CIBIC+ (Bakchine 2008 (99679) SG; Peskind 2004 (MD‐10) SG; Reisberg 2003 (9605); van Dyck 2007 (MD‐01)) 4 Median control group baseline scores and mean control group change from baseline for 3 studies reporting SIB (Reisberg 2003 (9605); van Dyck 2007 (MD‐01); Wang 2013) 5 Mean control group baseline scores and mean control group change from baseline for the 2 studies reporting ADCS‐ADL19 (Reisberg 2003 (9605); van Dyck 2007 (MD‐01)) 6 Median control group baseline scores and median control group change from baseline for the 4 studies reporting NPI (Howard 2012 (DOMINO‐AD); Reisberg 2003 (9605); van Dyck 2007 (MD‐01); Wang 2013) | ||||||
| Memantine 20 mg or equivalent compared to placebo, for moderate‐to‐severe AD, selected for agitation | ||||||
| Population: Alzheimer's disease, moderate‐to‐severe, selected for agitation | ||||||
| Outcomes | Score with placebo (median) | Mean improvement in change score between memantine and placebo | SMD (95% CI) meta‐analysis findings | № of participants | Certainty of the evidence | Comments |
| Clinical Global 7‐point Likert scale | The CIBIC+ score from one study was 4.63 5 (i.e. deterioration with time) | MD: 0.14 (‐0.17 to 0.44) (random effects) 24 week study only: MD: ‐0.05 (‐0.35 to 0.25) (Herrmann 2012 (10158)) | ‐0.11 (‐0.34 to 0.13) (random effects) | 443 24 week study: 275 participants | ⊕⊕⊝⊝ | SMD as a negative outcome (Analysis 3.5). Heterogeneity between 12 weeks (2 studies) and 24 weeks. Converted to CIBIC+ scale; SD(pooled) = 1.29 (Herrmann 2012 (10158)). |
| Cognitive Function 100‐point scale | Mean SIB score at baseline: 68.1. Median change from baseline (positive scale): ‐5.23 6 (i.e. deterioration with time) | MD: 4.34 (‐5.89 to 24 week study only: MD: ‐0.48 (‐2.57 to 1.61) (Herrmann 2012 (10158)) | ‐0.24 (‐0.84 to 0.36) (random effects) | 453 | ⊕⊝⊝⊝ | Analysed as mean difference (Analysis 3.6). [SMD as a negative outcome] |
| Performance on ADL | Mean ADCS‐ADL19 score at baseline: 32.5. Mean change from baseline (positive scale): ‐1.087 (i.e. slight deterioration with time) | MD: ‐1.48 (‐3.15 to 0.19) | 0.21 (‐0.02 to 0.43) | 309 | ⊕⊕⊝⊝ | Analysed as mean difference (Analysis 3.7) [SMD for decline in ADL as a negative outcome] |
| Behaviour and Mood (NPI) 144‐point scale | Median baseline NPI score was 33.3. Median change from baseline (negative scale): ‐8.6 8 (i.e. improvement with time) | MD: 1.51 (‐5.03 to 8.05) (random effects) | ‐0.07 (‐0.41 to 0.27) (random effects) | 470 | ⊕⊝⊝⊝ | Analysed as mean difference (random effects) (Analysis 3.8) [SMD as a negative outcome] |
| Agitation (Cohen Mansfield Agitation Inventory) range 29 ‐ 203 points | Mean baseline CMAI score was 57.7 Mean change from baseline (negative score) was ‐6.19 (i.e. improvement with time) | MD: 0.50 (‐3.71 to 4.71) (random effects) 2 studies in 422 participants | 0.11 (‐0.12 to 0.33) 2 studies in 306 participants | 455 (3 RCTs) | ⊕⊕⊕⊝ | MD and SMD as negative outcomes One study reported final scores (Fox 2012 (MAGD)), so not included in SMD. One study reported CMAI‐C (Forest 2006 (MD‐23)), so not included in MD meta‐analysis |
| Binary outcomes | Anticipated absolute effects | Relative effect | № of participants | Certainty of the evidence | Comments | |
| Risk with placebo (median) | Risk with memantine | |||||
| All‐cause discontinuation | 171 per 1000 | 188 per 1000 | RR 1.10 (0.79 to 1.52) | 555 113 events | ⊕⊕⊕⊝ | RR for all 3 studies in people with moderate‐to‐severe AD selected for agitation (Analysis 3.9). Median control group risk for 3 studies in 555 people with moderate‐to‐severe AD selected for agitation (Analysis 3.9) |
| Difference: 17 more people per 1000 discontinued treatment for any cause (95% CI 36 fewer to 89 more) | ||||||
| Number suffering at least one adverse event | 600 per 1000 | 618 per 1000 | RR 1.03 | 8033 5371 events | ⊕⊕⊕⊕ | RR from all studies (Analysis 9.3).Mean control group risk for 2 moderate‐to‐severe AD studies in people selected for agitation (Analysis 3.11) |
| Difference: 18 more people per 1000 suffered adverse events | ||||||
| *The risk in the intervention group (and its 95% confidence interval) is based on the assumed risk in the comparison group and the relative effect of the intervention (and its 95% CI). | ||||||
| GRADE Working Group grades of evidence | ||||||
| 1 Inconsistency in point estimates between 24 week and 12 week studies (downgrade once); imprecision (crossed null and SMD 0.30) (downgrade once) 2 Inconsistency between 24 week and 12 week studies (I² =90%) (downgrade twice); imprecision (very wide CI crossing SMD +0.30 and ‐0.30 (downgrade twice) 3 Imprecision (crossed null and SMD 0.40) (downgrade once); some inconsistency in point estimates and risk of bias from baseline differences (downgrade once across the two domains) 4 Inconsistency (I² = 62%, P = 0.07) (downgrade once); risk of bias (due to baseline differences) (downgrade once); imprecision (wide CI: SMD crossing ‐0.2 and 0.4) (downgrade twice) 5 Control group value for 1 study reporting CIBIC+ (Herrmann 2012 (10158))) 6 Mean control group baseline scores and mean control group change from baseline for 2 studies reporting SIB (Fox 2012 (MAGD); Herrmann 2012 (10158)) 7 Mean control group baseline scores and mean control group change from baseline for the 2 studies reporting ADCS‐ADL19 (Forest 2006 (MD‐23); Herrmann 2012 (10158)) 8 Median control group baseline scores and median control group change from baseline for the 3 studies reporting NPI (Forest 2006 (MD‐23); Fox 2012 (MAGD); Herrmann 2012 (10158)) 9 Mean control group baseline scores and mean control group change from baseline for the 2 studies reporting CMAI (Fox 2012 (MAGD); Herrmann 2012 (10158)) 10 Some inconsistency for two studies reporting CMAI and some imprecision (SMD crossing 0.3 and null) (downgrade once overall) 11 Imprecision (113 events) (downgrade once) | ||||||
| Memantine 20 mg compared to placebo for mild AD (MMSE 20‐23) observed case (OC) ‐ six‐month studies for dementia | ||||||
| Population: mild Alzheimer's disease | ||||||
| Continuous outcomes | Score with placebo | Mean improvement in change score between memantine and placebo | SMD (95% CI) meta‐analysis findings | № of participants | Certainty of the evidence | Comments |
| Clinical Global (CIBIC+) | Median CIBIC+ score | MD: 0.09 (‐0.12 to 0.30) | ‐0.08 (‐0.27 to 0.12) | 427 | ⊕⊕⊝⊝ | Analysed as mean difference (Analysis 4.1). [SMD as a negative outcome (Analysis 16.1)] |
| Cognitive function (ADAS‐Cog) | Baseline ADAS‐Cog scores not reported. Median change from baseline in ADAS‐Cog score (negative scale): ‐1.7 6 (i.e. improvement with time) | MD: 0.21 (‐0.95 to 1.38) | ‐0.03 (‐0.19 to 0.13) | 619 | ⊕⊕⊕⊝ | Analysed as mean difference (Analysis 4.2). [SMD as a negative outcome (Analysis 16.2).] |
| Performance on ADL (ADCS‐ADL23) | Baseline ADL scores not reported. Median change from | MD: ‐0.07 (‐1.80 to 1.66) | 0.02 (‐0.14 to 0.18) | 621 | ⊕⊕⊕⊝ | Analysed as mean difference for decline in ADL (Analysis 4.3). [SMD as a negative outcome (Analysis 16.3)] Direction of scale reversed for ADL outcome. |
| Behaviour and mood: (NPI) | Baseline NPI scores not reported. Median change from baseline in NPI was ‐2.4 (i.e. slight improvement with time) 8 | MD: ‐0.29 (‐2.16 to 1.58) | 0.02 (‐0.14 to 0.18) | 621 | ⊕⊕⊕⊝ | Analysed as mean difference. [SMD as a negative outcome (Analysis 16.4)]. |
| Binary outcomes | Anticipated absolute effects | Relative effect | № of participants | Certainty of the evidence | Comments | |
| Risk with placebo (median) | Risk with memantine | |||||
| All‐cause discontinuation | 100 per 1000 | 174 per 1000 | RR 1.74 | 528 72 events | ⊕⊝⊝⊝ | RR and median control group risk for mild AD studies (Analysis 16.5) |
| Difference: 74 more people per 1000 discontinued treatment for any cause (95% CI 8 to 181 more) | ||||||
| Number suffering at least one adverse event | 429 per 1000 | 442 per 1000 | RR 1.03 | 8033 5371 events | ⊕⊕⊕⊕ | RR from all studies (Analysis 9.3).Control group risk taken from Holland 2013 study |
| Difference: 13 more people per 1000 suffered adverse events | ||||||
| Number suffering at least one serious adverse event | 114 per 1000 | 104 per 1000 (93 to 116) | RR 0.91 | 6482 (19 RCTs) 918 events | ⊕⊕⊕⊕ | RR and median control risk from all AD studies (except those with agitation) (from Analysis 8.10) |
| Difference: 10 fewer people per 1000 suffered serious adverse events (95% CI 21 fewer to 2 more) | ||||||
| Number suffering agitation as an adverse event | Outcome not reported by any study | 0 RCTs | ||||
| *The risk in the intervention group (and its 95% confidence interval) is based on the assumed risk in the comparison group and the relative effect of the intervention (and its 95% CI). | ||||||
| GRADE Working Group grades of evidence | ||||||
| 1 All studies are post‐hoc subgroups (downgrade once on risk of bias); imprecision ‐ 427 patients and SMD estimate crosses null and is consistent with appreciable benefit and no benefit (downgrade once) 2 All studies are post‐hoc subgroups (downgrade once on risk of bias) 3 All studies are post‐hoc subgroups (downgrade once on risk of bias) and some inconsistency in the point estimates (but not sufficient to downgrade) 4 Majority of the information from post‐hoc subgroups (downgrade once on risk of bias); imprecision: 72 events, and CI crossed 1.25 (downgrade once); inconsistency (I² = 49%) downgrade once 5 Median control group values for 3 studies reporting CIBIC+ (Bakchine 2008 (99679) SG; Peskind 2004 (MD‐10) SG; Porsteinsson 2008(MD‐12)S) 6 Median control group change from baseline for 4 studies reporting ADAS‐Cog (Bakchine 2008 (99679) SG; Dysken 2014 SG; Peskind 2004 (MD‐10) SG; Porsteinsson 2008(MD‐12)S) 7 Median control group change from baseline for the 4 studies reporting ADCS‐ADL23 (Bakchine 2008 (99679) SG; Dysken 2014 SG; Peskind 2004 (MD‐10) SG; Porsteinsson 2008(MD‐12)S) 8 Median control group change from baseline for the 4 studies reporting NPI (Bakchine 2008 (99679) SG; Dysken 2014 SG; Peskind 2004 (MD‐10) SG; Porsteinsson 2008(MD‐12)S) | ||||||
| Memantine compared to placebo for Parkinson's disease dementia (PDD) and Dementia with Lewy Bodies (DLB) | ||||||
| Population: Parkinson's disease dementia (PDD) and dementia with Lewy bodies (DLB) | ||||||
| Continuous outcomes | Score with placebo (median) | Mean improvement in change score between memantine and placebo | SMD (95% CI) meta‐analysis findings | № of participants | Certainty of the evidence | Comments |
| Clinical Global (CIBIC+) 7‐point Likert scale | CIBIC+ score from 1 study was 4.1 (i.e. no change) | MD: 0.49 (0.13 to 0.83) | ‐0.35 (‐0.60 to ‐0.09) | 243 | ⊕⊕⊝⊝ | SMD as a negative outcome Back transformed to CIBIC+ scale using SD(pooled) = 1.39 (from 1 study (Marsh 2009 PDD)). |
| Cognitive Function: (MMSE) 30‐point scale | MMSE score: 20.0 (at 24 weeks). Change from baseline (positive scale): ‐0.5 (i.e. slight deterioration with time) (one study) | MD: 1.9 (0.07 to 3.73) | ‐0.50(‐1.00 to 0.00) | 63 | ⊕⊝⊝⊝ | One study at 24 weeks and one at 16 weeks only for this outcome; highly heterogeneous. So 24 week study reported only (Aarsland 2009). MMSE scale direction was reversed (Analysis 6.2) |
| Performance on ADL (ADCS‐ADL23) 78‐point scale | ADCS‐ADL23 score at baseline: 48 Change from baseline (positive scale): ‐0.1 (i.e. no change with time) (one study) | MD: 3.07 (‐1.25 to 7.4) | ‐0.27 (‐0.67 to 0.07) | 243 | ⊕⊝⊝⊝ | SMD decline in ADL as a negative outcome (Analysis 6.3). Random effects. Back transformed to ADCS‐ADL23 scale, using results from one study (Emre 2010 (11018)). SD(pooled) = 11.38. |
| Behaviour and Mood (NPI) 144‐point scale | Median NPI score at baseline: 13.0 Median change from baseline (negative scale): 1.4 | MD: 2.18 (‐1.21 to 5.57) | ‐0.18 (‐0.43 to 0.07) | 242 | ⊕⊕⊝⊝ | Random effects. Analysed as mean difference (Analysis 6.4). [SMD as a negative outcome (Analysis 8.4)] |
| Binary outcomes | Anticipated absolute effects | Relative effect | № of participants | Certainty of the evidence | Comments | |
| Risk with placebo (median) | Risk with memantine | |||||
| All‐cause discontinuation | 201 per 1000 | 169 per 1000 | RR 0.84 | 312 64 events | ⊕⊕⊝⊝ | RR and control group risk from PDD or DLB studies (Analysis 6.5) |
| Difference: 32 fewer people per 1000 discontinued treatment for any cause | ||||||
| Number suffering at least one adverse event | 500 per 1000 | 515 per 1000 | RR 1.03 | 8033 5371 events | ⊕⊕⊕⊕ | RR from all studies (Analysis 9.3). Median control group risk for PDD or DLB studies (Analysis 6.7). |
| Difference: 15 more people per 1000 suffered adverse events | ||||||
| Number suffering at least one serious adverse event | 86 per 1000 | 123 per 1000 (59 to 255) | RR 1.43 | 220 (2 RCTs) 26 events | ⊕⊕⊝⊝ | RR and control group risk from PDD or DLB studies (Analysis 8.10) |
| Difference: 37 more people per 1000 suffered serious adverse events (95% CI 27 fewer to 169 more) | ||||||
| Number suffering agitation as an adverse event | Outcome not reported for either study | 0 RCTs | ||||
| *The risk in the intervention group (and its 95% confidence interval) is based on the assumed risk in the comparison group and the relative effect of the intervention (and its 95% CI). | ||||||
| GRADE Working Group grades of evidence | ||||||
| 1 Majority of the information at high risk of bias and number of patients estimated (downgrade once); imprecision ‐ 243 patients (below optimal information size) (downgrade once) 2 Reporting bias (2 larger studies did not report outcome) and high risk of bias for remaining study (downgrade once), inconsistency with 16 weeks study high (I² = 75%) (downgrade once), imprecision (only 63 patients, wide CI) (downgrade once) 3 Majority of information at high risk of bias (downgrade once), inconsistency in point estimates (I² = 40%) (downgrade once) and imprecision (243 participants and CI crossed null and consistent with both benefit and no difference) (downgrade once) 4 Majority of information at high risk of bias (downgrade once), some inconsistency in point estimates (I² = 20%) (not downgraded) and imprecision (243 patients; CI crossed null and included benefit and no difference) (downgrade once) 5 Imprecision: CI crossed both 1.25 and 0.75, and CI fairly wide around absolute effect (downgrade twice) | ||||||
| Memantine compared to placebo for Frontotemporal dementia (FTD) | ||||||
| Population: frontotemporal dementia | ||||||
| Continuous outcomes | Score with placebo (median) | Mean improvement in change score between memantine and placebo | SMD (95% CI) meta‐analysis findings | № of participants | Certainty of the evidence | Comments |
| Clinical Global (CGIC) 7‐point Likert scale | CGIC score from 1 study was 4.8 (i.e. deterioration with time) | MD: 0.56 (‐0.11 to 1.21) | ‐0.31 (‐0.67 to 0.06) | 117 | ⊕⊕⊝⊝ | SMD as a negative outcome Back transformed to CGIC scale using SD (pooled) = 1.80 (from 1 study (Boxer 2013). |
| Cognitive Function: (MMSE) 30‐point scale | MMSE score: 25.1 (at 26 weeks). Change from baseline (positive scale): ‐0.9 (i.e. deterioration with time) (one study) | MD ‐0.30 (‐1.83 to 1.23) | 0.09 (‐0.35 to 0.52) | 81 | ⊕⊝⊝⊝ | One study at 6 months and one at 12 months for this outcome; some heterogeneity so 6‐month study reported only (Boxer 2013) (Analysis 7.2). MMSE scale direction was reversed. |
| Performance on ADL % DAD score = yes at 12 months | Baseline score: 58.3%. Change from baseline (positive scale): ‐19.5% (i.e. deterioration) (one study) | MD: 12.10% (‐1.40 to 25.60) | ‐ | 39 | ⊕⊝⊝⊝ | Decline in ADL not reported in either study. Percentage with DAD score = yes reported in Vercelletto 2011 at 12 months. |
| Behaviour and Mood (NPI) 144‐point scale | NPI score at baseline: 21.5. Change from baseline (negative scale): 0.3 | MD: 3.16 (‐3.61 to 8.01) | ‐0.17 (‐0.62 to 0.28) | 115 | ⊕⊕⊝⊝ | Analysed as mean difference (Analysis 7.3). Baseline score and change from baseline for 26‐week study (Boxer 2013). [SMD as a negative outcome (Analysis 8.4)] |
| Binary outcomes | Anticipated absolute effects | Relative effect (95% CI) | № of participants | Certainty of the evidence | Comments | |
| Risk with placebo (median) | Risk with memantine | |||||
| All‐cause discontinuation | 71 per 1000 | 109 per 1000 | RR 1.54 (0.54 to 4.06) | 133 15 events | ⊕⊕⊝⊝ | RR from FTD studies; control group risk from 26 week study (Analysis 7.4) |
| Difference: 38 more people per 1000 discontinued treatment for any cause (95% CI 33 fewer to 217 more) | ||||||
| Number suffering at least one adverse event | 667 per 1000 | 687 per 1000 | RR 1.03 | 8033 5371 events | ⊕⊕⊕⊕ | RR from all studies (Analysis 9.3).Control group risk for 26‐week FTD study |
| Difference: 20 more people per 1000 | ||||||
| Number suffering at least one severe adverse event | 48 per 1000 | 34 per 1000 (14 to 80) | RR 0.71 | 133 (2 RCTs) 17 events | ⊕⊕⊝⊝ | RR and control group risk from FTD study at 26 weeks (Analysis 8.10) |
| Difference: 14 fewer people per 1000 | ||||||
| Number suffering agitation as an adverse event | 48 per 1000 | 10 per 1000 (0.5 to 208) | RR 0.21 | 81 (1 RCT) | ⊕⊝⊝⊝ | RR and control group risk from FTD study at 26 weeks (Analysis 7.8) |
| Difference: 38 fewer people per 1000 | ||||||
| *The risk in the intervention group (and its 95% confidence interval) is based on the assumed risk in the comparison group and the relative effect of the intervention (and its 95% CI). | ||||||
| GRADE Working Group grades of evidence | ||||||
| 1 Majority of the information at high risk of bias (downgrade once); imprecision ‐ 117 patients (below optimal information size) (downgrade once) 2 Inconsistency in point estimates (I² = 23%) (downgrade once) and Imprecision (122 patients and wide confidence interval) (downgrade twice) 3 Imprecision (39 participants and CI crossed null and consistent with both benefit and no difference) (downgrade twice); indirect outcome (percentage DAD score at 12 months) and borderline high risk of bias (differential missing data) (downgrade once) 4 Some inconsistency in point estimates and Imprecision (122 patients and wide confidence interval) (downgrade twice overall) 5 Inconsistency in point estimates (downgrade once); Imprecision: 15 events and CI crossed both 1.25 and 0.75 (downgrade twice) 6 Imprecision: 17 events and wide CI (downgrade twice) 7 Imprecision: 2 events and very wide CI (downgrade twice): high risk of bias ‐ number discontinuing treatment greater than number of events (downgrade twice) | ||||||
| Number of Studies | Number of Participants | Standardised Effect Estimate | Heterogeneity (I²) | Test for | |||||||||
| Domain | All | with ChEI | no ChEI | All | with ChEI | no ChEI | All | with ChEI | no ChEI | All | with ChEI | no ChEI | |
| Clinical Global | 10 | 3 | 7 | 2797 | 1125 | 1672 | ‐0.20 | ‐0.21 (‐0.32 to ‐0.09) | ‐0.20 (‐0.30 to ‐0.10) | 0% | 13% | 0% | I² = 0%, P = 0.99 |
| Cognitive Function | 14 | 6 | 8 | 3337 | 1852 | 1485 | ‐0.28 (‐0.35 to ‐0.21) | ‐0.24 (‐0.33 to ‐0.14) | ‐0.33 (‐0.43 to ‐0.23) | 33% | 13% | 41% | I² = 44%, P = 0.18 |
| Decline in Living (Analysis 2.3) | 12 | 5 | 7 | 2687 | 1319 | 1368 | ‐0.17 (‐0.24 to ‐0.09) | ‐0.13 (‐0.24 to ‐0.03) | ‐0.20 (‐0.30 to ‐0.09) | 0% | 0% | 10% | I² = 0%, P = 0.43 |
| Behaviour and Mood | 15 | 6 | 9 | 3674 | 1855 | 1819 | ‐0.14 (‐0.21 to ‐0.08) | ‐0.18 (‐0.27 to ‐0.09) | ‐0.10 (‐0.19 to ‐0.01) | 6% | 10% | 0% | I² = 35%, P = 0.21 |
| All‐cause discontinuation | 15 | 6 | 10 | 4548 | 2089 | 2459 | RR 0.93 (0.82 to 1.05) | RR 0.94 (0.78 to 1.13) | RR 0.92 (0.78 to 1.08) | 9% | 61% | 0% | I² = 0%, P = 0.83 |
| Adverse events | 9 | 3 | 6 | 3390 | 1625 | 1765 | RR 1.02 (0.98 to 1.06) | RR 1.05 (0.98 to 1.12) | RR 0.99 (0.94 to 1.04) | 23% | 13% | 0% | I² = 46%, P = 0.17 |
| Agitation as an adverse event | 10 | 5 | 6 | 3854 | 1965 | 1889 | RR 0.79 (0.64 to 0.97) | RR 0.93 (0.65 to 1.31) | RR 0.72 (0.55 to 0.93) | 0% | 0% | 15% | I² = 25.1%, P = 0.25 |
| Six studies were conducted on patients with moderate‐to‐severe disease receiving ChEI therapy, these were: Dysken 2014: patients were on ongoing ChEI therapy with any ChEI (donepezil, rivastigmine or galantamine), as maintenance dosage for at least 4 weeks Grossberg 2008 (MD‐50): patients were on ongoing ChEI therapy with a stable dose of any ChEI for 3 months or longer, patients must remain on the same dose throughout the study. Howard 2012 (DOMINO‐AD): patients were on ongoing ChEI therapy with donepezil for at least 3 months and had received a dose of 10 mg for at least the previous Nakamura 2016: patients had been on donepezil for at least four weeks when recruited and then had 12 weeks single blind observation period on donepezil. Only those stable continued to the double blind period. Porsteinsson 2008 (MD‐12): patients were on ongoing ChEI therapy with any ChEI for 6 months or longer, and a stable dosing regimen for 3 months or longer (donepezil 5‐10 mg/day; rivastigmine 6, 9 or 12 mg/day; galantamine 16 or 24 mg/day) Tariot 2004 (MD‐02): patients were on ongoing ChEI therapy with donepezil for more than 6 months before entry into the trial and at a stable dose (5‐10mg/day) for at least 3 months. | |||||||||||||
| Patients not selected for agitation (with moderate‐to‐severe AD) | Patients selected for agitation | |||||
| With / without ChEI | No ChEI | With ChEI | With / without ChEI, mainly with | With ChEI | With / without ChEI ‐ | |
| Clinical global (SMD) | ‐0.20 (‐0.28 to ‐0.13) n = 10 studies; 2797 patients I² = 0%, P = 0.86 | ‐0.20 (‐0.30 to ‐0.10) n = 7; 1672 patients I² = 0%, P = 0.88 | ‐0.21 (‐0.32 to ‐0.09) n = 3; 1125 patients I² = 13%, P = 0.32 | ‐0.11 (‐0.34 to 0.13) n = 3; 443 patients I² = 25%, P = 0.26 | 0.04 (‐0.20 to 0.28) n = 1; 324 patients | ‐0.28 (‐0.59 to 0.02) n = 2; 168 patients I² = 0%, P = 0.96 |
| Cognitive function (SMD) | ‐0.28 (‐0.35 to ‐0.21) n = 13; 3337 patients I² = 30%, P = 0.14 | ‐0.33 (‐0.43 to ‐0.23) n = 8; 1485 patients I² = 41%, P = 0.11 | ‐0.24 (‐0.33 to ‐0.14) n = 6; 1852 patients I² = 13%, P = 0.33 | Not pooled I² = 90%, P = 0.002 | 0.05 (‐0.17 to 0.27) n = 1, 324 patients | ‐0.56 (‐0.92 to ‐0.21) n = 1; 129 patients (with ˜20% ChEI) |
| Decline in ADL (SMD) | ‐0.17 (‐0.24 to ‐0.09) n = 11; 2687 patients I² = 0%, P = 0.582 | ‐0.20 (‐0.30 to ‐0.09) n = 7; 1368 patients I² = 10%, P = 0.36 | ‐0.13 (‐0.24 to ‐0.03) n = 5; 1319 patients I² = 0%, P = 0.69 | 0.21 (‐0.02 to 0.43) n = 2; 309 patients I² = 0%, P = 0.40 | 0.23 (‐0.01 to 0.47) n = 1; 276 patients | ‐0.02 (‐0.70 to 0.67) n = 1; 33 patients (with ChEI) |
| Behaviour and mood (SMD) | ‐0.14 (‐0.21 to ‐0.08) n = 14; 3674 patients I² =6%, P = 0.39 | ‐0.10 (‐0.19 to ‐0.01) n = 9; 1819 patients I² = 0%, P = 0.46 | ‐0.18 (‐0.27 to ‐0.09) n = 6; 1855 patients I² = 10%, P = 0.35 | ‐0.07 (‐0.41 to 0.27) n = 3; 470 patients I² = 62%, P = 0.07 | 0.08 (‐0.14 to 0.30) n = 1; 324 patients | ‐0.20 (‐0.69 to 0.29) n = 2; 146 patients I² = 43%, P = 0.19 |
| CMAI (SMD) | ‐0.21 (‐0.45 to 0.04) n = 1; 261 patients | 0.11 (‐0.12 to 0.33) n = 2; 306 patients I² = 0%, P = 0.77 | 0.10 (‐0.14 to 0.33) n = 1; 273 patients | CMAI (final values): SMD: ‐0.19 (‐0.52 to 0.13) CMAI (community): SMD: 0.21 (‐0.48 to 0.89) n = 1; 33 patients | ||
| Proportion with agitation (RR) | 0.76 (0.601 to 0.96) 6 studies; 2 241 patients I² = 0%, P = 0.67 | 0.68 (0.51, 0.91) 4 studies; 1016 patients I² = 0%, P = 0.59 | 0.92 (0.54 to 1.31) 3 studies; 1225 patients I² = 0% and 0.85 | RR 2.39 (1.04 to 5.50) 2 studies; 403 patients I² = 0%, P = 0.60 | 2.20 (0.92 to 5.27) 1 study; 369 patients | 5.00 (0.26 to 97.00) 1 study; 34 patients (with ChEI) |
| Adverse event | Number of studies (participants) | RR (95% CI) | Heterogeneity (I²) | GRADE rating |
| Insomnia (Analysis 9.6) | 19 (5354), 221 events | 0.93 (0.73 to 1.20) | I² = 14%, P = 0.29 | LOW (downgraded on imprecision and reporting bias < 70% patients had AE data) |
| Confusion (Analysis 9.7) | 13 (4509), 167 events | 1.23 (0.91 to 1.65) | I² = 0%, P = 0.51 | LOW (downgraded on imprecision and reporting bias < 70% patients had AE data) |
| Depression (Analysis 9.8) | 10 (3052), 83 events | 1.06 (0.70 to 1.60) | I² = 0%, P = 0.60 | VERY LOW (downgraded on imprecision (twice), inconsistency in point estimates (once) and reporting bias <40% patients had AE data (twice)) |
| Headache (Analysis 9.9) | 16 (4889), 240 events | 1.29 (1.00 to 1.66) | I² = 9%,P = 0.36 | LOW (downgraded on imprecision (once) and reporting bias <70% patients had AE data) |
| Hypertension (Analysis 9.10) | 8 (3175), 87 events | 1.76 (1.14 to 2.70) | I² = 1%, P = 0.42 | VERY LOW (downgraded on imprecision (twice), inconsistency in point estimates (once) and reporting bias <40% patients had AE data (twice)) |
| Dizziness (Analysis 9.11) | 19 (6395), 323 events | 1.59 (1.28 to 1.98) | I² = 0%, P = 0.49 | MODERATE (downgraded on inconsistency in point estimates) |
| Falls (Analysis 9.12) | 20 (6743), 589 events | 0.98 (0.84 to 1.13) | I² = 0%, P = 0.84 | HIGH |
| Accidental injury (Analysis 9.13) | 10 (3813), 214 events | 0.81 (0.62 to 1.05) | I² = 0%, P = 0.81 | VERY LOW (downgraded on imprecision (once) and twice on reporting bias (< 50% patients and 1 in 4 studies) |
| Urinary incontinence (Analysis 9.14) | 8 (2724), 76 events | 1.12 (0.73 to 1.72) | I² = 0%, P = 0.83 | VERY LOW (downgraded on imprecision (twice), inconsistency in point estimates (once) and reporting bias <4 0% patients had AE data (twice)) |
| Diarrhoea (Analysis 9.15) | 18 (6186), 318 events | 0.82 (0.66 to 1.02) | I² = 0%, P = 0.58 | LOW (downgraded on imprecision (once), some inconsistency in point estimates and reporting bias <70% patients had AE data (once further)) |
| Influenza‐like symptoms (Analysis 9.16) | 7 (2836), 129 events | 1.21 (0.87 to 1.70) | I² = 0%, P = 0.97 | VERY LOW (downgraded on imprecision (once), and reporting bias < 40% patients and 1/6 studies had AE data (twice)) |
| Outcome or subgroup title | No. of studies | No. of participants | Statistical method | Effect size |
| 1 Clinical Global Show forest plot | 13 | 3079 | Std. Mean Difference (IV, Fixed, 95% CI) | ‐0.20 [‐0.28, ‐0.13] |
| 2 Cognitive Function Show forest plot | 14 | 3600 | Std. Mean Difference (IV, Fixed, 95% CI) | ‐0.27 [‐0.34, ‐0.21] |
| 3 Decline in ADL Show forest plot | 13 | 3077 | Std. Mean Difference (IV, Fixed, 95% CI) | ‐0.16 [‐0.24, ‐0.09] |
| 4 Behaviour and Mood Show forest plot | 14 | 3674 | Std. Mean Difference (IV, Fixed, 95% CI) | ‐0.14 [‐0.21, ‐0.08] |
| 5 All‐cause discontinuation Show forest plot | 16 | 4661 | Risk Ratio (M‐H, Fixed, 95% CI) | 0.93 [0.82, 1.05] |
| 6 Discontinuations due to adverse events Show forest plot | 16 | 4661 | Risk Ratio (M‐H, Fixed, 95% CI) | 0.94 [0.79, 1.13] |
| 7 Number suffering at least one adverse event Show forest plot | 17 | 4708 | Risk Ratio (M‐H, Fixed, 95% CI) | 1.02 [0.97, 1.06] |
| 8 Number suffering serious adverse events Show forest plot | 16 | 4449 | Risk Ratio (M‐H, Fixed, 95% CI) | 0.90 [0.75, 1.07] |
| 9 Number suffering agitation as an adverse event Show forest plot | 15 | 3904 | Risk Ratio (M‐H, Fixed, 95% CI) | 0.76 [0.60, 0.96] |
| Outcome or subgroup title | No. of studies | No. of participants | Statistical method | Effect size |
| 1 Clinical Global: subgroup analysis by +/‐ ChEI Show forest plot | 13 | 3079 | Std. Mean Difference (IV, Fixed, 95% CI) | ‐0.20 [‐0.28, ‐0.13] |
| 1.1 Monotherapy | 9 | 1760 | Std. Mean Difference (IV, Fixed, 95% CI) | ‐0.20 [‐0.30, ‐0.10] |
| 1.2 With concomitant cholinesterase inhibitors | 5 | 1319 | Std. Mean Difference (IV, Fixed, 95% CI) | ‐0.21 [‐0.32, ‐0.09] |
| 2 Cognitive Function subgroup analysis by +/‐ ChEI Show forest plot | 14 | 3600 | Std. Mean Difference (IV, Fixed, 95% CI) | ‐0.28 [‐0.35, ‐0.21] |
| 2.1 Monotherapy | 9 | 1748 | Std. Mean Difference (IV, Fixed, 95% CI) | ‐0.33 [‐0.43, ‐0.23] |
| 2.2 With concomitant cholinesterase inhibitors | 6 | 1852 | Std. Mean Difference (IV, Fixed, 95% CI) | ‐0.24 [‐0.33, ‐0.14] |
| 3 Decline in ADL: subgroup analysis by +/‐ ChEI Show forest plot | 13 | 3077 | Std. Mean Difference (IV, Fixed, 95% CI) | ‐0.17 [‐0.24, ‐0.09] |
| 3.1 Monotherapy | 9 | 1758 | Std. Mean Difference (IV, Fixed, 95% CI) | ‐0.20 [‐0.30, ‐0.09] |
| 3.2 With concomitant cholinesterase inhibitors | 5 | 1319 | Std. Mean Difference (IV, Fixed, 95% CI) | ‐0.13 [‐0.24, ‐0.03] |
| 4 Behaviour and Mood: subgroup analysis by +/‐ ChEI Show forest plot | 14 | 3674 | Std. Mean Difference (IV, Fixed, 95% CI) | ‐0.14 [‐0.21, ‐0.08] |
| 4.1 Monotherapy | 9 | 1819 | Std. Mean Difference (IV, Fixed, 95% CI) | ‐0.10 [‐0.19, ‐0.01] |
| 4.2 With concomitant cholinesterase inhibitors | 6 | 1855 | Std. Mean Difference (IV, Fixed, 95% CI) | ‐0.18 [‐0.27, ‐0.09] |
| 5 Cognitive function (sMMSE):subgroup analysis within randomised study ‐ per protocol Show forest plot | 1 | 143 | Mean Difference (IV, Fixed, 95% CI) | ‐1.35 [‐2.39, ‐0.31] |
| 5.1 Monotherapy | 1 | 62 | Mean Difference (IV, Fixed, 95% CI) | ‐2.11 [‐3.74, ‐0.48] |
| 5.2 With concomitant cholinesterase inhibitor | 1 | 81 | Mean Difference (IV, Fixed, 95% CI) | ‐0.82 [‐2.18, 0.54] |
| 6 Decline in ADL (BADL): subgroup analysis within randomised study ‐ per protocol Show forest plot | 1 | Mean Difference (IV, Fixed, 95% CI) | Subtotals only | |
| 6.1 Monotherapy | 1 | 62 | Mean Difference (IV, Fixed, 95% CI) | ‐2.46 [‐6.45, 1.53] |
| 6.2 With concomitant cholinesterase inhibitor | 1 | 81 | Mean Difference (IV, Fixed, 95% CI) | ‐0.59 [‐3.21, 2.03] |
| 7 NPI: subgroup analysis within randomised study ‐ per protocol Show forest plot | 1 | Mean Difference (IV, Fixed, 95% CI) | Subtotals only | |
| 7.1 Monotherapy | 1 | 62 | Mean Difference (IV, Fixed, 95% CI) | ‐4.23 [‐14.08, 5.62] |
| 7.2 With concomitant cholinesterase inhibitor | 1 | 81 | Mean Difference (IV, Fixed, 95% CI) | ‐6.99 [‐13.13, ‐0.85] |
| 8 Clinical Global: CIBIC+ mean difference; ChEI subgroup Show forest plot | 4 | 1238 | Std. Mean Difference (IV, Random, 95% CI) | ‐0.20 [‐0.33, ‐0.08] |
| 9 All‐cause discontinuation ‐ by ChEI Show forest plot | 16 | 4661 | Risk Ratio (M‐H, Fixed, 95% CI) | 0.93 [0.82, 1.05] |
| 9.1 Monotherapy | 10 | 2459 | Risk Ratio (M‐H, Fixed, 95% CI) | 0.92 [0.78, 1.08] |
| 9.2 with concomitant ChEI | 7 | 2202 | Risk Ratio (M‐H, Fixed, 95% CI) | 0.94 [0.78, 1.13] |
| 10 Discontinuations due to adverse events ‐ by ChEI Show forest plot | 16 | 4661 | Risk Ratio (M‐H, Fixed, 95% CI) | 0.94 [0.79, 1.13] |
| 10.1 Monotherapy | 10 | 2459 | Risk Ratio (M‐H, Fixed, 95% CI) | 0.91 [0.72, 1.15] |
| 10.2 With concomitant ChEI | 7 | 2202 | Risk Ratio (M‐H, Fixed, 95% CI) | 0.99 [0.75, 1.30] |
| 11 Adverse events ‐ by ChEI Show forest plot | 13 | 4324 | Risk Ratio (M‐H, Fixed, 95% CI) | 1.02 [0.98, 1.06] |
| 11.1 Monotherapy | 8 | 2284 | Risk Ratio (M‐H, Fixed, 95% CI) | 0.99 [0.94, 1.04] |
| 11.2 with concomitant ChEI | 5 | 2040 | Risk Ratio (M‐H, Fixed, 95% CI) | 1.05 [0.98, 1.12] |
| 12 Serious adverse events ‐ by ChEI Show forest plot | 15 | 5672 | Risk Ratio (M‐H, Fixed, 95% CI) | 0.94 [0.83, 1.06] |
| 12.1 Monotherapy | 10 | 3161 | Risk Ratio (M‐H, Fixed, 95% CI) | 0.90 [0.74, 1.08] |
| 12.2 With concomitant ChEI | 6 | 2511 | Risk Ratio (M‐H, Fixed, 95% CI) | 0.98 [0.83, 1.15] |
| 13 Number suffering agitation as an adverse event ‐ by ChEI Show forest plot | 10 | 3175 | Risk Ratio (M‐H, Fixed, 95% CI) | 0.76 [0.60, 0.96] |
| 13.1 Monotherapy | 6 | 1535 | Risk Ratio (M‐H, Fixed, 95% CI) | 0.68 [0.51, 0.91] |
| 13.2 with concomitant ChEI | 5 | 1640 | Risk Ratio (M‐H, Fixed, 95% CI) | 0.92 [0.60, 1.40] |
| 14 Memantine + donepezil vs memantine + placebo Show forest plot | 1 | Mean Difference (IV, Fixed, 95% CI) | Totals not selected | |
| 14.1 Cognitive function (sMMSE) | 1 | Mean Difference (IV, Fixed, 95% CI) | 0.0 [0.0, 0.0] | |
| 14.2 Decline in ADL (BADLS scale) | 1 | Mean Difference (IV, Fixed, 95% CI) | 0.0 [0.0, 0.0] | |
| 14.3 Behaviour and mood (NPI) | 1 | Mean Difference (IV, Fixed, 95% CI) | 0.0 [0.0, 0.0] | |
| Outcome or subgroup title | No. of studies | No. of participants | Statistical method | Effect size |
| 1 Cohen Mansfield Agitation Inventory (MD) Show forest plot | 2 | 422 | Mean Difference (IV, Random, 95% CI) | ‐0.50 [‐4.71, 3.71] |
| 1.1 12 weeks | 1 | 149 | Mean Difference (IV, Random, 95% CI) | ‐3.80 [‐10.06, 2.46] |
| 1.2 24 weeks | 1 | 273 | Mean Difference (IV, Random, 95% CI) | 0.90 [‐1.29, 3.09] |
| 2 Cohen Mansfield Agitation Inventory (SMD) Show forest plot | 2 | 306 | Std. Mean Difference (IV, Random, 95% CI) | 0.11 [‐0.12, 0.33] |
| 2.1 12 weeks | 1 | 33 | Std. Mean Difference (IV, Random, 95% CI) | 0.21 [‐0.48, 0.89] |
| 2.2 24 weeks | 1 | 273 | Std. Mean Difference (IV, Random, 95% CI) | 0.10 [‐0.14, 0.33] |
| 3 NPI agitation subscale Show forest plot | 3 | Mean Difference (IV, Random, 95% CI) | Subtotals only | |
| 3.1 12 weeks | 2 | 146 | Mean Difference (IV, Random, 95% CI) | ‐0.39 [‐1.90, 1.13] |
| 3.2 24 weeks | 1 | 324 | Mean Difference (IV, Random, 95% CI) | 0.0 [0.0, 0.0] |
| 4 Number suffering agitation Show forest plot | 3 | 556 | Risk Ratio (M‐H, Fixed, 95% CI) | 2.39 [1.04, 5.50] |
| 4.1 12 weeks | 2 | 187 | Risk Ratio (M‐H, Fixed, 95% CI) | 5.0 [0.26, 97.00] |
| 4.2 24 weeks | 1 | 369 | Risk Ratio (M‐H, Fixed, 95% CI) | 2.20 [0.92, 5.27] |
| 5 Clinical Global Show forest plot | 3 | 443 | Std. Mean Difference (IV, Random, 95% CI) | ‐0.11 [‐0.34, 0.13] |
| 5.1 12 weeks | 2 | 168 | Std. Mean Difference (IV, Random, 95% CI) | ‐0.28 [‐0.59, 0.02] |
| 5.2 24 weeks | 1 | 275 | Std. Mean Difference (IV, Random, 95% CI) | 0.04 [‐0.20, 0.28] |
| 6 Cognitive Function: SIB Show forest plot | 3 | 486 | Mean Difference (IV, Random, 95% CI) | ‐4.34 [‐14.58, 5.89] |
| 6.1 12 weeks | 2 | 162 | Mean Difference (IV, Random, 95% CI) | ‐10.00 [‐16.15, ‐3.85] |
| 6.2 24 weeks | 1 | 324 | Mean Difference (IV, Random, 95% CI) | 0.48 [‐1.61, 2.57] |
| 7 Decline in ADL: ADCS‐ADL19 Show forest plot | 3 | 458 | Mean Difference (IV, Fixed, 95% CI) | 1.48 [‐0.19, 3.15] |
| 7.1 12 weeks | 2 | 182 | Mean Difference (IV, Fixed, 95% CI) | ‐0.10 [‐4.18, 3.98] |
| 7.2 24 weeks | 1 | 276 | Mean Difference (IV, Fixed, 95% CI) | 1.80 [‐0.03, 3.63] |
| 8 Behaviour and Mood Show forest plot | 3 | 470 | Mean Difference (IV, Random, 95% CI) | ‐1.51 [‐8.05, 5.03] |
| 8.1 12 weeks | 2 | 146 | Mean Difference (IV, Random, 95% CI) | ‐3.76 [‐14.09, 6.58] |
| 8.2 24 weeks | 1 | 324 | Mean Difference (IV, Random, 95% CI) | 1.23 [‐2.19, 4.65] |
| 9 All‐cause discontinuation Show forest plot | 3 | 555 | Risk Ratio (M‐H, Fixed, 95% CI) | 1.10 [0.79, 1.52] |
| 9.1 12 weeks | 2 | 186 | Risk Ratio (M‐H, Fixed, 95% CI) | 1.24 [0.78, 1.99] |
| 9.2 24 weeks | 1 | 369 | Risk Ratio (M‐H, Fixed, 95% CI) | 1.00 [0.63, 1.56] |
| 10 Discontinuations due to adverse events Show forest plot | 3 | 556 | Risk Ratio (M‐H, Fixed, 95% CI) | 1.40 [0.88, 2.21] |
| 11 Number suffering at least one adverse event Show forest plot | 3 | 556 | Risk Ratio (M‐H, Fixed, 95% CI) | 1.07 [0.95, 1.20] |
| 12 Number suffering serious adverse events Show forest plot | 3 | 556 | Risk Ratio (M‐H, Fixed, 95% CI) | 1.65 [0.85, 3.20] |
| Outcome or subgroup title | No. of studies | No. of participants | Statistical method | Effect size |
| 1 Clinical global: CIBIC+ Show forest plot | 4 | 621 | Mean Difference (IV, Fixed, 95% CI) | ‐0.09 [‐0.30, 0.12] |
| 2 Cognitive function: ADASCog Show forest plot | 5 | Mean Difference (IV, Fixed, 95% CI) | Subtotals only | |
| 2.1 ADAS cog at 6 months | 4 | 619 | Mean Difference (IV, Fixed, 95% CI) | ‐0.21 [‐1.38, 0.95] |
| 2.2 MMSE at 12 months ‐ final values | 1 | 26 | Mean Difference (IV, Fixed, 95% CI) | ‐1.15 [‐3.47, 1.17] |
| 3 Decline in ADL: ADCS‐ADL23 Show forest plot | 4 | 621 | Mean Difference (IV, Fixed, 95% CI) | 0.07 [‐1.66, 1.80] |
| 4 Behaviour and mood: NPI Show forest plot | 4 | 621 | Mean Difference (IV, Fixed, 95% CI) | 0.29 [‐1.58, 2.16] |
| Outcome or subgroup title | No. of studies | No. of participants | Statistical method | Effect size |
| 1 Clinical Global: CGI Show forest plot | 2 | 757 | Std. Mean Difference (IV, Random, 95% CI) | ‐0.02 [‐0.23, 0.19] |
| 2 Cognitive function: ADAS‐Cog Show forest plot | 2 | 569 | Mean Difference (IV, Fixed, 95% CI) | ‐2.15 [‐3.25, ‐1.05] |
| 3 Decline in ADL: NOSGER self‐care subscale Show forest plot | 2 | 542 | Std. Mean Difference (IV, Fixed, 95% CI) | ‐0.04 [‐0.20, 0.13] |
| 4 Behaviour: NOSGER disturbing behaviour subscale Show forest plot | 2 | 541 | Std. Mean Difference (IV, Fixed, 95% CI) | ‐0.20 [‐0.37, ‐0.03] |
| 5 Cognitive function: ADAS‐Cog: post‐hoc subgroup analysis Show forest plot | 2 | Mean Difference (IV, Fixed, 95% CI) | Subtotals only | |
| 5.1 Mild‐to‐moderate (MMSE >14) | 2 | 467 | Mean Difference (IV, Fixed, 95% CI) | ‐1.64 [‐2.83, ‐0.45] |
| 5.2 Moderate (MMSE ≤ 14) | 2 | 102 | Mean Difference (IV, Fixed, 95% CI) | ‐4.51 [‐7.21, ‐1.81] |
| 6 All‐cause discontinuation Show forest plot | 2 | 900 | Risk Ratio (M‐H, Fixed, 95% CI) | 1.05 [0.83, 1.34] |
| 7 Discontinuation due to adverse events Show forest plot | 2 | 900 | Risk Ratio (M‐H, Random, 95% CI) | 1.09 [0.73, 1.64] |
| 8 Number suffering at least one adverse event Show forest plot | 2 | 900 | Risk Ratio (M‐H, Fixed, 95% CI) | 1.03 [0.95, 1.11] |
| 9 Number suffering agitation as an adverse event Show forest plot | 2 | 900 | Risk Ratio (M‐H, Fixed, 95% CI) | 0.56 [0.33, 0.96] |
| Outcome or subgroup title | No. of studies | No. of participants | Statistical method | Effect size |
| 1 Clinical Global (24 weeks) Show forest plot | 3 | 243 | Std. Mean Difference (IV, Fixed, 95% CI) | ‐0.35 [‐0.60, ‐0.09] |
| 2 Cognitive Function Show forest plot | 4 | 298 | Mean Difference (IV, Random, 95% CI) | ‐0.37 [‐3.68, 2.95] |
| 2.1 16 weeks | 1 | 25 | Mean Difference (IV, Random, 95% CI) | 1.5 [‐1.28, 4.28] |
| 2.2 24 weeks | 3 | 273 | Mean Difference (IV, Random, 95% CI) | ‐1.90 [‐3.73, ‐0.07] |
| 3 Decline in ADL (24 weeks) Show forest plot | 3 | 243 | Std. Mean Difference (IV, Random, 95% CI) | ‐0.27 [‐0.65, 0.11] |
| 4 Behaviour and Mood: NPI Show forest plot | 4 | 267 | Mean Difference (IV, Random, 95% CI) | ‐2.09 [‐4.84, 0.66] |
| 4.1 16 weeks | 1 | 25 | Mean Difference (IV, Random, 95% CI) | ‐2.60 [‐15.60, 10.40] |
| 4.2 24 weeks | 3 | 242 | Mean Difference (IV, Random, 95% CI) | ‐2.18 [‐5.57, 1.21] |
| 5 All‐cause discontinuation Show forest plot | 4 | 312 | Risk Ratio (M‐H, Fixed, 95% CI) | 0.84 [0.55, 1.28] |
| 6 Discontinuation due to adverse events Show forest plot | 4 | 315 | Risk Ratio (M‐H, Fixed, 95% CI) | 0.94 [0.54, 1.63] |
| 7 Number suffering at least one adverse event Show forest plot | 4 | 315 | Risk Ratio (M‐H, Fixed, 95% CI) | 1.01 [0.79, 1.28] |
| Outcome or subgroup title | No. of studies | No. of participants | Statistical method | Effect size |
| 1 Clinical Global Show forest plot | 2 | 117 | Std. Mean Difference (IV, Fixed, 95% CI) | ‐0.31 [‐0.67, 0.06] |
| 1.1 6 months | 1 | 76 | Std. Mean Difference (IV, Fixed, 95% CI) | ‐0.22 [‐0.67, 0.23] |
| 1.2 12 months | 1 | 41 | Std. Mean Difference (IV, Fixed, 95% CI) | ‐0.48 [‐1.10, 0.15] |
| 2 Cognitive Function: MMSE Show forest plot | 2 | 122 | Mean Difference (IV, Random, 95% CI) | ‐0.23 [‐2.03, 1.56] |
| 2.1 6 months | 1 | 81 | Mean Difference (IV, Random, 95% CI) | 0.30 [‐1.23, 1.83] |
| 2.2 12 months | 1 | 41 | Mean Difference (IV, Random, 95% CI) | ‐1.80 [‐5.06, 1.46] |
| 3 Behaviour and Mood: Neuropsychiatric Inventory (NPI) Total Show forest plot | 2 | 115 | Mean Difference (IV, Fixed, 95% CI) | ‐3.16 [‐8.06, 1.74] |
| 3.1 6 months | 1 | 76 | Mean Difference (IV, Fixed, 95% CI) | ‐2.20 [‐8.01, 3.61] |
| 3.2 12 months | 1 | 39 | Mean Difference (IV, Fixed, 95% CI) | ‐5.5 [‐14.60, 3.60] |
| 4 All‐cause discontinuation Show forest plot | 2 | 133 | Risk Ratio (M‐H, Fixed, 95% CI) | 1.54 [0.58, 4.06] |
| 5 Discontinuation due to adverse events Show forest plot | 2 | 133 | Risk Ratio (M‐H, Random, 95% CI) | 1.25 [0.35, 4.44] |
| 6 Number suffering at least one adverse event Show forest plot | 2 | 133 | Risk Ratio (M‐H, Fixed, 95% CI) | 1.00 [0.75, 1.33] |
| 7 Number suffering at serious adverse events Show forest plot | 2 | 133 | Risk Ratio (M‐H, Fixed, 95% CI) | 0.45 [0.07, 2.94] |
| 8 Number suffering agitation as an adverse event Show forest plot | 2 | 133 | Risk Ratio (M‐H, Random, 95% CI) | 0.21 [0.01, 4.34] |
| Outcome or subgroup title | No. of studies | No. of participants | Statistical method | Effect size |
| 1 Clinical Global ‐ by dementia type and severity Show forest plot | 21 | 5098 | Std. Mean Difference (IV, Fixed, 95% CI) | ‐0.15 [‐0.21, ‐0.09] |
| 1.1 Alzheimer's disease ‐ mild | 4 | 621 | Std. Mean Difference (IV, Fixed, 95% CI) | ‐0.08 [‐0.27, 0.12] |
| 1.2 Alzheimer's disease ‐ moderate to severe | 14 | 3126 | Std. Mean Difference (IV, Fixed, 95% CI) | ‐0.20 [‐0.28, ‐0.13] |
| 1.3 Alzheimer's disease with agitation | 1 | 275 | Std. Mean Difference (IV, Fixed, 95% CI) | 0.04 [‐0.20, 0.28] |
| 1.4 Vascular dementia ‐ mild to moderate | 2 | 757 | Std. Mean Difference (IV, Fixed, 95% CI) | ‐0.00 [‐0.15, 0.14] |
| 1.5 Parkinson's disease dementia / DLB ‐ mild to moderate | 3 | 243 | Std. Mean Difference (IV, Fixed, 95% CI) | ‐0.35 [‐0.60, ‐0.09] |
| 1.6 Fronto Temporal Dementia ‐ mild | 1 | 76 | Std. Mean Difference (IV, Fixed, 95% CI) | ‐0.22 [‐0.67, 0.23] |
| 2 Cognitive Function ‐ by dementia type and severity Show forest plot | 20 | 5303 | Std. Mean Difference (IV, Fixed, 95% CI) | ‐0.22 [‐0.28, ‐0.17] |
| 2.1 Alzheimer's disease ‐ mild | 4 | 619 | Std. Mean Difference (IV, Fixed, 95% CI) | ‐0.03 [‐0.19, 0.13] |
| 2.2 Alzheimer's disease ‐ moderate to severe | 15 | 3647 | Std. Mean Difference (IV, Fixed, 95% CI) | ‐0.27 [‐0.34, ‐0.21] |
| 2.3 Alzheimer's disease with agitation | 1 | 324 | Std. Mean Difference (IV, Fixed, 95% CI) | 0.05 [‐0.17, 0.27] |
| 2.4 Vascular dementia ‐ mild‐to‐moderate | 2 | 569 | Std. Mean Difference (IV, Fixed, 95% CI) | ‐0.32 [‐0.48, ‐0.15] |
| 2.5 PDD/DLB ‐ mild to moderate | 1 | 63 | Std. Mean Difference (IV, Fixed, 95% CI) | ‐0.50 [‐1.00, 0.00] |
| 2.6 Fronto Temporal Dementia ‐ mild | 1 | 81 | Std. Mean Difference (IV, Fixed, 95% CI) | 0.09 [‐0.35, 0.52] |
| 3 Decline in ADL ‐ by dementia type and severity Show forest plot | 21 | 4887 | Std. Mean Difference (IV, Fixed, 95% CI) | ‐0.10 [‐0.16, ‐0.04] |
| 3.1 Alzheimer's disease ‐ mild | 4 | 621 | Std. Mean Difference (IV, Fixed, 95% CI) | 0.02 [‐0.14, 0.18] |
| 3.2 Alzheimer's Disease ‐ moderate to severe | 14 | 3124 | Std. Mean Difference (IV, Fixed, 95% CI) | ‐0.16 [‐0.24, ‐0.09] |
| 3.3 Alzheimer's disease with agitation | 1 | 276 | Std. Mean Difference (IV, Fixed, 95% CI) | 0.23 [‐0.01, 0.47] |
| 3.4 Vascular dementia ‐ mild‐to‐moderate | 2 | 542 | Std. Mean Difference (IV, Fixed, 95% CI) | ‐0.04 [‐0.20, 0.13] |
| 3.5 PDD/DLB ‐ mild to moderate | 3 | 243 | Std. Mean Difference (IV, Fixed, 95% CI) | ‐0.19 [‐0.45, 0.06] |
| 3.6 Fronto Temporal Dementia ‐ mild | 1 | 81 | Std. Mean Difference (IV, Fixed, 95% CI) | 0.0 [0.0, 0.0] |
| 4 Behaviour and mood ‐ by dementia type and severity Show forest plot | 23 | 5525 | Std. Mean Difference (IV, Fixed, 95% CI) | ‐0.12 [‐0.17, ‐0.06] |
| 4.1 Alzheimer's Disease ‐ mild | 4 | 621 | Std. Mean Difference (IV, Fixed, 95% CI) | 0.02 [‐0.14, 0.18] |
| 4.2 AD ‐ moderate to severe | 15 | 3721 | Std. Mean Difference (IV, Fixed, 95% CI) | ‐0.14 [‐0.21, ‐0.08] |
| 4.3 Alzheimer's disease with agitation | 1 | 324 | Std. Mean Difference (IV, Fixed, 95% CI) | 0.08 [‐0.14, 0.30] |
| 4.4 Vascular dementia ‐ mild‐to‐moderate | 2 | 541 | Std. Mean Difference (IV, Fixed, 95% CI) | ‐0.20 [‐0.37, ‐0.03] |
| 4.5 PDD/DLB ‐ mild to moderate | 3 | 242 | Std. Mean Difference (IV, Fixed, 95% CI) | ‐0.18 [‐0.43, 0.07] |
| 4.6 Fronto Temporal Dementia ‐ mild | 1 | 76 | Std. Mean Difference (IV, Fixed, 95% CI) | ‐0.17 [‐0.62, 0.28] |
| 5 Number suffering agitation ‐ by dementia type and severity Show forest plot | 19 | 5933 | Risk Ratio (M‐H, Fixed, 95% CI) | 0.84 [0.71, 1.01] |
| 5.1 Alzheimer's disease mild‐to‐moderate | 5 | 1890 | Risk Ratio (M‐H, Fixed, 95% CI) | 1.05 [0.70, 1.58] |
| 5.2 Alzheimer's disease moderate‐to‐severe | 7 | 2505 | Risk Ratio (M‐H, Fixed, 95% CI) | 0.73 [0.58, 0.93] |
| 5.3 AD with agitation (increased severity) | 2 | 403 | Risk Ratio (M‐H, Fixed, 95% CI) | 2.39 [1.04, 5.50] |
| 5.4 Vascular dementia mild‐to‐moderate | 2 | 900 | Risk Ratio (M‐H, Fixed, 95% CI) | 0.56 [0.33, 0.96] |
| 5.5 Fronto Temporal Dementia | 1 | 81 | Risk Ratio (M‐H, Fixed, 95% CI) | 0.21 [0.01, 4.34] |
| 5.6 Mixed dementia mild‐to‐moderate | 2 | 154 | Risk Ratio (M‐H, Fixed, 95% CI) | 1.53 [0.71, 3.31] |
| 6 Number suffering agitation ‐ by dementia type and ChEI Show forest plot | 17 | 5392 | Risk Ratio (M‐H, Fixed, 95% CI) | 0.83 [0.69, 0.99] |
| 6.1 Alzheimer's disease monotherapy | 5 | 1624 | Risk Ratio (M‐H, Fixed, 95% CI) | 0.66 [0.49, 0.89] |
| 6.2 Alzheimer's disease with concomitant ChEI | 6 | 2230 | Risk Ratio (M‐H, Fixed, 95% CI) | 0.91 [0.68, 1.22] |
| 6.3 Alzheimer's disease with agitation with concomitant ChEI | 2 | 403 | Risk Ratio (M‐H, Fixed, 95% CI) | 2.39 [1.04, 5.50] |
| 6.4 Vascular dementia monotherapy implied | 2 | 900 | Risk Ratio (M‐H, Fixed, 95% CI) | 0.56 [0.33, 0.96] |
| 6.5 Fronto Temporal Dementia ‐ monotherapy | 1 | 81 | Risk Ratio (M‐H, Fixed, 95% CI) | 0.21 [0.01, 4.34] |
| 6.6 Mixed dementia ‐ unclear ChEI | 2 | 154 | Risk Ratio (M‐H, Fixed, 95% CI) | 1.53 [0.71, 3.31] |
| 7 All‐cause discontinuation (all durations) ‐ by dementia type and severity Show forest plot | 33 | 8116 | Risk Ratio (M‐H, Fixed, 95% CI) | 0.99 [0.90, 1.08] |
| 7.1 Alzheimer's Disease ‐ mild | 5 | 722 | Risk Ratio (M‐H, Fixed, 95% CI) | 1.74 [1.08, 2.81] |
| 7.2 Alzheimer's disease ‐ moderate to severe | 18 | 5200 | Risk Ratio (M‐H, Fixed, 95% CI) | 0.93 [0.83, 1.04] |
| 7.3 Alzheimer's disease with agitation | 3 | 555 | Risk Ratio (M‐H, Fixed, 95% CI) | 1.10 [0.79, 1.52] |
| 7.4 Vascular dementia mild‐to‐moderate | 2 | 900 | Risk Ratio (M‐H, Fixed, 95% CI) | 1.05 [0.83, 1.34] |
| 7.5 PDD/DLB mild‐to‐moderate | 4 | 312 | Risk Ratio (M‐H, Fixed, 95% CI) | 0.84 [0.55, 1.28] |
| 7.6 Fronto Temporal Dementia mild | 2 | 133 | Risk Ratio (M‐H, Fixed, 95% CI) | 1.54 [0.58, 4.06] |
| 7.7 AIDS complex dementia | 1 | 140 | Risk Ratio (M‐H, Fixed, 95% CI) | 1.0 [0.52, 1.94] |
| 7.8 Mixed dementia mild‐to‐moderate | 2 | 154 | Risk Ratio (M‐H, Fixed, 95% CI) | 0.87 [0.30, 2.50] |
| 8 Discontinuation due to adverse events ‐ by dementia type and severity Show forest plot | 31 | 7968 | Risk Ratio (M‐H, Fixed, 95% CI) | 1.03 [0.90, 1.18] |
| 8.1 Alzheimer's Disease ‐ mild | 5 | 722 | Risk Ratio (M‐H, Fixed, 95% CI) | 2.12 [1.03, 4.39] |
| 8.2 Alzheimer's Disease ‐ moderate to severe | 18 | 5202 | Risk Ratio (M‐H, Fixed, 95% CI) | 0.93 [0.79, 1.11] |
| 8.3 Alzheimer's disease with agitation | 3 | 556 | Risk Ratio (M‐H, Fixed, 95% CI) | 1.40 [0.88, 2.21] |
| 8.4 Vascular dementia mild‐to‐moderate | 2 | 900 | Risk Ratio (M‐H, Fixed, 95% CI) | 1.10 [0.73, 1.64] |
| 8.5 Fronto Temporal Dementia | 2 | 133 | Risk Ratio (M‐H, Fixed, 95% CI) | 1.28 [0.37, 4.48] |
| 8.6 AIDS Complex dementia | 1 | 140 | Risk Ratio (M‐H, Fixed, 95% CI) | 1.0 [0.37, 2.70] |
| 8.7 PDD/DLB mild‐to‐moderate | 4 | 315 | Risk Ratio (M‐H, Fixed, 95% CI) | 0.94 [0.54, 1.63] |
| 9 Number suffering at least one adverse event ‐ by dementia type and severity Show forest plot | 30 | 8139 | Risk Ratio (M‐H, Fixed, 95% CI) | 1.03 [1.00, 1.06] |
| 9.1 Alzheimer's disease mild‐to‐moderate | 9 | 2624 | Risk Ratio (M‐H, Fixed, 95% CI) | 1.03 [0.98, 1.08] |
| 9.2 Alzheimer's disease moderate‐to‐severe | 10 | 3596 | Risk Ratio (M‐H, Fixed, 95% CI) | 1.02 [0.97, 1.06] |
| 9.3 Alzheimer's disease with agitation | 2 | 403 | Risk Ratio (M‐H, Fixed, 95% CI) | 1.07 [0.95, 1.20] |
| 9.4 Vascular dementia mild‐to‐moderate | 2 | 900 | Risk Ratio (M‐H, Fixed, 95% CI) | 1.03 [0.95, 1.11] |
| 9.5 Fronto Temporal Dementia | 2 | 133 | Risk Ratio (M‐H, Fixed, 95% CI) | 1.00 [0.75, 1.33] |
| 9.6 PDD/DLB mild‐to‐moderate | 3 | 295 | Risk Ratio (M‐H, Fixed, 95% CI) | 1.01 [0.79, 1.28] |
| 9.7 AIDS complex dementia | 1 | 106 | Risk Ratio (M‐H, Fixed, 95% CI) | 0.0 [0.0, 0.0] |
| 9.8 Mixed dementia mild‐to‐moderate | 1 | 82 | Risk Ratio (M‐H, Fixed, 95% CI) | 1.39 [0.91, 2.12] |
| 10 Number suffering at least one serious AE ‐ by dementia type and severity Show forest plot | 27 | 8138 | Risk Ratio (M‐H, Fixed, 95% CI) | 0.92 [0.83, 1.02] |
| 10.1 Alzheimer's disease mild‐to‐moderate | 9 | 2798 | Risk Ratio (M‐H, Fixed, 95% CI) | 0.92 [0.79, 1.07] |
| 10.2 Alzheimer's disease moderate‐to‐severe | 10 | 3684 | Risk Ratio (M‐H, Fixed, 95% CI) | 0.91 [0.77, 1.08] |
| 10.3 Alzheimer's disease with agitation | 2 | 403 | Risk Ratio (M‐H, Fixed, 95% CI) | 1.65 [0.85, 3.20] |
| 10.4 Vascular dementia mild‐to‐moderate | 2 | 900 | Risk Ratio (M‐H, Fixed, 95% CI) | 0.82 [0.62, 1.09] |
| 10.5 Fronto Temporal Dementia | 2 | 133 | Risk Ratio (M‐H, Fixed, 95% CI) | 0.71 [0.30, 1.66] |
| 10.6 PDD/DLB mild‐to‐moderate | 2 | 220 | Risk Ratio (M‐H, Fixed, 95% CI) | 1.43 [0.69, 2.97] |
| 11 Number suffering agitation as an adverse event ‐ by dementia type Show forest plot | 20 | 6008 | Risk Ratio (M‐H, Fixed, 95% CI) | 0.84 [0.71, 1.01] |
| 11.1 Alzheimer's disease | 12 | 4395 | Risk Ratio (M‐H, Fixed, 95% CI) | 0.81 [0.66, 0.99] |
| 11.2 AD with agitation (increased severity) | 2 | 403 | Risk Ratio (M‐H, Fixed, 95% CI) | 2.39 [1.04, 5.50] |
| 11.3 Vascular dementia | 2 | 900 | Risk Ratio (M‐H, Fixed, 95% CI) | 0.56 [0.33, 0.96] |
| 11.4 Parkinson's Disease Dementia / Dementia Lewy Bodies | 1 | 75 | Risk Ratio (M‐H, Fixed, 95% CI) | 0.0 [0.0, 0.0] |
| 11.5 Fronto Temporal Dementia | 1 | 81 | Risk Ratio (M‐H, Fixed, 95% CI) | 0.21 [0.01, 4.34] |
| 11.6 Mixed dementia | 2 | 154 | Risk Ratio (M‐H, Fixed, 95% CI) | 1.53 [0.71, 3.31] |
| Outcome or subgroup title | No. of studies | No. of participants | Statistical method | Effect size |
| 1 All‐cause discontinuation Show forest plot | 41 | 8998 | Risk Ratio (M‐H, Fixed, 95% CI) | 0.99 [0.91, 1.08] |
| 2 Discontinuation due to adverse events Show forest plot | 41 | 9004 | Risk Ratio (M‐H, Fixed, 95% CI) | 1.06 [0.92, 1.21] |
| 3 Number suffering at least one adverse event Show forest plot | 41 | 8960 | Risk Ratio (M‐H, Fixed, 95% CI) | 1.03 [1.00, 1.06] |
| 4 Number suffering serious adverse events Show forest plot | 41 | 8960 | Risk Ratio (M‐H, Fixed, 95% CI) | 0.92 [0.83, 1.02] |
| 5 Number suffering agitation as an adverse event Show forest plot | 22 | 6814 | Risk Ratio (M‐H, Fixed, 95% CI) | 0.84 [0.71, 1.01] |
| 6 Number suffering insomnia as an adverse event Show forest plot | 19 | 5354 | Risk Ratio (M‐H, Fixed, 95% CI) | 0.93 [0.73, 1.20] |
| 7 Number suffering confusion as an adverse event Show forest plot | 13 | 4509 | Risk Ratio (M‐H, Fixed, 95% CI) | 1.23 [0.91, 1.65] |
| 8 Number suffering depression as an adverse event Show forest plot | 10 | 3052 | Risk Ratio (M‐H, Fixed, 95% CI) | 1.06 [0.70, 1.60] |
| 9 Number suffering headache as an adverse event Show forest plot | 16 | 4889 | Risk Ratio (M‐H, Fixed, 95% CI) | 1.29 [1.00, 1.66] |
| 10 Number suffering hypertension as an adverse event Show forest plot | 8 | 3175 | Risk Ratio (M‐H, Fixed, 95% CI) | 1.76 [1.14, 2.70] |
| 11 Number suffering dizziness as an adverse event Show forest plot | 19 | 6395 | Risk Ratio (M‐H, Fixed, 95% CI) | 1.59 [1.28, 1.98] |
| 12 Number suffering falls as an adverse event Show forest plot | 20 | 6743 | Risk Ratio (M‐H, Fixed, 95% CI) | 0.98 [0.84, 1.13] |
| 13 Number suffering accidental injury as an adverse event Show forest plot | 10 | 3813 | Risk Ratio (M‐H, Fixed, 95% CI) | 0.81 [0.62, 1.05] |
| 14 Number suffering urinary incontinence as an adverse event Show forest plot | 8 | 2724 | Risk Ratio (M‐H, Fixed, 95% CI) | 1.12 [0.73, 1.72] |
| 15 Number suffering diarrhoea as an adverse event Show forest plot | 18 | 6186 | Risk Ratio (M‐H, Fixed, 95% CI) | 0.82 [0.66, 1.02] |
| 16 Number suffering influenza like symptoms as an adverse event Show forest plot | 7 | 2836 | Risk Ratio (M‐H, Fixed, 95% CI) | 1.21 [0.87, 1.70] |
| Outcome or subgroup title | No. of studies | No. of participants | Statistical method | Effect size |
| 1 Cognitive function Show forest plot | 11 | Mean Difference (IV, Fixed, 95% CI) | Totals not selected | |
| 1.1 1) OC then LOCF | 1 | Mean Difference (IV, Fixed, 95% CI) | 0.0 [0.0, 0.0] | |
| 1.2 2) OC then LOCF | 1 | Mean Difference (IV, Fixed, 95% CI) | 0.0 [0.0, 0.0] | |
| 1.3 3) OC then LOCF | 1 | Mean Difference (IV, Fixed, 95% CI) | 0.0 [0.0, 0.0] | |
| 1.4 4) OC then LOCF | 1 | Mean Difference (IV, Fixed, 95% CI) | 0.0 [0.0, 0.0] | |
| 1.5 PP then Retrieved dropout | 1 | Mean Difference (IV, Fixed, 95% CI) | 0.0 [0.0, 0.0] | |
| 1.6 PP then retrieved dropout ‐ AChEI only | 1 | Mean Difference (IV, Fixed, 95% CI) | 0.0 [0.0, 0.0] | |
| 1.7 PP then Retrieved dropout ‐ no AChEI | 1 | Mean Difference (IV, Fixed, 95% CI) | 0.0 [0.0, 0.0] | |
| 1.8 5) OC then LOCF | 1 | Mean Difference (IV, Fixed, 95% CI) | 0.0 [0.0, 0.0] | |
| 1.9 6) OC then LOCF | 1 | Mean Difference (IV, Fixed, 95% CI) | 0.0 [0.0, 0.0] | |
| 1.10 7) OC then LOCF | 1 | Mean Difference (IV, Fixed, 95% CI) | 0.0 [0.0, 0.0] | |
| 1.11 OC then LOCF | 1 | Mean Difference (IV, Fixed, 95% CI) | 0.0 [0.0, 0.0] | |
| 1.12 OC then LOCF | 1 | Mean Difference (IV, Fixed, 95% CI) | 0.0 [0.0, 0.0] | |
| 1.13 Per protocol then LOCF | 1 | Mean Difference (IV, Fixed, 95% CI) | 0.0 [0.0, 0.0] | |
| 2 Decline in ADL: ADCS‐ADL19/23 Show forest plot | 10 | Mean Difference (IV, Fixed, 95% CI) | Totals not selected | |
| 2.1 1) OC then LOCF | 1 | Mean Difference (IV, Fixed, 95% CI) | 0.0 [0.0, 0.0] | |
| 2.2 2) OC then LOCF | 1 | Mean Difference (IV, Fixed, 95% CI) | 0.0 [0.0, 0.0] | |
| 2.3 3) OC then LOCF | 1 | Mean Difference (IV, Fixed, 95% CI) | 0.0 [0.0, 0.0] | |
| 2.4 4) OC then LOCF | 1 | Mean Difference (IV, Fixed, 95% CI) | 0.0 [0.0, 0.0] | |
| 2.5 5) OC then LOCF | 1 | Mean Difference (IV, Fixed, 95% CI) | 0.0 [0.0, 0.0] | |
| 2.6 6) OC then LOCF | 1 | Mean Difference (IV, Fixed, 95% CI) | 0.0 [0.0, 0.0] | |
| 2.7 7) OC then LOCF | 1 | Mean Difference (IV, Fixed, 95% CI) | 0.0 [0.0, 0.0] | |
| 2.8 PP then Retrieved Dropout | 1 | Mean Difference (IV, Fixed, 95% CI) | 0.0 [0.0, 0.0] | |
| 2.9 PP then Retrieved Dropout ‐ AChEI only | 1 | Mean Difference (IV, Fixed, 95% CI) | 0.0 [0.0, 0.0] | |
| 2.10 PP then Retrieved dropout ‐ no AChEI | 1 | Mean Difference (IV, Fixed, 95% CI) | 0.0 [0.0, 0.0] | |
| 2.11 OC then LOCF | 1 | Mean Difference (IV, Fixed, 95% CI) | 0.0 [0.0, 0.0] | |
| 2.12 Per protocol then LOCF | 1 | Mean Difference (IV, Fixed, 95% CI) | 0.0 [0.0, 0.0] | |
| 3 Cognitive Function: SIB/ADASCog/MMSE Show forest plot | 17 | Std. Mean Difference (IV, Fixed, 95% CI) | Subtotals only | |
| 3.1 OC | 12 | 2901 | Std. Mean Difference (IV, Fixed, 95% CI) | ‐0.26 [‐0.33, ‐0.19] |
| 3.2 LOCF | 8 | 3066 | Std. Mean Difference (IV, Fixed, 95% CI) | ‐0.26 [‐0.33, ‐0.18] |
| 3.3 Missing at random assumption | 2 | 203 | Std. Mean Difference (IV, Fixed, 95% CI) | ‐0.20 [‐0.47, 0.08] |
| 3.4 Per protocol | 1 | 143 | Std. Mean Difference (IV, Fixed, 95% CI) | ‐0.36 [‐0.69, ‐0.03] |
| 3.5 Retrieved dropout | 1 | 246 | Std. Mean Difference (IV, Fixed, 95% CI) | ‐0.39 [‐0.64, ‐0.14] |
| 4 Decline in Activities of Daily Living Show forest plot | 14 | Std. Mean Difference (IV, Fixed, 95% CI) | Subtotals only | |
| 4.1 OC only | 10 | 2874 | Std. Mean Difference (IV, Fixed, 95% CI) | ‐0.11 [‐0.19, ‐0.03] |
| 4.2 LOCF | 6 | 2107 | Std. Mean Difference (IV, Fixed, 95% CI) | ‐0.13 [‐0.21, ‐0.04] |
| 4.3 Missing at random assumption | 2 | 203 | Std. Mean Difference (IV, Fixed, 95% CI) | ‐0.01 [‐0.29, 0.26] |
| 4.4 Per protocol | 1 | 143 | Std. Mean Difference (IV, Fixed, 95% CI) | ‐0.17 [‐0.50, 0.16] |
| 4.5 Retrieved dropout | 1 | 246 | Std. Mean Difference (IV, Fixed, 95% CI) | ‐0.22 [‐0.47, 0.03] |
| Outcome or subgroup title | No. of studies | No. of participants | Statistical method | Effect size |
| 1 Clinical Global Show forest plot | 24 | 5575 | Std. Mean Difference (IV, Fixed, 95% CI) | ‐0.20 [‐0.26, ‐0.14] |
| 2 Cognitive Function Show forest plot | 24 | 5670 | Std. Mean Difference (IV, Fixed, 95% CI) | ‐0.19 [‐0.24, ‐0.13] |
| 3 Decline in ADL Show forest plot | 24 | 5716 | Std. Mean Difference (IV, Fixed, 95% CI) | ‐0.10 [‐0.17, ‐0.04] |
| 4 Behaviour and Mood Show forest plot | 24 | 5718 | Std. Mean Difference (IV, Fixed, 95% CI) | ‐0.13 [‐0.19, ‐0.07] |
| 5 Clinical Global ‐ sensitivity analysis for high RoB Show forest plot | 17 | 4552 | Std. Mean Difference (IV, Fixed, 95% CI) | ‐0.19 [‐0.26, ‐0.13] |
| 6 Cognitive Function ‐ sensitivity analysis for high risk of bias Show forest plot | 19 | 5354 | Std. Mean Difference (IV, Fixed, 95% CI) | ‐0.18 [‐0.23, ‐0.12] |
| 7 Decline in ADL ‐ sensitivity analysis on high RoB Show forest plot | 17 | 4837 | Std. Mean Difference (IV, Fixed, 95% CI) | ‐0.09 [‐0.15, ‐0.02] |
| 8 Behaviour and Mood ‐ sensitivity analysis on high RoB Show forest plot | 17 | 5240 | Std. Mean Difference (IV, Fixed, 95% CI) | ‐0.12 [‐0.18, ‐0.06] |
| Outcome or subgroup title | No. of studies | No. of participants | Statistical method | Effect size |
| 1 Clinical Global ‐ CIBIC Plus, CGI‐I, or ADCS‐CGIC Show forest plot | 24 | 5579 | Std. Mean Difference (IV, Fixed, 95% CI) | ‐0.20 [‐0.26, ‐0.14] |
| 1.1 < 6 months | 4 | 515 | Std. Mean Difference (IV, Fixed, 95% CI) | ‐0.31 [‐0.53, ‐0.10] |
| 1.2 6‐7 months | 14 | 4201 | Std. Mean Difference (IV, Fixed, 95% CI) | ‐0.19 [‐0.26, ‐0.12] |
| 1.3 > 7 months | 6 | 863 | Std. Mean Difference (IV, Fixed, 95% CI) | ‐0.28 [‐1.04, 0.48] |
| 2 Cognitive Function Show forest plot | 24 | 5670 | Std. Mean Difference (IV, Fixed, 95% CI) | ‐0.19 [‐0.24, ‐0.13] |
| 2.1 < 6 months | 4 | 625 | Std. Mean Difference (IV, Fixed, 95% CI) | ‐0.12 [‐0.34, 0.10] |
| 2.2 6‐7 months | 14 | 4182 | Std. Mean Difference (IV, Fixed, 95% CI) | ‐0.21 [‐0.28, ‐0.15] |
| 2.3 > 7 months | 6 | 863 | Std. Mean Difference (IV, Fixed, 95% CI) | ‐0.10 [‐0.23, 0.04] |
| 3 Decline in ADL ‐ BGP, ADCS‐ADL 19 or 23 Show forest plot | 24 | 5716 | Std. Mean Difference (IV, Fixed, 95% CI) | ‐0.10 [‐0.17, ‐0.04] |
| 3.1 < 6 months | 4 | 625 | Std. Mean Difference (IV, Fixed, 95% CI) | ‐0.23 [‐0.46, ‐0.01] |
| 3.2 6‐7 months | 14 | 4257 | Std. Mean Difference (IV, Fixed, 95% CI) | ‐0.12 [‐0.19, ‐0.04] |
| 3.3 >7 months | 6 | 834 | Std. Mean Difference (IV, Fixed, 95% CI) | 0.05 [‐0.11, 0.22] |
| 4 Behaviour and Mood (Standardised NPI or NPI‐NH Total) Show forest plot | 23 | 5582 | Std. Mean Difference (IV, Fixed, 95% CI) | ‐0.13 [‐0.19, ‐0.07] |
| 4.1 < 6 months | 4 | 625 | Std. Mean Difference (IV, Fixed, 95% CI) | ‐0.28 [‐0.54, ‐0.03] |
| 4.2 6‐7 months | 14 | 4259 | Std. Mean Difference (IV, Fixed, 95% CI) | ‐0.11 [‐0.18, ‐0.05] |
| 4.3 > 7 months | 5 | 698 | Std. Mean Difference (IV, Fixed, 95% CI) | ‐0.21 [‐0.41, ‐0.02] |
| Outcome or subgroup title | No. of studies | No. of participants | Statistical method | Effect size |
| 1 Clinical Global; 10mg versus 20mg Show forest plot | 2 | 545 | Std. Mean Difference (IV, Random, 95% CI) | 0.05 [‐0.12, 0.22] |
| 2 Cognitive function; 10mg vs 20 mg Show forest plot | 2 | 545 | Std. Mean Difference (IV, Random, 95% CI) | 0.10 [‐0.48, 0.68] |
| 3 Decline in ADL; 10mg versus 20mg Show forest plot | 2 | 546 | Mean Difference (IV, Random, 95% CI) | ‐0.15 [‐1.86, 1.56] |
| 4 Behaviour and mood; 10mg versus 20mg Show forest plot | 2 | 547 | Mean Difference (IV, Random, 95% CI) | 1.70 [‐1.06, 4.46] |
| 5 Clinical Global Show forest plot | 3 | 623 | Std. Mean Difference (IV, Random, 95% CI) | ‐0.26 [‐0.50, ‐0.02] |
| 6 Cognitive function Show forest plot | 3 | 623 | Std. Mean Difference (IV, Random, 95% CI) | ‐0.26 [‐0.45, ‐0.06] |
| 7 Decline in activities of daily living Show forest plot | 3 | 623 | Std. Mean Difference (IV, Random, 95% CI) | ‐0.38 [‐0.92, 0.16] |
| 8 Behaviour and mood Show forest plot | 3 | 626 | Mean Difference (IV, Random, 95% CI) | ‐0.55 [‐3.25, 2.15] |
| Outcome or subgroup title | No. of studies | No. of participants | Statistical method | Effect size |
| 1 Clinical Global: subgroup analysis by +/‐ ChEI Show forest plot | 12 | 3624 | Std. Mean Difference (IV, Fixed, 95% CI) | ‐0.19 [‐0.26, ‐0.13] |
| 1.1 Monotherapy (studies ordered by decreasing mean severity) | 9 | 2378 | Std. Mean Difference (IV, Fixed, 95% CI) | ‐0.20 [‐0.28, ‐0.11] |
| 1.2 With concomitant ChEI (studies ordered by decreasing mean severity) | 3 | 1246 | Std. Mean Difference (IV, Fixed, 95% CI) | ‐0.19 [‐0.30, ‐0.08] |
| 2 Cognitive Function subgroup analysis by +/‐ ChEI Show forest plot | 16 | 4501 | Std. Mean Difference (IV, Fixed, 95% CI) | ‐0.22 [‐0.28, ‐0.16] |
| 2.1 Monotherapy (studies ordered by decreasing mean severity) | 10 | 2189 | Std. Mean Difference (IV, Fixed, 95% CI) | ‐0.24 [‐0.32, ‐0.15] |
| 2.2 With concomitant ChEI (studies ordered by decreasing mean severity) | 7 | 2312 | Std. Mean Difference (IV, Fixed, 95% CI) | ‐0.20 [‐0.28, ‐0.12] |
| 3 Decline in ADL subgroup analysis by +/‐ ChEI Show forest plot | 12 | 3432 | Std. Mean Difference (IV, Fixed, 95% CI) | ‐0.12 [‐0.19, ‐0.05] |
| 3.1 Monotherapy (studies ordered by decreasing mean severity) | 7 | 1674 | Std. Mean Difference (IV, Fixed, 95% CI) | ‐0.14 [‐0.24, ‐0.04] |
| 3.2 With concomitant ChEI (studies ordered by decreasing mean severity) | 6 | 1758 | Std. Mean Difference (IV, Fixed, 95% CI) | ‐0.10 [‐0.19, ‐0.01] |
| 4 Behaviour and Mood: subgroup analysis by +/‐ ChEI Show forest plot | 14 | 4270 | Std. Mean Difference (IV, Fixed, 95% CI) | ‐0.12 [‐0.18, ‐0.06] |
| 4.1 Monotherapy (studies ordered by decreasing mean severity) | 9 | 2125 | Std. Mean Difference (IV, Fixed, 95% CI) | ‐0.08 [‐0.17, 0.00] |
| 4.2 With concomitant ChEI (studies ordered by decreasing mean severity) | 6 | 2145 | Std. Mean Difference (IV, Fixed, 95% CI) | ‐0.15 [‐0.24, ‐0.07] |
| Outcome or subgroup title | No. of studies | No. of participants | Statistical method | Effect size |
| 1 Clinical Global Show forest plot | 12 | 3624 | Std. Mean Difference (IV, Fixed, 95% CI) | ‐0.19 [‐0.26, ‐0.13] |
| 2 Cognitive Function Show forest plot | 16 | 4500 | Std. Mean Difference (IV, Fixed, 95% CI) | ‐0.22 [‐0.27, ‐0.16] |
| 3 Decline in ADL Show forest plot | 12 | 3432 | Std. Mean Difference (IV, Fixed, 95% CI) | ‐0.12 [‐0.19, ‐0.05] |
| 4 Behaviour and Mood Show forest plot | 14 | 4270 | Std. Mean Difference (IV, Fixed, 95% CI) | ‐0.12 [‐0.18, ‐0.06] |
| 5 Clinical Global Show forest plot | 12 | 3624 | Std. Mean Difference (IV, Fixed, 95% CI) | ‐0.19 [‐0.26, ‐0.13] |
| 5.1 mild to moderate | 5 | 1519 | Std. Mean Difference (IV, Fixed, 95% CI) | ‐0.16 [‐0.26, ‐0.06] |
| 5.2 moderate to severe | 7 | 2105 | Std. Mean Difference (IV, Fixed, 95% CI) | ‐0.22 [‐0.30, ‐0.13] |
| 6 Cognitive Function Show forest plot | 16 | 4500 | Std. Mean Difference (IV, Fixed, 95% CI) | ‐0.22 [‐0.27, ‐0.16] |
| 6.1 mild to moderate | 7 | 1959 | Std. Mean Difference (IV, Fixed, 95% CI) | ‐0.13 [‐0.22, ‐0.04] |
| 6.2 moderate to severe | 9 | 2541 | Std. Mean Difference (IV, Fixed, 95% CI) | ‐0.28 [‐0.36, ‐0.20] |
| 7 Decline in ADL Show forest plot | 12 | 3432 | Std. Mean Difference (IV, Fixed, 95% CI) | ‐0.12 [‐0.19, ‐0.05] |
| 7.1 mild to moderate | 5 | 1554 | Std. Mean Difference (IV, Fixed, 95% CI) | ‐0.03 [‐0.13, 0.07] |
| 7.2 moderate to severe | 7 | 1878 | Std. Mean Difference (IV, Fixed, 95% CI) | ‐0.19 [‐0.28, ‐0.10] |
| 8 Behaviour and Mood Show forest plot | 14 | 4270 | Std. Mean Difference (IV, Fixed, 95% CI) | ‐0.12 [‐0.18, ‐0.06] |
| 8.1 mild to moderate | 4 | 1405 | Std. Mean Difference (IV, Fixed, 95% CI) | ‐0.01 [‐0.11, 0.10] |
| 8.2 moderate to severe | 10 | 2865 | Std. Mean Difference (IV, Fixed, 95% CI) | ‐0.17 [‐0.25, ‐0.10] |
| 9 All‐cause discontinuation, by type of disease and severity Show forest plot | 23 | 6571 | Risk Ratio (M‐H, Fixed, 95% CI) | 0.98 [0.88, 1.09] |
| 9.1 Alzheimer's disease mild‐to‐moderate | 9 | 2305 | Risk Ratio (M‐H, Fixed, 95% CI) | 1.09 [0.90, 1.31] |
| 9.2 Alzheimer's disease moderate‐to‐severe | 14 | 4266 | Risk Ratio (M‐H, Fixed, 95% CI) | 0.94 [0.83, 1.06] |
| 10 Discontinuation due to adverse events, by disease type and severity Show forest plot | 20 | 6227 | Risk Ratio (M‐H, Fixed, 95% CI) | 1.03 [0.88, 1.20] |
| 10.1 Alzheimer's disease mild‐to‐moderate | 7 | 1985 | Risk Ratio (M‐H, Fixed, 95% CI) | 1.41 [1.04, 1.91] |
| 10.2 Alzheimer's disease moderate‐to‐severe | 13 | 4242 | Risk Ratio (M‐H, Fixed, 95% CI) | 0.91 [0.76, 1.10] |
| Outcome or subgroup title | No. of studies | No. of participants | Statistical method | Effect size |
| 1 Clinical Global ‐ mild vs moderate/severe Show forest plot | 10 | 3224 | Std. Mean Difference (IV, Fixed, 95% CI) | ‐0.19 [‐0.26, ‐0.12] |
| 1.1 mild | 3 | 427 | Std. Mean Difference (IV, Fixed, 95% CI) | ‐0.08 [‐0.27, 0.12] |
| 1.2 moderate to severe | 10 | 2797 | Std. Mean Difference (IV, Fixed, 95% CI) | ‐0.20 [‐0.28, ‐0.13] |
| 2 Cognitive Function ‐ mild vs moderate/severe Show forest plot | 13 | 3955 | Std. Mean Difference (IV, Fixed, 95% CI) | ‐0.24 [‐0.30, ‐0.17] |
| 2.1 mild | 4 | 619 | Std. Mean Difference (IV, Fixed, 95% CI) | ‐0.03 [‐0.19, 0.13] |
| 2.2 moderate to severe | 13 | 3336 | Std. Mean Difference (IV, Fixed, 95% CI) | ‐0.27 [‐0.34, ‐0.21] |
| 3 Decline in ADL ‐ mild vs moderate/severe Show forest plot | 11 | 3308 | Std. Mean Difference (IV, Fixed, 95% CI) | ‐0.13 [‐0.20, ‐0.06] |
| 3.1 mild | 4 | 621 | Std. Mean Difference (IV, Fixed, 95% CI) | 0.02 [‐0.14, 0.18] |
| 3.2 moderate to severe | 11 | 2687 | Std. Mean Difference (IV, Fixed, 95% CI) | ‐0.16 [‐0.24, ‐0.09] |
| 4 Behaviour and Mood ‐ mild vs moderate/severe Show forest plot | 14 | 4295 | Std. Mean Difference (IV, Fixed, 95% CI) | ‐0.12 [‐0.18, ‐0.06] |
| 4.1 mild | 4 | 621 | Std. Mean Difference (IV, Fixed, 95% CI) | 0.02 [‐0.14, 0.18] |
| 4.2 moderate to severe | 14 | 3674 | Std. Mean Difference (IV, Fixed, 95% CI) | ‐0.14 [‐0.21, ‐0.08] |
| 5 All‐cause discontinuation ‐ mild vs moderate/severe Show forest plot | 19 | 5922 | Risk Ratio (M‐H, Fixed, 95% CI) | 0.97 [0.87, 1.08] |
| 5.1 mild | 5 | 722 | Risk Ratio (M‐H, Fixed, 95% CI) | 1.74 [1.08, 2.81] |
| 5.2 moderate to severe | 18 | 5200 | Risk Ratio (M‐H, Fixed, 95% CI) | 0.93 [0.83, 1.04] |
| 6 Discontinuations due to adverse events ‐ mild vs moderate/severe Show forest plot | 20 | 6150 | Risk Ratio (M‐H, Fixed, 95% CI) | 1.01 [0.86, 1.18] |
| 6.1 Mild | 6 | 948 | Risk Ratio (M‐H, Fixed, 95% CI) | 1.71 [1.06, 2.76] |
| 6.2 Moderate to severe | 18 | 5202 | Risk Ratio (M‐H, Fixed, 95% CI) | 0.93 [0.79, 1.11] |
| Outcome or subgroup title | No. of studies | No. of participants | Statistical method | Effect size |
| 1 Clinical Global: post‐hoc within‐trial subgroup analyses Show forest plot | 8 | 2597 | Std. Mean Difference (IV, Fixed, 95% CI) | ‐0.18 [‐0.27, ‐0.10] |
| 1.1 severe (MMSE mean <10) | 4 | 523 | Std. Mean Difference (IV, Fixed, 95% CI) | ‐0.26 [‐0.43, ‐0.09] |
| 1.2 moderate (subgroup MMSE 10 to <20) | 8 | 1453 | Std. Mean Difference (IV, Fixed, 95% CI) | ‐0.19 [‐0.30, ‐0.08] |
| 1.3 mild (subgroup MMSE ≥20) | 4 | 621 | Std. Mean Difference (IV, Fixed, 95% CI) | ‐0.08 [‐0.27, 0.12] |
| 2 Cognitive Function: post‐hoc within‐trial subgroup analyses Show forest plot | 8 | 2598 | Std. Mean Difference (IV, Random, 95% CI) | ‐0.24 [‐0.34, ‐0.14] |
| 2.1 severe (MMSE <10) | 4 | 531 | Std. Mean Difference (IV, Random, 95% CI) | ‐0.39 [‐0.67, ‐0.11] |
| 2.2 moderate (subgroup MMSE 10 to <20) | 8 | 1448 | Std. Mean Difference (IV, Random, 95% CI) | ‐0.27 [‐0.37, ‐0.16] |
| 2.3 mild (subgroup MMSE ≥20) | 4 | 619 | Std. Mean Difference (IV, Random, 95% CI) | ‐0.03 [‐0.19, 0.13] |
| 3 Decline in ADL: post‐hoc within‐trial subgroup analyses Show forest plot | 8 | 2615 | Std. Mean Difference (IV, Fixed, 95% CI) | ‐0.10 [‐0.18, ‐0.02] |
| 3.1 severe (MMSE mean <10) | 4 | 531 | Std. Mean Difference (IV, Fixed, 95% CI) | ‐0.18 [‐0.35, ‐0.01] |
| 3.2 moderate (subgroup MMSE 10 to <20) | 8 | 1463 | Std. Mean Difference (IV, Fixed, 95% CI) | ‐0.13 [‐0.23, ‐0.02] |
| 3.3 mild (subgroup MMSE ≥20) | 4 | 621 | Std. Mean Difference (IV, Fixed, 95% CI) | 0.02 [‐0.14, 0.18] |
| 4 Clinical Global: by severity of disease Show forest plot | 10 | 3224 | Std. Mean Difference (IV, Fixed, 95% CI) | ‐0.19 [‐0.26, ‐0.12] |
| 4.1 severe (MMSE mean <10) | 2 | 548 | Std. Mean Difference (IV, Fixed, 95% CI) | ‐0.16 [‐0.33, 0.01] |
| 4.2 moderate/severe (MMSE mean 10‐12) | 5 | 1557 | Std. Mean Difference (IV, Fixed, 95% CI) | ‐0.24 [‐0.34, ‐0.14] |
| 4.3 moderate (post hoc within‐trial subgroup) | 3 | 692 | Std. Mean Difference (IV, Fixed, 95% CI) | ‐0.16 [‐0.31, ‐0.00] |
| 4.4 mild (post hoc within‐trial subgroup MMSE ≥20) | 3 | 427 | Std. Mean Difference (IV, Fixed, 95% CI) | ‐0.08 [‐0.27, 0.12] |
| 5 Cognitive Function: by severity of disease Show forest plot | 14 | 4131 | Std. Mean Difference (IV, Fixed, 95% CI) | ‐0.23 [‐0.29, ‐0.17] |
| 5.1 severe (MMSE mean <10) | 3 | 690 | Std. Mean Difference (IV, Fixed, 95% CI) | ‐0.42 [‐0.57, ‐0.27] |
| 5.2 moderate/severe (MMSE mean 10‐12) | 6 | 1852 | Std. Mean Difference (IV, Fixed, 95% CI) | ‐0.23 [‐0.32, ‐0.14] |
| 5.3 moderate (post hoc within‐trial subgroup) | 4 | 795 | Std. Mean Difference (IV, Fixed, 95% CI) | ‐0.25 [‐0.40, ‐0.11] |
| 5.4 mild (post hoc within‐trial subgroup and mean MMSE ≥20) | 5 | 794 | Std. Mean Difference (IV, Fixed, 95% CI) | ‐0.03 [‐0.17, 0.11] |
| 6 Decline in ADL: by severity of disease Show forest plot | 12 | 3457 | Std. Mean Difference (IV, Fixed, 95% CI) | ‐0.12 [‐0.19, ‐0.06] |
| 6.1 severe (MMSE mean <10) | 2 | 324 | Std. Mean Difference (IV, Fixed, 95% CI) | ‐0.36 [‐0.59, ‐0.14] |
| 6.2 moderate/severe (MMSE mean 10‐12) | 5 | 1554 | Std. Mean Difference (IV, Fixed, 95% CI) | ‐0.15 [‐0.25, ‐0.05] |
| 6.3 moderate (post hoc within‐trial subgroup) | 4 | 809 | Std. Mean Difference (IV, Fixed, 95% CI) | ‐0.10 [‐0.25, 0.04] |
| 6.4 mild (post hoc within‐trial subgroup and mean MMSE ≥20) | 5 | 770 | Std. Mean Difference (IV, Fixed, 95% CI) | 0.02 [‐0.12, 0.16] |
| 7 Behaviour and Mood: by severity of disease Show forest plot | 14 | 4295 | Std. Mean Difference (IV, Fixed, 95% CI) | ‐0.12 [‐0.18, ‐0.06] |
| 7.1 severe (MMSE mean <10) | 3 | 749 | Std. Mean Difference (IV, Fixed, 95% CI) | ‐0.25 [‐0.40, ‐0.11] |
| 7.2 moderate/severe (MMSE mean 10‐12) | 7 | 2116 | Std. Mean Difference (IV, Fixed, 95% CI) | ‐0.14 [‐0.23, ‐0.06] |
| 7.3 moderate (post hoc within‐trial subgroup) | 4 | 809 | Std. Mean Difference (IV, Fixed, 95% CI) | ‐0.02 [‐0.17, 0.12] |
| 7.4 mild (post hoc within‐trial subgroup MMSE ≥20) | 4 | 621 | Std. Mean Difference (IV, Fixed, 95% CI) | 0.02 [‐0.14, 0.18] |