Memantina para la demencia
Información
- DOI:
- https://doi.org/10.1002/14651858.CD003154.pub6Copiar DOI

- Base de datos:
-
- Cochrane Database of Systematic Reviews
- Versión publicada:
-
- 20 marzo 2019see what's new
- Tipo:
-
- Intervention
- Etapa:
-
- Review
- Grupo Editorial Cochrane:
-
Grupo Cochrane de Demencia y trastornos cognitivos
- Copyright:
-
- Copyright © 2019 The Cochrane Collaboration. Published by John Wiley & Sons, Ltd.
Cifras del artículo
Altmetric:
Citado por:
Autores
Contributions of authors
Earlier versions
Neda Minakaran contributed search for trials, extracted data, data entry, data analysis to the previous version
Almudena Areosa Sartre contributed to all except the last version of this review through drafting, trial searching, obtaining copies of trial reports, selection of trials for inclusion–exclusion; extraction of data, entry of data, interpretation of data analysis
Jacqueline Birks assisted in the selection of trials for inclusion and exclusion and checked the analyses of early versions.
Dymphna Hermans performed previous searches.
Lon Schneider was the Contact Editor for previous versions
This update
MW, RMcS: complete revision of text, replicating data extraction, analysis, interpretation, drafting.
ER: Data extraction, analysis, drafting.
Lon Schneider, Karen Dagerman, and Julian Higgins contributed the analysis of data from mild AD patients.
Sources of support
Internal sources
-
Cochrane Dementia & Cognitive Improvement Group, UK.
External sources
-
Alzheimer's Society, UK.
-
NIHR, UK.
This review update was supported by the National Institute for Health Research (NIHR), via Cochrane Infrastructure funding to the Cochrane Dementia and Cognitive Improvement group. The views and opinions expressed therein are those of the authors and do not necessarily reflect those of the Systematic Reviews Programme, NIHR, National Health Service or the Department of Health
Declarations of interest
Rupert McShane ‐ won a randomly selected prize worth less than £500 for attending two consecutive early morning sessions sponsored by Merz and Lundbeck at the Stockholm 2005 IPA meeting. He was a local investigator for two investigator initiated studies of memantine which were funded by Lundbeck (a study of short‐term treatment of memantine for agitation Fox 2012 (MAGD), and a six‐month study assessing maintenance of antipsychotic versus switch to memantine (Ballard 2015 (MAIN‐AD)); and for one MRC funded trial (Howard 2012 (DOMINO‐AD)).
Maggi Westby ‐ received remuneration for her role in writing this review.
Emmert Roberts ‐ none known
Neda Minakaran ‐ none known
Lon Schneider ‐ none known
Lucy E Farrimond ‐ none known
Nicola Maayan ‐ none known
Jennifer Ware ‐ none known
Jean Debarros ‐ none known
Acknowledgements
We thank Anna Noel Storr for running the searches and creating and maintaining ALOIS, Sue Marcus for guiding this so patiently to publication.
We thank Merz for providing an unpublished breakdown of global ratings of change and NOSGER scores from Wilcock 2002 (9202), Lundbeck for providing unpublished details of Lundbeck 2006 (10116).
We are grateful to the anonymous peer reviewers of previous versions of the review and to Elizabeta Mukaetova‐Ladinska and Gad A Marshall who peer reviewed this update.
We also thank Dr Kiyomi Shinohara for her translation of the Japanese paper, Nakamura 2016.
Version history
| Published | Title | Stage | Authors | Version |
| 2019 Mar 20 | Memantine for dementia | Review | Rupert McShane, Maggie J Westby, Emmert Roberts, Neda Minakaran, Lon Schneider, Lucy E Farrimond, Nicola Maayan, Jennifer Ware, Jean Debarros | |
| 2006 Apr 19 | Memantine for dementia | Review | Rupert McShane, Almudena Areosa Sastre, Neda Minakaran | |
| 2005 Jul 20 | Memantine for dementia | Review | Almudena Areosa Sastre, Fiona Sherriff, Rupert McShane | |
| 2005 Jul 20 | Memantine for dementia | Review | Almudena Areosa Sastre, Fiona Sherriff, Rupert McShane | |
| 2004 Oct 18 | Memantine for dementia | Review | Almudena Areosa Sastre, Fiona Sherriff | |
| 2003 Jul 21 | Memantine for dementia | Review | Almudena Areosa Sastre, Fiona Sherriff | |
Differences between protocol and review
The analysis of memantine in mild Alzheimer's disease (AD), and assessment of dual versus monotherapy were not included in the protocol. The possibility of trials in non‐AD or vascular dementia was omitted from the protocol, but in this update of the review each diagnosis is considered separately.
Keywords
MeSH
Medical Subject Headings (MeSH) Keywords
- Activities of Daily Living;
- Akathisia, Drug‐Induced [etiology];
- Alzheimer Disease [drug therapy];
- Cognition Disorders [drug therapy];
- Dementia [*drug therapy];
- Dementia, Vascular [drug therapy];
- Excitatory Amino Acid Antagonists [adverse effects, *therapeutic use];
- Memantine [adverse effects, *therapeutic use];
- Randomized Controlled Trials as Topic;
- Withholding Treatment;
Medical Subject Headings Check Words
Aged; Aged, 80 and over; Humans;
PICO

Study flow diagram of studies identified

'Risk of bias' summary: review authors' judgements about each risk of bias item for each included study.

'Risk of bia's graph: review authors' judgements about each risk of bias item presented as percentages across all included studies.

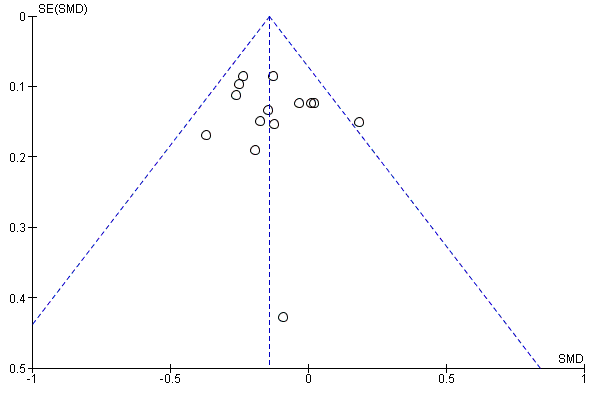
Funnel plot of comparison: 1 Memantine 20 mg or equivalent vs placebo for moderate‐to‐severe Alzheimer's disease. 24‐30 week data. OC, outcome: 1.1 Clinical Global.

Funnel plot of comparison: 1 Memantine 20 mg or equivalent vs placebo for moderate‐to‐severe Alzheimer's disease. 24‐30 week data. OC, outcome: 1.2 Cognitive Function.

Funnel plot of comparison: 1 Memantine 20 mg or equivalent vs placebo for moderate‐to‐severe Alzheimer's disease. 24‐30 week data. OC, outcome: 1.3 Decline in ADL.
Funnel plot of comparison: 1 Memantine 20 mg or equivalent vs placebo for moderate‐to‐severe Alzheimer's disease. 24‐30 week data. OC, outcome: 1.4 Behaviour and Mood.
Funnel plot of comparison: 1 Memantine 20 mg or equivalent vs placebo for moderate‐to‐severe Alzheimer's disease. 24‐30 week data. OC, outcome: 1.5 All‐cause discontinuation.

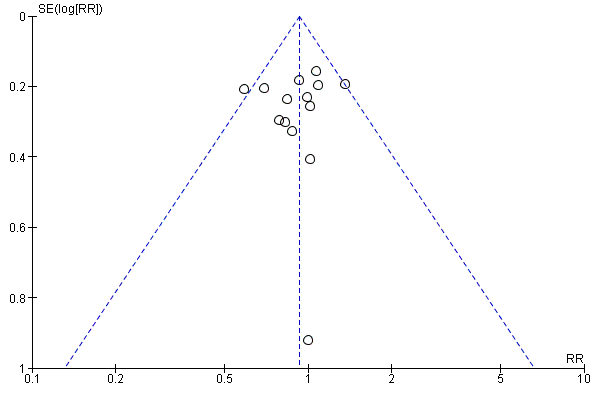
Funnel plot of comparison: 12 Adverse reactions ‐ Memantine vs placebo for mild to severe dementia. All diagnoses, all durations, outcome: 12.3 Number suffering at least one adverse event.
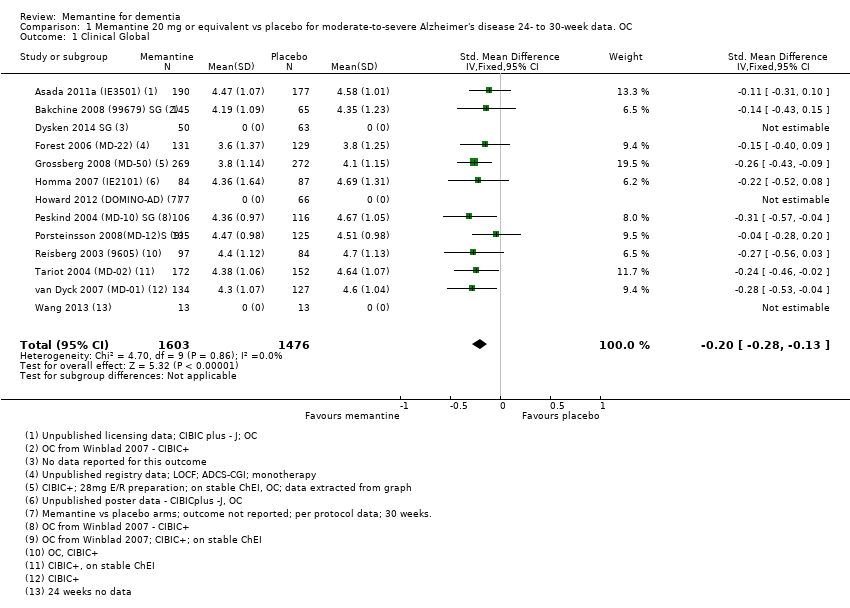
Comparison 1 Memantine 20 mg or equivalent vs placebo for moderate‐to‐severe Alzheimer's disease 24‐ to 30‐week data. OC, Outcome 1 Clinical Global.

Comparison 1 Memantine 20 mg or equivalent vs placebo for moderate‐to‐severe Alzheimer's disease 24‐ to 30‐week data. OC, Outcome 2 Cognitive Function.

Comparison 1 Memantine 20 mg or equivalent vs placebo for moderate‐to‐severe Alzheimer's disease 24‐ to 30‐week data. OC, Outcome 3 Decline in ADL.

Comparison 1 Memantine 20 mg or equivalent vs placebo for moderate‐to‐severe Alzheimer's disease 24‐ to 30‐week data. OC, Outcome 4 Behaviour and Mood.

Comparison 1 Memantine 20 mg or equivalent vs placebo for moderate‐to‐severe Alzheimer's disease 24‐ to 30‐week data. OC, Outcome 5 All‐cause discontinuation.
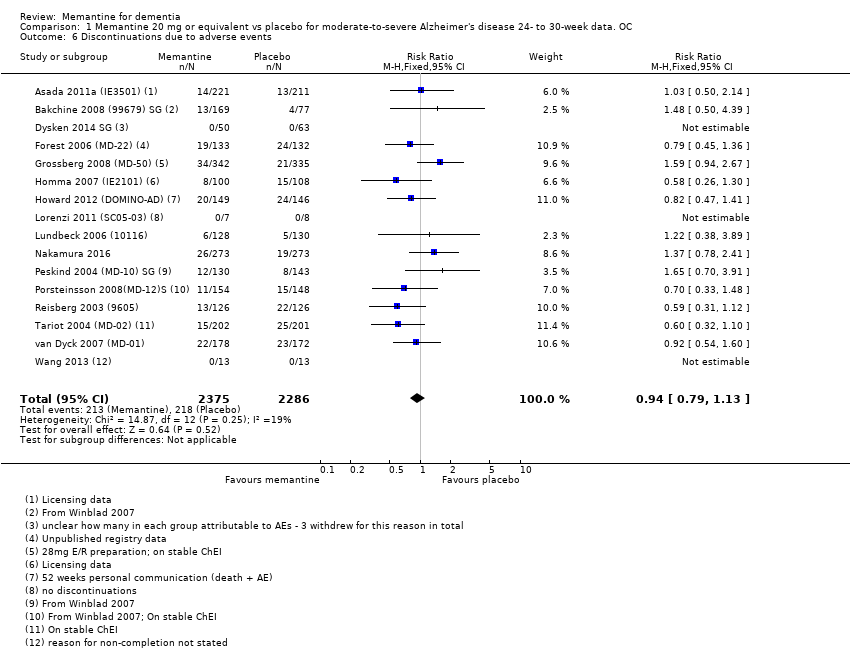
Comparison 1 Memantine 20 mg or equivalent vs placebo for moderate‐to‐severe Alzheimer's disease 24‐ to 30‐week data. OC, Outcome 6 Discontinuations due to adverse events.

Comparison 1 Memantine 20 mg or equivalent vs placebo for moderate‐to‐severe Alzheimer's disease 24‐ to 30‐week data. OC, Outcome 7 Number suffering at least one adverse event.
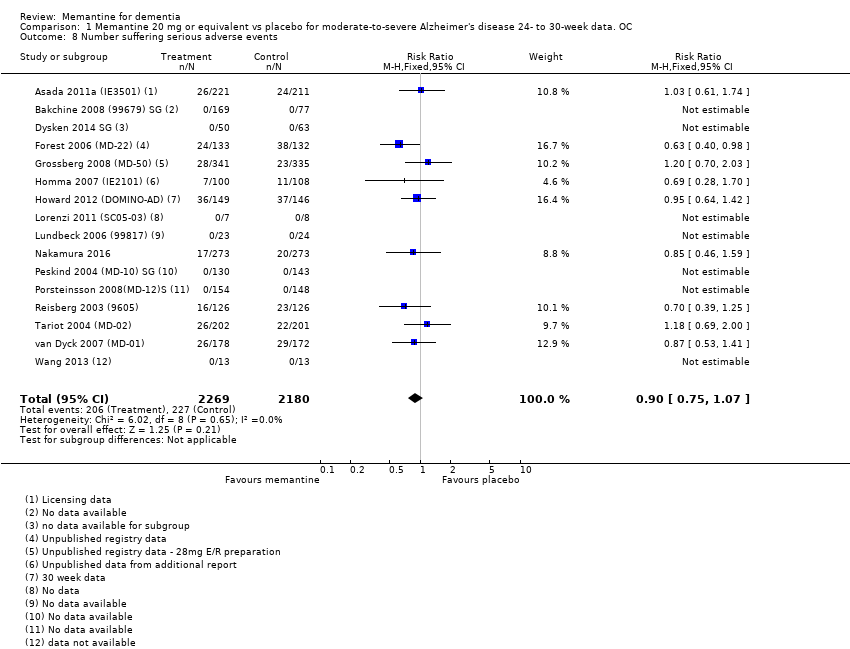
Comparison 1 Memantine 20 mg or equivalent vs placebo for moderate‐to‐severe Alzheimer's disease 24‐ to 30‐week data. OC, Outcome 8 Number suffering serious adverse events.

Comparison 1 Memantine 20 mg or equivalent vs placebo for moderate‐to‐severe Alzheimer's disease 24‐ to 30‐week data. OC, Outcome 9 Number suffering agitation as an adverse event.

Comparison 2 Memantine 20 mg or equivalent vs placebo in patients taking versus not taking cholinesterase inhibitors with moderate to severe Alzheimer's disease 24‐ to 30‐week data, Outcome 1 Clinical Global: subgroup analysis by +/‐ ChEI.

Comparison 2 Memantine 20 mg or equivalent vs placebo in patients taking versus not taking cholinesterase inhibitors with moderate to severe Alzheimer's disease 24‐ to 30‐week data, Outcome 2 Cognitive Function subgroup analysis by +/‐ ChEI.

Comparison 2 Memantine 20 mg or equivalent vs placebo in patients taking versus not taking cholinesterase inhibitors with moderate to severe Alzheimer's disease 24‐ to 30‐week data, Outcome 3 Decline in ADL: subgroup analysis by +/‐ ChEI.

Comparison 2 Memantine 20 mg or equivalent vs placebo in patients taking versus not taking cholinesterase inhibitors with moderate to severe Alzheimer's disease 24‐ to 30‐week data, Outcome 4 Behaviour and Mood: subgroup analysis by +/‐ ChEI.

Comparison 2 Memantine 20 mg or equivalent vs placebo in patients taking versus not taking cholinesterase inhibitors with moderate to severe Alzheimer's disease 24‐ to 30‐week data, Outcome 5 Cognitive function (sMMSE):subgroup analysis within randomised study ‐ per protocol.

Comparison 2 Memantine 20 mg or equivalent vs placebo in patients taking versus not taking cholinesterase inhibitors with moderate to severe Alzheimer's disease 24‐ to 30‐week data, Outcome 6 Decline in ADL (BADL): subgroup analysis within randomised study ‐ per protocol.

Comparison 2 Memantine 20 mg or equivalent vs placebo in patients taking versus not taking cholinesterase inhibitors with moderate to severe Alzheimer's disease 24‐ to 30‐week data, Outcome 7 NPI: subgroup analysis within randomised study ‐ per protocol.

Comparison 2 Memantine 20 mg or equivalent vs placebo in patients taking versus not taking cholinesterase inhibitors with moderate to severe Alzheimer's disease 24‐ to 30‐week data, Outcome 8 Clinical Global: CIBIC+ mean difference; ChEI subgroup.
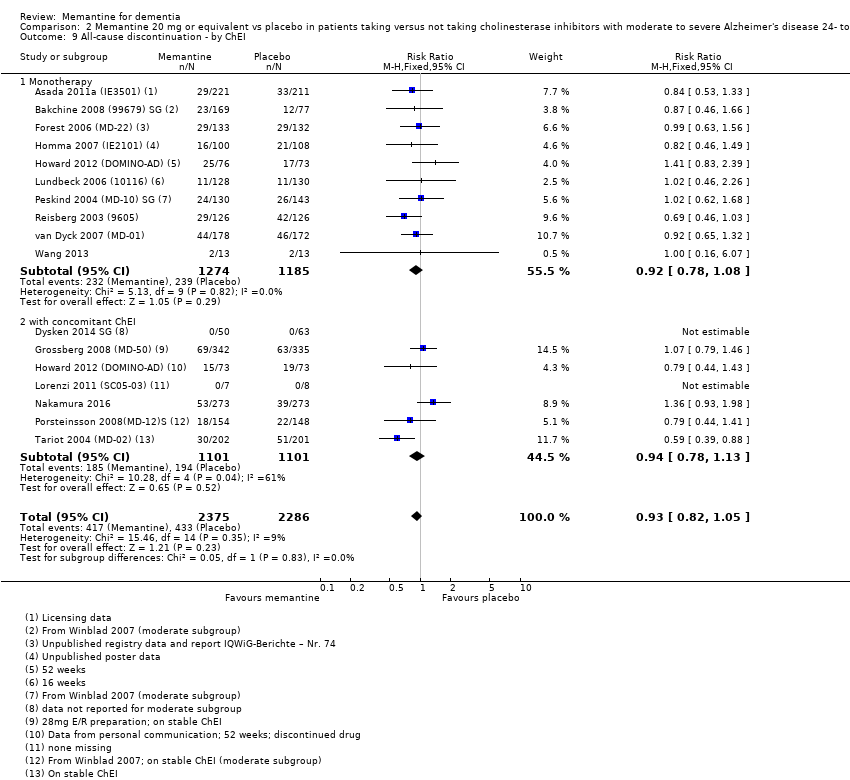
Comparison 2 Memantine 20 mg or equivalent vs placebo in patients taking versus not taking cholinesterase inhibitors with moderate to severe Alzheimer's disease 24‐ to 30‐week data, Outcome 9 All‐cause discontinuation ‐ by ChEI.

Comparison 2 Memantine 20 mg or equivalent vs placebo in patients taking versus not taking cholinesterase inhibitors with moderate to severe Alzheimer's disease 24‐ to 30‐week data, Outcome 10 Discontinuations due to adverse events ‐ by ChEI.
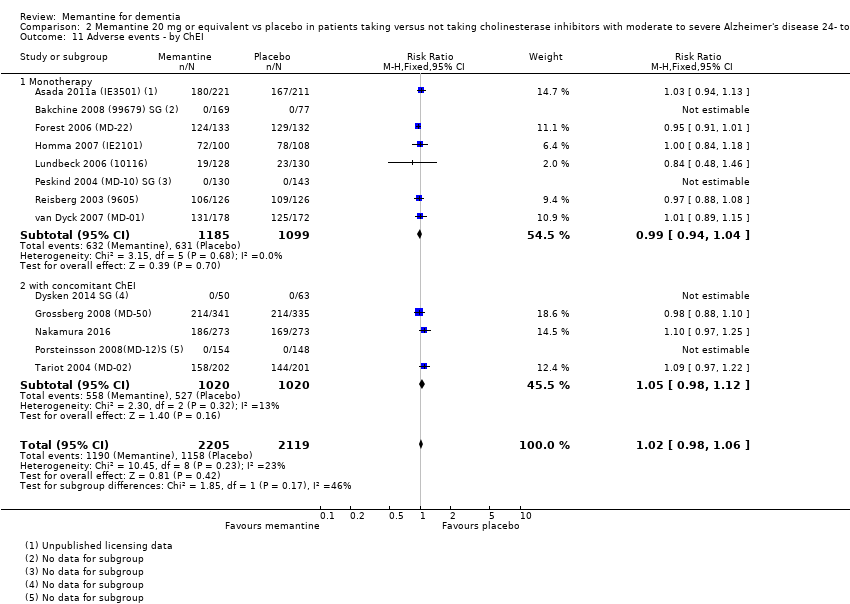
Comparison 2 Memantine 20 mg or equivalent vs placebo in patients taking versus not taking cholinesterase inhibitors with moderate to severe Alzheimer's disease 24‐ to 30‐week data, Outcome 11 Adverse events ‐ by ChEI.

Comparison 2 Memantine 20 mg or equivalent vs placebo in patients taking versus not taking cholinesterase inhibitors with moderate to severe Alzheimer's disease 24‐ to 30‐week data, Outcome 12 Serious adverse events ‐ by ChEI.

Comparison 2 Memantine 20 mg or equivalent vs placebo in patients taking versus not taking cholinesterase inhibitors with moderate to severe Alzheimer's disease 24‐ to 30‐week data, Outcome 13 Number suffering agitation as an adverse event ‐ by ChEI.

Comparison 2 Memantine 20 mg or equivalent vs placebo in patients taking versus not taking cholinesterase inhibitors with moderate to severe Alzheimer's disease 24‐ to 30‐week data, Outcome 14 Memantine + donepezil vs memantine + placebo.
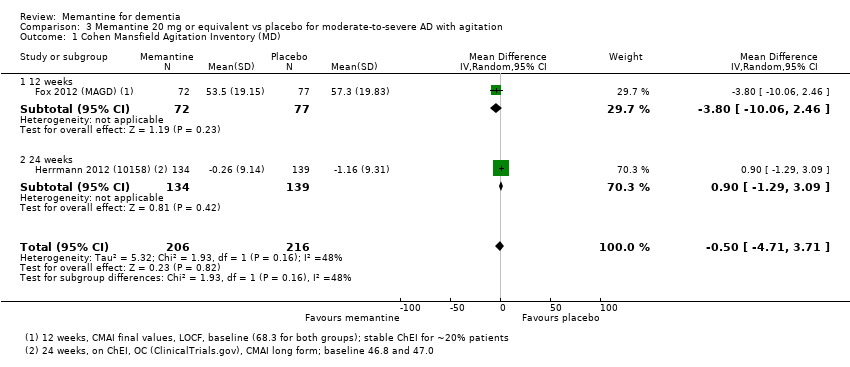
Comparison 3 Memantine 20 mg or equivalent vs placebo for moderate‐to‐severe AD with agitation, Outcome 1 Cohen Mansfield Agitation Inventory (MD).

Comparison 3 Memantine 20 mg or equivalent vs placebo for moderate‐to‐severe AD with agitation, Outcome 2 Cohen Mansfield Agitation Inventory (SMD).

Comparison 3 Memantine 20 mg or equivalent vs placebo for moderate‐to‐severe AD with agitation, Outcome 3 NPI agitation subscale.
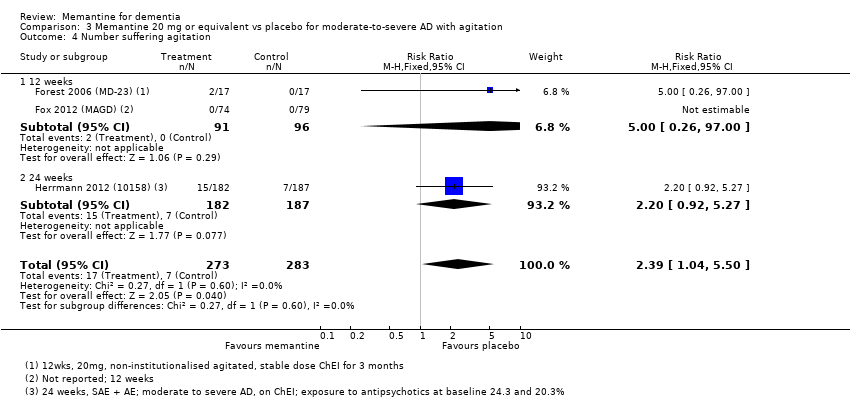
Comparison 3 Memantine 20 mg or equivalent vs placebo for moderate‐to‐severe AD with agitation, Outcome 4 Number suffering agitation.
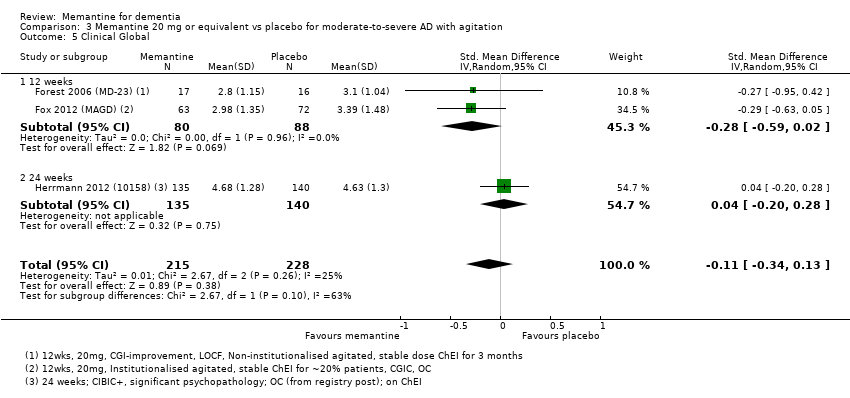
Comparison 3 Memantine 20 mg or equivalent vs placebo for moderate‐to‐severe AD with agitation, Outcome 5 Clinical Global.
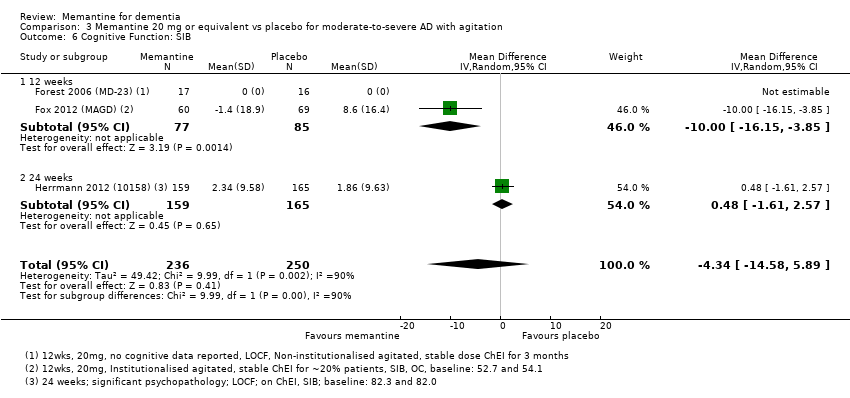
Comparison 3 Memantine 20 mg or equivalent vs placebo for moderate‐to‐severe AD with agitation, Outcome 6 Cognitive Function: SIB.

Comparison 3 Memantine 20 mg or equivalent vs placebo for moderate‐to‐severe AD with agitation, Outcome 7 Decline in ADL: ADCS‐ADL19.

Comparison 3 Memantine 20 mg or equivalent vs placebo for moderate‐to‐severe AD with agitation, Outcome 8 Behaviour and Mood.

Comparison 3 Memantine 20 mg or equivalent vs placebo for moderate‐to‐severe AD with agitation, Outcome 9 All‐cause discontinuation.

Comparison 3 Memantine 20 mg or equivalent vs placebo for moderate‐to‐severe AD with agitation, Outcome 10 Discontinuations due to adverse events.
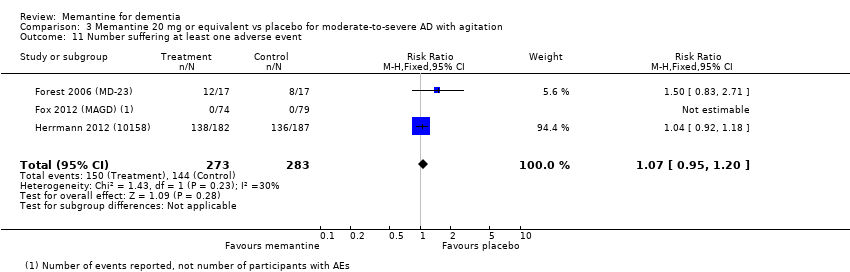
Comparison 3 Memantine 20 mg or equivalent vs placebo for moderate‐to‐severe AD with agitation, Outcome 11 Number suffering at least one adverse event.
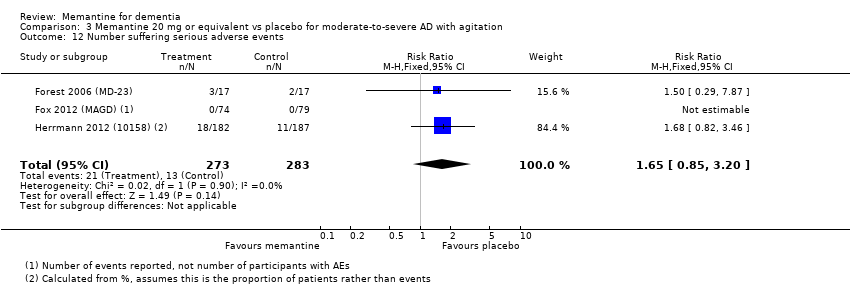
Comparison 3 Memantine 20 mg or equivalent vs placebo for moderate‐to‐severe AD with agitation, Outcome 12 Number suffering serious adverse events.

Comparison 4 Memantine 20 mg vs placebo for mild AD (MMSE 20‐23) OC six‐month studies, Outcome 1 Clinical global: CIBIC+.
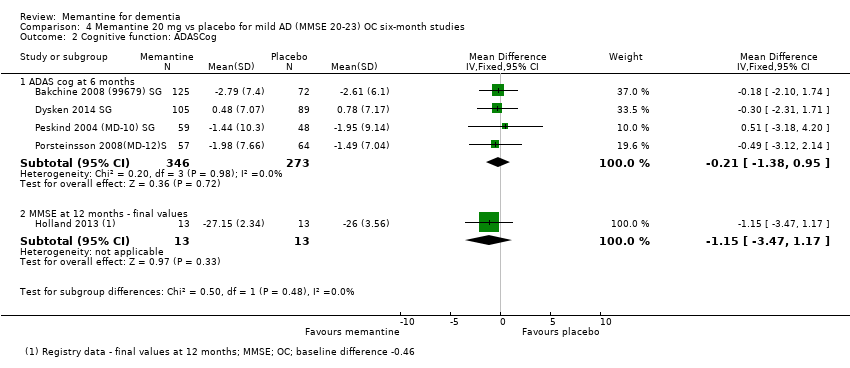
Comparison 4 Memantine 20 mg vs placebo for mild AD (MMSE 20‐23) OC six‐month studies, Outcome 2 Cognitive function: ADASCog.
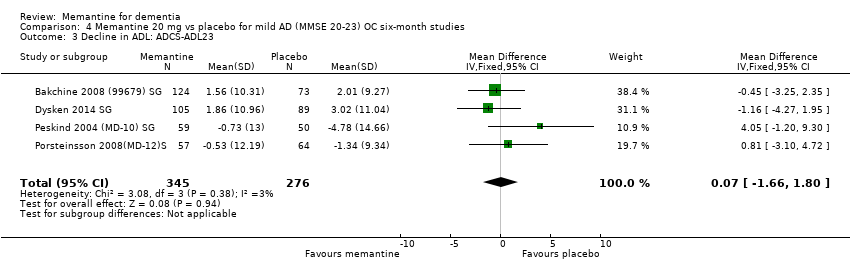
Comparison 4 Memantine 20 mg vs placebo for mild AD (MMSE 20‐23) OC six‐month studies, Outcome 3 Decline in ADL: ADCS‐ADL23.

Comparison 4 Memantine 20 mg vs placebo for mild AD (MMSE 20‐23) OC six‐month studies, Outcome 4 Behaviour and mood: NPI.

Comparison 5 Memantine 20 mg vs placebo for mild‐to‐moderate vascular dementia. Six‐month studies, Outcome 1 Clinical Global: CGI.

Comparison 5 Memantine 20 mg vs placebo for mild‐to‐moderate vascular dementia. Six‐month studies, Outcome 2 Cognitive function: ADAS‐Cog.
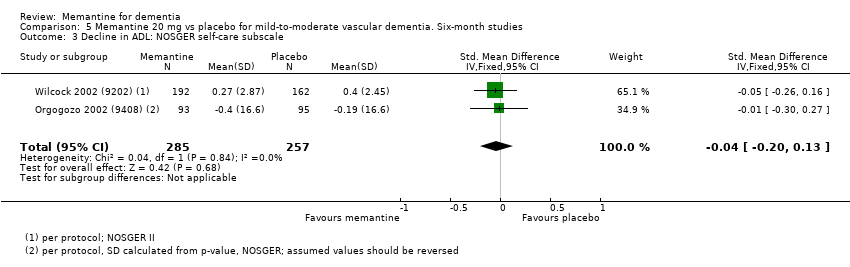
Comparison 5 Memantine 20 mg vs placebo for mild‐to‐moderate vascular dementia. Six‐month studies, Outcome 3 Decline in ADL: NOSGER self‐care subscale.

Comparison 5 Memantine 20 mg vs placebo for mild‐to‐moderate vascular dementia. Six‐month studies, Outcome 4 Behaviour: NOSGER disturbing behaviour subscale.

Comparison 5 Memantine 20 mg vs placebo for mild‐to‐moderate vascular dementia. Six‐month studies, Outcome 5 Cognitive function: ADAS‐Cog: post‐hoc subgroup analysis.
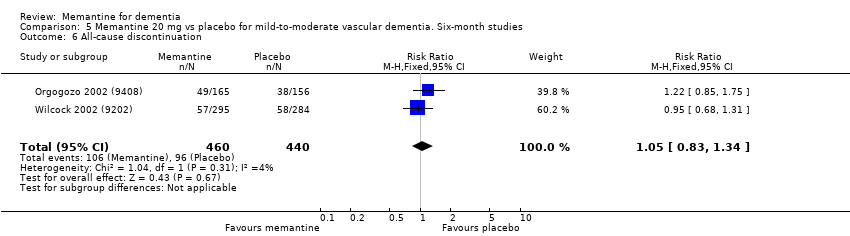
Comparison 5 Memantine 20 mg vs placebo for mild‐to‐moderate vascular dementia. Six‐month studies, Outcome 6 All‐cause discontinuation.

Comparison 5 Memantine 20 mg vs placebo for mild‐to‐moderate vascular dementia. Six‐month studies, Outcome 7 Discontinuation due to adverse events.

Comparison 5 Memantine 20 mg vs placebo for mild‐to‐moderate vascular dementia. Six‐month studies, Outcome 8 Number suffering at least one adverse event.

Comparison 5 Memantine 20 mg vs placebo for mild‐to‐moderate vascular dementia. Six‐month studies, Outcome 9 Number suffering agitation as an adverse event.

Comparison 6 Memantine vs placebo for Parkinson's disease dementia (PDD) and dementia with Lewy bodies (DLB). ITT‐LOCF Data, Outcome 1 Clinical Global (24 weeks).
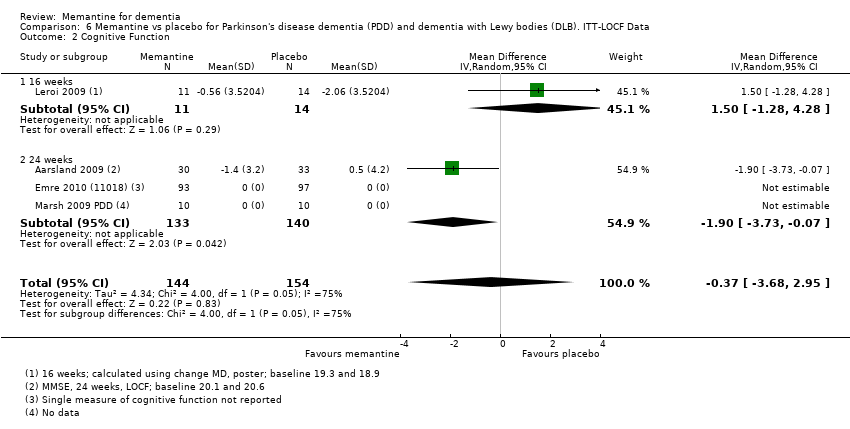
Comparison 6 Memantine vs placebo for Parkinson's disease dementia (PDD) and dementia with Lewy bodies (DLB). ITT‐LOCF Data, Outcome 2 Cognitive Function.

Comparison 6 Memantine vs placebo for Parkinson's disease dementia (PDD) and dementia with Lewy bodies (DLB). ITT‐LOCF Data, Outcome 3 Decline in ADL (24 weeks).

Comparison 6 Memantine vs placebo for Parkinson's disease dementia (PDD) and dementia with Lewy bodies (DLB). ITT‐LOCF Data, Outcome 4 Behaviour and Mood: NPI.

Comparison 6 Memantine vs placebo for Parkinson's disease dementia (PDD) and dementia with Lewy bodies (DLB). ITT‐LOCF Data, Outcome 5 All‐cause discontinuation.

Comparison 6 Memantine vs placebo for Parkinson's disease dementia (PDD) and dementia with Lewy bodies (DLB). ITT‐LOCF Data, Outcome 6 Discontinuation due to adverse events.

Comparison 6 Memantine vs placebo for Parkinson's disease dementia (PDD) and dementia with Lewy bodies (DLB). ITT‐LOCF Data, Outcome 7 Number suffering at least one adverse event.
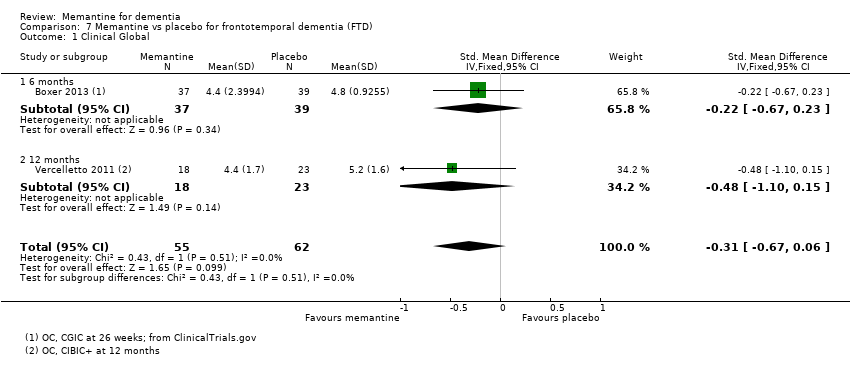
Comparison 7 Memantine vs placebo for frontotemporal dementia (FTD), Outcome 1 Clinical Global.
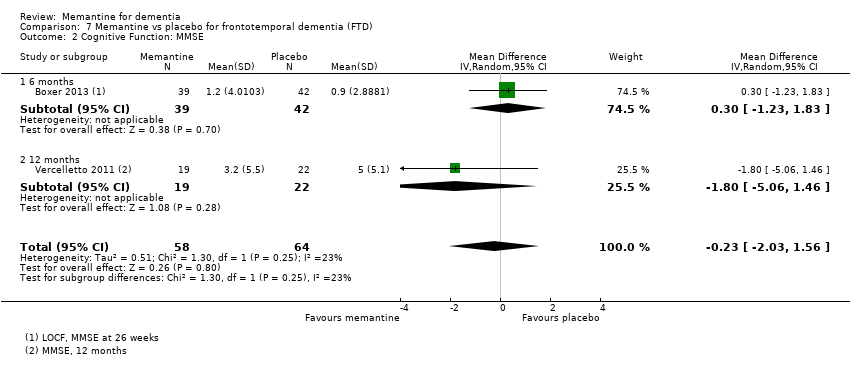
Comparison 7 Memantine vs placebo for frontotemporal dementia (FTD), Outcome 2 Cognitive Function: MMSE.

Comparison 7 Memantine vs placebo for frontotemporal dementia (FTD), Outcome 3 Behaviour and Mood: Neuropsychiatric Inventory (NPI) Total.
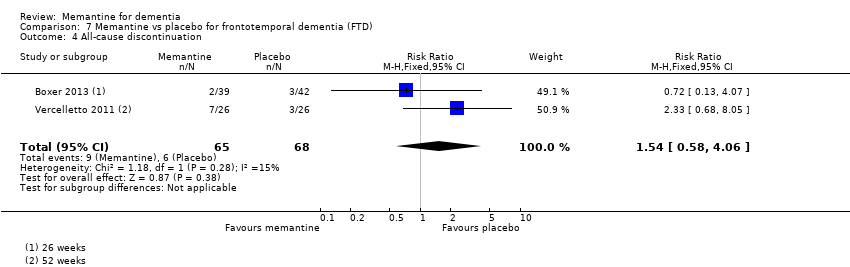
Comparison 7 Memantine vs placebo for frontotemporal dementia (FTD), Outcome 4 All‐cause discontinuation.

Comparison 7 Memantine vs placebo for frontotemporal dementia (FTD), Outcome 5 Discontinuation due to adverse events.
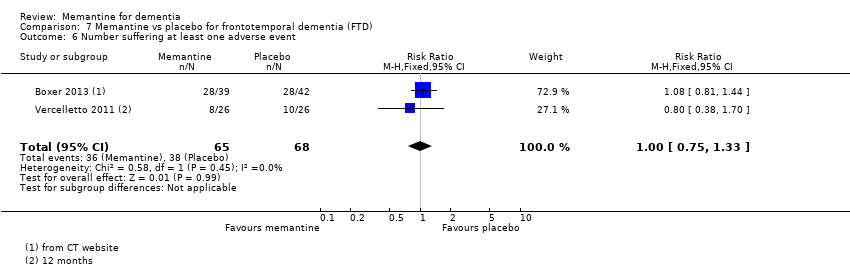
Comparison 7 Memantine vs placebo for frontotemporal dementia (FTD), Outcome 6 Number suffering at least one adverse event.

Comparison 7 Memantine vs placebo for frontotemporal dementia (FTD), Outcome 7 Number suffering at serious adverse events.

Comparison 7 Memantine vs placebo for frontotemporal dementia (FTD), Outcome 8 Number suffering agitation as an adverse event.
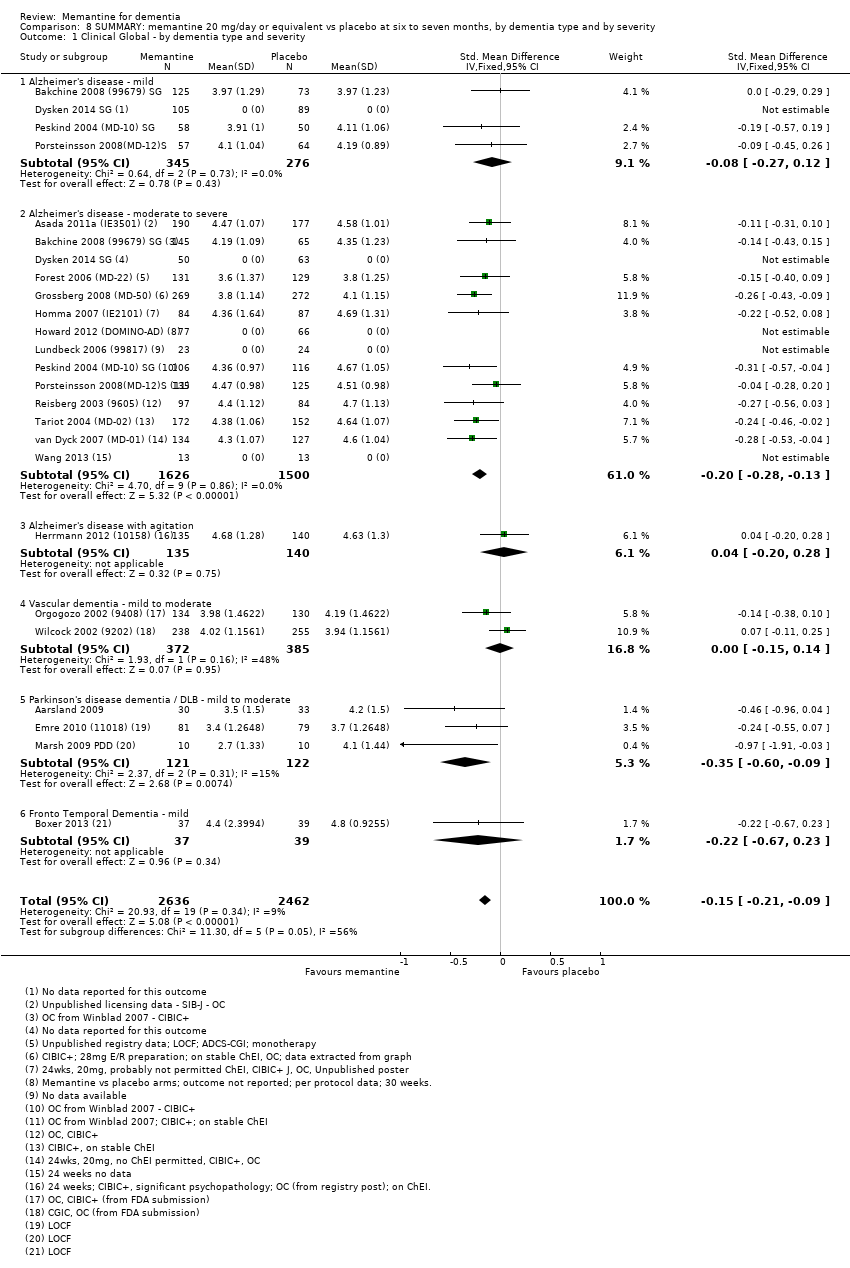
Comparison 8 SUMMARY: memantine 20 mg/day or equivalent vs placebo at six to seven months, by dementia type and by severity, Outcome 1 Clinical Global ‐ by dementia type and severity.

Comparison 8 SUMMARY: memantine 20 mg/day or equivalent vs placebo at six to seven months, by dementia type and by severity, Outcome 2 Cognitive Function ‐ by dementia type and severity.
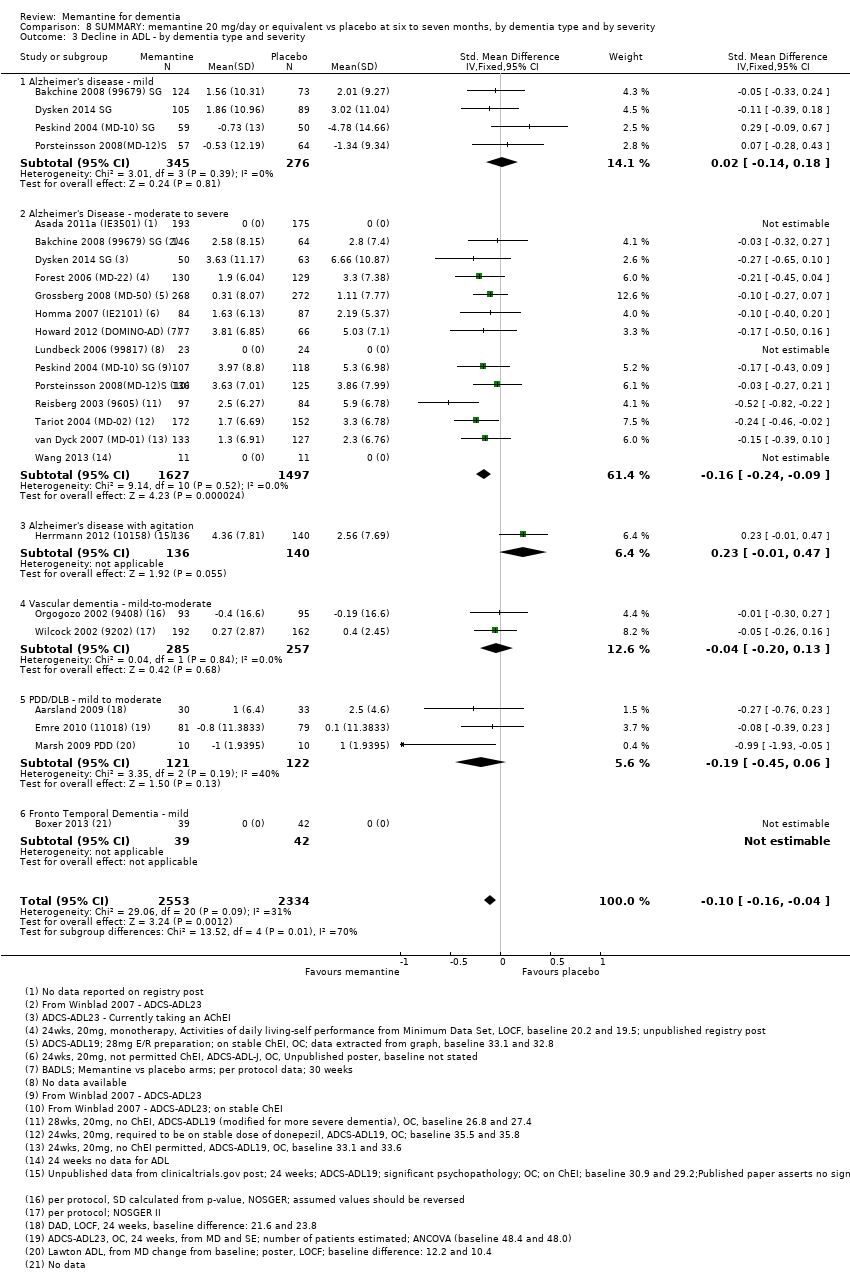
Comparison 8 SUMMARY: memantine 20 mg/day or equivalent vs placebo at six to seven months, by dementia type and by severity, Outcome 3 Decline in ADL ‐ by dementia type and severity.
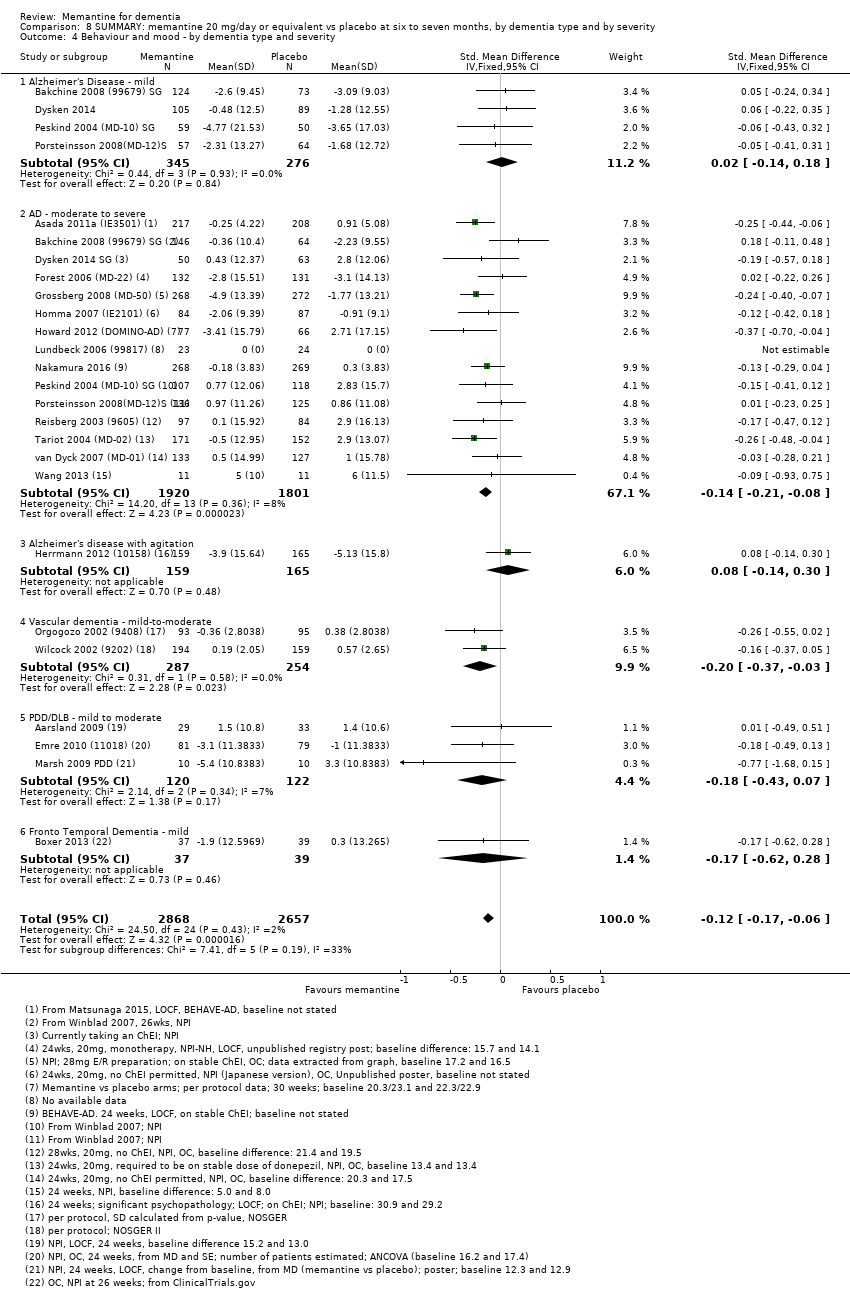
Comparison 8 SUMMARY: memantine 20 mg/day or equivalent vs placebo at six to seven months, by dementia type and by severity, Outcome 4 Behaviour and mood ‐ by dementia type and severity.
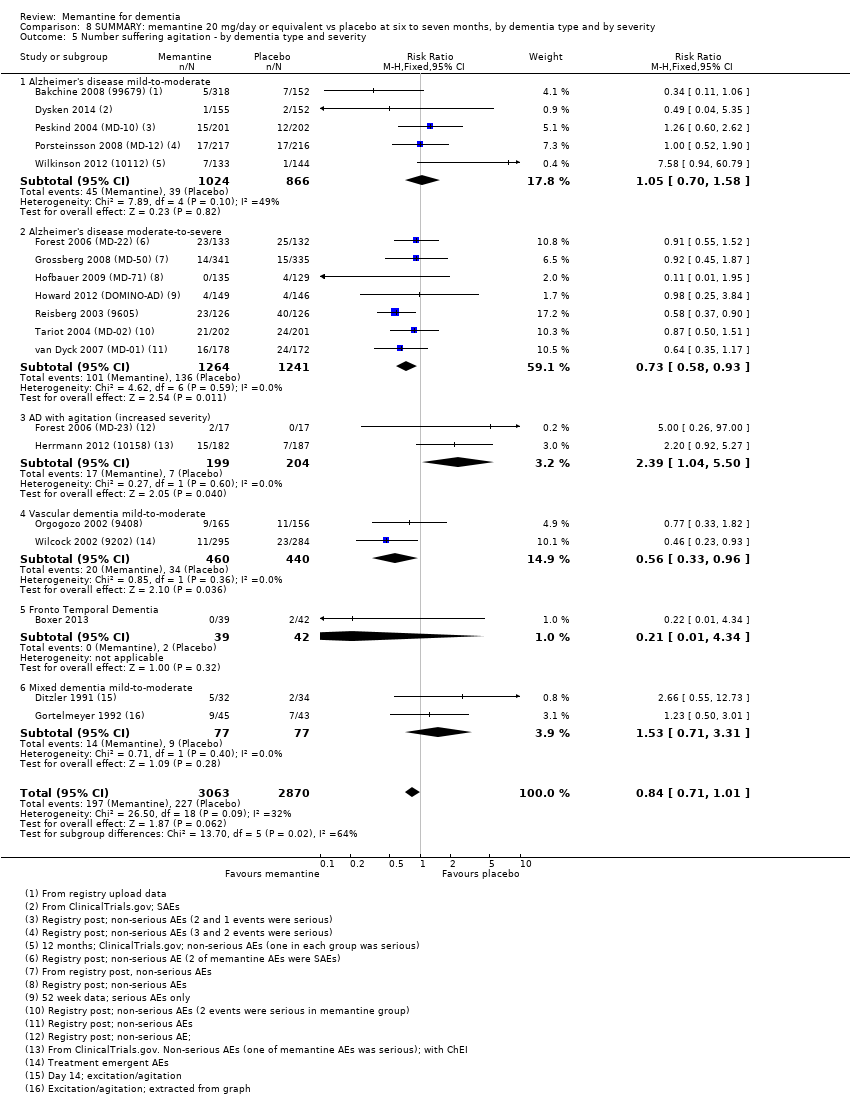
Comparison 8 SUMMARY: memantine 20 mg/day or equivalent vs placebo at six to seven months, by dementia type and by severity, Outcome 5 Number suffering agitation ‐ by dementia type and severity.

Comparison 8 SUMMARY: memantine 20 mg/day or equivalent vs placebo at six to seven months, by dementia type and by severity, Outcome 6 Number suffering agitation ‐ by dementia type and ChEI.
Comparison 8 SUMMARY: memantine 20 mg/day or equivalent vs placebo at six to seven months, by dementia type and by severity, Outcome 7 All‐cause discontinuation (all durations) ‐ by dementia type and severity.

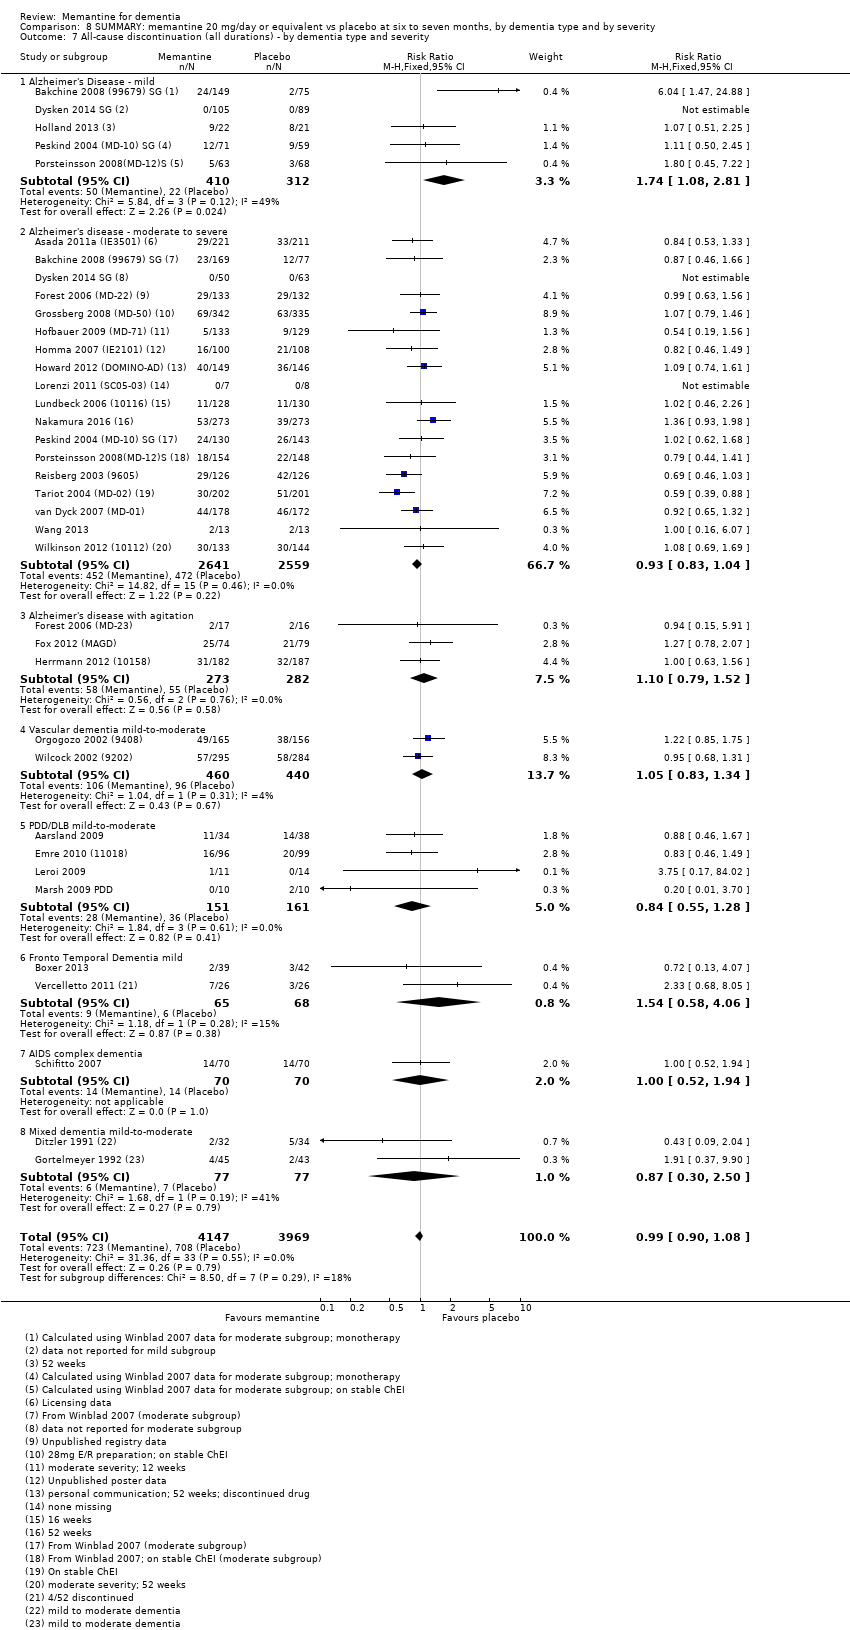
Comparison 8 SUMMARY: memantine 20 mg/day or equivalent vs placebo at six to seven months, by dementia type and by severity, Outcome 8 Discontinuation due to adverse events ‐ by dementia type and severity.
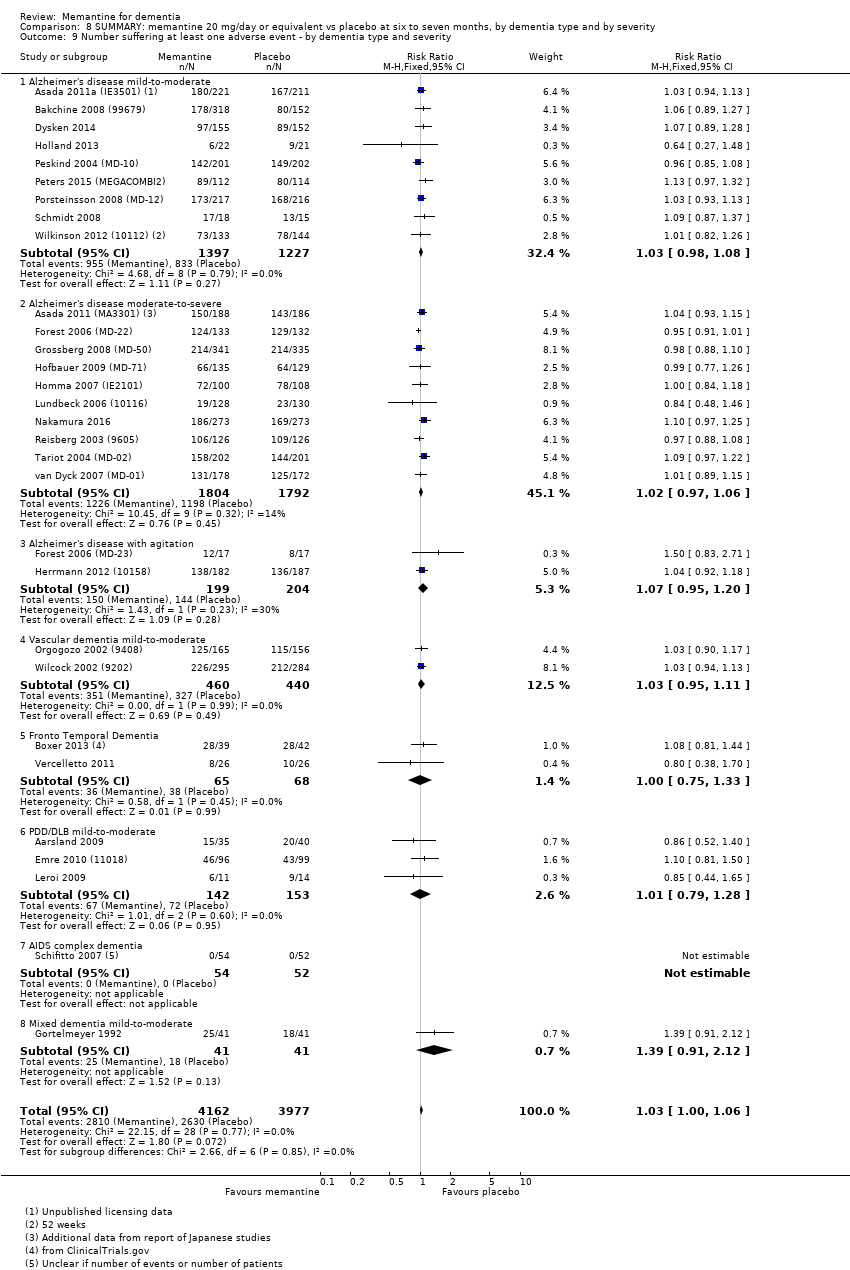
Comparison 8 SUMMARY: memantine 20 mg/day or equivalent vs placebo at six to seven months, by dementia type and by severity, Outcome 9 Number suffering at least one adverse event ‐ by dementia type and severity.
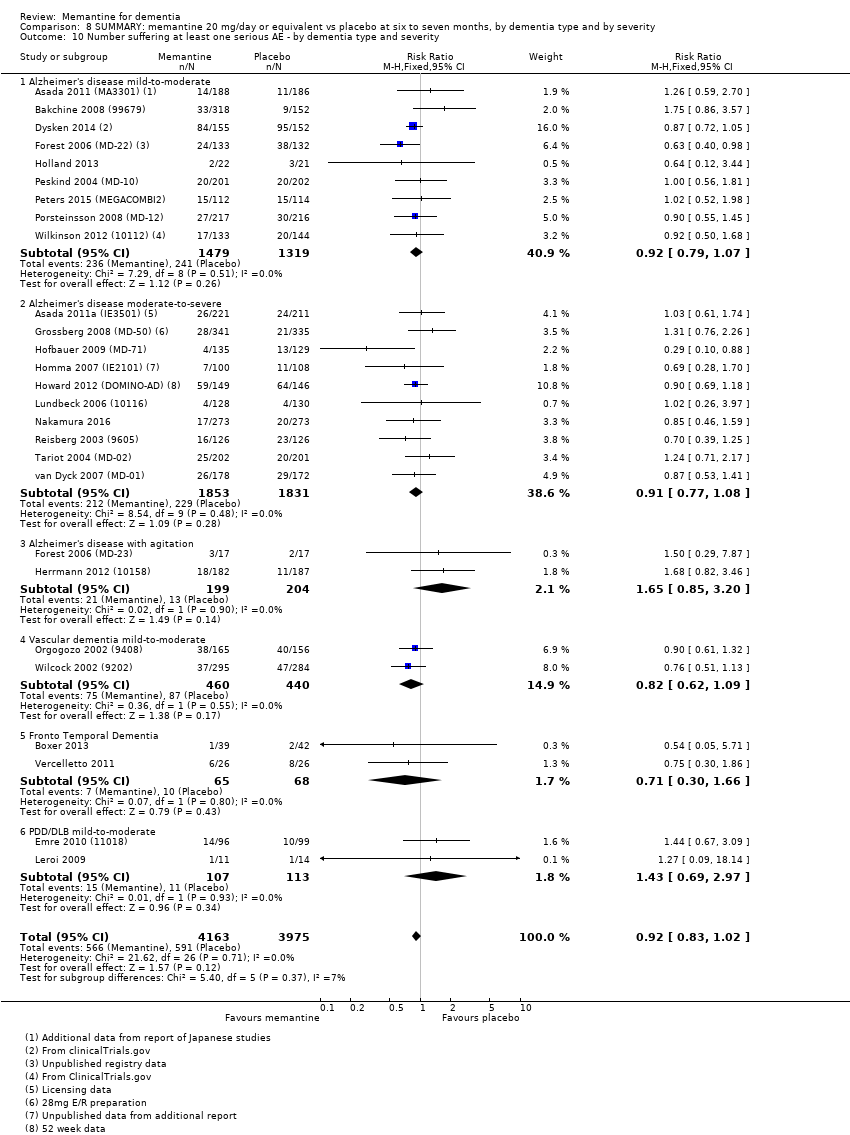
Comparison 8 SUMMARY: memantine 20 mg/day or equivalent vs placebo at six to seven months, by dementia type and by severity, Outcome 10 Number suffering at least one serious AE ‐ by dementia type and severity.
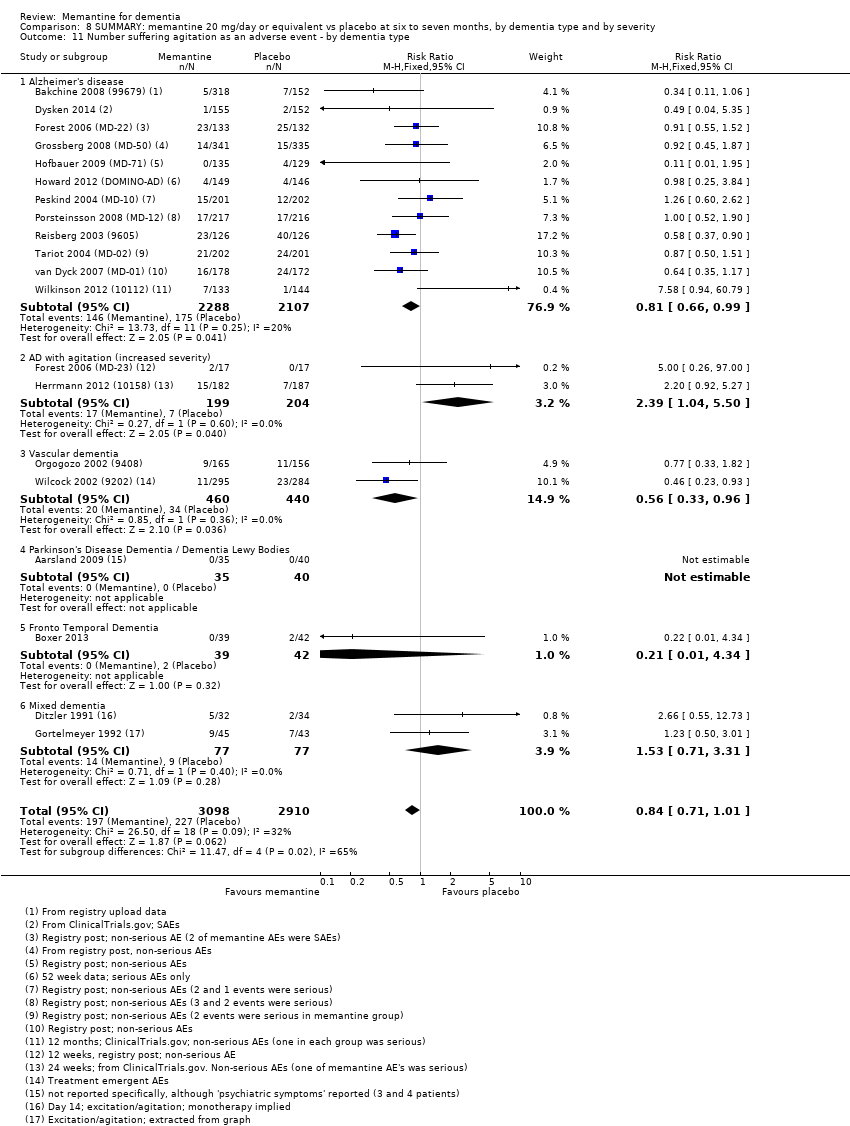
Comparison 8 SUMMARY: memantine 20 mg/day or equivalent vs placebo at six to seven months, by dementia type and by severity, Outcome 11 Number suffering agitation as an adverse event ‐ by dementia type.

Comparison 9 Adverse reactions: memantine vs placebo for mild to severe dementia. All diagnoses, all durations, Outcome 1 All‐cause discontinuation.

Comparison 9 Adverse reactions: memantine vs placebo for mild to severe dementia. All diagnoses, all durations, Outcome 2 Discontinuation due to adverse events.

Comparison 9 Adverse reactions: memantine vs placebo for mild to severe dementia. All diagnoses, all durations, Outcome 3 Number suffering at least one adverse event.

Comparison 9 Adverse reactions: memantine vs placebo for mild to severe dementia. All diagnoses, all durations, Outcome 4 Number suffering serious adverse events.

Comparison 9 Adverse reactions: memantine vs placebo for mild to severe dementia. All diagnoses, all durations, Outcome 5 Number suffering agitation as an adverse event.
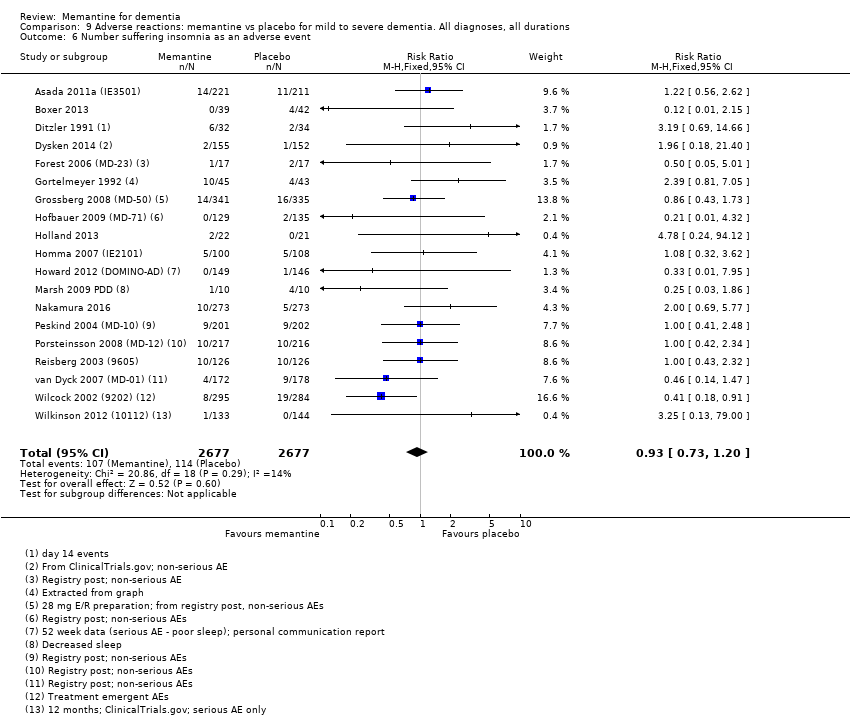
Comparison 9 Adverse reactions: memantine vs placebo for mild to severe dementia. All diagnoses, all durations, Outcome 6 Number suffering insomnia as an adverse event.

Comparison 9 Adverse reactions: memantine vs placebo for mild to severe dementia. All diagnoses, all durations, Outcome 7 Number suffering confusion as an adverse event.
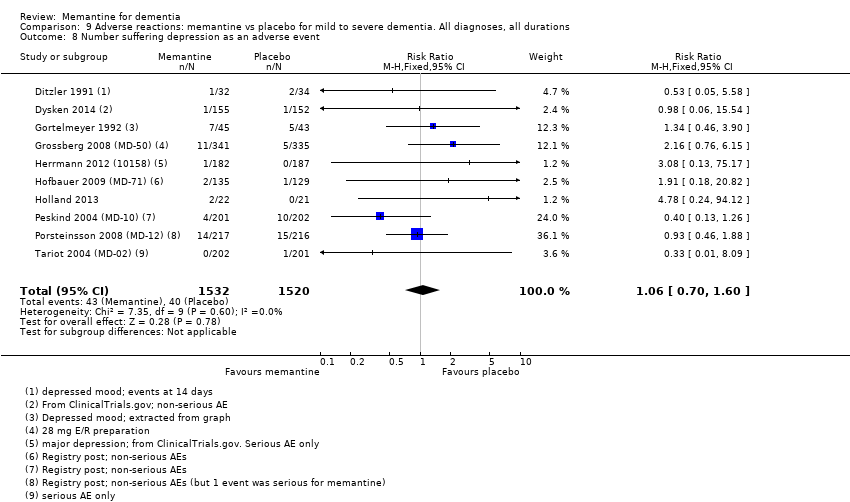
Comparison 9 Adverse reactions: memantine vs placebo for mild to severe dementia. All diagnoses, all durations, Outcome 8 Number suffering depression as an adverse event.

Comparison 9 Adverse reactions: memantine vs placebo for mild to severe dementia. All diagnoses, all durations, Outcome 9 Number suffering headache as an adverse event.

Comparison 9 Adverse reactions: memantine vs placebo for mild to severe dementia. All diagnoses, all durations, Outcome 10 Number suffering hypertension as an adverse event.

Comparison 9 Adverse reactions: memantine vs placebo for mild to severe dementia. All diagnoses, all durations, Outcome 11 Number suffering dizziness as an adverse event.

Comparison 9 Adverse reactions: memantine vs placebo for mild to severe dementia. All diagnoses, all durations, Outcome 12 Number suffering falls as an adverse event.
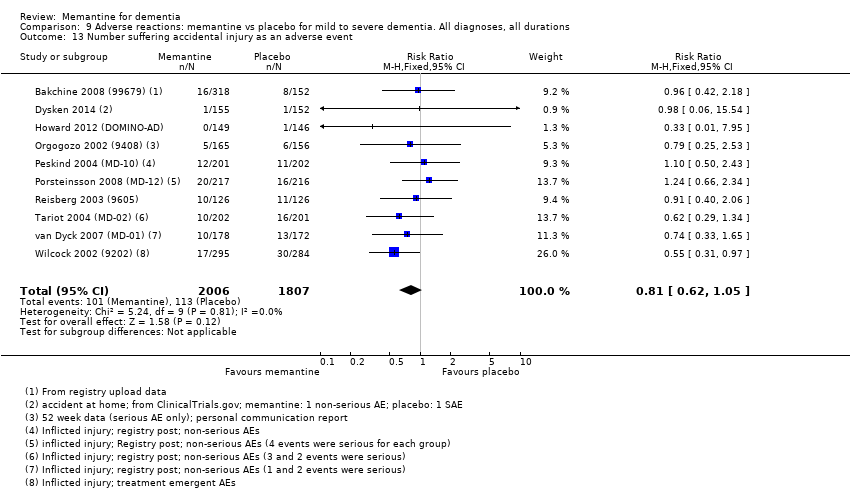
Comparison 9 Adverse reactions: memantine vs placebo for mild to severe dementia. All diagnoses, all durations, Outcome 13 Number suffering accidental injury as an adverse event.

Comparison 9 Adverse reactions: memantine vs placebo for mild to severe dementia. All diagnoses, all durations, Outcome 14 Number suffering urinary incontinence as an adverse event.

Comparison 9 Adverse reactions: memantine vs placebo for mild to severe dementia. All diagnoses, all durations, Outcome 15 Number suffering diarrhoea as an adverse event.
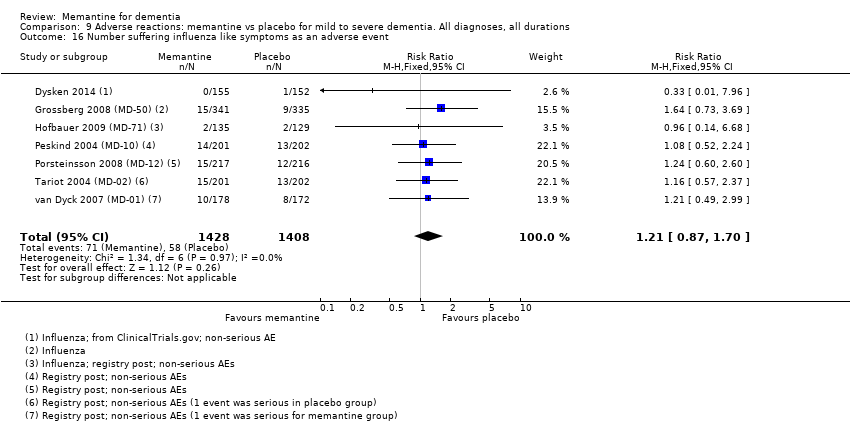
Comparison 9 Adverse reactions: memantine vs placebo for mild to severe dementia. All diagnoses, all durations, Outcome 16 Number suffering influenza like symptoms as an adverse event.
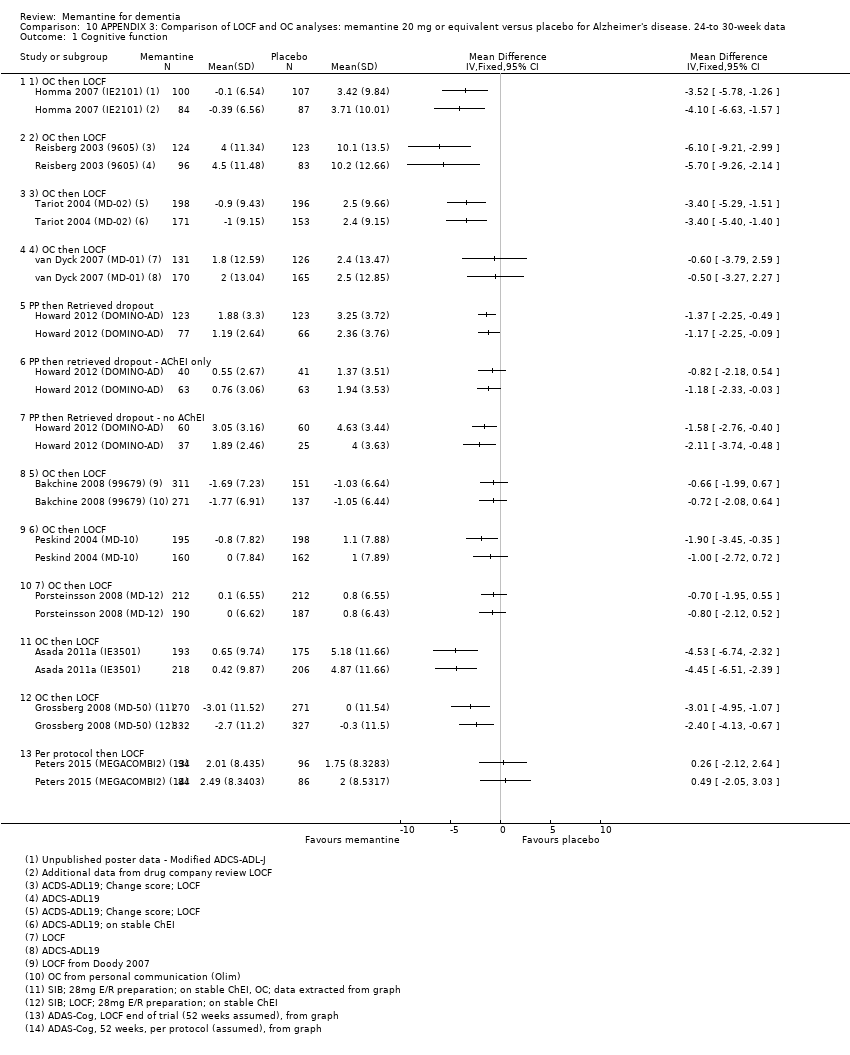
Comparison 10 APPENDIX 3: Comparison of LOCF and OC analyses: memantine 20 mg or equivalent versus placebo for Alzheimer's disease. 24‐to 30‐week data, Outcome 1 Cognitive function.

Comparison 10 APPENDIX 3: Comparison of LOCF and OC analyses: memantine 20 mg or equivalent versus placebo for Alzheimer's disease. 24‐to 30‐week data, Outcome 2 Decline in ADL: ADCS‐ADL19/23.

Comparison 10 APPENDIX 3: Comparison of LOCF and OC analyses: memantine 20 mg or equivalent versus placebo for Alzheimer's disease. 24‐to 30‐week data, Outcome 3 Cognitive Function: SIB/ADASCog/MMSE.

Comparison 10 APPENDIX 3: Comparison of LOCF and OC analyses: memantine 20 mg or equivalent versus placebo for Alzheimer's disease. 24‐to 30‐week data, Outcome 4 Decline in Activities of Daily Living.
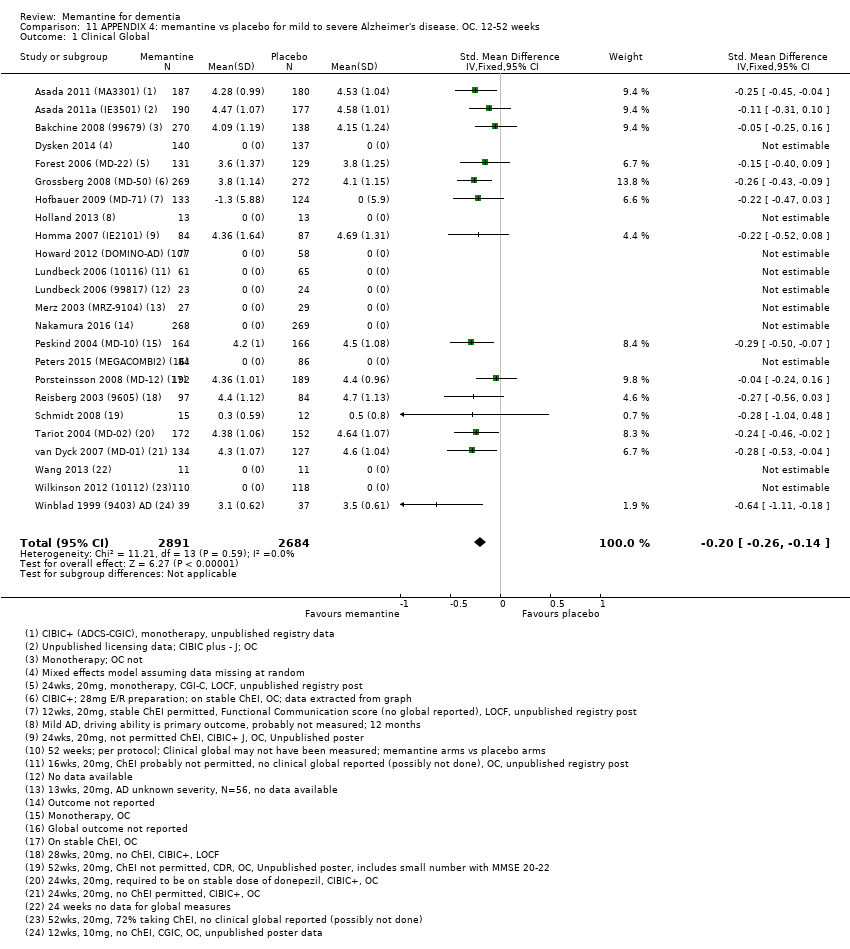
Comparison 11 APPENDIX 4: memantine vs placebo for mild to severe Alzheimer's disease. OC. 12‐52 weeks, Outcome 1 Clinical Global.

Comparison 11 APPENDIX 4: memantine vs placebo for mild to severe Alzheimer's disease. OC. 12‐52 weeks, Outcome 2 Cognitive Function.

Comparison 11 APPENDIX 4: memantine vs placebo for mild to severe Alzheimer's disease. OC. 12‐52 weeks, Outcome 3 Decline in ADL.
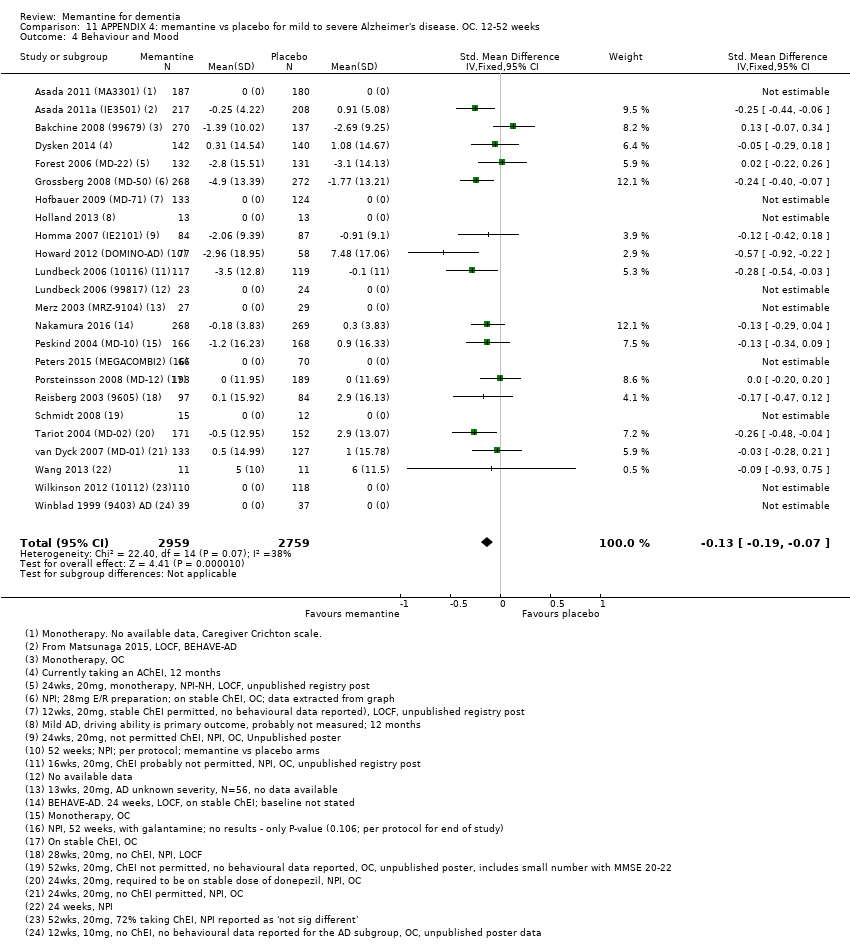
Comparison 11 APPENDIX 4: memantine vs placebo for mild to severe Alzheimer's disease. OC. 12‐52 weeks, Outcome 4 Behaviour and Mood.

Comparison 11 APPENDIX 4: memantine vs placebo for mild to severe Alzheimer's disease. OC. 12‐52 weeks, Outcome 5 Clinical Global ‐ sensitivity analysis for high RoB.

Comparison 11 APPENDIX 4: memantine vs placebo for mild to severe Alzheimer's disease. OC. 12‐52 weeks, Outcome 6 Cognitive Function ‐ sensitivity analysis for high risk of bias.

Comparison 11 APPENDIX 4: memantine vs placebo for mild to severe Alzheimer's disease. OC. 12‐52 weeks, Outcome 7 Decline in ADL ‐ sensitivity analysis on high RoB.

Comparison 11 APPENDIX 4: memantine vs placebo for mild to severe Alzheimer's disease. OC. 12‐52 weeks, Outcome 8 Behaviour and Mood ‐ sensitivity analysis on high RoB.

Comparison 12 APPENDIX 4: subgroup analysis by duration: memantine 20 mg or equivalent vs placebo for mild‐to‐severe Alzheimer's disease. OC. 12‐52 weeks, Outcome 1 Clinical Global ‐ CIBIC Plus, CGI‐I, or ADCS‐CGIC.

Comparison 12 APPENDIX 4: subgroup analysis by duration: memantine 20 mg or equivalent vs placebo for mild‐to‐severe Alzheimer's disease. OC. 12‐52 weeks, Outcome 2 Cognitive Function.
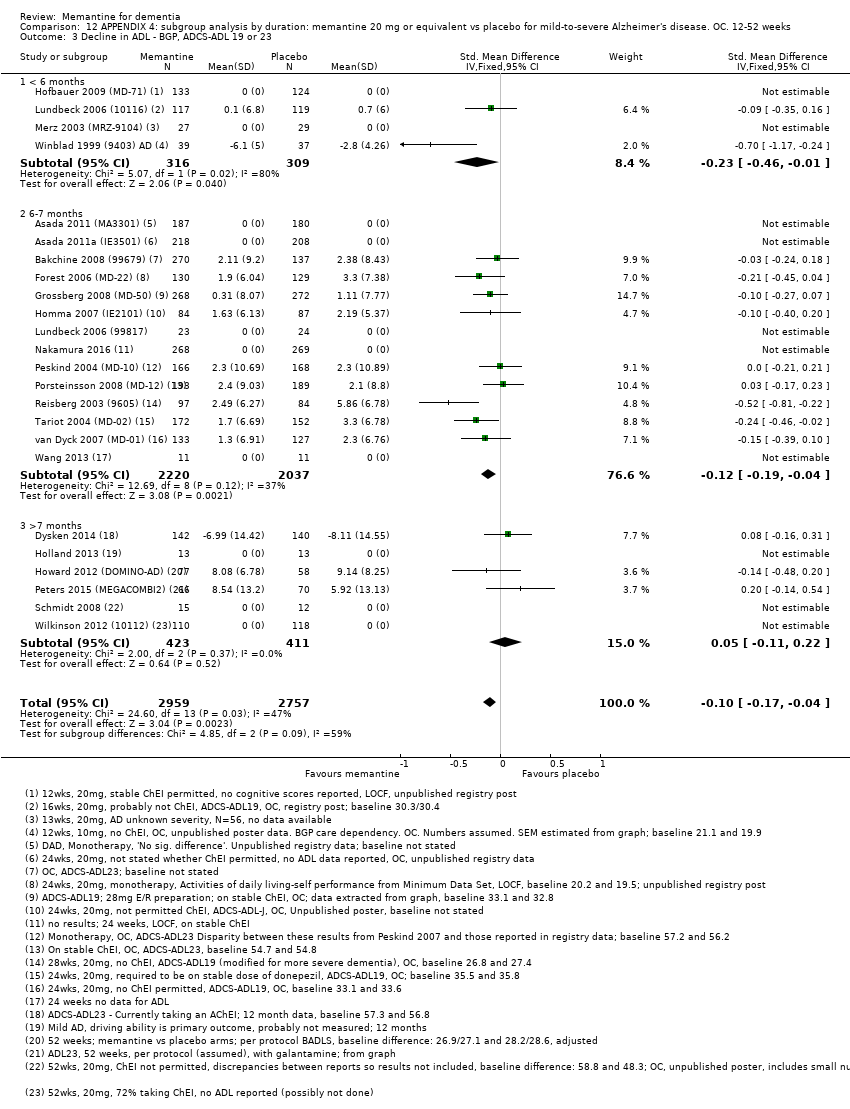
Comparison 12 APPENDIX 4: subgroup analysis by duration: memantine 20 mg or equivalent vs placebo for mild‐to‐severe Alzheimer's disease. OC. 12‐52 weeks, Outcome 3 Decline in ADL ‐ BGP, ADCS‐ADL 19 or 23.
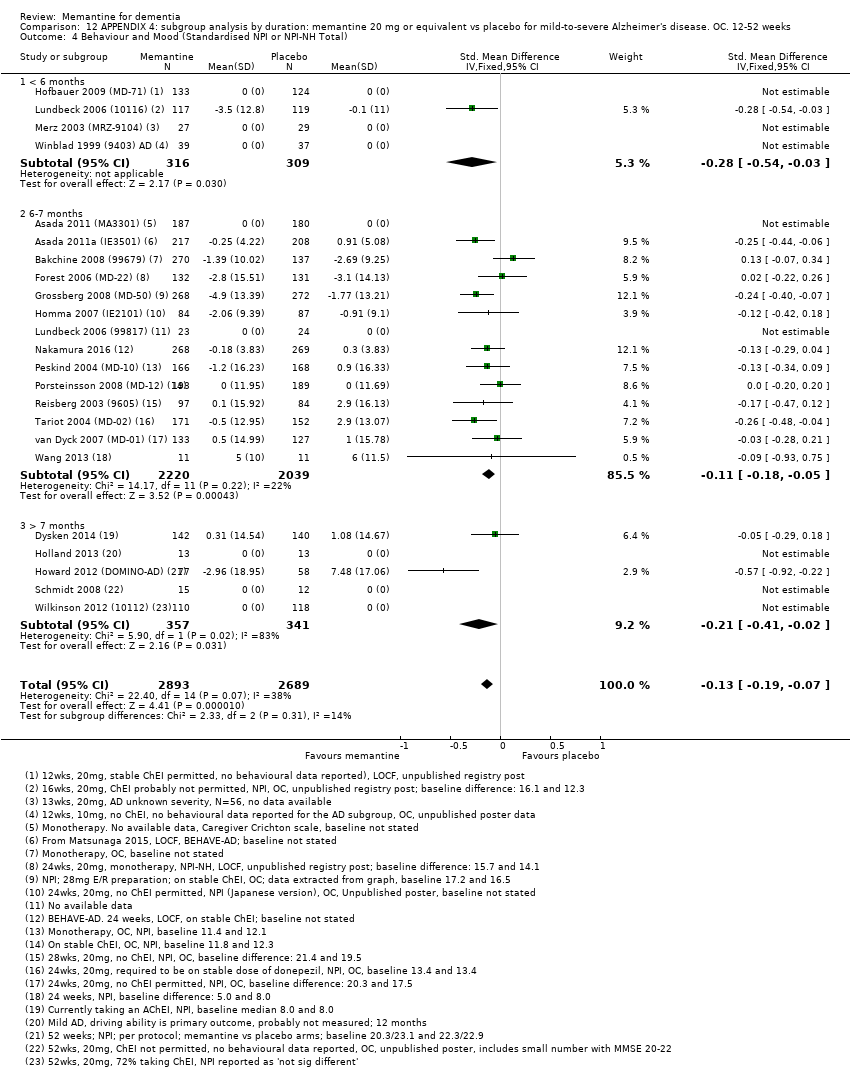
Comparison 12 APPENDIX 4: subgroup analysis by duration: memantine 20 mg or equivalent vs placebo for mild‐to‐severe Alzheimer's disease. OC. 12‐52 weeks, Outcome 4 Behaviour and Mood (Standardised NPI or NPI‐NH Total).

Comparison 13 APPENDIX 4: memantine 10 mg versus 20 mg memantine for Alzheimer's disease (12‐24 weeks), Outcome 1 Clinical Global; 10mg versus 20mg.

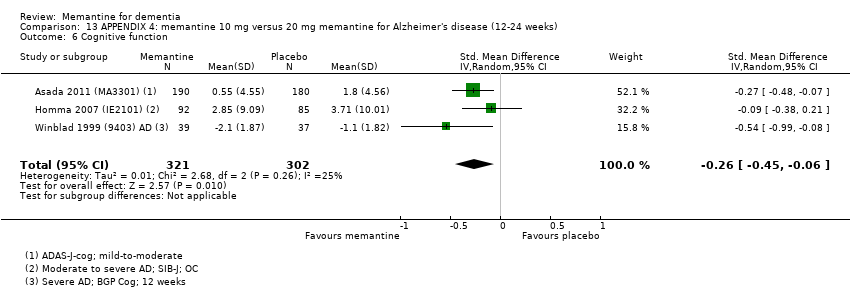
Comparison 13 APPENDIX 4: memantine 10 mg versus 20 mg memantine for Alzheimer's disease (12‐24 weeks), Outcome 2 Cognitive function; 10mg vs 20 mg.

Comparison 13 APPENDIX 4: memantine 10 mg versus 20 mg memantine for Alzheimer's disease (12‐24 weeks), Outcome 3 Decline in ADL; 10mg versus 20mg.

Comparison 13 APPENDIX 4: memantine 10 mg versus 20 mg memantine for Alzheimer's disease (12‐24 weeks), Outcome 4 Behaviour and mood; 10mg versus 20mg.

Comparison 13 APPENDIX 4: memantine 10 mg versus 20 mg memantine for Alzheimer's disease (12‐24 weeks), Outcome 5 Clinical Global.
Comparison 13 APPENDIX 4: memantine 10 mg versus 20 mg memantine for Alzheimer's disease (12‐24 weeks), Outcome 6 Cognitive function.

Comparison 13 APPENDIX 4: memantine 10 mg versus 20 mg memantine for Alzheimer's disease (12‐24 weeks), Outcome 7 Decline in activities of daily living.

Comparison 13 APPENDIX 4: memantine 10 mg versus 20 mg memantine for Alzheimer's disease (12‐24 weeks), Outcome 8 Behaviour and mood.

Comparison 14 APPENDIX 4: subgroup analysis by presence/absence of ChEI; 20 mg; six to seven months, Outcome 1 Clinical Global: subgroup analysis by +/‐ ChEI.
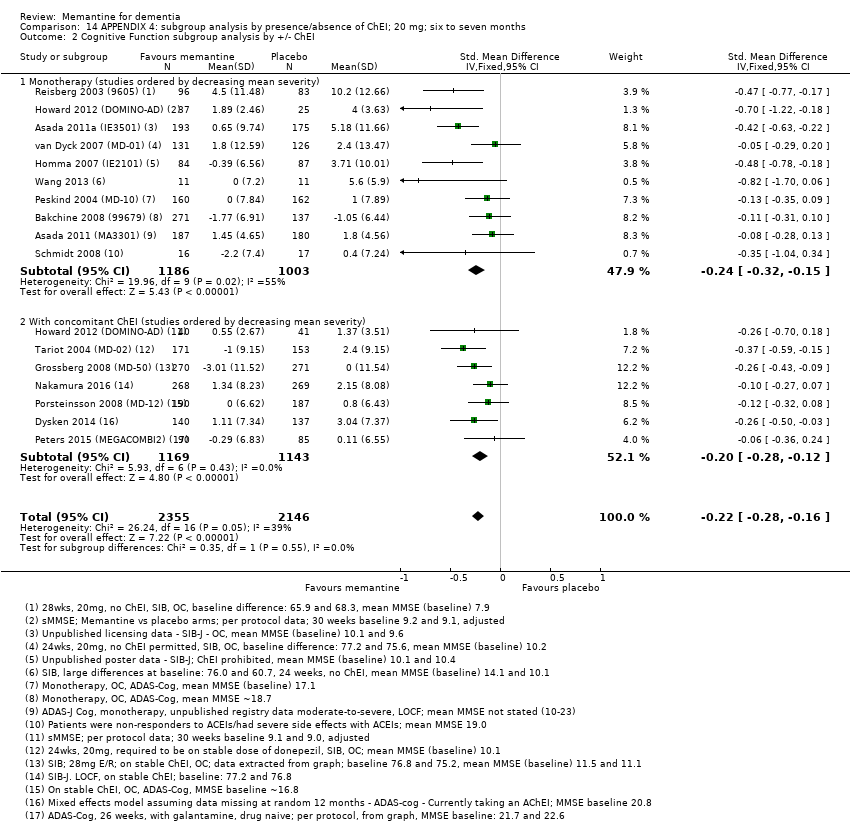
Comparison 14 APPENDIX 4: subgroup analysis by presence/absence of ChEI; 20 mg; six to seven months, Outcome 2 Cognitive Function subgroup analysis by +/‐ ChEI.

Comparison 14 APPENDIX 4: subgroup analysis by presence/absence of ChEI; 20 mg; six to seven months, Outcome 3 Decline in ADL subgroup analysis by +/‐ ChEI.
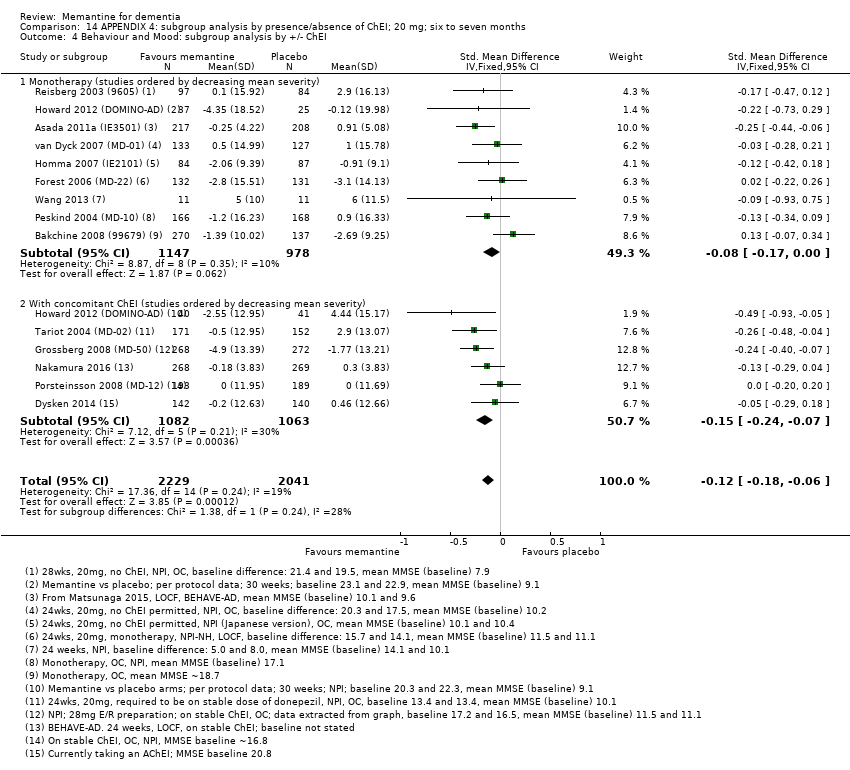
Comparison 14 APPENDIX 4: subgroup analysis by presence/absence of ChEI; 20 mg; six to seven months, Outcome 4 Behaviour and Mood: subgroup analysis by +/‐ ChEI.
Comparison 15 APPENDIX 4: subgroup analysis by severity/stage of AD: memantine 20 mg or equivalent vs placebo. OC. 24‐28 weeks, Outcome 1 Clinical Global.

Comparison 15 APPENDIX 4: subgroup analysis by severity/stage of AD: memantine 20 mg or equivalent vs placebo. OC. 24‐28 weeks, Outcome 2 Cognitive Function.

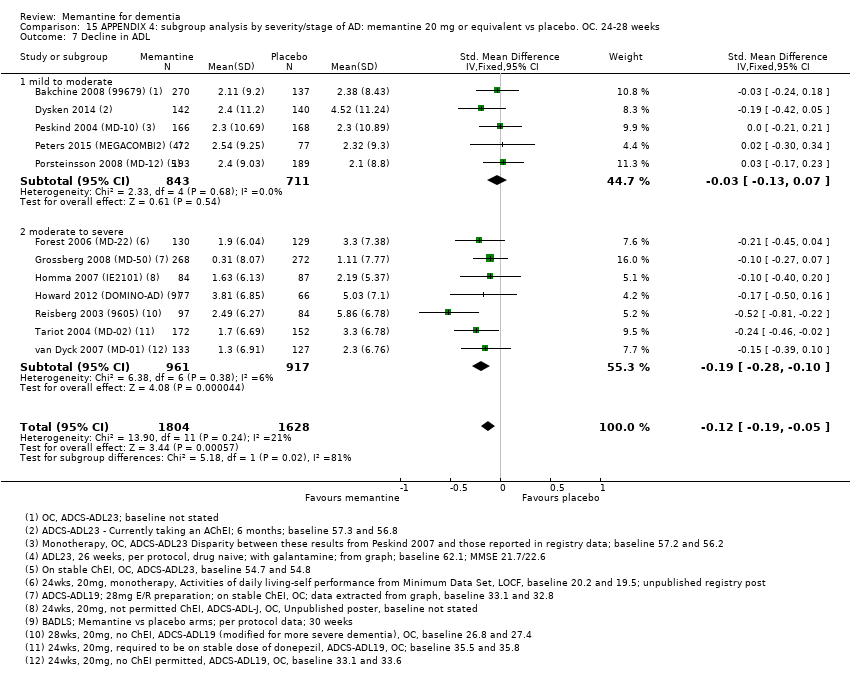
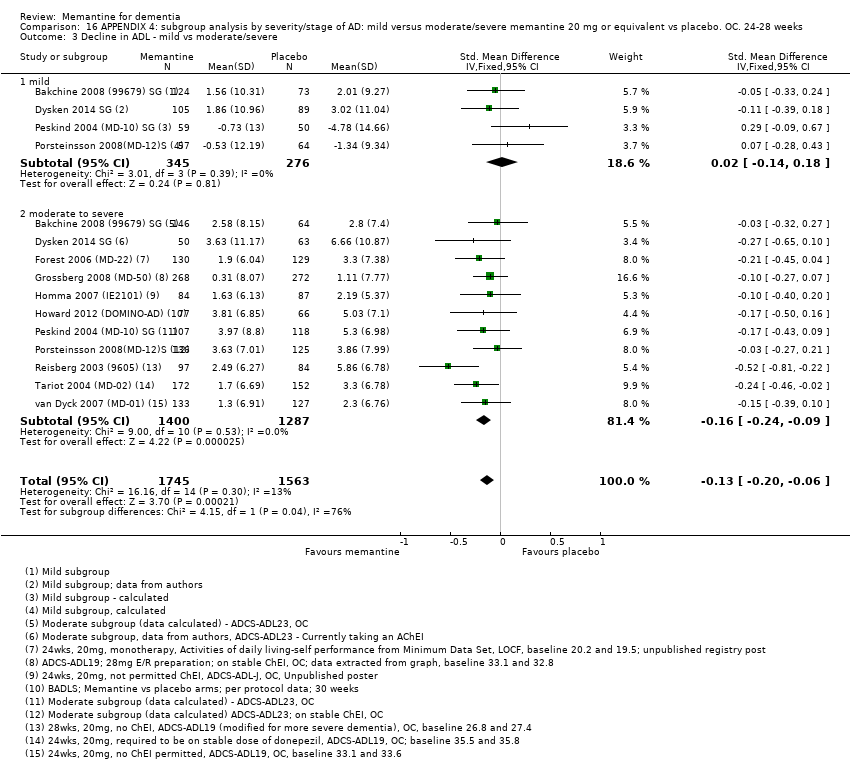
Comparison 15 APPENDIX 4: subgroup analysis by severity/stage of AD: memantine 20 mg or equivalent vs placebo. OC. 24‐28 weeks, Outcome 3 Decline in ADL.
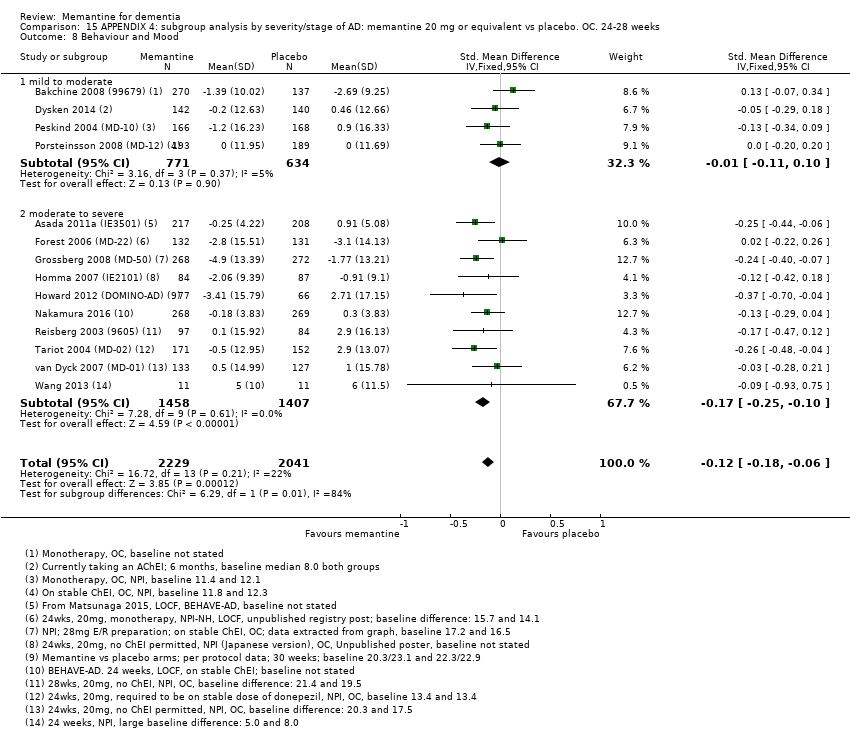
Comparison 15 APPENDIX 4: subgroup analysis by severity/stage of AD: memantine 20 mg or equivalent vs placebo. OC. 24‐28 weeks, Outcome 4 Behaviour and Mood.

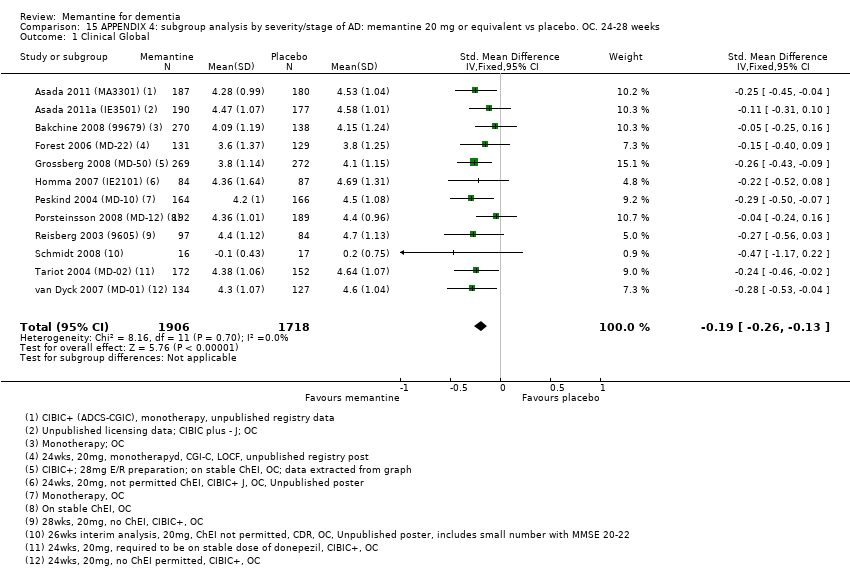
Comparison 15 APPENDIX 4: subgroup analysis by severity/stage of AD: memantine 20 mg or equivalent vs placebo. OC. 24‐28 weeks, Outcome 5 Clinical Global.

Comparison 15 APPENDIX 4: subgroup analysis by severity/stage of AD: memantine 20 mg or equivalent vs placebo. OC. 24‐28 weeks, Outcome 6 Cognitive Function.
Comparison 15 APPENDIX 4: subgroup analysis by severity/stage of AD: memantine 20 mg or equivalent vs placebo. OC. 24‐28 weeks, Outcome 7 Decline in ADL.
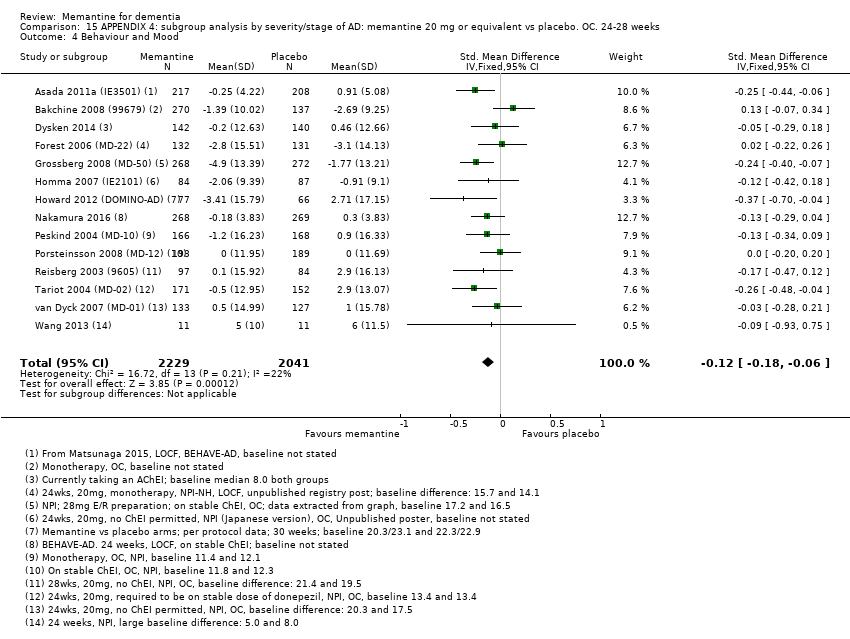
Comparison 15 APPENDIX 4: subgroup analysis by severity/stage of AD: memantine 20 mg or equivalent vs placebo. OC. 24‐28 weeks, Outcome 8 Behaviour and Mood.

Comparison 15 APPENDIX 4: subgroup analysis by severity/stage of AD: memantine 20 mg or equivalent vs placebo. OC. 24‐28 weeks, Outcome 9 All‐cause discontinuation, by type of disease and severity.

Comparison 15 APPENDIX 4: subgroup analysis by severity/stage of AD: memantine 20 mg or equivalent vs placebo. OC. 24‐28 weeks, Outcome 10 Discontinuation due to adverse events, by disease type and severity.
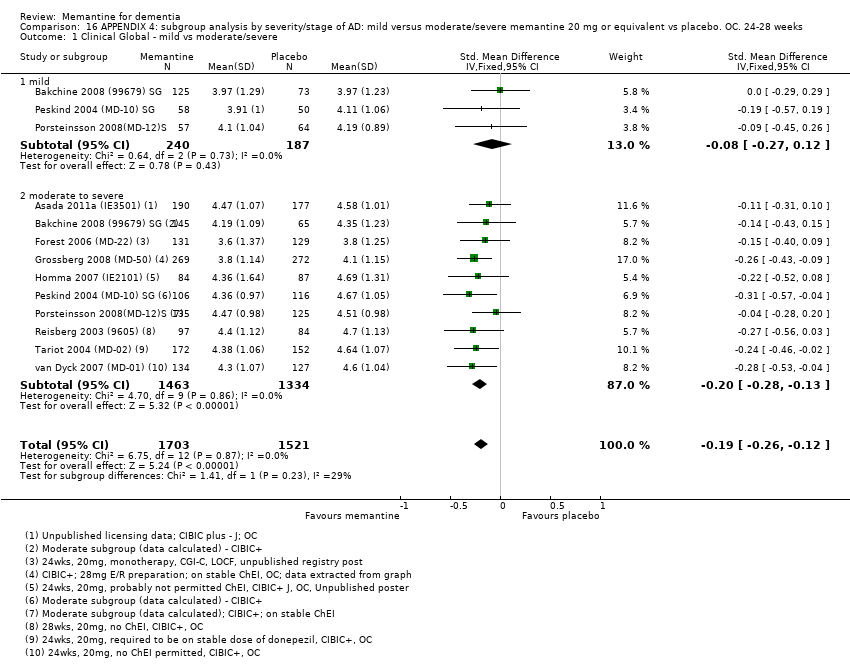
Comparison 16 APPENDIX 4: subgroup analysis by severity/stage of AD: mild versus moderate/severe memantine 20 mg or equivalent vs placebo. OC. 24‐28 weeks, Outcome 1 Clinical Global ‐ mild vs moderate/severe.
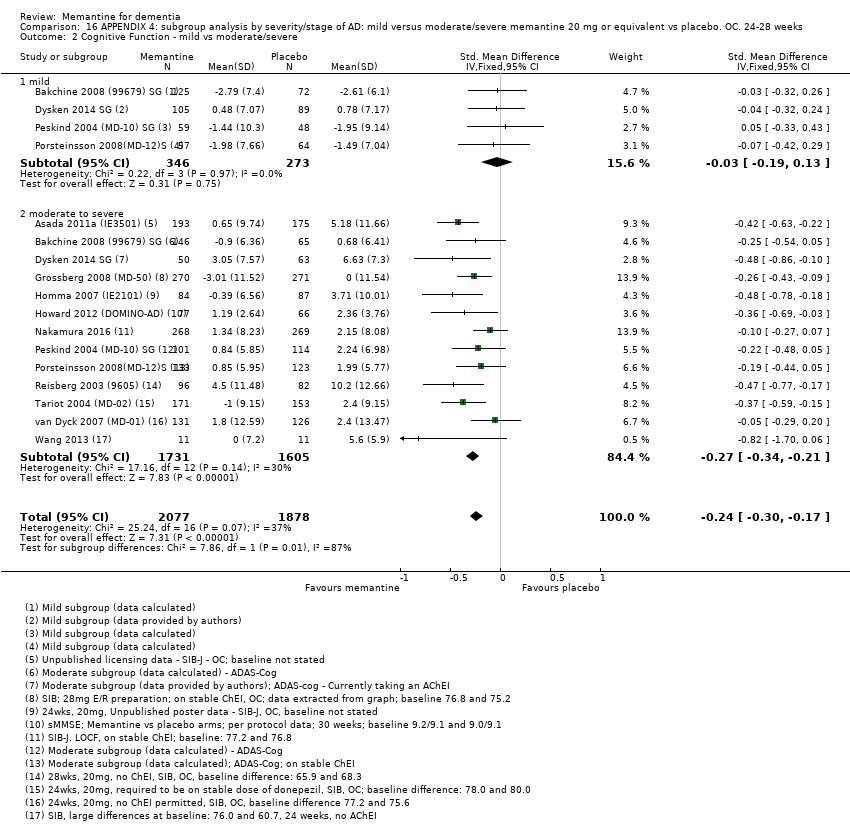
Comparison 16 APPENDIX 4: subgroup analysis by severity/stage of AD: mild versus moderate/severe memantine 20 mg or equivalent vs placebo. OC. 24‐28 weeks, Outcome 2 Cognitive Function ‐ mild vs moderate/severe.
Comparison 16 APPENDIX 4: subgroup analysis by severity/stage of AD: mild versus moderate/severe memantine 20 mg or equivalent vs placebo. OC. 24‐28 weeks, Outcome 3 Decline in ADL ‐ mild vs moderate/severe.

Comparison 16 APPENDIX 4: subgroup analysis by severity/stage of AD: mild versus moderate/severe memantine 20 mg or equivalent vs placebo. OC. 24‐28 weeks, Outcome 4 Behaviour and Mood ‐ mild vs moderate/severe.
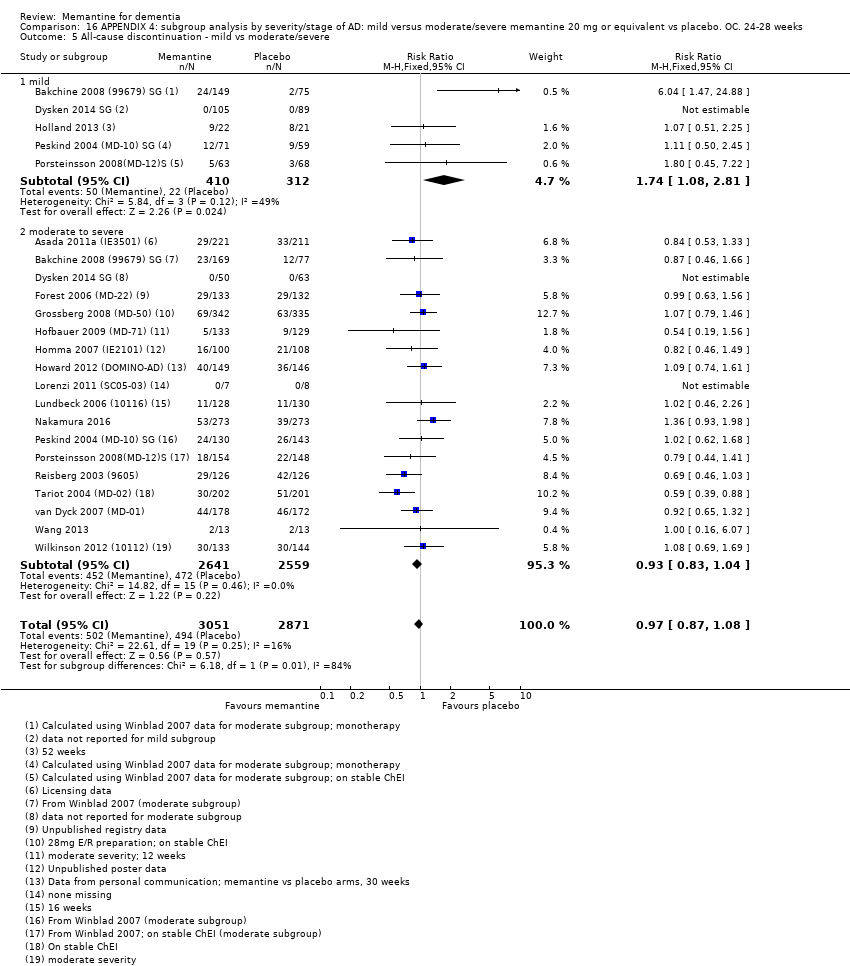
Comparison 16 APPENDIX 4: subgroup analysis by severity/stage of AD: mild versus moderate/severe memantine 20 mg or equivalent vs placebo. OC. 24‐28 weeks, Outcome 5 All‐cause discontinuation ‐ mild vs moderate/severe.
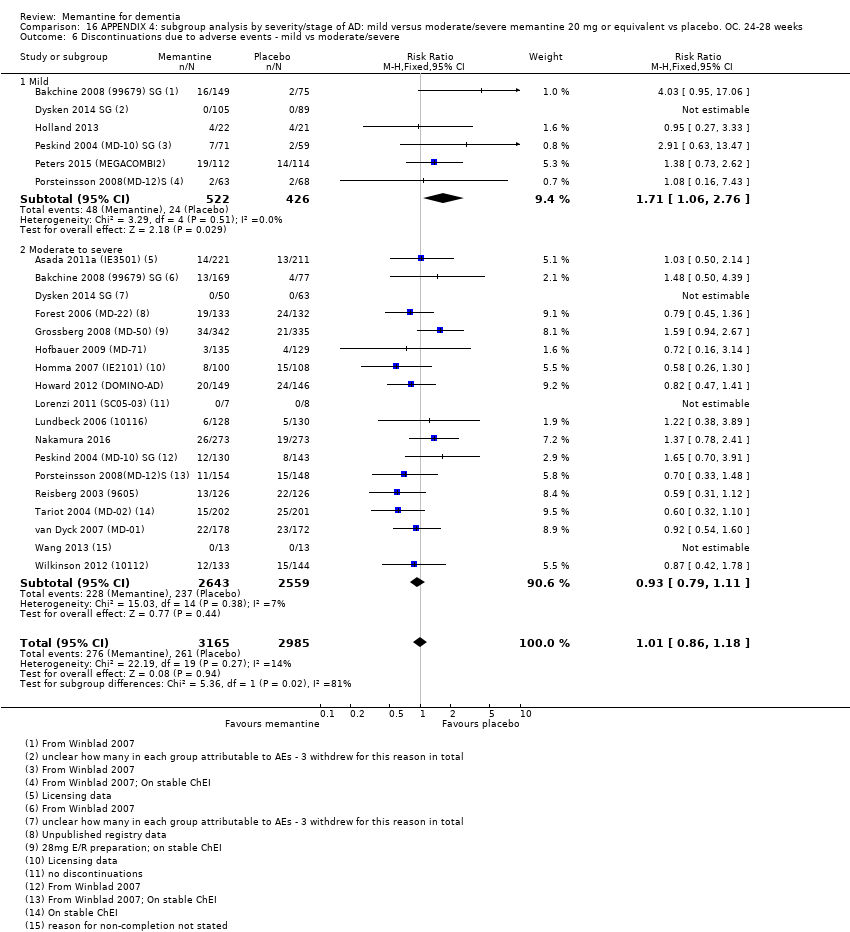
Comparison 16 APPENDIX 4: subgroup analysis by severity/stage of AD: mild versus moderate/severe memantine 20 mg or equivalent vs placebo. OC. 24‐28 weeks, Outcome 6 Discontinuations due to adverse events ‐ mild vs moderate/severe.
Comparison 17 APPENDIX 4: subgroup analysis by severity/stage of AD: severe versus moderate, Outcome 1 Clinical Global: post‐hoc within‐trial subgroup analyses.

Comparison 17 APPENDIX 4: subgroup analysis by severity/stage of AD: severe versus moderate, Outcome 2 Cognitive Function: post‐hoc within‐trial subgroup analyses.

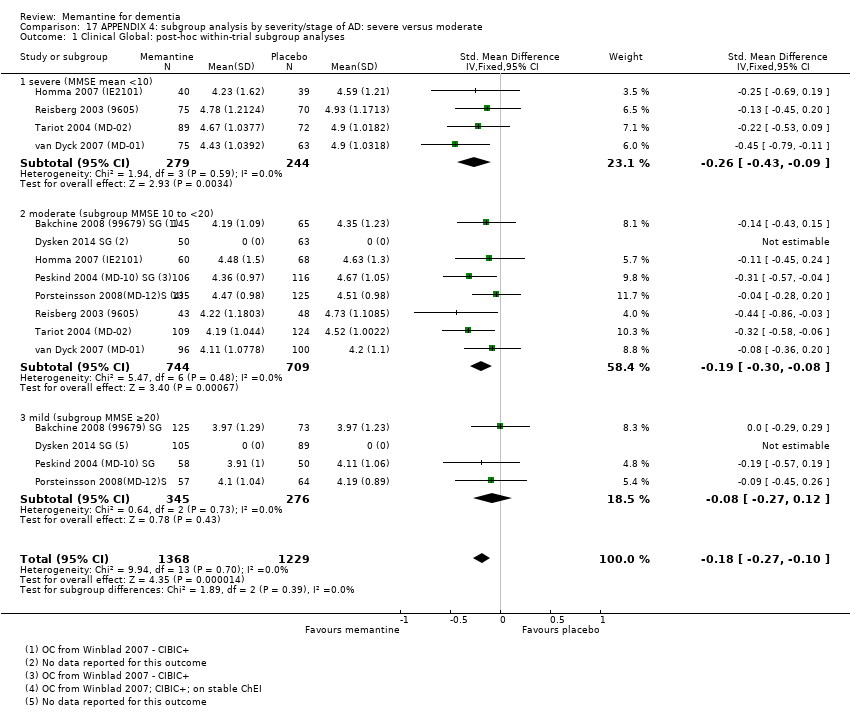
Comparison 17 APPENDIX 4: subgroup analysis by severity/stage of AD: severe versus moderate, Outcome 3 Decline in ADL: post‐hoc within‐trial subgroup analyses.

Comparison 17 APPENDIX 4: subgroup analysis by severity/stage of AD: severe versus moderate, Outcome 4 Clinical Global: by severity of disease.
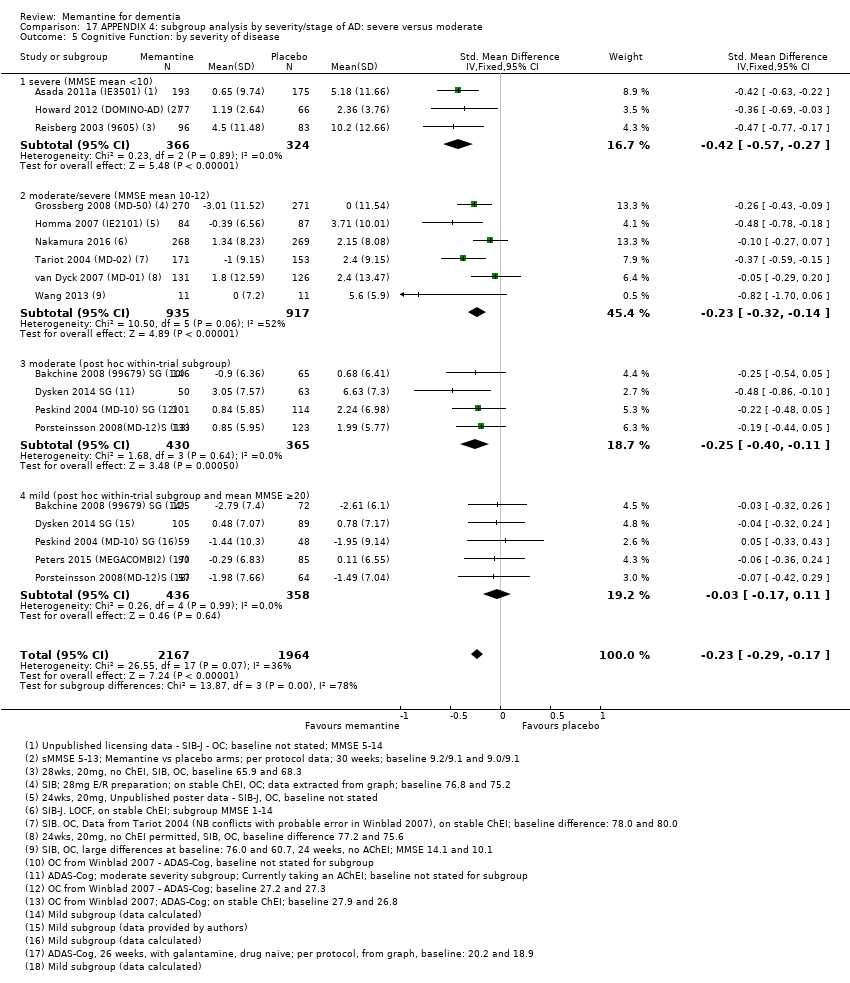
Comparison 17 APPENDIX 4: subgroup analysis by severity/stage of AD: severe versus moderate, Outcome 5 Cognitive Function: by severity of disease.

Comparison 17 APPENDIX 4: subgroup analysis by severity/stage of AD: severe versus moderate, Outcome 6 Decline in ADL: by severity of disease.
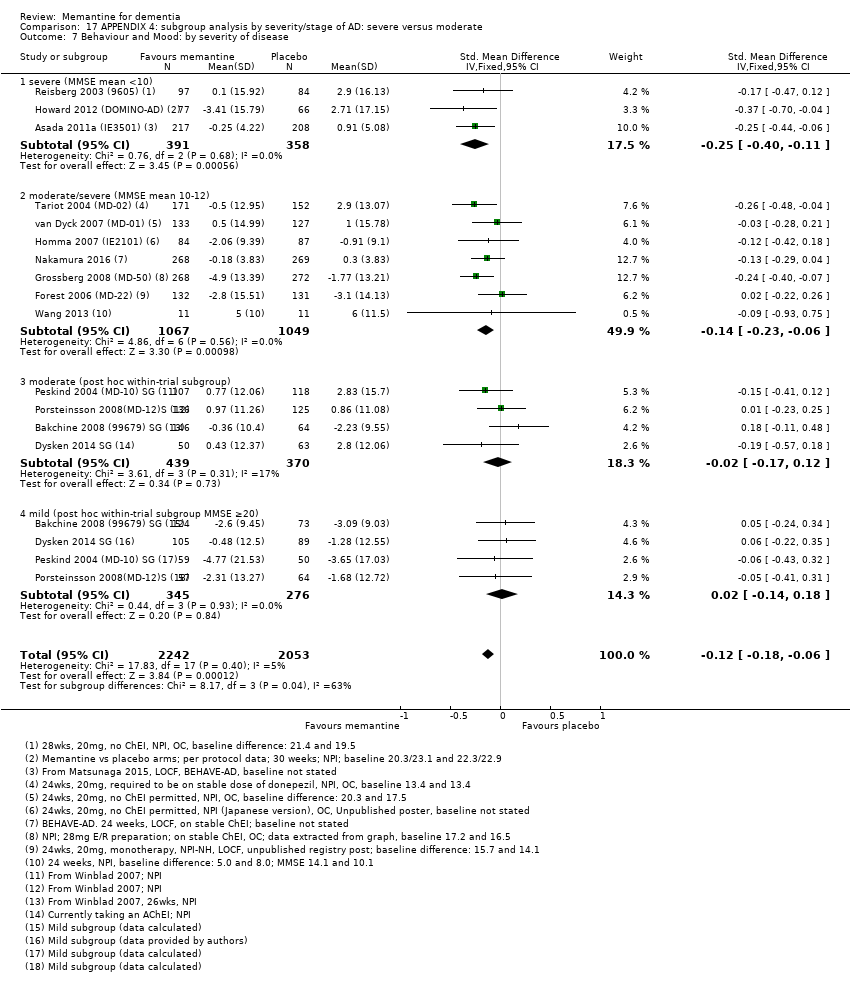
Comparison 17 APPENDIX 4: subgroup analysis by severity/stage of AD: severe versus moderate, Outcome 7 Behaviour and Mood: by severity of disease.
| Memantine 20 mg or equivalent compared to placebo for moderate‐to‐severe Alzheimer's disease (AD) 24‐ to 30‐week data. OC | ||||||
| Population: Alzheimer's disease (AD), moderate‐to‐severe | ||||||
| Continuous outcomes | Score with placebo (median) | Mean improvement in change score between memantine and placebo | SMD (95% CI) meta‐analysis findings | № of participants | Certainty of the evidence | Comments |
| Clinical Global (CIBIC+) | Median CIBIC+ score was 4.60 3 (i.e. deterioration with time) | MD: 0.21 (0.14 to 0.30) | ‐0.20 (‐0.28 to ‐0.13) | 2797 | ⊕⊕⊕⊕ | SMD as a negative outcome Converted to CIBIC+ scale; median SD(pooled) = 1.06. |
| Cognitive Function (SIB) | Median SIB score at baseline: 75.2. Median change from baseline (positive scale): ‐2.4 4 (i.e. deterioration with time) | MD: 3.11 (2.42 to 3.92) | ‐0.27 (‐0.34 to ‐0.21) | 3337 | ⊕⊕⊕⊕ | SMD as a negative outcome (Analysis 1.2). Converted to SIB scale (and scale direction inverted); median SD (pooled) = 11.53. |
| Functional performance on activities of daily living: ADCS‐ADL19 | Median ADCS‐ADL19 score at baseline: 33.2 Median change from baseline (positive scale): ‐2.8 5 (i.e. deterioration with time) | MD: 1.09 (0.62 to 1.64) | ‐0.16 (‐0.24 to ‐0.09) | 2687 | ⊕⊕⊕⊕ | SMD for decline in ADL (a negative outcome) (Analysis 1.3). Converted to ADCS‐ADL19 scale (and scale direction inverted); median SD(pooled) = 6.84. |
| Behaviour and Mood (NPI) 144‐point scale | The median baseline NPI score was 17.0. Median change from baseline (negative scale): 2.80 6 (i.e. deterioration with time) | MD: 1.84 (1.05 to 2.76) | ‐0.14 (‐0.21 to ‐0.08) | 3674 | ⊕⊕⊕⊕ | SMD as a negative outcome Converted to NPI scale; median SD(pooled) = 13.15. |
| Binary outcomes | Anticipated absolute effects | Relative effect | № of participants | Certainty of the evidence | Comments | |
| Risk with placebo (median) | Risk with memantine | |||||
| All‐cause discontinuation | 182 per 1000 | 169 per 1000 | RR 0.93 | 5087 924 events | ⊕⊕⊕⊕ | RR and median control group risk in people with moderate‐to‐severe AD without agitation (Analysis 16.5). |
| Difference: 13 fewer people per 1000 discontinued treatment for any cause (95% CI 31 fewer to 7 more) | ||||||
| Number suffering at least one adverse event | 716 per 1000 | 737 per 1000 | RR 1.03 | 8033 5371 events | ⊕⊕⊕⊕ | RR from all studies (Analysis 9.3). Median control group risk for moderate‐to‐severe AD studies (Analysis 1.7). |
| Difference: 21 more people per 1000 suffered adverse events | ||||||
| Number suffering at least one serious adverse event | 114 per 1000 | 104 per 1000 (93 to 116) | RR 0.91 | 6482 (19 RCTs) 918 events | ⊕⊕⊕⊕ | RR and median control risk from all AD studies (except those with agitation) (from Analysis 8.10) |
| Difference: 10 fewer people per 1000 suffered serious adverse events (95% CI 21 fewer to 2 more) | ||||||
| Number suffering agitation as an adverse event | 129 per 1000 | 104 per 1000 | RR 0.81 | 4395 321 events | ⊕⊕⊕⊝ | RR from all AD studies (apart from those in people with agitation) (Analysis 8.11). Median control group risk for moderate‐to‐severe AD studies (Analysis 1.9). |
| Difference: 25 fewer people per 1000 suffered agitation as an adverse event | ||||||
| *The risk in the intervention group (and its 95% confidence interval) is based on the assumed risk in the comparison group and the relative effect of the intervention (and its 95% CI). | ||||||
| GRADE Working Group grades of evidence | ||||||
| 1 Some inconsistency in point estimates, but not enough to downgrade 2 Some inconsistency in point estimates (downgrade once) 3 Median control group values for 8 studies reporting CIBIC+ (Asada 2011a (IE3501); Bakchine 2008 (99679) SG; Grossberg 2008 (MD‐50); Peskind 2004 (MD‐10) SG; Porsteinsson 2008(MD‐12)S; Reisberg 2003 (9605); Tariot 2004 (MD‐02); van Dyck 2007 (MD‐01)) 4 Median control group baseline scores and median control group change from baseline for 5 studies reporting SIB (Grossberg 2008 (MD‐50); Reisberg 2003 (9605); Tariot 2004 (MD‐02); van Dyck 2007 (MD‐01); Wang 2013) 5 Median control group baseline scores and median control group change from baseline for the 4 studies reporting ADCS‐ADL19 (Grossberg 2008 (MD‐50); Reisberg 2003 (9605);Tariot 2004 (MD‐02); van Dyck 2007 (MD‐01)) 6 Median control group baseline scores and median control group change from baseline for the 10 studies reporting NPI (Bakchine 2008 (99679) SG; Dysken 2014 SG; Grossberg 2008 (MD‐50); Howard 2012 (DOMINO‐AD); Peskind 2004 (MD‐10) SG; Porsteinsson 2008(MD‐12)S; Reisberg 2003 (9605); Tariot 2004 (MD‐02); van Dyck 2007 (MD‐01); Wang 2013) | ||||||
| Memantine 20 mg compared to placebo for mild‐to‐moderate vascular dementia. six‐month studies | ||||||
| Population: vascular dementia, mild‐to‐moderate severity | ||||||
| Continuous outcomes | Score with placebo (mean) | Mean improvement in change score between memantine and placebo | SMD (95% CI) meta‐analysis findings | № of participants | Certainty of the evidence | Comments |
| Clinical Global: (CIBIC+) | CIBIC+ score (i.e. no change with time) | MD: 0.03 (‐0,28 to 0.34) | ‐0.02 (‐0.23 to 0.19) | 757 | ⊕⊕⊕⊝ | SMD as a negative outcome; random effects (Analysis 5.1). Converted to CIBIC+ scale; SD(pooled) = 1.46. |
| Cognitive function: ADAS‐Cog | Mean ADAS‐Cog score at baseline was 23.6. Mean change from (i.e. deterioration with time) | MD: 2.15 (1.05 to 3.25) | ‐0.32 (‐0.48 to ‐0.15) | 569 | ⊕⊕⊕⊝ | Analysed as mean difference (Analysis 5.2) [SMD as a negative outcome Analysis 8.2] |
| Performance on ADL (NOSGER self care subscale) Subscale 5 points | Baseline scores not reported. Change from baseline i.e. deterioration with time | MD: 0.11 (‐0.35 to 0.54) | ‐0.04 (‐0.20 to 0.13) | 542 | ⊕⊕⊝⊝ | SMD for decline in ADL (a negative outcome) (Analysis 5.3). Converted to NOSGER II self‐care subscale (Wilcock 2002 (9202)) SD(pooled) = 2.69. |
| Behaviour: NOSGER disturbing behaviour subscale Subscale 5 points | Baseline scores not reported. Change from baseline for the NOSGER i.e. deterioration with time | MD: 0.47 (0.07 to 0.87) | ‐0.20 (‐0.37 to ‐0.03) | 542 | ⊕⊕⊝⊝ | SMD as a negative outcome (Analysis 5.4). Converted to NOSGER II disturbing behaviour subscale (Wilcock 2002 (9202)) SD(pooled) = 2.34. |
| Binary outcomes | Anticipated absolute effects | Relative effect | № of participants | Certainty of the evidence | Comments | |
| Risk with placebo (median) | Risk with memantine | |||||
| All‐cause discontinuation | 218 per 1000 | 229 per 1000 | RR 1.05 | 900 678 events | ⊕⊕⊝⊝ | RR and control group risk for studies in people with vascular dementia (Analysis 5.6.) |
| Difference: 11 more people per 1000 discontinued treatment for any cause (95% CI 37 fewer to 74 more) | ||||||
| Number suffering at least one adverse event | 742 per 1000 | 764 per 1000 | RR 1.03 | 8033 5371 events | ⊕⊕⊕⊕ | RR from all studies (Analysis 9.3). Control group risk taken from studies in vascular dementia (Analysis 5.8) |
| Difference: 22 more people per 1000 suffered adverse events | ||||||
| Number suffering at least one serious adverse event | 211 per 1000 | 173 per 1000 (95% CI 131 to 230) | RR 0.82 (0.62 to 1.09) | 900 (2 RCTs) 162 events | ⊕⊕⊝⊝ | RR and control group risk from vascular dementia studies (Analysis 8.10) |
| Difference: 38 fewer people per 1000 suffered serious adverse events (95% CI 80 fewer to 19 more) | ||||||
| Number suffering agitation as an adverse event | 77 per 1000 | 44 per 1000 | RR 0.57 | 900 54 events | ⊕⊕⊝⊝ | RR and control group risk from vascular dementia studies (Analysis 5.9); random effects |
| Difference: 33 fewer people per 1000 suffered agitation as an adverse event | ||||||
| *The risk in the intervention group (and its 95% confidence interval) is based on the assumed risk in the comparison group and the relative effect of the intervention (and its 95% CI). | ||||||
| GRADE Working Group grades of evidence | ||||||
| 1 Inconsistency in point estimates (and I² = 48%); some imprecision (95% CI crossed null and was consistent with benefit and no difference) but may be consequence of inconsistency (downgraded once overall) 2 Majority of the information at high risk of bias (downgrade once). Some inconsistency (but insufficient to downgrade) 3 Majority of the information at high risk of bias for 2 domains (downgrade twice) 4 Majority of the information at high risk of bias (downgrade once); some inconsistency and some imprecision (crossed null and 1.25) (downgrade once) 5 Majority of the information at high risk of bias (downgrade once); imprecision (162 events and crossed both 0.75 and null)) (downgrade once) 6 Majority of the information at high risk of bias (downgrade once); imprecision (only 54 events) (downgrade once) | ||||||
| Study | Clinical Global | Cognitive function | Decline in ADL | Behaviour and mood | ||||||||||
| CIBIC‐Plus | CGIC/ | CDR | ADAS‐ | SIB | MMSE | ADCS‐ | ADL‐19 | BADLS | BGP | DAD | NPI | BEHAVE | Other | |
| Alzheimers' disease studies | X | |||||||||||||
| X | X | Japanese versions. DAD, Caregiver‐rated Crichton Scale, MMSE, CDR | ||||||||||||
| X | X | X | Japanese versions | |||||||||||
| X | MMSE | |||||||||||||
| X | X | X | X | |||||||||||
| X | X | X | MMSE, Caregiver activity survey | |||||||||||
| X | X | X | NPI nursing home version; CMAI | |||||||||||
| X | X | X | CMAI, NPI‐Agitation | |||||||||||
| X | X | X | CMAI, MMSE, QOL‐AD, incidence of agitation | |||||||||||
| X | X | X | X | CMAI | ||||||||||
| X | X | X | X | |||||||||||
| FLCI, ASHA FACS (caregiver assessment) | ||||||||||||||
| X | DriveABLE On‐Road Test, MMSE | |||||||||||||
| X | X | X | X | Japanese versions.MMSE, FAST, BEHAVE‐AD. ADL scale not stated | ||||||||||
| X | X | X | EQ‐5D, GHQ‐12 | |||||||||||
| X | Final values only, no change scores | |||||||||||||
| X | X | X | MMSE | |||||||||||
| X | X | Japanese versions; Crichton scale | ||||||||||||
| X | X | X | X | |||||||||||
| X | X | X | CDR sum of boxes | |||||||||||
| X | X | X | X | |||||||||||
| X | X | X | X | FAST; ADL modified for severe dementia | ||||||||||
| X | X | X | X | MMSE; ADL scale not stated | ||||||||||
| X | X | X | X | |||||||||||
| X | X | X | X | FAST | ||||||||||
| X | X | MMSE, ADAS‐Cog | ||||||||||||
| X | X | Change in total brain volume, Agitation | ||||||||||||
| Vascular Dementia or dementia syndrome | ||||||||||||||
| X (PGI scale) | X | Physician's Global Impression, Syndrom Kurztest, SCAG; ADL scale not stated | ||||||||||||
| X | X | GBS, Tapping test, Trace test, SCAG; modified ADL | ||||||||||||
| X | X | X (NOSGER) | X (NOSGER) | CGIC, GBS, MMSE, NOSGER subscales for self‐care ADL and disturbing behaviour | ||||||||||
| X | Global assessment of clinical efficacy, NOSIE‐Index, SCAG | |||||||||||||
| X | X | X (NOSGER) | X (NOSGER) | NOSGER subscales for self‐care ADL and disturbing behaviour | ||||||||||
| X | X (BGP | X | D‐scale, AD subgroup also reported | |||||||||||
| Study | Number randomised | Diagnosis | Severity of disease | Mean age | Mean MMSE | % female | duration (weeks) |
| MODERATE‐TO‐SEVERE AD | |||||||
| 432 | AD | moderately severe‐to‐severe | not stated | ˜9.9 | not stated | 24 | |
| 165 | AD Nursing home | moderate‐to‐severe | 85.3 | ˜11.3 | 85 | 24 | |
| 34 | AD agitation | moderate‐to‐severe | 79.6 | 3‐18 | 80 | 12 | |
| 153 | AD agitation | moderate‐to‐severe MMSE < 20 | 84.1 | 7.5 | 72 | 12 | |
| 369 | AD agitation | moderate‐to‐severe | ˜74.9 | 11.9 | ˜58.3 | 24 | |
| 677 | AD | moderate‐to‐severe | 76.5 | 10.8 | 72 | 24 | |
| 265 | AD | moderate | ˜74.9 | 10‐19 | 58 | 12 | |
| 207 | AD | moderate‐to‐severe MMSE 5‐14 | 73.4 | ˜10.3 | 72 | 24 | |
| 295 | AD | moderate‐to‐severe (52% severe 5 to 9) | 77.1 | 9.1 | 65 | 52 | |
| 15 | AD | moderate‐to‐severe | 76.5 | ˜14.5 | 87 | 26 | |
| 250 | AD | MMSE 5‐18 | 72.3 | 11.8 | 60 | 16 | |
| 546 | AD | moderate‐to‐severe | ˜78.5 | ˜10.8 | ˜72.8 | 24 | |
| 252 | AD | moderately severe‐to‐severe | 76.1 | 7.9 | 67 | 28 | |
| 404 | AD | moderate‐to‐severe | 75.5 | 9.9 | 64.8 | 24 | |
| 350 | AD | moderate‐to‐severe | 78.2 | ˜10.1 | 71.4 | 24 | |
| 79 | AD | severe | ˜74.2 | 6.7 | ˜67 | 12 | |
| MILD‐TO‐MODERATE AD | |||||||
| 367 | AD | mild‐to‐moderate MMSE 10‐23 | not stated | 10‐23 | not stated | 24 | |
| 13 | AD | mild‐ to‐moderate | 76 | ˜21 | 38 | 52 | |
| 470 | AD | mild‐to‐moderate 11‐23 | 74 | ˜18.7 | 65 | 26 | |
| 307 and 306 (vit E) | AD | mild‐to‐moderate | ˜79.1 | 20.8 | ˜3 | 5 years | |
| 26 | AD | mild | 79.3 | ˜27.9 | 35 | 52 | |
| 226 | AD | mild‐to‐moderate | ˜72.4 | ˜22.2 | ˜63.7 | 52 | |
| 403 | AD | mild‐to‐moderate | 77.5 | 17.1 | 58.8 | 24 | |
| 432 | AD | mild‐to‐moderate | ˜75.5 | ˜16.8 | ˜52 | 24 | |
| 37 | AD | mild‐to‐moderate | 76.2 | 19.0 | 64 | 52 | |
| 22 | AD | mild‐to‐moderate | ˜65 | ˜12.1 | 64 | 22 | |
| 277 | AD | moderate | 74 | 16.8 | 57 | 52 | |
| Memantine 20 mg or equivalent compared to placebo, with concomitant ChEI, for moderate‐to‐severe AD. 24‐30 week data. OC | ||||||
| Population: Alzheimer's disease, moderate‐to‐severe | ||||||
| Continuous outcomes | Score with placebo (median) | Mean improvement in change score between memantine and placebo | SMD (95% CI) meta‐analysis findings | № of participants | Certainty of the evidence | Comments |
| Clinical Global (CIBIC+) | The median CIBIC+ score was 4.5 3 (i.e. deterioration with time) | MD: 0.21 (0.06 to 0.36) | ‐0.21 (‐0.32 to ‐0.09) | 1125 | ⊕⊕⊕⊝ | Analysed as mean difference. Random effects (Analysis 2.8) [SMD as a negative outcome (Analysis 2.1)] |
| Cognitive Function (SIB) | Mean SIB score at baseline: 77.6. Mean change from baseline (positive scale): ‐1.2 4 (i.e. slight deterioration with time) | MD: 2.48 (1.45 to 3.41) | ‐0.24 (‐0.33 to ‐0.14) | 1852 | ⊕⊕⊕⊕ | SMD as a negative outcome Converted to SIB scale (and scale direction inverted); median SD(pooled) = 10.34. |
| Performance on ADL: (ADCS‐ADL19) | Mean ADCS‐ADL19 score at baseline: 34.3. Mean change from baseline (positive scale): ‐2.2 5 (i.e. deterioration over time) | MD: 0.95 (0.22 to 1.76) | ‐0.13 (‐0.24 to ‐0.03) | 1319 | ⊕⊕⊕⊕ | SMD for decline in ADL as a negative outcome (Analysis 2.3) Converted to ADCS‐ADL19 scale (and scale direction inverted); median SD(pooled) = 7.33. |
| Behaviour and Mood (NPI) 144‐point scale | Median baseline NPI score was 16.5. Median change from baseline (negative scale): 2.80 6 (i.e. deterioration with time) | MD: 2.20 (1.10 to 3.29) | ‐0.18 (‐0.27 to ‐0.09) | 1855 | ⊕⊕⊕⊕ | SMD as a negative outcome (Analysis 2.4) Converted to NPI scale; median SD(pooled) = 12.20 |
| Binary outcomes | Anticipated absolute effects | Relative effect | № of participants | Certainty of the evidence | Comments | |
| Risk with placebo (median) | Risk with memantine | |||||
| All‐cause discontinuation | 168 per 1000 | 156 per 1000 | RR 0.93 | 5087 | ⊕⊕⊕⊕ | RR for all moderate‐to‐severe AD studies (apart from those with agitation) (Analysis 16.5). Median control group risk for 6 studies in 2089 people with moderate‐to‐severe AD without agitation, receiving ChEIs (Analysis 2.9) |
| Difference: 12 fewer people per 1000 discontinued treatment for any cause (95% CI 29 fewer to 7 more) | ||||||
| Number suffering at least one adverse event | 639 per 1000 | 658 per 1000 | RR 1.03 | 8033 5371 events | ⊕⊕⊕⊕ | RR from all studies (Analysis 9.3). Median control group risk for moderate‐to‐severe AD studies in people receiving ChEIs (Analysis 2.11) |
| Difference: 19 more people per 1000 suffered adverse events | ||||||
| Number suffering at least one serious adverse event | 114 per 1000 | 104 per 1000 (93 to 116) | RR 0.91 | 6482 (19 RCTs) 918 events | ⊕⊕⊕⊕ | RR and median control risk from all AD studies (except those with agitation) (from Analysis 8.10) |
| Difference: 10 fewer people per 1000 suffered serious adverse events (95% CI 21 fewer to 2 more) | ||||||
| Number suffering agitation as an adverse event | 45 per 1000 | 41 per 1000 | RR 0.92 | 1225 3 79 events | ⊕⊕⊝⊝ | RR and median control group risk for studies in people with moderate‐to‐severe AD without agitation, receiving ChEIs (Analysis 2.13) |
| Difference: 4 fewer people per 1000 suffered agitation as an adverse event | ||||||
| *The risk in the intervention group (and its 95% confidence interval) is based on the assumed risk in the comparison group and the relative effect of the intervention (and its 95% CI). We adopt the convention that a negative mean difference always means an improvement (i.e. favouring memantine) | ||||||
| GRADE Working Group grades of evidence | ||||||
| 1 Some inconsistency or variation in the point estimates (downgraded once for inconsistency) 2 79 events; imprecision around relative effect (CI crossing 1.25 and 0.75)(downgraded twice) 3 Median control group values for 3 studies reporting CIBIC+ (Grossberg 2008 (MD‐50); Porsteinsson 2008(MD‐12)S; Tariot 2004 (MD‐02)) 4 Mean control group baseline scores and mean control group change from baseline for 2 studies reporting SIB (Grossberg 2008 (MD‐50); Tariot 2004 (MD‐02)) 5 Mean control group baseline scores and mean control group change from baseline for the 2 studies reporting ADCS‐ADL19 (Grossberg 2008 (MD‐50); Tariot 2004 (MD‐02)) 6 Median control group baseline scores and median control group change from baseline for the 5 studies reporting NPI (Dysken 2014 SG; Grossberg 2008 (MD‐50); Howard 2012 (DOMINO‐AD); Porsteinsson 2008(MD‐12)S; Tariot 2004 (MD‐02)) | ||||||
| Memantine 20 mg or equivalent compared to placebo, monotherapy, for moderate‐to‐severe AD. 24‐to 30‐week data observed case (OC) | ||||||
| Population: Alzheimer's disease, moderate‐to‐severe | ||||||
| Outcomes | Score with placebo (median) | Mean improvement in change score between memantine and placebo | SMD (95% CI) meta‐analysis findings | № of participants | Certainty of the evidence | Comments |
| Clinical Global 7‐point Likert scale | The median CIBIC+ score was 4.64 3 (i.e. deterioration with time) | MD: 0.22 (0.11 to 0.33) | ‐0.20 (‐0.30 to ‐0.10) | 1672 | ⊕⊕⊕⊕ | SMD as a negative outcome (Analysis 2.1). Converted to CIBIC+ scale; median SD(pooled) = 1.09. |
| Cognitive Function 100‐point scale | Median SIB score at baseline: 68.3. Median change from baseline (positive scale): ‐5.6 4 (i.e. deterioration with time) | MD: 3.97 (2.77 to | ‐0.33 (‐0.43 to ‐0.23) | 1485 | ⊕⊕⊕⊕ | SMD as a negative outcome (Analysis 2.2) Converted to SIB scale (and scale direction inverted); median SD(pooled) = 12.04. |
| Performance on ADL | Mean ADCS‐ADL19 score at baseline: 30.5. Mean change from baseline (positive scale): ‐4.15 (i.e. deterioration with time) | MD: 1.33 (0.20 to 2.00) | ‐0.20 (‐0.30 to ‐0.09) | 1368 | ⊕⊕⊕⊕ | SMD for decline in ADL as a negative outcome (Analysis 2.3) Converted to ADCS‐ADL19 scale (and scale direction inverted); median SD(pooled) = 6.67. |
| Behaviour and Mood (NPI) 144‐point scale | Median baseline NPI score was 18.5. Median change from baseline (negative scale): 1.95 6 (i.e. slight deterioration with time) | MD: 1.57 (0.16 to 2.98) | ‐0.10 (‐0.19 to ‐0.01) | 1819 | ⊕⊕⊕⊕ | SMD as a negative outcome (Analysis 2.4) Converted to NPI scale; median SD(pooled) = 15.70. |
| Binary outcomes | Anticipated absolute effects | Relative effect | № of participants | Certainty of the evidence | Comments | |
| Risk with placebo (median) | Risk with memantine | |||||
| All‐cause discontinuation | 188 per 1000 | 175 per 1000 | RR 0.93 | 5087 924 events | ⊕⊕⊕⊕ | RR for all studies in people with moderate‐to‐severe AD (apart from those with agitation) (Analysis 16.5). Median control group risk for 10 studies in 2459 people with moderate‐to‐severe AD without agitation, receiving monotherapy (Analysis 2.9) |
| Difference: 13 fewer people per 1000 discontinued treatment for any cause (95% CI 32 fewer to 8 more) | ||||||
| Number suffering at least one adverse event | 760 per 1000 | 783 per 1000 | RR 1.03 | 8033 5371 events | ⊕⊕⊕⊕ | RR from all studies (Analysis 9.3).Median control group risk for moderate‐to‐severe AD studies in people receiving monotherapy (Analysis 2.11) |
| Difference: 23 more people per 1000 suffered adverse events | ||||||
| Number suffering at least one serious adverse event | 114 per 1000 | 104 per 1000 (93 to 116) | RR 0.91 | 6482 (19 RCTs) 918 events | ⊕⊕⊕⊕ | RR and median control risk from all AD studies (except those with agitation) (from Analysis 8.10) |
| Difference: 10 fewer people per 1000 suffered serious adverse events (95% CI 21 fewer to 2 more) | ||||||
| Number suffering agitation as an adverse event | 164 per 1000 | 112 per 1000 | RR 0.68 | 1016 154 events | ⊕⊕⊕⊝ | RR and median control group risk for studies in people with moderate‐to‐severe AD without agitation, receiving monotherapy (Analysis 2.13) |
| Difference: 52 fewer people per 1000 suffered agitation as an adverse event | ||||||
| *The risk in the intervention group (and its 95% confidence interval) is based on the assumed risk in the comparison group and the relative effect of the intervention (and its 95% CI). | ||||||
| GRADE Working Group grades of evidence | ||||||
| 1 Some inconsistency in point estimates, but insufficient to downgrade 2 Some imprecision (193 events and borderline for CI crossing 1; CI crossed 0.75) and some inconsistency in point estimates ‐ downgrade once overall 3 Median control group values for 4 studies reporting CIBIC+ (Bakchine 2008 (99679) SG; Peskind 2004 (MD‐10) SG; Reisberg 2003 (9605); van Dyck 2007 (MD‐01)) 4 Median control group baseline scores and mean control group change from baseline for 3 studies reporting SIB (Reisberg 2003 (9605); van Dyck 2007 (MD‐01); Wang 2013) 5 Mean control group baseline scores and mean control group change from baseline for the 2 studies reporting ADCS‐ADL19 (Reisberg 2003 (9605); van Dyck 2007 (MD‐01)) 6 Median control group baseline scores and median control group change from baseline for the 4 studies reporting NPI (Howard 2012 (DOMINO‐AD); Reisberg 2003 (9605); van Dyck 2007 (MD‐01); Wang 2013) | ||||||
| Memantine 20 mg or equivalent compared to placebo, for moderate‐to‐severe AD, selected for agitation | ||||||
| Population: Alzheimer's disease, moderate‐to‐severe, selected for agitation | ||||||
| Outcomes | Score with placebo (median) | Mean improvement in change score between memantine and placebo | SMD (95% CI) meta‐analysis findings | № of participants | Certainty of the evidence | Comments |
| Clinical Global 7‐point Likert scale | The CIBIC+ score from one study was 4.63 5 (i.e. deterioration with time) | MD: 0.14 (‐0.17 to 0.44) (random effects) 24 week study only: MD: ‐0.05 (‐0.35 to 0.25) (Herrmann 2012 (10158)) | ‐0.11 (‐0.34 to 0.13) (random effects) | 443 24 week study: 275 participants | ⊕⊕⊝⊝ | SMD as a negative outcome (Analysis 3.5). Heterogeneity between 12 weeks (2 studies) and 24 weeks. Converted to CIBIC+ scale; SD(pooled) = 1.29 (Herrmann 2012 (10158)). |
| Cognitive Function 100‐point scale | Mean SIB score at baseline: 68.1. Median change from baseline (positive scale): ‐5.23 6 (i.e. deterioration with time) | MD: 4.34 (‐5.89 to 24 week study only: MD: ‐0.48 (‐2.57 to 1.61) (Herrmann 2012 (10158)) | ‐0.24 (‐0.84 to 0.36) (random effects) | 453 | ⊕⊝⊝⊝ | Analysed as mean difference (Analysis 3.6). [SMD as a negative outcome] |
| Performance on ADL | Mean ADCS‐ADL19 score at baseline: 32.5. Mean change from baseline (positive scale): ‐1.087 (i.e. slight deterioration with time) | MD: ‐1.48 (‐3.15 to 0.19) | 0.21 (‐0.02 to 0.43) | 309 | ⊕⊕⊝⊝ | Analysed as mean difference (Analysis 3.7) [SMD for decline in ADL as a negative outcome] |
| Behaviour and Mood (NPI) 144‐point scale | Median baseline NPI score was 33.3. Median change from baseline (negative scale): ‐8.6 8 (i.e. improvement with time) | MD: 1.51 (‐5.03 to 8.05) (random effects) | ‐0.07 (‐0.41 to 0.27) (random effects) | 470 | ⊕⊝⊝⊝ | Analysed as mean difference (random effects) (Analysis 3.8) [SMD as a negative outcome] |
| Agitation (Cohen Mansfield Agitation Inventory) range 29 ‐ 203 points | Mean baseline CMAI score was 57.7 Mean change from baseline (negative score) was ‐6.19 (i.e. improvement with time) | MD: 0.50 (‐3.71 to 4.71) (random effects) 2 studies in 422 participants | 0.11 (‐0.12 to 0.33) 2 studies in 306 participants | 455 (3 RCTs) | ⊕⊕⊕⊝ | MD and SMD as negative outcomes One study reported final scores (Fox 2012 (MAGD)), so not included in SMD. One study reported CMAI‐C (Forest 2006 (MD‐23)), so not included in MD meta‐analysis |
| Binary outcomes | Anticipated absolute effects | Relative effect | № of participants | Certainty of the evidence | Comments | |
| Risk with placebo (median) | Risk with memantine | |||||
| All‐cause discontinuation | 171 per 1000 | 188 per 1000 | RR 1.10 (0.79 to 1.52) | 555 113 events | ⊕⊕⊕⊝ | RR for all 3 studies in people with moderate‐to‐severe AD selected for agitation (Analysis 3.9). Median control group risk for 3 studies in 555 people with moderate‐to‐severe AD selected for agitation (Analysis 3.9) |
| Difference: 17 more people per 1000 discontinued treatment for any cause (95% CI 36 fewer to 89 more) | ||||||
| Number suffering at least one adverse event | 600 per 1000 | 618 per 1000 | RR 1.03 | 8033 5371 events | ⊕⊕⊕⊕ | RR from all studies (Analysis 9.3).Mean control group risk for 2 moderate‐to‐severe AD studies in people selected for agitation (Analysis 3.11) |
| Difference: 18 more people per 1000 suffered adverse events | ||||||
| *The risk in the intervention group (and its 95% confidence interval) is based on the assumed risk in the comparison group and the relative effect of the intervention (and its 95% CI). | ||||||
| GRADE Working Group grades of evidence | ||||||
| 1 Inconsistency in point estimates between 24 week and 12 week studies (downgrade once); imprecision (crossed null and SMD 0.30) (downgrade once) 2 Inconsistency between 24 week and 12 week studies (I² =90%) (downgrade twice); imprecision (very wide CI crossing SMD +0.30 and ‐0.30 (downgrade twice) 3 Imprecision (crossed null and SMD 0.40) (downgrade once); some inconsistency in point estimates and risk of bias from baseline differences (downgrade once across the two domains) 4 Inconsistency (I² = 62%, P = 0.07) (downgrade once); risk of bias (due to baseline differences) (downgrade once); imprecision (wide CI: SMD crossing ‐0.2 and 0.4) (downgrade twice) 5 Control group value for 1 study reporting CIBIC+ (Herrmann 2012 (10158))) 6 Mean control group baseline scores and mean control group change from baseline for 2 studies reporting SIB (Fox 2012 (MAGD); Herrmann 2012 (10158)) 7 Mean control group baseline scores and mean control group change from baseline for the 2 studies reporting ADCS‐ADL19 (Forest 2006 (MD‐23); Herrmann 2012 (10158)) 8 Median control group baseline scores and median control group change from baseline for the 3 studies reporting NPI (Forest 2006 (MD‐23); Fox 2012 (MAGD); Herrmann 2012 (10158)) 9 Mean control group baseline scores and mean control group change from baseline for the 2 studies reporting CMAI (Fox 2012 (MAGD); Herrmann 2012 (10158)) 10 Some inconsistency for two studies reporting CMAI and some imprecision (SMD crossing 0.3 and null) (downgrade once overall) 11 Imprecision (113 events) (downgrade once) | ||||||
| Memantine 20 mg compared to placebo for mild AD (MMSE 20‐23) observed case (OC) ‐ six‐month studies for dementia | ||||||
| Population: mild Alzheimer's disease | ||||||
| Continuous outcomes | Score with placebo | Mean improvement in change score between memantine and placebo | SMD (95% CI) meta‐analysis findings | № of participants | Certainty of the evidence | Comments |
| Clinical Global (CIBIC+) | Median CIBIC+ score | MD: 0.09 (‐0.12 to 0.30) | ‐0.08 (‐0.27 to 0.12) | 427 | ⊕⊕⊝⊝ | Analysed as mean difference (Analysis 4.1). [SMD as a negative outcome (Analysis 16.1)] |
| Cognitive function (ADAS‐Cog) | Baseline ADAS‐Cog scores not reported. Median change from baseline in ADAS‐Cog score (negative scale): ‐1.7 6 (i.e. improvement with time) | MD: 0.21 (‐0.95 to 1.38) | ‐0.03 (‐0.19 to 0.13) | 619 | ⊕⊕⊕⊝ | Analysed as mean difference (Analysis 4.2). [SMD as a negative outcome (Analysis 16.2).] |
| Performance on ADL (ADCS‐ADL23) | Baseline ADL scores not reported. Median change from | MD: ‐0.07 (‐1.80 to 1.66) | 0.02 (‐0.14 to 0.18) | 621 | ⊕⊕⊕⊝ | Analysed as mean difference for decline in ADL (Analysis 4.3). [SMD as a negative outcome (Analysis 16.3)] Direction of scale reversed for ADL outcome. |
| Behaviour and mood: (NPI) | Baseline NPI scores not reported. Median change from baseline in NPI was ‐2.4 (i.e. slight improvement with time) 8 | MD: ‐0.29 (‐2.16 to 1.58) | 0.02 (‐0.14 to 0.18) | 621 | ⊕⊕⊕⊝ | Analysed as mean difference. [SMD as a negative outcome (Analysis 16.4)]. |
| Binary outcomes | Anticipated absolute effects | Relative effect | № of participants | Certainty of the evidence | Comments | |
| Risk with placebo (median) | Risk with memantine | |||||
| All‐cause discontinuation | 100 per 1000 | 174 per 1000 | RR 1.74 | 528 72 events | ⊕⊝⊝⊝ | RR and median control group risk for mild AD studies (Analysis 16.5) |
| Difference: 74 more people per 1000 discontinued treatment for any cause (95% CI 8 to 181 more) | ||||||
| Number suffering at least one adverse event | 429 per 1000 | 442 per 1000 | RR 1.03 | 8033 5371 events | ⊕⊕⊕⊕ | RR from all studies (Analysis 9.3).Control group risk taken from Holland 2013 study |
| Difference: 13 more people per 1000 suffered adverse events | ||||||
| Number suffering at least one serious adverse event | 114 per 1000 | 104 per 1000 (93 to 116) | RR 0.91 | 6482 (19 RCTs) 918 events | ⊕⊕⊕⊕ | RR and median control risk from all AD studies (except those with agitation) (from Analysis 8.10) |
| Difference: 10 fewer people per 1000 suffered serious adverse events (95% CI 21 fewer to 2 more) | ||||||
| Number suffering agitation as an adverse event | Outcome not reported by any study | 0 RCTs | ||||
| *The risk in the intervention group (and its 95% confidence interval) is based on the assumed risk in the comparison group and the relative effect of the intervention (and its 95% CI). | ||||||
| GRADE Working Group grades of evidence | ||||||
| 1 All studies are post‐hoc subgroups (downgrade once on risk of bias); imprecision ‐ 427 patients and SMD estimate crosses null and is consistent with appreciable benefit and no benefit (downgrade once) 2 All studies are post‐hoc subgroups (downgrade once on risk of bias) 3 All studies are post‐hoc subgroups (downgrade once on risk of bias) and some inconsistency in the point estimates (but not sufficient to downgrade) 4 Majority of the information from post‐hoc subgroups (downgrade once on risk of bias); imprecision: 72 events, and CI crossed 1.25 (downgrade once); inconsistency (I² = 49%) downgrade once 5 Median control group values for 3 studies reporting CIBIC+ (Bakchine 2008 (99679) SG; Peskind 2004 (MD‐10) SG; Porsteinsson 2008(MD‐12)S) 6 Median control group change from baseline for 4 studies reporting ADAS‐Cog (Bakchine 2008 (99679) SG; Dysken 2014 SG; Peskind 2004 (MD‐10) SG; Porsteinsson 2008(MD‐12)S) 7 Median control group change from baseline for the 4 studies reporting ADCS‐ADL23 (Bakchine 2008 (99679) SG; Dysken 2014 SG; Peskind 2004 (MD‐10) SG; Porsteinsson 2008(MD‐12)S) 8 Median control group change from baseline for the 4 studies reporting NPI (Bakchine 2008 (99679) SG; Dysken 2014 SG; Peskind 2004 (MD‐10) SG; Porsteinsson 2008(MD‐12)S) | ||||||
| Memantine compared to placebo for Parkinson's disease dementia (PDD) and Dementia with Lewy Bodies (DLB) | ||||||
| Population: Parkinson's disease dementia (PDD) and dementia with Lewy bodies (DLB) | ||||||
| Continuous outcomes | Score with placebo (median) | Mean improvement in change score between memantine and placebo | SMD (95% CI) meta‐analysis findings | № of participants | Certainty of the evidence | Comments |
| Clinical Global (CIBIC+) 7‐point Likert scale | CIBIC+ score from 1 study was 4.1 (i.e. no change) | MD: 0.49 (0.13 to 0.83) | ‐0.35 (‐0.60 to ‐0.09) | 243 | ⊕⊕⊝⊝ | SMD as a negative outcome Back transformed to CIBIC+ scale using SD(pooled) = 1.39 (from 1 study (Marsh 2009 PDD)). |
| Cognitive Function: (MMSE) 30‐point scale | MMSE score: 20.0 (at 24 weeks). Change from baseline (positive scale): ‐0.5 (i.e. slight deterioration with time) (one study) | MD: 1.9 (0.07 to 3.73) | ‐0.50(‐1.00 to 0.00) | 63 | ⊕⊝⊝⊝ | One study at 24 weeks and one at 16 weeks only for this outcome; highly heterogeneous. So 24 week study reported only (Aarsland 2009). MMSE scale direction was reversed (Analysis 6.2) |
| Performance on ADL (ADCS‐ADL23) 78‐point scale | ADCS‐ADL23 score at baseline: 48 Change from baseline (positive scale): ‐0.1 (i.e. no change with time) (one study) | MD: 3.07 (‐1.25 to 7.4) | ‐0.27 (‐0.67 to 0.07) | 243 | ⊕⊝⊝⊝ | SMD decline in ADL as a negative outcome (Analysis 6.3). Random effects. Back transformed to ADCS‐ADL23 scale, using results from one study (Emre 2010 (11018)). SD(pooled) = 11.38. |
| Behaviour and Mood (NPI) 144‐point scale | Median NPI score at baseline: 13.0 Median change from baseline (negative scale): 1.4 | MD: 2.18 (‐1.21 to 5.57) | ‐0.18 (‐0.43 to 0.07) | 242 | ⊕⊕⊝⊝ | Random effects. Analysed as mean difference (Analysis 6.4). [SMD as a negative outcome (Analysis 8.4)] |
| Binary outcomes | Anticipated absolute effects | Relative effect | № of participants | Certainty of the evidence | Comments | |
| Risk with placebo (median) | Risk with memantine | |||||
| All‐cause discontinuation | 201 per 1000 | 169 per 1000 | RR 0.84 | 312 64 events | ⊕⊕⊝⊝ | RR and control group risk from PDD or DLB studies (Analysis 6.5) |
| Difference: 32 fewer people per 1000 discontinued treatment for any cause | ||||||
| Number suffering at least one adverse event | 500 per 1000 | 515 per 1000 | RR 1.03 | 8033 5371 events | ⊕⊕⊕⊕ | RR from all studies (Analysis 9.3). Median control group risk for PDD or DLB studies (Analysis 6.7). |
| Difference: 15 more people per 1000 suffered adverse events | ||||||
| Number suffering at least one serious adverse event | 86 per 1000 | 123 per 1000 (59 to 255) | RR 1.43 | 220 (2 RCTs) 26 events | ⊕⊕⊝⊝ | RR and control group risk from PDD or DLB studies (Analysis 8.10) |
| Difference: 37 more people per 1000 suffered serious adverse events (95% CI 27 fewer to 169 more) | ||||||
| Number suffering agitation as an adverse event | Outcome not reported for either study | 0 RCTs | ||||
| *The risk in the intervention group (and its 95% confidence interval) is based on the assumed risk in the comparison group and the relative effect of the intervention (and its 95% CI). | ||||||
| GRADE Working Group grades of evidence | ||||||
| 1 Majority of the information at high risk of bias and number of patients estimated (downgrade once); imprecision ‐ 243 patients (below optimal information size) (downgrade once) 2 Reporting bias (2 larger studies did not report outcome) and high risk of bias for remaining study (downgrade once), inconsistency with 16 weeks study high (I² = 75%) (downgrade once), imprecision (only 63 patients, wide CI) (downgrade once) 3 Majority of information at high risk of bias (downgrade once), inconsistency in point estimates (I² = 40%) (downgrade once) and imprecision (243 participants and CI crossed null and consistent with both benefit and no difference) (downgrade once) 4 Majority of information at high risk of bias (downgrade once), some inconsistency in point estimates (I² = 20%) (not downgraded) and imprecision (243 patients; CI crossed null and included benefit and no difference) (downgrade once) 5 Imprecision: CI crossed both 1.25 and 0.75, and CI fairly wide around absolute effect (downgrade twice) | ||||||
| Memantine compared to placebo for Frontotemporal dementia (FTD) | ||||||
| Population: frontotemporal dementia | ||||||
| Continuous outcomes | Score with placebo (median) | Mean improvement in change score between memantine and placebo | SMD (95% CI) meta‐analysis findings | № of participants | Certainty of the evidence | Comments |
| Clinical Global (CGIC) 7‐point Likert scale | CGIC score from 1 study was 4.8 (i.e. deterioration with time) | MD: 0.56 (‐0.11 to 1.21) | ‐0.31 (‐0.67 to 0.06) | 117 | ⊕⊕⊝⊝ | SMD as a negative outcome Back transformed to CGIC scale using SD (pooled) = 1.80 (from 1 study (Boxer 2013). |
| Cognitive Function: (MMSE) 30‐point scale | MMSE score: 25.1 (at 26 weeks). Change from baseline (positive scale): ‐0.9 (i.e. deterioration with time) (one study) | MD ‐0.30 (‐1.83 to 1.23) | 0.09 (‐0.35 to 0.52) | 81 | ⊕⊝⊝⊝ | One study at 6 months and one at 12 months for this outcome; some heterogeneity so 6‐month study reported only (Boxer 2013) (Analysis 7.2). MMSE scale direction was reversed. |
| Performance on ADL % DAD score = yes at 12 months | Baseline score: 58.3%. Change from baseline (positive scale): ‐19.5% (i.e. deterioration) (one study) | MD: 12.10% (‐1.40 to 25.60) | ‐ | 39 | ⊕⊝⊝⊝ | Decline in ADL not reported in either study. Percentage with DAD score = yes reported in Vercelletto 2011 at 12 months. |
| Behaviour and Mood (NPI) 144‐point scale | NPI score at baseline: 21.5. Change from baseline (negative scale): 0.3 | MD: 3.16 (‐3.61 to 8.01) | ‐0.17 (‐0.62 to 0.28) | 115 | ⊕⊕⊝⊝ | Analysed as mean difference (Analysis 7.3). Baseline score and change from baseline for 26‐week study (Boxer 2013). [SMD as a negative outcome (Analysis 8.4)] |
| Binary outcomes | Anticipated absolute effects | Relative effect (95% CI) | № of participants | Certainty of the evidence | Comments | |
| Risk with placebo (median) | Risk with memantine | |||||
| All‐cause discontinuation | 71 per 1000 | 109 per 1000 | RR 1.54 (0.54 to 4.06) | 133 15 events | ⊕⊕⊝⊝ | RR from FTD studies; control group risk from 26 week study (Analysis 7.4) |
| Difference: 38 more people per 1000 discontinued treatment for any cause (95% CI 33 fewer to 217 more) | ||||||
| Number suffering at least one adverse event | 667 per 1000 | 687 per 1000 | RR 1.03 | 8033 5371 events | ⊕⊕⊕⊕ | RR from all studies (Analysis 9.3).Control group risk for 26‐week FTD study |
| Difference: 20 more people per 1000 | ||||||
| Number suffering at least one severe adverse event | 48 per 1000 | 34 per 1000 (14 to 80) | RR 0.71 | 133 (2 RCTs) 17 events | ⊕⊕⊝⊝ | RR and control group risk from FTD study at 26 weeks (Analysis 8.10) |
| Difference: 14 fewer people per 1000 | ||||||
| Number suffering agitation as an adverse event | 48 per 1000 | 10 per 1000 (0.5 to 208) | RR 0.21 | 81 (1 RCT) | ⊕⊝⊝⊝ | RR and control group risk from FTD study at 26 weeks (Analysis 7.8) |
| Difference: 38 fewer people per 1000 | ||||||
| *The risk in the intervention group (and its 95% confidence interval) is based on the assumed risk in the comparison group and the relative effect of the intervention (and its 95% CI). | ||||||
| GRADE Working Group grades of evidence | ||||||
| 1 Majority of the information at high risk of bias (downgrade once); imprecision ‐ 117 patients (below optimal information size) (downgrade once) 2 Inconsistency in point estimates (I² = 23%) (downgrade once) and Imprecision (122 patients and wide confidence interval) (downgrade twice) 3 Imprecision (39 participants and CI crossed null and consistent with both benefit and no difference) (downgrade twice); indirect outcome (percentage DAD score at 12 months) and borderline high risk of bias (differential missing data) (downgrade once) 4 Some inconsistency in point estimates and Imprecision (122 patients and wide confidence interval) (downgrade twice overall) 5 Inconsistency in point estimates (downgrade once); Imprecision: 15 events and CI crossed both 1.25 and 0.75 (downgrade twice) 6 Imprecision: 17 events and wide CI (downgrade twice) 7 Imprecision: 2 events and very wide CI (downgrade twice): high risk of bias ‐ number discontinuing treatment greater than number of events (downgrade twice) | ||||||
| Number of Studies | Number of Participants | Standardised Effect Estimate | Heterogeneity (I²) | Test for | |||||||||
| Domain | All | with ChEI | no ChEI | All | with ChEI | no ChEI | All | with ChEI | no ChEI | All | with ChEI | no ChEI | |
| Clinical Global | 10 | 3 | 7 | 2797 | 1125 | 1672 | ‐0.20 | ‐0.21 (‐0.32 to ‐0.09) | ‐0.20 (‐0.30 to ‐0.10) | 0% | 13% | 0% | I² = 0%, P = 0.99 |
| Cognitive Function | 14 | 6 | 8 | 3337 | 1852 | 1485 | ‐0.28 (‐0.35 to ‐0.21) | ‐0.24 (‐0.33 to ‐0.14) | ‐0.33 (‐0.43 to ‐0.23) | 33% | 13% | 41% | I² = 44%, P = 0.18 |
| Decline in Living (Analysis 2.3) | 12 | 5 | 7 | 2687 | 1319 | 1368 | ‐0.17 (‐0.24 to ‐0.09) | ‐0.13 (‐0.24 to ‐0.03) | ‐0.20 (‐0.30 to ‐0.09) | 0% | 0% | 10% | I² = 0%, P = 0.43 |
| Behaviour and Mood | 15 | 6 | 9 | 3674 | 1855 | 1819 | ‐0.14 (‐0.21 to ‐0.08) | ‐0.18 (‐0.27 to ‐0.09) | ‐0.10 (‐0.19 to ‐0.01) | 6% | 10% | 0% | I² = 35%, P = 0.21 |
| All‐cause discontinuation | 15 | 6 | 10 | 4548 | 2089 | 2459 | RR 0.93 (0.82 to 1.05) | RR 0.94 (0.78 to 1.13) | RR 0.92 (0.78 to 1.08) | 9% | 61% | 0% | I² = 0%, P = 0.83 |
| Adverse events | 9 | 3 | 6 | 3390 | 1625 | 1765 | RR 1.02 (0.98 to 1.06) | RR 1.05 (0.98 to 1.12) | RR 0.99 (0.94 to 1.04) | 23% | 13% | 0% | I² = 46%, P = 0.17 |
| Agitation as an adverse event | 10 | 5 | 6 | 3854 | 1965 | 1889 | RR 0.79 (0.64 to 0.97) | RR 0.93 (0.65 to 1.31) | RR 0.72 (0.55 to 0.93) | 0% | 0% | 15% | I² = 25.1%, P = 0.25 |
| Six studies were conducted on patients with moderate‐to‐severe disease receiving ChEI therapy, these were: Dysken 2014: patients were on ongoing ChEI therapy with any ChEI (donepezil, rivastigmine or galantamine), as maintenance dosage for at least 4 weeks Grossberg 2008 (MD‐50): patients were on ongoing ChEI therapy with a stable dose of any ChEI for 3 months or longer, patients must remain on the same dose throughout the study. Howard 2012 (DOMINO‐AD): patients were on ongoing ChEI therapy with donepezil for at least 3 months and had received a dose of 10 mg for at least the previous Nakamura 2016: patients had been on donepezil for at least four weeks when recruited and then had 12 weeks single blind observation period on donepezil. Only those stable continued to the double blind period. Porsteinsson 2008 (MD‐12): patients were on ongoing ChEI therapy with any ChEI for 6 months or longer, and a stable dosing regimen for 3 months or longer (donepezil 5‐10 mg/day; rivastigmine 6, 9 or 12 mg/day; galantamine 16 or 24 mg/day) Tariot 2004 (MD‐02): patients were on ongoing ChEI therapy with donepezil for more than 6 months before entry into the trial and at a stable dose (5‐10mg/day) for at least 3 months. | |||||||||||||
| Patients not selected for agitation (with moderate‐to‐severe AD) | Patients selected for agitation | |||||
| With / without ChEI | No ChEI | With ChEI | With / without ChEI, mainly with | With ChEI | With / without ChEI ‐ | |
| Clinical global (SMD) | ‐0.20 (‐0.28 to ‐0.13) n = 10 studies; 2797 patients I² = 0%, P = 0.86 | ‐0.20 (‐0.30 to ‐0.10) n = 7; 1672 patients I² = 0%, P = 0.88 | ‐0.21 (‐0.32 to ‐0.09) n = 3; 1125 patients I² = 13%, P = 0.32 | ‐0.11 (‐0.34 to 0.13) n = 3; 443 patients I² = 25%, P = 0.26 | 0.04 (‐0.20 to 0.28) n = 1; 324 patients | ‐0.28 (‐0.59 to 0.02) n = 2; 168 patients I² = 0%, P = 0.96 |
| Cognitive function (SMD) | ‐0.28 (‐0.35 to ‐0.21) n = 13; 3337 patients I² = 30%, P = 0.14 | ‐0.33 (‐0.43 to ‐0.23) n = 8; 1485 patients I² = 41%, P = 0.11 | ‐0.24 (‐0.33 to ‐0.14) n = 6; 1852 patients I² = 13%, P = 0.33 | Not pooled I² = 90%, P = 0.002 | 0.05 (‐0.17 to 0.27) n = 1, 324 patients | ‐0.56 (‐0.92 to ‐0.21) n = 1; 129 patients (with ˜20% ChEI) |
| Decline in ADL (SMD) | ‐0.17 (‐0.24 to ‐0.09) n = 11; 2687 patients I² = 0%, P = 0.582 | ‐0.20 (‐0.30 to ‐0.09) n = 7; 1368 patients I² = 10%, P = 0.36 | ‐0.13 (‐0.24 to ‐0.03) n = 5; 1319 patients I² = 0%, P = 0.69 | 0.21 (‐0.02 to 0.43) n = 2; 309 patients I² = 0%, P = 0.40 | 0.23 (‐0.01 to 0.47) n = 1; 276 patients | ‐0.02 (‐0.70 to 0.67) n = 1; 33 patients (with ChEI) |
| Behaviour and mood (SMD) | ‐0.14 (‐0.21 to ‐0.08) n = 14; 3674 patients I² =6%, P = 0.39 | ‐0.10 (‐0.19 to ‐0.01) n = 9; 1819 patients I² = 0%, P = 0.46 | ‐0.18 (‐0.27 to ‐0.09) n = 6; 1855 patients I² = 10%, P = 0.35 | ‐0.07 (‐0.41 to 0.27) n = 3; 470 patients I² = 62%, P = 0.07 | 0.08 (‐0.14 to 0.30) n = 1; 324 patients | ‐0.20 (‐0.69 to 0.29) n = 2; 146 patients I² = 43%, P = 0.19 |
| CMAI (SMD) | ‐0.21 (‐0.45 to 0.04) n = 1; 261 patients | 0.11 (‐0.12 to 0.33) n = 2; 306 patients I² = 0%, P = 0.77 | 0.10 (‐0.14 to 0.33) n = 1; 273 patients | CMAI (final values): SMD: ‐0.19 (‐0.52 to 0.13) CMAI (community): SMD: 0.21 (‐0.48 to 0.89) n = 1; 33 patients | ||
| Proportion with agitation (RR) | 0.76 (0.601 to 0.96) 6 studies; 2 241 patients I² = 0%, P = 0.67 | 0.68 (0.51, 0.91) 4 studies; 1016 patients I² = 0%, P = 0.59 | 0.92 (0.54 to 1.31) 3 studies; 1225 patients I² = 0% and 0.85 | RR 2.39 (1.04 to 5.50) 2 studies; 403 patients I² = 0%, P = 0.60 | 2.20 (0.92 to 5.27) 1 study; 369 patients | 5.00 (0.26 to 97.00) 1 study; 34 patients (with ChEI) |
| Adverse event | Number of studies (participants) | RR (95% CI) | Heterogeneity (I²) | GRADE rating |
| Insomnia (Analysis 9.6) | 19 (5354), 221 events | 0.93 (0.73 to 1.20) | I² = 14%, P = 0.29 | LOW (downgraded on imprecision and reporting bias < 70% patients had AE data) |
| Confusion (Analysis 9.7) | 13 (4509), 167 events | 1.23 (0.91 to 1.65) | I² = 0%, P = 0.51 | LOW (downgraded on imprecision and reporting bias < 70% patients had AE data) |
| Depression (Analysis 9.8) | 10 (3052), 83 events | 1.06 (0.70 to 1.60) | I² = 0%, P = 0.60 | VERY LOW (downgraded on imprecision (twice), inconsistency in point estimates (once) and reporting bias <40% patients had AE data (twice)) |
| Headache (Analysis 9.9) | 16 (4889), 240 events | 1.29 (1.00 to 1.66) | I² = 9%,P = 0.36 | LOW (downgraded on imprecision (once) and reporting bias <70% patients had AE data) |
| Hypertension (Analysis 9.10) | 8 (3175), 87 events | 1.76 (1.14 to 2.70) | I² = 1%, P = 0.42 | VERY LOW (downgraded on imprecision (twice), inconsistency in point estimates (once) and reporting bias <40% patients had AE data (twice)) |
| Dizziness (Analysis 9.11) | 19 (6395), 323 events | 1.59 (1.28 to 1.98) | I² = 0%, P = 0.49 | MODERATE (downgraded on inconsistency in point estimates) |
| Falls (Analysis 9.12) | 20 (6743), 589 events | 0.98 (0.84 to 1.13) | I² = 0%, P = 0.84 | HIGH |
| Accidental injury (Analysis 9.13) | 10 (3813), 214 events | 0.81 (0.62 to 1.05) | I² = 0%, P = 0.81 | VERY LOW (downgraded on imprecision (once) and twice on reporting bias (< 50% patients and 1 in 4 studies) |
| Urinary incontinence (Analysis 9.14) | 8 (2724), 76 events | 1.12 (0.73 to 1.72) | I² = 0%, P = 0.83 | VERY LOW (downgraded on imprecision (twice), inconsistency in point estimates (once) and reporting bias <4 0% patients had AE data (twice)) |
| Diarrhoea (Analysis 9.15) | 18 (6186), 318 events | 0.82 (0.66 to 1.02) | I² = 0%, P = 0.58 | LOW (downgraded on imprecision (once), some inconsistency in point estimates and reporting bias <70% patients had AE data (once further)) |
| Influenza‐like symptoms (Analysis 9.16) | 7 (2836), 129 events | 1.21 (0.87 to 1.70) | I² = 0%, P = 0.97 | VERY LOW (downgraded on imprecision (once), and reporting bias < 40% patients and 1/6 studies had AE data (twice)) |
| Outcome or subgroup title | No. of studies | No. of participants | Statistical method | Effect size |
| 1 Clinical Global Show forest plot | 13 | 3079 | Std. Mean Difference (IV, Fixed, 95% CI) | ‐0.20 [‐0.28, ‐0.13] |
| 2 Cognitive Function Show forest plot | 14 | 3600 | Std. Mean Difference (IV, Fixed, 95% CI) | ‐0.27 [‐0.34, ‐0.21] |
| 3 Decline in ADL Show forest plot | 13 | 3077 | Std. Mean Difference (IV, Fixed, 95% CI) | ‐0.16 [‐0.24, ‐0.09] |
| 4 Behaviour and Mood Show forest plot | 14 | 3674 | Std. Mean Difference (IV, Fixed, 95% CI) | ‐0.14 [‐0.21, ‐0.08] |
| 5 All‐cause discontinuation Show forest plot | 16 | 4661 | Risk Ratio (M‐H, Fixed, 95% CI) | 0.93 [0.82, 1.05] |
| 6 Discontinuations due to adverse events Show forest plot | 16 | 4661 | Risk Ratio (M‐H, Fixed, 95% CI) | 0.94 [0.79, 1.13] |
| 7 Number suffering at least one adverse event Show forest plot | 17 | 4708 | Risk Ratio (M‐H, Fixed, 95% CI) | 1.02 [0.97, 1.06] |
| 8 Number suffering serious adverse events Show forest plot | 16 | 4449 | Risk Ratio (M‐H, Fixed, 95% CI) | 0.90 [0.75, 1.07] |
| 9 Number suffering agitation as an adverse event Show forest plot | 15 | 3904 | Risk Ratio (M‐H, Fixed, 95% CI) | 0.76 [0.60, 0.96] |
| Outcome or subgroup title | No. of studies | No. of participants | Statistical method | Effect size |
| 1 Clinical Global: subgroup analysis by +/‐ ChEI Show forest plot | 13 | 3079 | Std. Mean Difference (IV, Fixed, 95% CI) | ‐0.20 [‐0.28, ‐0.13] |
| 1.1 Monotherapy | 9 | 1760 | Std. Mean Difference (IV, Fixed, 95% CI) | ‐0.20 [‐0.30, ‐0.10] |
| 1.2 With concomitant cholinesterase inhibitors | 5 | 1319 | Std. Mean Difference (IV, Fixed, 95% CI) | ‐0.21 [‐0.32, ‐0.09] |
| 2 Cognitive Function subgroup analysis by +/‐ ChEI Show forest plot | 14 | 3600 | Std. Mean Difference (IV, Fixed, 95% CI) | ‐0.28 [‐0.35, ‐0.21] |
| 2.1 Monotherapy | 9 | 1748 | Std. Mean Difference (IV, Fixed, 95% CI) | ‐0.33 [‐0.43, ‐0.23] |
| 2.2 With concomitant cholinesterase inhibitors | 6 | 1852 | Std. Mean Difference (IV, Fixed, 95% CI) | ‐0.24 [‐0.33, ‐0.14] |
| 3 Decline in ADL: subgroup analysis by +/‐ ChEI Show forest plot | 13 | 3077 | Std. Mean Difference (IV, Fixed, 95% CI) | ‐0.17 [‐0.24, ‐0.09] |
| 3.1 Monotherapy | 9 | 1758 | Std. Mean Difference (IV, Fixed, 95% CI) | ‐0.20 [‐0.30, ‐0.09] |
| 3.2 With concomitant cholinesterase inhibitors | 5 | 1319 | Std. Mean Difference (IV, Fixed, 95% CI) | ‐0.13 [‐0.24, ‐0.03] |
| 4 Behaviour and Mood: subgroup analysis by +/‐ ChEI Show forest plot | 14 | 3674 | Std. Mean Difference (IV, Fixed, 95% CI) | ‐0.14 [‐0.21, ‐0.08] |
| 4.1 Monotherapy | 9 | 1819 | Std. Mean Difference (IV, Fixed, 95% CI) | ‐0.10 [‐0.19, ‐0.01] |
| 4.2 With concomitant cholinesterase inhibitors | 6 | 1855 | Std. Mean Difference (IV, Fixed, 95% CI) | ‐0.18 [‐0.27, ‐0.09] |
| 5 Cognitive function (sMMSE):subgroup analysis within randomised study ‐ per protocol Show forest plot | 1 | 143 | Mean Difference (IV, Fixed, 95% CI) | ‐1.35 [‐2.39, ‐0.31] |
| 5.1 Monotherapy | 1 | 62 | Mean Difference (IV, Fixed, 95% CI) | ‐2.11 [‐3.74, ‐0.48] |
| 5.2 With concomitant cholinesterase inhibitor | 1 | 81 | Mean Difference (IV, Fixed, 95% CI) | ‐0.82 [‐2.18, 0.54] |
| 6 Decline in ADL (BADL): subgroup analysis within randomised study ‐ per protocol Show forest plot | 1 | Mean Difference (IV, Fixed, 95% CI) | Subtotals only | |
| 6.1 Monotherapy | 1 | 62 | Mean Difference (IV, Fixed, 95% CI) | ‐2.46 [‐6.45, 1.53] |
| 6.2 With concomitant cholinesterase inhibitor | 1 | 81 | Mean Difference (IV, Fixed, 95% CI) | ‐0.59 [‐3.21, 2.03] |
| 7 NPI: subgroup analysis within randomised study ‐ per protocol Show forest plot | 1 | Mean Difference (IV, Fixed, 95% CI) | Subtotals only | |
| 7.1 Monotherapy | 1 | 62 | Mean Difference (IV, Fixed, 95% CI) | ‐4.23 [‐14.08, 5.62] |
| 7.2 With concomitant cholinesterase inhibitor | 1 | 81 | Mean Difference (IV, Fixed, 95% CI) | ‐6.99 [‐13.13, ‐0.85] |
| 8 Clinical Global: CIBIC+ mean difference; ChEI subgroup Show forest plot | 4 | 1238 | Std. Mean Difference (IV, Random, 95% CI) | ‐0.20 [‐0.33, ‐0.08] |
| 9 All‐cause discontinuation ‐ by ChEI Show forest plot | 16 | 4661 | Risk Ratio (M‐H, Fixed, 95% CI) | 0.93 [0.82, 1.05] |
| 9.1 Monotherapy | 10 | 2459 | Risk Ratio (M‐H, Fixed, 95% CI) | 0.92 [0.78, 1.08] |
| 9.2 with concomitant ChEI | 7 | 2202 | Risk Ratio (M‐H, Fixed, 95% CI) | 0.94 [0.78, 1.13] |
| 10 Discontinuations due to adverse events ‐ by ChEI Show forest plot | 16 | 4661 | Risk Ratio (M‐H, Fixed, 95% CI) | 0.94 [0.79, 1.13] |
| 10.1 Monotherapy | 10 | 2459 | Risk Ratio (M‐H, Fixed, 95% CI) | 0.91 [0.72, 1.15] |
| 10.2 With concomitant ChEI | 7 | 2202 | Risk Ratio (M‐H, Fixed, 95% CI) | 0.99 [0.75, 1.30] |
| 11 Adverse events ‐ by ChEI Show forest plot | 13 | 4324 | Risk Ratio (M‐H, Fixed, 95% CI) | 1.02 [0.98, 1.06] |
| 11.1 Monotherapy | 8 | 2284 | Risk Ratio (M‐H, Fixed, 95% CI) | 0.99 [0.94, 1.04] |
| 11.2 with concomitant ChEI | 5 | 2040 | Risk Ratio (M‐H, Fixed, 95% CI) | 1.05 [0.98, 1.12] |
| 12 Serious adverse events ‐ by ChEI Show forest plot | 15 | 5672 | Risk Ratio (M‐H, Fixed, 95% CI) | 0.94 [0.83, 1.06] |
| 12.1 Monotherapy | 10 | 3161 | Risk Ratio (M‐H, Fixed, 95% CI) | 0.90 [0.74, 1.08] |
| 12.2 With concomitant ChEI | 6 | 2511 | Risk Ratio (M‐H, Fixed, 95% CI) | 0.98 [0.83, 1.15] |
| 13 Number suffering agitation as an adverse event ‐ by ChEI Show forest plot | 10 | 3175 | Risk Ratio (M‐H, Fixed, 95% CI) | 0.76 [0.60, 0.96] |
| 13.1 Monotherapy | 6 | 1535 | Risk Ratio (M‐H, Fixed, 95% CI) | 0.68 [0.51, 0.91] |
| 13.2 with concomitant ChEI | 5 | 1640 | Risk Ratio (M‐H, Fixed, 95% CI) | 0.92 [0.60, 1.40] |
| 14 Memantine + donepezil vs memantine + placebo Show forest plot | 1 | Mean Difference (IV, Fixed, 95% CI) | Totals not selected | |
| 14.1 Cognitive function (sMMSE) | 1 | Mean Difference (IV, Fixed, 95% CI) | 0.0 [0.0, 0.0] | |
| 14.2 Decline in ADL (BADLS scale) | 1 | Mean Difference (IV, Fixed, 95% CI) | 0.0 [0.0, 0.0] | |
| 14.3 Behaviour and mood (NPI) | 1 | Mean Difference (IV, Fixed, 95% CI) | 0.0 [0.0, 0.0] | |
| Outcome or subgroup title | No. of studies | No. of participants | Statistical method | Effect size |
| 1 Cohen Mansfield Agitation Inventory (MD) Show forest plot | 2 | 422 | Mean Difference (IV, Random, 95% CI) | ‐0.50 [‐4.71, 3.71] |
| 1.1 12 weeks | 1 | 149 | Mean Difference (IV, Random, 95% CI) | ‐3.80 [‐10.06, 2.46] |
| 1.2 24 weeks | 1 | 273 | Mean Difference (IV, Random, 95% CI) | 0.90 [‐1.29, 3.09] |
| 2 Cohen Mansfield Agitation Inventory (SMD) Show forest plot | 2 | 306 | Std. Mean Difference (IV, Random, 95% CI) | 0.11 [‐0.12, 0.33] |
| 2.1 12 weeks | 1 | 33 | Std. Mean Difference (IV, Random, 95% CI) | 0.21 [‐0.48, 0.89] |
| 2.2 24 weeks | 1 | 273 | Std. Mean Difference (IV, Random, 95% CI) | 0.10 [‐0.14, 0.33] |
| 3 NPI agitation subscale Show forest plot | 3 | Mean Difference (IV, Random, 95% CI) | Subtotals only | |
| 3.1 12 weeks | 2 | 146 | Mean Difference (IV, Random, 95% CI) | ‐0.39 [‐1.90, 1.13] |
| 3.2 24 weeks | 1 | 324 | Mean Difference (IV, Random, 95% CI) | 0.0 [0.0, 0.0] |
| 4 Number suffering agitation Show forest plot | 3 | 556 | Risk Ratio (M‐H, Fixed, 95% CI) | 2.39 [1.04, 5.50] |
| 4.1 12 weeks | 2 | 187 | Risk Ratio (M‐H, Fixed, 95% CI) | 5.0 [0.26, 97.00] |
| 4.2 24 weeks | 1 | 369 | Risk Ratio (M‐H, Fixed, 95% CI) | 2.20 [0.92, 5.27] |
| 5 Clinical Global Show forest plot | 3 | 443 | Std. Mean Difference (IV, Random, 95% CI) | ‐0.11 [‐0.34, 0.13] |
| 5.1 12 weeks | 2 | 168 | Std. Mean Difference (IV, Random, 95% CI) | ‐0.28 [‐0.59, 0.02] |
| 5.2 24 weeks | 1 | 275 | Std. Mean Difference (IV, Random, 95% CI) | 0.04 [‐0.20, 0.28] |
| 6 Cognitive Function: SIB Show forest plot | 3 | 486 | Mean Difference (IV, Random, 95% CI) | ‐4.34 [‐14.58, 5.89] |
| 6.1 12 weeks | 2 | 162 | Mean Difference (IV, Random, 95% CI) | ‐10.00 [‐16.15, ‐3.85] |
| 6.2 24 weeks | 1 | 324 | Mean Difference (IV, Random, 95% CI) | 0.48 [‐1.61, 2.57] |
| 7 Decline in ADL: ADCS‐ADL19 Show forest plot | 3 | 458 | Mean Difference (IV, Fixed, 95% CI) | 1.48 [‐0.19, 3.15] |
| 7.1 12 weeks | 2 | 182 | Mean Difference (IV, Fixed, 95% CI) | ‐0.10 [‐4.18, 3.98] |
| 7.2 24 weeks | 1 | 276 | Mean Difference (IV, Fixed, 95% CI) | 1.80 [‐0.03, 3.63] |
| 8 Behaviour and Mood Show forest plot | 3 | 470 | Mean Difference (IV, Random, 95% CI) | ‐1.51 [‐8.05, 5.03] |
| 8.1 12 weeks | 2 | 146 | Mean Difference (IV, Random, 95% CI) | ‐3.76 [‐14.09, 6.58] |
| 8.2 24 weeks | 1 | 324 | Mean Difference (IV, Random, 95% CI) | 1.23 [‐2.19, 4.65] |
| 9 All‐cause discontinuation Show forest plot | 3 | 555 | Risk Ratio (M‐H, Fixed, 95% CI) | 1.10 [0.79, 1.52] |
| 9.1 12 weeks | 2 | 186 | Risk Ratio (M‐H, Fixed, 95% CI) | 1.24 [0.78, 1.99] |
| 9.2 24 weeks | 1 | 369 | Risk Ratio (M‐H, Fixed, 95% CI) | 1.00 [0.63, 1.56] |
| 10 Discontinuations due to adverse events Show forest plot | 3 | 556 | Risk Ratio (M‐H, Fixed, 95% CI) | 1.40 [0.88, 2.21] |
| 11 Number suffering at least one adverse event Show forest plot | 3 | 556 | Risk Ratio (M‐H, Fixed, 95% CI) | 1.07 [0.95, 1.20] |
| 12 Number suffering serious adverse events Show forest plot | 3 | 556 | Risk Ratio (M‐H, Fixed, 95% CI) | 1.65 [0.85, 3.20] |
| Outcome or subgroup title | No. of studies | No. of participants | Statistical method | Effect size |
| 1 Clinical global: CIBIC+ Show forest plot | 4 | 621 | Mean Difference (IV, Fixed, 95% CI) | ‐0.09 [‐0.30, 0.12] |
| 2 Cognitive function: ADASCog Show forest plot | 5 | Mean Difference (IV, Fixed, 95% CI) | Subtotals only | |
| 2.1 ADAS cog at 6 months | 4 | 619 | Mean Difference (IV, Fixed, 95% CI) | ‐0.21 [‐1.38, 0.95] |
| 2.2 MMSE at 12 months ‐ final values | 1 | 26 | Mean Difference (IV, Fixed, 95% CI) | ‐1.15 [‐3.47, 1.17] |
| 3 Decline in ADL: ADCS‐ADL23 Show forest plot | 4 | 621 | Mean Difference (IV, Fixed, 95% CI) | 0.07 [‐1.66, 1.80] |
| 4 Behaviour and mood: NPI Show forest plot | 4 | 621 | Mean Difference (IV, Fixed, 95% CI) | 0.29 [‐1.58, 2.16] |
| Outcome or subgroup title | No. of studies | No. of participants | Statistical method | Effect size |
| 1 Clinical Global: CGI Show forest plot | 2 | 757 | Std. Mean Difference (IV, Random, 95% CI) | ‐0.02 [‐0.23, 0.19] |
| 2 Cognitive function: ADAS‐Cog Show forest plot | 2 | 569 | Mean Difference (IV, Fixed, 95% CI) | ‐2.15 [‐3.25, ‐1.05] |
| 3 Decline in ADL: NOSGER self‐care subscale Show forest plot | 2 | 542 | Std. Mean Difference (IV, Fixed, 95% CI) | ‐0.04 [‐0.20, 0.13] |
| 4 Behaviour: NOSGER disturbing behaviour subscale Show forest plot | 2 | 541 | Std. Mean Difference (IV, Fixed, 95% CI) | ‐0.20 [‐0.37, ‐0.03] |
| 5 Cognitive function: ADAS‐Cog: post‐hoc subgroup analysis Show forest plot | 2 | Mean Difference (IV, Fixed, 95% CI) | Subtotals only | |
| 5.1 Mild‐to‐moderate (MMSE >14) | 2 | 467 | Mean Difference (IV, Fixed, 95% CI) | ‐1.64 [‐2.83, ‐0.45] |
| 5.2 Moderate (MMSE ≤ 14) | 2 | 102 | Mean Difference (IV, Fixed, 95% CI) | ‐4.51 [‐7.21, ‐1.81] |
| 6 All‐cause discontinuation Show forest plot | 2 | 900 | Risk Ratio (M‐H, Fixed, 95% CI) | 1.05 [0.83, 1.34] |
| 7 Discontinuation due to adverse events Show forest plot | 2 | 900 | Risk Ratio (M‐H, Random, 95% CI) | 1.09 [0.73, 1.64] |
| 8 Number suffering at least one adverse event Show forest plot | 2 | 900 | Risk Ratio (M‐H, Fixed, 95% CI) | 1.03 [0.95, 1.11] |
| 9 Number suffering agitation as an adverse event Show forest plot | 2 | 900 | Risk Ratio (M‐H, Fixed, 95% CI) | 0.56 [0.33, 0.96] |
| Outcome or subgroup title | No. of studies | No. of participants | Statistical method | Effect size |
| 1 Clinical Global (24 weeks) Show forest plot | 3 | 243 | Std. Mean Difference (IV, Fixed, 95% CI) | ‐0.35 [‐0.60, ‐0.09] |
| 2 Cognitive Function Show forest plot | 4 | 298 | Mean Difference (IV, Random, 95% CI) | ‐0.37 [‐3.68, 2.95] |
| 2.1 16 weeks | 1 | 25 | Mean Difference (IV, Random, 95% CI) | 1.5 [‐1.28, 4.28] |
| 2.2 24 weeks | 3 | 273 | Mean Difference (IV, Random, 95% CI) | ‐1.90 [‐3.73, ‐0.07] |
| 3 Decline in ADL (24 weeks) Show forest plot | 3 | 243 | Std. Mean Difference (IV, Random, 95% CI) | ‐0.27 [‐0.65, 0.11] |
| 4 Behaviour and Mood: NPI Show forest plot | 4 | 267 | Mean Difference (IV, Random, 95% CI) | ‐2.09 [‐4.84, 0.66] |
| 4.1 16 weeks | 1 | 25 | Mean Difference (IV, Random, 95% CI) | ‐2.60 [‐15.60, 10.40] |
| 4.2 24 weeks | 3 | 242 | Mean Difference (IV, Random, 95% CI) | ‐2.18 [‐5.57, 1.21] |
| 5 All‐cause discontinuation Show forest plot | 4 | 312 | Risk Ratio (M‐H, Fixed, 95% CI) | 0.84 [0.55, 1.28] |
| 6 Discontinuation due to adverse events Show forest plot | 4 | 315 | Risk Ratio (M‐H, Fixed, 95% CI) | 0.94 [0.54, 1.63] |
| 7 Number suffering at least one adverse event Show forest plot | 4 | 315 | Risk Ratio (M‐H, Fixed, 95% CI) | 1.01 [0.79, 1.28] |
| Outcome or subgroup title | No. of studies | No. of participants | Statistical method | Effect size |
| 1 Clinical Global Show forest plot | 2 | 117 | Std. Mean Difference (IV, Fixed, 95% CI) | ‐0.31 [‐0.67, 0.06] |
| 1.1 6 months | 1 | 76 | Std. Mean Difference (IV, Fixed, 95% CI) | ‐0.22 [‐0.67, 0.23] |
| 1.2 12 months | 1 | 41 | Std. Mean Difference (IV, Fixed, 95% CI) | ‐0.48 [‐1.10, 0.15] |
| 2 Cognitive Function: MMSE Show forest plot | 2 | 122 | Mean Difference (IV, Random, 95% CI) | ‐0.23 [‐2.03, 1.56] |
| 2.1 6 months | 1 | 81 | Mean Difference (IV, Random, 95% CI) | 0.30 [‐1.23, 1.83] |
| 2.2 12 months | 1 | 41 | Mean Difference (IV, Random, 95% CI) | ‐1.80 [‐5.06, 1.46] |
| 3 Behaviour and Mood: Neuropsychiatric Inventory (NPI) Total Show forest plot | 2 | 115 | Mean Difference (IV, Fixed, 95% CI) | ‐3.16 [‐8.06, 1.74] |
| 3.1 6 months | 1 | 76 | Mean Difference (IV, Fixed, 95% CI) | ‐2.20 [‐8.01, 3.61] |
| 3.2 12 months | 1 | 39 | Mean Difference (IV, Fixed, 95% CI) | ‐5.5 [‐14.60, 3.60] |
| 4 All‐cause discontinuation Show forest plot | 2 | 133 | Risk Ratio (M‐H, Fixed, 95% CI) | 1.54 [0.58, 4.06] |
| 5 Discontinuation due to adverse events Show forest plot | 2 | 133 | Risk Ratio (M‐H, Random, 95% CI) | 1.25 [0.35, 4.44] |
| 6 Number suffering at least one adverse event Show forest plot | 2 | 133 | Risk Ratio (M‐H, Fixed, 95% CI) | 1.00 [0.75, 1.33] |
| 7 Number suffering at serious adverse events Show forest plot | 2 | 133 | Risk Ratio (M‐H, Fixed, 95% CI) | 0.45 [0.07, 2.94] |
| 8 Number suffering agitation as an adverse event Show forest plot | 2 | 133 | Risk Ratio (M‐H, Random, 95% CI) | 0.21 [0.01, 4.34] |
| Outcome or subgroup title | No. of studies | No. of participants | Statistical method | Effect size |
| 1 Clinical Global ‐ by dementia type and severity Show forest plot | 21 | 5098 | Std. Mean Difference (IV, Fixed, 95% CI) | ‐0.15 [‐0.21, ‐0.09] |
| 1.1 Alzheimer's disease ‐ mild | 4 | 621 | Std. Mean Difference (IV, Fixed, 95% CI) | ‐0.08 [‐0.27, 0.12] |
| 1.2 Alzheimer's disease ‐ moderate to severe | 14 | 3126 | Std. Mean Difference (IV, Fixed, 95% CI) | ‐0.20 [‐0.28, ‐0.13] |
| 1.3 Alzheimer's disease with agitation | 1 | 275 | Std. Mean Difference (IV, Fixed, 95% CI) | 0.04 [‐0.20, 0.28] |
| 1.4 Vascular dementia ‐ mild to moderate | 2 | 757 | Std. Mean Difference (IV, Fixed, 95% CI) | ‐0.00 [‐0.15, 0.14] |
| 1.5 Parkinson's disease dementia / DLB ‐ mild to moderate | 3 | 243 | Std. Mean Difference (IV, Fixed, 95% CI) | ‐0.35 [‐0.60, ‐0.09] |
| 1.6 Fronto Temporal Dementia ‐ mild | 1 | 76 | Std. Mean Difference (IV, Fixed, 95% CI) | ‐0.22 [‐0.67, 0.23] |
| 2 Cognitive Function ‐ by dementia type and severity Show forest plot | 20 | 5303 | Std. Mean Difference (IV, Fixed, 95% CI) | ‐0.22 [‐0.28, ‐0.17] |
| 2.1 Alzheimer's disease ‐ mild | 4 | 619 | Std. Mean Difference (IV, Fixed, 95% CI) | ‐0.03 [‐0.19, 0.13] |
| 2.2 Alzheimer's disease ‐ moderate to severe | 15 | 3647 | Std. Mean Difference (IV, Fixed, 95% CI) | ‐0.27 [‐0.34, ‐0.21] |
| 2.3 Alzheimer's disease with agitation | 1 | 324 | Std. Mean Difference (IV, Fixed, 95% CI) | 0.05 [‐0.17, 0.27] |
| 2.4 Vascular dementia ‐ mild‐to‐moderate | 2 | 569 | Std. Mean Difference (IV, Fixed, 95% CI) | ‐0.32 [‐0.48, ‐0.15] |
| 2.5 PDD/DLB ‐ mild to moderate | 1 | 63 | Std. Mean Difference (IV, Fixed, 95% CI) | ‐0.50 [‐1.00, 0.00] |
| 2.6 Fronto Temporal Dementia ‐ mild | 1 | 81 | Std. Mean Difference (IV, Fixed, 95% CI) | 0.09 [‐0.35, 0.52] |
| 3 Decline in ADL ‐ by dementia type and severity Show forest plot | 21 | 4887 | Std. Mean Difference (IV, Fixed, 95% CI) | ‐0.10 [‐0.16, ‐0.04] |
| 3.1 Alzheimer's disease ‐ mild | 4 | 621 | Std. Mean Difference (IV, Fixed, 95% CI) | 0.02 [‐0.14, 0.18] |
| 3.2 Alzheimer's Disease ‐ moderate to severe | 14 | 3124 | Std. Mean Difference (IV, Fixed, 95% CI) | ‐0.16 [‐0.24, ‐0.09] |
| 3.3 Alzheimer's disease with agitation | 1 | 276 | Std. Mean Difference (IV, Fixed, 95% CI) | 0.23 [‐0.01, 0.47] |
| 3.4 Vascular dementia ‐ mild‐to‐moderate | 2 | 542 | Std. Mean Difference (IV, Fixed, 95% CI) | ‐0.04 [‐0.20, 0.13] |
| 3.5 PDD/DLB ‐ mild to moderate | 3 | 243 | Std. Mean Difference (IV, Fixed, 95% CI) | ‐0.19 [‐0.45, 0.06] |
| 3.6 Fronto Temporal Dementia ‐ mild | 1 | 81 | Std. Mean Difference (IV, Fixed, 95% CI) | 0.0 [0.0, 0.0] |
| 4 Behaviour and mood ‐ by dementia type and severity Show forest plot | 23 | 5525 | Std. Mean Difference (IV, Fixed, 95% CI) | ‐0.12 [‐0.17, ‐0.06] |
| 4.1 Alzheimer's Disease ‐ mild | 4 | 621 | Std. Mean Difference (IV, Fixed, 95% CI) | 0.02 [‐0.14, 0.18] |
| 4.2 AD ‐ moderate to severe | 15 | 3721 | Std. Mean Difference (IV, Fixed, 95% CI) | ‐0.14 [‐0.21, ‐0.08] |
| 4.3 Alzheimer's disease with agitation | 1 | 324 | Std. Mean Difference (IV, Fixed, 95% CI) | 0.08 [‐0.14, 0.30] |
| 4.4 Vascular dementia ‐ mild‐to‐moderate | 2 | 541 | Std. Mean Difference (IV, Fixed, 95% CI) | ‐0.20 [‐0.37, ‐0.03] |
| 4.5 PDD/DLB ‐ mild to moderate | 3 | 242 | Std. Mean Difference (IV, Fixed, 95% CI) | ‐0.18 [‐0.43, 0.07] |
| 4.6 Fronto Temporal Dementia ‐ mild | 1 | 76 | Std. Mean Difference (IV, Fixed, 95% CI) | ‐0.17 [‐0.62, 0.28] |
| 5 Number suffering agitation ‐ by dementia type and severity Show forest plot | 19 | 5933 | Risk Ratio (M‐H, Fixed, 95% CI) | 0.84 [0.71, 1.01] |
| 5.1 Alzheimer's disease mild‐to‐moderate | 5 | 1890 | Risk Ratio (M‐H, Fixed, 95% CI) | 1.05 [0.70, 1.58] |
| 5.2 Alzheimer's disease moderate‐to‐severe | 7 | 2505 | Risk Ratio (M‐H, Fixed, 95% CI) | 0.73 [0.58, 0.93] |
| 5.3 AD with agitation (increased severity) | 2 | 403 | Risk Ratio (M‐H, Fixed, 95% CI) | 2.39 [1.04, 5.50] |
| 5.4 Vascular dementia mild‐to‐moderate | 2 | 900 | Risk Ratio (M‐H, Fixed, 95% CI) | 0.56 [0.33, 0.96] |
| 5.5 Fronto Temporal Dementia | 1 | 81 | Risk Ratio (M‐H, Fixed, 95% CI) | 0.21 [0.01, 4.34] |
| 5.6 Mixed dementia mild‐to‐moderate | 2 | 154 | Risk Ratio (M‐H, Fixed, 95% CI) | 1.53 [0.71, 3.31] |
| 6 Number suffering agitation ‐ by dementia type and ChEI Show forest plot | 17 | 5392 | Risk Ratio (M‐H, Fixed, 95% CI) | 0.83 [0.69, 0.99] |
| 6.1 Alzheimer's disease monotherapy | 5 | 1624 | Risk Ratio (M‐H, Fixed, 95% CI) | 0.66 [0.49, 0.89] |
| 6.2 Alzheimer's disease with concomitant ChEI | 6 | 2230 | Risk Ratio (M‐H, Fixed, 95% CI) | 0.91 [0.68, 1.22] |
| 6.3 Alzheimer's disease with agitation with concomitant ChEI | 2 | 403 | Risk Ratio (M‐H, Fixed, 95% CI) | 2.39 [1.04, 5.50] |
| 6.4 Vascular dementia monotherapy implied | 2 | 900 | Risk Ratio (M‐H, Fixed, 95% CI) | 0.56 [0.33, 0.96] |
| 6.5 Fronto Temporal Dementia ‐ monotherapy | 1 | 81 | Risk Ratio (M‐H, Fixed, 95% CI) | 0.21 [0.01, 4.34] |
| 6.6 Mixed dementia ‐ unclear ChEI | 2 | 154 | Risk Ratio (M‐H, Fixed, 95% CI) | 1.53 [0.71, 3.31] |
| 7 All‐cause discontinuation (all durations) ‐ by dementia type and severity Show forest plot | 33 | 8116 | Risk Ratio (M‐H, Fixed, 95% CI) | 0.99 [0.90, 1.08] |
| 7.1 Alzheimer's Disease ‐ mild | 5 | 722 | Risk Ratio (M‐H, Fixed, 95% CI) | 1.74 [1.08, 2.81] |
| 7.2 Alzheimer's disease ‐ moderate to severe | 18 | 5200 | Risk Ratio (M‐H, Fixed, 95% CI) | 0.93 [0.83, 1.04] |
| 7.3 Alzheimer's disease with agitation | 3 | 555 | Risk Ratio (M‐H, Fixed, 95% CI) | 1.10 [0.79, 1.52] |
| 7.4 Vascular dementia mild‐to‐moderate | 2 | 900 | Risk Ratio (M‐H, Fixed, 95% CI) | 1.05 [0.83, 1.34] |
| 7.5 PDD/DLB mild‐to‐moderate | 4 | 312 | Risk Ratio (M‐H, Fixed, 95% CI) | 0.84 [0.55, 1.28] |
| 7.6 Fronto Temporal Dementia mild | 2 | 133 | Risk Ratio (M‐H, Fixed, 95% CI) | 1.54 [0.58, 4.06] |
| 7.7 AIDS complex dementia | 1 | 140 | Risk Ratio (M‐H, Fixed, 95% CI) | 1.0 [0.52, 1.94] |
| 7.8 Mixed dementia mild‐to‐moderate | 2 | 154 | Risk Ratio (M‐H, Fixed, 95% CI) | 0.87 [0.30, 2.50] |
| 8 Discontinuation due to adverse events ‐ by dementia type and severity Show forest plot | 31 | 7968 | Risk Ratio (M‐H, Fixed, 95% CI) | 1.03 [0.90, 1.18] |
| 8.1 Alzheimer's Disease ‐ mild | 5 | 722 | Risk Ratio (M‐H, Fixed, 95% CI) | 2.12 [1.03, 4.39] |
| 8.2 Alzheimer's Disease ‐ moderate to severe | 18 | 5202 | Risk Ratio (M‐H, Fixed, 95% CI) | 0.93 [0.79, 1.11] |
| 8.3 Alzheimer's disease with agitation | 3 | 556 | Risk Ratio (M‐H, Fixed, 95% CI) | 1.40 [0.88, 2.21] |
| 8.4 Vascular dementia mild‐to‐moderate | 2 | 900 | Risk Ratio (M‐H, Fixed, 95% CI) | 1.10 [0.73, 1.64] |
| 8.5 Fronto Temporal Dementia | 2 | 133 | Risk Ratio (M‐H, Fixed, 95% CI) | 1.28 [0.37, 4.48] |
| 8.6 AIDS Complex dementia | 1 | 140 | Risk Ratio (M‐H, Fixed, 95% CI) | 1.0 [0.37, 2.70] |
| 8.7 PDD/DLB mild‐to‐moderate | 4 | 315 | Risk Ratio (M‐H, Fixed, 95% CI) | 0.94 [0.54, 1.63] |
| 9 Number suffering at least one adverse event ‐ by dementia type and severity Show forest plot | 30 | 8139 | Risk Ratio (M‐H, Fixed, 95% CI) | 1.03 [1.00, 1.06] |
| 9.1 Alzheimer's disease mild‐to‐moderate | 9 | 2624 | Risk Ratio (M‐H, Fixed, 95% CI) | 1.03 [0.98, 1.08] |
| 9.2 Alzheimer's disease moderate‐to‐severe | 10 | 3596 | Risk Ratio (M‐H, Fixed, 95% CI) | 1.02 [0.97, 1.06] |
| 9.3 Alzheimer's disease with agitation | 2 | 403 | Risk Ratio (M‐H, Fixed, 95% CI) | 1.07 [0.95, 1.20] |
| 9.4 Vascular dementia mild‐to‐moderate | 2 | 900 | Risk Ratio (M‐H, Fixed, 95% CI) | 1.03 [0.95, 1.11] |
| 9.5 Fronto Temporal Dementia | 2 | 133 | Risk Ratio (M‐H, Fixed, 95% CI) | 1.00 [0.75, 1.33] |
| 9.6 PDD/DLB mild‐to‐moderate | 3 | 295 | Risk Ratio (M‐H, Fixed, 95% CI) | 1.01 [0.79, 1.28] |
| 9.7 AIDS complex dementia | 1 | 106 | Risk Ratio (M‐H, Fixed, 95% CI) | 0.0 [0.0, 0.0] |
| 9.8 Mixed dementia mild‐to‐moderate | 1 | 82 | Risk Ratio (M‐H, Fixed, 95% CI) | 1.39 [0.91, 2.12] |
| 10 Number suffering at least one serious AE ‐ by dementia type and severity Show forest plot | 27 | 8138 | Risk Ratio (M‐H, Fixed, 95% CI) | 0.92 [0.83, 1.02] |
| 10.1 Alzheimer's disease mild‐to‐moderate | 9 | 2798 | Risk Ratio (M‐H, Fixed, 95% CI) | 0.92 [0.79, 1.07] |
| 10.2 Alzheimer's disease moderate‐to‐severe | 10 | 3684 | Risk Ratio (M‐H, Fixed, 95% CI) | 0.91 [0.77, 1.08] |
| 10.3 Alzheimer's disease with agitation | 2 | 403 | Risk Ratio (M‐H, Fixed, 95% CI) | 1.65 [0.85, 3.20] |
| 10.4 Vascular dementia mild‐to‐moderate | 2 | 900 | Risk Ratio (M‐H, Fixed, 95% CI) | 0.82 [0.62, 1.09] |
| 10.5 Fronto Temporal Dementia | 2 | 133 | Risk Ratio (M‐H, Fixed, 95% CI) | 0.71 [0.30, 1.66] |
| 10.6 PDD/DLB mild‐to‐moderate | 2 | 220 | Risk Ratio (M‐H, Fixed, 95% CI) | 1.43 [0.69, 2.97] |
| 11 Number suffering agitation as an adverse event ‐ by dementia type Show forest plot | 20 | 6008 | Risk Ratio (M‐H, Fixed, 95% CI) | 0.84 [0.71, 1.01] |
| 11.1 Alzheimer's disease | 12 | 4395 | Risk Ratio (M‐H, Fixed, 95% CI) | 0.81 [0.66, 0.99] |
| 11.2 AD with agitation (increased severity) | 2 | 403 | Risk Ratio (M‐H, Fixed, 95% CI) | 2.39 [1.04, 5.50] |
| 11.3 Vascular dementia | 2 | 900 | Risk Ratio (M‐H, Fixed, 95% CI) | 0.56 [0.33, 0.96] |
| 11.4 Parkinson's Disease Dementia / Dementia Lewy Bodies | 1 | 75 | Risk Ratio (M‐H, Fixed, 95% CI) | 0.0 [0.0, 0.0] |
| 11.5 Fronto Temporal Dementia | 1 | 81 | Risk Ratio (M‐H, Fixed, 95% CI) | 0.21 [0.01, 4.34] |
| 11.6 Mixed dementia | 2 | 154 | Risk Ratio (M‐H, Fixed, 95% CI) | 1.53 [0.71, 3.31] |
| Outcome or subgroup title | No. of studies | No. of participants | Statistical method | Effect size |
| 1 All‐cause discontinuation Show forest plot | 41 | 8998 | Risk Ratio (M‐H, Fixed, 95% CI) | 0.99 [0.91, 1.08] |
| 2 Discontinuation due to adverse events Show forest plot | 41 | 9004 | Risk Ratio (M‐H, Fixed, 95% CI) | 1.06 [0.92, 1.21] |
| 3 Number suffering at least one adverse event Show forest plot | 41 | 8960 | Risk Ratio (M‐H, Fixed, 95% CI) | 1.03 [1.00, 1.06] |
| 4 Number suffering serious adverse events Show forest plot | 41 | 8960 | Risk Ratio (M‐H, Fixed, 95% CI) | 0.92 [0.83, 1.02] |
| 5 Number suffering agitation as an adverse event Show forest plot | 22 | 6814 | Risk Ratio (M‐H, Fixed, 95% CI) | 0.84 [0.71, 1.01] |
| 6 Number suffering insomnia as an adverse event Show forest plot | 19 | 5354 | Risk Ratio (M‐H, Fixed, 95% CI) | 0.93 [0.73, 1.20] |
| 7 Number suffering confusion as an adverse event Show forest plot | 13 | 4509 | Risk Ratio (M‐H, Fixed, 95% CI) | 1.23 [0.91, 1.65] |
| 8 Number suffering depression as an adverse event Show forest plot | 10 | 3052 | Risk Ratio (M‐H, Fixed, 95% CI) | 1.06 [0.70, 1.60] |
| 9 Number suffering headache as an adverse event Show forest plot | 16 | 4889 | Risk Ratio (M‐H, Fixed, 95% CI) | 1.29 [1.00, 1.66] |
| 10 Number suffering hypertension as an adverse event Show forest plot | 8 | 3175 | Risk Ratio (M‐H, Fixed, 95% CI) | 1.76 [1.14, 2.70] |
| 11 Number suffering dizziness as an adverse event Show forest plot | 19 | 6395 | Risk Ratio (M‐H, Fixed, 95% CI) | 1.59 [1.28, 1.98] |
| 12 Number suffering falls as an adverse event Show forest plot | 20 | 6743 | Risk Ratio (M‐H, Fixed, 95% CI) | 0.98 [0.84, 1.13] |
| 13 Number suffering accidental injury as an adverse event Show forest plot | 10 | 3813 | Risk Ratio (M‐H, Fixed, 95% CI) | 0.81 [0.62, 1.05] |
| 14 Number suffering urinary incontinence as an adverse event Show forest plot | 8 | 2724 | Risk Ratio (M‐H, Fixed, 95% CI) | 1.12 [0.73, 1.72] |
| 15 Number suffering diarrhoea as an adverse event Show forest plot | 18 | 6186 | Risk Ratio (M‐H, Fixed, 95% CI) | 0.82 [0.66, 1.02] |
| 16 Number suffering influenza like symptoms as an adverse event Show forest plot | 7 | 2836 | Risk Ratio (M‐H, Fixed, 95% CI) | 1.21 [0.87, 1.70] |
| Outcome or subgroup title | No. of studies | No. of participants | Statistical method | Effect size |
| 1 Cognitive function Show forest plot | 11 | Mean Difference (IV, Fixed, 95% CI) | Totals not selected | |
| 1.1 1) OC then LOCF | 1 | Mean Difference (IV, Fixed, 95% CI) | 0.0 [0.0, 0.0] | |
| 1.2 2) OC then LOCF | 1 | Mean Difference (IV, Fixed, 95% CI) | 0.0 [0.0, 0.0] | |
| 1.3 3) OC then LOCF | 1 | Mean Difference (IV, Fixed, 95% CI) | 0.0 [0.0, 0.0] | |
| 1.4 4) OC then LOCF | 1 | Mean Difference (IV, Fixed, 95% CI) | 0.0 [0.0, 0.0] | |
| 1.5 PP then Retrieved dropout | 1 | Mean Difference (IV, Fixed, 95% CI) | 0.0 [0.0, 0.0] | |
| 1.6 PP then retrieved dropout ‐ AChEI only | 1 | Mean Difference (IV, Fixed, 95% CI) | 0.0 [0.0, 0.0] | |
| 1.7 PP then Retrieved dropout ‐ no AChEI | 1 | Mean Difference (IV, Fixed, 95% CI) | 0.0 [0.0, 0.0] | |
| 1.8 5) OC then LOCF | 1 | Mean Difference (IV, Fixed, 95% CI) | 0.0 [0.0, 0.0] | |
| 1.9 6) OC then LOCF | 1 | Mean Difference (IV, Fixed, 95% CI) | 0.0 [0.0, 0.0] | |
| 1.10 7) OC then LOCF | 1 | Mean Difference (IV, Fixed, 95% CI) | 0.0 [0.0, 0.0] | |
| 1.11 OC then LOCF | 1 | Mean Difference (IV, Fixed, 95% CI) | 0.0 [0.0, 0.0] | |
| 1.12 OC then LOCF | 1 | Mean Difference (IV, Fixed, 95% CI) | 0.0 [0.0, 0.0] | |
| 1.13 Per protocol then LOCF | 1 | Mean Difference (IV, Fixed, 95% CI) | 0.0 [0.0, 0.0] | |
| 2 Decline in ADL: ADCS‐ADL19/23 Show forest plot | 10 | Mean Difference (IV, Fixed, 95% CI) | Totals not selected | |
| 2.1 1) OC then LOCF | 1 | Mean Difference (IV, Fixed, 95% CI) | 0.0 [0.0, 0.0] | |
| 2.2 2) OC then LOCF | 1 | Mean Difference (IV, Fixed, 95% CI) | 0.0 [0.0, 0.0] | |
| 2.3 3) OC then LOCF | 1 | Mean Difference (IV, Fixed, 95% CI) | 0.0 [0.0, 0.0] | |
| 2.4 4) OC then LOCF | 1 | Mean Difference (IV, Fixed, 95% CI) | 0.0 [0.0, 0.0] | |
| 2.5 5) OC then LOCF | 1 | Mean Difference (IV, Fixed, 95% CI) | 0.0 [0.0, 0.0] | |
| 2.6 6) OC then LOCF | 1 | Mean Difference (IV, Fixed, 95% CI) | 0.0 [0.0, 0.0] | |
| 2.7 7) OC then LOCF | 1 | Mean Difference (IV, Fixed, 95% CI) | 0.0 [0.0, 0.0] | |
| 2.8 PP then Retrieved Dropout | 1 | Mean Difference (IV, Fixed, 95% CI) | 0.0 [0.0, 0.0] | |
| 2.9 PP then Retrieved Dropout ‐ AChEI only | 1 | Mean Difference (IV, Fixed, 95% CI) | 0.0 [0.0, 0.0] | |
| 2.10 PP then Retrieved dropout ‐ no AChEI | 1 | Mean Difference (IV, Fixed, 95% CI) | 0.0 [0.0, 0.0] | |
| 2.11 OC then LOCF | 1 | Mean Difference (IV, Fixed, 95% CI) | 0.0 [0.0, 0.0] | |
| 2.12 Per protocol then LOCF | 1 | Mean Difference (IV, Fixed, 95% CI) | 0.0 [0.0, 0.0] | |
| 3 Cognitive Function: SIB/ADASCog/MMSE Show forest plot | 17 | Std. Mean Difference (IV, Fixed, 95% CI) | Subtotals only | |
| 3.1 OC | 12 | 2901 | Std. Mean Difference (IV, Fixed, 95% CI) | ‐0.26 [‐0.33, ‐0.19] |
| 3.2 LOCF | 8 | 3066 | Std. Mean Difference (IV, Fixed, 95% CI) | ‐0.26 [‐0.33, ‐0.18] |
| 3.3 Missing at random assumption | 2 | 203 | Std. Mean Difference (IV, Fixed, 95% CI) | ‐0.20 [‐0.47, 0.08] |
| 3.4 Per protocol | 1 | 143 | Std. Mean Difference (IV, Fixed, 95% CI) | ‐0.36 [‐0.69, ‐0.03] |
| 3.5 Retrieved dropout | 1 | 246 | Std. Mean Difference (IV, Fixed, 95% CI) | ‐0.39 [‐0.64, ‐0.14] |
| 4 Decline in Activities of Daily Living Show forest plot | 14 | Std. Mean Difference (IV, Fixed, 95% CI) | Subtotals only | |
| 4.1 OC only | 10 | 2874 | Std. Mean Difference (IV, Fixed, 95% CI) | ‐0.11 [‐0.19, ‐0.03] |
| 4.2 LOCF | 6 | 2107 | Std. Mean Difference (IV, Fixed, 95% CI) | ‐0.13 [‐0.21, ‐0.04] |
| 4.3 Missing at random assumption | 2 | 203 | Std. Mean Difference (IV, Fixed, 95% CI) | ‐0.01 [‐0.29, 0.26] |
| 4.4 Per protocol | 1 | 143 | Std. Mean Difference (IV, Fixed, 95% CI) | ‐0.17 [‐0.50, 0.16] |
| 4.5 Retrieved dropout | 1 | 246 | Std. Mean Difference (IV, Fixed, 95% CI) | ‐0.22 [‐0.47, 0.03] |
| Outcome or subgroup title | No. of studies | No. of participants | Statistical method | Effect size |
| 1 Clinical Global Show forest plot | 24 | 5575 | Std. Mean Difference (IV, Fixed, 95% CI) | ‐0.20 [‐0.26, ‐0.14] |
| 2 Cognitive Function Show forest plot | 24 | 5670 | Std. Mean Difference (IV, Fixed, 95% CI) | ‐0.19 [‐0.24, ‐0.13] |
| 3 Decline in ADL Show forest plot | 24 | 5716 | Std. Mean Difference (IV, Fixed, 95% CI) | ‐0.10 [‐0.17, ‐0.04] |
| 4 Behaviour and Mood Show forest plot | 24 | 5718 | Std. Mean Difference (IV, Fixed, 95% CI) | ‐0.13 [‐0.19, ‐0.07] |
| 5 Clinical Global ‐ sensitivity analysis for high RoB Show forest plot | 17 | 4552 | Std. Mean Difference (IV, Fixed, 95% CI) | ‐0.19 [‐0.26, ‐0.13] |
| 6 Cognitive Function ‐ sensitivity analysis for high risk of bias Show forest plot | 19 | 5354 | Std. Mean Difference (IV, Fixed, 95% CI) | ‐0.18 [‐0.23, ‐0.12] |
| 7 Decline in ADL ‐ sensitivity analysis on high RoB Show forest plot | 17 | 4837 | Std. Mean Difference (IV, Fixed, 95% CI) | ‐0.09 [‐0.15, ‐0.02] |
| 8 Behaviour and Mood ‐ sensitivity analysis on high RoB Show forest plot | 17 | 5240 | Std. Mean Difference (IV, Fixed, 95% CI) | ‐0.12 [‐0.18, ‐0.06] |
| Outcome or subgroup title | No. of studies | No. of participants | Statistical method | Effect size |
| 1 Clinical Global ‐ CIBIC Plus, CGI‐I, or ADCS‐CGIC Show forest plot | 24 | 5579 | Std. Mean Difference (IV, Fixed, 95% CI) | ‐0.20 [‐0.26, ‐0.14] |
| 1.1 < 6 months | 4 | 515 | Std. Mean Difference (IV, Fixed, 95% CI) | ‐0.31 [‐0.53, ‐0.10] |
| 1.2 6‐7 months | 14 | 4201 | Std. Mean Difference (IV, Fixed, 95% CI) | ‐0.19 [‐0.26, ‐0.12] |
| 1.3 > 7 months | 6 | 863 | Std. Mean Difference (IV, Fixed, 95% CI) | ‐0.28 [‐1.04, 0.48] |
| 2 Cognitive Function Show forest plot | 24 | 5670 | Std. Mean Difference (IV, Fixed, 95% CI) | ‐0.19 [‐0.24, ‐0.13] |
| 2.1 < 6 months | 4 | 625 | Std. Mean Difference (IV, Fixed, 95% CI) | ‐0.12 [‐0.34, 0.10] |
| 2.2 6‐7 months | 14 | 4182 | Std. Mean Difference (IV, Fixed, 95% CI) | ‐0.21 [‐0.28, ‐0.15] |
| 2.3 > 7 months | 6 | 863 | Std. Mean Difference (IV, Fixed, 95% CI) | ‐0.10 [‐0.23, 0.04] |
| 3 Decline in ADL ‐ BGP, ADCS‐ADL 19 or 23 Show forest plot | 24 | 5716 | Std. Mean Difference (IV, Fixed, 95% CI) | ‐0.10 [‐0.17, ‐0.04] |
| 3.1 < 6 months | 4 | 625 | Std. Mean Difference (IV, Fixed, 95% CI) | ‐0.23 [‐0.46, ‐0.01] |
| 3.2 6‐7 months | 14 | 4257 | Std. Mean Difference (IV, Fixed, 95% CI) | ‐0.12 [‐0.19, ‐0.04] |
| 3.3 >7 months | 6 | 834 | Std. Mean Difference (IV, Fixed, 95% CI) | 0.05 [‐0.11, 0.22] |
| 4 Behaviour and Mood (Standardised NPI or NPI‐NH Total) Show forest plot | 23 | 5582 | Std. Mean Difference (IV, Fixed, 95% CI) | ‐0.13 [‐0.19, ‐0.07] |
| 4.1 < 6 months | 4 | 625 | Std. Mean Difference (IV, Fixed, 95% CI) | ‐0.28 [‐0.54, ‐0.03] |
| 4.2 6‐7 months | 14 | 4259 | Std. Mean Difference (IV, Fixed, 95% CI) | ‐0.11 [‐0.18, ‐0.05] |
| 4.3 > 7 months | 5 | 698 | Std. Mean Difference (IV, Fixed, 95% CI) | ‐0.21 [‐0.41, ‐0.02] |
| Outcome or subgroup title | No. of studies | No. of participants | Statistical method | Effect size |
| 1 Clinical Global; 10mg versus 20mg Show forest plot | 2 | 545 | Std. Mean Difference (IV, Random, 95% CI) | 0.05 [‐0.12, 0.22] |
| 2 Cognitive function; 10mg vs 20 mg Show forest plot | 2 | 545 | Std. Mean Difference (IV, Random, 95% CI) | 0.10 [‐0.48, 0.68] |
| 3 Decline in ADL; 10mg versus 20mg Show forest plot | 2 | 546 | Mean Difference (IV, Random, 95% CI) | ‐0.15 [‐1.86, 1.56] |
| 4 Behaviour and mood; 10mg versus 20mg Show forest plot | 2 | 547 | Mean Difference (IV, Random, 95% CI) | 1.70 [‐1.06, 4.46] |
| 5 Clinical Global Show forest plot | 3 | 623 | Std. Mean Difference (IV, Random, 95% CI) | ‐0.26 [‐0.50, ‐0.02] |
| 6 Cognitive function Show forest plot | 3 | 623 | Std. Mean Difference (IV, Random, 95% CI) | ‐0.26 [‐0.45, ‐0.06] |
| 7 Decline in activities of daily living Show forest plot | 3 | 623 | Std. Mean Difference (IV, Random, 95% CI) | ‐0.38 [‐0.92, 0.16] |
| 8 Behaviour and mood Show forest plot | 3 | 626 | Mean Difference (IV, Random, 95% CI) | ‐0.55 [‐3.25, 2.15] |
| Outcome or subgroup title | No. of studies | No. of participants | Statistical method | Effect size |
| 1 Clinical Global: subgroup analysis by +/‐ ChEI Show forest plot | 12 | 3624 | Std. Mean Difference (IV, Fixed, 95% CI) | ‐0.19 [‐0.26, ‐0.13] |
| 1.1 Monotherapy (studies ordered by decreasing mean severity) | 9 | 2378 | Std. Mean Difference (IV, Fixed, 95% CI) | ‐0.20 [‐0.28, ‐0.11] |
| 1.2 With concomitant ChEI (studies ordered by decreasing mean severity) | 3 | 1246 | Std. Mean Difference (IV, Fixed, 95% CI) | ‐0.19 [‐0.30, ‐0.08] |
| 2 Cognitive Function subgroup analysis by +/‐ ChEI Show forest plot | 16 | 4501 | Std. Mean Difference (IV, Fixed, 95% CI) | ‐0.22 [‐0.28, ‐0.16] |
| 2.1 Monotherapy (studies ordered by decreasing mean severity) | 10 | 2189 | Std. Mean Difference (IV, Fixed, 95% CI) | ‐0.24 [‐0.32, ‐0.15] |
| 2.2 With concomitant ChEI (studies ordered by decreasing mean severity) | 7 | 2312 | Std. Mean Difference (IV, Fixed, 95% CI) | ‐0.20 [‐0.28, ‐0.12] |
| 3 Decline in ADL subgroup analysis by +/‐ ChEI Show forest plot | 12 | 3432 | Std. Mean Difference (IV, Fixed, 95% CI) | ‐0.12 [‐0.19, ‐0.05] |
| 3.1 Monotherapy (studies ordered by decreasing mean severity) | 7 | 1674 | Std. Mean Difference (IV, Fixed, 95% CI) | ‐0.14 [‐0.24, ‐0.04] |
| 3.2 With concomitant ChEI (studies ordered by decreasing mean severity) | 6 | 1758 | Std. Mean Difference (IV, Fixed, 95% CI) | ‐0.10 [‐0.19, ‐0.01] |
| 4 Behaviour and Mood: subgroup analysis by +/‐ ChEI Show forest plot | 14 | 4270 | Std. Mean Difference (IV, Fixed, 95% CI) | ‐0.12 [‐0.18, ‐0.06] |
| 4.1 Monotherapy (studies ordered by decreasing mean severity) | 9 | 2125 | Std. Mean Difference (IV, Fixed, 95% CI) | ‐0.08 [‐0.17, 0.00] |
| 4.2 With concomitant ChEI (studies ordered by decreasing mean severity) | 6 | 2145 | Std. Mean Difference (IV, Fixed, 95% CI) | ‐0.15 [‐0.24, ‐0.07] |
| Outcome or subgroup title | No. of studies | No. of participants | Statistical method | Effect size |
| 1 Clinical Global Show forest plot | 12 | 3624 | Std. Mean Difference (IV, Fixed, 95% CI) | ‐0.19 [‐0.26, ‐0.13] |
| 2 Cognitive Function Show forest plot | 16 | 4500 | Std. Mean Difference (IV, Fixed, 95% CI) | ‐0.22 [‐0.27, ‐0.16] |
| 3 Decline in ADL Show forest plot | 12 | 3432 | Std. Mean Difference (IV, Fixed, 95% CI) | ‐0.12 [‐0.19, ‐0.05] |
| 4 Behaviour and Mood Show forest plot | 14 | 4270 | Std. Mean Difference (IV, Fixed, 95% CI) | ‐0.12 [‐0.18, ‐0.06] |
| 5 Clinical Global Show forest plot | 12 | 3624 | Std. Mean Difference (IV, Fixed, 95% CI) | ‐0.19 [‐0.26, ‐0.13] |
| 5.1 mild to moderate | 5 | 1519 | Std. Mean Difference (IV, Fixed, 95% CI) | ‐0.16 [‐0.26, ‐0.06] |
| 5.2 moderate to severe | 7 | 2105 | Std. Mean Difference (IV, Fixed, 95% CI) | ‐0.22 [‐0.30, ‐0.13] |
| 6 Cognitive Function Show forest plot | 16 | 4500 | Std. Mean Difference (IV, Fixed, 95% CI) | ‐0.22 [‐0.27, ‐0.16] |
| 6.1 mild to moderate | 7 | 1959 | Std. Mean Difference (IV, Fixed, 95% CI) | ‐0.13 [‐0.22, ‐0.04] |
| 6.2 moderate to severe | 9 | 2541 | Std. Mean Difference (IV, Fixed, 95% CI) | ‐0.28 [‐0.36, ‐0.20] |
| 7 Decline in ADL Show forest plot | 12 | 3432 | Std. Mean Difference (IV, Fixed, 95% CI) | ‐0.12 [‐0.19, ‐0.05] |
| 7.1 mild to moderate | 5 | 1554 | Std. Mean Difference (IV, Fixed, 95% CI) | ‐0.03 [‐0.13, 0.07] |
| 7.2 moderate to severe | 7 | 1878 | Std. Mean Difference (IV, Fixed, 95% CI) | ‐0.19 [‐0.28, ‐0.10] |
| 8 Behaviour and Mood Show forest plot | 14 | 4270 | Std. Mean Difference (IV, Fixed, 95% CI) | ‐0.12 [‐0.18, ‐0.06] |
| 8.1 mild to moderate | 4 | 1405 | Std. Mean Difference (IV, Fixed, 95% CI) | ‐0.01 [‐0.11, 0.10] |
| 8.2 moderate to severe | 10 | 2865 | Std. Mean Difference (IV, Fixed, 95% CI) | ‐0.17 [‐0.25, ‐0.10] |
| 9 All‐cause discontinuation, by type of disease and severity Show forest plot | 23 | 6571 | Risk Ratio (M‐H, Fixed, 95% CI) | 0.98 [0.88, 1.09] |
| 9.1 Alzheimer's disease mild‐to‐moderate | 9 | 2305 | Risk Ratio (M‐H, Fixed, 95% CI) | 1.09 [0.90, 1.31] |
| 9.2 Alzheimer's disease moderate‐to‐severe | 14 | 4266 | Risk Ratio (M‐H, Fixed, 95% CI) | 0.94 [0.83, 1.06] |
| 10 Discontinuation due to adverse events, by disease type and severity Show forest plot | 20 | 6227 | Risk Ratio (M‐H, Fixed, 95% CI) | 1.03 [0.88, 1.20] |
| 10.1 Alzheimer's disease mild‐to‐moderate | 7 | 1985 | Risk Ratio (M‐H, Fixed, 95% CI) | 1.41 [1.04, 1.91] |
| 10.2 Alzheimer's disease moderate‐to‐severe | 13 | 4242 | Risk Ratio (M‐H, Fixed, 95% CI) | 0.91 [0.76, 1.10] |
| Outcome or subgroup title | No. of studies | No. of participants | Statistical method | Effect size |
| 1 Clinical Global ‐ mild vs moderate/severe Show forest plot | 10 | 3224 | Std. Mean Difference (IV, Fixed, 95% CI) | ‐0.19 [‐0.26, ‐0.12] |
| 1.1 mild | 3 | 427 | Std. Mean Difference (IV, Fixed, 95% CI) | ‐0.08 [‐0.27, 0.12] |
| 1.2 moderate to severe | 10 | 2797 | Std. Mean Difference (IV, Fixed, 95% CI) | ‐0.20 [‐0.28, ‐0.13] |
| 2 Cognitive Function ‐ mild vs moderate/severe Show forest plot | 13 | 3955 | Std. Mean Difference (IV, Fixed, 95% CI) | ‐0.24 [‐0.30, ‐0.17] |
| 2.1 mild | 4 | 619 | Std. Mean Difference (IV, Fixed, 95% CI) | ‐0.03 [‐0.19, 0.13] |
| 2.2 moderate to severe | 13 | 3336 | Std. Mean Difference (IV, Fixed, 95% CI) | ‐0.27 [‐0.34, ‐0.21] |
| 3 Decline in ADL ‐ mild vs moderate/severe Show forest plot | 11 | 3308 | Std. Mean Difference (IV, Fixed, 95% CI) | ‐0.13 [‐0.20, ‐0.06] |
| 3.1 mild | 4 | 621 | Std. Mean Difference (IV, Fixed, 95% CI) | 0.02 [‐0.14, 0.18] |
| 3.2 moderate to severe | 11 | 2687 | Std. Mean Difference (IV, Fixed, 95% CI) | ‐0.16 [‐0.24, ‐0.09] |
| 4 Behaviour and Mood ‐ mild vs moderate/severe Show forest plot | 14 | 4295 | Std. Mean Difference (IV, Fixed, 95% CI) | ‐0.12 [‐0.18, ‐0.06] |
| 4.1 mild | 4 | 621 | Std. Mean Difference (IV, Fixed, 95% CI) | 0.02 [‐0.14, 0.18] |
| 4.2 moderate to severe | 14 | 3674 | Std. Mean Difference (IV, Fixed, 95% CI) | ‐0.14 [‐0.21, ‐0.08] |
| 5 All‐cause discontinuation ‐ mild vs moderate/severe Show forest plot | 19 | 5922 | Risk Ratio (M‐H, Fixed, 95% CI) | 0.97 [0.87, 1.08] |
| 5.1 mild | 5 | 722 | Risk Ratio (M‐H, Fixed, 95% CI) | 1.74 [1.08, 2.81] |
| 5.2 moderate to severe | 18 | 5200 | Risk Ratio (M‐H, Fixed, 95% CI) | 0.93 [0.83, 1.04] |
| 6 Discontinuations due to adverse events ‐ mild vs moderate/severe Show forest plot | 20 | 6150 | Risk Ratio (M‐H, Fixed, 95% CI) | 1.01 [0.86, 1.18] |
| 6.1 Mild | 6 | 948 | Risk Ratio (M‐H, Fixed, 95% CI) | 1.71 [1.06, 2.76] |
| 6.2 Moderate to severe | 18 | 5202 | Risk Ratio (M‐H, Fixed, 95% CI) | 0.93 [0.79, 1.11] |
| Outcome or subgroup title | No. of studies | No. of participants | Statistical method | Effect size |
| 1 Clinical Global: post‐hoc within‐trial subgroup analyses Show forest plot | 8 | 2597 | Std. Mean Difference (IV, Fixed, 95% CI) | ‐0.18 [‐0.27, ‐0.10] |
| 1.1 severe (MMSE mean <10) | 4 | 523 | Std. Mean Difference (IV, Fixed, 95% CI) | ‐0.26 [‐0.43, ‐0.09] |
| 1.2 moderate (subgroup MMSE 10 to <20) | 8 | 1453 | Std. Mean Difference (IV, Fixed, 95% CI) | ‐0.19 [‐0.30, ‐0.08] |
| 1.3 mild (subgroup MMSE ≥20) | 4 | 621 | Std. Mean Difference (IV, Fixed, 95% CI) | ‐0.08 [‐0.27, 0.12] |
| 2 Cognitive Function: post‐hoc within‐trial subgroup analyses Show forest plot | 8 | 2598 | Std. Mean Difference (IV, Random, 95% CI) | ‐0.24 [‐0.34, ‐0.14] |
| 2.1 severe (MMSE <10) | 4 | 531 | Std. Mean Difference (IV, Random, 95% CI) | ‐0.39 [‐0.67, ‐0.11] |
| 2.2 moderate (subgroup MMSE 10 to <20) | 8 | 1448 | Std. Mean Difference (IV, Random, 95% CI) | ‐0.27 [‐0.37, ‐0.16] |
| 2.3 mild (subgroup MMSE ≥20) | 4 | 619 | Std. Mean Difference (IV, Random, 95% CI) | ‐0.03 [‐0.19, 0.13] |
| 3 Decline in ADL: post‐hoc within‐trial subgroup analyses Show forest plot | 8 | 2615 | Std. Mean Difference (IV, Fixed, 95% CI) | ‐0.10 [‐0.18, ‐0.02] |
| 3.1 severe (MMSE mean <10) | 4 | 531 | Std. Mean Difference (IV, Fixed, 95% CI) | ‐0.18 [‐0.35, ‐0.01] |
| 3.2 moderate (subgroup MMSE 10 to <20) | 8 | 1463 | Std. Mean Difference (IV, Fixed, 95% CI) | ‐0.13 [‐0.23, ‐0.02] |
| 3.3 mild (subgroup MMSE ≥20) | 4 | 621 | Std. Mean Difference (IV, Fixed, 95% CI) | 0.02 [‐0.14, 0.18] |
| 4 Clinical Global: by severity of disease Show forest plot | 10 | 3224 | Std. Mean Difference (IV, Fixed, 95% CI) | ‐0.19 [‐0.26, ‐0.12] |
| 4.1 severe (MMSE mean <10) | 2 | 548 | Std. Mean Difference (IV, Fixed, 95% CI) | ‐0.16 [‐0.33, 0.01] |
| 4.2 moderate/severe (MMSE mean 10‐12) | 5 | 1557 | Std. Mean Difference (IV, Fixed, 95% CI) | ‐0.24 [‐0.34, ‐0.14] |
| 4.3 moderate (post hoc within‐trial subgroup) | 3 | 692 | Std. Mean Difference (IV, Fixed, 95% CI) | ‐0.16 [‐0.31, ‐0.00] |
| 4.4 mild (post hoc within‐trial subgroup MMSE ≥20) | 3 | 427 | Std. Mean Difference (IV, Fixed, 95% CI) | ‐0.08 [‐0.27, 0.12] |
| 5 Cognitive Function: by severity of disease Show forest plot | 14 | 4131 | Std. Mean Difference (IV, Fixed, 95% CI) | ‐0.23 [‐0.29, ‐0.17] |
| 5.1 severe (MMSE mean <10) | 3 | 690 | Std. Mean Difference (IV, Fixed, 95% CI) | ‐0.42 [‐0.57, ‐0.27] |
| 5.2 moderate/severe (MMSE mean 10‐12) | 6 | 1852 | Std. Mean Difference (IV, Fixed, 95% CI) | ‐0.23 [‐0.32, ‐0.14] |
| 5.3 moderate (post hoc within‐trial subgroup) | 4 | 795 | Std. Mean Difference (IV, Fixed, 95% CI) | ‐0.25 [‐0.40, ‐0.11] |
| 5.4 mild (post hoc within‐trial subgroup and mean MMSE ≥20) | 5 | 794 | Std. Mean Difference (IV, Fixed, 95% CI) | ‐0.03 [‐0.17, 0.11] |
| 6 Decline in ADL: by severity of disease Show forest plot | 12 | 3457 | Std. Mean Difference (IV, Fixed, 95% CI) | ‐0.12 [‐0.19, ‐0.06] |
| 6.1 severe (MMSE mean <10) | 2 | 324 | Std. Mean Difference (IV, Fixed, 95% CI) | ‐0.36 [‐0.59, ‐0.14] |
| 6.2 moderate/severe (MMSE mean 10‐12) | 5 | 1554 | Std. Mean Difference (IV, Fixed, 95% CI) | ‐0.15 [‐0.25, ‐0.05] |
| 6.3 moderate (post hoc within‐trial subgroup) | 4 | 809 | Std. Mean Difference (IV, Fixed, 95% CI) | ‐0.10 [‐0.25, 0.04] |
| 6.4 mild (post hoc within‐trial subgroup and mean MMSE ≥20) | 5 | 770 | Std. Mean Difference (IV, Fixed, 95% CI) | 0.02 [‐0.12, 0.16] |
| 7 Behaviour and Mood: by severity of disease Show forest plot | 14 | 4295 | Std. Mean Difference (IV, Fixed, 95% CI) | ‐0.12 [‐0.18, ‐0.06] |
| 7.1 severe (MMSE mean <10) | 3 | 749 | Std. Mean Difference (IV, Fixed, 95% CI) | ‐0.25 [‐0.40, ‐0.11] |
| 7.2 moderate/severe (MMSE mean 10‐12) | 7 | 2116 | Std. Mean Difference (IV, Fixed, 95% CI) | ‐0.14 [‐0.23, ‐0.06] |
| 7.3 moderate (post hoc within‐trial subgroup) | 4 | 809 | Std. Mean Difference (IV, Fixed, 95% CI) | ‐0.02 [‐0.17, 0.12] |
| 7.4 mild (post hoc within‐trial subgroup MMSE ≥20) | 4 | 621 | Std. Mean Difference (IV, Fixed, 95% CI) | 0.02 [‐0.14, 0.18] |