La mémantine contre la démence
Résumé scientifique
Contexte
La mémantine est un antagoniste non compétitif d'affinité modérée des récepteurs NMDA du glutamate. Il est autorisé dans la maladie d'Alzheimer (MA) modérée et grave ; aux États‐Unis, il est également largement utilisé en dérogation pour la MA légère.
Objectifs
Déterminer l'efficacité et l'innocuité de la mémantine chez les personnes atteintes de démence. Évaluer si la mémantine est bénéfique pour les personnes qui prennent déjà des inhibiteurs de la cholinestérase (ICh).
Stratégie de recherche documentaire
Nous avons fait une recherche dans le registre d'essais d'ALOIS, le Cochrane Dementia and Cognitive Improvement Group (http://www.medicine.ox.ac.uk/alois/) jusqu'au 25 mars 2018. Nous avons examiné les registres d'essais cliniques, les communiqués de presse et les affiches des fabricants de mémantine, ainsi que les sites Web de la FDA, de l'EMEA et de NICE. Nous avons contacté les auteurs et les entreprises pour obtenir les informations manquantes.
Critères de sélection
Essais randomisés à double aveugle, à groupes parallèles, contrôlés par placebo sur la mémantine chez les personnes atteintes de démence.
Recueil et analyse des données
Nous avons regroupé et analysé des données provenant de quatre domaines cliniques, de différentes étiologies et de sévérité de démence et de MA avec agitation. Nous avons évalué l'impact de la durée, de la gravité et de l'utilisation concomitante des inhibiteurs de la cholinestérase. Par conséquent, nous avons limité les analyses à la dose homologuée (20 mg/jour ou 28 mg à libération prolongée) et aux données après six à sept mois de suivi, et analysé séparément les résultats pour la MA légère et modérée à grave.
Nous avons transformé les résultats des critères de jugement relatifs à l'efficacité en différence de points selon des échelles d’évaluation.
Résultats principaux
Pour tous les types de démence, des données étaient disponibles auprès de près de 10 000 participants dans 44 essais, dont la plupart présentaient un risque faible ou incertain de biais. Pour près de la moitié des études, les données pertinentes provenaient de sources non publiées. La majorité des essais (29 sur 7 885 participants) ont été menés auprès de personnes atteintes de la MA.
1. MA modérée à grave (avec ou sans ICh concomitantes). Des données probantes de haute certitude provenant de 14 études menées auprès d'environ 3 700 participants montrent de façon constante un petit avantage clinique pour la mémantine par rapport au placebo : l'évaluation globale clinique ( en anglais : clinical global rating, CGR) : 0.21 points CIBIC+ (intervalle de confiance à 95 % (IC) 0,14 à 0,30) ; fonction cognitive (FC) : 3.11 points Severe Impairment Battery (SIB) (IC à 95 % : 2,42 à 3,92) ; rendement dans les activités de la vie quotidienne (en anglais : activities of daily living, ADL) : 1.09 ADL19 points (IC à 95 % : 0,62 à 1,64) ; et comportement et humeur (en anglais : behaviour and mood, BM) : 1.84 points Neuropsychiatric Inventory (NPI) (IC à 95 % : 1,05 à 2,76). Il se peut qu'il n'y ait pas de différence entre le nombre de personnes qui interrompent la mémantine par rapport au placebo. Risque relatif (RR) de 0,93 (IC à 95 % : 0,83 à 1,04), ce qui correspond à 13 personnes de moins pour 1000 (IC à 95 % : 31 à 7 de moins). Il existe des preuves de certitude modérée que le taux d’agitation comme effet indésirable est moindre chez les patients traités par mémantine: RR 0,81 (IC à 95 % : 0,66 à 0,99) (25 personnes de moins pour 1 000, IC à 95 % : 1 à 44 de moins), il existe également des preuves de certitude modérée, provenant de trois autres études, qui suggèrent que la mémantine n'est pas bénéfique comme traitement de l'agitation (p. ex. Cohen Mansfield Agitation Inventory : avantage clinique de 0,50 point CMAI, IC à 95 % : ‐ 3,71 à 4,71).
La présence d'inhibiteurs concomitants de la cholinestérase n'a pas d'incidence sur la différence d’effet entre la mémantine et le placebo, à l'exception possible du résultat sur le BM (effet plus important chez les personnes prenant des inhibiteurs de la cholinestérase) et du résultat sur la FC (effet moindre).
2. La maladie d'Alzheimer légère (Mini Mental State Examination (MMSE) 20 à 23) : principalement des preuves de certitude modérée fondées sur des sous‐groupes post‐hoc provenant d'un maximum de quatre études menées auprès d'environ 600 participants. Il semblerait qu'il n'y a aucune différence entre la mémantine et le placebo pour la FC : 0.21 points ADAS‐Cog (IC à 95 % : ‐0,95 à 1,38) ; performance sur l’ADL : ‐0,07 point ADL 23 (IC à 95 % : ‐1,80 à 1,66) et BM : ‐0,29 points NPI (IC à 95 % : ‐2,16 à 1,58). Il y a moins de certitude dans les données du CGR, ce qui suggère également qu'il n'y a peut‐être pas de différence : 0.09 Points CIBIC+ (IC à 95 % ‐0,12 à 0,30). La mémantine (comparativement au placebo) peut augmenter le nombre de personnes qui cessent le traitement en raison d'événements indésirables (RR 2,12, IC à 95 % : 1,03 à 4,39).
3. Démence vasculaire légère à modérée. Des données de certitude modérée et faible provenant de deux études menées auprès d'environ 750 participants indiquent qu'il y a probablement un léger avantage clinique pour la FC : 2.15 points ADAS‐Cog (IC à 95 % : 1,05 à 3,25) ; il pourrait y avoir un léger avantage clinique pour le BM : 0.47 points de troubles du comportement NOSGER (IC à 95 % : 0,07 à 0,87) ; il n'y a probablement aucune différence dans le CGR : 0.03 points CIBIC+ (IC 95 % ‐0,28 à 0,34) ; et il peut n'y avoir aucune différence pour les ADL : 0.11 points de la sous‐échelle activité de la vie quotidienne NOSGER II (IC à 95 % ‐0,35 à 0,54) et pour le nombre de personnes qui ont cessé le traitement : RR 1,05 (IC à 95 % : 0,83 à 1,34).
Les données probantes sur l'efficacité d'autres types de démence sont limitées, principalement de faible ou très faible certitude (maladie de Parkinson et démence à corps de Lewy (pour lesquels le CGR pourrait présenter un léger avantage clinique ; quatre études chez 319 personnes) ; démence frontotemporale (deux études chez 133 personnes) ; et complexe démentiel lié au SIDA (une étude chez 140 personnes)).
Il existe des données probantes de haute certitude ne montrant aucune différence entre la mémantine et le placebo en ce qui concerne la proportion de patients ayant subi au moins un effet indésirable : RR 1,03 (IC à 95 % : 1,00 à 1,06) ; le RR ne diffère pas entre les étiologies ou les sévérités de la démence. En combinant les données disponibles de tous les essais cliniques, il existe des preuves de certitude modérée que la mémantine est 1,6 fois plus susceptible que le placebo d'entraîner des étourdissements (6,1 % contre 3,9 %), des preuves de faible certitude d'un risque 1,3 fois plus élevé de céphalées (5,5 % contre 4,3 %), mais de certitude élevée de ne présenter aucune différence dans les chutes.
Conclusions des auteurs
Nous avons constaté d'importantes différences dans l'efficacité de la mémantine dans la MA légère par rapport à celle de la MA modérée à grave. La mémantine présente un léger avantage clinique chez les personnes atteintes de la MA modérée à grave, qu'elles prennent ou non également un inhibiteur de la cholinestérase, mais aucun avantage chez les personnes atteintes de la MA légère.
En raison de l'hétérogénéité clinique de la maladie d'Alzheimer, il est peu probable qu'un seul médicament ait un effet important, ce qui signifie que le traitement médicamenteux optimal peut comprendre plusieurs médicaments, chacun ayant isolément un bénéfice d’importance infra‐clinique.
Un essai définitif de longue durée dans la maladie d'Alzheimer légère est nécessaire pour déterminer si le fait de commencer la mémantine plus tôt serait bénéfique à long terme et sans danger : à l'heure actuelle, les preuves s'y opposent, bien que ce soit une pratique courante. Un essai de longue durée dans la MA modérée à grave est nécessaire pour déterminer si les bienfaits persistent au‐delà de six mois.
PICOs
Résumé simplifié
La mémantine comme traitement de la démence
Problématique de la revue
Nous avons examiné les données probantes sur la mémantine, qui est l'un des principaux médicaments utilisés dans le traitement des personnes atteintes de démence. Nous voulions savoir si la mémantine pouvait ralentir l'évolution de la démence et si elle était nocive de quelque façon que ce soit. Nous voulions aussi savoir si l'ajout de la mémantine à d'autres médicaments contre la démence apportait un effet supplémentaire.
Contexte
Le type de démence le plus courant est la maladie d'Alzheimer (MA), suivie de la démence vasculaire. Environ une ou deux personnes sur 100 sont atteintes de la MA à 65 ans, et ce taux double tous les cinq ans. La démence implique une perte de mémoire, des difficultés à penser et souvent des changements d'humeur et de comportement.
Il existe deux principaux types de traitement : les inhibiteurs de l'acétylcholinestérase (ICh) et la mémantine. Ces médicaments fonctionnent différemment et nous voulions savoir si le fait de donner les deux types de médicaments ensemble fonctionnerait mieux que les ICh seuls.
Caractéristiques des études
Nous avons cherché autant d'études pertinentes que possible ayant un plan d’étude fiable (essais contrôlés randomisés) et comparant la mémantine au placebo pour chaque type de démence. Nous avons trouvé 44 études portant sur environ 10 000 personnes. La plupart des études (29 chez 7 885 personnes) portaient sur des personnes atteintes de la MA. La plupart des études ont été bien menées, mais certaines n'ont pas été bien rapportées et nous avons obtenu des renseignements supplémentaires des laboratoires pharmaceutiques. Nous avons analysé les résultats séparément pour les personnes atteintes de démence légère et celles atteintes de démence modérée à sévère.
Résultats principaux
La mémantine a un léger effet bénéfique chez les personnes atteintes de la MA modérée à sévère. Cet avantage affecte la pensée, la capacité de poursuivre les activités quotidiennes normales et la gravité des troubles du comportement et d'humeur. Dans l'ensemble, elle est bien tolérée chez les personnes atteintes de la MA modérée à grave, mais elle peut causer des étourdissements chez quelques personnes qui la prennent.
Un résultat important est que l'ajout de la mémantine au traitement par ICh diminue l’agravation des symptomes, par rapport au placebo.
Cependant, chez les personnes atteintes d'une légère MA, la mémantine n'est probablement pas meilleure que le placebo. Il s'agit principalement de données de qualité moyenne.
Dans le cas de la démence vasculaire, deux études menées auprès d'environ 750 personnes ont indiqué que les troubles de la pensée, du comportement et de l'humeur présentaient probablement un léger avantage, et que l'agitation de la mémantine pouvait être moindre que celle du placebo. Il s'agit de données de qualité moyenne ou faible.
Valeur probante des données
Dans l'ensemble, les données probantes sur la mémantine de la MA sont de grande qualité et proviennent de nombreux essais menés auprès de milliers de personnes. Nous pouvons avoir confiance dans les résultats pour la MA, mais dans une moindre mesure concernant les personnes atteintes d'autres types de démence.
Ce résumé en langage simple est à jour en date de mars 2018.
Authors' conclusions
Summary of findings
| Memantine 20 mg or equivalent compared to placebo for moderate‐to‐severe Alzheimer's disease (AD) 24‐ to 30‐week data. OC | ||||||
| Population: Alzheimer's disease (AD), moderate‐to‐severe | ||||||
| Continuous outcomes | Score with placebo (median) | Mean improvement in change score between memantine and placebo | SMD (95% CI) meta‐analysis findings | № of participants | Certainty of the evidence | Comments |
| Clinical Global (CIBIC+) | Median CIBIC+ score was 4.60 3 (i.e. deterioration with time) | MD: 0.21 (0.14 to 0.30) | ‐0.20 (‐0.28 to ‐0.13) | 2797 | ⊕⊕⊕⊕ | SMD as a negative outcome Converted to CIBIC+ scale; median SD(pooled) = 1.06. |
| Cognitive Function (SIB) | Median SIB score at baseline: 75.2. Median change from baseline (positive scale): ‐2.4 4 (i.e. deterioration with time) | MD: 3.11 (2.42 to 3.92) | ‐0.27 (‐0.34 to ‐0.21) | 3337 | ⊕⊕⊕⊕ | SMD as a negative outcome (Analysis 1.2). Converted to SIB scale (and scale direction inverted); median SD (pooled) = 11.53. |
| Functional performance on activities of daily living: ADCS‐ADL19 | Median ADCS‐ADL19 score at baseline: 33.2 Median change from baseline (positive scale): ‐2.8 5 (i.e. deterioration with time) | MD: 1.09 (0.62 to 1.64) | ‐0.16 (‐0.24 to ‐0.09) | 2687 | ⊕⊕⊕⊕ | SMD for decline in ADL (a negative outcome) (Analysis 1.3). Converted to ADCS‐ADL19 scale (and scale direction inverted); median SD(pooled) = 6.84. |
| Behaviour and Mood (NPI) 144‐point scale | The median baseline NPI score was 17.0. Median change from baseline (negative scale): 2.80 6 (i.e. deterioration with time) | MD: 1.84 (1.05 to 2.76) | ‐0.14 (‐0.21 to ‐0.08) | 3674 | ⊕⊕⊕⊕ | SMD as a negative outcome Converted to NPI scale; median SD(pooled) = 13.15. |
| Binary outcomes | Anticipated absolute effects | Relative effect | № of participants | Certainty of the evidence | Comments | |
| Risk with placebo (median) | Risk with memantine | |||||
| All‐cause discontinuation | 182 per 1000 | 169 per 1000 | RR 0.93 | 5087 924 events | ⊕⊕⊕⊕ | RR and median control group risk in people with moderate‐to‐severe AD without agitation (Analysis 16.5). |
| Difference: 13 fewer people per 1000 discontinued treatment for any cause (95% CI 31 fewer to 7 more) | ||||||
| Number suffering at least one adverse event | 716 per 1000 | 737 per 1000 | RR 1.03 | 8033 5371 events | ⊕⊕⊕⊕ | RR from all studies (Analysis 9.3). Median control group risk for moderate‐to‐severe AD studies (Analysis 1.7). |
| Difference: 21 more people per 1000 suffered adverse events | ||||||
| Number suffering at least one serious adverse event | 114 per 1000 | 104 per 1000 (93 to 116) | RR 0.91 | 6482 (19 RCTs) 918 events | ⊕⊕⊕⊕ | RR and median control risk from all AD studies (except those with agitation) (from Analysis 8.10) |
| Difference: 10 fewer people per 1000 suffered serious adverse events (95% CI 21 fewer to 2 more) | ||||||
| Number suffering agitation as an adverse event | 129 per 1000 | 104 per 1000 | RR 0.81 | 4395 321 events | ⊕⊕⊕⊝ | RR from all AD studies (apart from those in people with agitation) (Analysis 8.11). Median control group risk for moderate‐to‐severe AD studies (Analysis 1.9). |
| Difference: 25 fewer people per 1000 suffered agitation as an adverse event | ||||||
| *The risk in the intervention group (and its 95% confidence interval) is based on the assumed risk in the comparison group and the relative effect of the intervention (and its 95% CI). | ||||||
| GRADE Working Group grades of evidence | ||||||
| 1 Some inconsistency in point estimates, but not enough to downgrade 2 Some inconsistency in point estimates (downgrade once) 3 Median control group values for 8 studies reporting CIBIC+ (Asada 2011a (IE3501); Bakchine 2008 (99679) SG; Grossberg 2008 (MD‐50); Peskind 2004 (MD‐10) SG; Porsteinsson 2008(MD‐12)S; Reisberg 2003 (9605); Tariot 2004 (MD‐02); van Dyck 2007 (MD‐01)) 4 Median control group baseline scores and median control group change from baseline for 5 studies reporting SIB (Grossberg 2008 (MD‐50); Reisberg 2003 (9605); Tariot 2004 (MD‐02); van Dyck 2007 (MD‐01); Wang 2013) 5 Median control group baseline scores and median control group change from baseline for the 4 studies reporting ADCS‐ADL19 (Grossberg 2008 (MD‐50); Reisberg 2003 (9605);Tariot 2004 (MD‐02); van Dyck 2007 (MD‐01)) 6 Median control group baseline scores and median control group change from baseline for the 10 studies reporting NPI (Bakchine 2008 (99679) SG; Dysken 2014 SG; Grossberg 2008 (MD‐50); Howard 2012 (DOMINO‐AD); Peskind 2004 (MD‐10) SG; Porsteinsson 2008(MD‐12)S; Reisberg 2003 (9605); Tariot 2004 (MD‐02); van Dyck 2007 (MD‐01); Wang 2013) | ||||||
| Memantine 20 mg compared to placebo for mild‐to‐moderate vascular dementia. six‐month studies | ||||||
| Population: vascular dementia, mild‐to‐moderate severity | ||||||
| Continuous outcomes | Score with placebo (mean) | Mean improvement in change score between memantine and placebo | SMD (95% CI) meta‐analysis findings | № of participants | Certainty of the evidence | Comments |
| Clinical Global: (CIBIC+) | CIBIC+ score (i.e. no change with time) | MD: 0.03 (‐0,28 to 0.34) | ‐0.02 (‐0.23 to 0.19) | 757 | ⊕⊕⊕⊝ | SMD as a negative outcome; random effects (Analysis 5.1). Converted to CIBIC+ scale; SD(pooled) = 1.46. |
| Cognitive function: ADAS‐Cog | Mean ADAS‐Cog score at baseline was 23.6. Mean change from (i.e. deterioration with time) | MD: 2.15 (1.05 to 3.25) | ‐0.32 (‐0.48 to ‐0.15) | 569 | ⊕⊕⊕⊝ | Analysed as mean difference (Analysis 5.2) [SMD as a negative outcome Analysis 8.2] |
| Performance on ADL (NOSGER self care subscale) Subscale 5 points | Baseline scores not reported. Change from baseline i.e. deterioration with time | MD: 0.11 (‐0.35 to 0.54) | ‐0.04 (‐0.20 to 0.13) | 542 | ⊕⊕⊝⊝ | SMD for decline in ADL (a negative outcome) (Analysis 5.3). Converted to NOSGER II self‐care subscale (Wilcock 2002 (9202)) SD(pooled) = 2.69. |
| Behaviour: NOSGER disturbing behaviour subscale Subscale 5 points | Baseline scores not reported. Change from baseline for the NOSGER i.e. deterioration with time | MD: 0.47 (0.07 to 0.87) | ‐0.20 (‐0.37 to ‐0.03) | 542 | ⊕⊕⊝⊝ | SMD as a negative outcome (Analysis 5.4). Converted to NOSGER II disturbing behaviour subscale (Wilcock 2002 (9202)) SD(pooled) = 2.34. |
| Binary outcomes | Anticipated absolute effects | Relative effect | № of participants | Certainty of the evidence | Comments | |
| Risk with placebo (median) | Risk with memantine | |||||
| All‐cause discontinuation | 218 per 1000 | 229 per 1000 | RR 1.05 | 900 678 events | ⊕⊕⊝⊝ | RR and control group risk for studies in people with vascular dementia (Analysis 5.6.) |
| Difference: 11 more people per 1000 discontinued treatment for any cause (95% CI 37 fewer to 74 more) | ||||||
| Number suffering at least one adverse event | 742 per 1000 | 764 per 1000 | RR 1.03 | 8033 5371 events | ⊕⊕⊕⊕ | RR from all studies (Analysis 9.3). Control group risk taken from studies in vascular dementia (Analysis 5.8) |
| Difference: 22 more people per 1000 suffered adverse events | ||||||
| Number suffering at least one serious adverse event | 211 per 1000 | 173 per 1000 (95% CI 131 to 230) | RR 0.82 (0.62 to 1.09) | 900 (2 RCTs) 162 events | ⊕⊕⊝⊝ | RR and control group risk from vascular dementia studies (Analysis 8.10) |
| Difference: 38 fewer people per 1000 suffered serious adverse events (95% CI 80 fewer to 19 more) | ||||||
| Number suffering agitation as an adverse event | 77 per 1000 | 44 per 1000 | RR 0.57 | 900 54 events | ⊕⊕⊝⊝ | RR and control group risk from vascular dementia studies (Analysis 5.9); random effects |
| Difference: 33 fewer people per 1000 suffered agitation as an adverse event | ||||||
| *The risk in the intervention group (and its 95% confidence interval) is based on the assumed risk in the comparison group and the relative effect of the intervention (and its 95% CI). | ||||||
| GRADE Working Group grades of evidence | ||||||
| 1 Inconsistency in point estimates (and I² = 48%); some imprecision (95% CI crossed null and was consistent with benefit and no difference) but may be consequence of inconsistency (downgraded once overall) 2 Majority of the information at high risk of bias (downgrade once). Some inconsistency (but insufficient to downgrade) 3 Majority of the information at high risk of bias for 2 domains (downgrade twice) 4 Majority of the information at high risk of bias (downgrade once); some inconsistency and some imprecision (crossed null and 1.25) (downgrade once) 5 Majority of the information at high risk of bias (downgrade once); imprecision (162 events and crossed both 0.75 and null)) (downgrade once) 6 Majority of the information at high risk of bias (downgrade once); imprecision (only 54 events) (downgrade once) | ||||||
Background
Description of the condition
This review covers the effect of memantine in dementia of all aetiologies.
Alzheimer's disease (AD) is the commonest cause of dementia, and is found in approximately 70% of autopsies of people with dementia. The prevalence of the disease is approximately 1% to 2% at the age of 65, but doubles every five years to at least the age of 90 (Qiu 2009). The disease is progressive. For the purposes of drug trials, people with AD who have a score on the brief mini mental state examination (MMSE) of more than 20 have come to be labelled as having 'mild' AD. However, the combination of loss of memory, disorientation and frequent loss of insight which accompanies this stage means that the impact on caregivers is often very far from 'mild'. It is not uncommon for patients to need admission to care homes in this stage. 'Moderate' AD has come to be defined as those with an MMSE score of 20 to 10. In this range, patients decline more rapidly. The impairment in patients' ability to manage everyday tasks becomes marked and is obvious during even brief conversation. By the time patients have progressed to an MMSE score of 10 or less ('severe' dementia), the deficits are profound and 24‐hour supervision is required. Approximately 70% of people with AD require admission to care homes.
Aside from age, the biggest risk factor for developing AD is possession of the ApoE4 gene, which is present in 17% to 30% of the population. Other risk factors include all vascular risks (diabetes, hypertension, high cholesterol, lack of exercise), any cerebral injury (trauma or stroke), and being female (Patterson 2007; Sibbett 2017).
Cellular and animal models, genetic, neuroimaging, clinical and postmortem brain studies have all been important in advancing understanding of the many changes which occur in the brains of people with AD. Nerve cell loss and disruption of neurotransmitter systems becomes widespread throughout many brain areas, particularly the hippocampus and cerebral cortex. Aggregation of peptide fragments of the amyloid precursor protein, which probably holds nerve cells close enough together for signals to be transmitted between them, causes malfunction of processes within cells. Large deposits of these fragments, amyloid plaques, develop outside neurones and are associated with a mild inflammatory response. However, removal of existing plaques does not appear to result in improvement in symptoms so it is unclear to what extent the amyloid plaques are a cause of AD or a consequence of some other, more fundamental, disturbance. Within the neurons, the transport of cellular components becomes disrupted because tau, which helps to keep the microtubule scaffolding together, becomes hyperphosphorylated and itself forms into paired helical filament 'tangles'. No drugs affecting this process have been proven to benefit symptoms. Cholinergic function, which mediates attention, tends to be impaired in people with AD. This can be partially corrected by cholinesterase inhibitors (ChEIs) which reduce the breakdown of acetylcholine.
Vascular dementia, in which cognitive decline is attributed to some form of vascular injury, typically ischaemic, is the second most common cause of dementia in Western societies. Developing a valid definition, distinct from AD, has been problematic. It is a heterogeneous condition and clinical manifestations differ depending on the size and location of the cerebrovascular lesions. In autopsy studies, 'mixed' AD and vascular dementia has been reported as accounting for between 0% and 55% of cases of dementia. In addition to co‐occurrence due simply to chance, AD and vascular dementia may have aetiological or pathogenetic factors in common (Kalaria 1999). In comparison with sufferers from AD, people with mixed dementia show higher frequencies of depressed mood, focal motor or sensory findings and gait disturbances, but the neuropsychological pattern is not distinctive. Using criteria which demand imaging evidence of discrete vascular lesions and a clinical event associated with cognitive decline, or evidence of marked small vessel disease, vascular dementia affects 1% to 20% of people aged 65 years or older.
Parkinson's disease dementia (PDD) and dementia with Lewy bodies (DLB) are closely related. The main clinical distinction is one of definition: those with PDD have had parkinsonism a year or more before developing dementia, whereas in DLB the onsets of dementia and any parkinsonism are closer in time. Some people with DLB show no signs of parkinsonism. Both groups are more likely to experience visual hallucinations, marked fluctuations in functional ability, and REM (rapid eye movement) sleep behaviour disorder.
Description of the intervention
Memantine was first synthesised at Eli Lilly as an agent to lower elevated blood sugar levels, but was ineffective. It has since been tested in over 100 randomised controlled trials in a wide variety of neurological and psychiatric conditions, including dementia of different sorts, depression, neuropathic pain, Parkinson's disease and autism.
In 1972, Merz applied for a German patent for memantine as a potential treatment for a wide range of cerebrovascular conditions, citing evidence of reduced degeneration and nerve cell loss following experimentally induced ischaemia in animal models. In 1975 and 1978, patents were granted in Germany and the USA, respectively (Parsons 1999). This basis for the original patent for memantine (Bormann 1991), which was due to expire in April 2010, was contested by manufacturers of generics (Forest 2007). Forest and Merz settled an agreement to provide licenses to each of Amneal, Cobalt, Dr. Reddy’s, Lupin, Orchid, Sun, Teva, Upsher−Smith, and Wockhardt that permitted these companies to launch their generic versions of 'Namenda' within three months prior to the expiration of the original patent (Forest 2010a). However, in March 2009, the U.S. Patent and Trademark Office issued a Notice of Final Determination that, after review of the regulatory timeline for approval, Namenda was entitled to a patent term extension until April 2015 and the patent finally expired in October 2015. Generic memantine is now available, but in 2010 the US Food and Drug Administration (FDA) awarded a license for an extended release, once daily preparation Namenda XR 28 mg (Forest 2010b). The patent for this expires in September 2029.
Memantine was approved in February 2002 by the European Agency for the Evaluation of Medical Products (EMEA) for the treatment of "moderately severe to severe Alzheimer's disease" (EMEA 2004) and in 2003 by the FDA for the treatment of moderate‐to‐severe AD (MMSE up to 14) (Anonymous 2003; Forest 2003). In 2006, the EMEA expanded its indication to 'moderate‐to‐severe AD' (MMSE up to 19) (EMEA 2006). In June 2008, the EMEA granted a license for a once daily 20 mg dosing schedule (EMEA 2008). Applications to the FDA and EMEA for licenses for the treatment of mild‐to‐moderate AD have been unsuccessful (Forest 2005b; Lundbeck 2005).
Memantine has not been approved for vascular dementia or earlier stages of AD in any jurisdiction.
Memantine is marketed as Axura by Merz, as Ebixa by Lundbeck in Europe, as Namenda by Forest in North America and as Mamary by Daiichi Asubio in Japan. In 2010, memantine had 34.8% share of the US market for drugs for AD (Forest 2010a). Annual global sales exceed 1 billion USD. In 2015, the UK price of memantine to the NHS decreased by 94%. Prescribing rates in England increased from approximately 100,000 items dispensed in 2011 to 784,000 (at a cost of £5.4m) in 2015 (Prescriptions England 2016).
In May 2015, Actavis launched Namzaric (a fixed‐dose combination of 28 mg extended‐release memantine and the ChEI, donepezil 10 mg) for people with moderate‐to‐severe AD, following FDA approval in December 2014.
How the intervention might work
Memantine is a low affinity antagonist of the N‐methyl‐D‐aspartate (NMDA) glutamate receptor. L‐glutamate is the main excitatory neurotransmitter in the central nervous system and is implicated in neural transmission, learning, memory processes and neuronal plasticity (Sucher 1996). Physiological glutamate activity is required for normal brain activity and so cannot be abolished completely (Kornhuber 1997). The hippocampus and other brain regions which are affected in AD, are rich in glutamate receptors of the NMDA class. Consolidation of new memories is also mediated through these receptors.
Excessive glutamate‐induced excitation, which results in excessive flow of calcium into neurons through NMDA receptors, plays a role in the pathogenesis of AD and in the damage due to an ischaemic stroke (Cacabelos 1999). The clinical actions of memantine may be mediated by preventing this excitotoxicity.
NMDA receptor‐induced responses may depend on the receptor location. Stimulation of synaptic NMDA receptors, acting primarily through nuclear Ca(2+) signalling, leads to the build‐up of a neuroprotective 'shield', whereas stimulation of extrasynaptic NMDA receptors promotes cell death (Hardingham 2010) and increases amyloid production (Bordji 2010). The differing pharmacodynamics of memantine at synaptic and extrasynaptic NMDA receptors may mean that there is a 'therapeutic window' for memantine at doses where inhibition of extrasynaptic receptors is greater than for synaptic receptors (Hardingham 2010). Inhibition of both subtypes occurs at higher doses.
It is possible that the effect of memantine is related to reduction of tau phosphorylation (Degerman Gunnarsson 2007) or of amyloid toxicity (Song 2008).
Memantine also preserves cerebral energy status during experimentally induced hypoglycaemia in healthy people (Willenborg 2011). Although this effect could be related to its actions in dementia, this has yet to be established.
Why it is important to do this review
First, since the last update of our review in 2006, the UK National Institute for Health and Care Excellence (NICE) has, on the basis of its 2011 appraisal (TA 217) revised an earlier recommendation that memantine was insufficiently cost‐effective to warrant prescription on the UK's National Health Service (NHS), and produced new recommendations outlining its use (NICE 2011). In a further update in 2015, NICE stated that they "identified nothing new that affects recommendations 1.1, 1.2" (those concerning memantine). Concurrent with the update of our Cochrane Review, NICE's clinical guideline on dementia (CG 42) has been partially updated, to review further the effect of two topics relevant to this memantine review: concurrent treatment with memantine and cholinesterase inhibitors (ChEIs), and memantine for non‐AD dementias. The guideline has not updated recommendations 1.1 and 1.2 (NICE 2018). The Cochrane Dementia and Cognitive Improvement review group is a stakeholder for this guideline and the authors of this review have shared data and evidence synthesis with NICE.
The UK recommendations regarding memantine monotherapy (TA 217 recommendations 1.1 and 1.2) therefore remain unchanged: that is, that memantine should be available at public expense for people who either (a) have moderate AD and are intolerant of, or have a contraindication to ChEIs or (b) have severe AD. The Appraisal Committee also concluded that "if cognitive scales are not appropriate for assessing the need for treatment, or whether to continue treatment, then clinicians should use another appropriate method of assessment".
NICE's 2011 updated decision was based on consideration of data from four studies, with emphasis on statistical significance. Their analysis showed a significant benefit on cognitive function assessed by the Severe Impairment Battery (SIB) at three months, but not at six months. Two studies provided data for assessment of activities of daily living (ADL) using the Alzheimer's Disease Cooperative Study ‐ Activities of Daily Living (ADCS‐ADL)19 scale, showing marginal significance at six months. No statistically significant effect was seen on behaviour. NICE's model suggested that memantine delayed time to institutional care by 0.8 months. Thus, NICE's 2015 decision to transfer recommendations 1.1 and 1.2 to their 'static list of technology appraisals' was taken on the basis of relatively few studies for clinical effectiveness. Memantine is now off‐patent so cost‐effectiveness will be affected.
NICE's original 2011 guidance also concluded that there was a "lack of evidence of additional clinical efficacy (of concurrent therapy with ChEIs) compared with memantine monotherapy" (NICE 2011). However, this aspect of the TA has now been updated in the newly published 2018 guideline (NICE 2018), which recommends that for people with an established diagnosis of AD who are already taking a ChEI, memantine should be additionally considered in moderate disease and additionally offered in severe disease (NICE 2018). A lack of clarity still remains because of the decision not to update the monotherapy recommendations, and there is potential confusion arising from conflating the old and new recommendations. The British Association for Psychopharmacology guideline suggests that there is "type I evidence [ie based on meta‐analysis of RCTs] for adding memantine to a cholinesterase inhibitor" (O'Brien 2017).
Second, the German Institute for Quality and Efficiency in Healthcare (IQWIG) has revised its conclusions on memantine. In 2009, they concluded that "there is no scientific proof that patients with moderate or severe Alzheimer's disease benefit from drugs containing the agent memantine". Their last search of registries for studies was in January 2009. Data from nine studies of 16 to 28 weeks duration were eventually included. IQWIG pointed to a lack of 'reliable responder analysis', which prevents an understanding of whether 'more patients in the memantine group notice a perceptible improvement in their symptoms than in the placebo group' and argued that it was "not possible to deduce a proof of a relevant effect" on clinical global because, although showing a significant benefit (standardised mean difference (SMD) 0.18, 95% confidence interval (CI) 0.05 to 0.3), the lower confidence limit fell below a threshold of 0.2. The majority of included studies collected data on the amount of care required ('resource utilisation') but this was not made available. However, in response, in 2011 Merz submitted post‐hoc findings on responder analyses which led to changes to IQWIG's conclusions (IQWIG 2011), "The data provide proof of a benefit of memantine in patients with Alzheimer’s disease with regard to the prevention of a relevant deterioration in cognitive function. For activities of daily living, taking into account the uncertain response criteria, as well as the concurrent minor size of the effect, the data provide an indication of a benefit of memantine."
Third, France's Minister for Health de‐listed all drugs routinely used for AD from August 2018 (memantine and the ChEIs, donepezil, galantamine and rivastigmine), stating, "The drugs available in early 2018 for Alzheimer's disease have only minimal and transient efficacy. They are also difficult to use because of their disproportionate adverse effects and many interactions with other drugs. None of the available drugs has been shown to slow down progression toward dependence, yet all carry a risk of life‐threatening adverse effects and severe drug interactions". De‐listing means the drugs are no longer reimbursed by the national health insurance system (Prescrire 2018). The French dementia guideline was updated at the same time and indicated that the 'medical service' was insufficient to justify national support, although noting the marketing authorisation and stating that drugs can be prescribed in line with their summary of product characteristics (HAS 2018).
Fourth, many patients in North America are taking memantine outside the terms of its license, perhaps in the belief that 'if it works for moderate AD it must work in mild AD'. In 2006, it was prescribed to 19% of people with mild AD, despite the fact that, in 2005 the FDA did not approve a supplemental new drug application (sNDA) by Forest Labs which sought specific marketing approval for a mild AD indication (McManus 2006). In the mainly academic centres that comprise the Alzheimer Disease Neuroimaging Initiative (ADNI) 45.7% of people with mild AD were receiving memantine (Schneider 2011a). Nearly 40% of US neurologists report prescribing memantine at least sometimes to people with mild cognitive impairment (Roberts 2010).
Fifth, the regulations governing publication of trial results have changed since the last update of this review in 2006. Trials conducted by US sponsors now have to be reported on clinical registries within a year of the last data being collected from the last participant in the trial. This greater transparency has led to data becoming available which is not subject to peer review, and to the possibility of identifying data which was collected but remains unavailable ('known unknowns'). The inclusion of non peer‐reviewed registry data in meta‐analysis reduces the risk of bias due to selective publication. It also helps to restore the breach of ethical contract with trial participants and their families which occurs when data remain unpublished: they usually agree to participate in the belief that the experience will contribute to publicly available knowledge.
Sixth, pharmacological strategies for managing some of the behavioural changes associated with dementia are of low benefit, often have side effects, and are overused. Considerable marketing activity, especially in the 2000s, asserted that memantine might be an alternative.
Seventh, there may be a therapeutic window for memantine that impacts on the timing of when memantine is prescribed. Trials in cognitive impairment in multiple sclerosis have consistently found a dose‐related worsening of neurological and psychiatric symptoms (Lovera 2010; Peyro‐Saint‐Paul 2016; Villoslada 2009), consistent with preclinical work suggesting the possibility of a therapeutic window (Hardingham 2010). In the ADNI, Schneider 2011a and colleagues found that people taking memantine and ChEIs declined faster on the MMSE and Clinical Dementia Rating (CDR) scales (but not Alzheimer's Disease Assessment Scale ‐ Cognitive subscale (ADAS‐Cog) or a functional questionnaire) than those taking ChEIs alone. Whilst this was probably because memantine was started early by clinicians faced with patients who were declining more rapidly, and the results of the two cognitive scales are not wholly consistent, the result is also consistent with an adverse effect of memantine in early AD.
It is therefore important to conduct this review to investigate these unanswered questions and inconsistencies, in order to give clear information.
Objectives
The primary aim of the review is to assess the efficacy and safety of memantine for the treatment of dementia, as revealed in clinical trials involving people with Alzheimer's, vascular, mixed or other forms of dementia. Additionally, the review aims to assess whether memantine adds benefit for people already taking cholinesterase inhibitors (ChEIs).
Methods
Criteria for considering studies for this review
Types of studies
We included studies for analysis in this review if they fulfilled the following criteria.
-
Double‐blind, parallel‐group, placebo‐controlled, with randomised and unconfounded treatment assignment to memantine or placebo
-
Sample selection criteria were specified and diagnosis used established criteria (e.g. Diagnostic and Statistical Manual of Mental Disorders (DSM) or International Classification of Diseases (ICD) criteria)
-
Outcome instruments were specified
-
Duration was specified
We also included studies for which data were known to exist but were not available in published reports, in order that the potential impact of publication bias could be assessed.
Double‐blind randomised trials of memantine for cognitive impairment which did not meet the inclusion criteria (e.g. in participants with mild cognitive impairment, or head‐to‐head studies) are briefly discussed in 'Excluded studies'.
Types of participants
People with Alzheimer's, vascular, mixed or other types dementia of all degrees of severity, treated as in‐ or out‐patients.
Types of interventions
Memantine at any dose and by any route of administration. Although there is evidence that 20 mg once daily is as well tolerated as 10 mg twice daily, an extended release formulation is now also available at an 'equivalent' dose (28 mg). Given this equivalence, and that it has a licence, it was included in analyses of the licensed dose and indication.
Types of outcome measures
The primary outcomes of interest included the following.
-
Clinical global rating
-
Cognitive function
-
Functional performance in activities of daily living (ADL)
-
Behavioural disturbance
-
Incidence of dropout and adverse events
We also sought data on the following pragmatic outcomes.
-
Effect on carer burden
-
Quality of Life
-
Institutionalisation
-
Costs
Search methods for identification of studies
Electronic searches
We searched ALOIS (www.medicine.ox.ac.uk/alois) ‐ the Cochrane Dementia and Cognitive Improvement Group’s Specialized Register on 25 March 2018. We used the Advanced search, with the following search terms: memantine, D‐145, DMAA, DRG‐0267, ebixa, abixa, axura, akatinol, memox and namenda.
ALOIS is maintained by the Information Specialists of the Cochrane Dementia Group and contains studies in the areas of dementia prevention, dementia treatment and cognitive enhancement in healthy people. The studies are identified from:
-
monthly searches of a number of major healthcare databases: MEDLINE, Embase, CINAHL, PsycINFO and LILACS;
-
monthly searches of a number of national and international trial registers: ISRCTN; UMIN (Japan's Trial Registry); ICTRP / WHO portal (which covers ClinicalTrials.gov; ISRCTN; the Chinese Clinical Trials Register; the German Clinical Trials Register; the Iranian Registry of Clinical Trials and the Netherlands National Trials Register, plus others);
-
quarterly search of the Cochrane Library’s Central Register of Controlled Trials (CENTRAL)
-
six‐monthly searches of a number of grey literature sources: ISI Web of Knowledge Conference Proceedings; Index to Theses; Australasian Digital Theses.
To view a list of all sources searched for ALOIS see About ALOIS on the ALOIS web site.
Details of the search strategies used for the retrieval of reports of trials from the healthcare databases, from Cochrane CENTRAL and from conference proceedings can be viewed in the ‘methods used in reviews’ section within the editorial information section of the Dementia and Cognitive Improvement Group.
We carried out additional searches in many of the sources listed above to cover the timeframe from the last searches performed for ALOIS to ensure that the search for the review was as up‐to‐date as possible. The search strategies used can be seen in Appendix 1.
We searched press releases from Merz, Lundbeck and Forest Laboratories (April 2017) and examined all releases pertaining to memantine.
The Forest, Lundbeck and JAPIC clinical trials registry and ClinicalTrials.gov were re‐examined for the final time in April 2017.
Searching other resources
All conference posters sponsored by Forest Laboratories, Merz or Lundbeck presented before end 2009 were provided through the medical information department of Merz..
We wrote to authors, Lundbeck, Forest, Merz and Daiichi Asubio for details about various studies as detailed in Characteristics of included studies.
Additionally, we were aware of conference posters reporting data from the Fox 2012 (MAGD) study. Review author RMcS had access to additional data from the Howard 2012 (DOMINO‐AD) study ‐ therefore we also included this information.
Data collection and analysis
Selection of studies
For this update, the abstracts of references newly retrieved by the search since the search conducted for the previously published version of this review were read by review authors MW, ER, JD or LF and checked by RMcS. Any disparity in the final lists was resolved by discussion in order to arrive at the final list of included studies.
Assessment of risk of bias in included studies
For all studies conducted since the introduction of ICH‐GCP (International Council for Harmonisation of Technical Requirements for Pharmaceuticals for Human Use ‐ Good Clinical Practice), we assumed that sequence generation, allocation concealment and blinding were all adequate and carried a low risk of bias. This was informed by prior findings, which were confirmed in the current review, of a low incidence of side‐effects which could potentially unmask allocation.
Incomplete outcome data due to participant dropout is a very common problem in dementia trials. We recorded the number of participants in each arm who did not have outcome data at the measurement point, alongside the reasons for 'missingness', and we calculated for each arm the proportion missing of those randomised. We used this approach to missing data, regardless of the method of analysis (see Dealing with missing data). In assessing risk of attrition bias for the continuous efficacy outcomes, we considered the following factors: the level of missing data, the difference between groups and the reasons for missingness. We also took into account whether the approach to missing data (e.g. observed case (OC) or last observation carried forward (LOCF)) gave different effect estimates. For the adverse events dichotomous outcome, we compared the proportions missing in each group with each other and with the adverse event risk. If there were substantial differential missing data or the missing data proportion was comparable with the adverse events risk, we rated the risk of attrition bias as high.
A further common problem is reporting bias, in which positive trials, or positive results within trials, are preferentially reported. We used funnel plots to assess whether results reported solely in trial registries were more likely to be positive than those published in peer review literature, or whether there were likely to be 'unknown unknowns': trials whose existence was not apparent despite the systematic searching. We noted in the 'Risk of bias' tables when outcomes had not been reported at all, but did not assign high risk of outcome reporting bias. Instead, we presented the results in forest plots for those studies that were known to exist, but for which no data were available. This approach did not alter estimates of effect size but was designed to show the extent of the ‘known unknowns’. In the absence of definitive information, we assumed that the numbers in the placebo and drug arms were the same. Then, for GRADE assessment, we considered downgrading on risk of bias if the potential contribution from missing studies could affect the summary statistics for studies with available data for that outcome.
Measures of treatment effect
As described in Types of outcome measures, the analysis is focused on the five domains of clinical global, cognitive function, performance on activities of daily living (ADL) function, behaviour and adverse events. The measures used are described in more detail in Appendix 2. Table 1 details which measures were used in the AD and vascular dementia studies. For data on adverse events, we sought the numbers in each treatment group and the numbers experiencing the outcome of interest.
| Study | Clinical Global | Cognitive function | Decline in ADL | Behaviour and mood | ||||||||||
| CIBIC‐Plus | CGIC/ | CDR | ADAS‐ | SIB | MMSE | ADCS‐ | ADL‐19 | BADLS | BGP | DAD | NPI | BEHAVE | Other | |
| Alzheimers' disease studies | X | |||||||||||||
| X | X | Japanese versions. DAD, Caregiver‐rated Crichton Scale, MMSE, CDR | ||||||||||||
| X | X | X | Japanese versions | |||||||||||
| X | MMSE | |||||||||||||
| X | X | X | X | |||||||||||
| X | X | X | MMSE, Caregiver activity survey | |||||||||||
| X | X | X | NPI nursing home version; CMAI | |||||||||||
| X | X | X | CMAI, NPI‐Agitation | |||||||||||
| X | X | X | CMAI, MMSE, QOL‐AD, incidence of agitation | |||||||||||
| X | X | X | X | CMAI | ||||||||||
| X | X | X | X | |||||||||||
| FLCI, ASHA FACS (caregiver assessment) | ||||||||||||||
| X | DriveABLE On‐Road Test, MMSE | |||||||||||||
| X | X | X | X | Japanese versions.MMSE, FAST, BEHAVE‐AD. ADL scale not stated | ||||||||||
| X | X | X | EQ‐5D, GHQ‐12 | |||||||||||
| X | Final values only, no change scores | |||||||||||||
| X | X | X | MMSE | |||||||||||
| X | X | Japanese versions; Crichton scale | ||||||||||||
| X | X | X | X | |||||||||||
| X | X | X | CDR sum of boxes | |||||||||||
| X | X | X | X | |||||||||||
| X | X | X | X | FAST; ADL modified for severe dementia | ||||||||||
| X | X | X | X | MMSE; ADL scale not stated | ||||||||||
| X | X | X | X | |||||||||||
| X | X | X | X | FAST | ||||||||||
| X | X | MMSE, ADAS‐Cog | ||||||||||||
| X | X | Change in total brain volume, Agitation | ||||||||||||
| Vascular Dementia or dementia syndrome | ||||||||||||||
| X (PGI scale) | X | Physician's Global Impression, Syndrom Kurztest, SCAG; ADL scale not stated | ||||||||||||
| X | X | GBS, Tapping test, Trace test, SCAG; modified ADL | ||||||||||||
| X | X | X (NOSGER) | X (NOSGER) | CGIC, GBS, MMSE, NOSGER subscales for self‐care ADL and disturbing behaviour | ||||||||||
| X | Global assessment of clinical efficacy, NOSIE‐Index, SCAG | |||||||||||||
| X | X | X (NOSGER) | X (NOSGER) | NOSGER subscales for self‐care ADL and disturbing behaviour | ||||||||||
| X | X (BGP | X | D‐scale, AD subgroup also reported | |||||||||||
For analysis, we transformed the data so that all outcomes were treated as negative (i.e. a higher score indicating a worse result), as is usual in the dementia field. We transformed data for individual scales for some outcomes, but for the outcome, functional performance on ADL ‐ a positive outcome ‐ we converted the positive emphasis into a negative one, analysing the outcome as a 'lack of functional performance on ADL' and reversing the sign of the change scores. For the purposes of analysis, we have described the outcome as a 'decline in ADL'.
For interpretation of this outcome, however, we discuss the clinical effect in terms of the functionality itself, reporting the performance on ADL (so, a mean difference of 1.07 points between memantine and placebo is a clinical benefit).
Dealing with missing data
People with dementia often drop out from studies. The treatment of such missing data is controversial. The options include: (1) ignore participants who drop out and present data only on those who complete the trial and the final assessment ('completers' ‐ closely related to 'observed case' (people who had an observation at the end point) and 'per protocol' analyses); (2) impute a value of 'no change from baseline' for those who were randomised but dropped out; (3) carry forward the last value obtained from whatever time point, as if it were the value for the final time point (last observation carried forward (LOCF)); (4) include people who have dropped out of the trial but have been encouraged to return for scheduled assessments ('retrieved dropouts'); or (5) use mixed methods to take into account the data at several time points.
In dementia, which is characterised by progressive decline, the final (latest) scores for participants who drop out early will, on average, be closer to the baseline values (i.e.less severe) than for those who do not. The use of LOCF in ChEI trials has been criticised because the higher dropout rates on drug meant that it inflated estimates of the drug effect. However, when dropout rates are lower in those taking the active drug than amongst those taking placebo, the LOCF technique yields a more conservative estimate of the size of the effect of the drug than analysis of 'observed cases'. Given that a lower dropout rate on drug probably reflects a beneficial effect of the drug, this is illogical and suggests that preference for the LOCF strategy in such cases reflects either misunderstanding or mere conservatism. The 'retrieved dropout' approach may reflect better the effectiveness of the drug, but large amounts of missing data, especially differential missing data, can still lead to more conservative results. Imputation of 'no change from baseline' is the most conservative analytical strategy. The high rates of dropout in dementia trials due to factors such as caregiver and patient physical ill health mean that the use of any of these strategies reduces the power of studies to show any effect, even if real. If these results are applied in cost‐effectiveness modelling, the benefit of a drug will be underestimated because of underestimated efficacy, and also because the costs incurred by those who do not continue the drug or placebo will be less.
Because of this controversy, peer reviewed publications typically present both OC and LOCF analyses. This is not the case with summary results presented in trial registries, and in the memantine trials, registries usually, but not invariably, present OC data.
In this review, we planned to use OC analyses wherever possible, but in some analyses, we had to pool trials reporting OC and LOCF data. This is made explicit in the footnotes of the relevant forest plots. We assessed the impact of this OC approach in a sensitivity analysis, which compared the results of analyses based on the two main approaches (OC and LOCF). The sensitivity analysis supported our strategy of using OC analyses in the rest of the review. We reported explicitly the degree of missing data in the Characteristics of included studies. Where mixed methods or area‐under‐the curve methods were reported by study authors, we extracted results from these analyses only if OC results were unavailable. For the Howard 2012 (DOMINO‐AD) study, a per protocol analysis was conducted (this excluded participants who received less than 70% of their treatment) and we used this analysis in preference to retrieved dropout, mixed‐methods analysis or imputation methods, as being the closest to OC.
Data synthesis
We used standard Cochrane meta‐analysis methods through RevMan 5.3. Data for the meta‐analyses were the reported raw data for each study. The data required for each trial and each outcome for continuous data were the mean change from baseline, the standard deviation of the mean change, and the number of participants for each treatment group. Where changes from baseline were not reported, we extracted the mean, standard deviation and the number of participants for each treatment group at study end. For the global impression of change outcome, the endpoint itself is of clinical relevance as all participants are by definition at the same baseline score. For some studies, we calculated th standard deviation (same for each group) using the P value for the mean difference (MD); this allowed analysis of the data using the standardised mean difference (SMD).
The summary statistics calculated by meta‐analysis of the continuous outcomes were (i) the MD, with its 95% confidence interval (CI), used when the pooled trials had the same rating scale or test, and (ii) the SMD ‐ the absolute MD divided by the standard deviation ‐ when the trials used different rating scales to assess a particular domain. Where different scales had different directions, we reversed the signs for the mean change from baseline values before conducting meta‐analysis (for example, in the ADAS‐Cog and SIB scales for cognitive impairment, higher values indicate greater and less impairment, respectively ‐ see Appendix 2 ‐ so we reversed the signs for results on the SIB scale).
At the outset, we conducted separate analyses for dementia of different aetiologies (AD; vascular dementia; Parkinson's disease dementia (PDD) or dementia with Lewy bodies (DLB); Frontotemporal dementia (FTD) and AIDS Dementia Complex).
As described in the section Dealing with missing data, we used the OC approach to missing data, wherever possible, but otherwise used what was reported by the study authors.
We initially combined all trials in AD, regardless of trial duration, severity of dementia or the presence of concomitant cholinesterase inhibitor (ChEI), and then examined these factors in pre‐specified subgroup analyses.
Subgroup analysis and investigation of heterogeneity
We assessed heterogeneity using the I² statistic (Higgins 2011) and by inspecting forest plots. An I² of more than 50% suggests that studies within an analysis may not be sufficiently similar for pooling to be valid. In such circumstances, we conducted sensitivity and subgroup analyses to examine the cause of the heterogeneity. We also examined the variability of the point estimates and the overlap of the confidence intervals, when I² values were less than 50%. Where there was evidence of heterogeneity we explored this further. Where heterogeneity could not be explained and an I² exceeded 35%, we used a random‐effects model instead of a fixed‐effect model.
For this update of the review, we explored, in subgroup analyses, the influence of the following characteristics, which were not specified in the original protocol.
-
Trial duration (< six months; six to seven months; > seven months)
-
Severity or stage of AD (mild versus moderate‐to‐severe)
-
Effect of concomitant ChEI
We also conducted meta‐regression using STATA (STATA 2013), considering the factors severity and presence of concomitant ChEIs.
Methods for subgroup analysis: mild versus moderate‐to‐severe disease
Only one study in AD investigated the effects of memantine solely in people with mild dementia, but, of our primary outcomes, only cognitive function at 12 months follow‐up was reported (Holland 2013). Some other studies randomised people with mild‐to‐moderate AD (MMSE 10‐23) but data were also available for separate subgroups of participants, either in the published study report or in a published industry‐produced meta‐analysis (Winblad 2007). The latter reported OC results separately for the subgroup of participants with moderate dementia, giving results for three mild‐to‐moderate AD studies (Bakchine 2008 (99679); Peskind 2004 (MD‐10); Porsteinsson 2008 (MD‐12). Comparison of these results with the full mild‐to‐moderate OC results allowed us to estimate the effect of memantine in mild AD. OC data for the three mild‐to‐moderate trials were kindly provided by Forest Laboratories.
To obtain the sample sizes and mean effects for the mild AD subgroup (MMSE from 20 to 23), we subtracted values for the moderate AD subgroup (MMSE 11 to 19), weighted by sample size, from the measures for all participants (MMSE from 11 to 23) (Schneider 2011b). We calculated standard deviations of the change scores for the mild subgroup using a standard formula for pooling standard deviations (Higgins 2011). We also obtained separate results for the Dysken 2014 study for six‐month data for the mild and moderate subgroups (author communication).
None of these four trials in people with mild‐to‐moderate dementia stratified the participants by severity before randomising and therefore there may be imbalance in the patient characteristics across the intervention groups for a particular subpopulation (i.e. risk of selection bias). We noted this post‐hoc splitting in the 'Risk of bias' assessments.
Sensitivity analysis
We conducted three sensitivity analyses, either to examine assumptions or to investigate risk of bias.
-
We assessed the impact of using an OC approach, by comparing the results of analyses based on the two main approaches (OC and LOCF).
-
We also examined the effect of high risk of bias, by conducting a sensitivity analysis in which we excluded from the analysis studies with high risk of bias for at least one domain.
-
We also examined the effect of using the results from post‐hoc subgroups for moderate severity AD, investigating the removal of such studies from the analysis of memantine versus placebo in moderate‐to‐severe AD.
'Summary of findings' table
We present the main results of the review in 'Summary of findings' tables. These tables present key information concerning the certainty of the evidence and the magnitude of the effects of the interventions examined for the main outcomes (Schünemann 2011a). 'Summary of findings' tables also include an overall grading of the evidence related to each of the main outcomes using the GRADE (Grading of Recommendations Assessment, Development and Evaluation) approach. The GRADE approach defines the certainty (formerly 'quality') of a body of evidence as the extent to which one can be confident that an estimate of effect or association is close to the true quantity of specific interest. The certainty of a body of evidence involves consideration of within‐study risk of bias, directness of evidence, heterogeneity, precision of effect estimates and risk of publication bias (Schünemann 2011b). We present the following outcomes in the 'Summary of findings' tables, with a separate table for each key comparison or population group.
-
Clinical global rating
-
Cognitive function
-
Performance on activities of daily living (ADL)
-
Behaviour and mood
-
Discontinuation (all‐cause)
-
Adverse events and serious adverse events
-
Agitation
'Back transformation' for continuous outcomes
Where an SMD analysis was conducted for continuous outcomes, we presented 'back transformed' effect estimates as the MD with its 95% CI: we transformed the overall standardised effect size to an approximate equivalent score on a particular scale for ease of interpretation (Higgins 2011). This involved multiplying the SMD by the median standard deviation for studies using a particular scale, calculated using the method of Hedges adjusted 'g'. We did this separately for each population and outcome.
In some cases (for example, ADL), the most appropriate scale was positive (i.e. the maximum score represented a better result), which potentially led to interpretation difficulties, so in the summary tables we report the baseline scores and the change from baseline on the original scales, but give the back‐transformed MD as absolute values representing improvement; the summary statistics from the analyses are also given (as negative outcomes, see Measures of treatment effect).
We analysed all continuous outcomes except clinical global rating using change scores, so for the 'Summary of Findings' Tables, we presented the control group value in two ways: firstly, as the median of the control group baseline scores for studies reporting that scale; and, secondly, as the median change from baseline for the control group.
For dichotomous outcomes, we calculated the absolute risk difference (RD) for the appropriate population using the median control group risk for those studies and the risk ratio (RR) for the analysis. For some outcomes (e.g. adverse events), we calculated the RR across studies in all populations because there were no differences between types or severities of dementia; this maximised the precision.
Assessing imprecision
Most of the efficacy outcomes are continuous variables, often reported on different scales. Effect estimates are generally small, but in the dementia field even a small improvement is considered important. Therefore, when assessing imprecision, we used a 'default' value of 400 participants as the optimal information size (OIS) (Guyatt 2011). If the evidence was based on fewer than 400 participants, we considered downgrading for imprecision. If there were more than 400 participants, we downgraded only if the 95% CI crossed the null (zero for MD or SMD) and if the CI included what might be an important benefit or harm or both. This decision was made by agreement between two review authors.
For assessing imprecision for dichotomous outcomes, we took into account the number of participants, the number of events, whether the CI crossed a risk ratio of 0.75 or 1.25 (GRADE 'default' values) and the CI around the absolute RD (Guyatt 2011).
Results
Description of studies
Studies are described in detail in Characteristics of included studies; Characteristics of excluded studies. In the former table, we report one four‐arm study four times: as two comparisons of memantine versus placebo (with or without vitamin E in both arms), and as post‐hoc subgroups for moderate and mild Alzheimer's disease (AD) for each of these comparisons (Dysken 2014). Four other studies reported results for severity subgroups and for these studies we have also extracted data and assessed risk of bias separately for the subgroups (Bakchine 2008 (99679); Peskind 2004 (MD‐10); Porsteinsson 2008 (MD‐12); Winblad 1999 (9403)). Summary details of the participants at baseline are given in Table 2 for the AD studies. Only three studies had fewer than 50% females ((Dysken 2014 ‐ 3%; Holland 2013 ‐ 35%; Ashford 2011 (95722) ‐ 38%). Most studies had a mean age between 70 and 80 years, exceptions were older participants in the Forest 2006 (MD‐22) study (mean 85 years) and the Fox 2012 (MAGD) study (mean 84 years) and younger participants in the Wang 2013 study (mean 65 years).
| Study | Number randomised | Diagnosis | Severity of disease | Mean age | Mean MMSE | % female | duration (weeks) |
| MODERATE‐TO‐SEVERE AD | |||||||
| 432 | AD | moderately severe‐to‐severe | not stated | ˜9.9 | not stated | 24 | |
| 165 | AD Nursing home | moderate‐to‐severe | 85.3 | ˜11.3 | 85 | 24 | |
| 34 | AD agitation | moderate‐to‐severe | 79.6 | 3‐18 | 80 | 12 | |
| 153 | AD agitation | moderate‐to‐severe MMSE < 20 | 84.1 | 7.5 | 72 | 12 | |
| 369 | AD agitation | moderate‐to‐severe | ˜74.9 | 11.9 | ˜58.3 | 24 | |
| 677 | AD | moderate‐to‐severe | 76.5 | 10.8 | 72 | 24 | |
| 265 | AD | moderate | ˜74.9 | 10‐19 | 58 | 12 | |
| 207 | AD | moderate‐to‐severe MMSE 5‐14 | 73.4 | ˜10.3 | 72 | 24 | |
| 295 | AD | moderate‐to‐severe (52% severe 5 to 9) | 77.1 | 9.1 | 65 | 52 | |
| 15 | AD | moderate‐to‐severe | 76.5 | ˜14.5 | 87 | 26 | |
| 250 | AD | MMSE 5‐18 | 72.3 | 11.8 | 60 | 16 | |
| 546 | AD | moderate‐to‐severe | ˜78.5 | ˜10.8 | ˜72.8 | 24 | |
| 252 | AD | moderately severe‐to‐severe | 76.1 | 7.9 | 67 | 28 | |
| 404 | AD | moderate‐to‐severe | 75.5 | 9.9 | 64.8 | 24 | |
| 350 | AD | moderate‐to‐severe | 78.2 | ˜10.1 | 71.4 | 24 | |
| 79 | AD | severe | ˜74.2 | 6.7 | ˜67 | 12 | |
| MILD‐TO‐MODERATE AD | |||||||
| 367 | AD | mild‐to‐moderate MMSE 10‐23 | not stated | 10‐23 | not stated | 24 | |
| 13 | AD | mild‐ to‐moderate | 76 | ˜21 | 38 | 52 | |
| 470 | AD | mild‐to‐moderate 11‐23 | 74 | ˜18.7 | 65 | 26 | |
| 307 and 306 (vit E) | AD | mild‐to‐moderate | ˜79.1 | 20.8 | ˜3 | 5 years | |
| 26 | AD | mild | 79.3 | ˜27.9 | 35 | 52 | |
| 226 | AD | mild‐to‐moderate | ˜72.4 | ˜22.2 | ˜63.7 | 52 | |
| 403 | AD | mild‐to‐moderate | 77.5 | 17.1 | 58.8 | 24 | |
| 432 | AD | mild‐to‐moderate | ˜75.5 | ˜16.8 | ˜52 | 24 | |
| 37 | AD | mild‐to‐moderate | 76.2 | 19.0 | 64 | 52 | |
| 22 | AD | mild‐to‐moderate | ˜65 | ˜12.1 | 64 | 22 | |
| 277 | AD | moderate | 74 | 16.8 | 57 | 52 | |
Results of the search
The searches generated a total of 3262 results. After de‐duplication and first assessment based on title and abstract screening, we obtained 264 in full text (Figure 1). We excluded 113 studies (see Characteristics of excluded studies). We added 32 new randomised controlled trials (RCTs) to the 12 studies in the previous 2006 update. Overall, these 44 studies were described in 148 reports. We are also aware of three ongoing studies (see Characteristics of ongoing studies).

Study flow diagram of studies identified
Included studies
Forty‐four studies fulfilled the inclusion criteria, comprising 9811 participants (Aarsland 2009; Asada 2011 (MA3301); Asada 2011a (IE3501); Ashford 2011 (95722); Bakchine 2008 (99679); Boxer 2013; Ditzler 1991; Dysken 2014; Emre 2010 (11018); Forest 2006 (MD‐22); Forest 2006 (MD‐23); Fox 2012 (MAGD); Herrmann 2012 (10158); Gortelmeyer 1992; Grossberg 2008 (MD‐50); Hofbauer 2009 (MD‐71); Holland 2013; Homma 2007 (IE2101); Howard 2012 (DOMINO‐AD); Leroi 2009; Lorenzi 2011 (SC05‐03); Lundbeck 2006 (10116); Lundbeck 2006 (99817); Marsh 2009 PDD; Medina 2011; Merz 2003 (MRZ‐9104); Merz 2003 (MRZ‐9105); Merz 2003 (MRZ‐9206); Nakamura 2016; Orgogozo 2002 (9408); Pantev 1993; Peskind 2004 (MD‐10); Peters 2015 (MEGACOMBI2); Porsteinsson 2008 (MD‐12); Reisberg 2003 (9605); Schifitto 2007; Schmidt 2008; Tariot 2004 (MD‐02); van Dyck 2007 (MD‐01); Vercelletto 2011; Wang 2013; Wilcock 2002 (9202); Wilkinson 2012 (10112); Winblad 1999 (9403)). The mean sample size was 223 and the median and range were 182.5 (13 to 677); 20 studies had more than 200 participants. Seven studies were reported solely as registry data or via author communication (Asada 2011 (MA3301); Forest 2006 (MD‐22); Forest 2006 (MD‐23); Lundbeck 2006 (99817); Marsh 2009 PDD; Merz 2003 (MRZ‐9105); Merz 2003 (MRZ‐9206)); and we obtained responses to requests for further information from the authors (or companies) of 16 studies (Asada 2011a (IE3501); Asada 2011 (MA3301); Bakchine 2008 (99679); Herrmann 2012 (10158); Grossberg 2008 (MD‐50); Homma 2007 (IE2101); Howard 2012 (DOMINO‐AD); Lundbeck 2006 (10116); Lundbeck 2006 (99817); Merz 2003 (MRZ‐9104); Merz 2003 (MRZ‐9105); Merz 2003 (MRZ‐9206); Peskind 2004 (MD‐10); Porsteinsson 2008 (MD‐12); Schmidt 2008; Wilkinson 2012 (10112)).
We have not been able to identify the results or any associated publications or announcements belonging to four studies: Lundbeck 2006 (99817) was a 12‐week study in Taiwan of 47 people with AD; Merz 2003 (MRZ‐9105) was a 12‐week study in Portugal of 27 people with 'primary dementia'; Merz 2003 (MRZ‐9104) was a 13‐week study in France of 56 people with AD; and Merz 2003 (MRZ‐9206) was a 14‐week study in Sweden of 56 people with vascular dementia.
Trial duration varied from six weeks to 2.27 years (mean), with the majority of studies having a duration of six months. Fourteen studies had a duration of less than six months (Ditzler 1991; Forest 2006 (MD‐23); Fox 2012 (MAGD); Gortelmeyer 1992; Hofbauer 2009 (MD‐71); Leroi 2009; Lundbeck 2006 (10116); Lundbeck 2006 (99817); Merz 2003 (MRZ‐9104); Merz 2003 (MRZ‐9105); Merz 2003 (MRZ‐9206); Pantev 1993; Schifitto 2007; Winblad 1999 (9403)). Eight studies reported results at 12 months or longer (Ashford 2011 (95722); Dysken 2014; Holland 2013; Howard 2012 (DOMINO‐AD); Peters 2015 (MEGACOMBI2); Schmidt 2008; Vercelletto 2011; Wilkinson 2012 (10112)), and of these, one provided interim results at 30 weeks (Howard 2012 (DOMINO‐AD)); and three at six months (Dysken 2014; Peters 2015 (MEGACOMBI2); Schmidt 2008).
Fifteen trials were conducted in North America: including 14 in the USA (Ashford 2011 (95722); Boxer 2013; Dysken 2014; Forest 2006 (MD‐22); Forest 2006 (MD‐23), Holland 2013; Marsh 2009 PDD; Medina 2011; Peskind 2004 (MD‐10); Porsteinsson 2008 (MD‐12); Reisberg 2003 (9605); Schifitto 2007; Tariot 2004 (MD‐02); van Dyck 2007 (MD‐01)), and one in Canada (Herrmann 2012 (10158)). Twenty trials were conducted in Europe, including four in the UK (Fox 2012 (MAGD); Howard 2012 (DOMINO‐AD); Leroi 2009; Wilcock 2002 (9202)); four in Germany (Ditzler 1991; Gortelmeyer 1992; Pantev 1993; Peters 2015 (MEGACOMBI2)); two in France (Merz 2003 (MRZ‐9104); Vercelletto 2011); one each in Austria (Schmidt 2008); Italy (Lorenzi 2011 (SC05‐03)); Latvia (Winblad 1999 (9403)); Portugal (Merz 2003 (MRZ‐9105)); Sweden (Merz 2003 (MRZ‐9206)); and five in more than one European country (Aarsland 2009; Bakchine 2008 (99679); Emre 2010 (11018); Orgogozo 2002 (9408); Wilkinson 2012 (10112)). Four trials were conducted in Japan (Asada 2011 (MA3301); Asada 2011a (IE3501); Homma 2007 (IE2101); Nakamura 2016); two in China (Lundbeck 2006 (10116); Wang 2013); and one in Taiwan (Lundbeck 2006 (99817)). The other two studies were international trials (Grossberg 2008 (MD‐50); Hofbauer 2009 (MD‐71)).
Funding
All studies had some funding from industry, with one exception (Schifitto 2007), although in three trials the only input was the provision of drugs and the main sponsors were the UK Medical Research Council; the US Veterans Affairs Co‐operative Studies Program and the Bundesministerium fűr Bildung und Forschung (respectively, Howard 2012 (DOMINO‐AD)Dysken 2014 and Peters 2015 (MEGACOMBI2)).
Eleven trials were sponsored by Merz Pharmaceuticals GmbH, Germany (Ditzler 1991; Gortelmeyer 1992; Merz 2003 (MRZ‐9104); Merz 2003 (MRZ‐9105); Merz 2003 (MRZ‐9206); Orgogozo 2002 (9408); Pantev 1993; Reisberg 2003 (9605); Schmidt 2008; Wilcock 2002 (9202); Winblad 1999 (9403). Fourteen trials were sponsored by Forest Laboratories Inc, US (Ashford 2011 (95722); Boxer 2013; Forest 2006 (MD‐22); Forest 2006 (MD‐23); Grossberg 2008 (MD‐50); Hofbauer 2009 (MD‐71); Holland 2013; Marsh 2009 PDD; Medina 2011; Peskind 2004 (MD‐10); Porsteinsson 2008 (MD‐12); Tariot 2004 (MD‐02); van Dyck 2007 (MD‐01)); and this company also provided drugs for one trial (Dysken 2014).
Twelve trials were sponsored by H. Lundbeck A/S, Denmark (Aarsland 2009; Bakchine 2008 (99679); Emre 2010 (11018); Fox 2012 (MAGD); Herrmann 2012 (10158); Leroi 2009; Lorenzi 2011 (SC05‐03); Lundbeck 2006 (10116); Lundbeck 2006 (99817); Vercelletto 2011; Wang 2013); and this company also provided drugs for one trial (Howard 2012 (DOMINO‐AD)). One trial was sponsored by both Merz and Lundbeck (Wilkinson 2012 (10112)).
Four trials were sponsored by Daiichi Sankyo Co. Ltd, Japan (Asada 2011 (MA3301); Asada 2011a (IE3501); Homma 2007 (IE2101); Nakamura 2016).
Patient characteristics
Diagnosis
The diagnosis of dementia was established using the latest versions of the Diagnostic and Statistical Manual of Mental Disorders (DSM III‐R; DSM IV) in 17 studies (Aarsland 2009; Asada 2011a (IE3501); Ashford 2011 (95722); Bakchine 2008 (99679); Emre 2010 (11018); Gortelmeyer 1992; Grossberg 2008 (MD‐50); Homma 2007 (IE2101); Leroi 2009; Marsh 2009 PDD; Orgogozo 2002 (9408); Pantev 1993; Reisberg 2003 (9605); Schmidt 2008; Wang 2013; Wilcock 2002 (9202); Winblad 1999 (9403)). Eleven other studies included people diagnosed with probable AD (McKhann 1984), according to the criteria of the National Institute of Neurologic, Communicative Disorders and Stroke and Alzheimer's Disease and Related Disorders Association (NINCDS‐ADRDA) (Asada 2011 (MA3301); Fox 2012 (MAGD); Herrmann 2012 (10158); Lorenzi 2011 (SC05‐03); Nakamura 2016; Peskind 2004 (MD‐10); Peters 2015 (MEGACOMBI2); Porsteinsson 2008 (MD‐12); Tariot 2004 (MD‐02); van Dyck 2007 (MD‐01); Wilkinson 2012 (10112)); and two studies included people diagnosed with probable or possible AD according to the same criteria (Dysken 2014; Howard 2012 (DOMINO‐AD)). The other studies did not report diagnosis by these criteria.
Type and severity of dementia
Almost all the studies measured severity of dementia as defined by scores on the Mini Mental State Examination (MMSE) (Folstein 1975). Three exceptions used the Sandoz Clinical Assessment Geriatric Scale (SCAG) (Ditzler 1991; Gortelmeyer 1992; Pantev 1993).
Twenty‐eight studies were in people with AD (Asada 2011 (MA3301); Asada 2011a (IE3501); Ashford 2011 (95722); Bakchine 2008 (99679); Dysken 2014; Forest 2006 (MD‐22); Forest 2006 (MD‐23); Fox 2012 (MAGD); Herrmann 2012 (10158); Grossberg 2008 (MD‐50); Hofbauer 2009 (MD‐71); Holland 2013; Homma 2007 (IE2101); Howard 2012 (DOMINO‐AD); Lorenzi 2011 (SC05‐03); Lundbeck 2006 (10116); Lundbeck 2006 (99817); Merz 2003 (MRZ‐9104); Nakamura 2016; Peskind 2004 (MD‐10); Peters 2015 (MEGACOMBI2); Porsteinsson 2008 (MD‐12); Reisberg 2003 (9605); Schmidt 2008; Tariot 2004 (MD‐02); van Dyck 2007 (MD‐01); Wang 2013; Wilkinson 2012 (10112)). We also included a subpopulation from a further study (Winblad 1999 (9403) AD), which reported an AD subgroup from the study Winblad 1999 (9403). These studies randomised a total of 7885 participants with AD.
Of these AD studies, one was in people with mild AD (Holland 2013); nine were in people with mild‐to‐moderate AD (Asada 2011 (MA3301); Ashford 2011 (95722); Bakchine 2008 (99679); Dysken 2014; Lundbeck 2006 (99817); Peskind 2004 (MD‐10); Peters 2015 (MEGACOMBI2); Porsteinsson 2008 (MD‐12); Schmidt 2008); two were in people with moderate AD (Hofbauer 2009 (MD‐71); Wilkinson 2012 (10112)); 15 were in people with moderate‐to‐severe AD (Asada 2011a (IE3501); Forest 2006 (MD‐22); Forest 2006 (MD‐23); Fox 2012 (MAGD); Herrmann 2012 (10158); Grossberg 2008 (MD‐50); Homma 2007 (IE2101); Howard 2012 (DOMINO‐AD); Lorenzi 2011 (SC05‐03); Lundbeck 2006 (10116); Nakamura 2016; Reisberg 2003 (9605); Tariot 2004 (MD‐02); van Dyck 2007 (MD‐01); Wang 2013); and we were unable to establish the severity in one study (Merz 2003 (MRZ‐9104)). Three of these studies reporting mean MMSE scores at baseline had a mean score of less than 10, suggesting that at least 50% of participants had severe AD (Fox 2012 (MAGD); Howard 2012 (DOMINO‐AD); Reisberg 2003 (9605)); the Winblad 1999 (9403) AD subgroup was selected to have a MMSE score below 10. One of the mild‐to‐moderate AD studies had a mean MMSE score of 22, so most people had mild dementia (Peters 2015 (MEGACOMBI2)).
Three studies involved people with vascular dementia, defined by the NINDS‐AIREN criteria (Merz 2003 (MRZ‐9206); Orgogozo 2002 (9408); Wilcock 2002 (9202)); 956 participants were randomised. One of these studies was in people with 'moderately severe' dementia (but reported no results) (Merz 2003 (MRZ‐9206)) and the other two studies recruited people with mild‐to‐moderate dementia.
Three short, phase II trials of four to six weeks in 213 participants included both AD and vascular dementia in various proportions (Ditzler 1991; Gortelmeyer 1992; Winblad 1999 (9403)); the Hachinski score was used to differentiate between AD and vascular dementia. Two further studies included both AD and vascular dementia, but there is no record of an attempt to distinguish the different types of dementia (Merz 2003 (MRZ‐9105); Pantev 1993). Two studies included people with mild‐to‐moderate dementia (Ditzler 1991; Gortelmeyer 1992); participants in one study had severe dementia (Winblad 1999 (9403)); participants in one study were equally divided between mild, moderate and severe disease (Pantev 1993); and one study reported "mild to‐moderate severe stages of primary dementia" (Merz 2003 (MRZ‐9105)).
The remaining studies included participants with other types of dementia: four studies in 319 participants with Parkinson's disease dementia (PDD) or dementia with Lewy bodies (DLB) (Aarsland 2009; Emre 2010 (11018), Leroi 2009; Marsh 2009 PDD); two studies in 133 participants with frontotemporal dementia (FTD) (Boxer 2013; Vercelletto 2011); one study in 140 participants with HIV AIDS dementia complex (Schifitto 2007); and one study in 50 participants with Huntingdon's Disease (this study, however, presented no useable data) (Medina 2011).
Three studies stated they selectively included patients with agitation (Forest 2006 (MD‐23); Fox 2012 (MAGD); Herrmann 2012 (10158)); 556 participants were randomised. One of these studies investigated treatment for those with agitation living in the community (Forest 2006 (MD‐23)); this study was terminated after recruiting only 34 participants, but reported these results. A second study recruited participants living in the community, who were specifically selected for the presence of agitation and aggression at baseline (Herrmann 2012 (10158)); the trial was prematurely terminated because of difficulty in recruitment (only recruiting 82% of the planned participants), but reported results. The third study of institutionalised patients with agitation specified a primary outcome of Cohen‐Mansfield Agitation Index (CMAI) score at six weeks (Fox 2012 (MAGD)).
Interventions assessed
The majority of studies randomised participants to memantine at its licensed dose of 20 mg daily (or placebo). One study used an extended release preparation of 28 mg/day, equivalent to 20 mg daily (Grossberg 2008 (MD‐50)). Two studies investigated a dose of 10 mg/day memantine versus placebo (Ashford 2011 (95722); Winblad 1999 (9403)); and two other studies included a 10 mg/day arm, alongside 20 mg/day and placebo (Asada 2011 (MA3301); Homma 2007 (IE2101)).
Seven studies compared the efficacy and safety of memantine (versus placebo) in people who were already receiving stable treatment with donepezil (Dysken 2014; Herrmann 2012 (10158); Grossberg 2008 (MD‐50); Lorenzi 2011 (SC05‐03); Nakamura 2016; Porsteinsson 2008 (MD‐12);Tariot 2004 (MD‐02)). Five other studies included some participants who were already on cholinesterase inhibitors (ChEIs): 72% (Wilkinson 2012 (10112)); 50% (Marsh 2009 PDD); 86% for memantine and 67% for placebo (Ashford 2011 (95722)); 19% and 23% (Fox 2012 (MAGD)); and 18% and 14% (Leroi 2009). Two other studies allowed the continuation of stable ChEIs, but did not state the proportions involved (Hofbauer 2009 (MD‐71); Holland 2013). One study was in people who were anti‐dementia drug naive at baseline and were randomised to memantine plus galantamine (a ChEI) versus placebo plus galantamine (Peters 2015 (MEGACOMBI2)).
One study actively discontinued ChEIs before starting memantine or placebo (Bakchine 2008 (99679); another had participants who had ChEIs discontinued because of a lack of efficacy (Schmidt 2008). One four‐arm study included 295 participants who were on stable ChEIs, but were being considered for a change of drug treatment; the participants were randomised to discontinue or continue donepezil, as well as randomising to memantine or placebo (Howard 2012 (DOMINO‐AD)). One study did not permit ChEIs within 30 days of the trial, although 55% had prior use of donepezil (Peskind 2004 (MD‐10)). Another study reported previous use of drugs for dementia by the participants, but without specifying types (Winblad 1999 (9403)).
One four‐arm study randomised 613 participants to concurrent vitamin E or placebo, as well as randomising to memantine or placebo (Dysken 2014).
Outcome measures
The range of outcome measures used in the studies is summarised in Table 1.
Adverse events (AEs) were reported in various ways: the number of people with any AE (at least one per person); the number with at least one serious AE (SAE) and results were also given separately for the number of people with specific AEs (agitation, insomnia, confusion (as an AE), depression, headache, hypertension, dizziness, fall, accidental injury, urinary incontinence, diarrhoea and influenza‐like symptoms). For these specific AEs, registry data were commonly presented separately for AEs and SAEs, but it was unclear whether there was overlap between the set of participants with a specific outcome recorded as an AE and the set of participants with that outcome recorded as an SAE. Therefore, we used results for the AE set only unless the outcome was solely reported as SAEs.
Adverse events across all diagnoses and durations are reported in Effects of interventions, section 5 and also separately for each diagnosis. These analyses were restricted to the 20 mg/day or equivalent dose of memantine.
Excluded studies
We excluded 115 studies (Figure 1) at the full‐text stage. Details are given in the Characteristics of excluded studies table, but the main reasons for exclusion were: 15 were not RCTs; 18 were not double‐blinded; the population in 16 studies did not have dementia (or not solely dementia participants); 16 studies were not placebo controlled; 24 were post‐hoc analyses or had inappropriate ways of combining data; and eight studies compared memantine with other interventions. We obtained the full papers for 11 systematic reviews in order to check the references, but there was no new information found (systematic reviews that did provide additional information were added as references to the included studies).
Risk of bias in included studies
A detailed analysis of the risks of bias for each study can be found in Characteristics of included studies. 'Risk of bias' domain ratings are shown per study in Figure 2 and percentage contributions for each domain are shown in Figure 3.
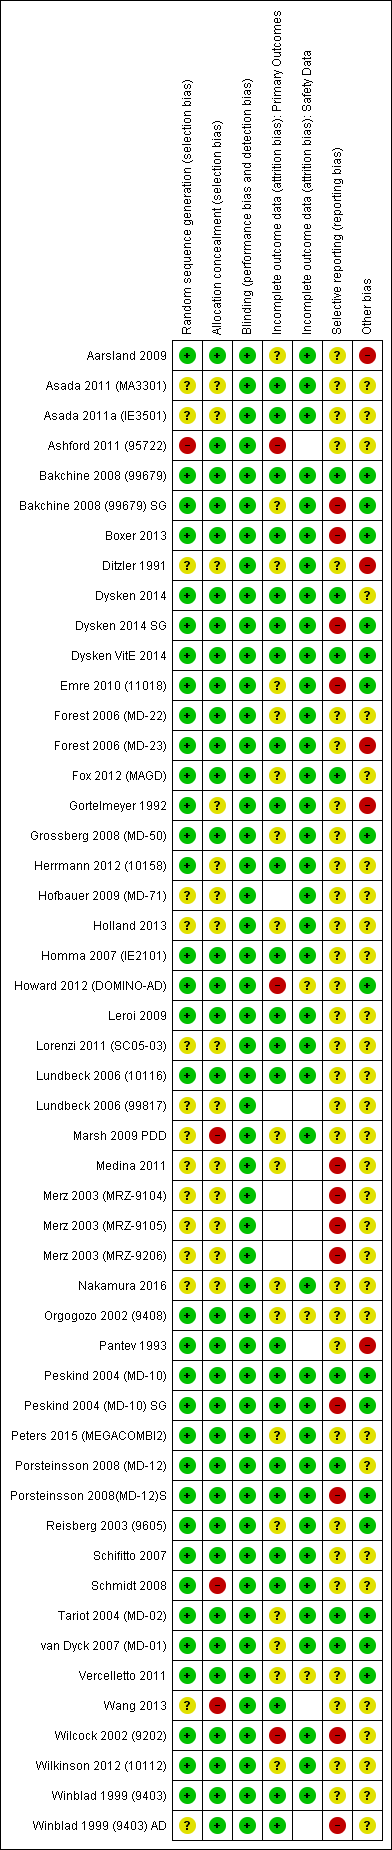
'Risk of bias' summary: review authors' judgements about each risk of bias item for each included study.
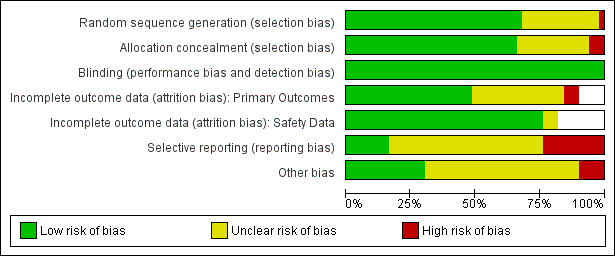
'Risk of bia's graph: review authors' judgements about each risk of bias item presented as percentages across all included studies.
Allocation
We assessed four studies to be at high risk of selection bias because of large differences in outcome at baseline that were as large or larger than the effect size for most outcomes (Aarsland 2009; Ashford 2011 (95722); Marsh 2009 PDD; Wang 2013); e.g. in one study (Wang 2013), 15.3 points baseline difference in Severe Impairment Battery (SIB), four points for MMSE, three points for Neuropsychiatric Inventory (NPI). The Aarsland 2009 study had baseline differences despite adequate methods of sequence generation and allocation concealment, and this is recorded as 'other' risk of bias. We considered one study to be at high risk of bias because of differences in the levels of concurrent neuroleptic medications: 33% in the placebo group and 28% in the memantine group, and because of a 10‐point difference in activities of daily living (ADL) at baseline (Schmidt 2008).
Other studies reporting differences at baseline for particular outcomes that are comparable with the effect estimate are considered in the results sections for those outcomes.
Blinding
All studies were double blinded ‐ this was an inclusion criterion ‐ and all were at low risk of bias for this domain.
Incomplete outcome data
We considered three studies to have a high risk of attrition bias for the efficacy outcomes of the review: one very small study had missing data of 43% (memantine) and 0% (placebo) (Ashford 2011 (95722)); a second study reported a per protocol analysis at 30 weeks for which excluded data were: 45% (memantine), 60% (placebo); 30% (memantine + donepezil) and 32% (placebo + donepezil); sensitivity analyses comparing the per protocol analysis with a 'completed follow‐up' analysis showed some differences in effect estimate (Howard 2012 (DOMINO‐AD)). The third study also reported a per protocol analysis for which excluded data were 35% (memantine) and 43% (placebo) (Wilcock 2002 (9202)).
Selective reporting
We considered four studies to be at high risk of bias for selective reporting of outcomes: one study decided post hoc to reduce the Clinical Global Impression of Change (CGIC) values to three categories (Boxer 2013); the second did not report the numbers of participants for the observed case (OC) analysis and we had to make assumptions (Emre 2010 (11018)); and the third reported missing scores for some participants that were not explained ( Nurse's Observational Scale for Geriatric Patients (NOSGER) outcomes) (Wilcock 2002 (9202)). Where other studies did not report outcomes or did not provide sufficient data to analyse, we included these studies in the appropriate forest plots and estimated their contribution to the whole meta‐analysis, as described in the Assessment of risk of bias in included studies section.
We also assessed the five studies that reported post‐hoc subgroups to be at high risk of outcome reporting bias for those subpopulations (Bakchine 2008 (99679) SG; Dysken 2014 SG; Peskind 2004 (MD‐10) SG; Porsteinsson 2008(MD‐12)S; Winblad 1999 (9403) AD).
Other potential sources of bias
We recorded three other studies as having high risk of bias because they had an outdated diagnosis of AD (Ditzler 1991; Gortelmeyer 1992; Pantev 1993). We considered one study to be at high risk of bias because the trial was terminated early without explanation given (Forest 2006 (MD‐23)).
Overall risk of bias
The overall risk of bias for most studies was either unclear or low (Figure 2). We considered three studies to have low risk of bias for all domains (Bakchine 2008 (99679); Dysken VitE 2014; Peskind 2004 (MD‐10)).
We assessed two studies to be at high risk of bias for at least two domains (Ashford 2011 (95722); Wilcock 2002 (9202) for NOSGER outcomes), and 11 other studies to be at high risk of bias for one domain (Aarsland 2009; Boxer 2013; Ditzler 1991; Emre 2010 (11018); Forest 2006 (MD‐23); Gortelmeyer 1992; Howard 2012 (DOMINO‐AD); Marsh 2009 PDD; Pantev 1993; Schmidt 2008; Wang 2013). We considered post‐hoc subgroups of five studies to be at high risk of bias for one domain (Bakchine 2008 (99679) SG; Dysken 2014 SG; Peskind 2004 (MD‐10) SG; Porsteinsson 2008(MD‐12)S; Winblad 1999 (9403) AD).
Effects of interventions
See: Summary of findings for the main comparison Moderate‐to‐severe AD, six to seven months; Summary of findings 2 Vascular dementia ‐ mild‐to‐moderate severity. six months
We present the efficacy results according to the aetiology of the dementia in sections 1 to 3 below. We compare effects across different types of dementia in section 4. We describe safety data, including discontinuation (all‐cause and that due to adverse events) and adverse events outcomes in section 5 for all aetiologies of dementia, represented on the same forest plots, with analyses featuring separate subgroups.
We conducted the main analyses as observed case (OC), for the reasons discussed in the Dealing with missing data section, and also tested the OC approach in sensitivity analyses in comparison with the last observation carried forward (LOCF) approach (Appendix 3).
We produce a 'Summary of findings' table for most sections (summary of findings Table for the main comparison; summary of findings Table 2; Table 3; Table 4; Table 5; Table 6; Table 7; Table 8). We generally analysed the efficacy outcomes as standardised mean difference (SMD), but back‐transformed to a common scale. Similarly, for dichotomous (safety) outcomes, we calculated the absolute risk difference (RD) for the relevant population. In doing so, we reported safety outcomes either for all trials of memantine (across all aetiologies) or for separate sub‐populations, depending on the safety outcome concerned.
| Memantine 20 mg or equivalent compared to placebo, with concomitant ChEI, for moderate‐to‐severe AD. 24‐30 week data. OC | ||||||
| Population: Alzheimer's disease, moderate‐to‐severe | ||||||
| Continuous outcomes | Score with placebo (median) | Mean improvement in change score between memantine and placebo | SMD (95% CI) meta‐analysis findings | № of participants | Certainty of the evidence | Comments |
| Clinical Global (CIBIC+) | The median CIBIC+ score was 4.5 3 (i.e. deterioration with time) | MD: 0.21 (0.06 to 0.36) | ‐0.21 (‐0.32 to ‐0.09) | 1125 | ⊕⊕⊕⊝ | Analysed as mean difference. Random effects (Analysis 2.8) [SMD as a negative outcome (Analysis 2.1)] |
| Cognitive Function (SIB) | Mean SIB score at baseline: 77.6. Mean change from baseline (positive scale): ‐1.2 4 (i.e. slight deterioration with time) | MD: 2.48 (1.45 to 3.41) | ‐0.24 (‐0.33 to ‐0.14) | 1852 | ⊕⊕⊕⊕ | SMD as a negative outcome Converted to SIB scale (and scale direction inverted); median SD(pooled) = 10.34. |
| Performance on ADL: (ADCS‐ADL19) | Mean ADCS‐ADL19 score at baseline: 34.3. Mean change from baseline (positive scale): ‐2.2 5 (i.e. deterioration over time) | MD: 0.95 (0.22 to 1.76) | ‐0.13 (‐0.24 to ‐0.03) | 1319 | ⊕⊕⊕⊕ | SMD for decline in ADL as a negative outcome (Analysis 2.3) Converted to ADCS‐ADL19 scale (and scale direction inverted); median SD(pooled) = 7.33. |
| Behaviour and Mood (NPI) 144‐point scale | Median baseline NPI score was 16.5. Median change from baseline (negative scale): 2.80 6 (i.e. deterioration with time) | MD: 2.20 (1.10 to 3.29) | ‐0.18 (‐0.27 to ‐0.09) | 1855 | ⊕⊕⊕⊕ | SMD as a negative outcome (Analysis 2.4) Converted to NPI scale; median SD(pooled) = 12.20 |
| Binary outcomes | Anticipated absolute effects | Relative effect | № of participants | Certainty of the evidence | Comments | |
| Risk with placebo (median) | Risk with memantine | |||||
| All‐cause discontinuation | 168 per 1000 | 156 per 1000 | RR 0.93 | 5087 | ⊕⊕⊕⊕ | RR for all moderate‐to‐severe AD studies (apart from those with agitation) (Analysis 16.5). Median control group risk for 6 studies in 2089 people with moderate‐to‐severe AD without agitation, receiving ChEIs (Analysis 2.9) |
| Difference: 12 fewer people per 1000 discontinued treatment for any cause (95% CI 29 fewer to 7 more) | ||||||
| Number suffering at least one adverse event | 639 per 1000 | 658 per 1000 | RR 1.03 | 8033 5371 events | ⊕⊕⊕⊕ | RR from all studies (Analysis 9.3). Median control group risk for moderate‐to‐severe AD studies in people receiving ChEIs (Analysis 2.11) |
| Difference: 19 more people per 1000 suffered adverse events | ||||||
| Number suffering at least one serious adverse event | 114 per 1000 | 104 per 1000 (93 to 116) | RR 0.91 | 6482 (19 RCTs) 918 events | ⊕⊕⊕⊕ | RR and median control risk from all AD studies (except those with agitation) (from Analysis 8.10) |
| Difference: 10 fewer people per 1000 suffered serious adverse events (95% CI 21 fewer to 2 more) | ||||||
| Number suffering agitation as an adverse event | 45 per 1000 | 41 per 1000 | RR 0.92 | 1225 3 79 events | ⊕⊕⊝⊝ | RR and median control group risk for studies in people with moderate‐to‐severe AD without agitation, receiving ChEIs (Analysis 2.13) |
| Difference: 4 fewer people per 1000 suffered agitation as an adverse event | ||||||
| *The risk in the intervention group (and its 95% confidence interval) is based on the assumed risk in the comparison group and the relative effect of the intervention (and its 95% CI). We adopt the convention that a negative mean difference always means an improvement (i.e. favouring memantine) | ||||||
| GRADE Working Group grades of evidence | ||||||
1 Some inconsistency or variation in the point estimates (downgraded once for inconsistency)
2 79 events; imprecision around relative effect (CI crossing 1.25 and 0.75)(downgraded twice)
3 Median control group values for 3 studies reporting CIBIC+ (Grossberg 2008 (MD‐50); Porsteinsson 2008(MD‐12)S; Tariot 2004 (MD‐02))
4 Mean control group baseline scores and mean control group change from baseline for 2 studies reporting SIB (Grossberg 2008 (MD‐50); Tariot 2004 (MD‐02))
5 Mean control group baseline scores and mean control group change from baseline for the 2 studies reporting ADCS‐ADL19 (Grossberg 2008 (MD‐50); Tariot 2004 (MD‐02))
6 Median control group baseline scores and median control group change from baseline for the 5 studies reporting NPI (Dysken 2014 SG; Grossberg 2008 (MD‐50); Howard 2012 (DOMINO‐AD); Porsteinsson 2008(MD‐12)S; Tariot 2004 (MD‐02))
| Memantine 20 mg or equivalent compared to placebo, monotherapy, for moderate‐to‐severe AD. 24‐to 30‐week data observed case (OC) | ||||||
| Population: Alzheimer's disease, moderate‐to‐severe | ||||||
| Outcomes | Score with placebo (median) | Mean improvement in change score between memantine and placebo | SMD (95% CI) meta‐analysis findings | № of participants | Certainty of the evidence | Comments |
| Clinical Global 7‐point Likert scale | The median CIBIC+ score was 4.64 3 (i.e. deterioration with time) | MD: 0.22 (0.11 to 0.33) | ‐0.20 (‐0.30 to ‐0.10) | 1672 | ⊕⊕⊕⊕ | SMD as a negative outcome (Analysis 2.1). Converted to CIBIC+ scale; median SD(pooled) = 1.09. |
| Cognitive Function 100‐point scale | Median SIB score at baseline: 68.3. Median change from baseline (positive scale): ‐5.6 4 (i.e. deterioration with time) | MD: 3.97 (2.77 to | ‐0.33 (‐0.43 to ‐0.23) | 1485 | ⊕⊕⊕⊕ | SMD as a negative outcome (Analysis 2.2) Converted to SIB scale (and scale direction inverted); median SD(pooled) = 12.04. |
| Performance on ADL | Mean ADCS‐ADL19 score at baseline: 30.5. Mean change from baseline (positive scale): ‐4.15 (i.e. deterioration with time) | MD: 1.33 (0.20 to 2.00) | ‐0.20 (‐0.30 to ‐0.09) | 1368 | ⊕⊕⊕⊕ | SMD for decline in ADL as a negative outcome (Analysis 2.3) Converted to ADCS‐ADL19 scale (and scale direction inverted); median SD(pooled) = 6.67. |
| Behaviour and Mood (NPI) 144‐point scale | Median baseline NPI score was 18.5. Median change from baseline (negative scale): 1.95 6 (i.e. slight deterioration with time) | MD: 1.57 (0.16 to 2.98) | ‐0.10 (‐0.19 to ‐0.01) | 1819 | ⊕⊕⊕⊕ | SMD as a negative outcome (Analysis 2.4) Converted to NPI scale; median SD(pooled) = 15.70. |
| Binary outcomes | Anticipated absolute effects | Relative effect | № of participants | Certainty of the evidence | Comments | |
| Risk with placebo (median) | Risk with memantine | |||||
| All‐cause discontinuation | 188 per 1000 | 175 per 1000 | RR 0.93 | 5087 924 events | ⊕⊕⊕⊕ | RR for all studies in people with moderate‐to‐severe AD (apart from those with agitation) (Analysis 16.5). Median control group risk for 10 studies in 2459 people with moderate‐to‐severe AD without agitation, receiving monotherapy (Analysis 2.9) |
| Difference: 13 fewer people per 1000 discontinued treatment for any cause (95% CI 32 fewer to 8 more) | ||||||
| Number suffering at least one adverse event | 760 per 1000 | 783 per 1000 | RR 1.03 | 8033 5371 events | ⊕⊕⊕⊕ | RR from all studies (Analysis 9.3).Median control group risk for moderate‐to‐severe AD studies in people receiving monotherapy (Analysis 2.11) |
| Difference: 23 more people per 1000 suffered adverse events | ||||||
| Number suffering at least one serious adverse event | 114 per 1000 | 104 per 1000 (93 to 116) | RR 0.91 | 6482 (19 RCTs) 918 events | ⊕⊕⊕⊕ | RR and median control risk from all AD studies (except those with agitation) (from Analysis 8.10) |
| Difference: 10 fewer people per 1000 suffered serious adverse events (95% CI 21 fewer to 2 more) | ||||||
| Number suffering agitation as an adverse event | 164 per 1000 | 112 per 1000 | RR 0.68 | 1016 154 events | ⊕⊕⊕⊝ | RR and median control group risk for studies in people with moderate‐to‐severe AD without agitation, receiving monotherapy (Analysis 2.13) |
| Difference: 52 fewer people per 1000 suffered agitation as an adverse event | ||||||
| *The risk in the intervention group (and its 95% confidence interval) is based on the assumed risk in the comparison group and the relative effect of the intervention (and its 95% CI). | ||||||
| GRADE Working Group grades of evidence | ||||||
1 Some inconsistency in point estimates, but insufficient to downgrade
2 Some imprecision (193 events and borderline for CI crossing 1; CI crossed 0.75) and some inconsistency in point estimates ‐ downgrade once overall
3 Median control group values for 4 studies reporting CIBIC+ (Bakchine 2008 (99679) SG; Peskind 2004 (MD‐10) SG; Reisberg 2003 (9605); van Dyck 2007 (MD‐01))
4 Median control group baseline scores and mean control group change from baseline for 3 studies reporting SIB (Reisberg 2003 (9605); van Dyck 2007 (MD‐01); Wang 2013)
5 Mean control group baseline scores and mean control group change from baseline for the 2 studies reporting ADCS‐ADL19 (Reisberg 2003 (9605); van Dyck 2007 (MD‐01))
6 Median control group baseline scores and median control group change from baseline for the 4 studies reporting NPI (Howard 2012 (DOMINO‐AD); Reisberg 2003 (9605); van Dyck 2007 (MD‐01); Wang 2013)
| Memantine 20 mg or equivalent compared to placebo, for moderate‐to‐severe AD, selected for agitation | ||||||
| Population: Alzheimer's disease, moderate‐to‐severe, selected for agitation | ||||||
| Outcomes | Score with placebo (median) | Mean improvement in change score between memantine and placebo | SMD (95% CI) meta‐analysis findings | № of participants | Certainty of the evidence | Comments |
| Clinical Global 7‐point Likert scale | The CIBIC+ score from one study was 4.63 5 (i.e. deterioration with time) | MD: 0.14 (‐0.17 to 0.44) (random effects) 24 week study only: MD: ‐0.05 (‐0.35 to 0.25) (Herrmann 2012 (10158)) | ‐0.11 (‐0.34 to 0.13) (random effects) | 443 24 week study: 275 participants | ⊕⊕⊝⊝ | SMD as a negative outcome (Analysis 3.5). Heterogeneity between 12 weeks (2 studies) and 24 weeks. Converted to CIBIC+ scale; SD(pooled) = 1.29 (Herrmann 2012 (10158)). |
| Cognitive Function 100‐point scale | Mean SIB score at baseline: 68.1. Median change from baseline (positive scale): ‐5.23 6 (i.e. deterioration with time) | MD: 4.34 (‐5.89 to 24 week study only: MD: ‐0.48 (‐2.57 to 1.61) (Herrmann 2012 (10158)) | ‐0.24 (‐0.84 to 0.36) (random effects) | 453 | ⊕⊝⊝⊝ | Analysed as mean difference (Analysis 3.6). [SMD as a negative outcome] |
| Performance on ADL | Mean ADCS‐ADL19 score at baseline: 32.5. Mean change from baseline (positive scale): ‐1.087 (i.e. slight deterioration with time) | MD: ‐1.48 (‐3.15 to 0.19) | 0.21 (‐0.02 to 0.43) | 309 | ⊕⊕⊝⊝ | Analysed as mean difference (Analysis 3.7) [SMD for decline in ADL as a negative outcome] |
| Behaviour and Mood (NPI) 144‐point scale | Median baseline NPI score was 33.3. Median change from baseline (negative scale): ‐8.6 8 (i.e. improvement with time) | MD: 1.51 (‐5.03 to 8.05) (random effects) | ‐0.07 (‐0.41 to 0.27) (random effects) | 470 | ⊕⊝⊝⊝ | Analysed as mean difference (random effects) (Analysis 3.8) [SMD as a negative outcome] |
| Agitation (Cohen Mansfield Agitation Inventory) range 29 ‐ 203 points | Mean baseline CMAI score was 57.7 Mean change from baseline (negative score) was ‐6.19 (i.e. improvement with time) | MD: 0.50 (‐3.71 to 4.71) (random effects) 2 studies in 422 participants | 0.11 (‐0.12 to 0.33) 2 studies in 306 participants | 455 (3 RCTs) | ⊕⊕⊕⊝ | MD and SMD as negative outcomes One study reported final scores (Fox 2012 (MAGD)), so not included in SMD. One study reported CMAI‐C (Forest 2006 (MD‐23)), so not included in MD meta‐analysis |
| Binary outcomes | Anticipated absolute effects | Relative effect | № of participants | Certainty of the evidence | Comments | |
| Risk with placebo (median) | Risk with memantine | |||||
| All‐cause discontinuation | 171 per 1000 | 188 per 1000 | RR 1.10 (0.79 to 1.52) | 555 113 events | ⊕⊕⊕⊝ | RR for all 3 studies in people with moderate‐to‐severe AD selected for agitation (Analysis 3.9). Median control group risk for 3 studies in 555 people with moderate‐to‐severe AD selected for agitation (Analysis 3.9) |
| Difference: 17 more people per 1000 discontinued treatment for any cause (95% CI 36 fewer to 89 more) | ||||||
| Number suffering at least one adverse event | 600 per 1000 | 618 per 1000 | RR 1.03 | 8033 5371 events | ⊕⊕⊕⊕ | RR from all studies (Analysis 9.3).Mean control group risk for 2 moderate‐to‐severe AD studies in people selected for agitation (Analysis 3.11) |
| Difference: 18 more people per 1000 suffered adverse events | ||||||
| *The risk in the intervention group (and its 95% confidence interval) is based on the assumed risk in the comparison group and the relative effect of the intervention (and its 95% CI). | ||||||
| GRADE Working Group grades of evidence | ||||||
1 Inconsistency in point estimates between 24 week and 12 week studies (downgrade once); imprecision (crossed null and SMD 0.30) (downgrade once)
2 Inconsistency between 24 week and 12 week studies (I² =90%) (downgrade twice); imprecision (very wide CI crossing SMD +0.30 and ‐0.30 (downgrade twice)
3 Imprecision (crossed null and SMD 0.40) (downgrade once); some inconsistency in point estimates and risk of bias from baseline differences (downgrade once across the two domains)
4 Inconsistency (I² = 62%, P = 0.07) (downgrade once); risk of bias (due to baseline differences) (downgrade once); imprecision (wide CI: SMD crossing ‐0.2 and 0.4) (downgrade twice)
5 Control group value for 1 study reporting CIBIC+ (Herrmann 2012 (10158)))
6 Mean control group baseline scores and mean control group change from baseline for 2 studies reporting SIB (Fox 2012 (MAGD); Herrmann 2012 (10158))
7 Mean control group baseline scores and mean control group change from baseline for the 2 studies reporting ADCS‐ADL19 (Forest 2006 (MD‐23); Herrmann 2012 (10158))
8 Median control group baseline scores and median control group change from baseline for the 3 studies reporting NPI (Forest 2006 (MD‐23); Fox 2012 (MAGD); Herrmann 2012 (10158))
9 Mean control group baseline scores and mean control group change from baseline for the 2 studies reporting CMAI (Fox 2012 (MAGD); Herrmann 2012 (10158))
10 Some inconsistency for two studies reporting CMAI and some imprecision (SMD crossing 0.3 and null) (downgrade once overall)
11 Imprecision (113 events) (downgrade once)
| Memantine 20 mg compared to placebo for mild AD (MMSE 20‐23) observed case (OC) ‐ six‐month studies for dementia | ||||||
| Population: mild Alzheimer's disease | ||||||
| Continuous outcomes | Score with placebo | Mean improvement in change score between memantine and placebo | SMD (95% CI) meta‐analysis findings | № of participants | Certainty of the evidence | Comments |
| Clinical Global (CIBIC+) | Median CIBIC+ score | MD: 0.09 (‐0.12 to 0.30) | ‐0.08 (‐0.27 to 0.12) | 427 | ⊕⊕⊝⊝ | Analysed as mean difference (Analysis 4.1). [SMD as a negative outcome (Analysis 16.1)] |
| Cognitive function (ADAS‐Cog) | Baseline ADAS‐Cog scores not reported. Median change from baseline in ADAS‐Cog score (negative scale): ‐1.7 6 (i.e. improvement with time) | MD: 0.21 (‐0.95 to 1.38) | ‐0.03 (‐0.19 to 0.13) | 619 | ⊕⊕⊕⊝ | Analysed as mean difference (Analysis 4.2). [SMD as a negative outcome (Analysis 16.2).] |
| Performance on ADL (ADCS‐ADL23) | Baseline ADL scores not reported. Median change from | MD: ‐0.07 (‐1.80 to 1.66) | 0.02 (‐0.14 to 0.18) | 621 | ⊕⊕⊕⊝ | Analysed as mean difference for decline in ADL (Analysis 4.3). [SMD as a negative outcome (Analysis 16.3)] Direction of scale reversed for ADL outcome. |
| Behaviour and mood: (NPI) | Baseline NPI scores not reported. Median change from baseline in NPI was ‐2.4 (i.e. slight improvement with time) 8 | MD: ‐0.29 (‐2.16 to 1.58) | 0.02 (‐0.14 to 0.18) | 621 | ⊕⊕⊕⊝ | Analysed as mean difference. [SMD as a negative outcome (Analysis 16.4)]. |
| Binary outcomes | Anticipated absolute effects | Relative effect | № of participants | Certainty of the evidence | Comments | |
| Risk with placebo (median) | Risk with memantine | |||||
| All‐cause discontinuation | 100 per 1000 | 174 per 1000 | RR 1.74 | 528 72 events | ⊕⊝⊝⊝ | RR and median control group risk for mild AD studies (Analysis 16.5) |
| Difference: 74 more people per 1000 discontinued treatment for any cause (95% CI 8 to 181 more) | ||||||
| Number suffering at least one adverse event | 429 per 1000 | 442 per 1000 | RR 1.03 | 8033 5371 events | ⊕⊕⊕⊕ | RR from all studies (Analysis 9.3).Control group risk taken from Holland 2013 study |
| Difference: 13 more people per 1000 suffered adverse events | ||||||
| Number suffering at least one serious adverse event | 114 per 1000 | 104 per 1000 (93 to 116) | RR 0.91 | 6482 (19 RCTs) 918 events | ⊕⊕⊕⊕ | RR and median control risk from all AD studies (except those with agitation) (from Analysis 8.10) |
| Difference: 10 fewer people per 1000 suffered serious adverse events (95% CI 21 fewer to 2 more) | ||||||
| Number suffering agitation as an adverse event | Outcome not reported by any study | 0 RCTs | ||||
| *The risk in the intervention group (and its 95% confidence interval) is based on the assumed risk in the comparison group and the relative effect of the intervention (and its 95% CI). | ||||||
| GRADE Working Group grades of evidence | ||||||
1 All studies are post‐hoc subgroups (downgrade once on risk of bias); imprecision ‐ 427 patients and SMD estimate crosses null and is consistent with appreciable benefit and no benefit (downgrade once)
2 All studies are post‐hoc subgroups (downgrade once on risk of bias)
3 All studies are post‐hoc subgroups (downgrade once on risk of bias) and some inconsistency in the point estimates (but not sufficient to downgrade)
4 Majority of the information from post‐hoc subgroups (downgrade once on risk of bias); imprecision: 72 events, and CI crossed 1.25 (downgrade once); inconsistency (I² = 49%) downgrade once
5 Median control group values for 3 studies reporting CIBIC+ (Bakchine 2008 (99679) SG; Peskind 2004 (MD‐10) SG; Porsteinsson 2008(MD‐12)S)
6 Median control group change from baseline for 4 studies reporting ADAS‐Cog (Bakchine 2008 (99679) SG; Dysken 2014 SG; Peskind 2004 (MD‐10) SG; Porsteinsson 2008(MD‐12)S)
7 Median control group change from baseline for the 4 studies reporting ADCS‐ADL23 (Bakchine 2008 (99679) SG; Dysken 2014 SG; Peskind 2004 (MD‐10) SG; Porsteinsson 2008(MD‐12)S)
8 Median control group change from baseline for the 4 studies reporting NPI (Bakchine 2008 (99679) SG; Dysken 2014 SG; Peskind 2004 (MD‐10) SG; Porsteinsson 2008(MD‐12)S)
| Memantine compared to placebo for Parkinson's disease dementia (PDD) and Dementia with Lewy Bodies (DLB) | ||||||
| Population: Parkinson's disease dementia (PDD) and dementia with Lewy bodies (DLB) | ||||||
| Continuous outcomes | Score with placebo (median) | Mean improvement in change score between memantine and placebo | SMD (95% CI) meta‐analysis findings | № of participants | Certainty of the evidence | Comments |
| Clinical Global (CIBIC+) 7‐point Likert scale | CIBIC+ score from 1 study was 4.1 (i.e. no change) | MD: 0.49 (0.13 to 0.83) | ‐0.35 (‐0.60 to ‐0.09) | 243 | ⊕⊕⊝⊝ | SMD as a negative outcome Back transformed to CIBIC+ scale using SD(pooled) = 1.39 (from 1 study (Marsh 2009 PDD)). |
| Cognitive Function: (MMSE) 30‐point scale | MMSE score: 20.0 (at 24 weeks). Change from baseline (positive scale): ‐0.5 (i.e. slight deterioration with time) (one study) | MD: 1.9 (0.07 to 3.73) | ‐0.50(‐1.00 to 0.00) | 63 | ⊕⊝⊝⊝ | One study at 24 weeks and one at 16 weeks only for this outcome; highly heterogeneous. So 24 week study reported only (Aarsland 2009). MMSE scale direction was reversed (Analysis 6.2) |
| Performance on ADL (ADCS‐ADL23) 78‐point scale | ADCS‐ADL23 score at baseline: 48 Change from baseline (positive scale): ‐0.1 (i.e. no change with time) (one study) | MD: 3.07 (‐1.25 to 7.4) | ‐0.27 (‐0.67 to 0.07) | 243 | ⊕⊝⊝⊝ | SMD decline in ADL as a negative outcome (Analysis 6.3). Random effects. Back transformed to ADCS‐ADL23 scale, using results from one study (Emre 2010 (11018)). SD(pooled) = 11.38. |
| Behaviour and Mood (NPI) 144‐point scale | Median NPI score at baseline: 13.0 Median change from baseline (negative scale): 1.4 | MD: 2.18 (‐1.21 to 5.57) | ‐0.18 (‐0.43 to 0.07) | 242 | ⊕⊕⊝⊝ | Random effects. Analysed as mean difference (Analysis 6.4). [SMD as a negative outcome (Analysis 8.4)] |
| Binary outcomes | Anticipated absolute effects | Relative effect | № of participants | Certainty of the evidence | Comments | |
| Risk with placebo (median) | Risk with memantine | |||||
| All‐cause discontinuation | 201 per 1000 | 169 per 1000 | RR 0.84 | 312 64 events | ⊕⊕⊝⊝ | RR and control group risk from PDD or DLB studies (Analysis 6.5) |
| Difference: 32 fewer people per 1000 discontinued treatment for any cause | ||||||
| Number suffering at least one adverse event | 500 per 1000 | 515 per 1000 | RR 1.03 | 8033 5371 events | ⊕⊕⊕⊕ | RR from all studies (Analysis 9.3). Median control group risk for PDD or DLB studies (Analysis 6.7). |
| Difference: 15 more people per 1000 suffered adverse events | ||||||
| Number suffering at least one serious adverse event | 86 per 1000 | 123 per 1000 (59 to 255) | RR 1.43 | 220 (2 RCTs) 26 events | ⊕⊕⊝⊝ | RR and control group risk from PDD or DLB studies (Analysis 8.10) |
| Difference: 37 more people per 1000 suffered serious adverse events (95% CI 27 fewer to 169 more) | ||||||
| Number suffering agitation as an adverse event | Outcome not reported for either study | 0 RCTs | ||||
| *The risk in the intervention group (and its 95% confidence interval) is based on the assumed risk in the comparison group and the relative effect of the intervention (and its 95% CI). | ||||||
| GRADE Working Group grades of evidence | ||||||
1 Majority of the information at high risk of bias and number of patients estimated (downgrade once); imprecision ‐ 243 patients (below optimal information size) (downgrade once)
2 Reporting bias (2 larger studies did not report outcome) and high risk of bias for remaining study (downgrade once), inconsistency with 16 weeks study high (I² = 75%) (downgrade once), imprecision (only 63 patients, wide CI) (downgrade once)
3 Majority of information at high risk of bias (downgrade once), inconsistency in point estimates (I² = 40%) (downgrade once) and imprecision (243 participants and CI crossed null and consistent with both benefit and no difference) (downgrade once)
4 Majority of information at high risk of bias (downgrade once), some inconsistency in point estimates (I² = 20%) (not downgraded) and imprecision (243 patients; CI crossed null and included benefit and no difference) (downgrade once)
5 Imprecision: CI crossed both 1.25 and 0.75, and CI fairly wide around absolute effect (downgrade twice)
| Memantine compared to placebo for Frontotemporal dementia (FTD) | ||||||
| Population: frontotemporal dementia | ||||||
| Continuous outcomes | Score with placebo (median) | Mean improvement in change score between memantine and placebo | SMD (95% CI) meta‐analysis findings | № of participants | Certainty of the evidence | Comments |
| Clinical Global (CGIC) 7‐point Likert scale | CGIC score from 1 study was 4.8 (i.e. deterioration with time) | MD: 0.56 (‐0.11 to 1.21) | ‐0.31 (‐0.67 to 0.06) | 117 | ⊕⊕⊝⊝ | SMD as a negative outcome Back transformed to CGIC scale using SD (pooled) = 1.80 (from 1 study (Boxer 2013). |
| Cognitive Function: (MMSE) 30‐point scale | MMSE score: 25.1 (at 26 weeks). Change from baseline (positive scale): ‐0.9 (i.e. deterioration with time) (one study) | MD ‐0.30 (‐1.83 to 1.23) | 0.09 (‐0.35 to 0.52) | 81 | ⊕⊝⊝⊝ | One study at 6 months and one at 12 months for this outcome; some heterogeneity so 6‐month study reported only (Boxer 2013) (Analysis 7.2). MMSE scale direction was reversed. |
| Performance on ADL % DAD score = yes at 12 months | Baseline score: 58.3%. Change from baseline (positive scale): ‐19.5% (i.e. deterioration) (one study) | MD: 12.10% (‐1.40 to 25.60) | ‐ | 39 | ⊕⊝⊝⊝ | Decline in ADL not reported in either study. Percentage with DAD score = yes reported in Vercelletto 2011 at 12 months. |
| Behaviour and Mood (NPI) 144‐point scale | NPI score at baseline: 21.5. Change from baseline (negative scale): 0.3 | MD: 3.16 (‐3.61 to 8.01) | ‐0.17 (‐0.62 to 0.28) | 115 | ⊕⊕⊝⊝ | Analysed as mean difference (Analysis 7.3). Baseline score and change from baseline for 26‐week study (Boxer 2013). [SMD as a negative outcome (Analysis 8.4)] |
| Binary outcomes | Anticipated absolute effects | Relative effect (95% CI) | № of participants | Certainty of the evidence | Comments | |
| Risk with placebo (median) | Risk with memantine | |||||
| All‐cause discontinuation | 71 per 1000 | 109 per 1000 | RR 1.54 (0.54 to 4.06) | 133 15 events | ⊕⊕⊝⊝ | RR from FTD studies; control group risk from 26 week study (Analysis 7.4) |
| Difference: 38 more people per 1000 discontinued treatment for any cause (95% CI 33 fewer to 217 more) | ||||||
| Number suffering at least one adverse event | 667 per 1000 | 687 per 1000 | RR 1.03 | 8033 5371 events | ⊕⊕⊕⊕ | RR from all studies (Analysis 9.3).Control group risk for 26‐week FTD study |
| Difference: 20 more people per 1000 | ||||||
| Number suffering at least one severe adverse event | 48 per 1000 | 34 per 1000 (14 to 80) | RR 0.71 | 133 (2 RCTs) 17 events | ⊕⊕⊝⊝ | RR and control group risk from FTD study at 26 weeks (Analysis 8.10) |
| Difference: 14 fewer people per 1000 | ||||||
| Number suffering agitation as an adverse event | 48 per 1000 | 10 per 1000 (0.5 to 208) | RR 0.21 | 81 (1 RCT) | ⊕⊝⊝⊝ | RR and control group risk from FTD study at 26 weeks (Analysis 7.8) |
| Difference: 38 fewer people per 1000 | ||||||
| *The risk in the intervention group (and its 95% confidence interval) is based on the assumed risk in the comparison group and the relative effect of the intervention (and its 95% CI). | ||||||
| GRADE Working Group grades of evidence | ||||||
1 Majority of the information at high risk of bias (downgrade once); imprecision ‐ 117 patients (below optimal information size) (downgrade once)
2 Inconsistency in point estimates (I² = 23%) (downgrade once) and Imprecision (122 patients and wide confidence interval) (downgrade twice)
3 Imprecision (39 participants and CI crossed null and consistent with both benefit and no difference) (downgrade twice); indirect outcome (percentage DAD score at 12 months) and borderline high risk of bias (differential missing data) (downgrade once)
4 Some inconsistency in point estimates and Imprecision (122 patients and wide confidence interval) (downgrade twice overall)
5 Inconsistency in point estimates (downgrade once); Imprecision: 15 events and CI crossed both 1.25 and 0.75 (downgrade twice)
6 Imprecision: 17 events and wide CI (downgrade twice)
7 Imprecision: 2 events and very wide CI (downgrade twice): high risk of bias ‐ number discontinuing treatment greater than number of events (downgrade twice)
1. Alzheimer's disease (AD)
1.1. Results for all studies in people with AD: trial selection
Twenty‐nine studies reported the effect of memantine in people with AD, however, we did not include five of these studies in the main analyses: three studies concerned participants selected for agitation or aggression and we treated this group separately because we considered this to be a different sub‐population (see section 1.4) (Forest 2006 (MD‐23); Fox 2012 (MAGD); Herrmann 2012 (10158). Secondly, it was necessary to analyse the main efficacy outcomes using the SMD because the studies employed different scales; therefore, we had to exclude from the efficacy analyses two studies reporting only final values (Ashford 2011 (95722); Lorenzi 2011 (SC05‐03)). In addition, in a post‐hoc decision, we excluded from the analyses results for two of the four arms in one study: the comparison of memantine versus placebo, in the presence of vitamin E (Dysken VitE 2014). This was because a negative interaction between memantine and vitamin E was identified by the authors for their primary outcome (decline in activities of daily living (ADL), P = 0.03), which persisted at all time points in the four‐arm study. Finally, for one study, there was a discrepancy in the one‐year results between the unpublished poster (which reported standard deviations) and the full paper (which did not) for their ADL outcome, so we also omitted this study for the outcome, decline in ADL (Schmidt 2008).
We therefore included data from 24 trials in 7102 randomised participants with AD, using the OC approach to missing data, whenever possible. For most outcomes, there was too much heterogeneity to make overall statements of effect, therefore we investigated the heterogeneity in sensitivity and subgroup analyses, examining risk of bias, trial duration, memantine dose, concomitant cholinesterase inhibitors (ChEIs) and severity of AD. Details are reported in Appendix 4 .
In a sensitivity analysis, we found that exclusion of the trials at high risk of bias for one or more domains generally made little difference to the heterogeneity, so all 24 studies were included in subgroup analyses (Appendix 4.1).
Following subgroup analyses (Appendix 4), we firstly restricted the main analyses (below) to those with the licensed memantine dose of 20 mg per day or a daily 28 mg extended release tablet, and to a duration of six to seven months. This meant that some studies were excluded from the analyses: four short‐term studies in 658 participants (Hofbauer 2009 (MD‐71); Lundbeck 2006 (10116); Merz 2003 (MRZ‐9104); Winblad 1999 (9403) AD); and three longer‐term studies in 334 participants that did not report interim results at six to seven months (Ashford 2011 (95722); Holland 2013; Wilkinson 2012 (10112)); these studies only reported results for the cognitive function outcome. Additionally, we did not include in the main analyses the 10 mg/day arms from two studies (Asada 2011 (MA3301); Homma 2007 (IE2101)). This left 17 studies in 5813 randomised participants.
Secondly, on the basis of subgroup analyses and meta‐regression addressing both severity and the presence or absence of ChEIs, we concluded that it was necessary to stratify the studies by severity of AD, and to later investigate residual heterogeneity in the moderate‐to‐severe population (Appendix 4; Appendix 5; Appendix 6). In the test for subgroup differences, there were large differences relating to disease severity, both between mild‐to‐moderate and moderate‐to‐severe AD and between mild and moderate‐to‐severe AD. We analysed and reported separately results for mild dementia and moderate‐to‐severe dementia because these represent the categories for the licensed indications. These analyses include post‐hoc subgroups for mild and moderate AD obtained from studies in people with mild‐to‐moderate AD. We had to omit from the main analyses three studies in 468 participants with mild‐to‐moderate AD because they did not report separately results for mild and moderate populations (Asada 2011 (MA3301); Peters 2015 (MEGACOMBI2); Schmidt 2008). Subgroup analyses also showed that any impact from the presence of ChEIs was small.
All subgroup analyses investigated the impact of different study factors on the effect estimate (i.e. the difference in mean change‐from‐baseline scores between memantine and placebo). However, we also observed differences according to severity in the change from baseline for the placebo group alone; this was found for all outcomes except clinical global (which appeared to be independent of severity). There was increased efficacy of memantine (versus placebo) with increasing severity of disease, but this occurred alongside deterioration in the placebo group for the moderate and severe populations and improvement for the mild population.
In the rest of this section, we report results for the following sub‐populations: Section 1.2 reports the results for all participants with moderate‐to‐severe AD, with the exception of studies in patients selected for agitation. Section 1.3 examines the effect of concomitant ChEIs in people with moderate‐to‐severe AD. Section 1.4 covers the effect of memantine versus placebo in patients with agitation (who also had moderate‐to‐severe AD). Finally, section 1.5 summarises the evidence for people with mild dementia. We do not discuss separately results for moderate and severe AD in the main section, but analyses based on post‐hoc subgroups are given in Appendix 4. Each sub‐section includes the individual results for the efficacy outcomes, GRADE certainty ratings and a summary.
1.2. Effect of memantine in people with moderate‐to‐severe AD at six to seven months; OC
1.2.1. Effect of memantine (20 mg to 28 mg/day) versus placebo (irrespective of whether additionally taking a cholinesterase inhibitor)
Fifteen studies met the inclusion criteria and contributed data from approximately 3700 analysed participants (Asada 2011a (IE3501); Bakchine 2008 (99679) SG; Dysken 2014 SG; Forest 2006 (MD‐22); Grossberg 2008 (MD‐50); Homma 2007 (IE2101); Howard 2012 (DOMINO‐AD); Lorenzi 2011 (SC05‐03); Nakamura 2016; Peskind 2004 (MD‐10) SG; Porsteinsson 2008(MD‐12)S; Reisberg 2003 (9605); Tariot 2004 (MD‐02); van Dyck 2007 (MD‐01); Wang 2013). Four of these studies provided post‐hoc data for moderate severity AD participants (Bakchine 2008 (99679) SG; Dysken 2014 SG; Peskind 2004 (MD‐10) SG; Porsteinsson 2008(MD‐12)S).
Not all studies reported all the outcomes: for the efficacy outcomes,10 studies contributed data to the clinical global outcome, 13 to cognitive function, 11 to decline in ADL and 14 to the behaviour and mood outcome. Thirteen studies reported all‐cause discontinuation and 12 withdrawal due to adverse events, but considerably fewer studies reported adverse events: nine studies (72% of all participants) reported the proportion of participants with at least one adverse event; nine studies (77% of all participants) reported the proportion with serious adverse events and six studies (61% of all participants) reported the proportion with agitation.
The evidence for this section is summarised in summary of findings Table for the main comparison, which covers both efficacy and safety outcomes; a negative SMD (or MD value means that the effect favours memantine.
-
Clinical global rating (Analysis 1.1): high‐certainty evidence: meta‐analysis of 10 studies in 2797 participants gave an SMD of ‐0.20 (95% CI ‐0.28 to ‐0.13), favouring memantine.
-
Cognitive function (Analysis 1.2): high‐certainty evidence: meta‐analysis of 13 studies in 3337 participants gave an SMD of ‐0.27 (95% CI ‐0.34 to ‐0.21); there was some variation in the point estimates (I² = 30%, P = 0.14).
-
Decline in ADL (Analysis 1.3): high‐certainty evidence: meta‐analysis of 11 studies in 2687 participants gave an SMD ‐0.16 (95% CI ‐0.24 to ‐0.09).
-
Behaviour and mood (Analysis 1.4) high‐certainty evidence: meta‐analysis of 14 studies in 3674 participants gave an SMD of ‐0.14 (95% CI ‐0.21 to ‐0.08); there was some variability in the point estimates (but I² = 8%, P = 0.36).
-
All‐cause discontinuation, discontinuation due to adverse events, adverse events and serious adverse events are reported in section 5.
Funnel plots for the primary outcomes are shown in Figure 4; Figure 5; Figure 6; Figure 7 and for all‐cause discontinuation in Figure 8. There appeared to be no suggestion of publication bias. There may be some asymmetry in the funnel plot for the number of people with at least one adverse event (Figure 9), but probably not sufficient to downgrade the evidence on the basis of publication bias.

Funnel plot of comparison: 1 Memantine 20 mg or equivalent vs placebo for moderate‐to‐severe Alzheimer's disease. 24‐30 week data. OC, outcome: 1.1 Clinical Global.

Funnel plot of comparison: 1 Memantine 20 mg or equivalent vs placebo for moderate‐to‐severe Alzheimer's disease. 24‐30 week data. OC, outcome: 1.2 Cognitive Function.
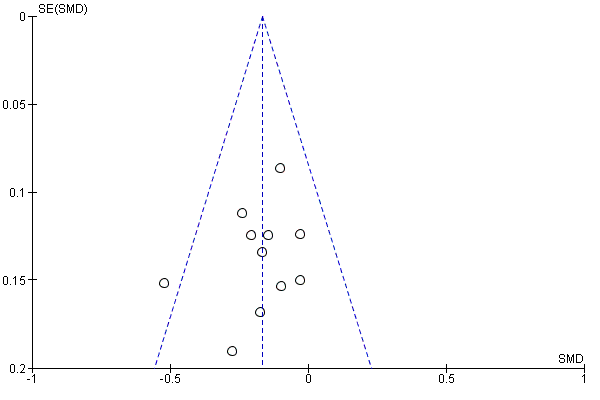
Funnel plot of comparison: 1 Memantine 20 mg or equivalent vs placebo for moderate‐to‐severe Alzheimer's disease. 24‐30 week data. OC, outcome: 1.3 Decline in ADL.
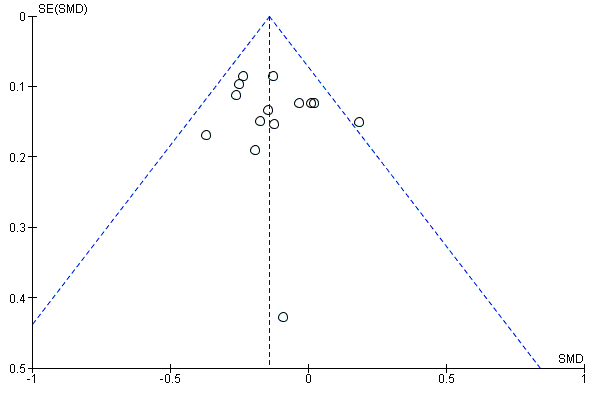
Funnel plot of comparison: 1 Memantine 20 mg or equivalent vs placebo for moderate‐to‐severe Alzheimer's disease. 24‐30 week data. OC, outcome: 1.4 Behaviour and Mood.
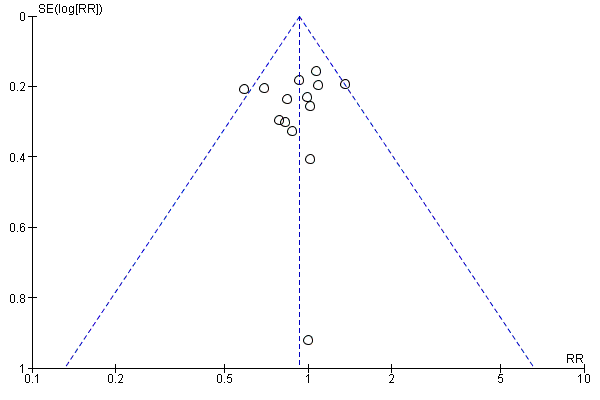
Funnel plot of comparison: 1 Memantine 20 mg or equivalent vs placebo for moderate‐to‐severe Alzheimer's disease. 24‐30 week data. OC, outcome: 1.5 All‐cause discontinuation.

Funnel plot of comparison: 12 Adverse reactions ‐ Memantine vs placebo for mild to severe dementia. All diagnoses, all durations, outcome: 12.3 Number suffering at least one adverse event.
1.2.2. Summary of results transformed to an appropriate scale
High‐certainty evidence from up to 14 studies in around 3700 participants shows a small clinical benefit for memantine versus placebo in each of the following outcomes: clinical global rating (MD benefit: 0.21 Clinician's Interview‐Based Impression of Change (CIBIC)+ points, 95% CI 0.14 to 0.30); cognitive function (MD benefit: 3.11 SIB points, 95% CI 2.42 to 3.92); performance on ADL (MD benefit: 1.09 ADL19 points, 95% CI 0.62 to 1.64); and behaviour and mood (MD benefit: 1.84 NPI points, 95% CI 1.05 to 2.76). (summary of findings Table for the main comparison).
There are similar numbers of people with adverse events in both groups, and memantine (compared with placebo) shows little difference in the number of people discontinuing treatment: RR 0.93 (95% CI 0.83 to 1.04), which corresponds to 13 fewer people discontinuing per 1000, 95% CI 31 fewer to 7 more. There is probably a reduction in the number with agitation as an adverse event (25 fewer per 1000; 95% CI 1 to 44 fewer).
1.3. Effect of memantine 20 mg or equivalent versus placebo in people with moderate‐to‐severe AD six to seven months, receiving concomitant ChEI or receiving monotherapy
An important objective of this review was to determine whether memantine (versus placebo) gave additional benefits for people already on ChEIs. In this section, firstly, we report the results of pre‐specified subgroup analyses by concomitant ChEI for the moderate‐to‐severe AD population. Statistically, there were no significant differences between the results for the two subgroups (with and without ChEI) ‐ see section 1.3.1, but, for the interested reader, we also report results separately for the population receiving ChEIs in section 1.3.2 and results for the monotherapy subgroup in section 1.3.3.
1.3.1. Effect of memantine 20 mg or equivalent: subgroup analysis according to the presence or absence of concomitant ChEI
We conducted subgroup analyses for the four efficacy outcomes to investigate any differences in the effect of memantine (versus placebo) between memantine as monotherapy or with concomitant ChEI. We examined both between‐trial and within‐trial subgroup analyses (see Appendix 6). The results for patients receiving monotherapy and for those receiving concomitant ChEI are summarised in Table 9 for all outcomes (Analysis 2.1; Analysis 2.2; Analysis 2.3; Analysis 2.4; Analysis 2.5; Analysis 2.6; Analysis 2.7).
| Number of Studies | Number of Participants | Standardised Effect Estimate | Heterogeneity (I²) | Test for | |||||||||
| Domain | All | with ChEI | no ChEI | All | with ChEI | no ChEI | All | with ChEI | no ChEI | All | with ChEI | no ChEI | |
| Clinical Global | 10 | 3 | 7 | 2797 | 1125 | 1672 | ‐0.20 | ‐0.21 (‐0.32 to ‐0.09) | ‐0.20 (‐0.30 to ‐0.10) | 0% | 13% | 0% | I² = 0%, P = 0.99 |
| Cognitive Function | 14 | 6 | 8 | 3337 | 1852 | 1485 | ‐0.28 (‐0.35 to ‐0.21) | ‐0.24 (‐0.33 to ‐0.14) | ‐0.33 (‐0.43 to ‐0.23) | 33% | 13% | 41% | I² = 44%, P = 0.18 |
| Decline in Living (Analysis 2.3) | 12 | 5 | 7 | 2687 | 1319 | 1368 | ‐0.17 (‐0.24 to ‐0.09) | ‐0.13 (‐0.24 to ‐0.03) | ‐0.20 (‐0.30 to ‐0.09) | 0% | 0% | 10% | I² = 0%, P = 0.43 |
| Behaviour and Mood | 15 | 6 | 9 | 3674 | 1855 | 1819 | ‐0.14 (‐0.21 to ‐0.08) | ‐0.18 (‐0.27 to ‐0.09) | ‐0.10 (‐0.19 to ‐0.01) | 6% | 10% | 0% | I² = 35%, P = 0.21 |
| All‐cause discontinuation | 15 | 6 | 10 | 4548 | 2089 | 2459 | RR 0.93 (0.82 to 1.05) | RR 0.94 (0.78 to 1.13) | RR 0.92 (0.78 to 1.08) | 9% | 61% | 0% | I² = 0%, P = 0.83 |
| Adverse events | 9 | 3 | 6 | 3390 | 1625 | 1765 | RR 1.02 (0.98 to 1.06) | RR 1.05 (0.98 to 1.12) | RR 0.99 (0.94 to 1.04) | 23% | 13% | 0% | I² = 46%, P = 0.17 |
| Agitation as an adverse event | 10 | 5 | 6 | 3854 | 1965 | 1889 | RR 0.79 (0.64 to 0.97) | RR 0.93 (0.65 to 1.31) | RR 0.72 (0.55 to 0.93) | 0% | 0% | 15% | I² = 25.1%, P = 0.25 |
Six studies were conducted on patients with moderate‐to‐severe disease receiving ChEI therapy, these were:
Dysken 2014: patients were on ongoing ChEI therapy with any ChEI (donepezil, rivastigmine or galantamine), as maintenance dosage for at least 4 weeks
Grossberg 2008 (MD‐50): patients were on ongoing ChEI therapy with a stable dose of any ChEI for 3 months or longer, patients must remain on the same dose throughout the study.
Howard 2012 (DOMINO‐AD): patients were on ongoing ChEI therapy with donepezil for at least 3 months and had received a dose of 10 mg for at least the previous
6 weeks. Patients were randomised to continue or discontinue donepezil. The patient’s prescribing clinician was considering a change in drug treatment.
Nakamura 2016: patients had been on donepezil for at least four weeks when recruited and then had 12 weeks single blind observation period on donepezil. Only those stable continued to the double blind period.
Porsteinsson 2008 (MD‐12): patients were on ongoing ChEI therapy with any ChEI for 6 months or longer, and a stable dosing regimen for 3 months or longer (donepezil 5‐10 mg/day; rivastigmine 6, 9 or 12 mg/day; galantamine 16 or 24 mg/day)
Tariot 2004 (MD‐02): patients were on ongoing ChEI therapy with donepezil for more than 6 months before entry into the trial and at a stable dose (5‐10mg/day) for at least 3 months.
The test for subgroup differences showed no significant difference between memantine monotherapy and memantine with concomitant ChEI (for the comparison of memantine versus placebo) for any of the primary efficacy outcomes, although there was a non‐significant difference between subgroups for the behaviour and mood outcome (I² = 35.2%, P = 0.21), and for the cognitive function outcome (I² = 44.2%, P = 0.18). For the behaviour and mood outcome, the subgroup results suggested a slightly larger effect of memantine versus placebo in the presence of concomitant ChEI (SMD ‐0.18, 95% CI ‐0.27 to ‐0.09) than in its absence (SMD ‐0.10, 95% CI ‐0.19 to ‐0.01), whereas for the cognitive function outcome, there was a slightly smaller effect in the presence of ChEI (SMD ‐0.24, 95% CI ‐0.33 to ‐0.14) compared with monotherapy (SMD ‐0.33, 95% CI ‐0.43 to ‐0,23). The forest plots for these analyses (Analysis 2.1; Analysis 2.2; Analysis 2.3; Analysis 2.4) are ordered within subgroups in decreasing order of mean study severity (MMSE) and we note that for the behaviour and mood outcome, an alternative explanation for the heterogeneity could be severity of disease (Appendix 4.5).
The safety outcomes showed no significant impact of concomitant ChEI (Analysis 2.9; Analysis 2.10; Analysis 2.11; Analysis 2.12; Analysis 2.13). There was a non‐significant result in the test for subgroup differences for adverse events overall (I² = 46% and P = 0.17), however, this is likely to occur because the confidence intervals for the subgroups are small; the numerical difference is minimal: the ChEI subgroup is RR 1.05 (95% CI 0.98 to 1.12) and monotherapy is RR 0.99 (95%CI 0.94 to 1.04), both indicating no difference between memantine and placebo. For agitation as an adverse event, the test for subgroup differences was I² = 20.9% and P = 0.26, there was probably no difference between memantine and placebo for the ChEI subgroup (RR 0.92, 95% CI 0.60 to 1.40), but for the monotherapy subgroup there was probably a reduction in agitation (RR 0.68, 95% CI 0.51 to 0.91).
The within‐trial subgroup analyses suffered from large and differential levels of missing data and it was uncertain whether there was a difference between subgroups with and without ChEIs (Howard 2012 (DOMINO‐AD)). Low‐certainty evidence (downgraded for risk of bias and imprecision) from one study, which randomised 149 participants to memantine plus continued donepezil versus memantine plus placebo and donepezil discontinued, suggested there may be a larger effect for the two drugs together compared with memantine monotherapy for cognitive function: MD benefit: 1.34 MMSE points (95% CI 0.19 to 2.49), i.e. it may be better to add memantine than to switch to memantine (Howard 2012 (DOMINO‐AD)).
1.3.2. Effect of memantine versus placebo in people with moderate‐to‐severe AD, receiving concomitant ChEIs
We report results of analyses restricted to studies in participants receiving ChEIs. Six studies analysed results from 1855 participants (Dysken 2014 SG; Grossberg 2008 (MD‐50); Howard 2012 (DOMINO‐AD); Nakamura 2016; Porsteinsson 2008(MD‐12)S; Tariot 2004 (MD‐02)). Two of these studies were reported as post‐hoc subgroups for moderate AD, taken from trials in people with mild‐to‐moderate AD (Dysken 2014 SG; Porsteinsson 2008(MD‐12)S).
The evidence for this section is summarised in the additional 'Summary of findings' Table 3, which covers both efficacy and safety outcomes.
Results were as follows. We analysed one outcome (clinical global) as the mean difference (MD) (rather than SMD) because all studies used the same scale; a negative SMD (or MD) value means that the effect favours memantine. In the forest plots, studies are shown in decreasing order of severity (MMSE).
-
Clinical global rating, CIBIC+ (Analysis 2.8): moderate‐certainty evidence (downgraded for inconsistency): meta‐analysis of three studies in 1125 participants gave an MD (random effects) of ‐0.21 (95% CI ‐0.36 to ‐0.06), favouring memantine. There was some heterogeneity in the point estimates (and I² = 32%, P = 0.23).
-
Cognitive function (Analysis 2.2): high‐certainty evidence: meta‐analysis of 6 studies in 1852 participants gave an SMD of ‐0.24 (95% CI ‐0.33 to ‐0.14).
-
Decline in ADL (Analysis 2.3): high‐certainty evidence: meta‐analysis of 5 studies in 1319 participants gave an SMD of ‐0.13 (95% CI ‐0.24 to ‐0.03).
-
Behaviour and mood (Analysis 2.4): high‐certainty evidence : meta‐analysis of 6 studies in 1855 participants gave an SMD of ‐0.18 (‐0.27 to ‐0.09). There was unimportant heterogeneity (I² = 10%, P = 0.35).
-
All‐cause discontinuation, discontinuation due to adverse events, adverse events and serious adverse events are reported in section 5 and Table 3.
1.3.3. Effect of memantine versus placebo in people with moderate‐to‐severe AD, receiving monotherapy
In this section, we report results of analyses restricted to studies in participants receiving monotherapy. Nine studies analysed results from 2215 participants (Asada 2011a (IE3501); Bakchine 2008 (99679) SG; Forest 2006 (MD‐22); Homma 2007 (IE2101); Howard 2012 (DOMINO‐AD); Peskind 2004 (MD‐10) SG; Reisberg 2003 (9605); van Dyck 2007 (MD‐01); Wang 2013). Two of these studies were reported as post‐hoc subgroups for moderate AD, taken from trials in people with mild‐to‐moderate AD (Bakchine 2008 (99679) SG; Peskind 2004 (MD‐10) SG).
The evidence for this section is summarised in the additional 'Summary of findings' Table 4, which covers both efficacy and safety outcomes. Results were as follows. Forest plots show studies in decreasing order of severity; a negative SMD (or MD) value means that the effect favours memantine.
-
Clinical global rating, CIBIC+ (Analysis 2.1): high‐certainty evidence: meta‐analysis of 7 studies in 1672 participants gave an SMD of ‐0.20 (95% CI ‐0.30 to ‐0.10), favouring memantine.
-
Cognitive function (Analysis 2.2): high‐certainty evidence: meta‐analysis of 8 studies in 1485 participants gave an SMD of ‐0.33 (95% CI ‐0.43 to ‐0.23). There is some heterogeneity in the point estimates, but apart from one study, the results are consistent with a benefit for memantine and were not downgraded for inconsistency (I² = 41%, P = 0.11).
-
Decline in ADL (Analysis 2.3): high‐certainty evidence: meta‐analysis of 7 studies in 1368 participants gave an SMD of ‐0.20 (95% CI ‐0.30 to ‐0.09).
-
Behaviour and mood, NPI (Analysis 2.9): high‐certainty evidence: meta‐analysis of 9 studies in 1819 participants gave an SMD of ‐0.10 (95% CI ‐0.19 to ‐0.01).
-
All‐cause discontinuation, discontinuation due to adverse events, adverse events and serious adverse events are reported in section 5 and Table 4.
1.3.4. Summary of results transformed to an appropriate scale
For people receiving concomitant ChEI
Mainly high‐, and moderate‐certainty evidence from up to six studies in around 1850 participants taking cholinesterase inhibitors shows a small clinical benefit for memantine versus placebo in cognitive function (MD benefit: 2.48 SIB points, 95% CI 1.45 to 3.41), performance on ADL (MD benefit: 0.95 ADL19 points, 95% CI 0.22 to 1.76) and behaviour and mood (MD benefit: 2.20 NPI points, 95% CI 1.10 to 3.29); and probably a small clinical benefit in clinical global rating (MD benefit: 0.21 CIBIC+ points, 95% CI 0.06 to 0.36) (Table 3).
There are similar numbers of people with adverse events in both groups. Memantine (compared with placebo) shows little difference in the number of people discontinuing treatment for any cause (12 fewer per 1000, 95% CI 29 fewer to 7 more), and there is probably no difference between interventions in the number with agitation as an adverse event (4 fewer per 1000, 95% CI 18 more to 18 fewer).
For people receiving monotherapy
High‐certainty evidence from up to nine studies in around 1800 participants shows a small clinical benefit for memantine versus placebo in all efficacy outcomes: clinical global rating (MD benefit:0.22 CIBIC+ points, 95% CI 0.11 to 0.33); cognitive function (MD benefit: 3.97 SIB points, 95% CI 2.77 to 5.18); performance on ADL (MD benefit:1.33 ADL19 points, 95% CI 0.20 to 2.00) and behaviour and mood (MD benefit:1.57 NPI points, 95% CI 0.16 to 2.98) (Table 4).
There are similar numbers of people with adverse events in both groups. Memantine (compared with placebo) shows little difference in the number of people discontinuing treatment for any cause (13 fewer per 1000, 95% CI 32 fewer to 8 more), and there is probably also a reduction in the number with agitation as an adverse event (52 fewer per 1000, 95% CI 15 to 80 fewer) (compare agitation in people receiving concomitant ChEI).
Test for subgroup differences
The test for subgroup differences between trials in which participants did and did not receive concomitant ChEI showed no significant differences, but three outcomes had non‐significant differences: cognitive function (I² = 44%), behaviour and mood (I² = 35%), and agitation as an adverse event (I² = 21%). For behaviour and mood, the effect of memantine appeared to be larger in people receiving ChEI, and for cognitive function the effect appeared larger in the monotherapy group. However, it was not clear that these differences could be attributed to concomitant ChEI, and severity may still play a role. For agitation as an adverse event, memantine monotherapy appeared to effect a reduction in the number of people with agitation, but memantine did not appear to add anything to existing effects with cholinesterase inhibitors.
1.4. Effect of memantine in people with moderate‐to‐severe AD with agitation; OC
1.4.1. Effect of memantine versus placebo in people with moderate‐to‐severe AD, with agitation
Three studies investigated the effect of memantine versus placebo in 556 randomised participants with agitation (Forest 2006 (MD‐23); Fox 2012 (MAGD); Herrmann 2012 (10158)); one study was unpublished (Forest 2006 (MD‐23)). Agitation was defined variously as: NPI > 12 with a score on the NPI agitation–aggression item of at least 1 (Herrmann 2012 (10158)); at least two weeks history of behavioural disturbance, and agitation judged by their clinical team to require intervention, with a Cohen Mansfield Agitation Inventory (CMAI) score ≥ 45 (Fox 2012 (MAGD)); and a score on the NPI agitation–aggression item of at least 4 (Forest 2006 (MD‐23)). All studies recruited people with moderate‐to‐severe AD, although the mean MMSE scores differed: one study had a mean score of 7.5 (inclusion ≤ 19) (Fox 2012 (MAGD)); the second had a mean of 11.9 (range 5 to 15) (Herrmann 2012 (10158)); and the third did not state the mean, but the range was 3 to 18 (Forest 2006 (MD‐23)). Two studies included participants on ChEIs (Forest 2006 (MD‐23); Herrmann 2012 (10158)); and the other had about 20% participants on ChEIs (Fox 2012 (MAGD)). One of the three studies was in institutionalised patients (Fox 2012 (MAGD)).
Two studies had a duration of 12 weeks (Forest 2006 (MD‐23); Fox 2012 (MAGD)); and the other was 24 weeks. Two of these studies were terminated prematurely, one after recruiting only 34 participants (Forest 2006 (MD‐23)); and the other because of difficulties in recruitment (the 369 participants formed 82% of the planned recruited sample) (Herrmann 2012 (10158)). One study had the primary aim of reducing agitation (Fox 2012 (MAGD)), and the other two aimed to investigate the efficacy of memantine in an agitated population (Forest 2006 (MD‐23); Herrmann 2012 (10158)). All three studies reported the effect of memantine on agitation using the CMAI, but one used the community version (Forest 2006 (MD‐23)).
We did not extract data from two reviews reporting on post‐hoc agitated subgroups because the data for individual trials were not available in a useful format (Gaultier 2005; Wilcock Post‐Hoc 3RCTs 2008). However, we discuss the findings from these studies in the Agreements and disagreements with other studies or reviews) and note the disagreement.
We analysed all efficacy outcomes except clinical global rating as the mean difference (rather than SMD) because all studies used the same scale; a negative SMD (or MD) value means that the effect favours memantine (Table 5).
Two main outcome measures were used to investigate agitation: the CMAI score (range 29 to 203) (or the CMAI‐community score in the Forest 2006 (MD‐23)) study; and the agitation–aggression subscale of the NPI. Analyses were subgrouped by time point (12 weeks and 24 weeks); we reported both the results for the pooled analysis and the 24‐week study alone, in order both to be consistent with the approach to duration in AD, and also to avoid reducing the analysis to only one study; a negative SMD (or MD) value means that the effect favours memantine.
-
CMAI: the three studies varied in the CMAI scale used and how they reported the results (one only reported final values), so we did not combine all studies in either an SMD analysis or as the MD. Instead, we meta‐analysed the two CMAI studies using the MD (Fox 2012 (MAGD); Herrmann 2012 (10158)) (Analysis 3.1) and also carried out meta‐analysis for the two studies reporting change scores using the SMD (Forest 2006 (MD‐23); Herrmann 2012 (10158)) (Analysis 3.2).
-
Meta‐analysis of 2 studies in 306 participants: moderate‐certainty evidence (downgraded once for imprecision) gave an SMD of 0.11 (‐0.12 to 0.33).
-
Meta‐analysis of 2 studies in 422 participants: moderate‐certainty evidence (downgraded once for inconsistency; I² = 48% and P = 0.16) gave a mean difference of ‐0.50 (‐4.71 to 3.71) (random effects).
-
The 24‐week study (1 study in 273 participants): low‐certainty evidence (downgraded once for imprecision and once for inconsistency with the other studies) gave an MD of 0.90 (95% CI ‐1.29 to 3.09) on the CMAI long form scale (range 29 ‐ 203, with a clinically important difference of about 40), i.e. no difference between interventions (Herrmann 2012 (10158)).
-
Baseline levels were: 43.3 and 41.3 (Forest 2006 (MD‐23)); 68.3 for both groups (Fox 2012 (MAGD)); and 46.8 and 47.0 (Herrmann 2012 (10158)).
-
There was no inconsistency between the two studies in people receiving concomitant ChEI.
-
-
NPI subscale for agitation–aggression (Analysis 3.3); this outcome was only reported for the short‐term studies ‐ very low‐certainty evidence (downgraded once each for risk of bias, imprecision and indirectness): meta‐analysis of 2 studies in 146 participants gave an MD of ‐0.39 (95% CI ‐1.90 to 1.13) (Forest 2006 (MD‐23); Fox 2012 (MAGD)).
Two studies also reported the proportion with agitation as a treatment emergent adverse event (TEAE); a risk ratio (RR) less than 1 means the effect favours memantine.
-
Proportion with agitation as a TEAE (Analysis 3.4).
-
Meta‐analysis of 2 studies in 403 participants, 24 events, participants in both studies receiving concomitant ChEI: low‐certainty evidence (downgraded for imprecision twice) gave a RR of 2.39 (95% CI 1.04 to 5.50). This effect was consistent across the two studies (I² = 0%, P = 0.60).
-
The 24‐week study (369 participants, 22 events): low‐certainty evidence (downgraded on imprecision twice) gave a RR of 2.20 (95% CI 0.92 to 5.27), i.e. about twice as many participants on memantine and ChEI had agitation compared with participants on ChEI plus placebo.
-
Results for the four other efficacy outcomes are shown below. All are reported as negative outcomes; a negative SMD (or MD) value means that the effect favours memantine.
-
Clinical global rating (Analysis 3.5).
-
Meta‐analysis of 3 studies in 443 participants: low‐certainty evidence (downgraded for inconsistency and imprecision) gave an SMD (random effects) of ‐0.11 (95% CI ‐0.34 to 0.13). There is heterogeneity in the point estimates between the 12‐week and 24‐week studies (although I² = 25%, P = 0.26).
-
The 24‐week study (275 participants): low‐certainty evidence (downgraded on inconsistency with other studies and imprecision) gave an MD of 0.05 (95% CI ‐0.25 to 0.35) for the CIBIC+ scale.
-
-
Cognitive function; SIB (Analysis 3.6).
-
The two studies gave very different results.There is substantial heterogeneity (I² = 90%, P = 0.002), and therefore results are reported separately.
-
At 12 weeks (1 study, 129 participants): the MD is ‐10.00 (95% CI ‐16.15 to ‐3.85).
-
The 24‐week study (324 participants): very low‐certainty evidence (downgraded twice on inconsistency with the other study and imprecision) gave an MD of 0.48 (95% CI ‐1.61 to 2.57).
-
-
Decline in ADL; ADCS‐ADL19 (Analysis 3.7).
-
Meta‐analysis of 2 studies in 309 participants receiving ChEI: low‐certainty evidence (downgraded once for imprecision and once overall for some inconsistency and risk of bias (baseline difference)): gave an MD of 1.48 (95% CI ‐0.19 to 3.15). There was heterogeneity in the point estimates (although I² = 0%, P = 0.40).
-
The 24‐week study (276 participants): low‐certainty evidence (downgraded for risk of bias and imprecision) gave an MD of 1.80 (95% CI ‐0.03 to 3.63). The difference at baseline for that study (276 participants) was 1.10 units lower for memantine (i.e. memantine more severe) (Herrmann 2012 (10158)),
-
-
Behaviour and mood, NPI total (Analysis 3.8).
-
Meta‐analysis of 3 studies in 470 participants: very low‐certainty evidence (downgraded once each for risk of bias (baseline difference), inconsistency and imprecision): gave a random effects MD of ‐1.51 (95% CI ‐8.05 to 5.03). There was heterogeneity in both the 12‐week studies' subgroup (I² = 57%, P = 0.13) and overall (I² = 62%, P = 0.07), but no differences between durations. In each study there were large baseline differences between the values for memantine and placebo, which for two studies were comparable with the effect estimate.
-
The 24‐week study (324 participants): very low‐certainty evidence (downgraded on imprecision, inconsistency and risk of bias) gave an MD of 1.23 (95% CI ‐2.19 to 4.65). The difference in NPI at baseline for that study was 1.70 units higher for memantine (i.e. more severe), which is larger than the effect estimate.
-
-
All‐cause discontinuation, discontinuation due to adverse events, adverse events and serious adverse events are reported in section 5.
The results for studies with and without patients with agitation are compared in Table 10.
| Patients not selected for agitation (with moderate‐to‐severe AD) | Patients selected for agitation | |||||
| With / without ChEI | No ChEI | With ChEI | With / without ChEI, mainly with | With ChEI | With / without ChEI ‐ | |
| Clinical global (SMD) | ‐0.20 (‐0.28 to ‐0.13) n = 10 studies; 2797 patients I² = 0%, P = 0.86 | ‐0.20 (‐0.30 to ‐0.10) n = 7; 1672 patients I² = 0%, P = 0.88 | ‐0.21 (‐0.32 to ‐0.09) n = 3; 1125 patients I² = 13%, P = 0.32 | ‐0.11 (‐0.34 to 0.13) n = 3; 443 patients I² = 25%, P = 0.26 | 0.04 (‐0.20 to 0.28) n = 1; 324 patients | ‐0.28 (‐0.59 to 0.02) n = 2; 168 patients I² = 0%, P = 0.96 |
| Cognitive function (SMD) | ‐0.28 (‐0.35 to ‐0.21) n = 13; 3337 patients I² = 30%, P = 0.14 | ‐0.33 (‐0.43 to ‐0.23) n = 8; 1485 patients I² = 41%, P = 0.11 | ‐0.24 (‐0.33 to ‐0.14) n = 6; 1852 patients I² = 13%, P = 0.33 | Not pooled I² = 90%, P = 0.002 | 0.05 (‐0.17 to 0.27) n = 1, 324 patients | ‐0.56 (‐0.92 to ‐0.21) n = 1; 129 patients (with ˜20% ChEI) |
| Decline in ADL (SMD) | ‐0.17 (‐0.24 to ‐0.09) n = 11; 2687 patients I² = 0%, P = 0.582 | ‐0.20 (‐0.30 to ‐0.09) n = 7; 1368 patients I² = 10%, P = 0.36 | ‐0.13 (‐0.24 to ‐0.03) n = 5; 1319 patients I² = 0%, P = 0.69 | 0.21 (‐0.02 to 0.43) n = 2; 309 patients I² = 0%, P = 0.40 | 0.23 (‐0.01 to 0.47) n = 1; 276 patients | ‐0.02 (‐0.70 to 0.67) n = 1; 33 patients (with ChEI) |
| Behaviour and mood (SMD) | ‐0.14 (‐0.21 to ‐0.08) n = 14; 3674 patients I² =6%, P = 0.39 | ‐0.10 (‐0.19 to ‐0.01) n = 9; 1819 patients I² = 0%, P = 0.46 | ‐0.18 (‐0.27 to ‐0.09) n = 6; 1855 patients I² = 10%, P = 0.35 | ‐0.07 (‐0.41 to 0.27) n = 3; 470 patients I² = 62%, P = 0.07 | 0.08 (‐0.14 to 0.30) n = 1; 324 patients | ‐0.20 (‐0.69 to 0.29) n = 2; 146 patients I² = 43%, P = 0.19 |
| CMAI (SMD) | ‐0.21 (‐0.45 to 0.04) n = 1; 261 patients | 0.11 (‐0.12 to 0.33) n = 2; 306 patients I² = 0%, P = 0.77 | 0.10 (‐0.14 to 0.33) n = 1; 273 patients | CMAI (final values): SMD: ‐0.19 (‐0.52 to 0.13) CMAI (community): SMD: 0.21 (‐0.48 to 0.89) n = 1; 33 patients | ||
| Proportion with agitation (RR) | 0.76 (0.601 to 0.96) 6 studies; 2 241 patients I² = 0%, P = 0.67 | 0.68 (0.51, 0.91) 4 studies; 1016 patients I² = 0%, P = 0.59 | 0.92 (0.54 to 1.31) 3 studies; 1225 patients I² = 0% and 0.85 | RR 2.39 (1.04 to 5.50) 2 studies; 403 patients I² = 0%, P = 0.60 | 2.20 (0.92 to 5.27) 1 study; 369 patients | 5.00 (0.26 to 97.00) 1 study; 34 patients (with ChEI) |
1.4.2. Summary of results transformed to an appropriate scale
The evidence was mainly of low or very low certainty for this patient group. Three studies in around 550 participants compared memantine and placebo in people with moderate‐to‐severe disease with agitation, but only one of these studies had a duration of six to seven months (Herrmann 2012 (10158)). One of the short‐term studies had more severe agitation at baseline compared with the other two studies, and this same study only had 20% of participants on ChEIs (Fox 2012 (MAGD)), whereas the other two studies had all on ChEIs. For the outcomes of CMAI, clinical global and cognitive function, there is inconsistency between the 24‐week and 12‐week studies. For these outcomes, we reported the meta‐analysis results and also gave the results for the 24‐week study alone, with the evidence for the latter downgraded due to inconsistency with the other study results. The results are summarised below in terms of relative improvement for memantine versus placebo for consistency with the other summary sections.
Low‐certainty evidence from one study in 275 people suggested there may have been no difference between memantine and placebo, either for clinical global rating: MD (relative improvement) = ‐0.05 CIBIC+ points, 95% CI ‐0.35 to 0.25; or for cognitive function: MD (relative improvement) = ‐0.48, 95% CI ‐2.57 to 1.61. For performance on ADL, there may be no difference between memantine (with ChEI) and placebo (with ChEI): MD (relative improvement) = ‐1.48 ADL19 points, 95% CI ‐3.15 to 0.19 (2 studies in 309 people). It is very uncertain whether there is a difference between memantine and placebo for the behaviour and mood outcome: MD (relative improvement) = +1.51 NPI points, 95% CI ‐5.03 to 8.05.
Regarding agitation, there is moderate‐certainty evidence from two studies (422 participants) to suggest there is probably no difference between memantine and placebo on the agitation CMAI scale: MD (relative improvement) = 0.50 CMAI points, 95% CI ‐3.71 to 4.71: this is a very small change for the CMAI scale. The evidence on the NPI agitation–aggression subscale was not reported (although measured) for the 24 week study and the remaining evidence is of very low certainty.
The proportion reporting agitation as a TEAE in two studies (403 participants) may be doubled in those receiving memantine (plus ChEI) compared with placebo (plus ChEI) (RR 2.39, 95% CI 1.04 to 5.50). We assume that the proportion with agitation reflects increases in the severity of agitation in this patient group; baseline levels were not reported, but the proportions at 24 weeks in the two groups in the larger study were relatively small (8% for memantine and 4% placebo) (Herrmann 2012 (10158)). These proportions are similar to the ranges for the moderate‐to‐severe AD groups (0% to18% memantine and 3% to 22% placebo). Additionally, the larger study reported differences at baseline ‐ the memantine group had higher levels of antipsychotic medication (24% versus 20%) and there was a centre effect (Herrmann 2012 (10158)).
There are similar numbers of people with adverse events in both groups, and memantine (compared with placebo) probably shows little difference in the number of people discontinuing treatment (RR 1.10, 95% CI 0.79 to 1.52, which corresponds to 17 fewer per 1000, 95% CI 36 fewer to 89 more).
1.5. Effect of memantine 20 mg in people with mild AD at six months
1.5.1. Effect of memantine versus placebo in people with mild AD
Four studies contributed data from post‐hoc subgroups (Bakchine 2008 (99679) SG; Dysken 2014 SG; Peskind 2004 (MD‐10) SG; Porsteinsson 2008(MD‐12)S); (see section Subgroup analysis and investigation of heterogeneity). Of the 1396 participants analysed in the four mild‐to‐moderate AD trials, 621 (44%) had mild AD. Two studies gave concomitant ChEIs (Dysken 2014 SG, Porsteinsson 2008(MD‐12)S). One additional study recruited 26 participants with mild AD and reported cognitive function at 12 months ((Holland 2013)). One further study in 195 participants was considered in sensitivity analyses because it had a mean MMSE score of around 22 and the participants were anti‐dementia treatment naive (Peters 2015 (MEGACOMBI2)). The addition of this study reinforced the efficacy results (see Appendix 4.5.2).
The evidence for this section is summarised in the additional summary of findings Table 6. Results are shown below; a negative SMD (or MD) value means that the effect favours memantine.
-
Clinical global rating, CIBIC+ (Analysis 4.1): low‐certainty evidence (downgraded once on risk of bias because post‐hoc subgroups and once on imprecision): meta‐analysis of 3 studies in 427 participants gave an MD of ‐0.09 (95% CI ‐0.30 to 0.12).
-
Cognitive function, ADAS‐Cog (Analysis 4.2): moderate‐certainty evidence (downgraded once on risk of bias): meta‐analysis of 4 studies in 619 participants gave an MD of ‐0.21 (95% CI ‐1.38 to 0.95).
-
Decline in ADL, ADCS‐ADL23 (Analysis 4.3): moderate‐certainty evidence (downgraded once on risk of bias): meta‐analysis of 4 studies in 621 participants gave an MD of 0.07 (95% CI ‐1.66 to 1.80). There was some heterogeneity in point estimates (but I² = 3%, P = 0.38).
-
Behaviour and mood, NPI (Analysis 4.4): moderate‐certainty evidence (downgraded once on risk of bias): meta‐analysis of 4 studies in 621 participants gave an MD of 0.29 (95% CI ‐1.58 to 2.16).
One additional trial was conducted in 26 participants with mild AD, but only gave data for MMSE ‐ and only final values were reported at 12 months (Holland 2013). Very low‐certainty evidence (downgraded for imprecision (twice) and indirectness) gave an MD (negative outcome) of ‐1.15 (95% CI ‐3.47 to 1.17), favouring memantine, however, the baseline difference was ‐0.46. Addition of the Peters 2015 (MEGACOMBI2) study to the meta‐analyses for cognitive function and decline in ADL showed very similar SMD results, but narrower CIs (Appendix 4.5.2).
All‐cause discontinuation, discontinuation due to adverse events and adverse events are reported in section 5. Serious adverse events were not reported separately for people with mild dementia.
1.5.2. Summary of results transformed to an appropriate scale
The results are summarised in terms of the relative improvement for memantine versus placebo, for consistency with the other summary sections. Mainly moderate‐certainty evidence based on post‐hoc subgroups from up to four studies in around 600 participants suggests there is probably no difference between memantine and placebo for three of the efficacy outcomes: cognitive function: MD (relative improvement) = 0.21 ADAS‐Cog points, 95% CI ‐0.95 to 1.38; performance on ADL: MD (relative improvement): ‐0.07 ADL 23 points, 95% CI ‐1.80 to 1.66; and behaviour and mood: MD (relative improvement) = ‐0.29 NPI points, 95% CI ‐2.16 to 1.58, and there may be no difference for clinical global rating: MD (relative improvement) = 0.09 CIBIC+ points, 95% CI ‐0.12 to 0.30 (low‐certainty evidence) (Table 6).
For the cognitive function and behaviour and mood outcomes, we observed an average improvement over time for the placebo groups, but little or no change over time for the decline in ADL and clinical global outcomes (Appendix 4.5.2.2): for placebo, the median of the standardised mean change from baseline was: cognitive function ‐0.20, range ‐0.38 to 0.11 and behaviour and mood ‐0.16, range ‐0.33 to ‐0.10). This improvement with placebo is in contrast to the results for people with moderate‐to‐severe disease (see section 1.2.2 and Appendix 4.5.2.2).
There are similar numbers of people with adverse events in both groups, but memantine (compared with placebo) may give an increase in the number of people discontinuing treatment because of adverse events: RR 2.12 (95% CI 1.03 to 4.39), which corresponds to 33 more per 1000 (95% CI 1 to 100 more). The evidence is of very low certainty regarding all‐cause discontinuation (74 more people per 1000 discontinued treatment, 95% CI 8 to 181 more), and agitation was not reported in these studies.
2. Vascular dementia
2.1. Effect of memantine in people with mild‐to‐moderate vascular dementia at six to seven months; OC or per protocol
2.1.1 Effect of memantine (20 mg/day) versus placebo
Three studies randomised 956 participants with vascular dementia (Merz 2003 (MRZ‐9206); Orgogozo 2002 (9408); Wilcock 2002 (9202)); but only two of these contributed data (Orgogozo 2002 (9408); Wilcock 2002 (9202); 900 randomised participants). Both studies were in people with mild‐to‐moderate dementia, and neither study appeared to allow concurrent ChEIs. Participants were randomised to 20 mg/day memantine versus placebo for 28 weeks. The two studies used different scales for each outcome except cognitive function (for which both studies used ADAS‐Cog). The decline in ADL, and the behaviour and mood outcomes used the Nurse's Observational Scale for Geriatric Patients (NOSGER) subscales (Appendix 2), but one study used the revised version (NOSGER II) and were presented as per protocol analyses (Wilcock 2002 (9202)). Consequently, we analysed all outcomes as SMD, with the exception of cognitive function.
The evidence for this section is summarised in summary of findings Table 2, which covers both efficacy and safety outcomes.
Results are shown below; a negative SMD (or MD) value means that the effect favours memantine.
-
Clinical Global (Analysis 5.1): moderate‐certainty evidence (downgraded for inconsistency): meta‐analysis of 2 studies in 757 analysed participants gave a random effects SMD of ‐0.02 (95% CI ‐0.23 to 0.19). There is some heterogeneity (I² = 48%, P = 0.16).
-
Cognitive function, ADAS‐Cog (Analysis 5.2): moderate‐certainty evidence (downgraded for risk of bias): meta‐analysis of 2 studies in 569 participants gave an MD of ‐2.15 (95% CI ‐3.25 to ‐1.05). There is some heterogeneity in the point estimates (and I² = 12%, P = 0.29), but this was insufficient to downgrade on inconsistency.
-
Decline in ADL on the NOSGER self‐care subscale (Analysis 5.3): low‐certainty evidence (downgraded twice overall for risk of bias and unclear scale direction for one study): meta‐analysis of 2 studies in 542 participants gave an SMD of ‐0.04 (95% CI ‐0.20 to 0.13).
-
Behaviour and mood on the NOSGER disturbing behaviour subscale (Analysis 5.4): low‐certainty evidence (downgraded twice for risk of bias): meta‐analysis of 2 studies in 541 participants gave an SMD of ‐0.20 (95% CI ‐0.37 to ‐0.03).
Post‐hoc subgroup analyses by severity were also conducted for an FDA report for the cognitive function outcome: results were reported for both trials, separated at an MMSE score of 14 into mild‐to‐moderate and moderate‐to‐severe. Analysis 5.5 (fixed effect) shows the test for subgroup differences to be significant (I² = 72.5, P = 0.06), with a bigger effect in the moderate‐to‐severe subgroup (ADAS‐Cog MD ‐4.51, 95% CI ‐7.21 to ‐1.81) than in the mild‐to‐moderate subgroup (MD ‐1.64, 95% CI ‐2.83 to ‐0.45).
2.1.2. Summary of results transformed to an appropriate scale
Moderate‐ and low‐certainty evidence from two studies in around 750 participants with vascular dementia gave mixed results for the comparison of memantine and placebo. There is probably a small clinical benefit for cognitive function: MD benefit = 2.15 ADAS‐Cog points, 95% CI 1.05 to 3.25, and there may be a small clinical benefit on the NOSGER disturbing behaviour outcome: MD benefit = 0.47 NOSGER points, 95% CI 0.07 to 0.87. However, there is probably no difference between memantine and placebo in clinical global rating: MD benefit = 0.03 CIBIC+ points, 95% CI ‐0.28 to 0.34, and there may be no difference in performance on ADL: MD benefit = 0.11 NOSGER II self‐care subscale points, 95% CI ‐0.35 to 0.54.
There are similar numbers of people with adverse events in both groups, and there may be no difference in the numbers of people discontinuing treatment RR 1.05 (95% CI 0.83 to 1.34), which corresponds to 11 fewer people per 1000 (95% CI 37 fewer to 74 more). There may be fewer people with agitation as an adverse event for memantine compared with placebo RR 0.57 (95% CI 0.33 to 0.97) (i.e., 33 fewer per 1000, 95% CI 2 to 52 fewer).
A post‐hoc subgroup analysis by severity suggested that memantine (versus placebo) may have had a bigger effect for cognitive function in people with moderate‐to‐ severe vascular dementia (MMSE ≥14) than in people with mild‐to‐moderate vascular dementia. The test for subgroup differences was significant (I² = 72.5%, P = 0.06), although this was a post‐hoc analysis.
3. Other forms of dementia
3.1. Effect of memantine in people with Parkinson’s disease dementia (PDD) or dementia Lewy bodies (DLB)
3.1.1. Effect of memantine (20 mg/day) versus placebo
Four studies in 319 randomised participants with PDD or DLB met the inclusion criteria (Aarsland 2009; Emre 2010 (11018); Leroi 2009; Marsh 2009 PDD); two studies were solely in participants with PDD (Leroi 2009;Marsh 2009 PDD); and the other two were in a mixed PDD–DLB population: one study had more PDD participants (memantine group 50%, placebo 61%) (Aarsland 2009); and the other had 65% with PDD in the memantine group and 59% in the placebo group (Emre 2010 (11018)). The severity of dementia was mild‐to‐moderate, with mean MMSE scores of ˜22 (Marsh 2009 PDD); ˜21 (Emre 2010 (11018)); ˜20 (Aarsland 2009); and ˜19 (Leroi 2009). Some studies gave the participants concomitant ChEIs: one study had 47% in the memantine group and 63% for placebo (Aarsland 2009); one did not permit ChEIs (Emre 2010 (11018)); one had 18.2% (memantine) and 14.2% (placebo) (Leroi 2009); and the other did not state the proportions (Marsh 2009 PDD). Only one study reported OC results (Emre 2010 (11018)). All outcomes were analysed as SMD apart from cognitive function and behaviour–mood. One study reported results at 16 weeks (Leroi 2009); the others were at 24 weeks. We report results for the 24‐week studies, unless there was only one 24‐week study, in which case the 16‐week study was considered.
The evidence for this section is summarised in 'Summary of findings' Table 7, which covers both efficacy and safety outcomes. Results are shown below; a negative SMD (or MD) value means that the effect favours memantine.
-
Clinical Global (Analysis 6.1): low‐certainty evidence (downgraded once each for risk of bias and imprecision): meta‐analysis of 3 studies in 243 participants gave an SMD of ‐0.35 (95% CI ‐0.60 to ‐0.09). There was a little heterogeneity in the point estimates (I² = 15%, P = 0.31).
-
Cognitive function, MMSE (Analysis 6.2): very low‐certainty evidence (downgraded once each for risk of bias, inconsistency with the 16‐week study and imprecision): one study in 63 participants gave an MD of ‐1.90 (95% CI ‐3.73 to ‐0.07). There was substantial heterogeneity between this study and the study reporting results at 16 weeks (I² = 75%, P = 0.05).
-
Decline in ADL (Analysis 6.3): very low‐certainty evidence (downgraded once each on risk of bias, inconsistency and imprecision): meta‐analysis of 3 studies in 243 participants gave a random effects SMD of ‐0.27 (95% CI ‐0.65 to 0.11). There was some heterogeneity (I² = 40%, P = 0.19).
-
Behaviour and mood, NPI (Analysis 6.4): low‐certainty evidence (downgraded once on each of risk of bias and imprecision or inconsistency): meta‐analysis of 3 studies in 242 participants) gave a random effects MD of ‐2.18 (95% CI ‐5.57 to 1.21). There was some heterogeneity in the point estimates (I² = 20%, P = 0.29).
-
All‐cause discontinuation, discontinuation due to adverse events, adverse events and serious adverse events are reported in section 5.
3.1.2. Summary of results transformed to an appropriate scale
Low‐ and very low‐certainty evidence from up to 3 studies in around 250 participants suggested that, for memantine versus placebo in people with PDD or DLB, there may be a small clinical benefit in clinical global rating (MD benefit: 0.49 CIBIC+ points, 95% CI 0.13 to 0.83) and in behaviour and mood (although the confidence interval was consistent with both no effect and benefit) (MD benefit: 2.18 NPI points, 95% CI ‐1.21 to 5.57). Evidence for all other efficacy outcomes is of very low certainty. There may be fewer people discontinuing treatment RR 0.84 (95% CI 0.55 to 1.28), which corresponds to 32 fewer per 1000 (95% CI 90 fewer to 56 more).
3.2. Effect of memantine in people with frontotemporal dementia (FTD)
3.2.1. Effect of memantine (20 mg/day) versus placebo in people with FTD
Two studies in 133 randomised participants with FTD were included (Boxer 2013; Vercelletto 2011). Both studies were in people with mild dementia and both prohibited the use of ChEIs. One study (52 participants) reported at 52 weeks (Vercelletto 2011), and the other (81 participants) at 26 weeks (Boxer 2013); both are included in the meta‐analyses, but where there was heterogeneity, we reported only the 26‐week (single study) results.
The evidence for this section is summarised in 'Summary of findings' Table 8, which covers both efficacy and safety outcomes. Results are shown below; a negative SMD (or MD) value means that the effect favours memantine.
-
Clinical global rating (Analysis 7.1): low‐certainty evidence (downgraded once each for risk of bias and imprecision): meta‐analysis of 2 studies in 117 participants gave an SMD of ‐0.31 (95% CI ‐0.67 to 0.06). The single study at 26 weeks (76 participants) had an MD (CGIC) of ‐0.40 (95% CI ‐1.23 to 0.43) (low‐certainty evidence).
-
Cognitive function, MMSE (Analysis 7.2): very low‐certainty evidence (downgraded twice for imprecision and once for inconsistency): meta‐analysis of 2 studies in 122 participants gave a random effects MD (negative outcome is an improvement) of ‐0.23 (95% CI ‐2.03 to 1.56). The single study at 26 weeks (81 participants) had an MD of 0.30 (95% CI ‐1.23 to 1.83), low‐certainty evidence (downgraded twice for imprecision).
-
Decline in ADL ‐ outcome reported only for one study (Vercelletto 2011), as the percentage DAD score = yes
-
Behaviour and mood, NPI (Analysis 7.3): low‐certainty evidence (downgraded twice overall for imprecision and some inconsistency): meta‐analysis of 2 studies in 115 participants gave an MD of ‐3.16 (95% CI ‐8.06 to 1.74). For the single study at 26 weeks: MD (NPI) = ‐2.20 (95% CI ‐8.01 to 3.61) (low‐certainty evidence (downgraded twice on imprecision)).
-
All‐cause discontinuation, discontinuation due to adverse events, adverse events and serious adverse events are reported in section 5.
3.2.2 Summary of results transformed to an appropriate scale
Mainly low‐certainty evidence from 2 studies in around 120 participants suggests there may be a small clinical benefit in clinical global rating (MD benefit: 0.56 CGIC points, 95% CI ‐1.21 to 0.11) and in behaviour and mood (MD benefit: 3.16 NPI points, 95% CI ‐3.61 to 8.01) for memantine versus placebo in people with FTD. There may be no difference in cognitive function (MD benefit for one study: ‐0.30 MMSE points, 95% CI ‐1.83 to 1.23). However, for all of the efficacy outcomes, there is uncertainty and the confidence interval is consistent with more than one conclusion. There may be more discontinuation in the memantine group (compared with placebo) for this population (RR 1.54, 95% CI 0.54 to 4.06).
3.3. Effect of memantine in people with AIDS‐related dementia complex (ADC)
Only one study currently fulfilled the inclusion criteria of this review with regard to the use of memantine in ADC ((Schifitto 2007)). The study randomised a total of 140 participants to 40 mg/day memantine or placebo. Only the cognitive function outcome was reported for 48 and 45 participants, respectively, as measured by a summary neuropsychological test score, averaged over eight measures (NPZ‐8). The authors reported the percentage improvement from baseline at 16 weeks: MD 43.0% (95% CI ‐19.2 to 105.2), in favour of memantine (low‐certainty evidence because of imprecision).
The number of adverse events (not the number of participants with adverse events) were similar in each arm: 116 in the memantine arm and 106 in the placebo arm. low‐certainty evidence (downgraded twice for imprecision) suggested that for all‐cause discontinuation, there may be no difference between memantine and placebo (1 study 140 participants, 28 events) RR 1.00 (95% CI 0.52 to 1.94). Similarly for discontinuation due to adverse events (1 study 140 participants, 14 events) RR 1.00 (95% CI 0.37 to 2.70). Further investigation into the use of memantine in ADC would be warranted.
4. Comparison of effects in different types of dementia
4.1 Memantine versus placebo, all severities ‐ efficacy analyses at six‐seven months
The results of the efficacy analyses for six to seven months for each type of dementia, separated by severity are summarised in Analysis 8.1; Analysis 8.2; Analysis 8.3; Analysis 8.4. These analyses only include studies with a duration of six to seven months, so some types of dementia are represented only by single studies: AD with agitation (Herrmann 2012 (10158)); FTD (Boxer 2013); and, for cognitive function, PDD or DLB (Aarsland 2009).
The evidence for AD (apart from the studies in people with agitation) was mainly of high certainty and moderate for the mild subpopulation. The evidence certainty was moderate to low for vascular dementia and mainly low for FTD. For PDD or DLB and AD participants with agitation, the evidence certainty was low or very low.
Within these limitations, the following observations can be made for the efficacy outcomes; this section does not further address evidence certainty.
Clinical global rating (Analysis 8.1): memantine (versus placebo) gives a small improvement in clinical global rating in all types and severities of dementia, with the exception of AD with agitation (single study) and vascular dementia. In the latter two types, there seems to be no difference between memantine and placebo. There may be a smaller effect in people with mild AD than in people with moderate‐to‐severe AD, but severity does not seem very important for this outcome.
Cognitive function: memantine (versus placebo) gives an improvement in cognitive function for AD (moderate‐to‐severe), vascular dementia and PDD or DLB (single study). Single studies in people with AD plus agitation and FTD suggested there may have been no difference between interventions. There is a significantly larger effect of memantine (versus placebo) in the moderate‐to‐severe AD population compared with that in mild AD ‐ such that memantine probably has no effect on cognitive function in people with mild AD, whereas an effect is observed in the moderate‐to‐severe population. The effect size in mild‐to‐moderate DLB or PDD (single study) and in mild‐to‐moderate vascular dementia appears to be similar to that in moderate‐severe AD (Analysis 8.2). Further trends towards increased efficacy with severity are indicated in Analysis 5.5 for vascular dementia and (Appendix 4) for AD.
Decline in ADL (Analysis 8.3): memantine (versus placebo) gives an improvement in performance on ADL in AD (moderate‐to‐severe) and PDD or DLB, but there may be no effect in vascular dementia and a deterioration in ADL performance for AD with agitation (single study). There is a significantly larger effect of memantine (versus placebo) in participants with moderate‐to‐severe AD compared with mild AD ‐ such that memantine probably has no effect on ADL in people with mild AD, but a small effect in people with moderate‐to‐severe AD. The effect in mild‐to‐moderate DLB or PDD again appears to be similar to that in moderate‐to‐severe AD.
Behaviour and mood (Analysis 8.4): memantine (versus placebo) appears to give an improvement in behaviour and mood for all types of dementia, with the exception of mild AD and AD with agitation (single study), for which there may be no difference between interventions. There is a significantly larger effect of memantine (versus placebo) in participants with moderate‐to‐severe AD versus mild AD ‐ such that memantine probably has no effect on behaviour and mood in people with mild AD. The effect in each of the other types of dementia (vascular dementia, DLB or PDD and FTD (one study) for mild‐to‐moderate dementia appears to be similar to that in moderate‐to‐severe AD (Analysis 8.4). There appears to be a trend towards increased efficacy with increased severity (Appendix 4), but this was an aggregate level subgroup analysis.
Agitation: the CMAI score has been compared in a limited way between AD patients, with versus without agitation at baseline (Table 10). Memantine (versus placebo) appears to result in fewer people with agitation in most types of dementia, with the exception of AD patients with agitation, for which memantine may give more severe agitation (Analysis 8.5) (see section 5.2.3 below). The effect on agitation of memantine versus placebo appears to be larger in people with moderate‐to‐severe AD compared with mild‐to‐moderate AD (Analysis 8.5), and also seems more effective in monotherapy compared with concomitant ChEI (Analysis 8.6). Results for this outcome were not given for the mild post‐hoc subgroup.
5. Adverse effects
We report results for all types of dementia and all durations for the 20 mg/day dose or equivalent. Forty‐one studies met these dose inclusion criteria in 8960 randomised participants. However, not all studies reported all outcomes and four of these remaining studies did not report any safety outcomes (Lundbeck 2006 (99817); Merz 2003 (MRZ‐9104); Merz 2003 (MRZ‐9105); Merz 2003 (MRZ‐9206)).
5.1. All‐cause discontinuation and discontinuation due to adverse events
The results of the discontinuation analyses for all studies are shown in Analysis 9.1 and Analysis 9.2, regardless of study duration, but split by dementia type and severity in Analysis 8.7 and Analysis 8.8 (three studies in mild‐to‐moderate disease were excluded from this analysis: Asada 2011 (MA3301); Peters 2015 (MEGACOMBI2); Schmidt 2008. Differences between studies in participants with or without ChEI are shown in Analysis 2.9 and Analysis 2.10 (for which three studies were excluded from the analysis because a proportion of participants were treated with ChEI ‐ Hofbauer 2009 (MD‐71); Holland 2013; Wilkinson 2012 (10112)); all study durations were permitted.
5.1.1. All‐cause discontinuation
All‐cause discontinuation was reported in 36 studies that included 8752 participants (1600 events). Overall, there is no difference between memantine and placebo: RR 0.99 (95% CI 0.91 to 1.08) (Analysis 9.1). There may be slight heterogeneity in the point estimates, but I² = 0%, P = 0.79. However, Analysis 8.7 suggests there are differences across dementia types and severities, and this is reinforced in AD, which shows a highly significant result in the test for subgroup differences (I² = 83.8% and P = 0.01) when comparing mild disease (RR 1.74, 95% CI 1.08 to 2.81) and moderate‐to‐severe disease (RR 0.93, 0.83 to 1.04).
We therefore report the results for this outcome separately for each dementia type and severity in the 'Summary of findings' tables for sections 1 to 3. For the moderate‐to‐severe AD group, there was no significant difference between the results for monotherapy and those for concomitant ChEI (Analysis 2.9) and so we report the combined moderate‐to‐severe results (test for subgroup differences I² = 0%, P = 0.83).
5.1.2. Discontinuation due to adverse events
Discontinuation due to adverse events was reported in 32 studies that included 8271 participants (779 events). Overall, there is little difference between memantine and placebo: RR 1.06 (95% CI 0.92 to 1.21) (Analysis 9.2). There is some heterogeneity in the point estimates, but I² = 0%, P = 0.64. Analysis 8.8 suggests there may be differences in discontinuation due to adverse events across dementia types and severities, and for AD there is a significant result in the test for subgroup differences between mild and moderate‐to‐severe disease (I² = 78.5% and P = 0.03). For the moderate‐to‐severe subgroup, there is no difference between the results for monotherapy and those for concomitant ChEI (Analysis 2.10; test for subgroup differences: I² = 0%, P = 0.65).
A previous finding of this review was that all‐cause discontinuation appeared to be less in participants taking memantine. This is only partially supported in this update by the six‐month trials of moderate‐to‐severe AD, which suggest a slight benefit (Analysis 1.5). However, for populations in which memantine has little effectiveness, there may be more people discontinuing the drug compared with placebo.
5.2. Adverse events
The adverse effects profile and tolerability were good.
5.2.1. Number with at least one adverse event
Twenty‐nine studies (of 41 possible) in 8033 participants reported the number of participants with at least one adverse event (Analysis 9.3); this is 90% of the available participants. Meta‐analysis showed no difference between memantine and placebo, which appeared consistent across studies: RR 1.03 (95% CI 1.00 to 1.06), I² = 0%, P = 0.60 (5371 events).
Analysis 8.9 shows a subgroup analysis by severity (mild‐to‐moderate and moderate‐to‐severe) and type of dementia and there are no significant differences between subgroups. Sensitivity analysis, excluding studies at overall high risk of bias had little effect. An analysis of studies in AD patients with moderate‐to‐severe disease and without agitation at baseline showed there is no significant difference between the results for monotherapy (RR 0.99, 95% CI 0.94 to 1.04) and those for concomitant ChEI (RR 1.05, 95% CI 0.98 to 1.12). (Analysis 2.11). The test for subgroup differences was I² = 46.0%, P = 0.17), but this is probably due to the narrow confidence intervals as a consequence of a large number of participants, On the basis of the similarity of the different subgroup findings, we used AE results for the full dataset for every type and severity of dementia.
5.2.2. Number with at least one serious adverse event
Twenty‐seven studies in 8138 participants reported the number with at least one serious adverse event (Analysis 9.4); this was 93% of all available participants. Meta‐analysis shows little difference between memantine and placebo: RR 0.92 (95% CI 0.83 to 1.02), I² = 0%, P = 0.71 (1157 events). Analysis 8.10 shows subgroups by both type and severity of dementia. There appear to be some differences by type of dementia, but no dependence on severity amongst the AD studies without agitation. Additionally, there is no significant difference between the results for monotherapy and those for concomitant ChEI in people with moderate‐to‐severe disease (Analysis 2.12). Therefore, in sections 1 to 4 we report this outcome separately for the different types of dementia, but combine the results for the AD studies (apart from those with agitation).
5.2.3. Number with agitation as an adverse event
Nineteen studies in 5933 participants reported the number of participants with agitation (Analysis 9.5); this was 68% of all available participants. Data on agitation were mainly reported as 'serious adverse events' or 'adverse events' in ClinicalTrials.gov or as registry data (see footnotes to the forest plots). Meta‐analysis suggests that fewer participants have agitation if they are taking memantine compared with placebo: RR 0.84 (95% CI 0.71 to 1.01) (424 events). There is some heterogeneity, I² = 32%, P = 0.09. Subgrouping by severity and type of dementia in Analysis 8.5 showed there were some differences by type of dementia, but the subdivision into mild‐to‐moderate and moderate‐to‐severe AD is not warranted, particularly because it was dependent on one study in people with moderate AD ((Wilkinson 2012 (10112)). There are no agitation data for the post‐hoc subgroups of mild and moderate AD.
In the AD population with agitation at baseline, there may be twice as many participants with agitation as a treatment emergent adverse event at six months for memantine compared with those on placebo, whereas memantine appears to be protective for agitation in people with AD without agitation at baseline (test for subgroup differences I² = 84%, P = 0.01) (Analysis 8.5) (low‐certainty evidence).
There may be different effects in the presence compared with the absence of ChEIs (Analysis 2.13; test for subgroup differences: I² = 20.9, P = 0.26). The results suggest less agitation for memantine (versus placebo) for the monotherapy subgroup (RR 0.68, 95% CI 0.51 to 0.91) and some heterogeneity, but little difference for concurrent therapy with ChEI (RR 0.92, 95% CI 0.60 to 1.40). Therefore, we reported this outcome separately in the summary of findings tables for sections 1 to 3 for other types of dementia; we combined the results for the AD studies across all severities (apart from those with agitation), but reported separately the results for studies in people receiving concomitant ChEI.
The collection of 'agitation as an adverse event' is not a good way to assess the impact of interventions on incident agitation, particularly for the studies in patients with agitation at baseline. Nevertheless, we have included these results in Analysis 8.11 for completeness, but have reported agitation as an efficacy outcome in section 1.4.
5.2.4. Number with specific adverse events
Results for other adverse events are shown in Table 11 and in Analysis 9.6 (insomnia); Analysis 9.7 (confusion); Analysis 9.8 (depression); Analysis 9.9 (headache); Analysis 9.10 (hypertension); Analysis 9.11 (dizziness); Analysis 9.12 (falls); Analysis 9.13 (accidental injury); Analysis 9.14 (urinary incontinence); Analysis 9.15 (diarrhoea) and Analysis 9.16 (influenza‐type symptoms).
| Adverse event | Number of studies (participants) | RR (95% CI) | Heterogeneity (I²) | GRADE rating |
| Insomnia (Analysis 9.6) | 19 (5354), 221 events | 0.93 (0.73 to 1.20) | I² = 14%, P = 0.29 | LOW (downgraded on imprecision and reporting bias < 70% patients had AE data) |
| Confusion (Analysis 9.7) | 13 (4509), 167 events | 1.23 (0.91 to 1.65) | I² = 0%, P = 0.51 | LOW (downgraded on imprecision and reporting bias < 70% patients had AE data) |
| Depression (Analysis 9.8) | 10 (3052), 83 events | 1.06 (0.70 to 1.60) | I² = 0%, P = 0.60 | VERY LOW (downgraded on imprecision (twice), inconsistency in point estimates (once) and reporting bias <40% patients had AE data (twice)) |
| Headache (Analysis 9.9) | 16 (4889), 240 events | 1.29 (1.00 to 1.66) | I² = 9%,P = 0.36 | LOW (downgraded on imprecision (once) and reporting bias <70% patients had AE data) |
| Hypertension (Analysis 9.10) | 8 (3175), 87 events | 1.76 (1.14 to 2.70) | I² = 1%, P = 0.42 | VERY LOW (downgraded on imprecision (twice), inconsistency in point estimates (once) and reporting bias <40% patients had AE data (twice)) |
| Dizziness (Analysis 9.11) | 19 (6395), 323 events | 1.59 (1.28 to 1.98) | I² = 0%, P = 0.49 | MODERATE (downgraded on inconsistency in point estimates) |
| Falls (Analysis 9.12) | 20 (6743), 589 events | 0.98 (0.84 to 1.13) | I² = 0%, P = 0.84 | HIGH |
| Accidental injury (Analysis 9.13) | 10 (3813), 214 events | 0.81 (0.62 to 1.05) | I² = 0%, P = 0.81 | VERY LOW (downgraded on imprecision (once) and twice on reporting bias (< 50% patients and 1 in 4 studies) |
| Urinary incontinence (Analysis 9.14) | 8 (2724), 76 events | 1.12 (0.73 to 1.72) | I² = 0%, P = 0.83 | VERY LOW (downgraded on imprecision (twice), inconsistency in point estimates (once) and reporting bias <4 0% patients had AE data (twice)) |
| Diarrhoea (Analysis 9.15) | 18 (6186), 318 events | 0.82 (0.66 to 1.02) | I² = 0%, P = 0.58 | LOW (downgraded on imprecision (once), some inconsistency in point estimates and reporting bias <70% patients had AE data (once further)) |
| Influenza‐like symptoms (Analysis 9.16) | 7 (2836), 129 events | 1.21 (0.87 to 1.70) | I² = 0%, P = 0.97 | VERY LOW (downgraded on imprecision (once), and reporting bias < 40% patients and 1/6 studies had AE data (twice)) |
The evidence on specific adverse events was generally of low‐ or very low‐certainty, mainly because relatively few studies reported the outcomes and we felt there was risk of reporting bias (Table 11).
Memantine is probably 1.6 times more likely than placebo to result in dizziness (RR 1.59, 95% CI 1.28 to 1.98) (moderate‐certainty) and may be 1.2 times more likely to result in confusion (RR 1.23, 95% CI 0.91 to 1.65) and 1.3 times more likely to give headache (RR 1.29, 95% CI 1.00 to 1.66) (low certainty). Memantine may be 1.2 times less likely than placebo to result in diarrhoea (RR 0.82, 95% CI 0.66 to 1.02) (low certainty). There is no difference between interventions for the incidence of falls (RR 0.98, 95% CI 0.84 to 1.13) (high‐certainty evidence). There is uncertainty about the other adverse events recorded.
Discussion
Summary of main results
We discuss in this section the findings in relation to the two objectives of the review: to assess the efficacy and safety of memantine for the treatment of dementia of different aetiologies, and secondly, to assess whether memantine adds benefit for people already taking cholinesterase inhibitors (ChEIs).
A) Efficacy and safety of memantine
Memantine shows a small important clinical benefit over placebo in some populations, but not others. In particular, there is benefit for moderate‐to‐severe Alzheimer's disease (AD) for the four efficacy outcomes, and for some outcomes for vascular dementia. There is probably no benefit in mild AD and it is uncertain whether there is any effect in people with agitation in moderate‐to‐severe disease. A summary of the efficacy results are given below.
Throughout the review, we found no difference between memantine and placebo in the number of people with at least one adverse event, regardless of aetiology of dementia or severity (risk ratio (RR) 1.03, 95% confidence interval (CI) 1.00 to 1.06). The evidence on specific adverse events is generally of low‐ or very low‐certainty, mainly because relatively few studies reported the outcomes and we felt there was risk of reporting bias. That said, memantine is probably 1.59 (95% CI 1.28 to 1.98) times more likely than placebo to result in dizziness (6.1% versus 3.9%) and may be 1.29 (95% CI 1.00 to 1.66) times more likely to result in headache (5.5% versus 4.3%). Memantine may be 1.2 times less likely than placebo to result in diarrhoea (RR 0.82, 95% CI 0.66 to 1.02) . There is no difference between interventions for the incidence of falls.
Discontinuation (all‐cause) varies according to severity of disease and may have an inverse relationship with effectiveness. For example, discontinuation in mild AD participants (RR 1.74, 95% CI 1.08 to 2.81) is very different from that in moderate‐to‐severe AD: (RR 0.93, 95% CI 0.83 to 1.04).
1. Alzheimer's disease (AD)
The efficacy of memantine varies according to the severity of disease.
For moderate‐to‐severe AD, evidence from up to 14 studies in around 3700 participants shows there is a small clinical benefit for memantine relative to placebo in each of the main efficacy outcomes. Approximately similar numbers of people taking memantine and placebo discontinue treatment and there is probably a reduction in the number with agitation as an adverse event. These differences between memantine and placebo are small but important benefits and we know them with confidence (see Quality of the evidence). They are accompanied by similar numbers of people discontinuing treatment and there is probably a reduction in those with agitation.
For people with mild AD, we used evidence from post‐hoc subgroups within four studies in people with mild‐to‐moderate disease. Although the trials were conducted in the mild‐to‐moderate population, licensing and treatment of AD is stratified into mild and moderate‐to‐severe categories, and we had to isolate evidence on the mild population in this way. There was one small study conducted solely in people with mild disease, but this did not give sufficient information to investigate the effect of memantine in this population (and was concerned with driving abilities). Evidence from up to four studies in around 600 participants suggested there may be no difference between memantine and placebo for clinical global rating and there is probably no difference for the other three efficacy outcomes. There may be an increase in the number of people discontinuing treatment because of adverse events, which may not be surprising given the lack of efficacy. For the population with mild AD, we observed an average improvement over time in cognitive function and in behaviour and mood for the placebo groups (median change from baseline). We are uncertain whether this improvement is a real effect or a statistical regression to the mean; it is possible that the improvement could be related to participants being in a trial.
We also investigated separately the effect of memantine in people with moderate‐to‐severe AD, who were selected for agitation. Only one study had results at six months, but we also analysed two other studies with three months' follow‐up, in order to probe whether the six‐month study was an outlier. This evidence was mainly of low or very low certainty, and within these limitations, suggested there may be little or no effect of memantine in this population for the outcomes of clinical global rating, cognitive function and performance on activities of daily living (ADL); the evidence for behaviour and mood was of very low certainty. There was moderate‐certainty evidence for the Cohen‐Mansfield Agitation Index (CMAI) score for agitation, which suggested there was probably no difference between memantine and placebo. The proportion reporting agitation as a treatment emergent adverse events (AEs) in two studies (403 participants) may be doubled in patients selected for agitation receiving memantine (plus ChEI) compared with placebo (plus ChEI). This is in contrast with AD patients with moderate‐to‐severe disease who were not selected for agitation, and in whom the proportion reporting agitation is reduced by memantine. We do not generally have confidence in these results, but consider that further research is needed to determine if memantine is indeed ineffective in an agitation population, appreciating that trials in this agitated population are difficult to conduct.
2. Vascular dementia
Moderate‐ and low‐certainty evidence from two studies in around 750 participants with vascular dementia gave mixed results for the comparison of memantine and placebo. There is probably a small clinical benefit for cognitive function and there may be a small clinical benefit on the Nurse's Observational Scale for Geriatric Patients (NOSGER) disturbing behaviour outcome. However, there is probably no difference between memantine and placebo in clinical global rating and there may be no difference in performance on ADL. There may be no difference in the numbers of people discontinuing treatment and there may be fewer people with agitation as an adverse event for memantine compared with placebo.
A post‐hoc subgroup analysis by severity suggested that memantine (versus placebo) may have a bigger effect for cognitive function in people with moderate‐to‐severe vascular dementia ( Mini Mental State Examination (MMSE) ≥14) than in people with mild‐to‐moderate vascular dementia. The test for subgroup differences was significant (I² = 72.5%, P = 0.06), although this was a post‐hoc analysis.
3. Other forms of dementia
Parkinson's disease dementia (PDD) and dementia with Lewy bodies (DLB): low‐ and very low‐certainty evidence from up to three studies in around 250 participants suggests that, for memantine versus placebo in people with PDD or DLB, there may be a small clinical benefit in clinical global rating and in behaviour and mood (although the confidence interval was consistent with both no effect and benefit). Evidence for all other efficacy outcomes was of very low certainty. There may be fewer people discontinuing treatment.
Frontotemporal dementia (FTD): mainly low‐certainty evidence from two studies in around 120 participants suggests there may be a small clinical benefit in clinical global function and in behaviour and mood for memantine versus placebo in people with FTD. There may be no difference in cognitive function. However, for all of the efficacy outcomes, there is uncertainty and the confidence interval is consistent with more than one conclusion. There may be more discontinuation in the memantine group (compared with placebo) for this population, but again the CI is wide.
AIDS‐related Dementia Complex (ADC): only one study in 140 participants was identified and suggested there may be an improvement in cognitive score ( Neuropsychological Z score (NPZ)‐8) at 16 weeks and that all‐cause discontinuation may be similar for memantine and placebo.
B) Benefit of memantine for those already taking cholinesterase inhibitors (ChEIs)
For our second objective, we examined whether memantine could give incremental benefit for people already taking ChEIs. We examined this by investigating whether there were different effects according to the presence or absence of concomitant ChEIs in those for whom memantine was more efficacious than placebo (i.e. moderate‐to‐severe AD).
Moderate‐to‐severe AD, with concomitant ChEIs: six trials in around 1850 people showed a small clinical benefit for memantine versus placebo in cognitive function, performance on ADL and behaviour and mood; and there is probably a small clinical benefit in clinical global rating. There are similar numbers of people with adverse events in both groups (RR 1.03, 95% CI 1.00 to 1.06). Similar numbers of people taking memantine and a ChEI discontinue their treatment compared to those taking placebo and a ChEI, and there may be little or no difference between interventions in the number with agitation as an adverse event.
There were similar efficacy findings for people receiving memantine monotherapy, except that the benefit compared with placebo is smaller in monotherapy for the behaviour and mood outcome and larger for the cognitive function outcome (Table 10). In contrast to people receiving concomitant ChEI, people receiving memantine monotherapy probably have less agitation than those receiving placebo.
Between‐trial subgroup analyses comparing the presence and absence of concomitant ChEIs suggest there is no significant difference between monotherapy and concurrent therapy with concomitant ChEI (for the comparison of memantine versus placebo) for any of the primary efficacy outcomes, although there is a non‐significant difference between subgroups for the cognitive function outcome (I² = 44%, P = 0.18) and for the behaviour and mood outcome (I² = 35%, P = 0.21). These subgroup analyses are non‐randomised comparisons between different groups of studies and do not investigate possible confounding factors, such as severity of disease. The only head‐to‐head randomised evidence was of low certainty: one study randomised 149 participants to memantine plus continued donepezil versus memantine plus placebo and donepezil discontinued. The study suffered from differential missing data, but there may be a benefit in using both drugs compared with memantine monotherapy for cognitive function, i.e. it may be better to add memantine than to switch to memantine.
Overall completeness and applicability of evidence
People with dementia who are recruited into drugs trials are often not representative of typical clinical populations. Those recruited typically lack physical comorbidities, have better psychosocial support, and are less likely to have neuropsychiatric symptoms, all of which may mitigate against decline and its functional impact.
The studies were too short and small to be expected to show any effect of memantine on life expectancy. It is possible that the drug extends the total time of deterioration without reducing the personal or social burden of the disease (Dresser 2000).The benefits of slowing Alzheimer's disease progression in the later stages can be controversial (Post 1997).
The reliability of the distinction between vascular and Alzheimer's dementia is not high: most patients with vascular dementia, especially those with severe dementia have additional Alzheimer's pathology. This limits the applicability of results from trials of mild‐to‐moderate vascular dementia to those with severe vascular dementia.
Responder analyses are not routinely presented although the data are available from all trials. However, a meta‐analysis of responders based on six trials found that 10% more placebo‐treated than memantine‐treated patients showed any clinical worsening (Wilkinson Post‐Hoc 6RCTs 2007). There was a similar difference in rates of marked clinical worsening.
Measures of executive function are difficult to assess in those with more advanced dementia and in general are not well covered in AD trials which use the Alzheimer's Disease Assessment Scale ‐ Cognitive subscale (ADAS‐Cog) and were not included in the vascular dementia trials (Roman 1999).
Comprehensive lists of adverse drug reactions are infrequently reported so there is a theoretical possibility of publication bias. Regulators require comprehensive reporting. Whilst the details of these reports to regulators remain confidential, changes in the 'Summary of Product Characteristics' are likely to be a more reliable source of information on rare adverse effects than pooled data in systematic reviews.
Quality of the evidence
The evidence for AD is mainly of high certainty (with the exception of studies in people selected for agitation), which means we can be very confident of the results, which we summarised across many studies in large numbers of participants. The evidence for mild AD was obtained from within‐trial post‐hoc subgroups, with data provided by drug companies, but this evidence is still of moderate certainty.
The evidence certainty is moderate to low for vascular dementia and mainly low for FTD. For PDD or DLB and AD participants with agitation, the evidence certainty is mainly low or very low.
The authors of this review have gone to great lengths to obtain data for studies that have not been fully published, or for which there have been delays in publication. This work has much increased the volume of evidence available, nevertheless the results of some studies are still not in the public domain and there could be publication bias. Funnel plots for the main efficacy outcomes and for all‐cause discontinuation did not appear to suggest small studies' bias. There may be some asymmetry found for the adverse events outcome. Nearly all the trials were funded by drug companies.
Potential biases in the review process
In analysing the data, we have carried out a series of subgroup analyses and stratifications. At the outset, we stratified the studies by type of dementia, but later compared across aetiologies as a check. Stratification seemed appropriate for the efficacy outcomes and some safety outcomes, but we combined the results for adverse events across all studies because we found no differences in adverse events between diagnostic subgroups. We investigated duration of study, dose of memantine and type of analysis (observed case (OC) versus last observation carried forward (LOCF)) and restricted the main analyses to a duration of six months and licensed dose, also preferring to analyse OC data. We have documented our reasoning for all these decisions, but they could be a source of bias.
We split the data by severity into mild and moderate‐to‐severe AD, on the basis of subgroup analyses and pragmatism connected with current licensing requirements. These subgroup analyses seemed to provide convincing evidence, but are still non‐randomised comparisons, and there could have been confounding by some other factor. We then split the moderate‐to‐severe dataset further in our investigation of the effect of concomitant ChEI, and this further splitting could have led to random error. For this reason (and the lack of evidence of a difference between monotherapy and dual therapy), we prefer to use results for all studies regardless of their use of ChEI.
We calculated data for mild AD from published trial data in people with mild‐to‐moderate disease and drug company‐provided subgroup data for people with moderate disease. These data are from post‐hoc subgroups and so there may be differences between intervention groups in baseline characteristics. It would have been preferable to stratify patients by severity and then randomise to treatments, but this was not done by the trialists. Having said this, there are large numbers of participants and the split into mild and moderate disease is pre‐defined, so this is probably a minor limitation.
We also made some post‐hoc decisions, namely to treat separately studies in AD patients selected for agitation and to exclude from the analysis two randomised arms from one study because of a study‐reported interaction of memantine with Vitamin E. In the first instance, we considered the patients selected for agitation to be sufficiently dissimilar from other AD patients that they should not be included in the same analyses, and in the second case we thought the effect modification could have introduced unwarranted heterogeneity. These decisions could have meant that our findings for AD were overestimated.
We have been transparent about the approaches taken in this review, and do not consider the potential for bias is high.
Agreements and disagreements with other studies or reviews
This updated Cochrane Review has mainly similarities, but some differences with previous work. We focus here on clinical guidelines or technology appraisals for dementia, and recent systematic reviews of memantine. We mainly focus on AD, considering the number of studies included, the approach to monotherapy and concurrent therapy, ways of dealing with missing data, the effects of severity and the impact of agitation.
We have included 32 new studies (in comparison with 2006), several of which had unpublished data provided by the study authors or drug companies. We also included results for post‐hoc subgroups, which have informed analyses for both the mild and moderate‐to‐severe AD categories. We have meta‐analysed results from considerably more AD studies than were included in the NICE technology appraisal, which had four monotherapy and two dual therapy trials (NICE 2011); and consequently our review has more precise summary statistics. For moderate‐to‐severe AD, this has meant that all the main efficacy outcomes show small benefits that are statistically significant, in contrast to the largely non‐significant findings of TA 217 ‐ which were equated with no effect (see Why it is important to do this review).
Our analyses have shown that the benefit obtained for monotherapy versus placebo in moderate‐to‐severe AD is very similar to that obtained in dual therapy trials, and the test for subgroup differences is not significant. Therefore, we have included all trials in the meta‐analyses, regardless of the presence or absence of ChEIs. This conclusion about the efficacy of dual therapy contrasts with the conclusion of the NICE appraisal, which stated there was a lack of evidence of additional clinical efficacy (of concurrent therapy with ChEIs) compared with memantine monotherapy (NICE 2011). Since 2011, there have been many new studies of memantine in AD, leading to more up‐to‐date systematic reviews, and NICE has now published an update to its dementia guideline in June 2018 (NICE 2018). We discuss this recent literature below.
Three systematic reviews in AD have been published in the past three years, two of memantine monotherapy (Chen 2017; Matsunaga 2015, and one of dual therapy (Matsunaga 2015b). These gave similar conclusions to our review for most outcomes, even though the authors included studies reporting participants with mild AD and studies that did not have a placebo comparator, and also used LOCF approaches for missing data. A further systematic review included three studies of dual therapy and showed significant benefits when the analysis was restricted to moderate‐to‐severe AD (Muayqil 2012). We also identified a recent review of predominantly Chinese studies, which compared concurrent therapy with donepezil, however the majority of studies did not include a placebo (Chen 2017). We note that the FDA granted a license for combination therapy in patients stabilised on 10 mg donepezil once daily in December 2014 and a combined formulation product was launched in 2015.
The effect of severity was also identified in two other systematic reviews (Di Santo 2013;Kishi 2017): one of these showed greater efficacy as severity increased in a similar way to our review, but only included six trials (Di Santo 2013). The other review of 30 AD studies (including those without a placebo comparator) reached similar conclusions to ours regarding severity, but did not probe the effect of memantine in mild AD disease (Kishi 2017).
The NICE dementia guideline has been updated concurrently with the update of this Cochrane Review (NICE 2018); we have shared data with the guideline developers and the Cochrane Dementia and Cognitive Improvement review group is a registered stakeholder for the guideline. The guideline is a major update of the original guideline and updates some aspects of TA 217. The guideline preserved the TA's original stratification for analyses of monotherapy and dual therapy, and has updated the dual therapy analyses by including additional studies; however, the monotherapy analyses have not been updated (NICE 2018). The update has revised recommendations for 'people who are already taking a ChEI', for whom clinicians should now consider adding memantine to ChEIs for people with moderate disease and offer memantine in addition to ChEI to people with severe disease (NICE 2018). The evidence in this Cochrane Review supports (and indeed has informed) recommendations to offer dual therapy, but we consider that the monotherapy recommendations should also have been examined, especially because there are many new studies and memantine is now off‐patent. We are also concerned that the conflation of the old and new recommendations in the new guideline may lead to confusion for clinicians. For example, in severe disease, the unchanged monotherapy recommendation is to offer memantine (and not ChEIs), yet the new dual therapy recommendation is for people who are 'already taking a ChEI'. Additionally, the 2018 guideline is not explicit on whether combination therapy should be offered as first line therapy for people presenting with moderate or severe disease.
A systematic review of clinical guidelines reported the recommendations from 12 moderate‐ to high‐quality guidelines (Ngo 2015). The authors noted there was disagreement between two guidelines on the benefit of memantine in mild AD, but agreement in its use in moderate‐to‐severe dementia.They noted conflicting recommendations amongst four guidelines to support combining ChEI therapy with memantine in moderate–to‐severe dementia.
France's Minister for Health has recently de‐listed memantine and the ChEIs, donepezil, galantamine and rivastigmine (HAS 2018), stating that "it is better to concentrate on helping to organise daily activities, maintain activity, support and help from those around you", This de‐listing was based on work by the Haute Autorité de Santé (HAS), which stated in 2016 following evidence review, "The new data confirms that the efficacy of drugs for the symptomatic treatment of Alzheimer's disease is, at best, modest. It is established only in the short term, mainly on cognitive disorders, in placebo controlled clinical studies whose clinical relevance and transposability in real life are not ensured. Patients in these studies are indeed younger than those who are managed in real practice, and unlike these they have no comorbidities, nor risks of drug interactions. In addition, the effects on behavioral disorders, quality of life, time to enter an institution, mortality, burden of illness for carers are still not established... However, the data accumulated since the commercialization of the drugs confirm the risk of occurrence of undesirable side effects (digestive, cardiovascular or neuropsychiatric disorders for the most notable) potentially serious, which can alter the quality of life" (HAS 2016, translation). The 2018 statement was less measured, stating that, "None of the available drugs has been shown to slow down progression toward dependence, yet all carry a risk of life‐threatening adverse effects and severe drug interactions" (Prescrire 2018) (see Why it is important to do this review).
The HAS based its conclusions for the efficacy of memantine on the Matsunaga 2015 review for monotherapy and an earlier review authored by some of us for dual therapy (Farrimond 2012), both of which broadly agree with the conclusions of our memantine review, but there are differences for ADL for both reviews (HAS Annexe 2016). The HAS considered the benefits to be 'clinically irrelevant' and stated there is no difference in ADL for dual therapy. These conclusions are not supported either by our current memantine review or by the review and cost‐effectiveness analysis of the NICE guideline (NICE 2018). We consider that the small incremental benefits from each of ChEI and memantine for all outcomes at six months follow‐up, each having an effect size that may be less than the minimum clinically important difference, do not equate to clinical irrelevance. As stated above, we do agree that participants recruited into drugs trials are often not representative of typical clinical populations.
Second, the French authorities examined adverse effect data in detail for the ChEIs and memantine, using meta‐analyses of clinical trials, summary of products characteristics (SPC) and (for uncommon AEs) observational studies and analyses of pharmacovigilance databases (HAS Annexe 2016). The HAS reported that in placebo‐controlled clinical trials, more people discontinued donepezil 10 mg than placebo due to adverse effects, but the HAS did not report this for other ChEIs or memantine. In our current memantine review, however, we have noted a significant subgroup difference for this outcome between people with mild disease (greater discontinuation on memantine) and those with moderate‐to‐severe disease (no difference compared with placebo) (see section A above). The HAS report included some observational studies, one of which compared memantine and the three ChEIs (but had no data on untreated patients) (Fosbøl 2012). This very large study in the USA and Denmark reported for the Danish cohort a greater risk (in adjusted analyses) of myocardial infarction and cardiac death for memantine (compared with donepezil) and a smaller risk for syncope and atrioventricular block, but no differences in the USA cohort on hospitalisation for cardiac events. In both cohorts, all‐cause mortality was greater for patients receiving memantine. The authors concluded that the greater risk of cardiovascular events in the Danish cohort in users of memantine and dual therapy is probably related to selection of sicker participants, because these therapies are reserved for individuals with more severe dementia in Denmark. They also noted the lack of comparative data (with placebo/no treatment) and stated that "no clinical studies has found cardiovascular signals of clinical concern" (Fosbøl 2012). The HAS also gives pharmacovigilance data (as case reports) and indicates changes made to the SPCs of the various drugs: data on donepezil versus placebo was inconsistent for mortality in people with vascular dementia; there may be an increased risk of QT interval prolongation for galantamine and there may be an increased risk of myocardial infarction, stroke and torsade de pointes for rivastigmine. A very large pharmacovigilance study of the WHO database, VigiBase, over 58 countries, investigated all ChEIs and noted that serious cardiovascular events were frequently reported, suggesting that their significance has probably been previously underestimated, and encouraging caution when prescribing these drugs, especially as patients with Alzheimer's disease are frequently frail and receive other drugs (Krӧger 2015). The HAS has little to say about memantine pharmacovigilance except that hepatitis has been added to the SPC, but does agree with our review on the results for adverse effects from clinical trials. Instead of treating memantine separately from ChEIs, the HAS statements on safety apply to the dementia drugs as a whole (HAS Annexe 2016). Overall, we consider there is insufficient evidence to support the strong statement on adverse events (HAS 2016) and think that memantine, which has a different mode of action from ChEIs, should be considered separately.
The HAS recommends care and support for the individual instead of the drug treatments, rather than including drug treatments as a part of a general care package. They do not appear to have reviewed the evidence on this.
Overall, our view is that the evidence in our review and our examination of the French adverse effects data raises questions about the appropriateness of the de‐listing policy taken by the French government. We note that de‐listing means the drugs are no longer reimbursed by the national health insurance system (Prescrire 2018), but that the drugs can be prescribed in line with their summary of product characteristics (HAS 2018). This may mean confusion for clinicians and potential for inequalities in the healthcare system.
Our review of the evidence on the effect on memantine in people with moderate‐to‐severe AD selected for agitation suggested that memantine may be ineffective in this population, but this is low‐ or very low‐certainty evidence. Our findings contrast with two post‐hoc analyses (Gaultier 2005; Wilcock Post‐Hoc 3RCTs 2008); the latter analysed individual participant data (IPD) from three randomised controlled trials (RCTs) in our review (Reisberg 2003 (9605); Tariot 2004 (MD‐02); van Dyck 2007 (MD‐01)); selecting only those from a 'behaviourally disturbed population', defined as a score > 0 on any of the three NPI symptoms of agitation–aggression, delusion, and hallucinations at baseline. Data were integrated in a single dataset and then analysed; meta‐analysis was not reported and the data were said to be 'pooled', indicating that the randomisation was not maintained. The study found a significant benefit for memantine for each of the efficacy outcomes at six months, but its reliability is unclear. A second review (Gaultier 2005); reported separately data from two RCTs in our review (Reisberg 2003 (9605); Tariot 2004 (MD‐02)), and, for one of the studies with memantine monotherapy (Reisberg 2003 (9605)) gave results for post‐hoc subgroups of participants with agitation and no agitation at baseline. Results were not reported for the other study (which had dual therapy). The review stated that for people with agitation at baseline (defined as in Wilcock Post‐Hoc 3RCTs 2008, and comprising about 60% of the population); there was a significant improvement in agitation symptoms for memantine compared with placebo, which does not agree with our review's findings, but we note this is a different outcome to that in our review (improvement versus worsening of symptoms). In people without agitation at baseline, there were stated to be significantly fewer emergent agitation symptoms for memantine. Overall, there may be some differences with earlier findings, but all the efficacy evidence is of low or very low certainty and there is a need for further research of alternative therapies in this important patient group.
Finally, we note some differences between this Cochrane Review and the 2018 NICE guideline for types of dementia other than AD (NICE 2018). For people with vascular dementia, the NICE guideline recommends that ChEIs or memantine should be considered only if they have comorbid AD or PDD/DLB. However, this Cochrane Review has identified small clinical benefits in cognitive function and in behaviour and mood in people diagnosed with vascular dementia, and there is a post‐hoc analysis indicating there may be greater benefits in people with more severe disease. For people with FTD, the guideline recommends that ChEIs and memantine should not be offered (a strong recommendation), stating that there is not usually a cholinergic deficit in people with FTD, that there was no evidence of benefit and also citing the potential for adverse effects, whilst noting no difference between memantine and placebo. It may be that the guideline has conflated the findings for ChEIs with those for memantine, and we note that memantine has a non‐cholinergic mechanism of action and may have potential for benefit, albeit from low‐ or very low‐certainty evidence. For people with PDD or DLB, the guideline reviewed the evidence for PDD and DLB separately, and appeared to draw conclusions on the basis of a lack of statistical significance. The guideline recommended that memantine should be considered only if ChEIs are not tolerated or contraindicated, which, while consistent with our review findings of low‐ or very lo‐ certainty evidence in this patient group, has a strength which goes beyond the evidence.
Study flow diagram of studies identified
'Risk of bias' summary: review authors' judgements about each risk of bias item for each included study.
'Risk of bia's graph: review authors' judgements about each risk of bias item presented as percentages across all included studies.
Funnel plot of comparison: 1 Memantine 20 mg or equivalent vs placebo for moderate‐to‐severe Alzheimer's disease. 24‐30 week data. OC, outcome: 1.1 Clinical Global.
Funnel plot of comparison: 1 Memantine 20 mg or equivalent vs placebo for moderate‐to‐severe Alzheimer's disease. 24‐30 week data. OC, outcome: 1.2 Cognitive Function.
Funnel plot of comparison: 1 Memantine 20 mg or equivalent vs placebo for moderate‐to‐severe Alzheimer's disease. 24‐30 week data. OC, outcome: 1.3 Decline in ADL.
Funnel plot of comparison: 1 Memantine 20 mg or equivalent vs placebo for moderate‐to‐severe Alzheimer's disease. 24‐30 week data. OC, outcome: 1.4 Behaviour and Mood.
Funnel plot of comparison: 1 Memantine 20 mg or equivalent vs placebo for moderate‐to‐severe Alzheimer's disease. 24‐30 week data. OC, outcome: 1.5 All‐cause discontinuation.
Funnel plot of comparison: 12 Adverse reactions ‐ Memantine vs placebo for mild to severe dementia. All diagnoses, all durations, outcome: 12.3 Number suffering at least one adverse event.

Comparison 1 Memantine 20 mg or equivalent vs placebo for moderate‐to‐severe Alzheimer's disease 24‐ to 30‐week data. OC, Outcome 1 Clinical Global.

Comparison 1 Memantine 20 mg or equivalent vs placebo for moderate‐to‐severe Alzheimer's disease 24‐ to 30‐week data. OC, Outcome 2 Cognitive Function.

Comparison 1 Memantine 20 mg or equivalent vs placebo for moderate‐to‐severe Alzheimer's disease 24‐ to 30‐week data. OC, Outcome 3 Decline in ADL.

Comparison 1 Memantine 20 mg or equivalent vs placebo for moderate‐to‐severe Alzheimer's disease 24‐ to 30‐week data. OC, Outcome 4 Behaviour and Mood.

Comparison 1 Memantine 20 mg or equivalent vs placebo for moderate‐to‐severe Alzheimer's disease 24‐ to 30‐week data. OC, Outcome 5 All‐cause discontinuation.

Comparison 1 Memantine 20 mg or equivalent vs placebo for moderate‐to‐severe Alzheimer's disease 24‐ to 30‐week data. OC, Outcome 6 Discontinuations due to adverse events.

Comparison 1 Memantine 20 mg or equivalent vs placebo for moderate‐to‐severe Alzheimer's disease 24‐ to 30‐week data. OC, Outcome 7 Number suffering at least one adverse event.

Comparison 1 Memantine 20 mg or equivalent vs placebo for moderate‐to‐severe Alzheimer's disease 24‐ to 30‐week data. OC, Outcome 8 Number suffering serious adverse events.

Comparison 1 Memantine 20 mg or equivalent vs placebo for moderate‐to‐severe Alzheimer's disease 24‐ to 30‐week data. OC, Outcome 9 Number suffering agitation as an adverse event.

Comparison 2 Memantine 20 mg or equivalent vs placebo in patients taking versus not taking cholinesterase inhibitors with moderate to severe Alzheimer's disease 24‐ to 30‐week data, Outcome 1 Clinical Global: subgroup analysis by +/‐ ChEI.

Comparison 2 Memantine 20 mg or equivalent vs placebo in patients taking versus not taking cholinesterase inhibitors with moderate to severe Alzheimer's disease 24‐ to 30‐week data, Outcome 2 Cognitive Function subgroup analysis by +/‐ ChEI.

Comparison 2 Memantine 20 mg or equivalent vs placebo in patients taking versus not taking cholinesterase inhibitors with moderate to severe Alzheimer's disease 24‐ to 30‐week data, Outcome 3 Decline in ADL: subgroup analysis by +/‐ ChEI.

Comparison 2 Memantine 20 mg or equivalent vs placebo in patients taking versus not taking cholinesterase inhibitors with moderate to severe Alzheimer's disease 24‐ to 30‐week data, Outcome 4 Behaviour and Mood: subgroup analysis by +/‐ ChEI.

Comparison 2 Memantine 20 mg or equivalent vs placebo in patients taking versus not taking cholinesterase inhibitors with moderate to severe Alzheimer's disease 24‐ to 30‐week data, Outcome 5 Cognitive function (sMMSE):subgroup analysis within randomised study ‐ per protocol.

Comparison 2 Memantine 20 mg or equivalent vs placebo in patients taking versus not taking cholinesterase inhibitors with moderate to severe Alzheimer's disease 24‐ to 30‐week data, Outcome 6 Decline in ADL (BADL): subgroup analysis within randomised study ‐ per protocol.

Comparison 2 Memantine 20 mg or equivalent vs placebo in patients taking versus not taking cholinesterase inhibitors with moderate to severe Alzheimer's disease 24‐ to 30‐week data, Outcome 7 NPI: subgroup analysis within randomised study ‐ per protocol.

Comparison 2 Memantine 20 mg or equivalent vs placebo in patients taking versus not taking cholinesterase inhibitors with moderate to severe Alzheimer's disease 24‐ to 30‐week data, Outcome 8 Clinical Global: CIBIC+ mean difference; ChEI subgroup.

Comparison 2 Memantine 20 mg or equivalent vs placebo in patients taking versus not taking cholinesterase inhibitors with moderate to severe Alzheimer's disease 24‐ to 30‐week data, Outcome 9 All‐cause discontinuation ‐ by ChEI.

Comparison 2 Memantine 20 mg or equivalent vs placebo in patients taking versus not taking cholinesterase inhibitors with moderate to severe Alzheimer's disease 24‐ to 30‐week data, Outcome 10 Discontinuations due to adverse events ‐ by ChEI.

Comparison 2 Memantine 20 mg or equivalent vs placebo in patients taking versus not taking cholinesterase inhibitors with moderate to severe Alzheimer's disease 24‐ to 30‐week data, Outcome 11 Adverse events ‐ by ChEI.

Comparison 2 Memantine 20 mg or equivalent vs placebo in patients taking versus not taking cholinesterase inhibitors with moderate to severe Alzheimer's disease 24‐ to 30‐week data, Outcome 12 Serious adverse events ‐ by ChEI.

Comparison 2 Memantine 20 mg or equivalent vs placebo in patients taking versus not taking cholinesterase inhibitors with moderate to severe Alzheimer's disease 24‐ to 30‐week data, Outcome 13 Number suffering agitation as an adverse event ‐ by ChEI.

Comparison 2 Memantine 20 mg or equivalent vs placebo in patients taking versus not taking cholinesterase inhibitors with moderate to severe Alzheimer's disease 24‐ to 30‐week data, Outcome 14 Memantine + donepezil vs memantine + placebo.

Comparison 3 Memantine 20 mg or equivalent vs placebo for moderate‐to‐severe AD with agitation, Outcome 1 Cohen Mansfield Agitation Inventory (MD).

Comparison 3 Memantine 20 mg or equivalent vs placebo for moderate‐to‐severe AD with agitation, Outcome 2 Cohen Mansfield Agitation Inventory (SMD).

Comparison 3 Memantine 20 mg or equivalent vs placebo for moderate‐to‐severe AD with agitation, Outcome 3 NPI agitation subscale.

Comparison 3 Memantine 20 mg or equivalent vs placebo for moderate‐to‐severe AD with agitation, Outcome 4 Number suffering agitation.

Comparison 3 Memantine 20 mg or equivalent vs placebo for moderate‐to‐severe AD with agitation, Outcome 5 Clinical Global.

Comparison 3 Memantine 20 mg or equivalent vs placebo for moderate‐to‐severe AD with agitation, Outcome 6 Cognitive Function: SIB.

Comparison 3 Memantine 20 mg or equivalent vs placebo for moderate‐to‐severe AD with agitation, Outcome 7 Decline in ADL: ADCS‐ADL19.

Comparison 3 Memantine 20 mg or equivalent vs placebo for moderate‐to‐severe AD with agitation, Outcome 8 Behaviour and Mood.

Comparison 3 Memantine 20 mg or equivalent vs placebo for moderate‐to‐severe AD with agitation, Outcome 9 All‐cause discontinuation.

Comparison 3 Memantine 20 mg or equivalent vs placebo for moderate‐to‐severe AD with agitation, Outcome 10 Discontinuations due to adverse events.

Comparison 3 Memantine 20 mg or equivalent vs placebo for moderate‐to‐severe AD with agitation, Outcome 11 Number suffering at least one adverse event.

Comparison 3 Memantine 20 mg or equivalent vs placebo for moderate‐to‐severe AD with agitation, Outcome 12 Number suffering serious adverse events.

Comparison 4 Memantine 20 mg vs placebo for mild AD (MMSE 20‐23) OC six‐month studies, Outcome 1 Clinical global: CIBIC+.

Comparison 4 Memantine 20 mg vs placebo for mild AD (MMSE 20‐23) OC six‐month studies, Outcome 2 Cognitive function: ADASCog.

Comparison 4 Memantine 20 mg vs placebo for mild AD (MMSE 20‐23) OC six‐month studies, Outcome 3 Decline in ADL: ADCS‐ADL23.

Comparison 4 Memantine 20 mg vs placebo for mild AD (MMSE 20‐23) OC six‐month studies, Outcome 4 Behaviour and mood: NPI.

Comparison 5 Memantine 20 mg vs placebo for mild‐to‐moderate vascular dementia. Six‐month studies, Outcome 1 Clinical Global: CGI.

Comparison 5 Memantine 20 mg vs placebo for mild‐to‐moderate vascular dementia. Six‐month studies, Outcome 2 Cognitive function: ADAS‐Cog.

Comparison 5 Memantine 20 mg vs placebo for mild‐to‐moderate vascular dementia. Six‐month studies, Outcome 3 Decline in ADL: NOSGER self‐care subscale.

Comparison 5 Memantine 20 mg vs placebo for mild‐to‐moderate vascular dementia. Six‐month studies, Outcome 4 Behaviour: NOSGER disturbing behaviour subscale.

Comparison 5 Memantine 20 mg vs placebo for mild‐to‐moderate vascular dementia. Six‐month studies, Outcome 5 Cognitive function: ADAS‐Cog: post‐hoc subgroup analysis.

Comparison 5 Memantine 20 mg vs placebo for mild‐to‐moderate vascular dementia. Six‐month studies, Outcome 6 All‐cause discontinuation.

Comparison 5 Memantine 20 mg vs placebo for mild‐to‐moderate vascular dementia. Six‐month studies, Outcome 7 Discontinuation due to adverse events.

Comparison 5 Memantine 20 mg vs placebo for mild‐to‐moderate vascular dementia. Six‐month studies, Outcome 8 Number suffering at least one adverse event.

Comparison 5 Memantine 20 mg vs placebo for mild‐to‐moderate vascular dementia. Six‐month studies, Outcome 9 Number suffering agitation as an adverse event.

Comparison 6 Memantine vs placebo for Parkinson's disease dementia (PDD) and dementia with Lewy bodies (DLB). ITT‐LOCF Data, Outcome 1 Clinical Global (24 weeks).

Comparison 6 Memantine vs placebo for Parkinson's disease dementia (PDD) and dementia with Lewy bodies (DLB). ITT‐LOCF Data, Outcome 2 Cognitive Function.

Comparison 6 Memantine vs placebo for Parkinson's disease dementia (PDD) and dementia with Lewy bodies (DLB). ITT‐LOCF Data, Outcome 3 Decline in ADL (24 weeks).

Comparison 6 Memantine vs placebo for Parkinson's disease dementia (PDD) and dementia with Lewy bodies (DLB). ITT‐LOCF Data, Outcome 4 Behaviour and Mood: NPI.

Comparison 6 Memantine vs placebo for Parkinson's disease dementia (PDD) and dementia with Lewy bodies (DLB). ITT‐LOCF Data, Outcome 5 All‐cause discontinuation.

Comparison 6 Memantine vs placebo for Parkinson's disease dementia (PDD) and dementia with Lewy bodies (DLB). ITT‐LOCF Data, Outcome 6 Discontinuation due to adverse events.

Comparison 6 Memantine vs placebo for Parkinson's disease dementia (PDD) and dementia with Lewy bodies (DLB). ITT‐LOCF Data, Outcome 7 Number suffering at least one adverse event.

Comparison 7 Memantine vs placebo for frontotemporal dementia (FTD), Outcome 1 Clinical Global.

Comparison 7 Memantine vs placebo for frontotemporal dementia (FTD), Outcome 2 Cognitive Function: MMSE.

Comparison 7 Memantine vs placebo for frontotemporal dementia (FTD), Outcome 3 Behaviour and Mood: Neuropsychiatric Inventory (NPI) Total.

Comparison 7 Memantine vs placebo for frontotemporal dementia (FTD), Outcome 4 All‐cause discontinuation.

Comparison 7 Memantine vs placebo for frontotemporal dementia (FTD), Outcome 5 Discontinuation due to adverse events.

Comparison 7 Memantine vs placebo for frontotemporal dementia (FTD), Outcome 6 Number suffering at least one adverse event.

Comparison 7 Memantine vs placebo for frontotemporal dementia (FTD), Outcome 7 Number suffering at serious adverse events.

Comparison 7 Memantine vs placebo for frontotemporal dementia (FTD), Outcome 8 Number suffering agitation as an adverse event.

Comparison 8 SUMMARY: memantine 20 mg/day or equivalent vs placebo at six to seven months, by dementia type and by severity, Outcome 1 Clinical Global ‐ by dementia type and severity.

Comparison 8 SUMMARY: memantine 20 mg/day or equivalent vs placebo at six to seven months, by dementia type and by severity, Outcome 2 Cognitive Function ‐ by dementia type and severity.

Comparison 8 SUMMARY: memantine 20 mg/day or equivalent vs placebo at six to seven months, by dementia type and by severity, Outcome 3 Decline in ADL ‐ by dementia type and severity.

Comparison 8 SUMMARY: memantine 20 mg/day or equivalent vs placebo at six to seven months, by dementia type and by severity, Outcome 4 Behaviour and mood ‐ by dementia type and severity.

Comparison 8 SUMMARY: memantine 20 mg/day or equivalent vs placebo at six to seven months, by dementia type and by severity, Outcome 5 Number suffering agitation ‐ by dementia type and severity.

Comparison 8 SUMMARY: memantine 20 mg/day or equivalent vs placebo at six to seven months, by dementia type and by severity, Outcome 6 Number suffering agitation ‐ by dementia type and ChEI.

Comparison 8 SUMMARY: memantine 20 mg/day or equivalent vs placebo at six to seven months, by dementia type and by severity, Outcome 7 All‐cause discontinuation (all durations) ‐ by dementia type and severity.

Comparison 8 SUMMARY: memantine 20 mg/day or equivalent vs placebo at six to seven months, by dementia type and by severity, Outcome 8 Discontinuation due to adverse events ‐ by dementia type and severity.

Comparison 8 SUMMARY: memantine 20 mg/day or equivalent vs placebo at six to seven months, by dementia type and by severity, Outcome 9 Number suffering at least one adverse event ‐ by dementia type and severity.

Comparison 8 SUMMARY: memantine 20 mg/day or equivalent vs placebo at six to seven months, by dementia type and by severity, Outcome 10 Number suffering at least one serious AE ‐ by dementia type and severity.

Comparison 8 SUMMARY: memantine 20 mg/day or equivalent vs placebo at six to seven months, by dementia type and by severity, Outcome 11 Number suffering agitation as an adverse event ‐ by dementia type.

Comparison 9 Adverse reactions: memantine vs placebo for mild to severe dementia. All diagnoses, all durations, Outcome 1 All‐cause discontinuation.

Comparison 9 Adverse reactions: memantine vs placebo for mild to severe dementia. All diagnoses, all durations, Outcome 2 Discontinuation due to adverse events.

Comparison 9 Adverse reactions: memantine vs placebo for mild to severe dementia. All diagnoses, all durations, Outcome 3 Number suffering at least one adverse event.

Comparison 9 Adverse reactions: memantine vs placebo for mild to severe dementia. All diagnoses, all durations, Outcome 4 Number suffering serious adverse events.

Comparison 9 Adverse reactions: memantine vs placebo for mild to severe dementia. All diagnoses, all durations, Outcome 5 Number suffering agitation as an adverse event.

Comparison 9 Adverse reactions: memantine vs placebo for mild to severe dementia. All diagnoses, all durations, Outcome 6 Number suffering insomnia as an adverse event.

Comparison 9 Adverse reactions: memantine vs placebo for mild to severe dementia. All diagnoses, all durations, Outcome 7 Number suffering confusion as an adverse event.

Comparison 9 Adverse reactions: memantine vs placebo for mild to severe dementia. All diagnoses, all durations, Outcome 8 Number suffering depression as an adverse event.

Comparison 9 Adverse reactions: memantine vs placebo for mild to severe dementia. All diagnoses, all durations, Outcome 9 Number suffering headache as an adverse event.

Comparison 9 Adverse reactions: memantine vs placebo for mild to severe dementia. All diagnoses, all durations, Outcome 10 Number suffering hypertension as an adverse event.

Comparison 9 Adverse reactions: memantine vs placebo for mild to severe dementia. All diagnoses, all durations, Outcome 11 Number suffering dizziness as an adverse event.

Comparison 9 Adverse reactions: memantine vs placebo for mild to severe dementia. All diagnoses, all durations, Outcome 12 Number suffering falls as an adverse event.

Comparison 9 Adverse reactions: memantine vs placebo for mild to severe dementia. All diagnoses, all durations, Outcome 13 Number suffering accidental injury as an adverse event.

Comparison 9 Adverse reactions: memantine vs placebo for mild to severe dementia. All diagnoses, all durations, Outcome 14 Number suffering urinary incontinence as an adverse event.

Comparison 9 Adverse reactions: memantine vs placebo for mild to severe dementia. All diagnoses, all durations, Outcome 15 Number suffering diarrhoea as an adverse event.

Comparison 9 Adverse reactions: memantine vs placebo for mild to severe dementia. All diagnoses, all durations, Outcome 16 Number suffering influenza like symptoms as an adverse event.

Comparison 10 APPENDIX 3: Comparison of LOCF and OC analyses: memantine 20 mg or equivalent versus placebo for Alzheimer's disease. 24‐to 30‐week data, Outcome 1 Cognitive function.

Comparison 10 APPENDIX 3: Comparison of LOCF and OC analyses: memantine 20 mg or equivalent versus placebo for Alzheimer's disease. 24‐to 30‐week data, Outcome 2 Decline in ADL: ADCS‐ADL19/23.

Comparison 10 APPENDIX 3: Comparison of LOCF and OC analyses: memantine 20 mg or equivalent versus placebo for Alzheimer's disease. 24‐to 30‐week data, Outcome 3 Cognitive Function: SIB/ADASCog/MMSE.

Comparison 10 APPENDIX 3: Comparison of LOCF and OC analyses: memantine 20 mg or equivalent versus placebo for Alzheimer's disease. 24‐to 30‐week data, Outcome 4 Decline in Activities of Daily Living.

Comparison 11 APPENDIX 4: memantine vs placebo for mild to severe Alzheimer's disease. OC. 12‐52 weeks, Outcome 1 Clinical Global.

Comparison 11 APPENDIX 4: memantine vs placebo for mild to severe Alzheimer's disease. OC. 12‐52 weeks, Outcome 2 Cognitive Function.

Comparison 11 APPENDIX 4: memantine vs placebo for mild to severe Alzheimer's disease. OC. 12‐52 weeks, Outcome 3 Decline in ADL.

Comparison 11 APPENDIX 4: memantine vs placebo for mild to severe Alzheimer's disease. OC. 12‐52 weeks, Outcome 4 Behaviour and Mood.

Comparison 11 APPENDIX 4: memantine vs placebo for mild to severe Alzheimer's disease. OC. 12‐52 weeks, Outcome 5 Clinical Global ‐ sensitivity analysis for high RoB.

Comparison 11 APPENDIX 4: memantine vs placebo for mild to severe Alzheimer's disease. OC. 12‐52 weeks, Outcome 6 Cognitive Function ‐ sensitivity analysis for high risk of bias.

Comparison 11 APPENDIX 4: memantine vs placebo for mild to severe Alzheimer's disease. OC. 12‐52 weeks, Outcome 7 Decline in ADL ‐ sensitivity analysis on high RoB.

Comparison 11 APPENDIX 4: memantine vs placebo for mild to severe Alzheimer's disease. OC. 12‐52 weeks, Outcome 8 Behaviour and Mood ‐ sensitivity analysis on high RoB.

Comparison 12 APPENDIX 4: subgroup analysis by duration: memantine 20 mg or equivalent vs placebo for mild‐to‐severe Alzheimer's disease. OC. 12‐52 weeks, Outcome 1 Clinical Global ‐ CIBIC Plus, CGI‐I, or ADCS‐CGIC.

Comparison 12 APPENDIX 4: subgroup analysis by duration: memantine 20 mg or equivalent vs placebo for mild‐to‐severe Alzheimer's disease. OC. 12‐52 weeks, Outcome 2 Cognitive Function.

Comparison 12 APPENDIX 4: subgroup analysis by duration: memantine 20 mg or equivalent vs placebo for mild‐to‐severe Alzheimer's disease. OC. 12‐52 weeks, Outcome 3 Decline in ADL ‐ BGP, ADCS‐ADL 19 or 23.

Comparison 12 APPENDIX 4: subgroup analysis by duration: memantine 20 mg or equivalent vs placebo for mild‐to‐severe Alzheimer's disease. OC. 12‐52 weeks, Outcome 4 Behaviour and Mood (Standardised NPI or NPI‐NH Total).

Comparison 13 APPENDIX 4: memantine 10 mg versus 20 mg memantine for Alzheimer's disease (12‐24 weeks), Outcome 1 Clinical Global; 10mg versus 20mg.

Comparison 13 APPENDIX 4: memantine 10 mg versus 20 mg memantine for Alzheimer's disease (12‐24 weeks), Outcome 2 Cognitive function; 10mg vs 20 mg.

Comparison 13 APPENDIX 4: memantine 10 mg versus 20 mg memantine for Alzheimer's disease (12‐24 weeks), Outcome 3 Decline in ADL; 10mg versus 20mg.

Comparison 13 APPENDIX 4: memantine 10 mg versus 20 mg memantine for Alzheimer's disease (12‐24 weeks), Outcome 4 Behaviour and mood; 10mg versus 20mg.

Comparison 13 APPENDIX 4: memantine 10 mg versus 20 mg memantine for Alzheimer's disease (12‐24 weeks), Outcome 5 Clinical Global.

Comparison 13 APPENDIX 4: memantine 10 mg versus 20 mg memantine for Alzheimer's disease (12‐24 weeks), Outcome 6 Cognitive function.

Comparison 13 APPENDIX 4: memantine 10 mg versus 20 mg memantine for Alzheimer's disease (12‐24 weeks), Outcome 7 Decline in activities of daily living.

Comparison 13 APPENDIX 4: memantine 10 mg versus 20 mg memantine for Alzheimer's disease (12‐24 weeks), Outcome 8 Behaviour and mood.

Comparison 14 APPENDIX 4: subgroup analysis by presence/absence of ChEI; 20 mg; six to seven months, Outcome 1 Clinical Global: subgroup analysis by +/‐ ChEI.

Comparison 14 APPENDIX 4: subgroup analysis by presence/absence of ChEI; 20 mg; six to seven months, Outcome 2 Cognitive Function subgroup analysis by +/‐ ChEI.

Comparison 14 APPENDIX 4: subgroup analysis by presence/absence of ChEI; 20 mg; six to seven months, Outcome 3 Decline in ADL subgroup analysis by +/‐ ChEI.

Comparison 14 APPENDIX 4: subgroup analysis by presence/absence of ChEI; 20 mg; six to seven months, Outcome 4 Behaviour and Mood: subgroup analysis by +/‐ ChEI.

Comparison 15 APPENDIX 4: subgroup analysis by severity/stage of AD: memantine 20 mg or equivalent vs placebo. OC. 24‐28 weeks, Outcome 1 Clinical Global.

Comparison 15 APPENDIX 4: subgroup analysis by severity/stage of AD: memantine 20 mg or equivalent vs placebo. OC. 24‐28 weeks, Outcome 2 Cognitive Function.

Comparison 15 APPENDIX 4: subgroup analysis by severity/stage of AD: memantine 20 mg or equivalent vs placebo. OC. 24‐28 weeks, Outcome 3 Decline in ADL.

Comparison 15 APPENDIX 4: subgroup analysis by severity/stage of AD: memantine 20 mg or equivalent vs placebo. OC. 24‐28 weeks, Outcome 4 Behaviour and Mood.

Comparison 15 APPENDIX 4: subgroup analysis by severity/stage of AD: memantine 20 mg or equivalent vs placebo. OC. 24‐28 weeks, Outcome 5 Clinical Global.

Comparison 15 APPENDIX 4: subgroup analysis by severity/stage of AD: memantine 20 mg or equivalent vs placebo. OC. 24‐28 weeks, Outcome 6 Cognitive Function.

Comparison 15 APPENDIX 4: subgroup analysis by severity/stage of AD: memantine 20 mg or equivalent vs placebo. OC. 24‐28 weeks, Outcome 7 Decline in ADL.

Comparison 15 APPENDIX 4: subgroup analysis by severity/stage of AD: memantine 20 mg or equivalent vs placebo. OC. 24‐28 weeks, Outcome 8 Behaviour and Mood.

Comparison 15 APPENDIX 4: subgroup analysis by severity/stage of AD: memantine 20 mg or equivalent vs placebo. OC. 24‐28 weeks, Outcome 9 All‐cause discontinuation, by type of disease and severity.

Comparison 15 APPENDIX 4: subgroup analysis by severity/stage of AD: memantine 20 mg or equivalent vs placebo. OC. 24‐28 weeks, Outcome 10 Discontinuation due to adverse events, by disease type and severity.

Comparison 16 APPENDIX 4: subgroup analysis by severity/stage of AD: mild versus moderate/severe memantine 20 mg or equivalent vs placebo. OC. 24‐28 weeks, Outcome 1 Clinical Global ‐ mild vs moderate/severe.

Comparison 16 APPENDIX 4: subgroup analysis by severity/stage of AD: mild versus moderate/severe memantine 20 mg or equivalent vs placebo. OC. 24‐28 weeks, Outcome 2 Cognitive Function ‐ mild vs moderate/severe.

Comparison 16 APPENDIX 4: subgroup analysis by severity/stage of AD: mild versus moderate/severe memantine 20 mg or equivalent vs placebo. OC. 24‐28 weeks, Outcome 3 Decline in ADL ‐ mild vs moderate/severe.

Comparison 16 APPENDIX 4: subgroup analysis by severity/stage of AD: mild versus moderate/severe memantine 20 mg or equivalent vs placebo. OC. 24‐28 weeks, Outcome 4 Behaviour and Mood ‐ mild vs moderate/severe.

Comparison 16 APPENDIX 4: subgroup analysis by severity/stage of AD: mild versus moderate/severe memantine 20 mg or equivalent vs placebo. OC. 24‐28 weeks, Outcome 5 All‐cause discontinuation ‐ mild vs moderate/severe.

Comparison 16 APPENDIX 4: subgroup analysis by severity/stage of AD: mild versus moderate/severe memantine 20 mg or equivalent vs placebo. OC. 24‐28 weeks, Outcome 6 Discontinuations due to adverse events ‐ mild vs moderate/severe.

Comparison 17 APPENDIX 4: subgroup analysis by severity/stage of AD: severe versus moderate, Outcome 1 Clinical Global: post‐hoc within‐trial subgroup analyses.

Comparison 17 APPENDIX 4: subgroup analysis by severity/stage of AD: severe versus moderate, Outcome 2 Cognitive Function: post‐hoc within‐trial subgroup analyses.

Comparison 17 APPENDIX 4: subgroup analysis by severity/stage of AD: severe versus moderate, Outcome 3 Decline in ADL: post‐hoc within‐trial subgroup analyses.

Comparison 17 APPENDIX 4: subgroup analysis by severity/stage of AD: severe versus moderate, Outcome 4 Clinical Global: by severity of disease.

Comparison 17 APPENDIX 4: subgroup analysis by severity/stage of AD: severe versus moderate, Outcome 5 Cognitive Function: by severity of disease.

Comparison 17 APPENDIX 4: subgroup analysis by severity/stage of AD: severe versus moderate, Outcome 6 Decline in ADL: by severity of disease.

Comparison 17 APPENDIX 4: subgroup analysis by severity/stage of AD: severe versus moderate, Outcome 7 Behaviour and Mood: by severity of disease.
| Memantine 20 mg or equivalent compared to placebo for moderate‐to‐severe Alzheimer's disease (AD) 24‐ to 30‐week data. OC | ||||||
| Population: Alzheimer's disease (AD), moderate‐to‐severe | ||||||
| Continuous outcomes | Score with placebo (median) | Mean improvement in change score between memantine and placebo | SMD (95% CI) meta‐analysis findings | № of participants | Certainty of the evidence | Comments |
| Clinical Global (CIBIC+) | Median CIBIC+ score was 4.60 3 (i.e. deterioration with time) | MD: 0.21 (0.14 to 0.30) | ‐0.20 (‐0.28 to ‐0.13) | 2797 | ⊕⊕⊕⊕ | SMD as a negative outcome Converted to CIBIC+ scale; median SD(pooled) = 1.06. |
| Cognitive Function (SIB) | Median SIB score at baseline: 75.2. Median change from baseline (positive scale): ‐2.4 4 (i.e. deterioration with time) | MD: 3.11 (2.42 to 3.92) | ‐0.27 (‐0.34 to ‐0.21) | 3337 | ⊕⊕⊕⊕ | SMD as a negative outcome (Analysis 1.2). Converted to SIB scale (and scale direction inverted); median SD (pooled) = 11.53. |
| Functional performance on activities of daily living: ADCS‐ADL19 | Median ADCS‐ADL19 score at baseline: 33.2 Median change from baseline (positive scale): ‐2.8 5 (i.e. deterioration with time) | MD: 1.09 (0.62 to 1.64) | ‐0.16 (‐0.24 to ‐0.09) | 2687 | ⊕⊕⊕⊕ | SMD for decline in ADL (a negative outcome) (Analysis 1.3). Converted to ADCS‐ADL19 scale (and scale direction inverted); median SD(pooled) = 6.84. |
| Behaviour and Mood (NPI) 144‐point scale | The median baseline NPI score was 17.0. Median change from baseline (negative scale): 2.80 6 (i.e. deterioration with time) | MD: 1.84 (1.05 to 2.76) | ‐0.14 (‐0.21 to ‐0.08) | 3674 | ⊕⊕⊕⊕ | SMD as a negative outcome Converted to NPI scale; median SD(pooled) = 13.15. |
| Binary outcomes | Anticipated absolute effects | Relative effect | № of participants | Certainty of the evidence | Comments | |
| Risk with placebo (median) | Risk with memantine | |||||
| All‐cause discontinuation | 182 per 1000 | 169 per 1000 | RR 0.93 | 5087 924 events | ⊕⊕⊕⊕ | RR and median control group risk in people with moderate‐to‐severe AD without agitation (Analysis 16.5). |
| Difference: 13 fewer people per 1000 discontinued treatment for any cause (95% CI 31 fewer to 7 more) | ||||||
| Number suffering at least one adverse event | 716 per 1000 | 737 per 1000 | RR 1.03 | 8033 5371 events | ⊕⊕⊕⊕ | RR from all studies (Analysis 9.3). Median control group risk for moderate‐to‐severe AD studies (Analysis 1.7). |
| Difference: 21 more people per 1000 suffered adverse events | ||||||
| Number suffering at least one serious adverse event | 114 per 1000 | 104 per 1000 (93 to 116) | RR 0.91 | 6482 (19 RCTs) 918 events | ⊕⊕⊕⊕ | RR and median control risk from all AD studies (except those with agitation) (from Analysis 8.10) |
| Difference: 10 fewer people per 1000 suffered serious adverse events (95% CI 21 fewer to 2 more) | ||||||
| Number suffering agitation as an adverse event | 129 per 1000 | 104 per 1000 | RR 0.81 | 4395 321 events | ⊕⊕⊕⊝ | RR from all AD studies (apart from those in people with agitation) (Analysis 8.11). Median control group risk for moderate‐to‐severe AD studies (Analysis 1.9). |
| Difference: 25 fewer people per 1000 suffered agitation as an adverse event | ||||||
| *The risk in the intervention group (and its 95% confidence interval) is based on the assumed risk in the comparison group and the relative effect of the intervention (and its 95% CI). | ||||||
| GRADE Working Group grades of evidence | ||||||
| 1 Some inconsistency in point estimates, but not enough to downgrade 2 Some inconsistency in point estimates (downgrade once) 3 Median control group values for 8 studies reporting CIBIC+ (Asada 2011a (IE3501); Bakchine 2008 (99679) SG; Grossberg 2008 (MD‐50); Peskind 2004 (MD‐10) SG; Porsteinsson 2008(MD‐12)S; Reisberg 2003 (9605); Tariot 2004 (MD‐02); van Dyck 2007 (MD‐01)) 4 Median control group baseline scores and median control group change from baseline for 5 studies reporting SIB (Grossberg 2008 (MD‐50); Reisberg 2003 (9605); Tariot 2004 (MD‐02); van Dyck 2007 (MD‐01); Wang 2013) 5 Median control group baseline scores and median control group change from baseline for the 4 studies reporting ADCS‐ADL19 (Grossberg 2008 (MD‐50); Reisberg 2003 (9605);Tariot 2004 (MD‐02); van Dyck 2007 (MD‐01)) 6 Median control group baseline scores and median control group change from baseline for the 10 studies reporting NPI (Bakchine 2008 (99679) SG; Dysken 2014 SG; Grossberg 2008 (MD‐50); Howard 2012 (DOMINO‐AD); Peskind 2004 (MD‐10) SG; Porsteinsson 2008(MD‐12)S; Reisberg 2003 (9605); Tariot 2004 (MD‐02); van Dyck 2007 (MD‐01); Wang 2013) | ||||||
| Memantine 20 mg compared to placebo for mild‐to‐moderate vascular dementia. six‐month studies | ||||||
| Population: vascular dementia, mild‐to‐moderate severity | ||||||
| Continuous outcomes | Score with placebo (mean) | Mean improvement in change score between memantine and placebo | SMD (95% CI) meta‐analysis findings | № of participants | Certainty of the evidence | Comments |
| Clinical Global: (CIBIC+) | CIBIC+ score (i.e. no change with time) | MD: 0.03 (‐0,28 to 0.34) | ‐0.02 (‐0.23 to 0.19) | 757 | ⊕⊕⊕⊝ | SMD as a negative outcome; random effects (Analysis 5.1). Converted to CIBIC+ scale; SD(pooled) = 1.46. |
| Cognitive function: ADAS‐Cog | Mean ADAS‐Cog score at baseline was 23.6. Mean change from (i.e. deterioration with time) | MD: 2.15 (1.05 to 3.25) | ‐0.32 (‐0.48 to ‐0.15) | 569 | ⊕⊕⊕⊝ | Analysed as mean difference (Analysis 5.2) [SMD as a negative outcome Analysis 8.2] |
| Performance on ADL (NOSGER self care subscale) Subscale 5 points | Baseline scores not reported. Change from baseline i.e. deterioration with time | MD: 0.11 (‐0.35 to 0.54) | ‐0.04 (‐0.20 to 0.13) | 542 | ⊕⊕⊝⊝ | SMD for decline in ADL (a negative outcome) (Analysis 5.3). Converted to NOSGER II self‐care subscale (Wilcock 2002 (9202)) SD(pooled) = 2.69. |
| Behaviour: NOSGER disturbing behaviour subscale Subscale 5 points | Baseline scores not reported. Change from baseline for the NOSGER i.e. deterioration with time | MD: 0.47 (0.07 to 0.87) | ‐0.20 (‐0.37 to ‐0.03) | 542 | ⊕⊕⊝⊝ | SMD as a negative outcome (Analysis 5.4). Converted to NOSGER II disturbing behaviour subscale (Wilcock 2002 (9202)) SD(pooled) = 2.34. |
| Binary outcomes | Anticipated absolute effects | Relative effect | № of participants | Certainty of the evidence | Comments | |
| Risk with placebo (median) | Risk with memantine | |||||
| All‐cause discontinuation | 218 per 1000 | 229 per 1000 | RR 1.05 | 900 678 events | ⊕⊕⊝⊝ | RR and control group risk for studies in people with vascular dementia (Analysis 5.6.) |
| Difference: 11 more people per 1000 discontinued treatment for any cause (95% CI 37 fewer to 74 more) | ||||||
| Number suffering at least one adverse event | 742 per 1000 | 764 per 1000 | RR 1.03 | 8033 5371 events | ⊕⊕⊕⊕ | RR from all studies (Analysis 9.3). Control group risk taken from studies in vascular dementia (Analysis 5.8) |
| Difference: 22 more people per 1000 suffered adverse events | ||||||
| Number suffering at least one serious adverse event | 211 per 1000 | 173 per 1000 (95% CI 131 to 230) | RR 0.82 (0.62 to 1.09) | 900 (2 RCTs) 162 events | ⊕⊕⊝⊝ | RR and control group risk from vascular dementia studies (Analysis 8.10) |
| Difference: 38 fewer people per 1000 suffered serious adverse events (95% CI 80 fewer to 19 more) | ||||||
| Number suffering agitation as an adverse event | 77 per 1000 | 44 per 1000 | RR 0.57 | 900 54 events | ⊕⊕⊝⊝ | RR and control group risk from vascular dementia studies (Analysis 5.9); random effects |
| Difference: 33 fewer people per 1000 suffered agitation as an adverse event | ||||||
| *The risk in the intervention group (and its 95% confidence interval) is based on the assumed risk in the comparison group and the relative effect of the intervention (and its 95% CI). | ||||||
| GRADE Working Group grades of evidence | ||||||
| 1 Inconsistency in point estimates (and I² = 48%); some imprecision (95% CI crossed null and was consistent with benefit and no difference) but may be consequence of inconsistency (downgraded once overall) 2 Majority of the information at high risk of bias (downgrade once). Some inconsistency (but insufficient to downgrade) 3 Majority of the information at high risk of bias for 2 domains (downgrade twice) 4 Majority of the information at high risk of bias (downgrade once); some inconsistency and some imprecision (crossed null and 1.25) (downgrade once) 5 Majority of the information at high risk of bias (downgrade once); imprecision (162 events and crossed both 0.75 and null)) (downgrade once) 6 Majority of the information at high risk of bias (downgrade once); imprecision (only 54 events) (downgrade once) | ||||||
| Study | Clinical Global | Cognitive function | Decline in ADL | Behaviour and mood | ||||||||||
| CIBIC‐Plus | CGIC/ | CDR | ADAS‐ | SIB | MMSE | ADCS‐ | ADL‐19 | BADLS | BGP | DAD | NPI | BEHAVE | Other | |
| Alzheimers' disease studies | X | |||||||||||||
| X | X | Japanese versions. DAD, Caregiver‐rated Crichton Scale, MMSE, CDR | ||||||||||||
| X | X | X | Japanese versions | |||||||||||
| X | MMSE | |||||||||||||
| X | X | X | X | |||||||||||
| X | X | X | MMSE, Caregiver activity survey | |||||||||||
| X | X | X | NPI nursing home version; CMAI | |||||||||||
| X | X | X | CMAI, NPI‐Agitation | |||||||||||
| X | X | X | CMAI, MMSE, QOL‐AD, incidence of agitation | |||||||||||
| X | X | X | X | CMAI | ||||||||||
| X | X | X | X | |||||||||||
| FLCI, ASHA FACS (caregiver assessment) | ||||||||||||||
| X | DriveABLE On‐Road Test, MMSE | |||||||||||||
| X | X | X | X | Japanese versions.MMSE, FAST, BEHAVE‐AD. ADL scale not stated | ||||||||||
| X | X | X | EQ‐5D, GHQ‐12 | |||||||||||
| X | Final values only, no change scores | |||||||||||||
| X | X | X | MMSE | |||||||||||
| X | X | Japanese versions; Crichton scale | ||||||||||||
| X | X | X | X | |||||||||||
| X | X | X | CDR sum of boxes | |||||||||||
| X | X | X | X | |||||||||||
| X | X | X | X | FAST; ADL modified for severe dementia | ||||||||||
| X | X | X | X | MMSE; ADL scale not stated | ||||||||||
| X | X | X | X | |||||||||||
| X | X | X | X | FAST | ||||||||||
| X | X | MMSE, ADAS‐Cog | ||||||||||||
| X | X | Change in total brain volume, Agitation | ||||||||||||
| Vascular Dementia or dementia syndrome | ||||||||||||||
| X (PGI scale) | X | Physician's Global Impression, Syndrom Kurztest, SCAG; ADL scale not stated | ||||||||||||
| X | X | GBS, Tapping test, Trace test, SCAG; modified ADL | ||||||||||||
| X | X | X (NOSGER) | X (NOSGER) | CGIC, GBS, MMSE, NOSGER subscales for self‐care ADL and disturbing behaviour | ||||||||||
| X | Global assessment of clinical efficacy, NOSIE‐Index, SCAG | |||||||||||||
| X | X | X (NOSGER) | X (NOSGER) | NOSGER subscales for self‐care ADL and disturbing behaviour | ||||||||||
| X | X (BGP | X | D‐scale, AD subgroup also reported | |||||||||||
| Study | Number randomised | Diagnosis | Severity of disease | Mean age | Mean MMSE | % female | duration (weeks) |
| MODERATE‐TO‐SEVERE AD | |||||||
| 432 | AD | moderately severe‐to‐severe | not stated | ˜9.9 | not stated | 24 | |
| 165 | AD Nursing home | moderate‐to‐severe | 85.3 | ˜11.3 | 85 | 24 | |
| 34 | AD agitation | moderate‐to‐severe | 79.6 | 3‐18 | 80 | 12 | |
| 153 | AD agitation | moderate‐to‐severe MMSE < 20 | 84.1 | 7.5 | 72 | 12 | |
| 369 | AD agitation | moderate‐to‐severe | ˜74.9 | 11.9 | ˜58.3 | 24 | |
| 677 | AD | moderate‐to‐severe | 76.5 | 10.8 | 72 | 24 | |
| 265 | AD | moderate | ˜74.9 | 10‐19 | 58 | 12 | |
| 207 | AD | moderate‐to‐severe MMSE 5‐14 | 73.4 | ˜10.3 | 72 | 24 | |
| 295 | AD | moderate‐to‐severe (52% severe 5 to 9) | 77.1 | 9.1 | 65 | 52 | |
| 15 | AD | moderate‐to‐severe | 76.5 | ˜14.5 | 87 | 26 | |
| 250 | AD | MMSE 5‐18 | 72.3 | 11.8 | 60 | 16 | |
| 546 | AD | moderate‐to‐severe | ˜78.5 | ˜10.8 | ˜72.8 | 24 | |
| 252 | AD | moderately severe‐to‐severe | 76.1 | 7.9 | 67 | 28 | |
| 404 | AD | moderate‐to‐severe | 75.5 | 9.9 | 64.8 | 24 | |
| 350 | AD | moderate‐to‐severe | 78.2 | ˜10.1 | 71.4 | 24 | |
| 79 | AD | severe | ˜74.2 | 6.7 | ˜67 | 12 | |
| MILD‐TO‐MODERATE AD | |||||||
| 367 | AD | mild‐to‐moderate MMSE 10‐23 | not stated | 10‐23 | not stated | 24 | |
| 13 | AD | mild‐ to‐moderate | 76 | ˜21 | 38 | 52 | |
| 470 | AD | mild‐to‐moderate 11‐23 | 74 | ˜18.7 | 65 | 26 | |
| 307 and 306 (vit E) | AD | mild‐to‐moderate | ˜79.1 | 20.8 | ˜3 | 5 years | |
| 26 | AD | mild | 79.3 | ˜27.9 | 35 | 52 | |
| 226 | AD | mild‐to‐moderate | ˜72.4 | ˜22.2 | ˜63.7 | 52 | |
| 403 | AD | mild‐to‐moderate | 77.5 | 17.1 | 58.8 | 24 | |
| 432 | AD | mild‐to‐moderate | ˜75.5 | ˜16.8 | ˜52 | 24 | |
| 37 | AD | mild‐to‐moderate | 76.2 | 19.0 | 64 | 52 | |
| 22 | AD | mild‐to‐moderate | ˜65 | ˜12.1 | 64 | 22 | |
| 277 | AD | moderate | 74 | 16.8 | 57 | 52 | |
| Memantine 20 mg or equivalent compared to placebo, with concomitant ChEI, for moderate‐to‐severe AD. 24‐30 week data. OC | ||||||
| Population: Alzheimer's disease, moderate‐to‐severe | ||||||
| Continuous outcomes | Score with placebo (median) | Mean improvement in change score between memantine and placebo | SMD (95% CI) meta‐analysis findings | № of participants | Certainty of the evidence | Comments |
| Clinical Global (CIBIC+) | The median CIBIC+ score was 4.5 3 (i.e. deterioration with time) | MD: 0.21 (0.06 to 0.36) | ‐0.21 (‐0.32 to ‐0.09) | 1125 | ⊕⊕⊕⊝ | Analysed as mean difference. Random effects (Analysis 2.8) [SMD as a negative outcome (Analysis 2.1)] |
| Cognitive Function (SIB) | Mean SIB score at baseline: 77.6. Mean change from baseline (positive scale): ‐1.2 4 (i.e. slight deterioration with time) | MD: 2.48 (1.45 to 3.41) | ‐0.24 (‐0.33 to ‐0.14) | 1852 | ⊕⊕⊕⊕ | SMD as a negative outcome Converted to SIB scale (and scale direction inverted); median SD(pooled) = 10.34. |
| Performance on ADL: (ADCS‐ADL19) | Mean ADCS‐ADL19 score at baseline: 34.3. Mean change from baseline (positive scale): ‐2.2 5 (i.e. deterioration over time) | MD: 0.95 (0.22 to 1.76) | ‐0.13 (‐0.24 to ‐0.03) | 1319 | ⊕⊕⊕⊕ | SMD for decline in ADL as a negative outcome (Analysis 2.3) Converted to ADCS‐ADL19 scale (and scale direction inverted); median SD(pooled) = 7.33. |
| Behaviour and Mood (NPI) 144‐point scale | Median baseline NPI score was 16.5. Median change from baseline (negative scale): 2.80 6 (i.e. deterioration with time) | MD: 2.20 (1.10 to 3.29) | ‐0.18 (‐0.27 to ‐0.09) | 1855 | ⊕⊕⊕⊕ | SMD as a negative outcome (Analysis 2.4) Converted to NPI scale; median SD(pooled) = 12.20 |
| Binary outcomes | Anticipated absolute effects | Relative effect | № of participants | Certainty of the evidence | Comments | |
| Risk with placebo (median) | Risk with memantine | |||||
| All‐cause discontinuation | 168 per 1000 | 156 per 1000 | RR 0.93 | 5087 | ⊕⊕⊕⊕ | RR for all moderate‐to‐severe AD studies (apart from those with agitation) (Analysis 16.5). Median control group risk for 6 studies in 2089 people with moderate‐to‐severe AD without agitation, receiving ChEIs (Analysis 2.9) |
| Difference: 12 fewer people per 1000 discontinued treatment for any cause (95% CI 29 fewer to 7 more) | ||||||
| Number suffering at least one adverse event | 639 per 1000 | 658 per 1000 | RR 1.03 | 8033 5371 events | ⊕⊕⊕⊕ | RR from all studies (Analysis 9.3). Median control group risk for moderate‐to‐severe AD studies in people receiving ChEIs (Analysis 2.11) |
| Difference: 19 more people per 1000 suffered adverse events | ||||||
| Number suffering at least one serious adverse event | 114 per 1000 | 104 per 1000 (93 to 116) | RR 0.91 | 6482 (19 RCTs) 918 events | ⊕⊕⊕⊕ | RR and median control risk from all AD studies (except those with agitation) (from Analysis 8.10) |
| Difference: 10 fewer people per 1000 suffered serious adverse events (95% CI 21 fewer to 2 more) | ||||||
| Number suffering agitation as an adverse event | 45 per 1000 | 41 per 1000 | RR 0.92 | 1225 3 79 events | ⊕⊕⊝⊝ | RR and median control group risk for studies in people with moderate‐to‐severe AD without agitation, receiving ChEIs (Analysis 2.13) |
| Difference: 4 fewer people per 1000 suffered agitation as an adverse event | ||||||
| *The risk in the intervention group (and its 95% confidence interval) is based on the assumed risk in the comparison group and the relative effect of the intervention (and its 95% CI). We adopt the convention that a negative mean difference always means an improvement (i.e. favouring memantine) | ||||||
| GRADE Working Group grades of evidence | ||||||
| 1 Some inconsistency or variation in the point estimates (downgraded once for inconsistency) 2 79 events; imprecision around relative effect (CI crossing 1.25 and 0.75)(downgraded twice) 3 Median control group values for 3 studies reporting CIBIC+ (Grossberg 2008 (MD‐50); Porsteinsson 2008(MD‐12)S; Tariot 2004 (MD‐02)) 4 Mean control group baseline scores and mean control group change from baseline for 2 studies reporting SIB (Grossberg 2008 (MD‐50); Tariot 2004 (MD‐02)) 5 Mean control group baseline scores and mean control group change from baseline for the 2 studies reporting ADCS‐ADL19 (Grossberg 2008 (MD‐50); Tariot 2004 (MD‐02)) 6 Median control group baseline scores and median control group change from baseline for the 5 studies reporting NPI (Dysken 2014 SG; Grossberg 2008 (MD‐50); Howard 2012 (DOMINO‐AD); Porsteinsson 2008(MD‐12)S; Tariot 2004 (MD‐02)) | ||||||
| Memantine 20 mg or equivalent compared to placebo, monotherapy, for moderate‐to‐severe AD. 24‐to 30‐week data observed case (OC) | ||||||
| Population: Alzheimer's disease, moderate‐to‐severe | ||||||
| Outcomes | Score with placebo (median) | Mean improvement in change score between memantine and placebo | SMD (95% CI) meta‐analysis findings | № of participants | Certainty of the evidence | Comments |
| Clinical Global 7‐point Likert scale | The median CIBIC+ score was 4.64 3 (i.e. deterioration with time) | MD: 0.22 (0.11 to 0.33) | ‐0.20 (‐0.30 to ‐0.10) | 1672 | ⊕⊕⊕⊕ | SMD as a negative outcome (Analysis 2.1). Converted to CIBIC+ scale; median SD(pooled) = 1.09. |
| Cognitive Function 100‐point scale | Median SIB score at baseline: 68.3. Median change from baseline (positive scale): ‐5.6 4 (i.e. deterioration with time) | MD: 3.97 (2.77 to | ‐0.33 (‐0.43 to ‐0.23) | 1485 | ⊕⊕⊕⊕ | SMD as a negative outcome (Analysis 2.2) Converted to SIB scale (and scale direction inverted); median SD(pooled) = 12.04. |
| Performance on ADL | Mean ADCS‐ADL19 score at baseline: 30.5. Mean change from baseline (positive scale): ‐4.15 (i.e. deterioration with time) | MD: 1.33 (0.20 to 2.00) | ‐0.20 (‐0.30 to ‐0.09) | 1368 | ⊕⊕⊕⊕ | SMD for decline in ADL as a negative outcome (Analysis 2.3) Converted to ADCS‐ADL19 scale (and scale direction inverted); median SD(pooled) = 6.67. |
| Behaviour and Mood (NPI) 144‐point scale | Median baseline NPI score was 18.5. Median change from baseline (negative scale): 1.95 6 (i.e. slight deterioration with time) | MD: 1.57 (0.16 to 2.98) | ‐0.10 (‐0.19 to ‐0.01) | 1819 | ⊕⊕⊕⊕ | SMD as a negative outcome (Analysis 2.4) Converted to NPI scale; median SD(pooled) = 15.70. |
| Binary outcomes | Anticipated absolute effects | Relative effect | № of participants | Certainty of the evidence | Comments | |
| Risk with placebo (median) | Risk with memantine | |||||
| All‐cause discontinuation | 188 per 1000 | 175 per 1000 | RR 0.93 | 5087 924 events | ⊕⊕⊕⊕ | RR for all studies in people with moderate‐to‐severe AD (apart from those with agitation) (Analysis 16.5). Median control group risk for 10 studies in 2459 people with moderate‐to‐severe AD without agitation, receiving monotherapy (Analysis 2.9) |
| Difference: 13 fewer people per 1000 discontinued treatment for any cause (95% CI 32 fewer to 8 more) | ||||||
| Number suffering at least one adverse event | 760 per 1000 | 783 per 1000 | RR 1.03 | 8033 5371 events | ⊕⊕⊕⊕ | RR from all studies (Analysis 9.3).Median control group risk for moderate‐to‐severe AD studies in people receiving monotherapy (Analysis 2.11) |
| Difference: 23 more people per 1000 suffered adverse events | ||||||
| Number suffering at least one serious adverse event | 114 per 1000 | 104 per 1000 (93 to 116) | RR 0.91 | 6482 (19 RCTs) 918 events | ⊕⊕⊕⊕ | RR and median control risk from all AD studies (except those with agitation) (from Analysis 8.10) |
| Difference: 10 fewer people per 1000 suffered serious adverse events (95% CI 21 fewer to 2 more) | ||||||
| Number suffering agitation as an adverse event | 164 per 1000 | 112 per 1000 | RR 0.68 | 1016 154 events | ⊕⊕⊕⊝ | RR and median control group risk for studies in people with moderate‐to‐severe AD without agitation, receiving monotherapy (Analysis 2.13) |
| Difference: 52 fewer people per 1000 suffered agitation as an adverse event | ||||||
| *The risk in the intervention group (and its 95% confidence interval) is based on the assumed risk in the comparison group and the relative effect of the intervention (and its 95% CI). | ||||||
| GRADE Working Group grades of evidence | ||||||
| 1 Some inconsistency in point estimates, but insufficient to downgrade 2 Some imprecision (193 events and borderline for CI crossing 1; CI crossed 0.75) and some inconsistency in point estimates ‐ downgrade once overall 3 Median control group values for 4 studies reporting CIBIC+ (Bakchine 2008 (99679) SG; Peskind 2004 (MD‐10) SG; Reisberg 2003 (9605); van Dyck 2007 (MD‐01)) 4 Median control group baseline scores and mean control group change from baseline for 3 studies reporting SIB (Reisberg 2003 (9605); van Dyck 2007 (MD‐01); Wang 2013) 5 Mean control group baseline scores and mean control group change from baseline for the 2 studies reporting ADCS‐ADL19 (Reisberg 2003 (9605); van Dyck 2007 (MD‐01)) 6 Median control group baseline scores and median control group change from baseline for the 4 studies reporting NPI (Howard 2012 (DOMINO‐AD); Reisberg 2003 (9605); van Dyck 2007 (MD‐01); Wang 2013) | ||||||
| Memantine 20 mg or equivalent compared to placebo, for moderate‐to‐severe AD, selected for agitation | ||||||
| Population: Alzheimer's disease, moderate‐to‐severe, selected for agitation | ||||||
| Outcomes | Score with placebo (median) | Mean improvement in change score between memantine and placebo | SMD (95% CI) meta‐analysis findings | № of participants | Certainty of the evidence | Comments |
| Clinical Global 7‐point Likert scale | The CIBIC+ score from one study was 4.63 5 (i.e. deterioration with time) | MD: 0.14 (‐0.17 to 0.44) (random effects) 24 week study only: MD: ‐0.05 (‐0.35 to 0.25) (Herrmann 2012 (10158)) | ‐0.11 (‐0.34 to 0.13) (random effects) | 443 24 week study: 275 participants | ⊕⊕⊝⊝ | SMD as a negative outcome (Analysis 3.5). Heterogeneity between 12 weeks (2 studies) and 24 weeks. Converted to CIBIC+ scale; SD(pooled) = 1.29 (Herrmann 2012 (10158)). |
| Cognitive Function 100‐point scale | Mean SIB score at baseline: 68.1. Median change from baseline (positive scale): ‐5.23 6 (i.e. deterioration with time) | MD: 4.34 (‐5.89 to 24 week study only: MD: ‐0.48 (‐2.57 to 1.61) (Herrmann 2012 (10158)) | ‐0.24 (‐0.84 to 0.36) (random effects) | 453 | ⊕⊝⊝⊝ | Analysed as mean difference (Analysis 3.6). [SMD as a negative outcome] |
| Performance on ADL | Mean ADCS‐ADL19 score at baseline: 32.5. Mean change from baseline (positive scale): ‐1.087 (i.e. slight deterioration with time) | MD: ‐1.48 (‐3.15 to 0.19) | 0.21 (‐0.02 to 0.43) | 309 | ⊕⊕⊝⊝ | Analysed as mean difference (Analysis 3.7) [SMD for decline in ADL as a negative outcome] |
| Behaviour and Mood (NPI) 144‐point scale | Median baseline NPI score was 33.3. Median change from baseline (negative scale): ‐8.6 8 (i.e. improvement with time) | MD: 1.51 (‐5.03 to 8.05) (random effects) | ‐0.07 (‐0.41 to 0.27) (random effects) | 470 | ⊕⊝⊝⊝ | Analysed as mean difference (random effects) (Analysis 3.8) [SMD as a negative outcome] |
| Agitation (Cohen Mansfield Agitation Inventory) range 29 ‐ 203 points | Mean baseline CMAI score was 57.7 Mean change from baseline (negative score) was ‐6.19 (i.e. improvement with time) | MD: 0.50 (‐3.71 to 4.71) (random effects) 2 studies in 422 participants | 0.11 (‐0.12 to 0.33) 2 studies in 306 participants | 455 (3 RCTs) | ⊕⊕⊕⊝ | MD and SMD as negative outcomes One study reported final scores (Fox 2012 (MAGD)), so not included in SMD. One study reported CMAI‐C (Forest 2006 (MD‐23)), so not included in MD meta‐analysis |
| Binary outcomes | Anticipated absolute effects | Relative effect | № of participants | Certainty of the evidence | Comments | |
| Risk with placebo (median) | Risk with memantine | |||||
| All‐cause discontinuation | 171 per 1000 | 188 per 1000 | RR 1.10 (0.79 to 1.52) | 555 113 events | ⊕⊕⊕⊝ | RR for all 3 studies in people with moderate‐to‐severe AD selected for agitation (Analysis 3.9). Median control group risk for 3 studies in 555 people with moderate‐to‐severe AD selected for agitation (Analysis 3.9) |
| Difference: 17 more people per 1000 discontinued treatment for any cause (95% CI 36 fewer to 89 more) | ||||||
| Number suffering at least one adverse event | 600 per 1000 | 618 per 1000 | RR 1.03 | 8033 5371 events | ⊕⊕⊕⊕ | RR from all studies (Analysis 9.3).Mean control group risk for 2 moderate‐to‐severe AD studies in people selected for agitation (Analysis 3.11) |
| Difference: 18 more people per 1000 suffered adverse events | ||||||
| *The risk in the intervention group (and its 95% confidence interval) is based on the assumed risk in the comparison group and the relative effect of the intervention (and its 95% CI). | ||||||
| GRADE Working Group grades of evidence | ||||||
| 1 Inconsistency in point estimates between 24 week and 12 week studies (downgrade once); imprecision (crossed null and SMD 0.30) (downgrade once) 2 Inconsistency between 24 week and 12 week studies (I² =90%) (downgrade twice); imprecision (very wide CI crossing SMD +0.30 and ‐0.30 (downgrade twice) 3 Imprecision (crossed null and SMD 0.40) (downgrade once); some inconsistency in point estimates and risk of bias from baseline differences (downgrade once across the two domains) 4 Inconsistency (I² = 62%, P = 0.07) (downgrade once); risk of bias (due to baseline differences) (downgrade once); imprecision (wide CI: SMD crossing ‐0.2 and 0.4) (downgrade twice) 5 Control group value for 1 study reporting CIBIC+ (Herrmann 2012 (10158))) 6 Mean control group baseline scores and mean control group change from baseline for 2 studies reporting SIB (Fox 2012 (MAGD); Herrmann 2012 (10158)) 7 Mean control group baseline scores and mean control group change from baseline for the 2 studies reporting ADCS‐ADL19 (Forest 2006 (MD‐23); Herrmann 2012 (10158)) 8 Median control group baseline scores and median control group change from baseline for the 3 studies reporting NPI (Forest 2006 (MD‐23); Fox 2012 (MAGD); Herrmann 2012 (10158)) 9 Mean control group baseline scores and mean control group change from baseline for the 2 studies reporting CMAI (Fox 2012 (MAGD); Herrmann 2012 (10158)) 10 Some inconsistency for two studies reporting CMAI and some imprecision (SMD crossing 0.3 and null) (downgrade once overall) 11 Imprecision (113 events) (downgrade once) | ||||||
| Memantine 20 mg compared to placebo for mild AD (MMSE 20‐23) observed case (OC) ‐ six‐month studies for dementia | ||||||
| Population: mild Alzheimer's disease | ||||||
| Continuous outcomes | Score with placebo | Mean improvement in change score between memantine and placebo | SMD (95% CI) meta‐analysis findings | № of participants | Certainty of the evidence | Comments |
| Clinical Global (CIBIC+) | Median CIBIC+ score | MD: 0.09 (‐0.12 to 0.30) | ‐0.08 (‐0.27 to 0.12) | 427 | ⊕⊕⊝⊝ | Analysed as mean difference (Analysis 4.1). [SMD as a negative outcome (Analysis 16.1)] |
| Cognitive function (ADAS‐Cog) | Baseline ADAS‐Cog scores not reported. Median change from baseline in ADAS‐Cog score (negative scale): ‐1.7 6 (i.e. improvement with time) | MD: 0.21 (‐0.95 to 1.38) | ‐0.03 (‐0.19 to 0.13) | 619 | ⊕⊕⊕⊝ | Analysed as mean difference (Analysis 4.2). [SMD as a negative outcome (Analysis 16.2).] |
| Performance on ADL (ADCS‐ADL23) | Baseline ADL scores not reported. Median change from | MD: ‐0.07 (‐1.80 to 1.66) | 0.02 (‐0.14 to 0.18) | 621 | ⊕⊕⊕⊝ | Analysed as mean difference for decline in ADL (Analysis 4.3). [SMD as a negative outcome (Analysis 16.3)] Direction of scale reversed for ADL outcome. |
| Behaviour and mood: (NPI) | Baseline NPI scores not reported. Median change from baseline in NPI was ‐2.4 (i.e. slight improvement with time) 8 | MD: ‐0.29 (‐2.16 to 1.58) | 0.02 (‐0.14 to 0.18) | 621 | ⊕⊕⊕⊝ | Analysed as mean difference. [SMD as a negative outcome (Analysis 16.4)]. |
| Binary outcomes | Anticipated absolute effects | Relative effect | № of participants | Certainty of the evidence | Comments | |
| Risk with placebo (median) | Risk with memantine | |||||
| All‐cause discontinuation | 100 per 1000 | 174 per 1000 | RR 1.74 | 528 72 events | ⊕⊝⊝⊝ | RR and median control group risk for mild AD studies (Analysis 16.5) |
| Difference: 74 more people per 1000 discontinued treatment for any cause (95% CI 8 to 181 more) | ||||||
| Number suffering at least one adverse event | 429 per 1000 | 442 per 1000 | RR 1.03 | 8033 5371 events | ⊕⊕⊕⊕ | RR from all studies (Analysis 9.3).Control group risk taken from Holland 2013 study |
| Difference: 13 more people per 1000 suffered adverse events | ||||||
| Number suffering at least one serious adverse event | 114 per 1000 | 104 per 1000 (93 to 116) | RR 0.91 | 6482 (19 RCTs) 918 events | ⊕⊕⊕⊕ | RR and median control risk from all AD studies (except those with agitation) (from Analysis 8.10) |
| Difference: 10 fewer people per 1000 suffered serious adverse events (95% CI 21 fewer to 2 more) | ||||||
| Number suffering agitation as an adverse event | Outcome not reported by any study | 0 RCTs | ||||
| *The risk in the intervention group (and its 95% confidence interval) is based on the assumed risk in the comparison group and the relative effect of the intervention (and its 95% CI). | ||||||
| GRADE Working Group grades of evidence | ||||||
| 1 All studies are post‐hoc subgroups (downgrade once on risk of bias); imprecision ‐ 427 patients and SMD estimate crosses null and is consistent with appreciable benefit and no benefit (downgrade once) 2 All studies are post‐hoc subgroups (downgrade once on risk of bias) 3 All studies are post‐hoc subgroups (downgrade once on risk of bias) and some inconsistency in the point estimates (but not sufficient to downgrade) 4 Majority of the information from post‐hoc subgroups (downgrade once on risk of bias); imprecision: 72 events, and CI crossed 1.25 (downgrade once); inconsistency (I² = 49%) downgrade once 5 Median control group values for 3 studies reporting CIBIC+ (Bakchine 2008 (99679) SG; Peskind 2004 (MD‐10) SG; Porsteinsson 2008(MD‐12)S) 6 Median control group change from baseline for 4 studies reporting ADAS‐Cog (Bakchine 2008 (99679) SG; Dysken 2014 SG; Peskind 2004 (MD‐10) SG; Porsteinsson 2008(MD‐12)S) 7 Median control group change from baseline for the 4 studies reporting ADCS‐ADL23 (Bakchine 2008 (99679) SG; Dysken 2014 SG; Peskind 2004 (MD‐10) SG; Porsteinsson 2008(MD‐12)S) 8 Median control group change from baseline for the 4 studies reporting NPI (Bakchine 2008 (99679) SG; Dysken 2014 SG; Peskind 2004 (MD‐10) SG; Porsteinsson 2008(MD‐12)S) | ||||||
| Memantine compared to placebo for Parkinson's disease dementia (PDD) and Dementia with Lewy Bodies (DLB) | ||||||
| Population: Parkinson's disease dementia (PDD) and dementia with Lewy bodies (DLB) | ||||||
| Continuous outcomes | Score with placebo (median) | Mean improvement in change score between memantine and placebo | SMD (95% CI) meta‐analysis findings | № of participants | Certainty of the evidence | Comments |
| Clinical Global (CIBIC+) 7‐point Likert scale | CIBIC+ score from 1 study was 4.1 (i.e. no change) | MD: 0.49 (0.13 to 0.83) | ‐0.35 (‐0.60 to ‐0.09) | 243 | ⊕⊕⊝⊝ | SMD as a negative outcome Back transformed to CIBIC+ scale using SD(pooled) = 1.39 (from 1 study (Marsh 2009 PDD)). |
| Cognitive Function: (MMSE) 30‐point scale | MMSE score: 20.0 (at 24 weeks). Change from baseline (positive scale): ‐0.5 (i.e. slight deterioration with time) (one study) | MD: 1.9 (0.07 to 3.73) | ‐0.50(‐1.00 to 0.00) | 63 | ⊕⊝⊝⊝ | One study at 24 weeks and one at 16 weeks only for this outcome; highly heterogeneous. So 24 week study reported only (Aarsland 2009). MMSE scale direction was reversed (Analysis 6.2) |
| Performance on ADL (ADCS‐ADL23) 78‐point scale | ADCS‐ADL23 score at baseline: 48 Change from baseline (positive scale): ‐0.1 (i.e. no change with time) (one study) | MD: 3.07 (‐1.25 to 7.4) | ‐0.27 (‐0.67 to 0.07) | 243 | ⊕⊝⊝⊝ | SMD decline in ADL as a negative outcome (Analysis 6.3). Random effects. Back transformed to ADCS‐ADL23 scale, using results from one study (Emre 2010 (11018)). SD(pooled) = 11.38. |
| Behaviour and Mood (NPI) 144‐point scale | Median NPI score at baseline: 13.0 Median change from baseline (negative scale): 1.4 | MD: 2.18 (‐1.21 to 5.57) | ‐0.18 (‐0.43 to 0.07) | 242 | ⊕⊕⊝⊝ | Random effects. Analysed as mean difference (Analysis 6.4). [SMD as a negative outcome (Analysis 8.4)] |
| Binary outcomes | Anticipated absolute effects | Relative effect | № of participants | Certainty of the evidence | Comments | |
| Risk with placebo (median) | Risk with memantine | |||||
| All‐cause discontinuation | 201 per 1000 | 169 per 1000 | RR 0.84 | 312 64 events | ⊕⊕⊝⊝ | RR and control group risk from PDD or DLB studies (Analysis 6.5) |
| Difference: 32 fewer people per 1000 discontinued treatment for any cause | ||||||
| Number suffering at least one adverse event | 500 per 1000 | 515 per 1000 | RR 1.03 | 8033 5371 events | ⊕⊕⊕⊕ | RR from all studies (Analysis 9.3). Median control group risk for PDD or DLB studies (Analysis 6.7). |
| Difference: 15 more people per 1000 suffered adverse events | ||||||
| Number suffering at least one serious adverse event | 86 per 1000 | 123 per 1000 (59 to 255) | RR 1.43 | 220 (2 RCTs) 26 events | ⊕⊕⊝⊝ | RR and control group risk from PDD or DLB studies (Analysis 8.10) |
| Difference: 37 more people per 1000 suffered serious adverse events (95% CI 27 fewer to 169 more) | ||||||
| Number suffering agitation as an adverse event | Outcome not reported for either study | 0 RCTs | ||||
| *The risk in the intervention group (and its 95% confidence interval) is based on the assumed risk in the comparison group and the relative effect of the intervention (and its 95% CI). | ||||||
| GRADE Working Group grades of evidence | ||||||
| 1 Majority of the information at high risk of bias and number of patients estimated (downgrade once); imprecision ‐ 243 patients (below optimal information size) (downgrade once) 2 Reporting bias (2 larger studies did not report outcome) and high risk of bias for remaining study (downgrade once), inconsistency with 16 weeks study high (I² = 75%) (downgrade once), imprecision (only 63 patients, wide CI) (downgrade once) 3 Majority of information at high risk of bias (downgrade once), inconsistency in point estimates (I² = 40%) (downgrade once) and imprecision (243 participants and CI crossed null and consistent with both benefit and no difference) (downgrade once) 4 Majority of information at high risk of bias (downgrade once), some inconsistency in point estimates (I² = 20%) (not downgraded) and imprecision (243 patients; CI crossed null and included benefit and no difference) (downgrade once) 5 Imprecision: CI crossed both 1.25 and 0.75, and CI fairly wide around absolute effect (downgrade twice) | ||||||
| Memantine compared to placebo for Frontotemporal dementia (FTD) | ||||||
| Population: frontotemporal dementia | ||||||
| Continuous outcomes | Score with placebo (median) | Mean improvement in change score between memantine and placebo | SMD (95% CI) meta‐analysis findings | № of participants | Certainty of the evidence | Comments |
| Clinical Global (CGIC) 7‐point Likert scale | CGIC score from 1 study was 4.8 (i.e. deterioration with time) | MD: 0.56 (‐0.11 to 1.21) | ‐0.31 (‐0.67 to 0.06) | 117 | ⊕⊕⊝⊝ | SMD as a negative outcome Back transformed to CGIC scale using SD (pooled) = 1.80 (from 1 study (Boxer 2013). |
| Cognitive Function: (MMSE) 30‐point scale | MMSE score: 25.1 (at 26 weeks). Change from baseline (positive scale): ‐0.9 (i.e. deterioration with time) (one study) | MD ‐0.30 (‐1.83 to 1.23) | 0.09 (‐0.35 to 0.52) | 81 | ⊕⊝⊝⊝ | One study at 6 months and one at 12 months for this outcome; some heterogeneity so 6‐month study reported only (Boxer 2013) (Analysis 7.2). MMSE scale direction was reversed. |
| Performance on ADL % DAD score = yes at 12 months | Baseline score: 58.3%. Change from baseline (positive scale): ‐19.5% (i.e. deterioration) (one study) | MD: 12.10% (‐1.40 to 25.60) | ‐ | 39 | ⊕⊝⊝⊝ | Decline in ADL not reported in either study. Percentage with DAD score = yes reported in Vercelletto 2011 at 12 months. |
| Behaviour and Mood (NPI) 144‐point scale | NPI score at baseline: 21.5. Change from baseline (negative scale): 0.3 | MD: 3.16 (‐3.61 to 8.01) | ‐0.17 (‐0.62 to 0.28) | 115 | ⊕⊕⊝⊝ | Analysed as mean difference (Analysis 7.3). Baseline score and change from baseline for 26‐week study (Boxer 2013). [SMD as a negative outcome (Analysis 8.4)] |
| Binary outcomes | Anticipated absolute effects | Relative effect (95% CI) | № of participants | Certainty of the evidence | Comments | |
| Risk with placebo (median) | Risk with memantine | |||||
| All‐cause discontinuation | 71 per 1000 | 109 per 1000 | RR 1.54 (0.54 to 4.06) | 133 15 events | ⊕⊕⊝⊝ | RR from FTD studies; control group risk from 26 week study (Analysis 7.4) |
| Difference: 38 more people per 1000 discontinued treatment for any cause (95% CI 33 fewer to 217 more) | ||||||
| Number suffering at least one adverse event | 667 per 1000 | 687 per 1000 | RR 1.03 | 8033 5371 events | ⊕⊕⊕⊕ | RR from all studies (Analysis 9.3).Control group risk for 26‐week FTD study |
| Difference: 20 more people per 1000 | ||||||
| Number suffering at least one severe adverse event | 48 per 1000 | 34 per 1000 (14 to 80) | RR 0.71 | 133 (2 RCTs) 17 events | ⊕⊕⊝⊝ | RR and control group risk from FTD study at 26 weeks (Analysis 8.10) |
| Difference: 14 fewer people per 1000 | ||||||
| Number suffering agitation as an adverse event | 48 per 1000 | 10 per 1000 (0.5 to 208) | RR 0.21 | 81 (1 RCT) | ⊕⊝⊝⊝ | RR and control group risk from FTD study at 26 weeks (Analysis 7.8) |
| Difference: 38 fewer people per 1000 | ||||||
| *The risk in the intervention group (and its 95% confidence interval) is based on the assumed risk in the comparison group and the relative effect of the intervention (and its 95% CI). | ||||||
| GRADE Working Group grades of evidence | ||||||
| 1 Majority of the information at high risk of bias (downgrade once); imprecision ‐ 117 patients (below optimal information size) (downgrade once) 2 Inconsistency in point estimates (I² = 23%) (downgrade once) and Imprecision (122 patients and wide confidence interval) (downgrade twice) 3 Imprecision (39 participants and CI crossed null and consistent with both benefit and no difference) (downgrade twice); indirect outcome (percentage DAD score at 12 months) and borderline high risk of bias (differential missing data) (downgrade once) 4 Some inconsistency in point estimates and Imprecision (122 patients and wide confidence interval) (downgrade twice overall) 5 Inconsistency in point estimates (downgrade once); Imprecision: 15 events and CI crossed both 1.25 and 0.75 (downgrade twice) 6 Imprecision: 17 events and wide CI (downgrade twice) 7 Imprecision: 2 events and very wide CI (downgrade twice): high risk of bias ‐ number discontinuing treatment greater than number of events (downgrade twice) | ||||||
| Number of Studies | Number of Participants | Standardised Effect Estimate | Heterogeneity (I²) | Test for | |||||||||
| Domain | All | with ChEI | no ChEI | All | with ChEI | no ChEI | All | with ChEI | no ChEI | All | with ChEI | no ChEI | |
| Clinical Global | 10 | 3 | 7 | 2797 | 1125 | 1672 | ‐0.20 | ‐0.21 (‐0.32 to ‐0.09) | ‐0.20 (‐0.30 to ‐0.10) | 0% | 13% | 0% | I² = 0%, P = 0.99 |
| Cognitive Function | 14 | 6 | 8 | 3337 | 1852 | 1485 | ‐0.28 (‐0.35 to ‐0.21) | ‐0.24 (‐0.33 to ‐0.14) | ‐0.33 (‐0.43 to ‐0.23) | 33% | 13% | 41% | I² = 44%, P = 0.18 |
| Decline in Living (Analysis 2.3) | 12 | 5 | 7 | 2687 | 1319 | 1368 | ‐0.17 (‐0.24 to ‐0.09) | ‐0.13 (‐0.24 to ‐0.03) | ‐0.20 (‐0.30 to ‐0.09) | 0% | 0% | 10% | I² = 0%, P = 0.43 |
| Behaviour and Mood | 15 | 6 | 9 | 3674 | 1855 | 1819 | ‐0.14 (‐0.21 to ‐0.08) | ‐0.18 (‐0.27 to ‐0.09) | ‐0.10 (‐0.19 to ‐0.01) | 6% | 10% | 0% | I² = 35%, P = 0.21 |
| All‐cause discontinuation | 15 | 6 | 10 | 4548 | 2089 | 2459 | RR 0.93 (0.82 to 1.05) | RR 0.94 (0.78 to 1.13) | RR 0.92 (0.78 to 1.08) | 9% | 61% | 0% | I² = 0%, P = 0.83 |
| Adverse events | 9 | 3 | 6 | 3390 | 1625 | 1765 | RR 1.02 (0.98 to 1.06) | RR 1.05 (0.98 to 1.12) | RR 0.99 (0.94 to 1.04) | 23% | 13% | 0% | I² = 46%, P = 0.17 |
| Agitation as an adverse event | 10 | 5 | 6 | 3854 | 1965 | 1889 | RR 0.79 (0.64 to 0.97) | RR 0.93 (0.65 to 1.31) | RR 0.72 (0.55 to 0.93) | 0% | 0% | 15% | I² = 25.1%, P = 0.25 |
| Six studies were conducted on patients with moderate‐to‐severe disease receiving ChEI therapy, these were: Dysken 2014: patients were on ongoing ChEI therapy with any ChEI (donepezil, rivastigmine or galantamine), as maintenance dosage for at least 4 weeks Grossberg 2008 (MD‐50): patients were on ongoing ChEI therapy with a stable dose of any ChEI for 3 months or longer, patients must remain on the same dose throughout the study. Howard 2012 (DOMINO‐AD): patients were on ongoing ChEI therapy with donepezil for at least 3 months and had received a dose of 10 mg for at least the previous Nakamura 2016: patients had been on donepezil for at least four weeks when recruited and then had 12 weeks single blind observation period on donepezil. Only those stable continued to the double blind period. Porsteinsson 2008 (MD‐12): patients were on ongoing ChEI therapy with any ChEI for 6 months or longer, and a stable dosing regimen for 3 months or longer (donepezil 5‐10 mg/day; rivastigmine 6, 9 or 12 mg/day; galantamine 16 or 24 mg/day) Tariot 2004 (MD‐02): patients were on ongoing ChEI therapy with donepezil for more than 6 months before entry into the trial and at a stable dose (5‐10mg/day) for at least 3 months. | |||||||||||||
| Patients not selected for agitation (with moderate‐to‐severe AD) | Patients selected for agitation | |||||
| With / without ChEI | No ChEI | With ChEI | With / without ChEI, mainly with | With ChEI | With / without ChEI ‐ | |
| Clinical global (SMD) | ‐0.20 (‐0.28 to ‐0.13) n = 10 studies; 2797 patients I² = 0%, P = 0.86 | ‐0.20 (‐0.30 to ‐0.10) n = 7; 1672 patients I² = 0%, P = 0.88 | ‐0.21 (‐0.32 to ‐0.09) n = 3; 1125 patients I² = 13%, P = 0.32 | ‐0.11 (‐0.34 to 0.13) n = 3; 443 patients I² = 25%, P = 0.26 | 0.04 (‐0.20 to 0.28) n = 1; 324 patients | ‐0.28 (‐0.59 to 0.02) n = 2; 168 patients I² = 0%, P = 0.96 |
| Cognitive function (SMD) | ‐0.28 (‐0.35 to ‐0.21) n = 13; 3337 patients I² = 30%, P = 0.14 | ‐0.33 (‐0.43 to ‐0.23) n = 8; 1485 patients I² = 41%, P = 0.11 | ‐0.24 (‐0.33 to ‐0.14) n = 6; 1852 patients I² = 13%, P = 0.33 | Not pooled I² = 90%, P = 0.002 | 0.05 (‐0.17 to 0.27) n = 1, 324 patients | ‐0.56 (‐0.92 to ‐0.21) n = 1; 129 patients (with ˜20% ChEI) |
| Decline in ADL (SMD) | ‐0.17 (‐0.24 to ‐0.09) n = 11; 2687 patients I² = 0%, P = 0.582 | ‐0.20 (‐0.30 to ‐0.09) n = 7; 1368 patients I² = 10%, P = 0.36 | ‐0.13 (‐0.24 to ‐0.03) n = 5; 1319 patients I² = 0%, P = 0.69 | 0.21 (‐0.02 to 0.43) n = 2; 309 patients I² = 0%, P = 0.40 | 0.23 (‐0.01 to 0.47) n = 1; 276 patients | ‐0.02 (‐0.70 to 0.67) n = 1; 33 patients (with ChEI) |
| Behaviour and mood (SMD) | ‐0.14 (‐0.21 to ‐0.08) n = 14; 3674 patients I² =6%, P = 0.39 | ‐0.10 (‐0.19 to ‐0.01) n = 9; 1819 patients I² = 0%, P = 0.46 | ‐0.18 (‐0.27 to ‐0.09) n = 6; 1855 patients I² = 10%, P = 0.35 | ‐0.07 (‐0.41 to 0.27) n = 3; 470 patients I² = 62%, P = 0.07 | 0.08 (‐0.14 to 0.30) n = 1; 324 patients | ‐0.20 (‐0.69 to 0.29) n = 2; 146 patients I² = 43%, P = 0.19 |
| CMAI (SMD) | ‐0.21 (‐0.45 to 0.04) n = 1; 261 patients | 0.11 (‐0.12 to 0.33) n = 2; 306 patients I² = 0%, P = 0.77 | 0.10 (‐0.14 to 0.33) n = 1; 273 patients | CMAI (final values): SMD: ‐0.19 (‐0.52 to 0.13) CMAI (community): SMD: 0.21 (‐0.48 to 0.89) n = 1; 33 patients | ||
| Proportion with agitation (RR) | 0.76 (0.601 to 0.96) 6 studies; 2 241 patients I² = 0%, P = 0.67 | 0.68 (0.51, 0.91) 4 studies; 1016 patients I² = 0%, P = 0.59 | 0.92 (0.54 to 1.31) 3 studies; 1225 patients I² = 0% and 0.85 | RR 2.39 (1.04 to 5.50) 2 studies; 403 patients I² = 0%, P = 0.60 | 2.20 (0.92 to 5.27) 1 study; 369 patients | 5.00 (0.26 to 97.00) 1 study; 34 patients (with ChEI) |
| Adverse event | Number of studies (participants) | RR (95% CI) | Heterogeneity (I²) | GRADE rating |
| Insomnia (Analysis 9.6) | 19 (5354), 221 events | 0.93 (0.73 to 1.20) | I² = 14%, P = 0.29 | LOW (downgraded on imprecision and reporting bias < 70% patients had AE data) |
| Confusion (Analysis 9.7) | 13 (4509), 167 events | 1.23 (0.91 to 1.65) | I² = 0%, P = 0.51 | LOW (downgraded on imprecision and reporting bias < 70% patients had AE data) |
| Depression (Analysis 9.8) | 10 (3052), 83 events | 1.06 (0.70 to 1.60) | I² = 0%, P = 0.60 | VERY LOW (downgraded on imprecision (twice), inconsistency in point estimates (once) and reporting bias <40% patients had AE data (twice)) |
| Headache (Analysis 9.9) | 16 (4889), 240 events | 1.29 (1.00 to 1.66) | I² = 9%,P = 0.36 | LOW (downgraded on imprecision (once) and reporting bias <70% patients had AE data) |
| Hypertension (Analysis 9.10) | 8 (3175), 87 events | 1.76 (1.14 to 2.70) | I² = 1%, P = 0.42 | VERY LOW (downgraded on imprecision (twice), inconsistency in point estimates (once) and reporting bias <40% patients had AE data (twice)) |
| Dizziness (Analysis 9.11) | 19 (6395), 323 events | 1.59 (1.28 to 1.98) | I² = 0%, P = 0.49 | MODERATE (downgraded on inconsistency in point estimates) |
| Falls (Analysis 9.12) | 20 (6743), 589 events | 0.98 (0.84 to 1.13) | I² = 0%, P = 0.84 | HIGH |
| Accidental injury (Analysis 9.13) | 10 (3813), 214 events | 0.81 (0.62 to 1.05) | I² = 0%, P = 0.81 | VERY LOW (downgraded on imprecision (once) and twice on reporting bias (< 50% patients and 1 in 4 studies) |
| Urinary incontinence (Analysis 9.14) | 8 (2724), 76 events | 1.12 (0.73 to 1.72) | I² = 0%, P = 0.83 | VERY LOW (downgraded on imprecision (twice), inconsistency in point estimates (once) and reporting bias <4 0% patients had AE data (twice)) |
| Diarrhoea (Analysis 9.15) | 18 (6186), 318 events | 0.82 (0.66 to 1.02) | I² = 0%, P = 0.58 | LOW (downgraded on imprecision (once), some inconsistency in point estimates and reporting bias <70% patients had AE data (once further)) |
| Influenza‐like symptoms (Analysis 9.16) | 7 (2836), 129 events | 1.21 (0.87 to 1.70) | I² = 0%, P = 0.97 | VERY LOW (downgraded on imprecision (once), and reporting bias < 40% patients and 1/6 studies had AE data (twice)) |
| Outcome or subgroup title | No. of studies | No. of participants | Statistical method | Effect size |
| 1 Clinical Global Show forest plot | 13 | 3079 | Std. Mean Difference (IV, Fixed, 95% CI) | ‐0.20 [‐0.28, ‐0.13] |
| 2 Cognitive Function Show forest plot | 14 | 3600 | Std. Mean Difference (IV, Fixed, 95% CI) | ‐0.27 [‐0.34, ‐0.21] |
| 3 Decline in ADL Show forest plot | 13 | 3077 | Std. Mean Difference (IV, Fixed, 95% CI) | ‐0.16 [‐0.24, ‐0.09] |
| 4 Behaviour and Mood Show forest plot | 14 | 3674 | Std. Mean Difference (IV, Fixed, 95% CI) | ‐0.14 [‐0.21, ‐0.08] |
| 5 All‐cause discontinuation Show forest plot | 16 | 4661 | Risk Ratio (M‐H, Fixed, 95% CI) | 0.93 [0.82, 1.05] |
| 6 Discontinuations due to adverse events Show forest plot | 16 | 4661 | Risk Ratio (M‐H, Fixed, 95% CI) | 0.94 [0.79, 1.13] |
| 7 Number suffering at least one adverse event Show forest plot | 17 | 4708 | Risk Ratio (M‐H, Fixed, 95% CI) | 1.02 [0.97, 1.06] |
| 8 Number suffering serious adverse events Show forest plot | 16 | 4449 | Risk Ratio (M‐H, Fixed, 95% CI) | 0.90 [0.75, 1.07] |
| 9 Number suffering agitation as an adverse event Show forest plot | 15 | 3904 | Risk Ratio (M‐H, Fixed, 95% CI) | 0.76 [0.60, 0.96] |
| Outcome or subgroup title | No. of studies | No. of participants | Statistical method | Effect size |
| 1 Clinical Global: subgroup analysis by +/‐ ChEI Show forest plot | 13 | 3079 | Std. Mean Difference (IV, Fixed, 95% CI) | ‐0.20 [‐0.28, ‐0.13] |
| 1.1 Monotherapy | 9 | 1760 | Std. Mean Difference (IV, Fixed, 95% CI) | ‐0.20 [‐0.30, ‐0.10] |
| 1.2 With concomitant cholinesterase inhibitors | 5 | 1319 | Std. Mean Difference (IV, Fixed, 95% CI) | ‐0.21 [‐0.32, ‐0.09] |
| 2 Cognitive Function subgroup analysis by +/‐ ChEI Show forest plot | 14 | 3600 | Std. Mean Difference (IV, Fixed, 95% CI) | ‐0.28 [‐0.35, ‐0.21] |
| 2.1 Monotherapy | 9 | 1748 | Std. Mean Difference (IV, Fixed, 95% CI) | ‐0.33 [‐0.43, ‐0.23] |
| 2.2 With concomitant cholinesterase inhibitors | 6 | 1852 | Std. Mean Difference (IV, Fixed, 95% CI) | ‐0.24 [‐0.33, ‐0.14] |
| 3 Decline in ADL: subgroup analysis by +/‐ ChEI Show forest plot | 13 | 3077 | Std. Mean Difference (IV, Fixed, 95% CI) | ‐0.17 [‐0.24, ‐0.09] |
| 3.1 Monotherapy | 9 | 1758 | Std. Mean Difference (IV, Fixed, 95% CI) | ‐0.20 [‐0.30, ‐0.09] |
| 3.2 With concomitant cholinesterase inhibitors | 5 | 1319 | Std. Mean Difference (IV, Fixed, 95% CI) | ‐0.13 [‐0.24, ‐0.03] |
| 4 Behaviour and Mood: subgroup analysis by +/‐ ChEI Show forest plot | 14 | 3674 | Std. Mean Difference (IV, Fixed, 95% CI) | ‐0.14 [‐0.21, ‐0.08] |
| 4.1 Monotherapy | 9 | 1819 | Std. Mean Difference (IV, Fixed, 95% CI) | ‐0.10 [‐0.19, ‐0.01] |
| 4.2 With concomitant cholinesterase inhibitors | 6 | 1855 | Std. Mean Difference (IV, Fixed, 95% CI) | ‐0.18 [‐0.27, ‐0.09] |
| 5 Cognitive function (sMMSE):subgroup analysis within randomised study ‐ per protocol Show forest plot | 1 | 143 | Mean Difference (IV, Fixed, 95% CI) | ‐1.35 [‐2.39, ‐0.31] |
| 5.1 Monotherapy | 1 | 62 | Mean Difference (IV, Fixed, 95% CI) | ‐2.11 [‐3.74, ‐0.48] |
| 5.2 With concomitant cholinesterase inhibitor | 1 | 81 | Mean Difference (IV, Fixed, 95% CI) | ‐0.82 [‐2.18, 0.54] |
| 6 Decline in ADL (BADL): subgroup analysis within randomised study ‐ per protocol Show forest plot | 1 | Mean Difference (IV, Fixed, 95% CI) | Subtotals only | |
| 6.1 Monotherapy | 1 | 62 | Mean Difference (IV, Fixed, 95% CI) | ‐2.46 [‐6.45, 1.53] |
| 6.2 With concomitant cholinesterase inhibitor | 1 | 81 | Mean Difference (IV, Fixed, 95% CI) | ‐0.59 [‐3.21, 2.03] |
| 7 NPI: subgroup analysis within randomised study ‐ per protocol Show forest plot | 1 | Mean Difference (IV, Fixed, 95% CI) | Subtotals only | |
| 7.1 Monotherapy | 1 | 62 | Mean Difference (IV, Fixed, 95% CI) | ‐4.23 [‐14.08, 5.62] |
| 7.2 With concomitant cholinesterase inhibitor | 1 | 81 | Mean Difference (IV, Fixed, 95% CI) | ‐6.99 [‐13.13, ‐0.85] |
| 8 Clinical Global: CIBIC+ mean difference; ChEI subgroup Show forest plot | 4 | 1238 | Std. Mean Difference (IV, Random, 95% CI) | ‐0.20 [‐0.33, ‐0.08] |
| 9 All‐cause discontinuation ‐ by ChEI Show forest plot | 16 | 4661 | Risk Ratio (M‐H, Fixed, 95% CI) | 0.93 [0.82, 1.05] |
| 9.1 Monotherapy | 10 | 2459 | Risk Ratio (M‐H, Fixed, 95% CI) | 0.92 [0.78, 1.08] |
| 9.2 with concomitant ChEI | 7 | 2202 | Risk Ratio (M‐H, Fixed, 95% CI) | 0.94 [0.78, 1.13] |
| 10 Discontinuations due to adverse events ‐ by ChEI Show forest plot | 16 | 4661 | Risk Ratio (M‐H, Fixed, 95% CI) | 0.94 [0.79, 1.13] |
| 10.1 Monotherapy | 10 | 2459 | Risk Ratio (M‐H, Fixed, 95% CI) | 0.91 [0.72, 1.15] |
| 10.2 With concomitant ChEI | 7 | 2202 | Risk Ratio (M‐H, Fixed, 95% CI) | 0.99 [0.75, 1.30] |
| 11 Adverse events ‐ by ChEI Show forest plot | 13 | 4324 | Risk Ratio (M‐H, Fixed, 95% CI) | 1.02 [0.98, 1.06] |
| 11.1 Monotherapy | 8 | 2284 | Risk Ratio (M‐H, Fixed, 95% CI) | 0.99 [0.94, 1.04] |
| 11.2 with concomitant ChEI | 5 | 2040 | Risk Ratio (M‐H, Fixed, 95% CI) | 1.05 [0.98, 1.12] |
| 12 Serious adverse events ‐ by ChEI Show forest plot | 15 | 5672 | Risk Ratio (M‐H, Fixed, 95% CI) | 0.94 [0.83, 1.06] |
| 12.1 Monotherapy | 10 | 3161 | Risk Ratio (M‐H, Fixed, 95% CI) | 0.90 [0.74, 1.08] |
| 12.2 With concomitant ChEI | 6 | 2511 | Risk Ratio (M‐H, Fixed, 95% CI) | 0.98 [0.83, 1.15] |
| 13 Number suffering agitation as an adverse event ‐ by ChEI Show forest plot | 10 | 3175 | Risk Ratio (M‐H, Fixed, 95% CI) | 0.76 [0.60, 0.96] |
| 13.1 Monotherapy | 6 | 1535 | Risk Ratio (M‐H, Fixed, 95% CI) | 0.68 [0.51, 0.91] |
| 13.2 with concomitant ChEI | 5 | 1640 | Risk Ratio (M‐H, Fixed, 95% CI) | 0.92 [0.60, 1.40] |
| 14 Memantine + donepezil vs memantine + placebo Show forest plot | 1 | Mean Difference (IV, Fixed, 95% CI) | Totals not selected | |
| 14.1 Cognitive function (sMMSE) | 1 | Mean Difference (IV, Fixed, 95% CI) | 0.0 [0.0, 0.0] | |
| 14.2 Decline in ADL (BADLS scale) | 1 | Mean Difference (IV, Fixed, 95% CI) | 0.0 [0.0, 0.0] | |
| 14.3 Behaviour and mood (NPI) | 1 | Mean Difference (IV, Fixed, 95% CI) | 0.0 [0.0, 0.0] | |
| Outcome or subgroup title | No. of studies | No. of participants | Statistical method | Effect size |
| 1 Cohen Mansfield Agitation Inventory (MD) Show forest plot | 2 | 422 | Mean Difference (IV, Random, 95% CI) | ‐0.50 [‐4.71, 3.71] |
| 1.1 12 weeks | 1 | 149 | Mean Difference (IV, Random, 95% CI) | ‐3.80 [‐10.06, 2.46] |
| 1.2 24 weeks | 1 | 273 | Mean Difference (IV, Random, 95% CI) | 0.90 [‐1.29, 3.09] |
| 2 Cohen Mansfield Agitation Inventory (SMD) Show forest plot | 2 | 306 | Std. Mean Difference (IV, Random, 95% CI) | 0.11 [‐0.12, 0.33] |
| 2.1 12 weeks | 1 | 33 | Std. Mean Difference (IV, Random, 95% CI) | 0.21 [‐0.48, 0.89] |
| 2.2 24 weeks | 1 | 273 | Std. Mean Difference (IV, Random, 95% CI) | 0.10 [‐0.14, 0.33] |
| 3 NPI agitation subscale Show forest plot | 3 | Mean Difference (IV, Random, 95% CI) | Subtotals only | |
| 3.1 12 weeks | 2 | 146 | Mean Difference (IV, Random, 95% CI) | ‐0.39 [‐1.90, 1.13] |
| 3.2 24 weeks | 1 | 324 | Mean Difference (IV, Random, 95% CI) | 0.0 [0.0, 0.0] |
| 4 Number suffering agitation Show forest plot | 3 | 556 | Risk Ratio (M‐H, Fixed, 95% CI) | 2.39 [1.04, 5.50] |
| 4.1 12 weeks | 2 | 187 | Risk Ratio (M‐H, Fixed, 95% CI) | 5.0 [0.26, 97.00] |
| 4.2 24 weeks | 1 | 369 | Risk Ratio (M‐H, Fixed, 95% CI) | 2.20 [0.92, 5.27] |
| 5 Clinical Global Show forest plot | 3 | 443 | Std. Mean Difference (IV, Random, 95% CI) | ‐0.11 [‐0.34, 0.13] |
| 5.1 12 weeks | 2 | 168 | Std. Mean Difference (IV, Random, 95% CI) | ‐0.28 [‐0.59, 0.02] |
| 5.2 24 weeks | 1 | 275 | Std. Mean Difference (IV, Random, 95% CI) | 0.04 [‐0.20, 0.28] |
| 6 Cognitive Function: SIB Show forest plot | 3 | 486 | Mean Difference (IV, Random, 95% CI) | ‐4.34 [‐14.58, 5.89] |
| 6.1 12 weeks | 2 | 162 | Mean Difference (IV, Random, 95% CI) | ‐10.00 [‐16.15, ‐3.85] |
| 6.2 24 weeks | 1 | 324 | Mean Difference (IV, Random, 95% CI) | 0.48 [‐1.61, 2.57] |
| 7 Decline in ADL: ADCS‐ADL19 Show forest plot | 3 | 458 | Mean Difference (IV, Fixed, 95% CI) | 1.48 [‐0.19, 3.15] |
| 7.1 12 weeks | 2 | 182 | Mean Difference (IV, Fixed, 95% CI) | ‐0.10 [‐4.18, 3.98] |
| 7.2 24 weeks | 1 | 276 | Mean Difference (IV, Fixed, 95% CI) | 1.80 [‐0.03, 3.63] |
| 8 Behaviour and Mood Show forest plot | 3 | 470 | Mean Difference (IV, Random, 95% CI) | ‐1.51 [‐8.05, 5.03] |
| 8.1 12 weeks | 2 | 146 | Mean Difference (IV, Random, 95% CI) | ‐3.76 [‐14.09, 6.58] |
| 8.2 24 weeks | 1 | 324 | Mean Difference (IV, Random, 95% CI) | 1.23 [‐2.19, 4.65] |
| 9 All‐cause discontinuation Show forest plot | 3 | 555 | Risk Ratio (M‐H, Fixed, 95% CI) | 1.10 [0.79, 1.52] |
| 9.1 12 weeks | 2 | 186 | Risk Ratio (M‐H, Fixed, 95% CI) | 1.24 [0.78, 1.99] |
| 9.2 24 weeks | 1 | 369 | Risk Ratio (M‐H, Fixed, 95% CI) | 1.00 [0.63, 1.56] |
| 10 Discontinuations due to adverse events Show forest plot | 3 | 556 | Risk Ratio (M‐H, Fixed, 95% CI) | 1.40 [0.88, 2.21] |
| 11 Number suffering at least one adverse event Show forest plot | 3 | 556 | Risk Ratio (M‐H, Fixed, 95% CI) | 1.07 [0.95, 1.20] |
| 12 Number suffering serious adverse events Show forest plot | 3 | 556 | Risk Ratio (M‐H, Fixed, 95% CI) | 1.65 [0.85, 3.20] |
| Outcome or subgroup title | No. of studies | No. of participants | Statistical method | Effect size |
| 1 Clinical global: CIBIC+ Show forest plot | 4 | 621 | Mean Difference (IV, Fixed, 95% CI) | ‐0.09 [‐0.30, 0.12] |
| 2 Cognitive function: ADASCog Show forest plot | 5 | Mean Difference (IV, Fixed, 95% CI) | Subtotals only | |
| 2.1 ADAS cog at 6 months | 4 | 619 | Mean Difference (IV, Fixed, 95% CI) | ‐0.21 [‐1.38, 0.95] |
| 2.2 MMSE at 12 months ‐ final values | 1 | 26 | Mean Difference (IV, Fixed, 95% CI) | ‐1.15 [‐3.47, 1.17] |
| 3 Decline in ADL: ADCS‐ADL23 Show forest plot | 4 | 621 | Mean Difference (IV, Fixed, 95% CI) | 0.07 [‐1.66, 1.80] |
| 4 Behaviour and mood: NPI Show forest plot | 4 | 621 | Mean Difference (IV, Fixed, 95% CI) | 0.29 [‐1.58, 2.16] |
| Outcome or subgroup title | No. of studies | No. of participants | Statistical method | Effect size |
| 1 Clinical Global: CGI Show forest plot | 2 | 757 | Std. Mean Difference (IV, Random, 95% CI) | ‐0.02 [‐0.23, 0.19] |
| 2 Cognitive function: ADAS‐Cog Show forest plot | 2 | 569 | Mean Difference (IV, Fixed, 95% CI) | ‐2.15 [‐3.25, ‐1.05] |
| 3 Decline in ADL: NOSGER self‐care subscale Show forest plot | 2 | 542 | Std. Mean Difference (IV, Fixed, 95% CI) | ‐0.04 [‐0.20, 0.13] |
| 4 Behaviour: NOSGER disturbing behaviour subscale Show forest plot | 2 | 541 | Std. Mean Difference (IV, Fixed, 95% CI) | ‐0.20 [‐0.37, ‐0.03] |
| 5 Cognitive function: ADAS‐Cog: post‐hoc subgroup analysis Show forest plot | 2 | Mean Difference (IV, Fixed, 95% CI) | Subtotals only | |
| 5.1 Mild‐to‐moderate (MMSE >14) | 2 | 467 | Mean Difference (IV, Fixed, 95% CI) | ‐1.64 [‐2.83, ‐0.45] |
| 5.2 Moderate (MMSE ≤ 14) | 2 | 102 | Mean Difference (IV, Fixed, 95% CI) | ‐4.51 [‐7.21, ‐1.81] |
| 6 All‐cause discontinuation Show forest plot | 2 | 900 | Risk Ratio (M‐H, Fixed, 95% CI) | 1.05 [0.83, 1.34] |
| 7 Discontinuation due to adverse events Show forest plot | 2 | 900 | Risk Ratio (M‐H, Random, 95% CI) | 1.09 [0.73, 1.64] |
| 8 Number suffering at least one adverse event Show forest plot | 2 | 900 | Risk Ratio (M‐H, Fixed, 95% CI) | 1.03 [0.95, 1.11] |
| 9 Number suffering agitation as an adverse event Show forest plot | 2 | 900 | Risk Ratio (M‐H, Fixed, 95% CI) | 0.56 [0.33, 0.96] |
| Outcome or subgroup title | No. of studies | No. of participants | Statistical method | Effect size |
| 1 Clinical Global (24 weeks) Show forest plot | 3 | 243 | Std. Mean Difference (IV, Fixed, 95% CI) | ‐0.35 [‐0.60, ‐0.09] |
| 2 Cognitive Function Show forest plot | 4 | 298 | Mean Difference (IV, Random, 95% CI) | ‐0.37 [‐3.68, 2.95] |
| 2.1 16 weeks | 1 | 25 | Mean Difference (IV, Random, 95% CI) | 1.5 [‐1.28, 4.28] |
| 2.2 24 weeks | 3 | 273 | Mean Difference (IV, Random, 95% CI) | ‐1.90 [‐3.73, ‐0.07] |
| 3 Decline in ADL (24 weeks) Show forest plot | 3 | 243 | Std. Mean Difference (IV, Random, 95% CI) | ‐0.27 [‐0.65, 0.11] |
| 4 Behaviour and Mood: NPI Show forest plot | 4 | 267 | Mean Difference (IV, Random, 95% CI) | ‐2.09 [‐4.84, 0.66] |
| 4.1 16 weeks | 1 | 25 | Mean Difference (IV, Random, 95% CI) | ‐2.60 [‐15.60, 10.40] |
| 4.2 24 weeks | 3 | 242 | Mean Difference (IV, Random, 95% CI) | ‐2.18 [‐5.57, 1.21] |
| 5 All‐cause discontinuation Show forest plot | 4 | 312 | Risk Ratio (M‐H, Fixed, 95% CI) | 0.84 [0.55, 1.28] |
| 6 Discontinuation due to adverse events Show forest plot | 4 | 315 | Risk Ratio (M‐H, Fixed, 95% CI) | 0.94 [0.54, 1.63] |
| 7 Number suffering at least one adverse event Show forest plot | 4 | 315 | Risk Ratio (M‐H, Fixed, 95% CI) | 1.01 [0.79, 1.28] |
| Outcome or subgroup title | No. of studies | No. of participants | Statistical method | Effect size |
| 1 Clinical Global Show forest plot | 2 | 117 | Std. Mean Difference (IV, Fixed, 95% CI) | ‐0.31 [‐0.67, 0.06] |
| 1.1 6 months | 1 | 76 | Std. Mean Difference (IV, Fixed, 95% CI) | ‐0.22 [‐0.67, 0.23] |
| 1.2 12 months | 1 | 41 | Std. Mean Difference (IV, Fixed, 95% CI) | ‐0.48 [‐1.10, 0.15] |
| 2 Cognitive Function: MMSE Show forest plot | 2 | 122 | Mean Difference (IV, Random, 95% CI) | ‐0.23 [‐2.03, 1.56] |
| 2.1 6 months | 1 | 81 | Mean Difference (IV, Random, 95% CI) | 0.30 [‐1.23, 1.83] |
| 2.2 12 months | 1 | 41 | Mean Difference (IV, Random, 95% CI) | ‐1.80 [‐5.06, 1.46] |
| 3 Behaviour and Mood: Neuropsychiatric Inventory (NPI) Total Show forest plot | 2 | 115 | Mean Difference (IV, Fixed, 95% CI) | ‐3.16 [‐8.06, 1.74] |
| 3.1 6 months | 1 | 76 | Mean Difference (IV, Fixed, 95% CI) | ‐2.20 [‐8.01, 3.61] |
| 3.2 12 months | 1 | 39 | Mean Difference (IV, Fixed, 95% CI) | ‐5.5 [‐14.60, 3.60] |
| 4 All‐cause discontinuation Show forest plot | 2 | 133 | Risk Ratio (M‐H, Fixed, 95% CI) | 1.54 [0.58, 4.06] |
| 5 Discontinuation due to adverse events Show forest plot | 2 | 133 | Risk Ratio (M‐H, Random, 95% CI) | 1.25 [0.35, 4.44] |
| 6 Number suffering at least one adverse event Show forest plot | 2 | 133 | Risk Ratio (M‐H, Fixed, 95% CI) | 1.00 [0.75, 1.33] |
| 7 Number suffering at serious adverse events Show forest plot | 2 | 133 | Risk Ratio (M‐H, Fixed, 95% CI) | 0.45 [0.07, 2.94] |
| 8 Number suffering agitation as an adverse event Show forest plot | 2 | 133 | Risk Ratio (M‐H, Random, 95% CI) | 0.21 [0.01, 4.34] |
| Outcome or subgroup title | No. of studies | No. of participants | Statistical method | Effect size |
| 1 Clinical Global ‐ by dementia type and severity Show forest plot | 21 | 5098 | Std. Mean Difference (IV, Fixed, 95% CI) | ‐0.15 [‐0.21, ‐0.09] |
| 1.1 Alzheimer's disease ‐ mild | 4 | 621 | Std. Mean Difference (IV, Fixed, 95% CI) | ‐0.08 [‐0.27, 0.12] |
| 1.2 Alzheimer's disease ‐ moderate to severe | 14 | 3126 | Std. Mean Difference (IV, Fixed, 95% CI) | ‐0.20 [‐0.28, ‐0.13] |
| 1.3 Alzheimer's disease with agitation | 1 | 275 | Std. Mean Difference (IV, Fixed, 95% CI) | 0.04 [‐0.20, 0.28] |
| 1.4 Vascular dementia ‐ mild to moderate | 2 | 757 | Std. Mean Difference (IV, Fixed, 95% CI) | ‐0.00 [‐0.15, 0.14] |
| 1.5 Parkinson's disease dementia / DLB ‐ mild to moderate | 3 | 243 | Std. Mean Difference (IV, Fixed, 95% CI) | ‐0.35 [‐0.60, ‐0.09] |
| 1.6 Fronto Temporal Dementia ‐ mild | 1 | 76 | Std. Mean Difference (IV, Fixed, 95% CI) | ‐0.22 [‐0.67, 0.23] |
| 2 Cognitive Function ‐ by dementia type and severity Show forest plot | 20 | 5303 | Std. Mean Difference (IV, Fixed, 95% CI) | ‐0.22 [‐0.28, ‐0.17] |
| 2.1 Alzheimer's disease ‐ mild | 4 | 619 | Std. Mean Difference (IV, Fixed, 95% CI) | ‐0.03 [‐0.19, 0.13] |
| 2.2 Alzheimer's disease ‐ moderate to severe | 15 | 3647 | Std. Mean Difference (IV, Fixed, 95% CI) | ‐0.27 [‐0.34, ‐0.21] |
| 2.3 Alzheimer's disease with agitation | 1 | 324 | Std. Mean Difference (IV, Fixed, 95% CI) | 0.05 [‐0.17, 0.27] |
| 2.4 Vascular dementia ‐ mild‐to‐moderate | 2 | 569 | Std. Mean Difference (IV, Fixed, 95% CI) | ‐0.32 [‐0.48, ‐0.15] |
| 2.5 PDD/DLB ‐ mild to moderate | 1 | 63 | Std. Mean Difference (IV, Fixed, 95% CI) | ‐0.50 [‐1.00, 0.00] |
| 2.6 Fronto Temporal Dementia ‐ mild | 1 | 81 | Std. Mean Difference (IV, Fixed, 95% CI) | 0.09 [‐0.35, 0.52] |
| 3 Decline in ADL ‐ by dementia type and severity Show forest plot | 21 | 4887 | Std. Mean Difference (IV, Fixed, 95% CI) | ‐0.10 [‐0.16, ‐0.04] |
| 3.1 Alzheimer's disease ‐ mild | 4 | 621 | Std. Mean Difference (IV, Fixed, 95% CI) | 0.02 [‐0.14, 0.18] |
| 3.2 Alzheimer's Disease ‐ moderate to severe | 14 | 3124 | Std. Mean Difference (IV, Fixed, 95% CI) | ‐0.16 [‐0.24, ‐0.09] |
| 3.3 Alzheimer's disease with agitation | 1 | 276 | Std. Mean Difference (IV, Fixed, 95% CI) | 0.23 [‐0.01, 0.47] |
| 3.4 Vascular dementia ‐ mild‐to‐moderate | 2 | 542 | Std. Mean Difference (IV, Fixed, 95% CI) | ‐0.04 [‐0.20, 0.13] |
| 3.5 PDD/DLB ‐ mild to moderate | 3 | 243 | Std. Mean Difference (IV, Fixed, 95% CI) | ‐0.19 [‐0.45, 0.06] |
| 3.6 Fronto Temporal Dementia ‐ mild | 1 | 81 | Std. Mean Difference (IV, Fixed, 95% CI) | 0.0 [0.0, 0.0] |
| 4 Behaviour and mood ‐ by dementia type and severity Show forest plot | 23 | 5525 | Std. Mean Difference (IV, Fixed, 95% CI) | ‐0.12 [‐0.17, ‐0.06] |
| 4.1 Alzheimer's Disease ‐ mild | 4 | 621 | Std. Mean Difference (IV, Fixed, 95% CI) | 0.02 [‐0.14, 0.18] |
| 4.2 AD ‐ moderate to severe | 15 | 3721 | Std. Mean Difference (IV, Fixed, 95% CI) | ‐0.14 [‐0.21, ‐0.08] |
| 4.3 Alzheimer's disease with agitation | 1 | 324 | Std. Mean Difference (IV, Fixed, 95% CI) | 0.08 [‐0.14, 0.30] |
| 4.4 Vascular dementia ‐ mild‐to‐moderate | 2 | 541 | Std. Mean Difference (IV, Fixed, 95% CI) | ‐0.20 [‐0.37, ‐0.03] |
| 4.5 PDD/DLB ‐ mild to moderate | 3 | 242 | Std. Mean Difference (IV, Fixed, 95% CI) | ‐0.18 [‐0.43, 0.07] |
| 4.6 Fronto Temporal Dementia ‐ mild | 1 | 76 | Std. Mean Difference (IV, Fixed, 95% CI) | ‐0.17 [‐0.62, 0.28] |
| 5 Number suffering agitation ‐ by dementia type and severity Show forest plot | 19 | 5933 | Risk Ratio (M‐H, Fixed, 95% CI) | 0.84 [0.71, 1.01] |
| 5.1 Alzheimer's disease mild‐to‐moderate | 5 | 1890 | Risk Ratio (M‐H, Fixed, 95% CI) | 1.05 [0.70, 1.58] |
| 5.2 Alzheimer's disease moderate‐to‐severe | 7 | 2505 | Risk Ratio (M‐H, Fixed, 95% CI) | 0.73 [0.58, 0.93] |
| 5.3 AD with agitation (increased severity) | 2 | 403 | Risk Ratio (M‐H, Fixed, 95% CI) | 2.39 [1.04, 5.50] |
| 5.4 Vascular dementia mild‐to‐moderate | 2 | 900 | Risk Ratio (M‐H, Fixed, 95% CI) | 0.56 [0.33, 0.96] |
| 5.5 Fronto Temporal Dementia | 1 | 81 | Risk Ratio (M‐H, Fixed, 95% CI) | 0.21 [0.01, 4.34] |
| 5.6 Mixed dementia mild‐to‐moderate | 2 | 154 | Risk Ratio (M‐H, Fixed, 95% CI) | 1.53 [0.71, 3.31] |
| 6 Number suffering agitation ‐ by dementia type and ChEI Show forest plot | 17 | 5392 | Risk Ratio (M‐H, Fixed, 95% CI) | 0.83 [0.69, 0.99] |
| 6.1 Alzheimer's disease monotherapy | 5 | 1624 | Risk Ratio (M‐H, Fixed, 95% CI) | 0.66 [0.49, 0.89] |
| 6.2 Alzheimer's disease with concomitant ChEI | 6 | 2230 | Risk Ratio (M‐H, Fixed, 95% CI) | 0.91 [0.68, 1.22] |
| 6.3 Alzheimer's disease with agitation with concomitant ChEI | 2 | 403 | Risk Ratio (M‐H, Fixed, 95% CI) | 2.39 [1.04, 5.50] |
| 6.4 Vascular dementia monotherapy implied | 2 | 900 | Risk Ratio (M‐H, Fixed, 95% CI) | 0.56 [0.33, 0.96] |
| 6.5 Fronto Temporal Dementia ‐ monotherapy | 1 | 81 | Risk Ratio (M‐H, Fixed, 95% CI) | 0.21 [0.01, 4.34] |
| 6.6 Mixed dementia ‐ unclear ChEI | 2 | 154 | Risk Ratio (M‐H, Fixed, 95% CI) | 1.53 [0.71, 3.31] |
| 7 All‐cause discontinuation (all durations) ‐ by dementia type and severity Show forest plot | 33 | 8116 | Risk Ratio (M‐H, Fixed, 95% CI) | 0.99 [0.90, 1.08] |
| 7.1 Alzheimer's Disease ‐ mild | 5 | 722 | Risk Ratio (M‐H, Fixed, 95% CI) | 1.74 [1.08, 2.81] |
| 7.2 Alzheimer's disease ‐ moderate to severe | 18 | 5200 | Risk Ratio (M‐H, Fixed, 95% CI) | 0.93 [0.83, 1.04] |
| 7.3 Alzheimer's disease with agitation | 3 | 555 | Risk Ratio (M‐H, Fixed, 95% CI) | 1.10 [0.79, 1.52] |
| 7.4 Vascular dementia mild‐to‐moderate | 2 | 900 | Risk Ratio (M‐H, Fixed, 95% CI) | 1.05 [0.83, 1.34] |
| 7.5 PDD/DLB mild‐to‐moderate | 4 | 312 | Risk Ratio (M‐H, Fixed, 95% CI) | 0.84 [0.55, 1.28] |
| 7.6 Fronto Temporal Dementia mild | 2 | 133 | Risk Ratio (M‐H, Fixed, 95% CI) | 1.54 [0.58, 4.06] |
| 7.7 AIDS complex dementia | 1 | 140 | Risk Ratio (M‐H, Fixed, 95% CI) | 1.0 [0.52, 1.94] |
| 7.8 Mixed dementia mild‐to‐moderate | 2 | 154 | Risk Ratio (M‐H, Fixed, 95% CI) | 0.87 [0.30, 2.50] |
| 8 Discontinuation due to adverse events ‐ by dementia type and severity Show forest plot | 31 | 7968 | Risk Ratio (M‐H, Fixed, 95% CI) | 1.03 [0.90, 1.18] |
| 8.1 Alzheimer's Disease ‐ mild | 5 | 722 | Risk Ratio (M‐H, Fixed, 95% CI) | 2.12 [1.03, 4.39] |
| 8.2 Alzheimer's Disease ‐ moderate to severe | 18 | 5202 | Risk Ratio (M‐H, Fixed, 95% CI) | 0.93 [0.79, 1.11] |
| 8.3 Alzheimer's disease with agitation | 3 | 556 | Risk Ratio (M‐H, Fixed, 95% CI) | 1.40 [0.88, 2.21] |
| 8.4 Vascular dementia mild‐to‐moderate | 2 | 900 | Risk Ratio (M‐H, Fixed, 95% CI) | 1.10 [0.73, 1.64] |
| 8.5 Fronto Temporal Dementia | 2 | 133 | Risk Ratio (M‐H, Fixed, 95% CI) | 1.28 [0.37, 4.48] |
| 8.6 AIDS Complex dementia | 1 | 140 | Risk Ratio (M‐H, Fixed, 95% CI) | 1.0 [0.37, 2.70] |
| 8.7 PDD/DLB mild‐to‐moderate | 4 | 315 | Risk Ratio (M‐H, Fixed, 95% CI) | 0.94 [0.54, 1.63] |
| 9 Number suffering at least one adverse event ‐ by dementia type and severity Show forest plot | 30 | 8139 | Risk Ratio (M‐H, Fixed, 95% CI) | 1.03 [1.00, 1.06] |
| 9.1 Alzheimer's disease mild‐to‐moderate | 9 | 2624 | Risk Ratio (M‐H, Fixed, 95% CI) | 1.03 [0.98, 1.08] |
| 9.2 Alzheimer's disease moderate‐to‐severe | 10 | 3596 | Risk Ratio (M‐H, Fixed, 95% CI) | 1.02 [0.97, 1.06] |
| 9.3 Alzheimer's disease with agitation | 2 | 403 | Risk Ratio (M‐H, Fixed, 95% CI) | 1.07 [0.95, 1.20] |
| 9.4 Vascular dementia mild‐to‐moderate | 2 | 900 | Risk Ratio (M‐H, Fixed, 95% CI) | 1.03 [0.95, 1.11] |
| 9.5 Fronto Temporal Dementia | 2 | 133 | Risk Ratio (M‐H, Fixed, 95% CI) | 1.00 [0.75, 1.33] |
| 9.6 PDD/DLB mild‐to‐moderate | 3 | 295 | Risk Ratio (M‐H, Fixed, 95% CI) | 1.01 [0.79, 1.28] |
| 9.7 AIDS complex dementia | 1 | 106 | Risk Ratio (M‐H, Fixed, 95% CI) | 0.0 [0.0, 0.0] |
| 9.8 Mixed dementia mild‐to‐moderate | 1 | 82 | Risk Ratio (M‐H, Fixed, 95% CI) | 1.39 [0.91, 2.12] |
| 10 Number suffering at least one serious AE ‐ by dementia type and severity Show forest plot | 27 | 8138 | Risk Ratio (M‐H, Fixed, 95% CI) | 0.92 [0.83, 1.02] |
| 10.1 Alzheimer's disease mild‐to‐moderate | 9 | 2798 | Risk Ratio (M‐H, Fixed, 95% CI) | 0.92 [0.79, 1.07] |
| 10.2 Alzheimer's disease moderate‐to‐severe | 10 | 3684 | Risk Ratio (M‐H, Fixed, 95% CI) | 0.91 [0.77, 1.08] |
| 10.3 Alzheimer's disease with agitation | 2 | 403 | Risk Ratio (M‐H, Fixed, 95% CI) | 1.65 [0.85, 3.20] |
| 10.4 Vascular dementia mild‐to‐moderate | 2 | 900 | Risk Ratio (M‐H, Fixed, 95% CI) | 0.82 [0.62, 1.09] |
| 10.5 Fronto Temporal Dementia | 2 | 133 | Risk Ratio (M‐H, Fixed, 95% CI) | 0.71 [0.30, 1.66] |
| 10.6 PDD/DLB mild‐to‐moderate | 2 | 220 | Risk Ratio (M‐H, Fixed, 95% CI) | 1.43 [0.69, 2.97] |
| 11 Number suffering agitation as an adverse event ‐ by dementia type Show forest plot | 20 | 6008 | Risk Ratio (M‐H, Fixed, 95% CI) | 0.84 [0.71, 1.01] |
| 11.1 Alzheimer's disease | 12 | 4395 | Risk Ratio (M‐H, Fixed, 95% CI) | 0.81 [0.66, 0.99] |
| 11.2 AD with agitation (increased severity) | 2 | 403 | Risk Ratio (M‐H, Fixed, 95% CI) | 2.39 [1.04, 5.50] |
| 11.3 Vascular dementia | 2 | 900 | Risk Ratio (M‐H, Fixed, 95% CI) | 0.56 [0.33, 0.96] |
| 11.4 Parkinson's Disease Dementia / Dementia Lewy Bodies | 1 | 75 | Risk Ratio (M‐H, Fixed, 95% CI) | 0.0 [0.0, 0.0] |
| 11.5 Fronto Temporal Dementia | 1 | 81 | Risk Ratio (M‐H, Fixed, 95% CI) | 0.21 [0.01, 4.34] |
| 11.6 Mixed dementia | 2 | 154 | Risk Ratio (M‐H, Fixed, 95% CI) | 1.53 [0.71, 3.31] |
| Outcome or subgroup title | No. of studies | No. of participants | Statistical method | Effect size |
| 1 All‐cause discontinuation Show forest plot | 41 | 8998 | Risk Ratio (M‐H, Fixed, 95% CI) | 0.99 [0.91, 1.08] |
| 2 Discontinuation due to adverse events Show forest plot | 41 | 9004 | Risk Ratio (M‐H, Fixed, 95% CI) | 1.06 [0.92, 1.21] |
| 3 Number suffering at least one adverse event Show forest plot | 41 | 8960 | Risk Ratio (M‐H, Fixed, 95% CI) | 1.03 [1.00, 1.06] |
| 4 Number suffering serious adverse events Show forest plot | 41 | 8960 | Risk Ratio (M‐H, Fixed, 95% CI) | 0.92 [0.83, 1.02] |
| 5 Number suffering agitation as an adverse event Show forest plot | 22 | 6814 | Risk Ratio (M‐H, Fixed, 95% CI) | 0.84 [0.71, 1.01] |
| 6 Number suffering insomnia as an adverse event Show forest plot | 19 | 5354 | Risk Ratio (M‐H, Fixed, 95% CI) | 0.93 [0.73, 1.20] |
| 7 Number suffering confusion as an adverse event Show forest plot | 13 | 4509 | Risk Ratio (M‐H, Fixed, 95% CI) | 1.23 [0.91, 1.65] |
| 8 Number suffering depression as an adverse event Show forest plot | 10 | 3052 | Risk Ratio (M‐H, Fixed, 95% CI) | 1.06 [0.70, 1.60] |
| 9 Number suffering headache as an adverse event Show forest plot | 16 | 4889 | Risk Ratio (M‐H, Fixed, 95% CI) | 1.29 [1.00, 1.66] |
| 10 Number suffering hypertension as an adverse event Show forest plot | 8 | 3175 | Risk Ratio (M‐H, Fixed, 95% CI) | 1.76 [1.14, 2.70] |
| 11 Number suffering dizziness as an adverse event Show forest plot | 19 | 6395 | Risk Ratio (M‐H, Fixed, 95% CI) | 1.59 [1.28, 1.98] |
| 12 Number suffering falls as an adverse event Show forest plot | 20 | 6743 | Risk Ratio (M‐H, Fixed, 95% CI) | 0.98 [0.84, 1.13] |
| 13 Number suffering accidental injury as an adverse event Show forest plot | 10 | 3813 | Risk Ratio (M‐H, Fixed, 95% CI) | 0.81 [0.62, 1.05] |
| 14 Number suffering urinary incontinence as an adverse event Show forest plot | 8 | 2724 | Risk Ratio (M‐H, Fixed, 95% CI) | 1.12 [0.73, 1.72] |
| 15 Number suffering diarrhoea as an adverse event Show forest plot | 18 | 6186 | Risk Ratio (M‐H, Fixed, 95% CI) | 0.82 [0.66, 1.02] |
| 16 Number suffering influenza like symptoms as an adverse event Show forest plot | 7 | 2836 | Risk Ratio (M‐H, Fixed, 95% CI) | 1.21 [0.87, 1.70] |
| Outcome or subgroup title | No. of studies | No. of participants | Statistical method | Effect size |
| 1 Cognitive function Show forest plot | 11 | Mean Difference (IV, Fixed, 95% CI) | Totals not selected | |
| 1.1 1) OC then LOCF | 1 | Mean Difference (IV, Fixed, 95% CI) | 0.0 [0.0, 0.0] | |
| 1.2 2) OC then LOCF | 1 | Mean Difference (IV, Fixed, 95% CI) | 0.0 [0.0, 0.0] | |
| 1.3 3) OC then LOCF | 1 | Mean Difference (IV, Fixed, 95% CI) | 0.0 [0.0, 0.0] | |
| 1.4 4) OC then LOCF | 1 | Mean Difference (IV, Fixed, 95% CI) | 0.0 [0.0, 0.0] | |
| 1.5 PP then Retrieved dropout | 1 | Mean Difference (IV, Fixed, 95% CI) | 0.0 [0.0, 0.0] | |
| 1.6 PP then retrieved dropout ‐ AChEI only | 1 | Mean Difference (IV, Fixed, 95% CI) | 0.0 [0.0, 0.0] | |
| 1.7 PP then Retrieved dropout ‐ no AChEI | 1 | Mean Difference (IV, Fixed, 95% CI) | 0.0 [0.0, 0.0] | |
| 1.8 5) OC then LOCF | 1 | Mean Difference (IV, Fixed, 95% CI) | 0.0 [0.0, 0.0] | |
| 1.9 6) OC then LOCF | 1 | Mean Difference (IV, Fixed, 95% CI) | 0.0 [0.0, 0.0] | |
| 1.10 7) OC then LOCF | 1 | Mean Difference (IV, Fixed, 95% CI) | 0.0 [0.0, 0.0] | |
| 1.11 OC then LOCF | 1 | Mean Difference (IV, Fixed, 95% CI) | 0.0 [0.0, 0.0] | |
| 1.12 OC then LOCF | 1 | Mean Difference (IV, Fixed, 95% CI) | 0.0 [0.0, 0.0] | |
| 1.13 Per protocol then LOCF | 1 | Mean Difference (IV, Fixed, 95% CI) | 0.0 [0.0, 0.0] | |
| 2 Decline in ADL: ADCS‐ADL19/23 Show forest plot | 10 | Mean Difference (IV, Fixed, 95% CI) | Totals not selected | |
| 2.1 1) OC then LOCF | 1 | Mean Difference (IV, Fixed, 95% CI) | 0.0 [0.0, 0.0] | |
| 2.2 2) OC then LOCF | 1 | Mean Difference (IV, Fixed, 95% CI) | 0.0 [0.0, 0.0] | |
| 2.3 3) OC then LOCF | 1 | Mean Difference (IV, Fixed, 95% CI) | 0.0 [0.0, 0.0] | |
| 2.4 4) OC then LOCF | 1 | Mean Difference (IV, Fixed, 95% CI) | 0.0 [0.0, 0.0] | |
| 2.5 5) OC then LOCF | 1 | Mean Difference (IV, Fixed, 95% CI) | 0.0 [0.0, 0.0] | |
| 2.6 6) OC then LOCF | 1 | Mean Difference (IV, Fixed, 95% CI) | 0.0 [0.0, 0.0] | |
| 2.7 7) OC then LOCF | 1 | Mean Difference (IV, Fixed, 95% CI) | 0.0 [0.0, 0.0] | |
| 2.8 PP then Retrieved Dropout | 1 | Mean Difference (IV, Fixed, 95% CI) | 0.0 [0.0, 0.0] | |
| 2.9 PP then Retrieved Dropout ‐ AChEI only | 1 | Mean Difference (IV, Fixed, 95% CI) | 0.0 [0.0, 0.0] | |
| 2.10 PP then Retrieved dropout ‐ no AChEI | 1 | Mean Difference (IV, Fixed, 95% CI) | 0.0 [0.0, 0.0] | |
| 2.11 OC then LOCF | 1 | Mean Difference (IV, Fixed, 95% CI) | 0.0 [0.0, 0.0] | |
| 2.12 Per protocol then LOCF | 1 | Mean Difference (IV, Fixed, 95% CI) | 0.0 [0.0, 0.0] | |
| 3 Cognitive Function: SIB/ADASCog/MMSE Show forest plot | 17 | Std. Mean Difference (IV, Fixed, 95% CI) | Subtotals only | |
| 3.1 OC | 12 | 2901 | Std. Mean Difference (IV, Fixed, 95% CI) | ‐0.26 [‐0.33, ‐0.19] |
| 3.2 LOCF | 8 | 3066 | Std. Mean Difference (IV, Fixed, 95% CI) | ‐0.26 [‐0.33, ‐0.18] |
| 3.3 Missing at random assumption | 2 | 203 | Std. Mean Difference (IV, Fixed, 95% CI) | ‐0.20 [‐0.47, 0.08] |
| 3.4 Per protocol | 1 | 143 | Std. Mean Difference (IV, Fixed, 95% CI) | ‐0.36 [‐0.69, ‐0.03] |
| 3.5 Retrieved dropout | 1 | 246 | Std. Mean Difference (IV, Fixed, 95% CI) | ‐0.39 [‐0.64, ‐0.14] |
| 4 Decline in Activities of Daily Living Show forest plot | 14 | Std. Mean Difference (IV, Fixed, 95% CI) | Subtotals only | |
| 4.1 OC only | 10 | 2874 | Std. Mean Difference (IV, Fixed, 95% CI) | ‐0.11 [‐0.19, ‐0.03] |
| 4.2 LOCF | 6 | 2107 | Std. Mean Difference (IV, Fixed, 95% CI) | ‐0.13 [‐0.21, ‐0.04] |
| 4.3 Missing at random assumption | 2 | 203 | Std. Mean Difference (IV, Fixed, 95% CI) | ‐0.01 [‐0.29, 0.26] |
| 4.4 Per protocol | 1 | 143 | Std. Mean Difference (IV, Fixed, 95% CI) | ‐0.17 [‐0.50, 0.16] |
| 4.5 Retrieved dropout | 1 | 246 | Std. Mean Difference (IV, Fixed, 95% CI) | ‐0.22 [‐0.47, 0.03] |
| Outcome or subgroup title | No. of studies | No. of participants | Statistical method | Effect size |
| 1 Clinical Global Show forest plot | 24 | 5575 | Std. Mean Difference (IV, Fixed, 95% CI) | ‐0.20 [‐0.26, ‐0.14] |
| 2 Cognitive Function Show forest plot | 24 | 5670 | Std. Mean Difference (IV, Fixed, 95% CI) | ‐0.19 [‐0.24, ‐0.13] |
| 3 Decline in ADL Show forest plot | 24 | 5716 | Std. Mean Difference (IV, Fixed, 95% CI) | ‐0.10 [‐0.17, ‐0.04] |
| 4 Behaviour and Mood Show forest plot | 24 | 5718 | Std. Mean Difference (IV, Fixed, 95% CI) | ‐0.13 [‐0.19, ‐0.07] |
| 5 Clinical Global ‐ sensitivity analysis for high RoB Show forest plot | 17 | 4552 | Std. Mean Difference (IV, Fixed, 95% CI) | ‐0.19 [‐0.26, ‐0.13] |
| 6 Cognitive Function ‐ sensitivity analysis for high risk of bias Show forest plot | 19 | 5354 | Std. Mean Difference (IV, Fixed, 95% CI) | ‐0.18 [‐0.23, ‐0.12] |
| 7 Decline in ADL ‐ sensitivity analysis on high RoB Show forest plot | 17 | 4837 | Std. Mean Difference (IV, Fixed, 95% CI) | ‐0.09 [‐0.15, ‐0.02] |
| 8 Behaviour and Mood ‐ sensitivity analysis on high RoB Show forest plot | 17 | 5240 | Std. Mean Difference (IV, Fixed, 95% CI) | ‐0.12 [‐0.18, ‐0.06] |
| Outcome or subgroup title | No. of studies | No. of participants | Statistical method | Effect size |
| 1 Clinical Global ‐ CIBIC Plus, CGI‐I, or ADCS‐CGIC Show forest plot | 24 | 5579 | Std. Mean Difference (IV, Fixed, 95% CI) | ‐0.20 [‐0.26, ‐0.14] |
| 1.1 < 6 months | 4 | 515 | Std. Mean Difference (IV, Fixed, 95% CI) | ‐0.31 [‐0.53, ‐0.10] |
| 1.2 6‐7 months | 14 | 4201 | Std. Mean Difference (IV, Fixed, 95% CI) | ‐0.19 [‐0.26, ‐0.12] |
| 1.3 > 7 months | 6 | 863 | Std. Mean Difference (IV, Fixed, 95% CI) | ‐0.28 [‐1.04, 0.48] |
| 2 Cognitive Function Show forest plot | 24 | 5670 | Std. Mean Difference (IV, Fixed, 95% CI) | ‐0.19 [‐0.24, ‐0.13] |
| 2.1 < 6 months | 4 | 625 | Std. Mean Difference (IV, Fixed, 95% CI) | ‐0.12 [‐0.34, 0.10] |
| 2.2 6‐7 months | 14 | 4182 | Std. Mean Difference (IV, Fixed, 95% CI) | ‐0.21 [‐0.28, ‐0.15] |
| 2.3 > 7 months | 6 | 863 | Std. Mean Difference (IV, Fixed, 95% CI) | ‐0.10 [‐0.23, 0.04] |
| 3 Decline in ADL ‐ BGP, ADCS‐ADL 19 or 23 Show forest plot | 24 | 5716 | Std. Mean Difference (IV, Fixed, 95% CI) | ‐0.10 [‐0.17, ‐0.04] |
| 3.1 < 6 months | 4 | 625 | Std. Mean Difference (IV, Fixed, 95% CI) | ‐0.23 [‐0.46, ‐0.01] |
| 3.2 6‐7 months | 14 | 4257 | Std. Mean Difference (IV, Fixed, 95% CI) | ‐0.12 [‐0.19, ‐0.04] |
| 3.3 >7 months | 6 | 834 | Std. Mean Difference (IV, Fixed, 95% CI) | 0.05 [‐0.11, 0.22] |
| 4 Behaviour and Mood (Standardised NPI or NPI‐NH Total) Show forest plot | 23 | 5582 | Std. Mean Difference (IV, Fixed, 95% CI) | ‐0.13 [‐0.19, ‐0.07] |
| 4.1 < 6 months | 4 | 625 | Std. Mean Difference (IV, Fixed, 95% CI) | ‐0.28 [‐0.54, ‐0.03] |
| 4.2 6‐7 months | 14 | 4259 | Std. Mean Difference (IV, Fixed, 95% CI) | ‐0.11 [‐0.18, ‐0.05] |
| 4.3 > 7 months | 5 | 698 | Std. Mean Difference (IV, Fixed, 95% CI) | ‐0.21 [‐0.41, ‐0.02] |
| Outcome or subgroup title | No. of studies | No. of participants | Statistical method | Effect size |
| 1 Clinical Global; 10mg versus 20mg Show forest plot | 2 | 545 | Std. Mean Difference (IV, Random, 95% CI) | 0.05 [‐0.12, 0.22] |
| 2 Cognitive function; 10mg vs 20 mg Show forest plot | 2 | 545 | Std. Mean Difference (IV, Random, 95% CI) | 0.10 [‐0.48, 0.68] |
| 3 Decline in ADL; 10mg versus 20mg Show forest plot | 2 | 546 | Mean Difference (IV, Random, 95% CI) | ‐0.15 [‐1.86, 1.56] |
| 4 Behaviour and mood; 10mg versus 20mg Show forest plot | 2 | 547 | Mean Difference (IV, Random, 95% CI) | 1.70 [‐1.06, 4.46] |
| 5 Clinical Global Show forest plot | 3 | 623 | Std. Mean Difference (IV, Random, 95% CI) | ‐0.26 [‐0.50, ‐0.02] |
| 6 Cognitive function Show forest plot | 3 | 623 | Std. Mean Difference (IV, Random, 95% CI) | ‐0.26 [‐0.45, ‐0.06] |
| 7 Decline in activities of daily living Show forest plot | 3 | 623 | Std. Mean Difference (IV, Random, 95% CI) | ‐0.38 [‐0.92, 0.16] |
| 8 Behaviour and mood Show forest plot | 3 | 626 | Mean Difference (IV, Random, 95% CI) | ‐0.55 [‐3.25, 2.15] |
| Outcome or subgroup title | No. of studies | No. of participants | Statistical method | Effect size |
| 1 Clinical Global: subgroup analysis by +/‐ ChEI Show forest plot | 12 | 3624 | Std. Mean Difference (IV, Fixed, 95% CI) | ‐0.19 [‐0.26, ‐0.13] |
| 1.1 Monotherapy (studies ordered by decreasing mean severity) | 9 | 2378 | Std. Mean Difference (IV, Fixed, 95% CI) | ‐0.20 [‐0.28, ‐0.11] |
| 1.2 With concomitant ChEI (studies ordered by decreasing mean severity) | 3 | 1246 | Std. Mean Difference (IV, Fixed, 95% CI) | ‐0.19 [‐0.30, ‐0.08] |
| 2 Cognitive Function subgroup analysis by +/‐ ChEI Show forest plot | 16 | 4501 | Std. Mean Difference (IV, Fixed, 95% CI) | ‐0.22 [‐0.28, ‐0.16] |
| 2.1 Monotherapy (studies ordered by decreasing mean severity) | 10 | 2189 | Std. Mean Difference (IV, Fixed, 95% CI) | ‐0.24 [‐0.32, ‐0.15] |
| 2.2 With concomitant ChEI (studies ordered by decreasing mean severity) | 7 | 2312 | Std. Mean Difference (IV, Fixed, 95% CI) | ‐0.20 [‐0.28, ‐0.12] |
| 3 Decline in ADL subgroup analysis by +/‐ ChEI Show forest plot | 12 | 3432 | Std. Mean Difference (IV, Fixed, 95% CI) | ‐0.12 [‐0.19, ‐0.05] |
| 3.1 Monotherapy (studies ordered by decreasing mean severity) | 7 | 1674 | Std. Mean Difference (IV, Fixed, 95% CI) | ‐0.14 [‐0.24, ‐0.04] |
| 3.2 With concomitant ChEI (studies ordered by decreasing mean severity) | 6 | 1758 | Std. Mean Difference (IV, Fixed, 95% CI) | ‐0.10 [‐0.19, ‐0.01] |
| 4 Behaviour and Mood: subgroup analysis by +/‐ ChEI Show forest plot | 14 | 4270 | Std. Mean Difference (IV, Fixed, 95% CI) | ‐0.12 [‐0.18, ‐0.06] |
| 4.1 Monotherapy (studies ordered by decreasing mean severity) | 9 | 2125 | Std. Mean Difference (IV, Fixed, 95% CI) | ‐0.08 [‐0.17, 0.00] |
| 4.2 With concomitant ChEI (studies ordered by decreasing mean severity) | 6 | 2145 | Std. Mean Difference (IV, Fixed, 95% CI) | ‐0.15 [‐0.24, ‐0.07] |
| Outcome or subgroup title | No. of studies | No. of participants | Statistical method | Effect size |
| 1 Clinical Global Show forest plot | 12 | 3624 | Std. Mean Difference (IV, Fixed, 95% CI) | ‐0.19 [‐0.26, ‐0.13] |
| 2 Cognitive Function Show forest plot | 16 | 4500 | Std. Mean Difference (IV, Fixed, 95% CI) | ‐0.22 [‐0.27, ‐0.16] |
| 3 Decline in ADL Show forest plot | 12 | 3432 | Std. Mean Difference (IV, Fixed, 95% CI) | ‐0.12 [‐0.19, ‐0.05] |
| 4 Behaviour and Mood Show forest plot | 14 | 4270 | Std. Mean Difference (IV, Fixed, 95% CI) | ‐0.12 [‐0.18, ‐0.06] |
| 5 Clinical Global Show forest plot | 12 | 3624 | Std. Mean Difference (IV, Fixed, 95% CI) | ‐0.19 [‐0.26, ‐0.13] |
| 5.1 mild to moderate | 5 | 1519 | Std. Mean Difference (IV, Fixed, 95% CI) | ‐0.16 [‐0.26, ‐0.06] |
| 5.2 moderate to severe | 7 | 2105 | Std. Mean Difference (IV, Fixed, 95% CI) | ‐0.22 [‐0.30, ‐0.13] |
| 6 Cognitive Function Show forest plot | 16 | 4500 | Std. Mean Difference (IV, Fixed, 95% CI) | ‐0.22 [‐0.27, ‐0.16] |
| 6.1 mild to moderate | 7 | 1959 | Std. Mean Difference (IV, Fixed, 95% CI) | ‐0.13 [‐0.22, ‐0.04] |
| 6.2 moderate to severe | 9 | 2541 | Std. Mean Difference (IV, Fixed, 95% CI) | ‐0.28 [‐0.36, ‐0.20] |
| 7 Decline in ADL Show forest plot | 12 | 3432 | Std. Mean Difference (IV, Fixed, 95% CI) | ‐0.12 [‐0.19, ‐0.05] |
| 7.1 mild to moderate | 5 | 1554 | Std. Mean Difference (IV, Fixed, 95% CI) | ‐0.03 [‐0.13, 0.07] |
| 7.2 moderate to severe | 7 | 1878 | Std. Mean Difference (IV, Fixed, 95% CI) | ‐0.19 [‐0.28, ‐0.10] |
| 8 Behaviour and Mood Show forest plot | 14 | 4270 | Std. Mean Difference (IV, Fixed, 95% CI) | ‐0.12 [‐0.18, ‐0.06] |
| 8.1 mild to moderate | 4 | 1405 | Std. Mean Difference (IV, Fixed, 95% CI) | ‐0.01 [‐0.11, 0.10] |
| 8.2 moderate to severe | 10 | 2865 | Std. Mean Difference (IV, Fixed, 95% CI) | ‐0.17 [‐0.25, ‐0.10] |
| 9 All‐cause discontinuation, by type of disease and severity Show forest plot | 23 | 6571 | Risk Ratio (M‐H, Fixed, 95% CI) | 0.98 [0.88, 1.09] |
| 9.1 Alzheimer's disease mild‐to‐moderate | 9 | 2305 | Risk Ratio (M‐H, Fixed, 95% CI) | 1.09 [0.90, 1.31] |
| 9.2 Alzheimer's disease moderate‐to‐severe | 14 | 4266 | Risk Ratio (M‐H, Fixed, 95% CI) | 0.94 [0.83, 1.06] |
| 10 Discontinuation due to adverse events, by disease type and severity Show forest plot | 20 | 6227 | Risk Ratio (M‐H, Fixed, 95% CI) | 1.03 [0.88, 1.20] |
| 10.1 Alzheimer's disease mild‐to‐moderate | 7 | 1985 | Risk Ratio (M‐H, Fixed, 95% CI) | 1.41 [1.04, 1.91] |
| 10.2 Alzheimer's disease moderate‐to‐severe | 13 | 4242 | Risk Ratio (M‐H, Fixed, 95% CI) | 0.91 [0.76, 1.10] |
| Outcome or subgroup title | No. of studies | No. of participants | Statistical method | Effect size |
| 1 Clinical Global ‐ mild vs moderate/severe Show forest plot | 10 | 3224 | Std. Mean Difference (IV, Fixed, 95% CI) | ‐0.19 [‐0.26, ‐0.12] |
| 1.1 mild | 3 | 427 | Std. Mean Difference (IV, Fixed, 95% CI) | ‐0.08 [‐0.27, 0.12] |
| 1.2 moderate to severe | 10 | 2797 | Std. Mean Difference (IV, Fixed, 95% CI) | ‐0.20 [‐0.28, ‐0.13] |
| 2 Cognitive Function ‐ mild vs moderate/severe Show forest plot | 13 | 3955 | Std. Mean Difference (IV, Fixed, 95% CI) | ‐0.24 [‐0.30, ‐0.17] |
| 2.1 mild | 4 | 619 | Std. Mean Difference (IV, Fixed, 95% CI) | ‐0.03 [‐0.19, 0.13] |
| 2.2 moderate to severe | 13 | 3336 | Std. Mean Difference (IV, Fixed, 95% CI) | ‐0.27 [‐0.34, ‐0.21] |
| 3 Decline in ADL ‐ mild vs moderate/severe Show forest plot | 11 | 3308 | Std. Mean Difference (IV, Fixed, 95% CI) | ‐0.13 [‐0.20, ‐0.06] |
| 3.1 mild | 4 | 621 | Std. Mean Difference (IV, Fixed, 95% CI) | 0.02 [‐0.14, 0.18] |
| 3.2 moderate to severe | 11 | 2687 | Std. Mean Difference (IV, Fixed, 95% CI) | ‐0.16 [‐0.24, ‐0.09] |
| 4 Behaviour and Mood ‐ mild vs moderate/severe Show forest plot | 14 | 4295 | Std. Mean Difference (IV, Fixed, 95% CI) | ‐0.12 [‐0.18, ‐0.06] |
| 4.1 mild | 4 | 621 | Std. Mean Difference (IV, Fixed, 95% CI) | 0.02 [‐0.14, 0.18] |
| 4.2 moderate to severe | 14 | 3674 | Std. Mean Difference (IV, Fixed, 95% CI) | ‐0.14 [‐0.21, ‐0.08] |
| 5 All‐cause discontinuation ‐ mild vs moderate/severe Show forest plot | 19 | 5922 | Risk Ratio (M‐H, Fixed, 95% CI) | 0.97 [0.87, 1.08] |
| 5.1 mild | 5 | 722 | Risk Ratio (M‐H, Fixed, 95% CI) | 1.74 [1.08, 2.81] |
| 5.2 moderate to severe | 18 | 5200 | Risk Ratio (M‐H, Fixed, 95% CI) | 0.93 [0.83, 1.04] |
| 6 Discontinuations due to adverse events ‐ mild vs moderate/severe Show forest plot | 20 | 6150 | Risk Ratio (M‐H, Fixed, 95% CI) | 1.01 [0.86, 1.18] |
| 6.1 Mild | 6 | 948 | Risk Ratio (M‐H, Fixed, 95% CI) | 1.71 [1.06, 2.76] |
| 6.2 Moderate to severe | 18 | 5202 | Risk Ratio (M‐H, Fixed, 95% CI) | 0.93 [0.79, 1.11] |
| Outcome or subgroup title | No. of studies | No. of participants | Statistical method | Effect size |
| 1 Clinical Global: post‐hoc within‐trial subgroup analyses Show forest plot | 8 | 2597 | Std. Mean Difference (IV, Fixed, 95% CI) | ‐0.18 [‐0.27, ‐0.10] |
| 1.1 severe (MMSE mean <10) | 4 | 523 | Std. Mean Difference (IV, Fixed, 95% CI) | ‐0.26 [‐0.43, ‐0.09] |
| 1.2 moderate (subgroup MMSE 10 to <20) | 8 | 1453 | Std. Mean Difference (IV, Fixed, 95% CI) | ‐0.19 [‐0.30, ‐0.08] |
| 1.3 mild (subgroup MMSE ≥20) | 4 | 621 | Std. Mean Difference (IV, Fixed, 95% CI) | ‐0.08 [‐0.27, 0.12] |
| 2 Cognitive Function: post‐hoc within‐trial subgroup analyses Show forest plot | 8 | 2598 | Std. Mean Difference (IV, Random, 95% CI) | ‐0.24 [‐0.34, ‐0.14] |
| 2.1 severe (MMSE <10) | 4 | 531 | Std. Mean Difference (IV, Random, 95% CI) | ‐0.39 [‐0.67, ‐0.11] |
| 2.2 moderate (subgroup MMSE 10 to <20) | 8 | 1448 | Std. Mean Difference (IV, Random, 95% CI) | ‐0.27 [‐0.37, ‐0.16] |
| 2.3 mild (subgroup MMSE ≥20) | 4 | 619 | Std. Mean Difference (IV, Random, 95% CI) | ‐0.03 [‐0.19, 0.13] |
| 3 Decline in ADL: post‐hoc within‐trial subgroup analyses Show forest plot | 8 | 2615 | Std. Mean Difference (IV, Fixed, 95% CI) | ‐0.10 [‐0.18, ‐0.02] |
| 3.1 severe (MMSE mean <10) | 4 | 531 | Std. Mean Difference (IV, Fixed, 95% CI) | ‐0.18 [‐0.35, ‐0.01] |
| 3.2 moderate (subgroup MMSE 10 to <20) | 8 | 1463 | Std. Mean Difference (IV, Fixed, 95% CI) | ‐0.13 [‐0.23, ‐0.02] |
| 3.3 mild (subgroup MMSE ≥20) | 4 | 621 | Std. Mean Difference (IV, Fixed, 95% CI) | 0.02 [‐0.14, 0.18] |
| 4 Clinical Global: by severity of disease Show forest plot | 10 | 3224 | Std. Mean Difference (IV, Fixed, 95% CI) | ‐0.19 [‐0.26, ‐0.12] |
| 4.1 severe (MMSE mean <10) | 2 | 548 | Std. Mean Difference (IV, Fixed, 95% CI) | ‐0.16 [‐0.33, 0.01] |
| 4.2 moderate/severe (MMSE mean 10‐12) | 5 | 1557 | Std. Mean Difference (IV, Fixed, 95% CI) | ‐0.24 [‐0.34, ‐0.14] |
| 4.3 moderate (post hoc within‐trial subgroup) | 3 | 692 | Std. Mean Difference (IV, Fixed, 95% CI) | ‐0.16 [‐0.31, ‐0.00] |
| 4.4 mild (post hoc within‐trial subgroup MMSE ≥20) | 3 | 427 | Std. Mean Difference (IV, Fixed, 95% CI) | ‐0.08 [‐0.27, 0.12] |
| 5 Cognitive Function: by severity of disease Show forest plot | 14 | 4131 | Std. Mean Difference (IV, Fixed, 95% CI) | ‐0.23 [‐0.29, ‐0.17] |
| 5.1 severe (MMSE mean <10) | 3 | 690 | Std. Mean Difference (IV, Fixed, 95% CI) | ‐0.42 [‐0.57, ‐0.27] |
| 5.2 moderate/severe (MMSE mean 10‐12) | 6 | 1852 | Std. Mean Difference (IV, Fixed, 95% CI) | ‐0.23 [‐0.32, ‐0.14] |
| 5.3 moderate (post hoc within‐trial subgroup) | 4 | 795 | Std. Mean Difference (IV, Fixed, 95% CI) | ‐0.25 [‐0.40, ‐0.11] |
| 5.4 mild (post hoc within‐trial subgroup and mean MMSE ≥20) | 5 | 794 | Std. Mean Difference (IV, Fixed, 95% CI) | ‐0.03 [‐0.17, 0.11] |
| 6 Decline in ADL: by severity of disease Show forest plot | 12 | 3457 | Std. Mean Difference (IV, Fixed, 95% CI) | ‐0.12 [‐0.19, ‐0.06] |
| 6.1 severe (MMSE mean <10) | 2 | 324 | Std. Mean Difference (IV, Fixed, 95% CI) | ‐0.36 [‐0.59, ‐0.14] |
| 6.2 moderate/severe (MMSE mean 10‐12) | 5 | 1554 | Std. Mean Difference (IV, Fixed, 95% CI) | ‐0.15 [‐0.25, ‐0.05] |
| 6.3 moderate (post hoc within‐trial subgroup) | 4 | 809 | Std. Mean Difference (IV, Fixed, 95% CI) | ‐0.10 [‐0.25, 0.04] |
| 6.4 mild (post hoc within‐trial subgroup and mean MMSE ≥20) | 5 | 770 | Std. Mean Difference (IV, Fixed, 95% CI) | 0.02 [‐0.12, 0.16] |
| 7 Behaviour and Mood: by severity of disease Show forest plot | 14 | 4295 | Std. Mean Difference (IV, Fixed, 95% CI) | ‐0.12 [‐0.18, ‐0.06] |
| 7.1 severe (MMSE mean <10) | 3 | 749 | Std. Mean Difference (IV, Fixed, 95% CI) | ‐0.25 [‐0.40, ‐0.11] |
| 7.2 moderate/severe (MMSE mean 10‐12) | 7 | 2116 | Std. Mean Difference (IV, Fixed, 95% CI) | ‐0.14 [‐0.23, ‐0.06] |
| 7.3 moderate (post hoc within‐trial subgroup) | 4 | 809 | Std. Mean Difference (IV, Fixed, 95% CI) | ‐0.02 [‐0.17, 0.12] |
| 7.4 mild (post hoc within‐trial subgroup MMSE ≥20) | 4 | 621 | Std. Mean Difference (IV, Fixed, 95% CI) | 0.02 [‐0.14, 0.18] |