Transfusi darah sebagai langkah pencegahan strok primer dan sekunder di kalangan pengidap anaemia sel sabit
Referencias
References to studies included in this review
References to studies excluded from this review
Additional references
References to other published versions of this review
Characteristics of studies
Characteristics of included studies [ordered by study ID]
Ir a:
| Methods | Multicentre randomised trial in 29 clinical centres in the USA, Canada, France and the UK. Recruitment: December 2004 to May 2010. The last participant enrolled completed the exit visit on July 29, 2013. | |
| Participants | Inclusion criteria: children aged 5 to 15 years, confirmed diagnosis of haemoglobin SS or haemoglobin Sβ0 thalassaemia, and at least one infarct‐like lesion on the screening MRI scan defined as an MRI signal abnormality that was at least 3 mm in one dimension and that was visible in two planes on fluid‐attenuated inversion recovery (FLAIR) T2‐weighted images, as determined by agreement of two of the three trial neuroradiologists. Exclusion criteria: history of focal neurologic deficit associated with an infarct on brain MRI, a seizure disorder, treatment with hydroxyurea in the previous 3 months, a history of regular transfusion therapy, or imaging or non‐imaging TCD measurement that was above the trial‐defined thresholds. Participant flow: 1210 registered for screening; 1074 had screening MRI evaluated by neuroradiology committee; 675 had normal, 20 indeterminate MRI; 379 had infarct‐like lesions on screening MRI; 291 had infarct‐like lesions adjudicated by neurology committee; 220 had pre‐randomisation MRIs adjudicated by neuroradiology committee; 196 underwent randomisation. Transfusion arm:N = 99 (15 crossed over to observation) Sex: male: 59 (60%); F: 40 (40%) Age: 5 to 7: 26 (26%): 8 to 10: 35 (35%); 11 to 13: 32 (32%); 14 to 15: 6 (6%) TCD velocity: median (IQR) cm/sec: 147 (123‐168) (N = 98) Lesions on initial MRI: 99 (100%) Parental report of recurring headaches: yes: 37 (37%); No: 62 (63%) Steady state haemoglobin: median (IQR): g/L: 77 (72 to 84) Phenotypes: not stated (Included only HbSS or HbSβº) Hb F% median (IQR): 9.0 (4.0 to 14.0) Alpha thalassaemia: not reported Observation arm:N = 97 (6 crossed over to transfusion) Sex: male: 52 (54%); F: 45 (46%) Age: 5 to 7: 28 (29%): 8 to 10: 32 (33%); 11 to 13: 29 (30%); 14 to 15: 8 (8%) TCD velocity: median (IQR) cm/sec: 143 (131 to 163) Lesions on initial MRI: 97 (100%) Parental report of recurring headaches: yes: 43 (44%); No: 54 (56%) Steady state haemoglobin: median (IQR): g/L: 79 (74 to 89) Phenotypes: not stated trial included only HbSS or HbSβº Hb F% median (IQR): 10.0 (5.0 to 15.0) Alpha thalassaemia: not reported | |
| Interventions | Transfusion: transfusion arm received a transfusion approximately monthly to maintain a target haemoglobin concentration greater than 90 g/L and a target haemoglobin S concentration of 30% or less. Red cell component: leucocyte‐depleted, negative for haemoglobin S. Red cell matching: ABO, Rh and Kell antigens. Iron chelation: ferritin levels were monitored before each transfusion. Site investigators were advised to initiate chelation therapy for participants who had ferritin levels greater than 1500 ng per millilitre for 2 or more consecutive months. Observation: observation arm received standard care with no treatment for silent infarcts and no hydroxyurea therapy and were evaluated quarterly | |
| Outcomes | Primary outcome: the recurrence of infarct or haemorrhage as determined by neuroimaging, clinical evidence of permanent neurologic injury, or both. A new infarct had to meet the criteria for a SCI; an enlarged SCI was defined as a previously identified silent cerebral infarct that increased by at least 3 mm along any linear dimension in any plane on MRI; TIA, included in secondary analyses of neurologic outcomes, defined as an event that resulted in focal neurologic deficits that lasted less than 24 hours, did not result in abnormalities on T2‐weighted or FLAIR images that were indicative of an acute infarct, and had no other reasonable medical explanation. Secondary outcomes: changes in cognition, assessed by measurement of IQ scores with the Wechsler Abbreviated Scale of Intelligence12 or the Wechsler Preschool and Primary Scale of Intelligence III; also assessed scores on the Behavior Rating Inventory of Executive Function (BRIEF). | |
| Notes | Funding: supported by grants from the National Institute of Neurological Disorders and Stroke (5U01NS042804, 3U01NS042804 [American Recovery Reinvestment ACT supplementary grant] to Dr DeBaun); the Institute of Clinical and Translational Sciences, National Center for Research Resources, and the National Center for Advancing Translational Sciences, Clinical and Translational Research; NIH Roadmap for Medical Research (UL1TR000448, to Washington University; UL1TR001079, to Johns Hopkins University; and UL1TR000003, to the Children’s Hospital of Philadelphia); and Research and Development in the National Health Service, UK. Declarations of interest: Dr McKinstry reports receiving honoraria and lecture fees from Siemens Healthcare and consulting fees from Guerbet; Dr Woods, receiving fees for serving on a data and safety monitoring board from Mast Therapeutics and grant support from ClinDatrix and Novartis; Dr Kwiatkowski, receiving fees for serving on an advisory board from Shire Pharmaceuticals, consulting fees from Shire Pharmaceuticals and Sideris Pharmaceuticals, and grant support from Resonance Health; Dr. Heiny, receiving lecture fees from Novartis; Dr. Redding‐Lallinger, receiving grant support from Eli Lilly and Mast Therapeutics; and Dr. Casella, receiving honoraria, travel support, and consulting fees through his institution from Mast Therapeutics and being an inventor and a named party on a patent and licensing agreement for an assay panel of brain biomarkers for the detection of brain injury (PCT US2011/056338), licensed to ImmunArray with pending royalties only. No other potential conflict of interest relevant to this article was reported. Trial registration: NCT00072761 & ISRCTN52713285. Mean length of follow‐up: children were followed for a median of 3 years. Power calculation: a sample size of 204 participants (102 in each group) would give the trial 85% power to detect a decrease of at least 86% in the prevalence of the primary end point, assuming a 10% dropout rate and a crossover rate of 16% from transfusion to observation and 3% from observation to transfusion, at a two‐tailed nominal alpha level of 0.05. | |
| Risk of bias | ||
| Bias | Authors' judgement | Support for judgement |
| Random sequence generation (selection bias) | Low risk | Randomisation assignments were provided by the statistical data coordinating centre with the use of a permuted block design, with stratification according to site, age, and sex. Participants were assigned in a 1:1 ratio to the observation group or the transfusion group and were followed until the occurrence of a trial end‐point event or until exit from the trial. |
| Allocation concealment (selection bias) | Low risk | Assignments were provided by the statistical data coordinating centre. |
| Blinding of participants and personnel (performance bias) | High risk | By the nature of the trial treatments used (blood transfusions vs observation), it is impractical to make SIT trial blinded (masked). |
| Blinding of outcome assessment (detection bias) | Low risk | Members of neuroradiology and neurology committees, who were unaware of the trial‐group assignments, adjudicated neurologic and MRI findings. |
| Blinding of outcome assessment (detection bias) | High risk | Unblinded trial. |
| Incomplete outcome data (attrition bias) | Low risk | All outcomes reported. All participants accounted for, conducted an intention‐to‐treat and per protocol analysis for the primary outcomes The primary end point was ascertained for 185 of the 196 participants (94%). Of the 99 participants randomly assigned to the transfusion group, 90 started receiving transfusions within 4 weeks after assignment. The cross‐over rate from transfusion to observation was 15% (15 of 99 participants); 9 participants declined blood transfusion, and 6 crossed over to observation at a median time of 34 days. |
| Selective reporting (reporting bias) | Low risk | Protocol available and all planned outcomes reported. |
| Other bias | Unclear risk | Among participants in the observation group, 32% received transfusions (a median of 3 transfusions each), including 6 participants who crossed over to regular monthly transfusions at a median of 1.7 years. During the course of the trial, hydroxyurea was started in 14 of 97 participants (14%) in the observation group and in 3 of 99 (3%) in the transfusion group because of disease severity. Exclusion criteria included treatment with hydroxyurea. Not clear how long or when treatment began ‐ possible contamination and unknown effect on outcomes. 6 also crossed over to regular transfusion giving 20% cross‐over rate to either hydroxyurea or transfusion. |
| Methods | Multicentre randomised controlled trial conducted in 12 centres in the USA and Canada in children 2 ‐ 16 years of age with HbSS or HbSβº thalassaemia. Screening began in January 1995 and ended in November 1996. The trial was to run to December 1998 but was stopped in September 1997. | |
| Participants | Inclusion criteria: children 2 to 16 years of age and who had been given a diagnosis of sickle cell anaemia or sickle ß0 thalassaemia at high risk of stroke with a blood flow velocity of at least 200 cm per second on 2 TCD trials. Exclusion criteria: history of stroke, had an indication for or contraindication to long‐term transfusion, were receiving other treatments that affected the risk of stroke, were infected with the human immunodeficiency virus (HIV), had been treated for seizures, were pregnant, or had a serum ferritin concentration above 500 ng per millilitre. Participant flow: screened: N = 1934; eligible: N = 206 randomised: N = 130 Transfusion:N = 63 Sex: male: 31 (49%) Age: mean (SD): 8.2 (3.2) years HbS% mean (SD): 87 (10) HbF% mean (SD): 8.0 (5.2) Alpha thalassaemia: 14 (22%) TCD velocity: mean (SD): 223 (27) cm/sec Lesions on initial MRI: N (%) participants: 19 (31%) Standard care:N = 67 Sex: male: 29 (43%) Age: mean (SD): 8.4 (3.3) years HbS% mean (SD): 87 (7) HbF% mean (SD): 9.4 (5.0) Alpha thalassaemia: 7 (9%) TCD velocity: mean (SD) : 223 (28) cm/sec Lesions on initial MRI N (%): participants 25 (38%) Phenotypes: not reported (trial included only HbSS or HbSβº) | |
| Interventions | Transfusion: N = 63 In the transfusion arm the goal was to reach an HbS concentration < 30 per cent of total haemoglobin within 21 days without exceeding a haemoglobin concentration of 120 g/L and a hematocrit of 36%. Exchange or simple transfusion were allowed: 63% were simple transfusions, 12% were exchange; 25% a combination of simple and exchange. Red cells were delivered in a volume of approximately 10 to 15 mL per kg of packed cells per transfusion. Red cell component: leucocyte‐depleted, negative for haemoglobin S. Red cell matching: ABO, Rh and Kell antigens. Iron chelation: none. Potential participants with a ferritin level above 500 ng/mL were excluded from the trial. The intention was to exclude any child with a significant iron burden before initiation of treatment, thus avoiding Standard care:N = 67 | |
| Outcomes | Primary outcome: cerebral infarction and intracranial haemorrhage. Secondary outcomes: death, transfusion‐related adverse events. | |
| Notes | Funding: supported by Cooperative Agreements (U10 HL 52193 and U10 HL 52016) with the National Heart, Lung, and Blood Institute. Declarations of interest: none published. Trial registration: no registration found. Mean (SD) length of follow‐up: transfusion arm: 21.0 (5.7) months; Standard care: 18.3 (7.0) months. Power calculation: "Estimates of stroke risk for patients randomized to standard care were obtained by fitting an exponential model to the follow‐up of TCD (1) patients follow‐up, it was estimated that 47% of patients in this group should develop stroke on study. Assuming transfusion prevents 70% of these strokes, 14% of the patients randomized to transfusion should have strokes on study. Taken together, these values imply that a sample size of 46 per treatment arm should provide the desired statistical power of 90% to detect a 70% reduction in stroke incidence at a type I error rate of 0.05 for a two‐sided test". Analysis: 4 interim analyses and one final analysis were planned. the date of the first analysis changed from 20 months to 14 months after recruitment began. | |
| Risk of bias | ||
| Bias | Authors' judgement | Support for judgement |
| Random sequence generation (selection bias) | Low risk | "The DCC developed permuted blocks within which treatment allocations were randomly and evenly assigned. The blocks themselves were |
| Allocation concealment (selection bias) | Low risk | "After telephone verification that the patient was eligible and acquisition of written parental consent, the DCC ran a short randomization program and provided the Investigator with the trial group assignment." " Permuted blocks are used to blind Investigators to the potential treatment assignment of each patient while preserving approximate balance within and across Centers. The DCC provided the Clinical Center Investigator and patient with the treatment assignment." |
| Blinding of participants and personnel (performance bias) | High risk | Clinicians and participants were unblinded. |
| Blinding of outcome assessment (detection bias) | Low risk | A panel of physicians with no knowledge of the children’s treatment assignments who were not affiliated with the trial centres determined whether an event was a stroke. The primary end points were cerebral infarction and intracranial haemorrhage. "The protocol was intended to identify all neurologic events. A panel of physicians with no knowledge of the children’s treatment |
| Blinding of outcome assessment (detection bias) | High risk | Unblinded trial. |
| Incomplete outcome data (attrition bias) | Low risk | An ITT analysis was used, despite 12 participants crossing over between groups (2) or withdrawing from the trial (10). Reasons were provided. 10 participants from the transfusion group withdrew from the trial because of problems with compliance (n = 4), multiple alloantibodies (n = 1), ineligibility (n = 1) or other unspecified reasons (n = 4). Two participants from the standard care group crossed over to the transfusion group, one on the second day due to diagnosis of subacute intracerebral hematoma and the other after 12 months for treatment of leg ulcers. |
| Selective reporting (reporting bias) | Unclear risk | No protocol available and no prospective trial registration. |
| Other bias | Unclear risk | "Four interim analyses and one final analysis were planned, with the Lan–DeMets approximation of the O’Brien–Fleming stopping boundary. The date of the first analysis was changed from 20 months to 14 months after recruitment began." "Because of the high rate of stroke in the standard‐care group and the significant effect of transfusion found at the second interim analysis, the data safety and monitoring board recommended that the trial be stopped 16 months before the planned date of December 1998 so that transfusion could be offered to children in the standard‐care group." There was an imbalance between the number of participants with alpha thalassaemia trait between treatment arms (22% transfusion arm versus 9% standard treatment arm). |
| Methods | Multicentre RCT, extension to the STOP trial conducted in 23 centres (including the 12 centres in STOP) in the U.S. and Canada to determine whether regular blood transfusions for the prevention of stroke could be stopped in children and youth 5 ‐ 20 years of age with SCD. Children were monitored by transcranial Doppler examinations after transfusions were halted and by resuming transfusions if the examination indicated a high risk of stroke. This trial was an extension of the previous STOP trial, in which children with abnormal velocities on TCD ultrasonographic examination were administered transfusions to prevent a first stroke. The trial was meant to be a 54‐month trial involving 50 participants in each group, with 60 of the participants enrolled during the first 12 months and 40 during the next 24 months; after recruitment ended, there were 18 months of follow‐up. Four interim analyses and one final analysis were planned for the composite end point. The trial was stopped on the advice of the data safety and monitoring committee because of concern about safety at the fourth interim analysis with 79 participants enrolled. | |
| Participants | Inclusion criteria: children whose Doppler studies normalized after 30 or more months of transfusion were eligible for the present trial. In addition, children who had not participated in the previous STOP trial whose condition met the criteria for eligibility and treatment were also eligible for the present trial. Adequate participation in a transfusion program (≥ 24 transfusions in 30 months and Hb S < 30% in at least 20 of the 30 months); 2 Normal TCD examinations at least 2 weeks apart while receiving transfusions within 4 months of randomisation; age, 5 to 20 years; consent to participate in trial. Exclusion criteria: prior stroke; Indication for chronic transfusion; contraindication for chronic transfusion; moderate‐to‐severe intracranial arterial disease on MRA. Participant flow: screened: not reported; eligible: not reported; randomised: N = 79. Transfusion continued: N = 38 Sex: male: 20 (53%) Age: mean (SD): 12.5 (3.3) HbS % mean (SD): 21.0 (8.6) HbF% mean (SD): 2.4 (1.8) Alpha thalassaemia: not reported TCD velocity: mean (SD): 139 (16) cm/sec Lesions on initial MRI: 10 (26%) Phenotypes:Not reported (trial included only HbSS or HbSβº) Transfusion halted: N = 41 Sex: male: 13 (32%) Age: mean (SD): 12.05 (3.1) HbF% mean (SD): 2.3 (1.5) Alpha thalassaemia: not reported TCD velocity: mean (SD): 143 (18) cm/sec Lesions on initial MRI: 11 (27%) Phenotypes: not reported (trial included only HbSS or HbSβº) | |
| Interventions | Transfusion continued: n = 38. Transfusion could be simple, manual exchange or automated exchange. antigens. Red cell component: leucocyte‐depleted, negative for haemoglobin S. Red cell matching: ABO, Rh and Kell antigens. Iron chelation: chelation therapy with the use of deferoxamine was recommended if serum ferritin levels exceeded 2500 ng per millilitre. Transfusion halted: n = 41. Participants in the transfusion‐halted group could receive transfusions to treat complications of sickle cell disease. Initiation of hydroxyurea therapy or regular transfusion was designated as a cross‐over and data was censored on the patient as of the date of treatment. | |
| Outcomes | Primary outcome: composite end point was a stroke (cerebral infarction or intracranial haemorrhage) or reversion to abnormal velocity on transcranial Doppler ultrasonography, defined as 2 consecutive studies with abnormal velocities, 3 consecutive studies with an average velocity of 200 cm per second or more, or 3 consecutive inadequate studies plus evidence of severe stenosis on MRA. Secondary outcomes: also reports deaths, acute chest syndrome and transfusion adverse events. | |
| Notes | Funding: supported by grants (U01 HL 052193 and U01 HL 052016) from the National Heart, Lung, and Blood Institute. Declarations of interest: no potential conflict of interest relevant to this article was reported. Trial registration: no registration found. Mean length of follow‐up: the median time from randomisation to an end‐point event was 3.2 months (range, 2.1 to 10.1), and the mean (SD) was 4.5 (2.6) months. Power calculation: for a 54‐month trial involving 50 participants in each group, with 60 of the participants enrolled during the first 12 months and 40 during the next 24 months; after recruitment ended, there were 18 months of follow‐up. Analysis: the trial was stopped by the National Heart, Lung, and Blood Institute on the advice of the data safety and monitoring committee because of concern about safety at the fourth interim analysis. | |
| Risk of bias | ||
| Bias | Authors' judgement | Support for judgement |
| Random sequence generation (selection bias) | Low risk | Participants were stratified at randomisation according to the presence or absence of ischaemic lesions on MRI; random, permuted blocks of 4 or 6 participants were used within each group as defined by MRI. Institutional balancing with a tolerance of two participants per site was imposed to maintain an approximate balance in treatment assignments at each site. Eligible participants underwent randomisation with equal probability of continuing or halting transfusion. |
| Allocation concealment (selection bias) | Unclear risk | Method of allocation concealment not reported. |
| Blinding of participants and personnel (performance bias) | High risk | Participants and personnel were unblinded. |
| Blinding of outcome assessment (detection bias) | Low risk | "Suspected strokes were adjudicated by experts unaware of the treatment assignment using clinical data and all available imaging data. Stroke was defined as persistent neurologic abnormalities or transient symptoms accompanied by a new cerebral lesion appropriate to the patient’s clinical presentation." "The Doppler studies were transmitted to central readers who were unaware of the treatment assignments. All results were recorded as the time‐averaged mean of the maximum velocity in the middle cerebral or internal carotid artery and were classified as normal (all mean velocities of <170 cm per second), conditional (at least one mean velocity of 170 to 199 cm per second but none ≥200 cm per second), abnormal (at least one mean velocity of at least 200 cm per second), or inadequate (no information available on one or both middle cerebral arteries)". |
| Blinding of outcome assessment (detection bias) | High risk | Unblinded trial. |
| Incomplete outcome data (attrition bias) | High risk | It was not stated whether intent‐to‐treat analysis was used. Data on 9 participants assigned to no continued transfusion who did not have a primary end‐point event were censored: 5 of these participants resumed chronic transfusion and four started treatment with hydroxyurea. Of 38 participants assigned to continued transfusion, 5 discontinued participation in the trial. N = 14 (17%) of participants discontinued or censored. |
| Selective reporting (reporting bias) | Unclear risk | Primary outcomes reported. Did not state secondary outcomes. Not clear if all adverse events reported and also censored data not contributing to outcome reporting. |
| Other bias | Unclear risk | The trial was stopped by the National Heart, Lung, and Blood Institute on the advice of the data safety and monitoring committee because of concern about safety at the fourth interim analysis. |
| Methods | Multicentre randomised controlled non‐inferiority trial conducted in 26 paediatric sickle cell centres in the USA. Total duration of trial treatment was 30 months after randomisation, with a final trial visit scheduled 6 months after discontinuation of trial treatments. | |
| Participants | Inclusion criteria: paediatric participants with severe forms of SCA (HbSS, HbS/βº‐thalassemia, HbS/OArab); age range of 5.0 to 18.9 years, inclusive, at the time of enrolment; initial (primary) completed overt clinical stroke after the age 12 months with documented infarction on brain CT or MRI; at least 18 months of chronic monthly erythrocyte transfusions since primary stroke; transfusional iron overload, defined as a previously documented liver iron concentration ≥ 5.0 mg Fe per g of dry weight liver or serum ferritin ≥ 500 ng/mL on 2 independent measurements; adequate monthly erythrocyte transfusions with average HbS ≤ 45% (the upper limit of the established academic community standard) for the past 6 months before enrolment; parent or guardian willing and able to provide informed consent with verbal or written assent from the child (< 18 years of age), and subject willing and able to provide informed consent (≥ 18 years of age); ability to comply with trial related treatments, evaluations, and follow‐up. Exclusion criteria: inability to receive or tolerate chronic RBC transfusion therapy; inability to take or tolerate daily oral hydroxyurea; clinical and laboratory evidence of hypersplenism (temporary); abnormal laboratory values at initial evaluation (temporary); current participation in other therapeutic clinical trials; current use of other therapeutic agents for sickle cell disease (e.g. arginine, decitabine, magnesium); any condition or chronic illness, such as a positive tuberculin (PPD) test, which in the opinion of the investigator makes participation ill‐advised; inability or unwillingness to complete required screening studies, including blood tests, brain MRI/MRA, and liver biopsy; a sibling enrolled in SWiTCH. Participant flow: screened: N = 202; enrolled: N = 161; randomised: N = 134 Transfusion + chelation: N = 66 (one moved before starting trial treatment) Sex: Male: 31 (47%) Age: Mean (SD): 13.3 (3.8) Phenotype: HbSS: 66 (100%) Previous recurrent stroke: 4 (6%) History of TIA: 11 (17%) Infarction: 65 (98%) Vasculopathy: 54 (82%) Moya‐moya: 5 (8%) Liver iron content (LIC), mg Fe/g dw liver median (IQR): 14.5 (9.5 to 23.3) Serum ferritin, ng/mL median (IQR): 3282.0 (2321.0 to 4306.0) HbS% median (IQR): 27.0 (21.2 to 38.6) HbF% median (IQR): 1.7 (1.0 to 2.5) Alpha thalassaemia: not reported Hydroxyurea + phlebotomy:N = 67 Sex: male: 41 (61%) Age: Mean (SD): 13.0 (4.0) Phenotype: HbSS: 66 (99%) Previous recurrent stroke: 10 (15%) History of TIA: 10 (15%) Infarction: 65 (98%) Vasculopathy: 53 (79%) Moya‐moya: 11 (16%) Liver iron content (LIC), mg Fe/g dw liver median (IQR): 13.9 (8.7 to 22.9) Serum ferritin, ng/mL median (IQR): 3346.0 (2202.0 to 4682.0) HbS% median (IQR): 30.3 (23.8 to 39.6) HbF% median (IQR): 1.4 (0.8 to 2.2) Alpha thalassaemia: not reported | |
| Interventions | Standard treatment (transfusion + chelation): N = 66 For standard treatment (blood transfusion + iron chelation) participants received monthly blood transfusions designed to maintain 30% HbS, with local discretion regarding transfusion type (e.g., simple or erythrocytapheresis). Red cell component: not reported. Red cell matching: not reported. Iron chelation: daily iron chelation. Hydroxyurea + phlebotomy: N = 67 Participants randomised to hydroxyurea + phlebotomy commenced hydroxyurea at 20 mg/kg/d with stepwise escalation to MTD. Transfusions continued for 4 to 9 months during an overlap phase designed to protect against recurrent stroke during hydroxyurea dose escalation. Once MTD was reached and transfusions were discontinued, phlebotomy commenced with a target of 10 mL/kg (maximum volume, 500 mL) blood removed monthly to reduce iron burden. | |
| Outcomes | Primary outcome: composite primary endpoint of secondary stroke recurrence rate and quantitative liver iron concentration. Secondary outcomes: non‐stroke neurological events, non‐neurological sickle cell clinical events, quality of life evaluation, and measures of organ function. | |
| Notes | Funding: supported by National Heart, Lung, and Blood Institute grants U01‐HL078787 (R.E.W.) and U01‐HL078987 (R.W.H.). Declarations of interest: the authors declare no competing financial interests. Trial registration: ClinicalTrials.gov NCT00122980. Mean length of follow‐up: 6‐month follow‐up. Power calculation: not stated. Analysis: because reduction in LIC was not superior on hydroxyurea/phlebotomy, the DSMB concluded that the composite primary trial end point would not be met and recommended trial closure. NHLBI closed SWiTCH N = 40 did not complete treatment phase in transfusion/iron chelation arm and N = 43 did not complete treatment phase in hydroxyurea/phlebotomy arm. | |
| Risk of bias | ||
| Bias | Authors' judgement | Support for judgement |
| Random sequence generation (selection bias) | Unclear risk | Method of sequence generation not reported. |
| Allocation concealment (selection bias) | Unclear risk | Method of allocation concealment not reported. |
| Blinding of participants and personnel (performance bias) | High risk | By the nature of the trial treatments used to prevent recurrent stroke (blood transfusions vs hydroxyurea), it is impractical to make SWiTCH a blinded (masked) trial. |
| Blinding of outcome assessment (detection bias) | Low risk | The inclusive independent stroke adjudication process for all suspected new neurological events is a novel feature of the trial. Stroke recurrence is a primary trial endpoint but also is a critical safety endpoint for the SWiTCH trial. Accordingly, it was necessary to develop an inclusive process by which all potential stroke events were recognized and systematically adjudicated using a standardized protocol and masked consultants. Participants who develop any acute neurological change are promptly evaluated for possible stroke. In addition, site personnel are provided with a written script to use at each interval clinic visit, to ensure that subjects and families are asked each month about any signs and symptoms of stroke. After a new neurological event is suspected, the stroke adjudication process begins. The clinical history and neurological exam are reviewed by 3 independent neurologists without knowledge of the imaging findings. Simultaneously, the radiological evaluation is reviewed by 3 independent masked neuroradiologists without knowledge of the clinical history or neurological examination. Only after their independent consensus opinions are formed are these two opinions reconciled into a final stroke adjudication decision; a diagnosis of stroke requires new neurological findings with corresponding radiological changes. |
| Blinding of outcome assessment (detection bias) | High risk | The SWiTCH principal investigator was masked to all treatment‐specific results, including laboratory tests and clinical events. In addition, all investigators at the peripheral clinical sites are masked to trial treatment results outside of their own clinical centre. Unblinded trial. |
| Incomplete outcome data (attrition bias) | Low risk | The primary statistical analyses of efficacy and safety will be performed on the ITT population, which consists of all participants who were randomised to a trial treatment and for whom outcome data are available. |
| Selective reporting (reporting bias) | High risk | Several secondary outcomes not reported (i.e. quality of life, growth and development, organ damage, transfusion‐related, chelation‐related and phlebotomy related complications) |
| Other bias | Unclear risk | the DSMB concluded that the composite primary trial end point would not be met and recommended trial closure. NHLBI closed SWiTCH ‐ N = 40 did not complete treatment phase in transfusion/iron chelation arm and N = 43 did not complete treatment phase in hydroxyurea/phlebotomy arm. More participants had moya‐moya in the hydroxyurea arm (11 participants) than the transfusion arm (5 participants), it was not known if there was a difference between treatment arms in the number of participants with other types of severe vasculopathy. |
| Methods | Multicentre randomised open‐label non‐inferiority trial conducted at 26 paediatric hospital and health centres in the USA and Canada in children with abnormal TCD velocities greater or equal to 200 cm/s but no vasculopathy Duration: 24 months after randomisation with a 6‐month visit after completing exit studies. | |
| Participants | Screened: N = 159; excluded: N = 38; randomised: N = 121 Inclusion criteria
Exclusion criteria
Transfusion (N = 61): (mean (SD) unless otherwise stated) Sex: male: 19 (31%) Age: mean (SD): 9.5 ± 2.68 Phenotype: HbSS: 59 (97%) Age at index abnormal TCD: mean (SD): 5.7 (2.0) Average index TCD value (cm/s): mean (SD): 226 (25) Average entry TCD value (cm/s): mean (SD): 145 (21) Silent cerebral infarct: 25 (41%) Mild to moderate vasculopathy: 6 (10%) Transusion duration (years): 3.8 (1.8) Simple transfusions: 36 (59%) RBC alloantibodies: 9 (15%) RBC autoantibodies 12 (20%) Liver iron (mg Fe per g dry weight liver) Mean (SD): 8.5 (7.5) Serum ferritin (ng/mL) Mean (SD): 2713 (2207) Current chelation usage: 51 (84%) Haemoglobin (g/L) Mean (SD): 93 (8) HbS% Mean (SD): 26.5 (10.3) HbF% Mean (SD): 10·3 (6·5) Alpha thalassaemia: not reported Hydroxyurea (n = 60): (mean (SD) unless otherwise stated) Sex: male: 29 (48%) Age: mean (SD): 9.7 (3.2) Phenotype: HbSS: 60 (100%) Age at index abnormal TCD: mean (SD): 5.0 (1.8) Average index TCD value (cm/s): mean (SD): 220 (17) Average entry TCD value (cm/s): mean (SD): 145 (26) SCI: 22 (37%) Mild to moderate vasculopathy: 4 (7%) Transfusion duration (years): 4.5 (2.8) Simple transfusions: 39 (65%) RBC alloantibodies: 11 (18%) RBC autoantibodies: 10 (17%) Liver iron (mg Fe per g dry weight liver): Mean (SD): 11.3 (9.5) Serum ferritin (ng/mL): mean (SD): 3080 (2347) Current chelation usage: 48 (80%) Haemoglobin (g/L): mean (SD): 93 (8) HbS% Mean (SD): 27.6 (9.9) HbF% Mean (SD): 8·8 (5·5) Alpha thalassaemia: not reported | |
| Interventions | Transfusions N = 61: Participants continued to receive transfusions once per month to maintain HbS at 30% or lower with local discretion with respect to transfusion type (simple, partial exchange, or erythrocytapheresis). Red cell component: not reported. Red cell matching: not reported. Iron chelation: deferasirox was recommended to manage iron overload; children already receiving chelation therapy maintained their current doses; those starting chelation therapy received deferasirox at 10 ‐ 40 mg/kg per day with the dose dependent on liver iron concentration at screening. Hydroxyurea N = 60: Participants initiated treatment of hydroxyurea at 20 mg/kg per day (capsules or liquid formulation) with escalation to MTD defined as the dose at which moderate marrow suppression of neutrophils and reticulocytes was achieved. Transfusions were slowly weaned in accordance with a standard protocol over 4 ‐ 9 months. | |
| Outcomes | Primary outcome: TCD time‐averaged mean velocity on the index side defined as the cerebral hemisphere with the higher mean arterial velocity at baseline assessment. Secondary outcomes: TCD velocity on the non‐index side, new stroke or non‐stroke neurological events, new brain MRI/MRA lesions, hepatic iron overload, sickle‐related events, neuropsychological status, quality of life, growth, and treatment‐related complications. | |
| Notes | Funding: supported by the National Heart, Lung, and Blood Institute through grants R01 HL‐095647 (REW) and R01 HL‐095511 (BRD). Declarations of interest: all authors declared. Trial registration: ClinicalTrials.gov, number NCT01425307. Mean length of follow‐up: 24 months after randomisation,with a 6‐month visit after completing exit studies Power calculation: 100 participants (50 per treatment arm) who complete the 24‐month post‐randomisation follow‐up period will provide at least 90% power to test the non‐inferiority hypothesis under reasonable scenarios. Analysis: two planned interim analyses after 33% and 67% of participants had completed exit studies. At the first scheduled interim analysis, non‐inferiority was shown and the sponsor terminated the trial after 50% had exited and repeat analysis confirmed the first interim analysis. We did analyses in the ITT population, except for a planned per‐protocol analysis of TCD velocities, which excluded participants who exited the trial early. | |
| Risk of bias | ||
| Bias | Authors' judgement | Support for judgement |
| Random sequence generation (selection bias) | Low risk | Participants will be randomised to treatment arm by means of an adaptive randomisation algorithm to maintain balance between treatment groups with respect to site, age, and the mean of 2 screening maximum TCD velocities. Participants are randomised to either the Standard or Alternative treatment arm at an approximately 1 to 1 ratio. Randomisation is stratified within site to achieve approximate balance with respect to two baseline factors: (1) the mean of the two screening TCD velocity values and (2) participant age at enrolment. Block sizes will be fixed at 4 to maintain equal sample sizes in the two arms within a given site every fourth randomisation. Random block size was not employed due to the small number of participants excepted at each clinical site. Assignment within a given block of four will be randomly ordered and will vary from block to block. The first 8 participants to be randomised will be assigned to a treatment arm based on the site‐specific unconstrained random allocation scheme. |
| Allocation concealment (selection bias) | Low risk | From appendix: this process assures that the differences in mean baseline age and mean baseline TCD velocity between the two arms, after the participant’s randomisation, do not exceed a critical value determined by a statistical probability distribution. Adaptive randomisation and trial‐wide imbalance constraints and other constraints appear to ensure that allocation is statistically determined. Randomisation was done centrally, stratified by site with a block size of four, and we used an adaptive randomisation scheme to balance the covariates of baseline age and TCD velocity. |
| Blinding of participants and personnel (performance bias) | High risk | Participants and personnel are unblinded. |
| Blinding of outcome assessment (detection bias) | Low risk | TCD examinations were done just before transfusions or phlebotomy, and all were read centrally by observers masked to treatment assignment and previous TCD results. All new potential stroke events were assessed with careful neurological evaluation and brain MRI or MRA examinations, then adjudicated centrally by a panel of expert reviewers. Independent and then consensus opinions were obtained from neurologists and neuroradiologists masked to trial treatment. Brain MRI/MRA examinations at trial exit allowed us to confirm that no strokes had been missed by the adjudication process. |
| Blinding of outcome assessment (detection bias) | High risk | Unblinded trial. |
| Incomplete outcome data (attrition bias) | Low risk | All randomised participants included in safety and efficacy analysis Transfusion arm: 0 lost to follow‐up, 8 discontinued intervention, 3 adjudicated TIA, 1 TCD velocity > 240 cm/s 2 non‐adherence 1 difficulty finding matched blood 1 chose to withdraw hydroxyurea arm: 6 discontinued intervention 3 adjudicated transient Ischaemic attack 3 non‐adherence. |
| Selective reporting (reporting bias) | Unclear risk | Some outcomes will be reported in future papers. |
| Other bias | Unclear risk | Children with severe vasculopathy were excluded from TWiTCH trial during screening, so these children might not be suitable candidates for hydroxyurea. Mean age of the trial participants was slightly older than the peak age for primary stroke (about 5 ‐ 6 years), yet still within the published range. The duration of hydroxyurea therapy without transfusions was relatively short; longer follow‐up is clearly needed to establish whether these findings are maintained over time. Trial stopped early based on TCD velocities, an accepted surrogate for primary stroke risk in children with sickle cell anaemia, still be some uncertainty with regards to effectiveness for stroke prevention in certain populations and over time. After full enrolment and when 37% of the participants had exited the trial, the first scheduled interim analysis showed that the stopping boundary had been passed and non‐inferiority was shown. After 50% of participants had exited, repeat analyses supported these findings and the trial was terminated by NHLBI. Remaining participants then completed all exit studies before discontinuing protocol‐directed trial treatment. In total, the standard group included 42 participants who completed trial treatment, 11 who had truncated treatment, and eight who exited early; the alternative group included 41 participants who completed treatment, 13 who had truncated treatment, and 6 who exited early. |
DSMB: Data and Safety Monitoring Board
HbS: sickle haemoglobin
HbSβºThal: sickle beta‐zero thalassaemia
HbSS: homozygous sickle cell disease
ITT: intention‐to‐treat
MRA: magnetic resonance angiography
MRI: magnetic resonance imaging
MTD: maximum tolerated dose
RBC: red blood cells
RCT: randomised controlled trial
SCI: silent cerebral infarct
SD: standard deviation
TCD: transcranial Doppler ultrasonography
TIA: transient Ischaemic attack
Characteristics of excluded studies [ordered by study ID]
Ir a:
| Study | Reason for exclusion |
| Not a randomised trial. | |
| No red blood cell transfusion arm; hydroxyurea versus observation. |
Data and analyses
| Outcome or subgroup title | No. of studies | No. of participants | Statistical method | Effect size |
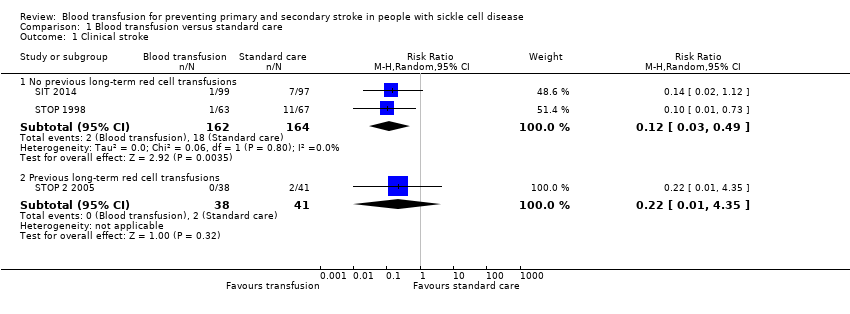
| 1 Clinical stroke Show forest plot | 3 | Risk Ratio (M‐H, Random, 95% CI) | Subtotals only | |
| Analysis 1.1  Comparison 1 Blood transfusion versus standard care, Outcome 1 Clinical stroke. | ||||
| 1.1 No previous long‐term red cell transfusions | 2 | 326 | Risk Ratio (M‐H, Random, 95% CI) | 0.12 [0.03, 0.49] |
| 1.2 Previous long‐term red cell transfusions | 1 | 79 | Risk Ratio (M‐H, Random, 95% CI) | 0.22 [0.01, 4.35] |
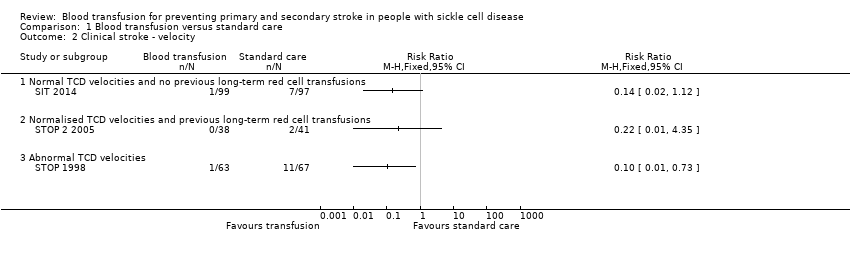
| 2 Clinical stroke ‐ velocity Show forest plot | 3 | Risk Ratio (M‐H, Fixed, 95% CI) | Totals not selected | |
| Analysis 1.2  Comparison 1 Blood transfusion versus standard care, Outcome 2 Clinical stroke ‐ velocity. | ||||
| 2.1 Normal TCD velocities and no previous long‐term red cell transfusions | 1 | Risk Ratio (M‐H, Fixed, 95% CI) | 0.0 [0.0, 0.0] | |
| 2.2 Normalised TCD velocities and previous long‐term red cell transfusions | 1 | Risk Ratio (M‐H, Fixed, 95% CI) | 0.0 [0.0, 0.0] | |
| 2.3 Abnormal TCD velocities | 1 | Risk Ratio (M‐H, Fixed, 95% CI) | 0.0 [0.0, 0.0] | |
| 3 Clinical stroke ‐ SCI Show forest plot | 2 | Risk Ratio (M‐H, Fixed, 95% CI) | Subtotals only | |
| Analysis 1.3 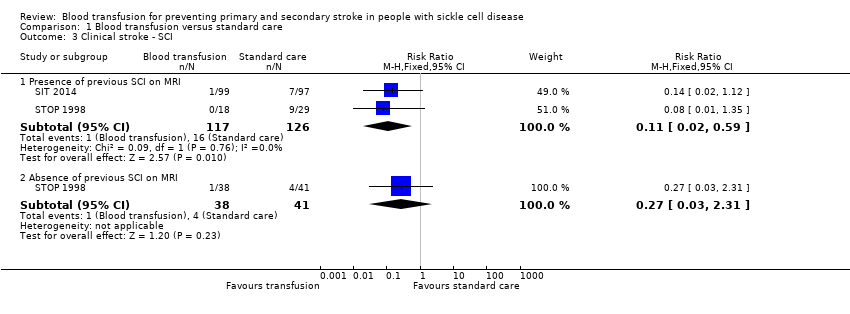 Comparison 1 Blood transfusion versus standard care, Outcome 3 Clinical stroke ‐ SCI. | ||||
| 3.1 Presence of previous SCI on MRI | 2 | 243 | Risk Ratio (M‐H, Fixed, 95% CI) | 0.11 [0.02, 0.59] |
| 3.2 Absence of previous SCI on MRI | 1 | 79 | Risk Ratio (M‐H, Fixed, 95% CI) | 0.27 [0.03, 2.31] |
| 4 Mortality Show forest plot | 1 | Peto Odds Ratio (Peto, Fixed, 95% CI) | Totals not selected | |
| Analysis 1.4  Comparison 1 Blood transfusion versus standard care, Outcome 4 Mortality. | ||||
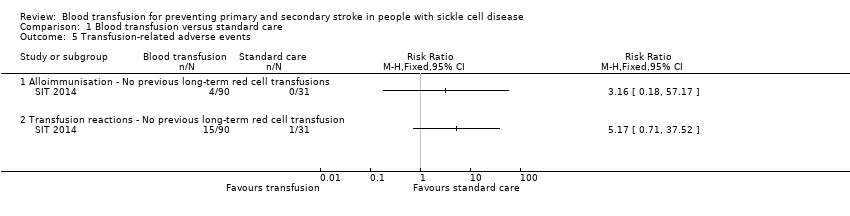
| 5 Transfusion‐related adverse events Show forest plot | 1 | Risk Ratio (M‐H, Fixed, 95% CI) | Totals not selected | |
| Analysis 1.5  Comparison 1 Blood transfusion versus standard care, Outcome 5 Transfusion‐related adverse events. | ||||
| 5.1 Alloimmunisation ‐ No previous long‐term red cell transfusions | 1 | Risk Ratio (M‐H, Fixed, 95% CI) | 0.0 [0.0, 0.0] | |
| 5.2 Transfusion reactions ‐ No previous long‐term red cell transfusion | 1 | Risk Ratio (M‐H, Fixed, 95% CI) | 0.0 [0.0, 0.0] | |
| 6 TIA Show forest plot | 2 | Peto Odds Ratio (Peto, Fixed, 95% CI) | Subtotals only | |
| Analysis 1.6  Comparison 1 Blood transfusion versus standard care, Outcome 6 TIA. | ||||
| 6.1 No previous long‐term red cell transfusions | 2 | 323 | Peto Odds Ratio (Peto, Fixed, 95% CI) | 0.13 [0.01, 2.11] |
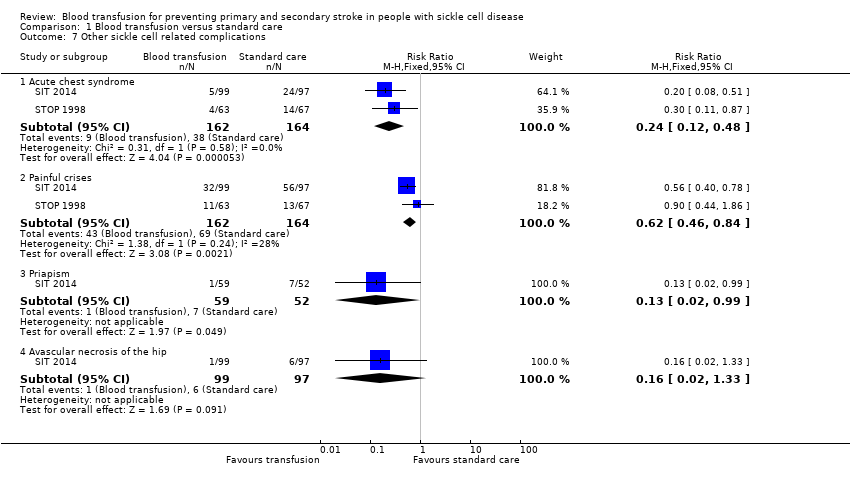
| 7 Other sickle cell related complications Show forest plot | 2 | Risk Ratio (M‐H, Fixed, 95% CI) | Subtotals only | |
| Analysis 1.7  Comparison 1 Blood transfusion versus standard care, Outcome 7 Other sickle cell related complications. | ||||
| 7.1 Acute chest syndrome | 2 | 326 | Risk Ratio (M‐H, Fixed, 95% CI) | 0.24 [0.12, 0.48] |
| 7.2 Painful crises | 2 | 326 | Risk Ratio (M‐H, Fixed, 95% CI) | 0.62 [0.46, 0.84] |
| 7.3 Priapism | 1 | 111 | Risk Ratio (M‐H, Fixed, 95% CI) | 0.13 [0.02, 0.99] |
| 7.4 Avascular necrosis of the hip | 1 | 196 | Risk Ratio (M‐H, Fixed, 95% CI) | 0.16 [0.02, 1.33] |
| Outcome or subgroup title | No. of studies | No. of participants | Statistical method | Effect size |
| 1 Clinical stroke ‐ Secondary prevention Show forest plot | 1 | Risk Ratio (M‐H, Fixed, 95% CI) | Totals not selected | |
| Analysis 2.1  Comparison 2 Hydroxyurea and phlebotomy versus standard treatment (transfusions/chelation), Outcome 1 Clinical stroke ‐ Secondary prevention. | ||||
| 2 Mortality Show forest plot | 2 | Peto Odds Ratio (Peto, Fixed, 95% CI) | Totals not selected | |
| Analysis 2.2  Comparison 2 Hydroxyurea and phlebotomy versus standard treatment (transfusions/chelation), Outcome 2 Mortality. | ||||
| 2.1 Mortality ‐ Primary prevention | 1 | Peto Odds Ratio (Peto, Fixed, 95% CI) | 0.0 [0.0, 0.0] | |
| 2.2 Mortality ‐ Secondary prevention | 1 | Peto Odds Ratio (Peto, Fixed, 95% CI) | 0.0 [0.0, 0.0] | |
| 3 Transfusion‐related complications ‐ Serum ferritin; Primary prevention Show forest plot | 1 | Mean Difference (IV, Fixed, 95% CI) | Totals not selected | |
| Analysis 2.3  Comparison 2 Hydroxyurea and phlebotomy versus standard treatment (transfusions/chelation), Outcome 3 Transfusion‐related complications ‐ Serum ferritin; Primary prevention. | ||||
| 4 Transfusion related complications ‐ Liver iron concentration ‐ Primary prevention Show forest plot | 1 | Mean Difference (IV, Fixed, 95% CI) | Totals not selected | |
| Analysis 2.4  Comparison 2 Hydroxyurea and phlebotomy versus standard treatment (transfusions/chelation), Outcome 4 Transfusion related complications ‐ Liver iron concentration ‐ Primary prevention. | ||||
| 5 Other neurological event Show forest plot | 2 | Risk Ratio (M‐H, Fixed, 95% CI) | Totals not selected | |
| Analysis 2.5 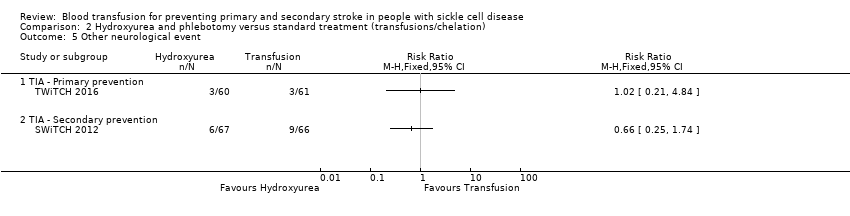 Comparison 2 Hydroxyurea and phlebotomy versus standard treatment (transfusions/chelation), Outcome 5 Other neurological event. | ||||
| 5.1 TIA ‐ Primary prevention | 1 | Risk Ratio (M‐H, Fixed, 95% CI) | 0.0 [0.0, 0.0] | |
| 5.2 TIA ‐ Secondary prevention | 1 | Risk Ratio (M‐H, Fixed, 95% CI) | 0.0 [0.0, 0.0] | |
| 6 Other sickle cell related complications Show forest plot | 2 | Risk Ratio (M‐H, Random, 95% CI) | Totals not selected | |
| Analysis 2.6 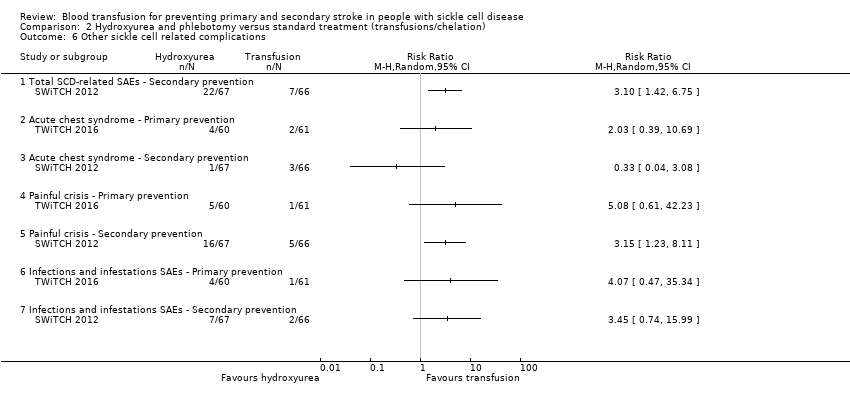 Comparison 2 Hydroxyurea and phlebotomy versus standard treatment (transfusions/chelation), Outcome 6 Other sickle cell related complications. | ||||
| 6.1 Total SCD‐related SAEs ‐ Secondary prevention | 1 | Risk Ratio (M‐H, Random, 95% CI) | 0.0 [0.0, 0.0] | |
| 6.2 Acute chest syndrome ‐ Primary prevention | 1 | Risk Ratio (M‐H, Random, 95% CI) | 0.0 [0.0, 0.0] | |
| 6.3 Acute chest syndrome ‐ Secondary prevention | 1 | Risk Ratio (M‐H, Random, 95% CI) | 0.0 [0.0, 0.0] | |
| 6.4 Painful crisis ‐ Primary prevention | 1 | Risk Ratio (M‐H, Random, 95% CI) | 0.0 [0.0, 0.0] | |
| 6.5 Painful crisis ‐ Secondary prevention | 1 | Risk Ratio (M‐H, Random, 95% CI) | 0.0 [0.0, 0.0] | |
| 6.6 Infections and infestations SAEs ‐ Primary prevention | 1 | Risk Ratio (M‐H, Random, 95% CI) | 0.0 [0.0, 0.0] | |
| 6.7 Infections and infestations SAEs ‐ Secondary prevention | 1 | Risk Ratio (M‐H, Random, 95% CI) | 0.0 [0.0, 0.0] | |
| 7 Haemoglobin levels Show forest plot | 1 | Mean Difference (IV, Fixed, 95% CI) | Totals not selected | |
| Analysis 2.7  Comparison 2 Hydroxyurea and phlebotomy versus standard treatment (transfusions/chelation), Outcome 7 Haemoglobin levels. | ||||
| 8 Haemoglobin S levels Show forest plot | 1 | Mean Difference (IV, Fixed, 95% CI) | Totals not selected | |
| Analysis 2.8  Comparison 2 Hydroxyurea and phlebotomy versus standard treatment (transfusions/chelation), Outcome 8 Haemoglobin S levels. | ||||

Study flow diagram.

Risk of bias graph: review authors' judgements about each risk of bias item presented as percentages across all included studies.

Risk of bias summary: review authors' judgements about each risk of bias item for each included study.
Comparison 1 Blood transfusion versus standard care, Outcome 1 Clinical stroke.
Comparison 1 Blood transfusion versus standard care, Outcome 2 Clinical stroke ‐ velocity.

Comparison 1 Blood transfusion versus standard care, Outcome 3 Clinical stroke ‐ SCI.

Comparison 1 Blood transfusion versus standard care, Outcome 4 Mortality.
Comparison 1 Blood transfusion versus standard care, Outcome 5 Transfusion‐related adverse events.

Comparison 1 Blood transfusion versus standard care, Outcome 6 TIA.
Comparison 1 Blood transfusion versus standard care, Outcome 7 Other sickle cell related complications.

Comparison 2 Hydroxyurea and phlebotomy versus standard treatment (transfusions/chelation), Outcome 1 Clinical stroke ‐ Secondary prevention.

Comparison 2 Hydroxyurea and phlebotomy versus standard treatment (transfusions/chelation), Outcome 2 Mortality.

Comparison 2 Hydroxyurea and phlebotomy versus standard treatment (transfusions/chelation), Outcome 3 Transfusion‐related complications ‐ Serum ferritin; Primary prevention.

Comparison 2 Hydroxyurea and phlebotomy versus standard treatment (transfusions/chelation), Outcome 4 Transfusion related complications ‐ Liver iron concentration ‐ Primary prevention.

Comparison 2 Hydroxyurea and phlebotomy versus standard treatment (transfusions/chelation), Outcome 5 Other neurological event.

Comparison 2 Hydroxyurea and phlebotomy versus standard treatment (transfusions/chelation), Outcome 6 Other sickle cell related complications.

Comparison 2 Hydroxyurea and phlebotomy versus standard treatment (transfusions/chelation), Outcome 7 Haemoglobin levels.

Comparison 2 Hydroxyurea and phlebotomy versus standard treatment (transfusions/chelation), Outcome 8 Haemoglobin S levels.
| Primary prevention | ||||||
| Patient or population: individuals with sickle cell disease who are at risk of a primary stroke who have not had previous long‐term red cell transfusions | ||||||
| Outcomes | Anticipated absolute effects* (95% CI) | Relative effect | № of participants | Quality of the evidence | Comments | |
| Risk with standard care | Risk with Blood transfusion | |||||
| Clinical stroke | Trial population | RR 0.12 | 326 | ⊕⊕⊕⊝ | ||
| 110 per 1000 | 13 per 1000 (3 to 54) | |||||
| All‐cause mortality | No deaths occurred in either trial arm | ‐ | 326 | ⊕⊝⊝⊝ | ||
| Adverse events associated with transfusion | Moderatea | RR 3.16 | 121 | ⊕⊝⊝⊝ | ||
| 10 per 1000 | 32 per 1000 (2 to 572) | |||||
| TIA | Trial population | Peto OR 0.13 (0.01 to 2.11) | 323 (2 RCTs) | ⊕⊝⊝⊝ | ||
| 21 per 1000 | 5 per 1000 (0 to 43) | |||||
| Serious adverse events as a result of sickle cell‐related complications | Trial population | RR 0.24 | 326 | ⊕⊕⊝⊝ | ||
| 232 per 1,000 | 56 per 1000 (28 to 111) | |||||
| Moderate | ||||||
| 230 per 1000 | 55 per 1000 (28 to 110) | |||||
| Measures of neurological impairment assessed with: WASI IQ score | Least square mean 1.7 (SE 95% CI ‐1.1 to 4.4) | ‐ | 166 (1 RCT) | ⊕⊕⊝⊝ | Author reported data from SIT 2014 | |
| Quality of life assessed with: Child Health Questionnaire Parent Form 50 | Difference estimate ‐0.54 (‐0.92 to ‐0.17) | ‐ | 196 (1 RCT) | ⊕⊕⊝⊝ | Author reported data from SIT 2014 | |
| *The risk in the intervention group (and its 95% confidence interval) is based on the assumed risk in the comparison group and the relative effect of the intervention (and its 95% CI). | ||||||
| GRADE Working Group grades of evidence | ||||||
| 1 We downgraded the quality of evidence by 1 due to imprecision. Rare event. No deaths occurred. 2 We downgraded the quality of the evidence by 1 due to risk of bias. Unblinded trial and cross‐overs, and imbalance between loss to follow‐up between trial arms 3 We downgraded the quality of the evidence by 1 due to indirectness. Only children with HbSS or HbSβº thalassaemia included in trials 4 We downgraded the quality of evidence by 2 due to imprecision. The estimate has very wide CIs a Based on Chou 2013 | ||||||
| Primary prevention | ||||||
| Patient or population: individuals with sickle cell disease who are at risk of a primary stroke who have had long‐term red cell transfusions to prevent a stroke | ||||||
| Outcomes | Anticipated absolute effects* (95% CI) | Relative effect | № of participants | Quality of the evidence | Comments | |
| Risk with standard care | Risk with blood transfusion | |||||
| Clinical stroke | Trial population | RR 0.22 (0.01 to 4.35) | 79 | ⊕⊝⊝⊝ | ||
| 49 per 1000 | 11 per 1000 (0 to 212) | |||||
| All‐cause mortality | Moderatea | Peto OR 8.00 (0.16 to 404.12) | 79 | ⊕⊝⊝⊝ | ||
| 10 per 1000 | 75 per 1000 (2 to 803) | |||||
| Adverse events associated with transfusion | See comment | 79 (1 RCT) | ‐ | No comparative numbers reported | ||
| TIA | See comment | 79 (1 RCT) | ‐ | No comparative numbers reported | ||
| Serious adverse events as a result of sickle cell‐related complications assessed with: ACS | See comment | 79 (1 RCT) | ‐ | No comparative numbers reported | ||
| Measures of neurological impairment ‐ not reported | Outcome not reported | ‐ | ‐ | ‐ | ||
| Quality of life ‐ not reported | Outcome not reported | ‐ | ‐ | ‐ | ‐ | |
| *The risk in the intervention group (and its 95% confidence interval) is based on the assumed risk in the comparison group and the relative effect of the intervention (and its 95% CI). | ||||||
| GRADE Working Group grades of evidence | ||||||
| 1 We did not downgrade the evidence due to risk of bias because the evidence was already very low grade evidence. There was attrition bias. Imbalance between loss to follow‐up between trial arms 2 We downgraded the quality of the evidence by 1 due to indirectness. Only children with HbSS or HbSβº thalassaemia included in trials 3 We downgraded the quality of evidence by 2 due to imprecision. The estimate has very wide CIs a Assuming a mortality rate of 1% | ||||||
| Primary prevention | ||||||
| Patient or population: individuals with sickle cell disease who are at risk of a primary stroke who have had long‐term red cell transfusions to prevent a stroke | ||||||
| Outcomes | Anticipated absolute effects* (95% CI) | Relative effect | № of participants | Quality of the evidence | Comments | |
| Risk with hydroxyurea and phlebotomy | Risk with Blood transfusion | |||||
| Clinical stroke | No strokes occurred in either trial arm | ‐ | 121 (1 RCT) | ⊕⊝⊝⊝ | ||
| All‐cause mortality | No deaths occurred in either trial arm | ‐ | 121 (1 RCT) | ⊕⊝⊝⊝ | ||
| Adverse events associated with transfusion | The mean liver iron concentration was 9.5 mg Fe/g dry weight | MD 1.8 mg Fe/g dry weight lower (5.16 lower to 1.56 higher) | ‐ | 121 (1 RCT) | ⊕⊕⊝⊝ | Switching to hydroxyurea and phlebotomy may reduce serum ferritin levels compared to continuing to receive red cell transfusions and chelation (MD) ‐1398 μg/L, 95% CI ‐1929 to ‐867; one trial, 121 participants) |
| Incidence of TIA | 49 per 1000 | 50 per 1,000 (10 to 238) | RR 1.02 (0.21 to 4.84) | 121 (1 RCT) | ⊕⊝⊝⊝ | |
| Serious adverse events as a result of sickle cell‐related complications | Trial population | RR 2.03 (0.39 to 10.69) | 121 (1 RCT) | ⊕⊝⊝⊝ | ||
| 33 per 1000 | 67 per 1,000 (13 to 350) | |||||
| Measures of neurological impairment ‐ not reported | Outcome not reported | ‐ | ‐ | ‐ | ‐ | |
| Quality of life ‐ not reported | Outcome not reported | ‐ | ‐ | ‐ | ‐ | |
| *The risk in the intervention group (and its 95% confidence interval) is based on the assumed risk in the comparison group and the relative effect of the intervention (and its 95% CI). | ||||||
| GRADE Working Group grades of evidence | ||||||
| 1 We downgraded the quality of the evidence by 2 due to imprecision. Rare event. No deaths or stroke occurred. 2 We downgraded the quality of the evidence by 1 due to indirectness. Only children with HbSS or HbSβº thalassaemia included in trials 3 We downgraded the quality of the evidence by 1 due to risk of bias.Trial was not blinded and stopped early 4 We downgraded the quality of the evidence by 1 due to imprecision. The estimate has very wide CIs | ||||||
| Secondary prevention | ||||||
| Patient or population: individuals with sickle cell disease who have had a stroke who have had long‐term red cell transfusions to prevent another stroke | ||||||
| Outcomes | Anticipated absolute effects* (95% CI) | Relative effect | № of participants | Quality of the evidence | Comments | |
| Risk with hydroxyurea and phlebotomy | Risk with Blood transfusion | |||||
| Clinical stroke | Trial population | RR 14.78 | 133 (1 RCT) | ⊕⊝⊝⊝ | ||
| 0 per 1000 | 0 per 1000 (0 to 0) | |||||
| All‐cause mortality | 15 per 1000 | 15 per 1000 (1 to 198) | Peto OR 0.98 (0.06 to 15.92) | 133 (1 RCT) | ⊕⊝⊝⊝ | |
| Transfusion‐related adverse events ‐ assessed with liver iron concentration mg Fe/g dry weight liver | Hydroxyurea arm: median 17.2 mg IQR 10.0 to 30.6 Transfusion arm: median 17.3 mg IQR 8.8 to 30.7 | 56 (1 RCT) | ⊕⊕⊝⊝ | P = 0.7920a Switching to hydroxyurea and phlebotomy may reduce serum ferritin levels compared to continuing to receive red cell transfusions and chelation 1994 μg/L, interquartile range (IQR) 998 to 3475, in the hydroxyurea arm and 4064 μg/L, IQR 2330 to 7126, in the transfusion arm; one trial, 133 participants; P < 0.001 a | ||
| Incidence of TIA | Trial population | RR 0.66 | 133 (1 RCT) | ⊕⊝⊝⊝ | ||
| 136 per 1000 | 90 per 1000 (34 to 237) | |||||
| Serious adverse events as a result of sickle cell‐related complications | Trial population | RR 0.33 (0.04 to 3.08) | 133 (1 RCT) | ⊕⊝⊝⊝ | ||
| 45 per 1000 | 15 per 1000 (2 to 140) | |||||
| Measures of neurological impairment ‐ not reported | Outcome not reported | ‐ | ‐ | ‐ | ||
| Quality of life ‐ not reported | Outcome not reported | ‐ | ‐ | ‐ | ||
| *The risk in the intervention group (and its 95% confidence interval) is based on the assumed risk in the comparison group and the relative effect of the intervention (and its 95% CI). | ||||||
| GRADE Working Group grades of evidence | ||||||
| 1 We downgraded the quality of the evidence by 1 due to risk of bias. Trial was not blinded and stopped early 2 We downgraded the quality of the evidence by 1 due to indirectness. Only children with HbSS or HbSβº thalassaemia included in trials 3 We downgraded the quality of the evidence by 1 due to imprecision. The estimate has very wide CIs a Analysis performed by the trial authors | ||||||
| Outcomes | Trials | Number of participants with at least one event | Adverse events/100 person‐years | Incidence rate ratioc (95% CI) | ||
| Transfusion | Standard | Transfusion | Standard | |||
| Transfusion reactions | 15 out of 90a | 1 out of 31b | 8.85 | 1.66 | 5.33 (1.67 to 23.52) | |
| Ferritin > 1500 μg/L | 76 out of 90a | 3 out of 31b | 534.70 | 37.07 | 14.42 (5.41 to 85.17) | |
| aNine participants who declined transfusion were excluded from the analysis. Abbreviations: CI: confidence interval | ||||||
| Outcomes | Trials | Number of participants with at least one event | Adverse events/100 person‐years | Incidence rate ratioa (95% CI) | ||
| Transfusion | Standard | Transfusion | Standard | |||
| Acute chest syndrome | 4 out of 63 | 14 out of 67 | 4.8b | 15.3b | ‐ | |
| 5 out of 99 | 24 out of 97 | 1.81b | 14.35b | 0.41 (0.20 to 0.75) | ||
| Painful crisis | 11 out of 63 | 13 out of 67 | 16.2 | 27.6 | ‐ | |
| 32 out of 99 | 56 out of 97 | 41.58 | 102.21 | 0.13 (0.04 to 0.28) | ||
| Priapism | 1 out of 59 | 7 out of 52 | 0.84 | 6.65 | 0.13 (0.03 to 0.55) | |
| Symptomatic avascular necrosis of the hip | 1 out of 99 | 6 out of 97 | 0.4 | 2.25 | 0.22 (0.05 to 0.85) | |
| a The incidence ratio was calculated as the rate of adverse events per 100 person‐years in the transfusion group divided by the rate of adverse events per 100 person‐years in the observation group. The 95% confidence intervals were calculated with the use of the bootstrap method with 10,000 replications. b One child from the standard care group was excluded from these analyses due to a stroke on day 16 of the trial. Abbreviation: CI: confidence interval | ||||||
| Trial | Intervention | Baseline | 6 to 12 months | 12 to 18 months | 18 to 24 months | ||||
| Hb (g/L) | Hb S (%) | Hb (g/L) | Hb S (%) | Hb (g/L) | Hb S (%) | Hb (g/L) | Hb S (%) | ||
| No previous long‐term transfusions | |||||||||
| Transfusion | Median 77 IQR (72 to 84) | Median 85 90% CI (51 to 95) | ‐ | Median 30 90% CI (17 to 43) | ‐ | Median 29 90% CI (16 to 43) | ‐ | Median 30 90% CI (16 to 43) | |
| Standard | Median 79 IQR (74 to 89) | ‐ | ‐ | ‐ | ‐ | ‐ | ‐ | ‐ | |
| Transfusion | Mean (SD) 72 (8) | Mean (SD) 87 (10) | ‐ | ‐ | ‐ | ‐ | ‐ | ‐ | |
| Standard | Mean (SD) 76 (7) | Mean (SD) 87 (7) | ‐ | ‐ | ‐ | ‐ | ‐ | ‐ | |
| Previous long‐term transfusions | |||||||||
| Transfusion | Mean (SD) 93 (9) | Mean (SD) 21 (8.6) | Mean (SD) 94 (9) | Mean (SD) 25.4 (10.9) | ‐ | ‐ | ‐ | ‐ | |
| Standard | Mean (SD) 98 (12) | Mean (SD) 19 (11) | Mean (SD) 77 (8) | Mean (SD) 81.0 (8.6) | ‐ | ‐ | ‐ | ‐ | |
| Abbreviations: CI: confidence interval; IQR: interquartile range; SD: standard deviation | |||||||||
| Trial | Number of transfusions | Number of HbS levels measured | HbS less than 30% | HbS 30 to 40% | HbS greater than 40% |
| No previous long‐term transfusions | |||||
| 1521 | ‐ | ‐ | 101 | 42 | |
| Previous long‐term transfusions | |||||
| 1070 | 988 | 748 (76%) | 192 (19%) | 48 (5%) | |
| Outcome or subgroup title | No. of studies | No. of participants | Statistical method | Effect size |
| 1 Clinical stroke Show forest plot | 3 | Risk Ratio (M‐H, Random, 95% CI) | Subtotals only | |
| 1.1 No previous long‐term red cell transfusions | 2 | 326 | Risk Ratio (M‐H, Random, 95% CI) | 0.12 [0.03, 0.49] |
| 1.2 Previous long‐term red cell transfusions | 1 | 79 | Risk Ratio (M‐H, Random, 95% CI) | 0.22 [0.01, 4.35] |
| 2 Clinical stroke ‐ velocity Show forest plot | 3 | Risk Ratio (M‐H, Fixed, 95% CI) | Totals not selected | |
| 2.1 Normal TCD velocities and no previous long‐term red cell transfusions | 1 | Risk Ratio (M‐H, Fixed, 95% CI) | 0.0 [0.0, 0.0] | |
| 2.2 Normalised TCD velocities and previous long‐term red cell transfusions | 1 | Risk Ratio (M‐H, Fixed, 95% CI) | 0.0 [0.0, 0.0] | |
| 2.3 Abnormal TCD velocities | 1 | Risk Ratio (M‐H, Fixed, 95% CI) | 0.0 [0.0, 0.0] | |
| 3 Clinical stroke ‐ SCI Show forest plot | 2 | Risk Ratio (M‐H, Fixed, 95% CI) | Subtotals only | |
| 3.1 Presence of previous SCI on MRI | 2 | 243 | Risk Ratio (M‐H, Fixed, 95% CI) | 0.11 [0.02, 0.59] |
| 3.2 Absence of previous SCI on MRI | 1 | 79 | Risk Ratio (M‐H, Fixed, 95% CI) | 0.27 [0.03, 2.31] |
| 4 Mortality Show forest plot | 1 | Peto Odds Ratio (Peto, Fixed, 95% CI) | Totals not selected | |
| 5 Transfusion‐related adverse events Show forest plot | 1 | Risk Ratio (M‐H, Fixed, 95% CI) | Totals not selected | |
| 5.1 Alloimmunisation ‐ No previous long‐term red cell transfusions | 1 | Risk Ratio (M‐H, Fixed, 95% CI) | 0.0 [0.0, 0.0] | |
| 5.2 Transfusion reactions ‐ No previous long‐term red cell transfusion | 1 | Risk Ratio (M‐H, Fixed, 95% CI) | 0.0 [0.0, 0.0] | |
| 6 TIA Show forest plot | 2 | Peto Odds Ratio (Peto, Fixed, 95% CI) | Subtotals only | |
| 6.1 No previous long‐term red cell transfusions | 2 | 323 | Peto Odds Ratio (Peto, Fixed, 95% CI) | 0.13 [0.01, 2.11] |
| 7 Other sickle cell related complications Show forest plot | 2 | Risk Ratio (M‐H, Fixed, 95% CI) | Subtotals only | |
| 7.1 Acute chest syndrome | 2 | 326 | Risk Ratio (M‐H, Fixed, 95% CI) | 0.24 [0.12, 0.48] |
| 7.2 Painful crises | 2 | 326 | Risk Ratio (M‐H, Fixed, 95% CI) | 0.62 [0.46, 0.84] |
| 7.3 Priapism | 1 | 111 | Risk Ratio (M‐H, Fixed, 95% CI) | 0.13 [0.02, 0.99] |
| 7.4 Avascular necrosis of the hip | 1 | 196 | Risk Ratio (M‐H, Fixed, 95% CI) | 0.16 [0.02, 1.33] |
| Outcome or subgroup title | No. of studies | No. of participants | Statistical method | Effect size |
| 1 Clinical stroke ‐ Secondary prevention Show forest plot | 1 | Risk Ratio (M‐H, Fixed, 95% CI) | Totals not selected | |
| 2 Mortality Show forest plot | 2 | Peto Odds Ratio (Peto, Fixed, 95% CI) | Totals not selected | |
| 2.1 Mortality ‐ Primary prevention | 1 | Peto Odds Ratio (Peto, Fixed, 95% CI) | 0.0 [0.0, 0.0] | |
| 2.2 Mortality ‐ Secondary prevention | 1 | Peto Odds Ratio (Peto, Fixed, 95% CI) | 0.0 [0.0, 0.0] | |
| 3 Transfusion‐related complications ‐ Serum ferritin; Primary prevention Show forest plot | 1 | Mean Difference (IV, Fixed, 95% CI) | Totals not selected | |
| 4 Transfusion related complications ‐ Liver iron concentration ‐ Primary prevention Show forest plot | 1 | Mean Difference (IV, Fixed, 95% CI) | Totals not selected | |
| 5 Other neurological event Show forest plot | 2 | Risk Ratio (M‐H, Fixed, 95% CI) | Totals not selected | |
| 5.1 TIA ‐ Primary prevention | 1 | Risk Ratio (M‐H, Fixed, 95% CI) | 0.0 [0.0, 0.0] | |
| 5.2 TIA ‐ Secondary prevention | 1 | Risk Ratio (M‐H, Fixed, 95% CI) | 0.0 [0.0, 0.0] | |
| 6 Other sickle cell related complications Show forest plot | 2 | Risk Ratio (M‐H, Random, 95% CI) | Totals not selected | |
| 6.1 Total SCD‐related SAEs ‐ Secondary prevention | 1 | Risk Ratio (M‐H, Random, 95% CI) | 0.0 [0.0, 0.0] | |
| 6.2 Acute chest syndrome ‐ Primary prevention | 1 | Risk Ratio (M‐H, Random, 95% CI) | 0.0 [0.0, 0.0] | |
| 6.3 Acute chest syndrome ‐ Secondary prevention | 1 | Risk Ratio (M‐H, Random, 95% CI) | 0.0 [0.0, 0.0] | |
| 6.4 Painful crisis ‐ Primary prevention | 1 | Risk Ratio (M‐H, Random, 95% CI) | 0.0 [0.0, 0.0] | |
| 6.5 Painful crisis ‐ Secondary prevention | 1 | Risk Ratio (M‐H, Random, 95% CI) | 0.0 [0.0, 0.0] | |
| 6.6 Infections and infestations SAEs ‐ Primary prevention | 1 | Risk Ratio (M‐H, Random, 95% CI) | 0.0 [0.0, 0.0] | |
| 6.7 Infections and infestations SAEs ‐ Secondary prevention | 1 | Risk Ratio (M‐H, Random, 95% CI) | 0.0 [0.0, 0.0] | |
| 7 Haemoglobin levels Show forest plot | 1 | Mean Difference (IV, Fixed, 95% CI) | Totals not selected | |
| 8 Haemoglobin S levels Show forest plot | 1 | Mean Difference (IV, Fixed, 95% CI) | Totals not selected | |