Transfusión de sangre para la prevención del accidente cerebrovascular primario y secundario en pacientes con anemia de células falciformes
Información
- DOI:
- https://doi.org/10.1002/14651858.CD003146.pub3Copiar DOI

- Base de datos:
-
- Cochrane Database of Systematic Reviews
- Versión publicada:
-
- 17 enero 2017see what's new
- Tipo:
-
- Intervention
- Etapa:
-
- Review
- Grupo Editorial Cochrane:
-
Grupo Cochrane de Fibrosis quística y enfermedades genéticas
- Copyright:
-
- Copyright © 2017 The Cochrane Collaboration. Published by John Wiley & Sons, Ltd.
Cifras del artículo
Altmetric:
Citado por:
Autores
Contributions of authors
The original review was conceived by the Cochrane Cystic Fibrosis and Genetic Disorders Group and designed by Dr Hirst (née Riddington).
In this most recent update all listed authors contributed to the review.
Lise Estcourt: searching; selection of trials; eligibility assessment; content expert, and review content update and development.
Patricia Fortin: searching; selection of trials; eligibility assessment; and review content update and development.
Sally Hopewell: methodological expert and review development.
Marialena Trivella: statistical and methodological expert and review development
Winfred Wang: protocol development, review development and content expert.
Sources of support
Internal sources
-
No sources of support supplied
External sources
-
National Institute for Health Research, UK.
This systematic review was supported by the National Institute for Health Research, via Cochrane Infrastructure funding to the Cochrane Cystic Fibrosis and Genetic Disorders Group.
Declarations of interest
Lise Estcourt: partly funded by the NIHR Cochrane Programme Grant ‐ Safe and Appropriate Use of Blood Components.
Patricia Fortin: funded by the NIHR Cochrane Programme Grant ‐ Safe and Appropriate Use of Blood Components.
Sally Hopewell: partly funded by the NIHR Cochrane Programme Grant ‐ Safe and Appropriate Use of Blood Components.
Marialena Trivella: partly funded by the NIHR Cochrane Programme Grant ‐ Safe and Appropriate Use of Blood Components.
Winfred Wang: was a PI on several of the included trials (STOP 1998; STOP 2 2005; SWiTCH 2012). He has been a consultant for: Celgene (at a one‐day meeting involving an anti‐sickling drug); and Baxter (at a one‐day meeting involving gene therapy for haemoglobinopathies). These consultancies did not involve treatment that would be used in the management of stroke in people with SCD.
Acknowledgements
We acknowledge the substantial contribution by Dr Ceri Hirst in undertaking the original version of this review (Hirst 2002), and Dr Kerry Kirkham (née Dwan) in the update of the review (Wang 2013).
We thank the editorial base of the Cochrane Cystic Fibrosis and Genetic Disorders Group for their help and support during the course of this review.
We thank NHS Blood and Transplant (NHSBT).
We thank the National Institute for Health Research (NIHR). This review is part of a series of reviews that have been partly funded by the NIHR Cochrane Programme Grant ‐ Safe and Appropriate Use of Blood Components. This research was also supported by the National Institute for Health Research (NIHR) Oxford Biomedical Research Centre Programme.The views expressed are those of the authors and not necessarily those of the NHS, the NIHR or the Department of Health.
Version history
| Published | Title | Stage | Authors | Version |
| 2020 Jul 27 | Blood transfusion for preventing primary and secondary stroke in people with sickle cell disease | Review | Lise J Estcourt, Ruchika Kohli, Sally Hopewell, Marialena Trivella, Winfred C Wang | |
| 2017 Jan 17 | Blood transfusion for preventing primary and secondary stroke in people with sickle cell disease | Review | Lise J Estcourt, Patricia M Fortin, Sally Hopewell, Marialena Trivella, Winfred C Wang | |
| 2013 Nov 14 | Blood transfusion for preventing primary and secondary stroke in people with sickle cell disease | Review | Winfred C Wang, Kerry Dwan | |
| 2002 Jan 21 | Blood transfusion for preventing stroke in people with sickle cell disease | Review | Ceri Hirst, Winfred C Wang | |
Differences between protocol and review
The title has been amended to include the terms 'primary and secondary'.
Excluded quasi‐randomised trials.
New subgroups TCD and silent cerebral infarcts.
Excluded outcome of SCI as it is being addressed within another review (Estcourt 2016).
Includes cluster‐randomised trials.
Included Summary of Findings tables.
Keywords
MeSH
Medical Subject Headings (MeSH) Keywords
- Anemia, Sickle Cell [blood, *complications];
- Antisickling Agents [adverse effects, therapeutic use];
- Blood Transfusion;
- Early Termination of Clinical Trials;
- *Erythrocyte Transfusion [adverse effects];
- Hemoglobin, Sickle;
- Hydroxyurea [adverse effects, therapeutic use];
- Iron Chelating Agents [therapeutic use];
- Phlebotomy [adverse effects];
- *Primary Prevention;
- *Secondary Prevention;
- Stroke [etiology, *prevention & control];
Medical Subject Headings Check Words
Adolescent; Child; Child, Preschool; Humans; Young Adult;
PICO

Study flow diagram.

Risk of bias graph: review authors' judgements about each risk of bias item presented as percentages across all included studies.

Risk of bias summary: review authors' judgements about each risk of bias item for each included study.
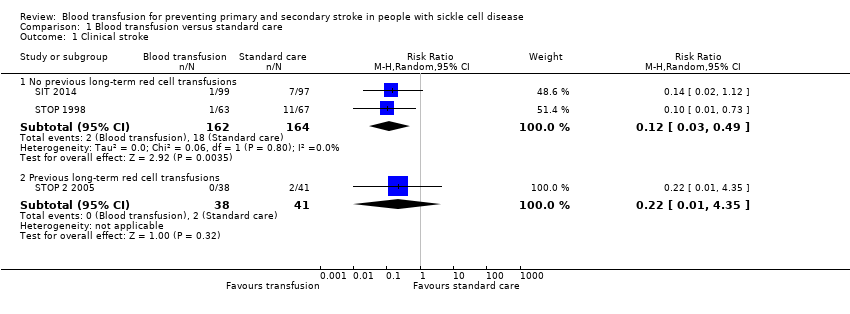
Comparison 1 Blood transfusion versus standard care, Outcome 1 Clinical stroke.
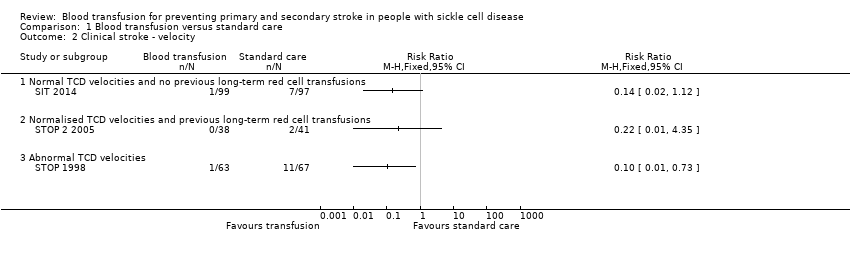
Comparison 1 Blood transfusion versus standard care, Outcome 2 Clinical stroke ‐ velocity.

Comparison 1 Blood transfusion versus standard care, Outcome 3 Clinical stroke ‐ SCI.

Comparison 1 Blood transfusion versus standard care, Outcome 4 Mortality.
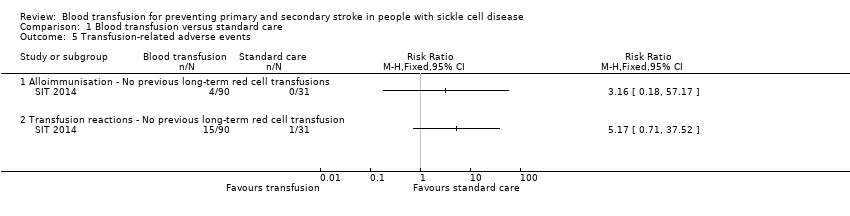
Comparison 1 Blood transfusion versus standard care, Outcome 5 Transfusion‐related adverse events.

Comparison 1 Blood transfusion versus standard care, Outcome 6 TIA.
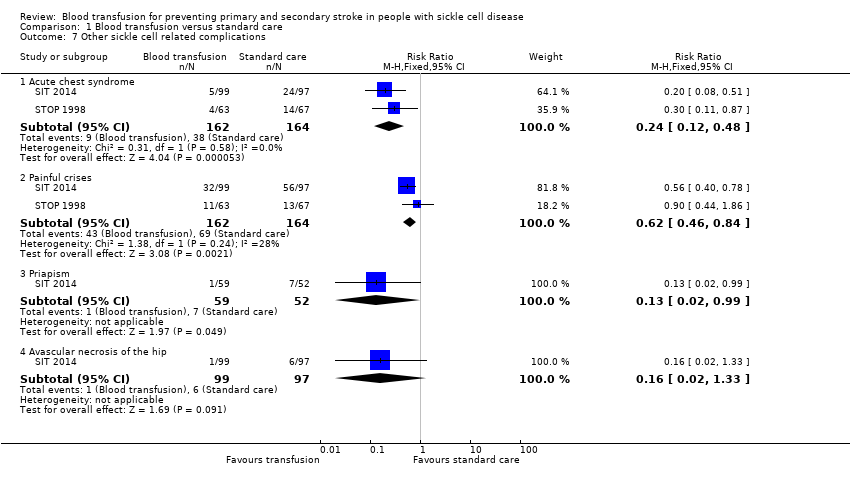
Comparison 1 Blood transfusion versus standard care, Outcome 7 Other sickle cell related complications.

Comparison 2 Hydroxyurea and phlebotomy versus standard treatment (transfusions/chelation), Outcome 1 Clinical stroke ‐ Secondary prevention.

Comparison 2 Hydroxyurea and phlebotomy versus standard treatment (transfusions/chelation), Outcome 2 Mortality.

Comparison 2 Hydroxyurea and phlebotomy versus standard treatment (transfusions/chelation), Outcome 3 Transfusion‐related complications ‐ Serum ferritin; Primary prevention.

Comparison 2 Hydroxyurea and phlebotomy versus standard treatment (transfusions/chelation), Outcome 4 Transfusion related complications ‐ Liver iron concentration ‐ Primary prevention.
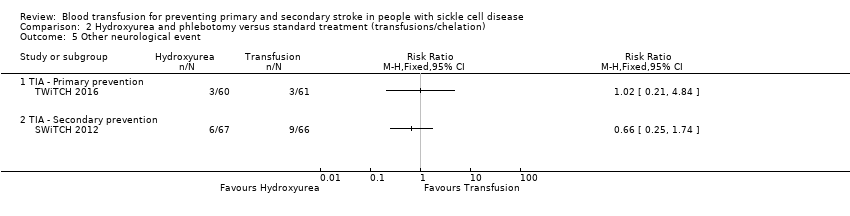
Comparison 2 Hydroxyurea and phlebotomy versus standard treatment (transfusions/chelation), Outcome 5 Other neurological event.

Comparison 2 Hydroxyurea and phlebotomy versus standard treatment (transfusions/chelation), Outcome 6 Other sickle cell related complications.

Comparison 2 Hydroxyurea and phlebotomy versus standard treatment (transfusions/chelation), Outcome 7 Haemoglobin levels.

Comparison 2 Hydroxyurea and phlebotomy versus standard treatment (transfusions/chelation), Outcome 8 Haemoglobin S levels.
| Primary prevention | ||||||
| Patient or population: individuals with sickle cell disease who are at risk of a primary stroke who have not had previous long‐term red cell transfusions | ||||||
| Outcomes | Anticipated absolute effects* (95% CI) | Relative effect | № of participants | Quality of the evidence | Comments | |
| Risk with standard care | Risk with Blood transfusion | |||||
| Clinical stroke | Trial population | RR 0.12 | 326 | ⊕⊕⊕⊝ | ||
| 110 per 1000 | 13 per 1000 (3 to 54) | |||||
| All‐cause mortality | No deaths occurred in either trial arm | ‐ | 326 | ⊕⊝⊝⊝ | ||
| Adverse events associated with transfusion | Moderatea | RR 3.16 | 121 | ⊕⊝⊝⊝ | ||
| 10 per 1000 | 32 per 1000 (2 to 572) | |||||
| TIA | Trial population | Peto OR 0.13 (0.01 to 2.11) | 323 (2 RCTs) | ⊕⊝⊝⊝ | ||
| 21 per 1000 | 5 per 1000 (0 to 43) | |||||
| Serious adverse events as a result of sickle cell‐related complications | Trial population | RR 0.24 | 326 | ⊕⊕⊝⊝ | ||
| 232 per 1,000 | 56 per 1000 (28 to 111) | |||||
| Moderate | ||||||
| 230 per 1000 | 55 per 1000 (28 to 110) | |||||
| Measures of neurological impairment assessed with: WASI IQ score | Least square mean 1.7 (SE 95% CI ‐1.1 to 4.4) | ‐ | 166 (1 RCT) | ⊕⊕⊝⊝ | Author reported data from SIT 2014 | |
| Quality of life assessed with: Child Health Questionnaire Parent Form 50 | Difference estimate ‐0.54 (‐0.92 to ‐0.17) | ‐ | 196 (1 RCT) | ⊕⊕⊝⊝ | Author reported data from SIT 2014 | |
| *The risk in the intervention group (and its 95% confidence interval) is based on the assumed risk in the comparison group and the relative effect of the intervention (and its 95% CI). | ||||||
| GRADE Working Group grades of evidence | ||||||
| 1 We downgraded the quality of evidence by 1 due to imprecision. Rare event. No deaths occurred. 2 We downgraded the quality of the evidence by 1 due to risk of bias. Unblinded trial and cross‐overs, and imbalance between loss to follow‐up between trial arms 3 We downgraded the quality of the evidence by 1 due to indirectness. Only children with HbSS or HbSβº thalassaemia included in trials 4 We downgraded the quality of evidence by 2 due to imprecision. The estimate has very wide CIs a Based on Chou 2013 | ||||||
| Primary prevention | ||||||
| Patient or population: individuals with sickle cell disease who are at risk of a primary stroke who have had long‐term red cell transfusions to prevent a stroke | ||||||
| Outcomes | Anticipated absolute effects* (95% CI) | Relative effect | № of participants | Quality of the evidence | Comments | |
| Risk with standard care | Risk with blood transfusion | |||||
| Clinical stroke | Trial population | RR 0.22 (0.01 to 4.35) | 79 | ⊕⊝⊝⊝ | ||
| 49 per 1000 | 11 per 1000 (0 to 212) | |||||
| All‐cause mortality | Moderatea | Peto OR 8.00 (0.16 to 404.12) | 79 | ⊕⊝⊝⊝ | ||
| 10 per 1000 | 75 per 1000 (2 to 803) | |||||
| Adverse events associated with transfusion | See comment | 79 (1 RCT) | ‐ | No comparative numbers reported | ||
| TIA | See comment | 79 (1 RCT) | ‐ | No comparative numbers reported | ||
| Serious adverse events as a result of sickle cell‐related complications assessed with: ACS | See comment | 79 (1 RCT) | ‐ | No comparative numbers reported | ||
| Measures of neurological impairment ‐ not reported | Outcome not reported | ‐ | ‐ | ‐ | ||
| Quality of life ‐ not reported | Outcome not reported | ‐ | ‐ | ‐ | ‐ | |
| *The risk in the intervention group (and its 95% confidence interval) is based on the assumed risk in the comparison group and the relative effect of the intervention (and its 95% CI). | ||||||
| GRADE Working Group grades of evidence | ||||||
| 1 We did not downgrade the evidence due to risk of bias because the evidence was already very low grade evidence. There was attrition bias. Imbalance between loss to follow‐up between trial arms 2 We downgraded the quality of the evidence by 1 due to indirectness. Only children with HbSS or HbSβº thalassaemia included in trials 3 We downgraded the quality of evidence by 2 due to imprecision. The estimate has very wide CIs a Assuming a mortality rate of 1% | ||||||
| Primary prevention | ||||||
| Patient or population: individuals with sickle cell disease who are at risk of a primary stroke who have had long‐term red cell transfusions to prevent a stroke | ||||||
| Outcomes | Anticipated absolute effects* (95% CI) | Relative effect | № of participants | Quality of the evidence | Comments | |
| Risk with hydroxyurea and phlebotomy | Risk with Blood transfusion | |||||
| Clinical stroke | No strokes occurred in either trial arm | ‐ | 121 (1 RCT) | ⊕⊝⊝⊝ | ||
| All‐cause mortality | No deaths occurred in either trial arm | ‐ | 121 (1 RCT) | ⊕⊝⊝⊝ | ||
| Adverse events associated with transfusion | The mean liver iron concentration was 9.5 mg Fe/g dry weight | MD 1.8 mg Fe/g dry weight lower (5.16 lower to 1.56 higher) | ‐ | 121 (1 RCT) | ⊕⊕⊝⊝ | Switching to hydroxyurea and phlebotomy may reduce serum ferritin levels compared to continuing to receive red cell transfusions and chelation (MD) ‐1398 μg/L, 95% CI ‐1929 to ‐867; one trial, 121 participants) |
| Incidence of TIA | 49 per 1000 | 50 per 1,000 (10 to 238) | RR 1.02 (0.21 to 4.84) | 121 (1 RCT) | ⊕⊝⊝⊝ | |
| Serious adverse events as a result of sickle cell‐related complications | Trial population | RR 2.03 (0.39 to 10.69) | 121 (1 RCT) | ⊕⊝⊝⊝ | ||
| 33 per 1000 | 67 per 1,000 (13 to 350) | |||||
| Measures of neurological impairment ‐ not reported | Outcome not reported | ‐ | ‐ | ‐ | ‐ | |
| Quality of life ‐ not reported | Outcome not reported | ‐ | ‐ | ‐ | ‐ | |
| *The risk in the intervention group (and its 95% confidence interval) is based on the assumed risk in the comparison group and the relative effect of the intervention (and its 95% CI). | ||||||
| GRADE Working Group grades of evidence | ||||||
| 1 We downgraded the quality of the evidence by 2 due to imprecision. Rare event. No deaths or stroke occurred. 2 We downgraded the quality of the evidence by 1 due to indirectness. Only children with HbSS or HbSβº thalassaemia included in trials 3 We downgraded the quality of the evidence by 1 due to risk of bias.Trial was not blinded and stopped early 4 We downgraded the quality of the evidence by 1 due to imprecision. The estimate has very wide CIs | ||||||
| Secondary prevention | ||||||
| Patient or population: individuals with sickle cell disease who have had a stroke who have had long‐term red cell transfusions to prevent another stroke | ||||||
| Outcomes | Anticipated absolute effects* (95% CI) | Relative effect | № of participants | Quality of the evidence | Comments | |
| Risk with hydroxyurea and phlebotomy | Risk with Blood transfusion | |||||
| Clinical stroke | Trial population | RR 14.78 | 133 (1 RCT) | ⊕⊝⊝⊝ | ||
| 0 per 1000 | 0 per 1000 (0 to 0) | |||||
| All‐cause mortality | 15 per 1000 | 15 per 1000 (1 to 198) | Peto OR 0.98 (0.06 to 15.92) | 133 (1 RCT) | ⊕⊝⊝⊝ | |
| Transfusion‐related adverse events ‐ assessed with liver iron concentration mg Fe/g dry weight liver | Hydroxyurea arm: median 17.2 mg IQR 10.0 to 30.6 Transfusion arm: median 17.3 mg IQR 8.8 to 30.7 | 56 (1 RCT) | ⊕⊕⊝⊝ | P = 0.7920a Switching to hydroxyurea and phlebotomy may reduce serum ferritin levels compared to continuing to receive red cell transfusions and chelation 1994 μg/L, interquartile range (IQR) 998 to 3475, in the hydroxyurea arm and 4064 μg/L, IQR 2330 to 7126, in the transfusion arm; one trial, 133 participants; P < 0.001 a | ||
| Incidence of TIA | Trial population | RR 0.66 | 133 (1 RCT) | ⊕⊝⊝⊝ | ||
| 136 per 1000 | 90 per 1000 (34 to 237) | |||||
| Serious adverse events as a result of sickle cell‐related complications | Trial population | RR 0.33 (0.04 to 3.08) | 133 (1 RCT) | ⊕⊝⊝⊝ | ||
| 45 per 1000 | 15 per 1000 (2 to 140) | |||||
| Measures of neurological impairment ‐ not reported | Outcome not reported | ‐ | ‐ | ‐ | ||
| Quality of life ‐ not reported | Outcome not reported | ‐ | ‐ | ‐ | ||
| *The risk in the intervention group (and its 95% confidence interval) is based on the assumed risk in the comparison group and the relative effect of the intervention (and its 95% CI). | ||||||
| GRADE Working Group grades of evidence | ||||||
| 1 We downgraded the quality of the evidence by 1 due to risk of bias. Trial was not blinded and stopped early 2 We downgraded the quality of the evidence by 1 due to indirectness. Only children with HbSS or HbSβº thalassaemia included in trials 3 We downgraded the quality of the evidence by 1 due to imprecision. The estimate has very wide CIs a Analysis performed by the trial authors | ||||||
| Outcomes | Trials | Number of participants with at least one event | Adverse events/100 person‐years | Incidence rate ratioc (95% CI) | ||
| Transfusion | Standard | Transfusion | Standard | |||
| Transfusion reactions | 15 out of 90a | 1 out of 31b | 8.85 | 1.66 | 5.33 (1.67 to 23.52) | |
| Ferritin > 1500 μg/L | 76 out of 90a | 3 out of 31b | 534.70 | 37.07 | 14.42 (5.41 to 85.17) | |
| aNine participants who declined transfusion were excluded from the analysis. Abbreviations: CI: confidence interval | ||||||
| Outcomes | Trials | Number of participants with at least one event | Adverse events/100 person‐years | Incidence rate ratioa (95% CI) | ||
| Transfusion | Standard | Transfusion | Standard | |||
| Acute chest syndrome | 4 out of 63 | 14 out of 67 | 4.8b | 15.3b | ‐ | |
| 5 out of 99 | 24 out of 97 | 1.81b | 14.35b | 0.41 (0.20 to 0.75) | ||
| Painful crisis | 11 out of 63 | 13 out of 67 | 16.2 | 27.6 | ‐ | |
| 32 out of 99 | 56 out of 97 | 41.58 | 102.21 | 0.13 (0.04 to 0.28) | ||
| Priapism | 1 out of 59 | 7 out of 52 | 0.84 | 6.65 | 0.13 (0.03 to 0.55) | |
| Symptomatic avascular necrosis of the hip | 1 out of 99 | 6 out of 97 | 0.4 | 2.25 | 0.22 (0.05 to 0.85) | |
| a The incidence ratio was calculated as the rate of adverse events per 100 person‐years in the transfusion group divided by the rate of adverse events per 100 person‐years in the observation group. The 95% confidence intervals were calculated with the use of the bootstrap method with 10,000 replications. b One child from the standard care group was excluded from these analyses due to a stroke on day 16 of the trial. Abbreviation: CI: confidence interval | ||||||
| Trial | Intervention | Baseline | 6 to 12 months | 12 to 18 months | 18 to 24 months | ||||
| Hb (g/L) | Hb S (%) | Hb (g/L) | Hb S (%) | Hb (g/L) | Hb S (%) | Hb (g/L) | Hb S (%) | ||
| No previous long‐term transfusions | |||||||||
| Transfusion | Median 77 IQR (72 to 84) | Median 85 90% CI (51 to 95) | ‐ | Median 30 90% CI (17 to 43) | ‐ | Median 29 90% CI (16 to 43) | ‐ | Median 30 90% CI (16 to 43) | |
| Standard | Median 79 IQR (74 to 89) | ‐ | ‐ | ‐ | ‐ | ‐ | ‐ | ‐ | |
| Transfusion | Mean (SD) 72 (8) | Mean (SD) 87 (10) | ‐ | ‐ | ‐ | ‐ | ‐ | ‐ | |
| Standard | Mean (SD) 76 (7) | Mean (SD) 87 (7) | ‐ | ‐ | ‐ | ‐ | ‐ | ‐ | |
| Previous long‐term transfusions | |||||||||
| Transfusion | Mean (SD) 93 (9) | Mean (SD) 21 (8.6) | Mean (SD) 94 (9) | Mean (SD) 25.4 (10.9) | ‐ | ‐ | ‐ | ‐ | |
| Standard | Mean (SD) 98 (12) | Mean (SD) 19 (11) | Mean (SD) 77 (8) | Mean (SD) 81.0 (8.6) | ‐ | ‐ | ‐ | ‐ | |
| Abbreviations: CI: confidence interval; IQR: interquartile range; SD: standard deviation | |||||||||
| Trial | Number of transfusions | Number of HbS levels measured | HbS less than 30% | HbS 30 to 40% | HbS greater than 40% |
| No previous long‐term transfusions | |||||
| 1521 | ‐ | ‐ | 101 | 42 | |
| Previous long‐term transfusions | |||||
| 1070 | 988 | 748 (76%) | 192 (19%) | 48 (5%) | |
| Outcome or subgroup title | No. of studies | No. of participants | Statistical method | Effect size |
| 1 Clinical stroke Show forest plot | 3 | Risk Ratio (M‐H, Random, 95% CI) | Subtotals only | |
| 1.1 No previous long‐term red cell transfusions | 2 | 326 | Risk Ratio (M‐H, Random, 95% CI) | 0.12 [0.03, 0.49] |
| 1.2 Previous long‐term red cell transfusions | 1 | 79 | Risk Ratio (M‐H, Random, 95% CI) | 0.22 [0.01, 4.35] |
| 2 Clinical stroke ‐ velocity Show forest plot | 3 | Risk Ratio (M‐H, Fixed, 95% CI) | Totals not selected | |
| 2.1 Normal TCD velocities and no previous long‐term red cell transfusions | 1 | Risk Ratio (M‐H, Fixed, 95% CI) | 0.0 [0.0, 0.0] | |
| 2.2 Normalised TCD velocities and previous long‐term red cell transfusions | 1 | Risk Ratio (M‐H, Fixed, 95% CI) | 0.0 [0.0, 0.0] | |
| 2.3 Abnormal TCD velocities | 1 | Risk Ratio (M‐H, Fixed, 95% CI) | 0.0 [0.0, 0.0] | |
| 3 Clinical stroke ‐ SCI Show forest plot | 2 | Risk Ratio (M‐H, Fixed, 95% CI) | Subtotals only | |
| 3.1 Presence of previous SCI on MRI | 2 | 243 | Risk Ratio (M‐H, Fixed, 95% CI) | 0.11 [0.02, 0.59] |
| 3.2 Absence of previous SCI on MRI | 1 | 79 | Risk Ratio (M‐H, Fixed, 95% CI) | 0.27 [0.03, 2.31] |
| 4 Mortality Show forest plot | 1 | Peto Odds Ratio (Peto, Fixed, 95% CI) | Totals not selected | |
| 5 Transfusion‐related adverse events Show forest plot | 1 | Risk Ratio (M‐H, Fixed, 95% CI) | Totals not selected | |
| 5.1 Alloimmunisation ‐ No previous long‐term red cell transfusions | 1 | Risk Ratio (M‐H, Fixed, 95% CI) | 0.0 [0.0, 0.0] | |
| 5.2 Transfusion reactions ‐ No previous long‐term red cell transfusion | 1 | Risk Ratio (M‐H, Fixed, 95% CI) | 0.0 [0.0, 0.0] | |
| 6 TIA Show forest plot | 2 | Peto Odds Ratio (Peto, Fixed, 95% CI) | Subtotals only | |
| 6.1 No previous long‐term red cell transfusions | 2 | 323 | Peto Odds Ratio (Peto, Fixed, 95% CI) | 0.13 [0.01, 2.11] |
| 7 Other sickle cell related complications Show forest plot | 2 | Risk Ratio (M‐H, Fixed, 95% CI) | Subtotals only | |
| 7.1 Acute chest syndrome | 2 | 326 | Risk Ratio (M‐H, Fixed, 95% CI) | 0.24 [0.12, 0.48] |
| 7.2 Painful crises | 2 | 326 | Risk Ratio (M‐H, Fixed, 95% CI) | 0.62 [0.46, 0.84] |
| 7.3 Priapism | 1 | 111 | Risk Ratio (M‐H, Fixed, 95% CI) | 0.13 [0.02, 0.99] |
| 7.4 Avascular necrosis of the hip | 1 | 196 | Risk Ratio (M‐H, Fixed, 95% CI) | 0.16 [0.02, 1.33] |
| Outcome or subgroup title | No. of studies | No. of participants | Statistical method | Effect size |
| 1 Clinical stroke ‐ Secondary prevention Show forest plot | 1 | Risk Ratio (M‐H, Fixed, 95% CI) | Totals not selected | |
| 2 Mortality Show forest plot | 2 | Peto Odds Ratio (Peto, Fixed, 95% CI) | Totals not selected | |
| 2.1 Mortality ‐ Primary prevention | 1 | Peto Odds Ratio (Peto, Fixed, 95% CI) | 0.0 [0.0, 0.0] | |
| 2.2 Mortality ‐ Secondary prevention | 1 | Peto Odds Ratio (Peto, Fixed, 95% CI) | 0.0 [0.0, 0.0] | |
| 3 Transfusion‐related complications ‐ Serum ferritin; Primary prevention Show forest plot | 1 | Mean Difference (IV, Fixed, 95% CI) | Totals not selected | |
| 4 Transfusion related complications ‐ Liver iron concentration ‐ Primary prevention Show forest plot | 1 | Mean Difference (IV, Fixed, 95% CI) | Totals not selected | |
| 5 Other neurological event Show forest plot | 2 | Risk Ratio (M‐H, Fixed, 95% CI) | Totals not selected | |
| 5.1 TIA ‐ Primary prevention | 1 | Risk Ratio (M‐H, Fixed, 95% CI) | 0.0 [0.0, 0.0] | |
| 5.2 TIA ‐ Secondary prevention | 1 | Risk Ratio (M‐H, Fixed, 95% CI) | 0.0 [0.0, 0.0] | |
| 6 Other sickle cell related complications Show forest plot | 2 | Risk Ratio (M‐H, Random, 95% CI) | Totals not selected | |
| 6.1 Total SCD‐related SAEs ‐ Secondary prevention | 1 | Risk Ratio (M‐H, Random, 95% CI) | 0.0 [0.0, 0.0] | |
| 6.2 Acute chest syndrome ‐ Primary prevention | 1 | Risk Ratio (M‐H, Random, 95% CI) | 0.0 [0.0, 0.0] | |
| 6.3 Acute chest syndrome ‐ Secondary prevention | 1 | Risk Ratio (M‐H, Random, 95% CI) | 0.0 [0.0, 0.0] | |
| 6.4 Painful crisis ‐ Primary prevention | 1 | Risk Ratio (M‐H, Random, 95% CI) | 0.0 [0.0, 0.0] | |
| 6.5 Painful crisis ‐ Secondary prevention | 1 | Risk Ratio (M‐H, Random, 95% CI) | 0.0 [0.0, 0.0] | |
| 6.6 Infections and infestations SAEs ‐ Primary prevention | 1 | Risk Ratio (M‐H, Random, 95% CI) | 0.0 [0.0, 0.0] | |
| 6.7 Infections and infestations SAEs ‐ Secondary prevention | 1 | Risk Ratio (M‐H, Random, 95% CI) | 0.0 [0.0, 0.0] | |
| 7 Haemoglobin levels Show forest plot | 1 | Mean Difference (IV, Fixed, 95% CI) | Totals not selected | |
| 8 Haemoglobin S levels Show forest plot | 1 | Mean Difference (IV, Fixed, 95% CI) | Totals not selected | |