Quimioterapia en dosis elevadas y trasplante de médula ósea o células tronco autólogas versus quimioterapia convencional para las mujeres con cáncer de mama de mal pronóstico temprano
Información
- DOI:
- https://doi.org/10.1002/14651858.CD003139.pub3Copiar DOI

- Base de datos:
-
- Cochrane Database of Systematic Reviews
- Versión publicada:
-
- 20 mayo 2016see what's new
- Tipo:
-
- Intervention
- Etapa:
-
- Review
- Grupo Editorial Cochrane:
-
Grupo Cochrane de Cáncer de mama
- Copyright:
-
- Copyright © 2016 The Cochrane Collaboration. Published by John Wiley & Sons, Ltd.
Cifras del artículo
Altmetric:
Citado por:
Autores
Contributions of authors
For the 2016 update of this review, Jane Marjoribanks, Maimoona Azhar and Anne Lethaby conducted the search, selected the studies, extracted the data and/or updated the text. CIndy Farquhar checked the study selection and commented on drafts.
For previous versions of the review: Cindy Farquhar drafted the protocol, searched for and selected the studies, extracted the data and wrote the text of the review. Jane Marjoribanks selected the studies, extracted the data, entered the data, completed the included and excluded studies table, assisted with the writing of the document. Russell Basser edited the protocol, selected the studies, extracted the data and commented on the draft on several occasions, particularly providing content advice. Anne Lethaby commented on the draft of the protocol, provided statistical advice and commented on the draft on several occasions. Jane Marjoribanks updated the review.
Sources of support
Internal sources
-
University of Auckland, New Zealand.
External sources
-
RAND Corporation, Santa Monica, California (Supported by the Robert Wood Johnson Foundation Grant #044128), USA.
Declarations of interest
Cindy Farquhar: No conflict of interest
Jane Marjoribanks: No conflict of interest
Anne Lethaby: No conflict of interest
Maimoona Azhar: No conflict of interest
Acknowledgements
We would like to acknowledge Dr Russell Basser for his contribution as an author in pre‐2016 versions of this review.
For the 2016 update of this review, we would like to thank the staff of the Editorial Office of the Cochrane Breast Cancer Group, especially Melina Willson and Slavica Berber.
The following individuals have provided help and advice with previous versions of this review: Dr Mark Jefferies, Oncology Department, Christchurch Hospital, Christchurch, New Zealand, and members of the Cochrane Menstrual Disorders and Subfertility Group (now the Gynaecology and Fertility Group).
We also thank the study investigators who provided additional information and were generally helpful.
Version history
| Published | Title | Stage | Authors | Version |
| 2016 May 20 | High‐dose chemotherapy and autologous bone marrow or stem cell transplantation versus conventional chemotherapy for women with early poor prognosis breast cancer | Review | Cindy Farquhar, Jane Marjoribanks, Anne Lethaby, Maimoona Azhar | |
| 2005 Jul 20 | High dose chemotherapy and autologous bone marrow or stem cell transplantation versus conventional chemotherapy for women with early poor prognosis breast cancer | Review | Cindy Farquhar, Jane Marjoribanks, Russell Basser, Anne Lethaby | |
| 2003 Jan 20 | High dose chemotherapy and autologous bone marrow or stem cell transplantation versus conventional chemotherapy for women with early poor prognosis breast cancer | Review | Cindy M Farquhar, Russell Basser, Jane Marjoribanks, Anne E Lethaby | |
Differences between protocol and review
For the 2016 update of the review we made the following changes:
-
Differentiated the outcomes as primary and secondary
-
Undertook 'Risk of bias' assessment with the Cochrane 'Risk of bias' tool
-
Added formal assessment of publication bias (by means of a funnel plot)
-
Utilised GRADE methods to assess and summarise the quality of the evidence
-
Edited the text to clarify that we conducted a post hoc sensitivity analysis by number of lymph nodes.
The rationale for the changes was to conform to current Cochrane methodological standards and in accordance with the advice of the statistician who peer‐reviewed the 2016 update.
For the 2007 update of the review, we made the following change:
-
Tables of comparisons edited to include each study at only one point of follow‐up for each outcome. For each study we chose the follow‐up time with the most mature data, with preference given to published data.
Keywords
MeSH
Medical Subject Headings (MeSH) Keywords
- *Bone Marrow Transplantation;
- *Stem Cell Transplantation;
- Antineoplastic Agents [*administration & dosage, adverse effects];
- Antineoplastic Combined Chemotherapy Protocols [*administration & dosage, adverse effects];
- Breast Neoplasms [*drug therapy, mortality, *surgery];
- Combined Modality Therapy [methods];
- Prognosis;
- Randomized Controlled Trials as Topic;
- Salvage Therapy;
- Survival Rate;
- Time Factors;
- Transplantation, Autologous;
Medical Subject Headings Check Words
Female; Humans;
PICO
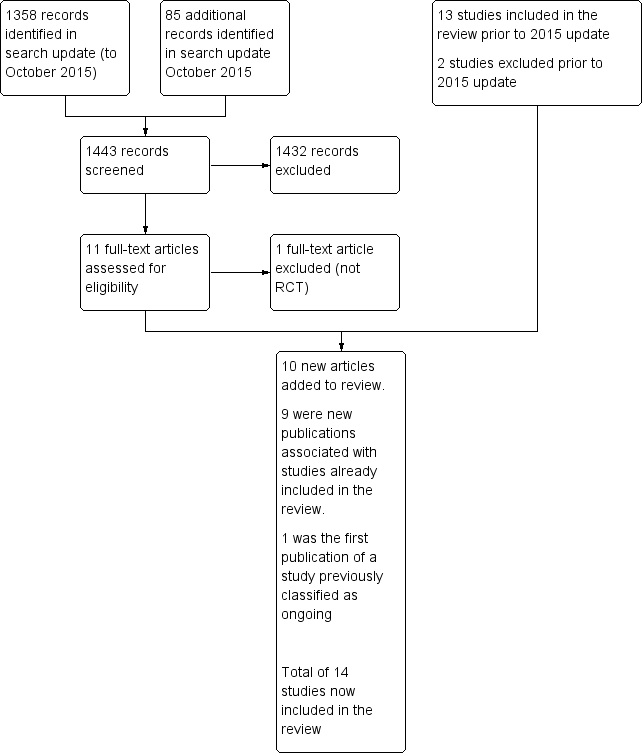
Study flow diagram.

Risk of bias graph: review authors' judgements about each risk of bias item presented as percentages across all included studies.
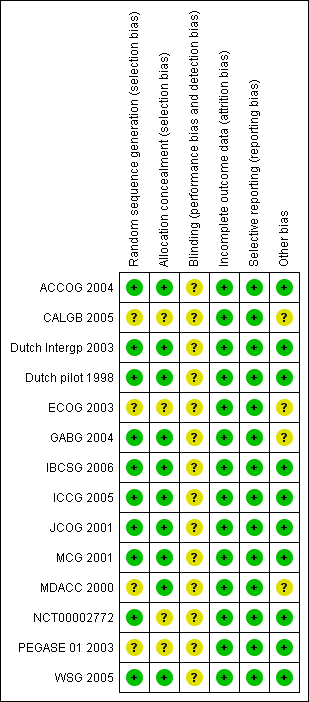
Risk of bias summary: review authors' judgements about each risk of bias item for each included study.

Forest plot of comparison: 1 High‐dose chemotherapy versus standard chemotherapy, outcome: 1.1 Overall survival.

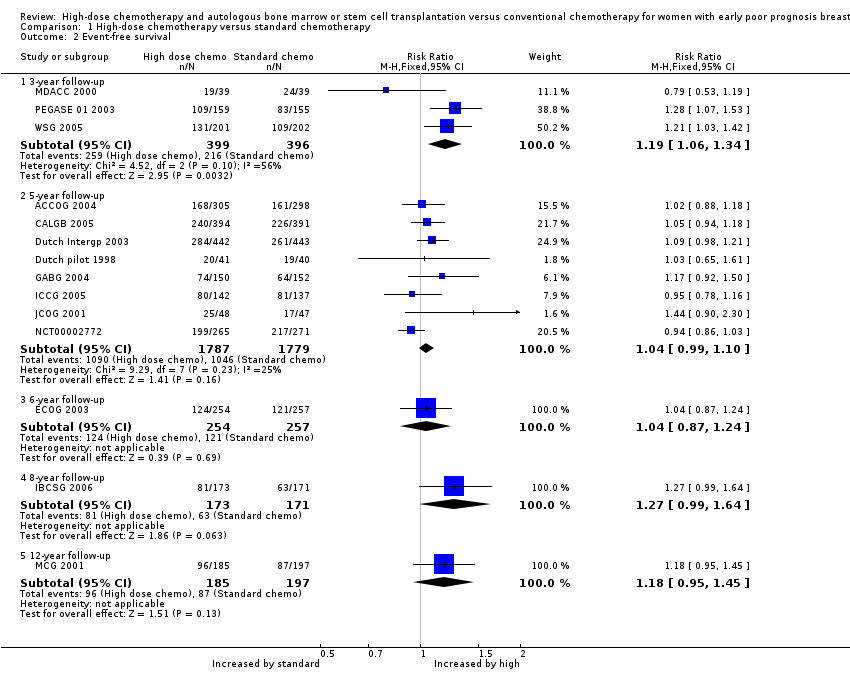
Forest plot of comparison: 1 High‐dose chemotherapy versus standard chemotherapy, outcome: 1.2 Event‐free survival.

Funnel plot of comparison: 1 High‐dose chemotherapy versus standard chemotherapy, outcome: 1.3 Treatment‐related mortality.

Comparison 1 High‐dose chemotherapy versus standard chemotherapy, Outcome 1 Overall survival.
Comparison 1 High‐dose chemotherapy versus standard chemotherapy, Outcome 2 Event‐free survival.

Comparison 1 High‐dose chemotherapy versus standard chemotherapy, Outcome 3 Treatment‐related mortality.

Comparison 1 High‐dose chemotherapy versus standard chemotherapy, Outcome 4 Second cancers.
| High‐dose chemotherapy versus chemotherapy without bone marrow transplant or stem cell rescue | ||||||
| Population: women with early poor prognosis breast cancer | ||||||
| Outcomes | Anticipated absolute effects* (95% CI) | Relative effect | № of participants | Quality of the evidence | Comments | |
| Risk with standard chemotherapy | Risk with high dose chemotherapy | |||||
| Overall survival at 5‐year follow‐up | 672 per 1000 | 672 per 1000 | RR 1.00 | 3566 (8 RCTs) | ⨁⨁⨁⨁ | |
| Event‐free survival at 5‐year follow‐up | 578 per 1000 | 601 per 1000 | RR 1.04 | 3566 | ⨁⨁⨁⨁ | |
| Treatment‐related mortality | 2 per 1000 | 14 per 1000 | RR 7.97 | 5600 | ⨁⨁⨁⨁ | Most deaths occurred within the first year of treatment |
| Second cancers at 4 ‐ 9‐year median follow‐up | 25 per 1000 | 31 per 1000 | RR 1.25 | 3423 | ⨁⨁⨁⨁ | |
| *The risk in the intervention group (and its 95% confidence interval) is based on the median risk in the comparison group and the relative effect of the intervention (and its 95% CI) | ||||||
| GRADE Working Group grades of evidence | ||||||
| Study ID | Median Age | Tumour | Median nodes positive | Minimum nodes positive | > 9 nodes | Oestro positive | Progest. positive | Other | Premenop'sal |
| 45 | 3 cm max. | 9 | 4 | 45% | 31% (ER or PR +ve) | 31% (ER or PR +ve) | 43% receptor unknown | ‐ | |
| 45 | 3 cm median | 14 (range 10 ‐ 52) | 10 | 100% | 69% | ‐ | ‐ | ‐ | |
| 45 | T1 5%; T2 30%; T3 45%; T4 10%; Tx 10% | ‐ | N/A: Had pre‐op chemo | N/A | 20% | 25% | 54% receptor unknown | 83% | |
| 45.7 | T1 22%; T2 60%; T3 16% | ‐ | 4 | 35.8% | 65% | 53% | 28% oestrogen receptor negative | ‐ | |
| 44 | ‐ | ‐ | 10 | ‐ | 60% | 59% | 46% > 14 +ve nodes | 72% | |
| ‐ | ‐ | ‐ | 10 | 100% | 60% | 40% | ‐ | 58% | |
| 46 | T1 26%; T2 51%; T3 20% | 13 | 5 ‐ 10 depending on other prognostic factors | 73% | ‐ | ‐ | 40% oestrogen & progesterone receptor ‐ve | 67% | |
| 47 (range 24 ‐ 60) | T1 28%; T2 54%; T3 14%; unknown 4% | 9 (range 4 ‐ 36) | 4 | 45% | 43% | 25% | 38% receptor status not known | 70% | |
| 46 | ‐ | 16 (range 10 ‐ 49) | 10 | 100% | ‐ | ‐ | ‐ | 74% | |
| 45 | ‐ | ‐ | 10 at diagnosis or 4 after initial chemo | > 60% | 50% | 45% | 5% receptor unknown | 68% | |
| ‐ | ‐ | ‐ | 4 | 62% | ‐ | ‐ | ‐ | ‐ | |
| 46 (mean) | ‐ | 13 | 8 | ? | 31% | ‐ | ‐ | 68% | |
| Not stated. 45% were aged 40 ‐ 49 yrs | 20% had T3 tumour | 8% were N2 | ‐ | ‐ | ‐ | ‐ | 66% ER/PgR +ve; 8% receptor unknown | ‐ | |
| 47 | Mean size 3.3 ‐ 3.5 cm | 17 ‐ 18 | 10 | 100% | 63% | ‐ | ‐ | 53% | |
| +ve = positive | |||||||||
| Stage | What stage means |
| I | Breast tumour 2 cm or less in diameter and does not appear to have spread beyond the breast |
| IIA | Breast tumour over 2 cm in diameter OR has spread to the axillary (underarm) lymph nodes on the same side as the breast cancer. The nodes are not stuck to one another or to the surrounding tissues |
| IIB | Breast tumour over 2 cm in diameter AND has spread to the axillary nodes on the same side as the breast cancer. The nodes are not stuck together or to the surrounding tissues. OR the tumour is larger than 5 cm in diameter (and nodes are clear) |
| IIIA | Breast tumour over 5 cms in diameter AND has spread to the axillary lymph nodes on the same side OR tumour has spread to the lymph nodes on the same side as the breast cancer and the nodes are stuck to each other or to the surrounding tissues |
| IIIB | Breast tumour has spread to chest wall or skin OR tumour has spread to internal mammary lymph nodes on the same side as breast tumour |
| IV | Tumour has spread from breast to distant sites or to supraclavicular (above collarbone) lymph nodes |
| Study | Phase 1 | Phase 2 |
| doxorubicin 75 mg | cyclophosphamide | |
| cyclophosphamide 600 mg | cyclophosphamide 900 mg | |
| cyclophosphamide 500 mg | ‐ | |
| cyclophosphamide 500 mg | ‐ | |
| cyclophosphamide 1400 mg (po) | ‐ | |
| cyclophosphamide 600 mg | cyclophosphamide 1 gm | |
| doxorubicin 60mg or epirubicin 90 mg | cyclophosphamide 1400 mg (po) | |
| cyclophosphamide 600 mg | cyclophosphamide 1200 mg | |
| cyclophosphamide 500 mg | ‐ | |
| epirubicin 120 mg 3 cycles | cyclophosphamide 600 mg | |
| cyclophosphamide 500 mg | ‐ | |
| cyclophosphamide 500 mg | ‐ | |
| sequential administration of 3 cycles each of doxorubicin 80 mg/m², paclitaxel 200 mg/m², and cyclophosphamide | ‐ | |
| cyclophosphamide 600 mg | cyclophosphamide 600 mg |
| Study | Initial phase | High‐dose cycle 1 | High‐dose cycle 2 | High‐dose cycle 3 | High‐dose cycle 4 | Regimen |
| 4 cycles of doxorubicin (as control arm) followed by: | cyclophosphamide 4 gm | cyclophosphamide 6 gm | ‐ | ‐ | Divided doses over 4 days | |
| 4 cycles of cyclophosphamide, doxorubicin and fluorouracil (as control arm) followed by: | cyclophosphamide 5.625 gm | ‐ | ‐ | ‐ | Divided doses over 3 days | |
| 4 cycles of cyclophosphamide, epirubicin and fluorouracil (doses as control arm) followed by: | cyclophosphamide 6 gm | ‐ | ‐ | ‐ | Divided doses over 4 days | |
| 4 cycles of cyclophosphamide, epirubicin and fluorouracil (as control arm) followed by: | cyclophosphamide 6 gm | ‐ | ‐ | ‐ | Divided doses over 4 days | |
| 6 cycles of cyclophosphamide, doxorubicin and 5FU (as control arm) followed by: | cyclophosphamide 6 gm | ‐ | ‐ | ‐ | Continuous infusion over 4 days | |
| 4 cycles of cyclophosphamide and epirubicin (as control arm) followed by: | cyclophosphamide 6 gm | ‐ | ‐ | ‐ | Divided doses over 4 days | |
| No common path with control group protocol | epirubicin 200 mg | As cycle 1 | As cycle 1 | 3 X 21‐day cycles | ||
| 2 cycles of cyclophosphamide, epirubicin and fluorouracil (as control arm cycles 1 and 2) | cyclophosphamide 6 gm | ‐ | ‐ | ‐ | Continuous infusion over 4 days | |
| 6 cycles of cyclophosphamide, doxorubicin and fluorouracil (as control arm), followed by: | cyclophosphamide 6 gm | ‐ | ‐ | ‐ | ‐ | |
| No common path with control group protocol | cyclophosphamide 7 gm | methotrexate 8gm | epirubicin 120 mg X 2 | thiotepa 600 mg melphalan 160 ‐ 180 mg | 4 high‐dose treatments in sequence | |
| 8 cycles of cyclophosphamide, doxorubicin and fluorouracil (as control arm), followed by: | cyclophosphamide 5.25 gm | As cycle 1 | ‐ | ‐ | Divided doses over 3 days. 2nd cycle given when haematologically safe | |
| 4 cycles of cyclophosphamide, epirubicin and fluorouracil (as control arm), followed by: | cyclophosphamide 120 mg | ‐ | ‐ | ‐ | ‐ | |
| 4 cycles of doxorubicin 80 mg/m² and cyclophosphamide 600 mg/m² (AC) every 3 weeks | STAMP I or STAMP V HDC regimen. STAMP I consisted of cyclophosphamide 1.85 g/m²/d and cisplatin 55 mg/m²/d, followed by carmustine 600 mg/m²; STAMP V consisted of cyclophosphamide 1.5 g/m²/d, carboplatin 200 mg/m²/d, and thiotepa 125 mg/m²/d | ‐ | ‐ | ‐ | ‐ | |
| 2 cycles of cyclophosphamide and epirubicin (as control arm) | cyclophosphamide 3 gm | As cycle 1 | ‐ | ‐ | High‐dose cycles over 28 days |
| Study ID | Data maturity | Median follow‐up |
| No | 4 years | |
| No | 7.3 years | |
| 5 years | 6.9 years | |
| 3 years | 7 years | |
| No | 6.1 years | |
| No | 6.1 years | |
| No | 8.3 years | |
| No | 4.2 years | |
| No | 63 months | |
| 3 years | 11.9 years | |
| No | 11.33 years | |
| 3 years | 3.25 years | |
| No | 5.8 years | |
| 3 years | 4 years |
| Study ID | Haemopoietic | Gastrointestinal | Pulmonary | Cardiac events | Neurological | Other toxicity | Late/ long term | Second cancers | Trialist's summary |
| Standard chemo: Grade 4 neutropenia 15% | Haemorrhage ≥ grade 2: | Nausea ≥ grade 3: | Rhythm toxicity ≥ grade 2: | Cortical neurotoxicity ≥ 1 | Both trial arms: Menopausal symptoms common. | ‐ | ‐ | ‐ | |
| Leukopenia and thrombocytopenia common in both groups but more severe and persistent in HDC arm | ‐ | Toxicity ≥ grade 3: | ‐ | Toxicity ≥ grade 3: | Hepatic toxicity ≥ grade 3: | ‐ | By median 7.5 yrs High‐dose arm: 16 second cancers (4%) (including acute myeloid leukaemia or myelodysplatic syndrome 7; breast cancer 5) | ‐ | |
| High‐dose chemo: all hospitalised for 13 ‐ 30 days for haemopoietic recovery. Median neutropenic fever 5 days Standard chemo: neutropenic fever after 4% of cycles | High‐dose: mucositis 85% (severe in 22%), diarrhoea common. Standard chemo: Mild nausea and vomiting, mucositis (28% of cycles), diarrhoea (4% of cycles) | ‐ | See long‐term events | ‐ | Both arms: alopecia 100%, fatigue common, lymphoedema of arm in 20% High‐dose: ovarian failure 100%, radiation pneumonitis 10%, Standard dose: radiation pneumonitis 2% | High‐dose arm: 1 case hypothyroidism, 1 case auto‐antibody production | At median follow‐up of 7 years: | High‐dose: "Moderately well tolerated but substantial though reversible toxic effects". Standard dose: "Mild toxicity" | |
| High‐dose: transfusion‐dependent 100% | High‐dose: nausea and vomiting 100% | ‐ | High‐dose: cardiac arrhythmia 1/442, possible heart failure 1/442 | ‐ | High‐dose: high fever (necessitating early termination of treatment): 4 women (1%) | ‐ | By median follow‐up 7 years: | High‐dose: "Well tolerated" | |
| High‐dose: leukopenia 98%, granulocytopenia 94%, thrombocytopenia 97%, anaemia 62%, | High‐dose: nausea 32%, vomiting 16%, diarrhoea 22%, stomatitis 37% Standard chemo: nausea 11%, vomiting 8%, stomatitis 4% (all grade 3 or 4) | Standard chemo: 1% (grade 3 or 4) | ‐ | Standard chemo: 6% (grade 3 or 4) | High‐dose: infection 21%, liver effects 13%, skin effects 11%, diabetes 14% Standard dose: hyperglycaemia 2%, phlebitis 1%, hepatotoxicity 1% (all grade 3 or 4) | ‐ | By median 6.1 years: | ‐ | |
| ‐ | High‐dose: Grade 3 or 4 gastrointestinal toxicity < 1%; | Grade 3 or 4 toxicity < 1% | ‐ | High‐dose: Grade 3 or 4 toxicity nil | High‐dose: Grade 3 or 4 toxicity: Bladder < 1%; kidney nil; liver nil | ‐ | ‐ | ‐ | |
| High‐dose: myelosuppression | High‐dose: nausea and vomiting; mucositis | ‐ | ‐ | ‐ | ‐ | Permanent amenorrhoea: High‐dose arm 77/95 (81% overall, age < 40 years 61%; age > 40 years 96%); Standard‐dose arm 61/98 (63% overall age < 40 years 24%; age > 40 years 84%) | By median 8.3 years: | High‐dose: Overall toxicities Grade 3 1%; Grade 4 98%; | |
| High‐dose: leucopenia and thrombocytopenia presumed 100% but nadir count not always available (grade 3 or 4) | High‐dose: nausea and vomiting 46%, mucositis 22% (grade 3 or 4) | High‐dose: Pulmonary embolus 1/143; respiratory failure requiring ventilator 1/143 | High‐dose: severe cardiac arrhythmia 2% (3/143) | ‐ | High‐dose: hair loss 100%, fever (no infection) 17%, infection 24%, "other" 28% (grade 3 or 4), deep vein thrombosis 1/143 | After chemotherapy: 227 toxic events occurred (127 in high‐dose arm, 110 in control arm), of which 30% related to tamoxifen. Of the others, 7 events deemed life‐threatening (5 in high‐dose group, 2 in control arm) | High‐dose: 2/143 (breast 1, ovarian 1) | ||
| High‐dose: All 34 women receiving HDC actually developed grade 4 leukopenia and grade 4 neutropenia; 27 (79%) developed grade 4 and the other 7 grade 3 thrombocytopenia. Standard dose: 7 women (8%) developed grade 4 neutropenia | High‐dose: vomiting 62%, diarrhoea 29%, mucositis 15%, (grade 3 or 4) | ‐ | High‐dose: grade 3 arrhythmia 3%, | ‐ | High‐dose: Grade 3 or 4 infection: 6% | ‐ | ‐ | ‐ | |
| High‐dose: Length of hospital stay not stated. Standard dose: 22% admitted with infection or fever | High‐dose: mild/moderate vomiting 80%, mild/moderate diarrhoea 58%, mild/moderate mucositis 83%. Standard dose: Nausea and vomiting moderate 75%, severe 16%. Diarrhoea moderate 19%, severe 8%. Mucousitis moderate 36%, severe 10% | High‐dose: 1 case (severe) | High‐dose: moderate/severe 8%. Standard dose: 1 woman (1%) had myocardial infarction | High‐dose: hearing loss 2 cases (6%) ‐ 1 permanent, mild/moderate peripheral neuropathy 11% | High‐dose: Renal: 25% (22% mild, < 3% severe), hepatic (mild/moderate) 31%, bladder (moderate) 25%, skin (mild) 8% | High‐dose: 1 case of avascular necrosis | High‐dose: 1 case of acute myeloid leukaemia | "Overall there was greater and more frequent morbidity associated with high dose chemotherapy" | |
| ‐ | ‐ | ‐ | ‐ | ‐ | ‐ | ‐ | ‐ | ‐ | |
| ‐ | ‐ | ‐ | ‐ | ‐ | ‐ | ‐ | ‐ | ‐ | |
| High‐dose: 62% had haematologic toxicity during induction and 92% had it during transplantation. 3 women had myelodysplastic syndrome Controls: 59% had haematologic toxicity 2 women had myelodysplastic syndrome | ‐ | ‐ | ‐ | ‐ | ‐ | High‐dose: 44% of women experienced grade 3 or 4 nonhaematologic toxicity during induction while 80% experienced grade 3 or 4 nonhematologic toxicity during transplantation. Control arm: Approximately 63% experienced grade 3 or 4 nonhaematologic toxicity, most commonly fatigue, nausea and vomiting, infection, febrile neutropenia, mucositis, and sensory neuropathy | ‐ | High‐dose: 44% had | |
| ‐ | High‐dose arm: nausea 25%, mucositis 18%, diarrhoea 5% | High‐dose arm: 1% | High‐dose arm: 3% | ‐ | High‐dose arm: grade 3 or 4 skin toxicity 3%, amenorrhoea 100% | ‐ | ‐ | Both high‐dose chemotherapy and dose‐dense conventional chemotherapy are feasible with tolerable toxicity in a multicentre setting |
| Outcome or subgroup title | No. of studies | No. of participants | Statistical method | Effect size |
| 1 Overall survival Show forest plot | 14 | Risk Ratio (M‐H, Fixed, 95% CI) | Subtotals only | |
| 1.1 3‐year follow‐up | 3 | 795 | Risk Ratio (M‐H, Fixed, 95% CI) | 1.02 [0.95, 1.10] |
| 1.2 5‐year follow‐up | 8 | 3566 | Risk Ratio (M‐H, Fixed, 95% CI) | 1.00 [0.96, 1.04] |
| 1.3 6‐year follow‐up | 1 | 511 | Risk Ratio (M‐H, Fixed, 95% CI) | 0.94 [0.81, 1.08] |
| 1.4 8‐year follow‐up | 1 | 344 | Risk Ratio (M‐H, Fixed, 95% CI) | 1.17 [0.95, 1.43] |
| 1.5 12‐year follow‐up | 1 | 382 | Risk Ratio (M‐H, Fixed, 95% CI) | 1.18 [0.99, 1.42] |
| 2 Event‐free survival Show forest plot | 14 | Risk Ratio (M‐H, Fixed, 95% CI) | Subtotals only | |
| 2.1 3‐year follow‐up | 3 | 795 | Risk Ratio (M‐H, Fixed, 95% CI) | 1.19 [1.06, 1.34] |
| 2.2 5‐year follow‐up | 8 | 3566 | Risk Ratio (M‐H, Fixed, 95% CI) | 1.04 [0.99, 1.10] |
| 2.3 6‐year follow‐up | 1 | 511 | Risk Ratio (M‐H, Fixed, 95% CI) | 1.04 [0.87, 1.24] |
| 2.4 8‐year follow‐up | 1 | 344 | Risk Ratio (M‐H, Fixed, 95% CI) | 1.27 [0.99, 1.64] |
| 2.5 12‐year follow‐up | 1 | 382 | Risk Ratio (M‐H, Fixed, 95% CI) | 1.18 [0.95, 1.45] |
| 3 Treatment‐related mortality Show forest plot | 14 | 5600 | Risk Ratio (M‐H, Fixed, 95% CI) | 7.97 [3.99, 15.92] |
| 4 Second cancers Show forest plot | 7 | 3423 | Risk Ratio (M‐H, Fixed, 95% CI) | 1.25 [0.90, 1.73] |
| 4.1 By median 4‐ to 5‐year follow‐up | 2 | 817 | Risk Ratio (M‐H, Fixed, 95% CI) | 2.34 [0.61, 8.99] |
| 4.2 By median 6‐year follow‐up | 1 | 511 | Risk Ratio (M‐H, Fixed, 95% CI) | 1.69 [0.75, 3.78] |
| 4.3 By median 7‐year follow‐up | 3 | 1751 | Risk Ratio (M‐H, Fixed, 95% CI) | 1.02 [0.69, 1.51] |
| 4.4 By median 8‐ to 9‐year follow‐up | 1 | 344 | Risk Ratio (M‐H, Fixed, 95% CI) | 2.97 [0.61, 14.49] |