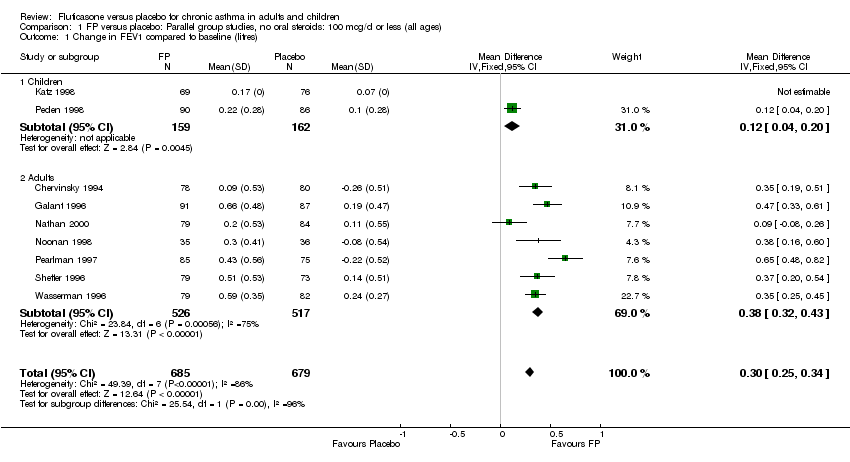
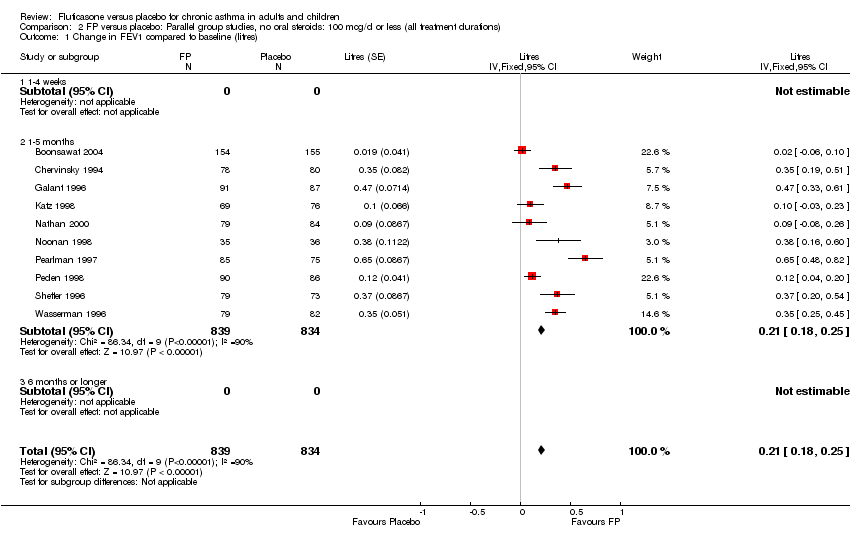
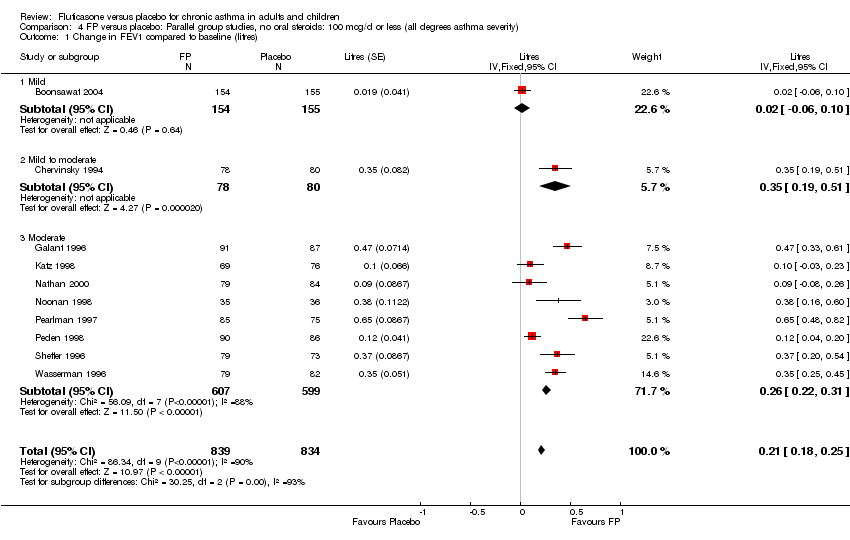
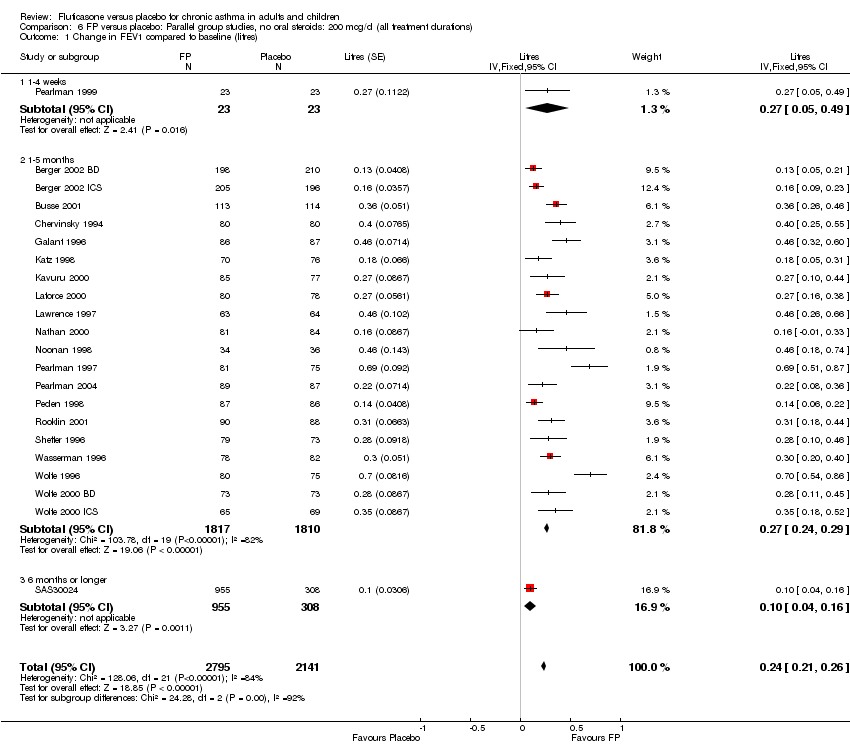
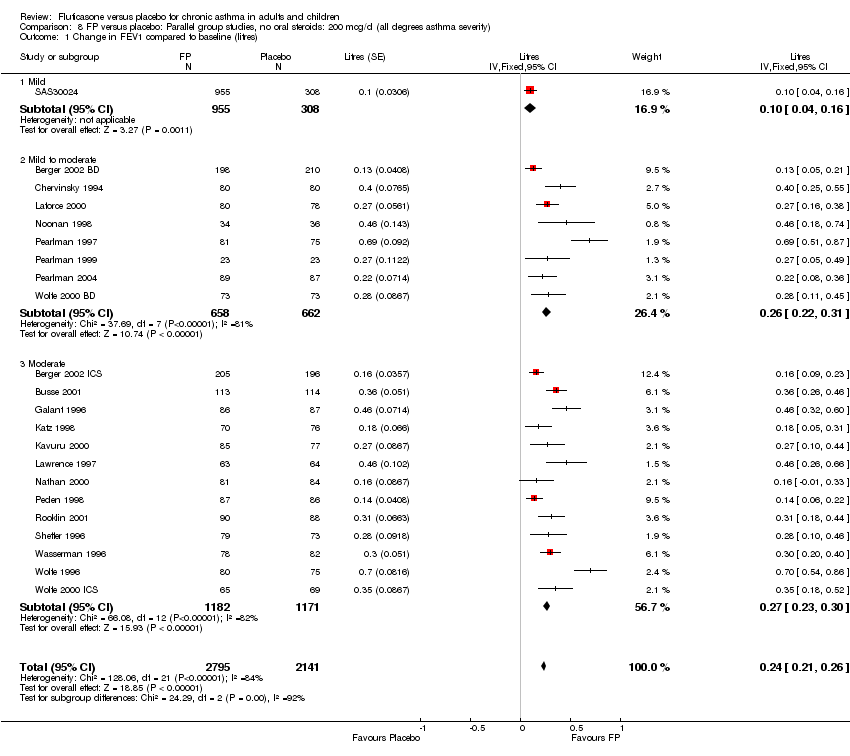
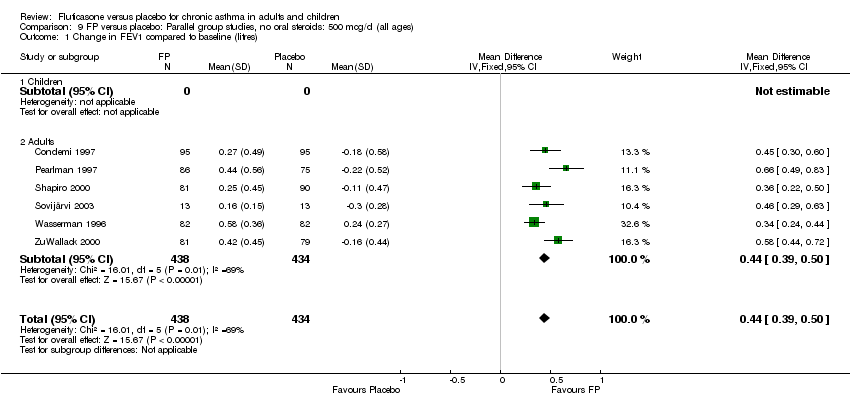
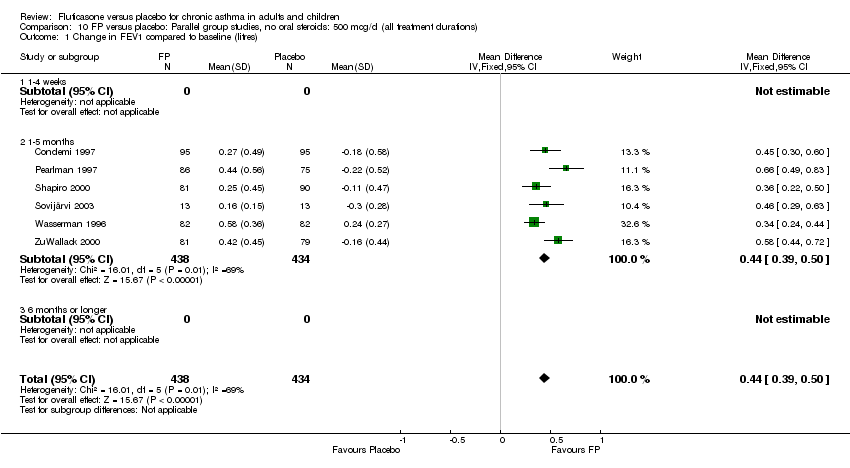
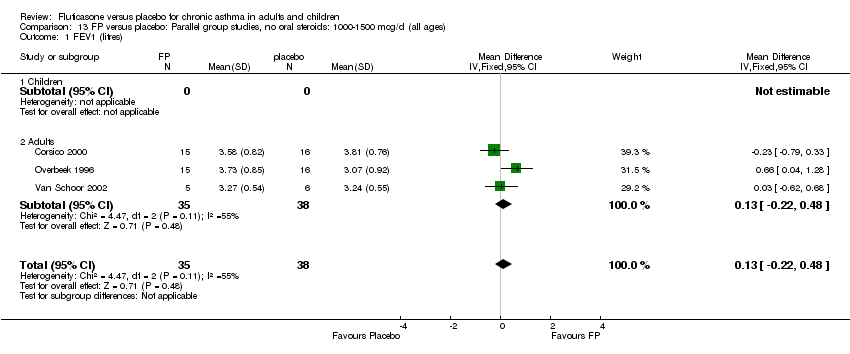
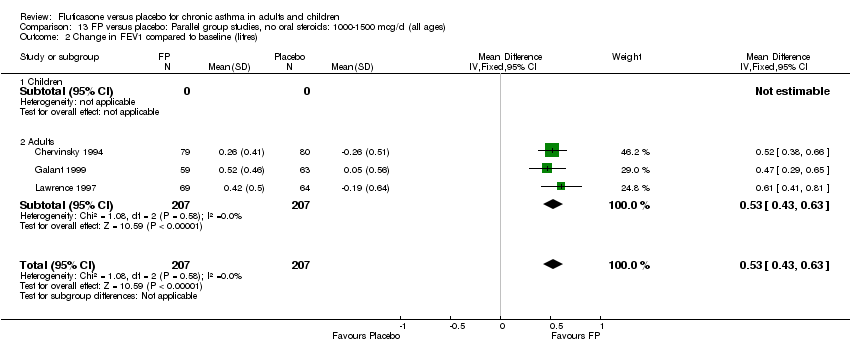
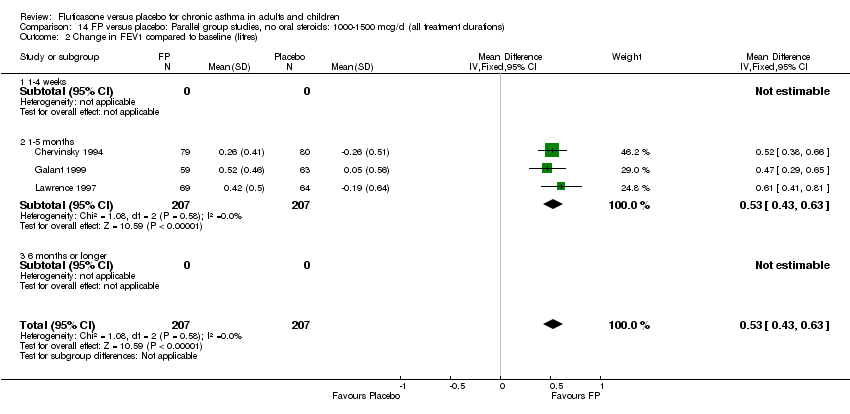
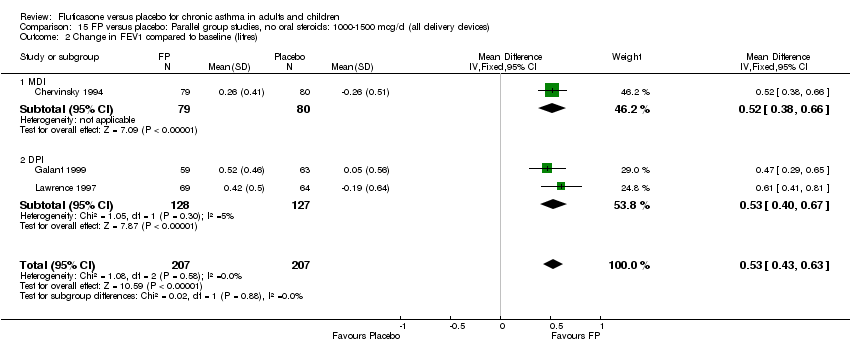
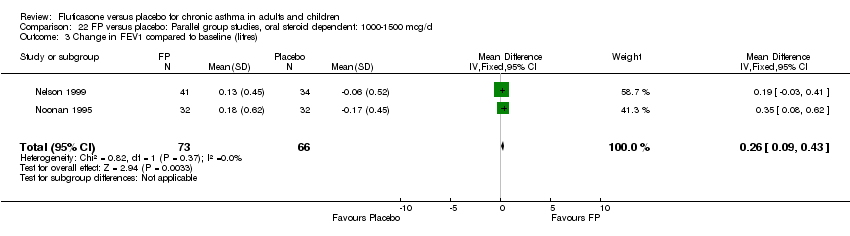
| 1 Change in FEV1 compared to baseline (litres) Show forest plot | 21 | 4790 | Mean Difference (IV, Fixed, 95% CI) | 0.24 [0.21, 0.26] |
|
| 1.1 Children | 2 | 331 | Mean Difference (IV, Fixed, 95% CI) | 0.19 [0.12, 0.25] |
| 1.2 Adults | 19 | 4459 | Mean Difference (IV, Fixed, 95% CI) | 0.25 [0.22, 0.27] |
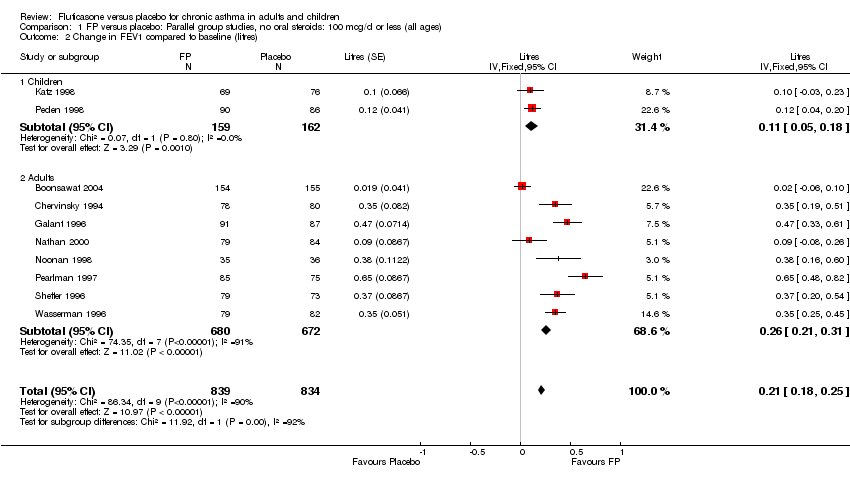
| 2 Change in FEV1 compared to baseline (imputed estimates) Show forest plot | 22 | 4936 | Litres (Fixed, 95% CI) | 0.24 [0.21, 0.26] |
|
| 2.1 Children | 3 | 477 | Litres (Fixed, 95% CI) | 0.18 [0.13, 0.24] |
| 2.2 Adults | 19 | 4459 | Litres (Fixed, 95% CI) | 0.25 [0.22, 0.28] |
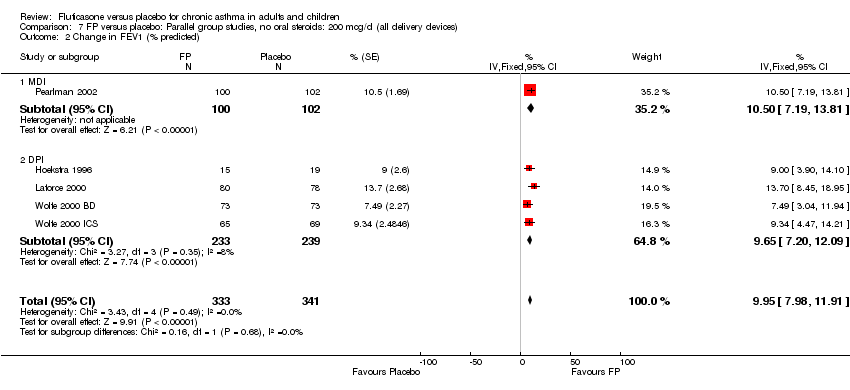
| 3 Change in FEV1 (% predicted) Show forest plot | 5 | 674 | % (Fixed, 95% CI) | 9.95 [7.98, 11.91] |
|
| 3.1 Children | 2 | 192 | % (Fixed, 95% CI) | 11.28 [7.62, 14.94] |
| 3.2 Adults | 3 | 482 | % (Fixed, 95% CI) | 9.41 [7.07, 11.74] |
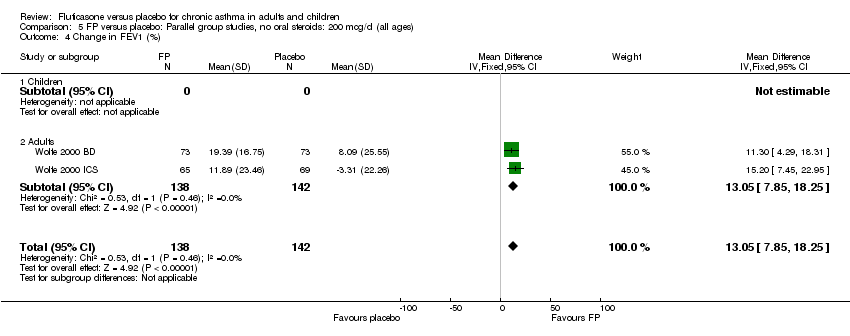
| 4 Change in FEV1 (%) Show forest plot | 2 | 280 | Mean Difference (IV, Fixed, 95% CI) | 13.05 [7.85, 18.25] |
|
| 4.1 Children | 0 | 0 | Mean Difference (IV, Fixed, 95% CI) | 0.0 [0.0, 0.0] |
| 4.2 Adults | 2 | 280 | Mean Difference (IV, Fixed, 95% CI) | 13.05 [7.85, 18.25] |
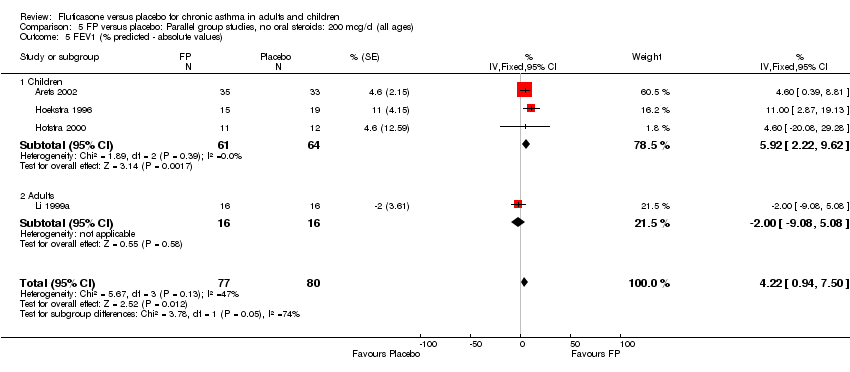
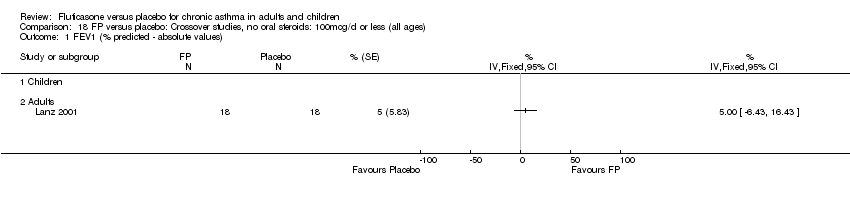
| 5 FEV1 (% predicted ‐ absolute values) Show forest plot | 4 | 157 | % (Fixed, 95% CI) | 4.22 [0.94, 7.50] |
|
| 5.1 Children | 3 | 125 | % (Fixed, 95% CI) | 5.92 [2.22, 9.62] |
| 5.2 Adults | 1 | 32 | % (Fixed, 95% CI) | ‐2.0 [‐9.08, 5.08] |
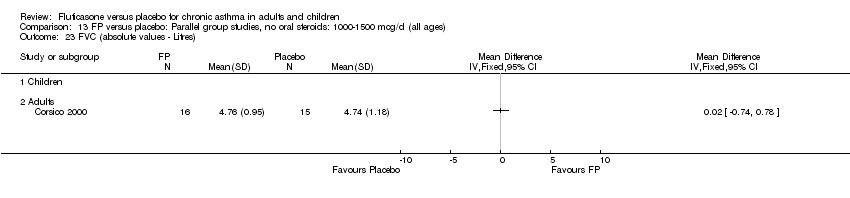
| 6 FEV1 (absolute values) Show forest plot | 2 | 86 | Litres (Fixed, 95% CI) | 0.06 [‐0.00, 0.13] |
|
| 6.1 Children | 1 | 68 | Litres (Fixed, 95% CI) | 0.06 [‐0.00, 0.12] |
| 6.2 Adults | 1 | 18 | Litres (Fixed, 95% CI) | 0.59 [‐0.31, 1.49] |
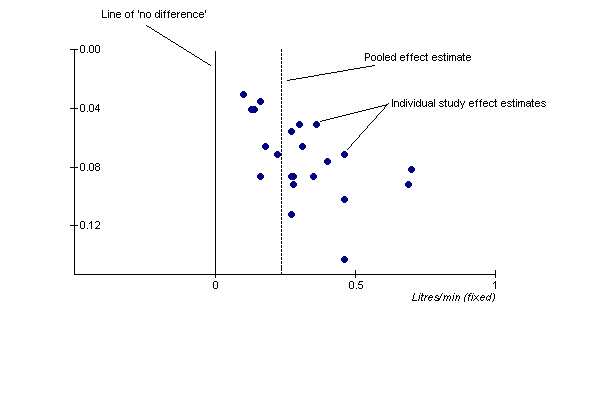
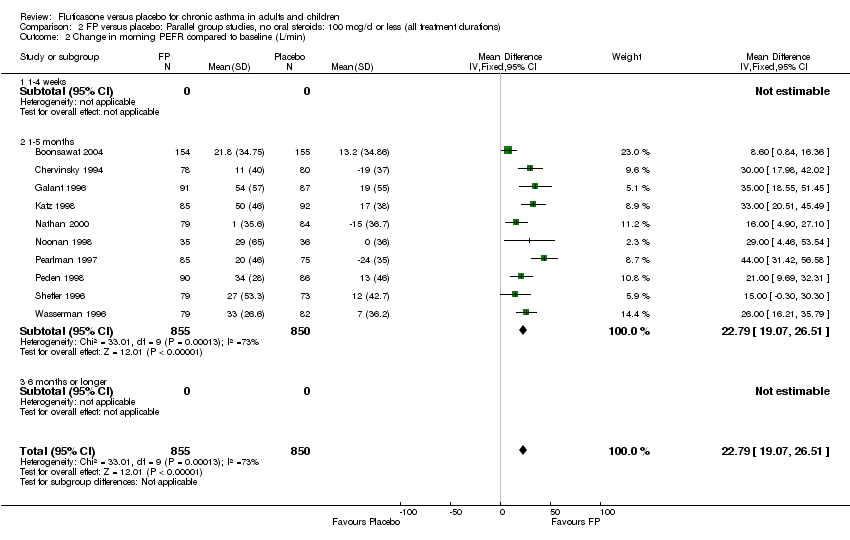
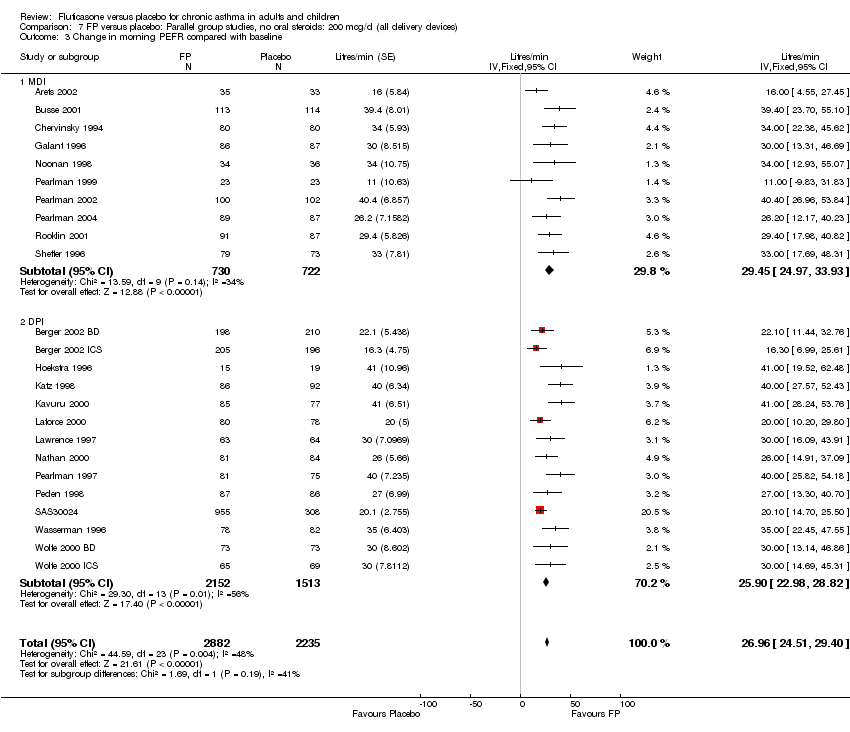
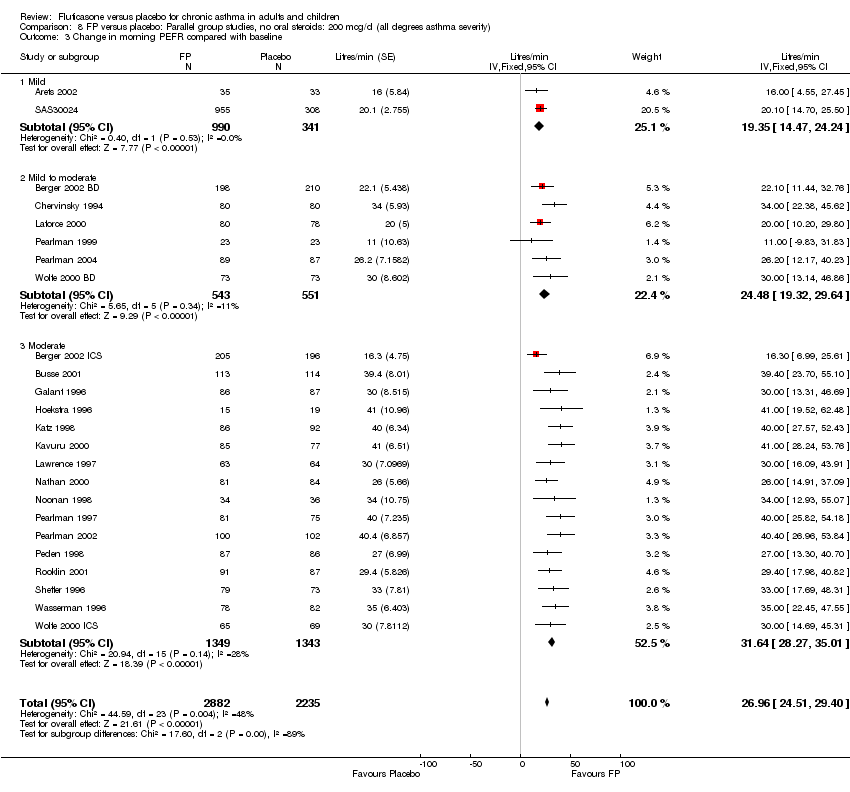
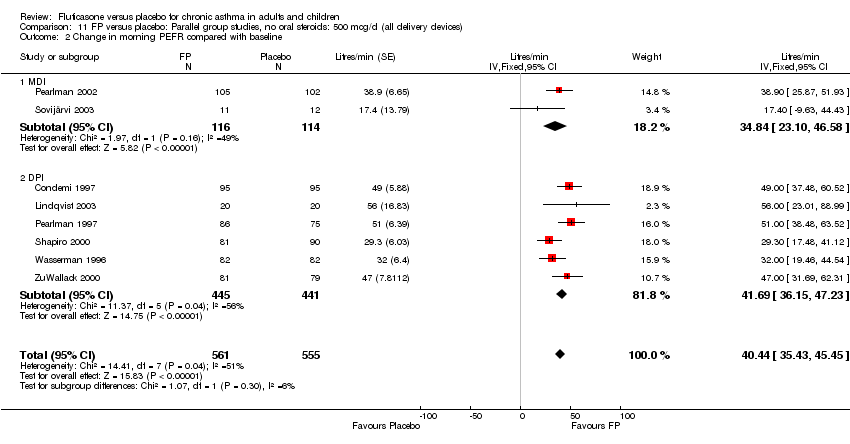
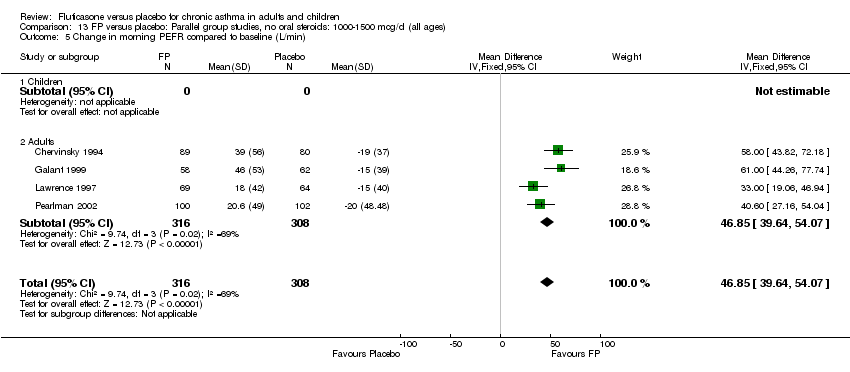
| 7 Change in morning PEFR compared with baseline Show forest plot | 24 | 5117 | Litres/min (Fixed, 95% CI) | 26.96 [24.51, 29.40] |
|
| 7.1 Children | 5 | 611 | Litres/min (Fixed, 95% CI) | 25.68 [20.09, 31.27] |
| 7.2 Adults | 19 | 4506 | Litres/min (Fixed, 95% CI) | 27.26 [24.54, 29.98] |
| 8 Change in morning PEFR compared to baseline (L/min) Show forest plot | 21 | 3752 | Mean Difference (IV, Fixed, 95% CI) | 29.29 [26.44, 32.14] |
|
| 8.1 Children | 3 | 509 | Mean Difference (IV, Fixed, 95% CI) | 27.50 [20.79, 34.21] |
| 8.2 Adults | 18 | 3243 | Mean Difference (IV, Fixed, 95% CI) | 29.69 [26.54, 32.83] |
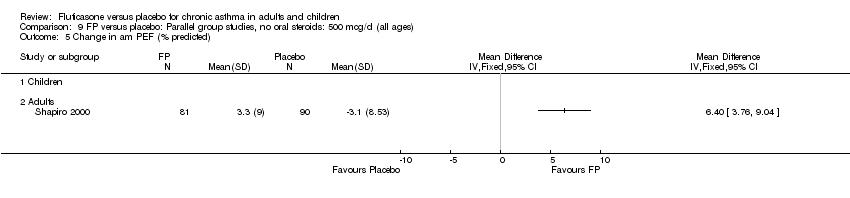
| 9 Mean change in am PEF (% predicted) Show forest plot | 2 | 665 | % (Fixed, 95% CI) | 4.49 [2.92, 6.05] |
|
| 9.1 Children | 1 | 241 | % (Fixed, 95% CI) | 6.0 [2.08, 9.92] |
| 9.2 Adults | 1 | 424 | % (Fixed, 95% CI) | 4.2 [2.49, 5.91] |
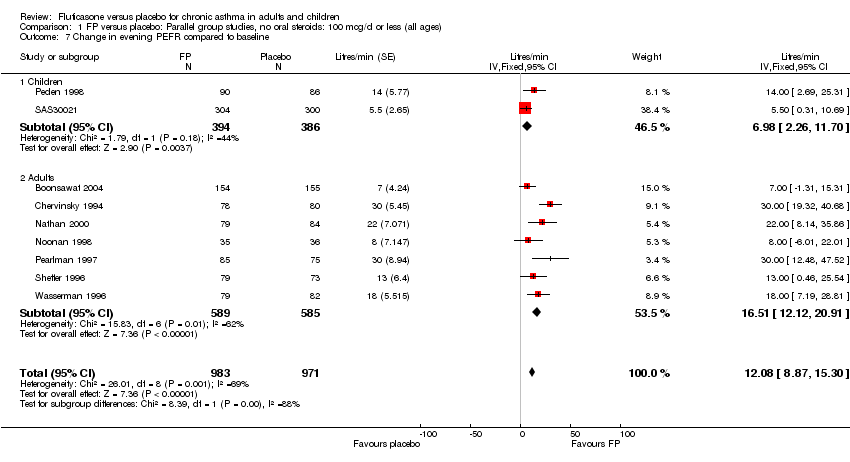
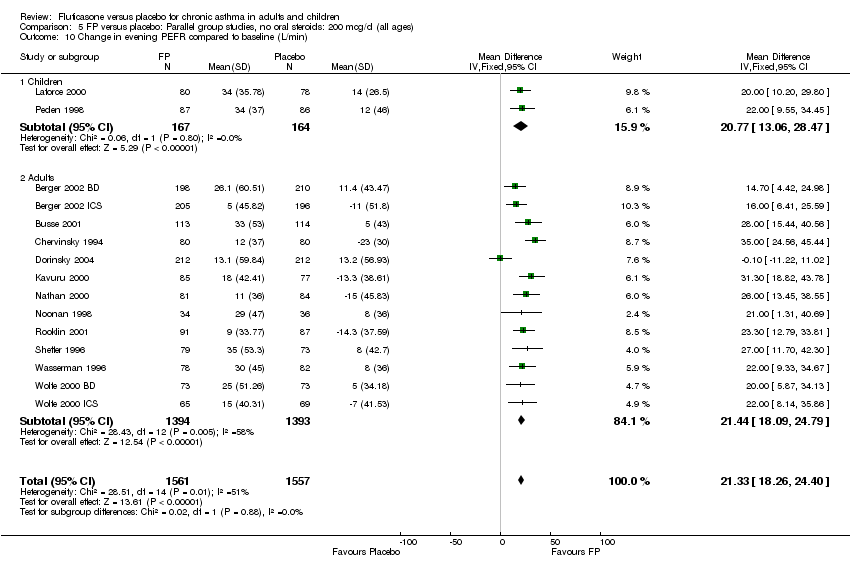
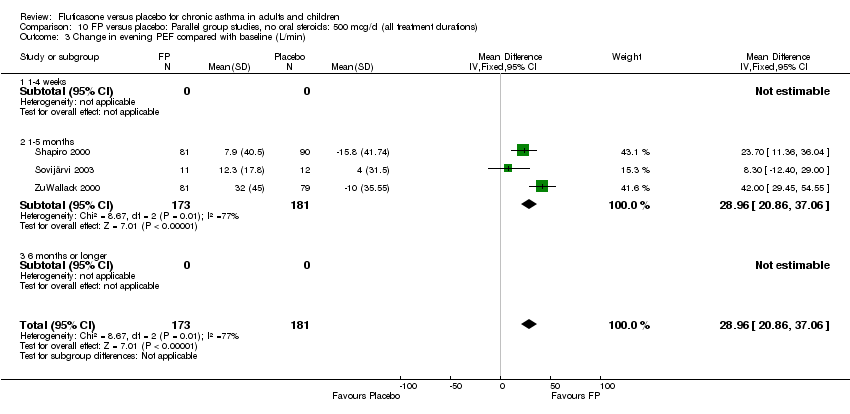
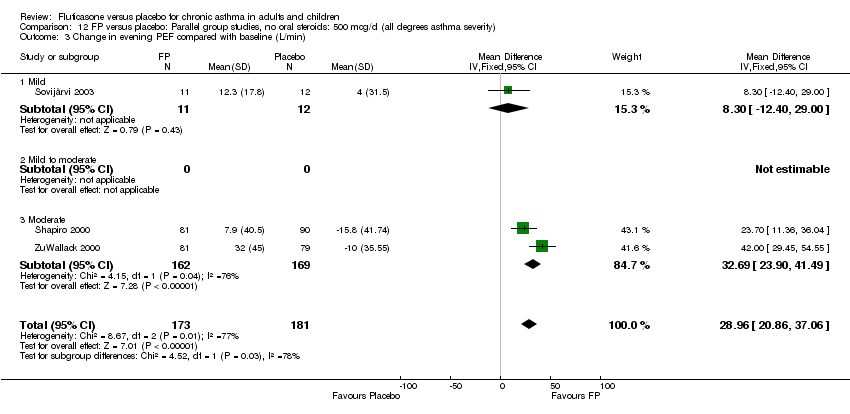
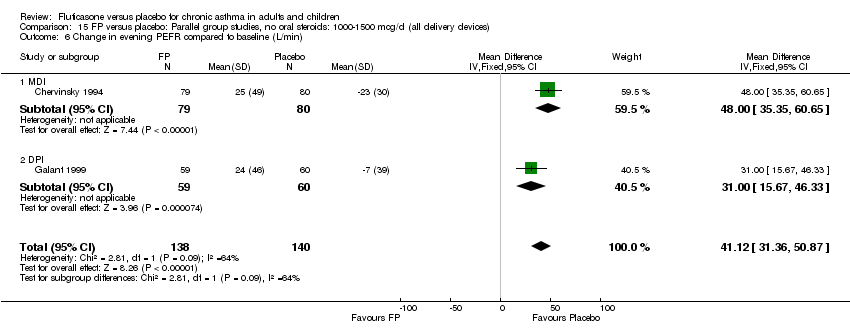
| 10 Change in evening PEFR compared to baseline (L/min) Show forest plot | 15 | 3118 | Mean Difference (IV, Fixed, 95% CI) | 21.33 [18.26, 24.40] |
|
| 10.1 Children | 2 | 331 | Mean Difference (IV, Fixed, 95% CI) | 20.77 [13.06, 28.47] |
| 10.2 Adults | 13 | 2787 | Mean Difference (IV, Fixed, 95% CI) | 21.44 [18.09, 24.79] |
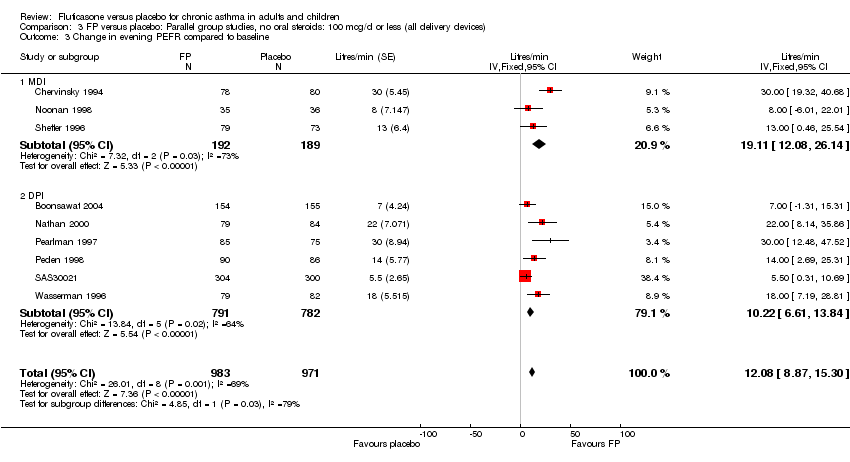
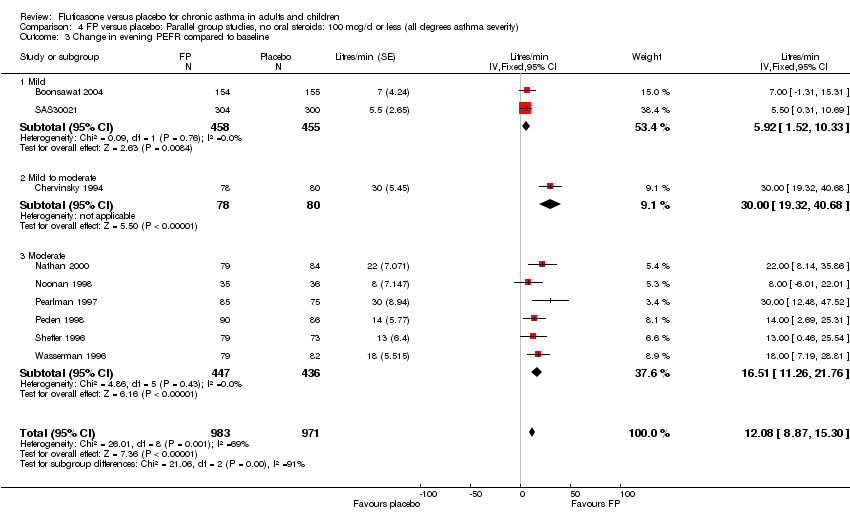
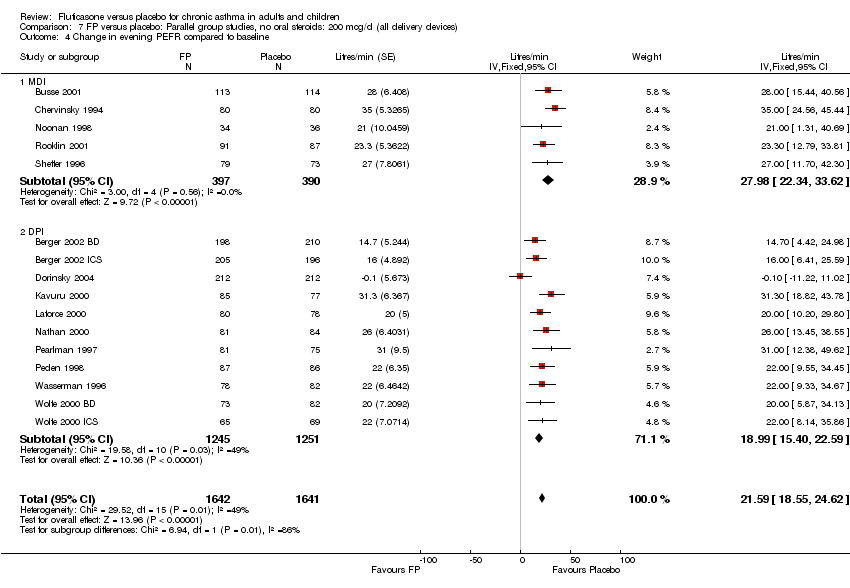
| 11 Change in evening PEFR compared to baseline Show forest plot | 16 | 3283 | Litres/min (Fixed, 95% CI) | 21.59 [18.55, 24.62] |
|
| 11.1 Children | 2 | 331 | Litres/min (Fixed, 95% CI) | 20.77 [13.07, 28.46] |
| 11.2 Adults | 14 | 2952 | Litres/min (Fixed, 95% CI) | 21.74 [18.44, 25.03] |
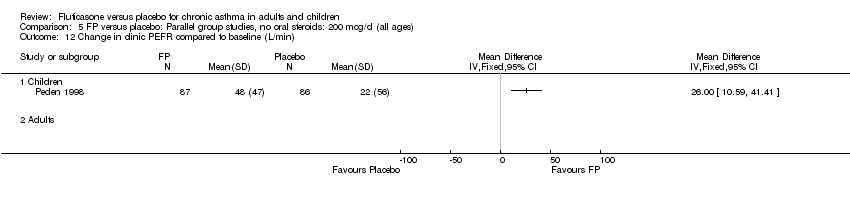
| 12 Change in clinic PEFR compared to baseline (L/min) Show forest plot | 1 | | Mean Difference (IV, Fixed, 95% CI) | Totals not selected |
|
| 12.1 Children | 1 | | Mean Difference (IV, Fixed, 95% CI) | 0.0 [0.0, 0.0] |
| 12.2 Adults | 0 | | Mean Difference (IV, Fixed, 95% CI) | 0.0 [0.0, 0.0] |
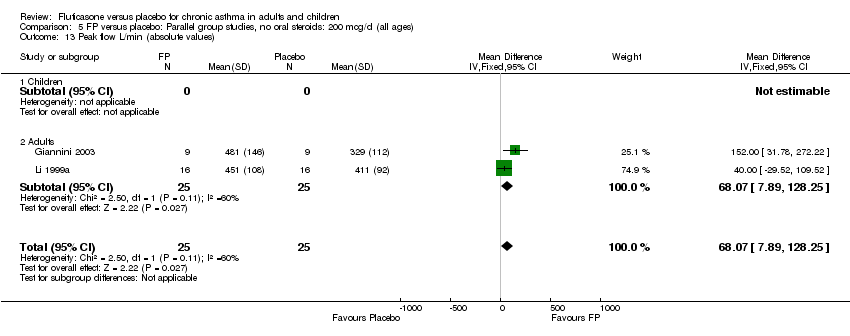
| 13 Peak flow L/min (absolute values) Show forest plot | 2 | 50 | Mean Difference (IV, Fixed, 95% CI) | 68.07 [7.89, 128.25] |
|
| 13.1 Children | 0 | 0 | Mean Difference (IV, Fixed, 95% CI) | 0.0 [0.0, 0.0] |
| 13.2 Adults | 2 | 50 | Mean Difference (IV, Fixed, 95% CI) | 68.07 [7.89, 128.25] |
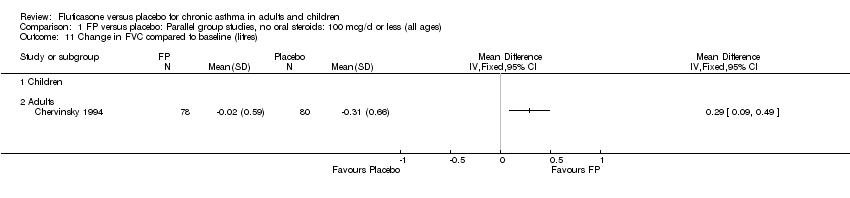
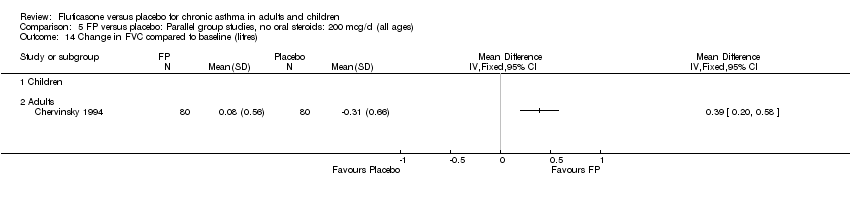
| 14 Change in FVC compared to baseline (litres) Show forest plot | 1 | | Mean Difference (IV, Fixed, 95% CI) | Totals not selected |
|
| 14.1 Children | 0 | | Mean Difference (IV, Fixed, 95% CI) | 0.0 [0.0, 0.0] |
| 14.2 Adults | 1 | | Mean Difference (IV, Fixed, 95% CI) | 0.0 [0.0, 0.0] |
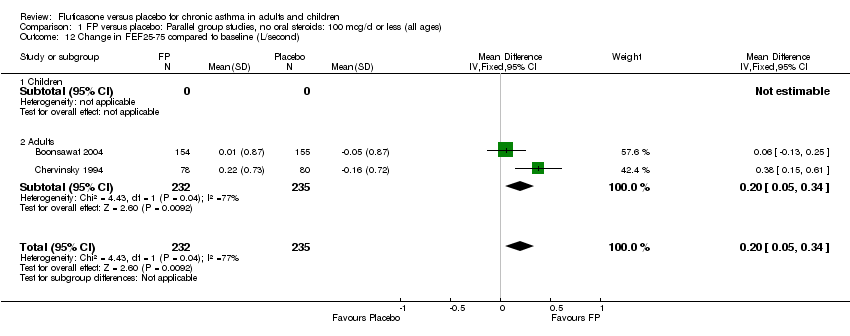
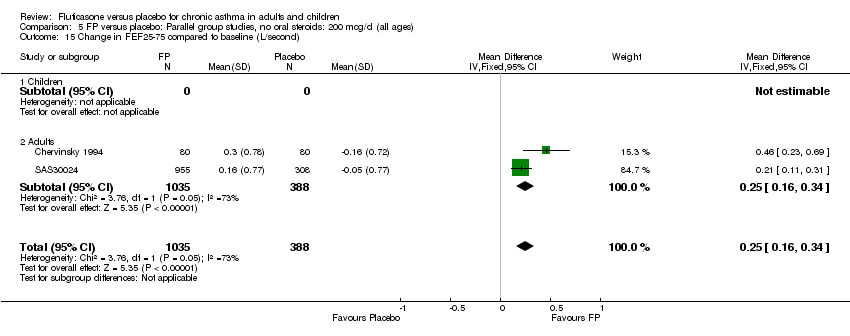
| 15 Change in FEF25‐75 compared to baseline (L/second) Show forest plot | 2 | 1423 | Mean Difference (IV, Fixed, 95% CI) | 0.25 [0.16, 0.34] |
|
| 15.1 Children | 0 | 0 | Mean Difference (IV, Fixed, 95% CI) | 0.0 [0.0, 0.0] |
| 15.2 Adults | 2 | 1423 | Mean Difference (IV, Fixed, 95% CI) | 0.25 [0.16, 0.34] |
| 16 Histamine BHR (log base 2 PC20 FEV1 mg/ml) Show forest plot | 1 | | Mean Difference (IV, Fixed, 95% CI) | Totals not selected |
|
| 16.1 Children | 1 | | Mean Difference (IV, Fixed, 95% CI) | 0.0 [0.0, 0.0] |
| 16.2 Adults | 0 | | Mean Difference (IV, Fixed, 95% CI) | 0.0 [0.0, 0.0] |
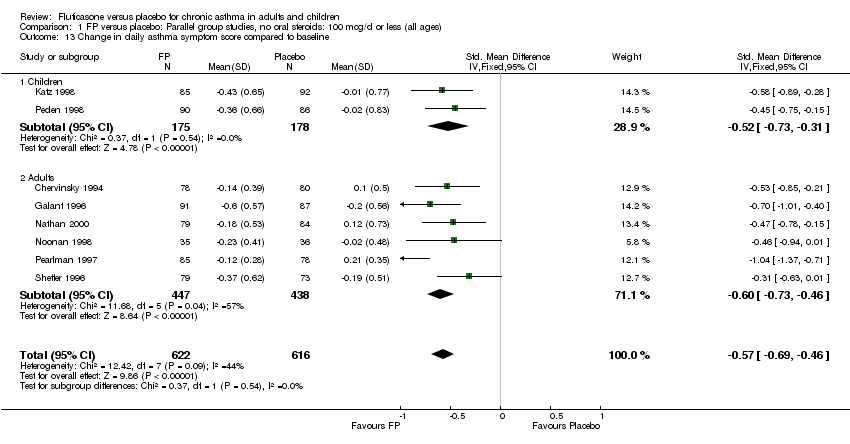
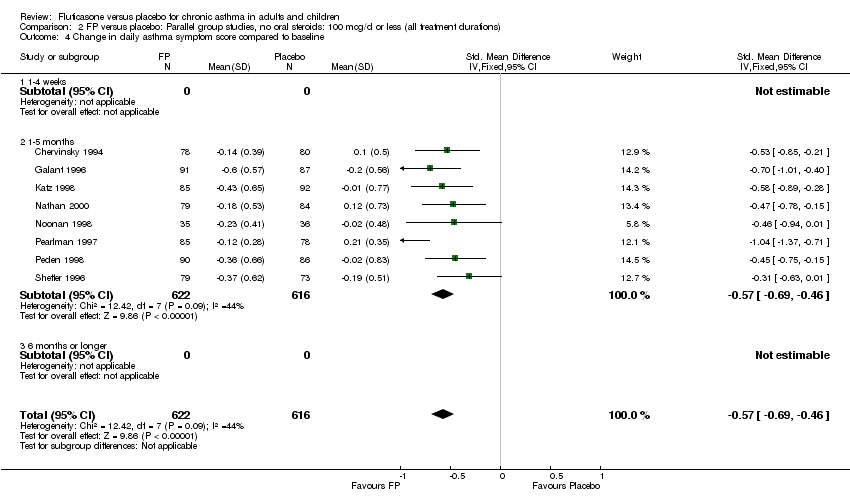
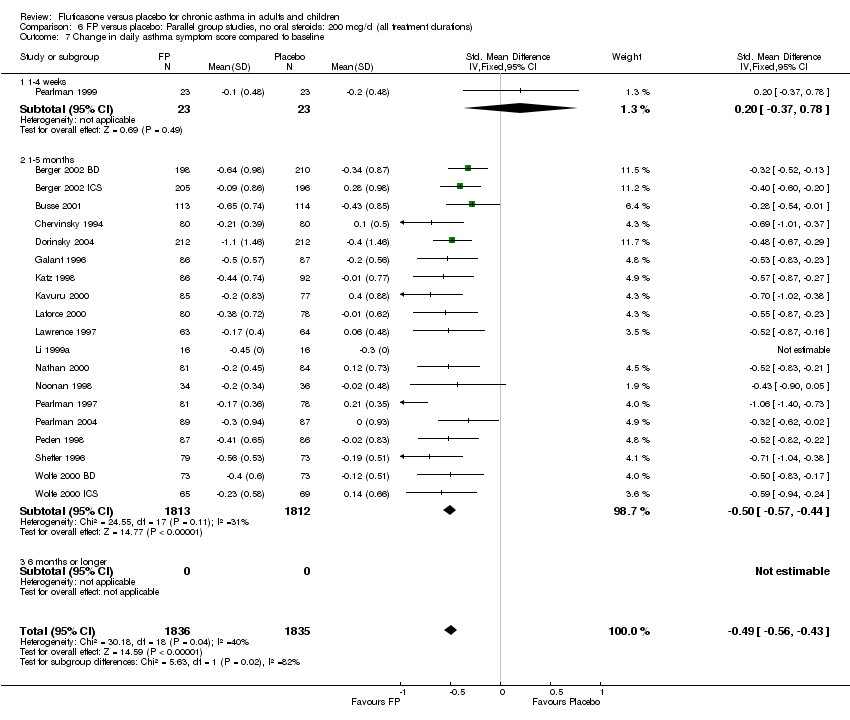
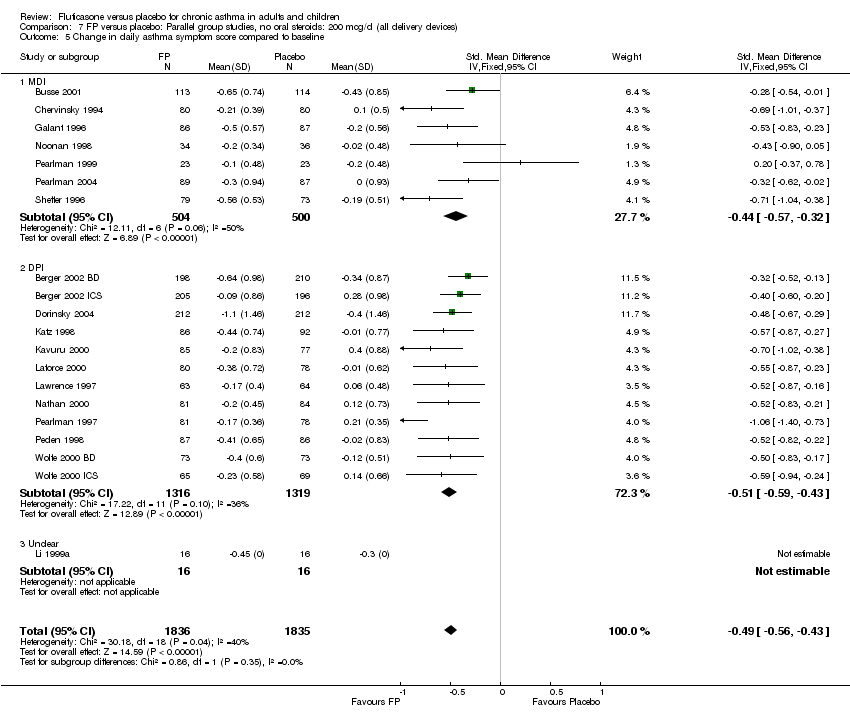
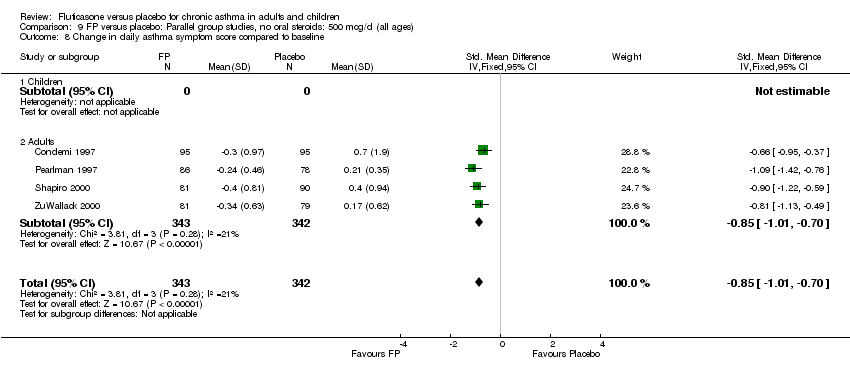
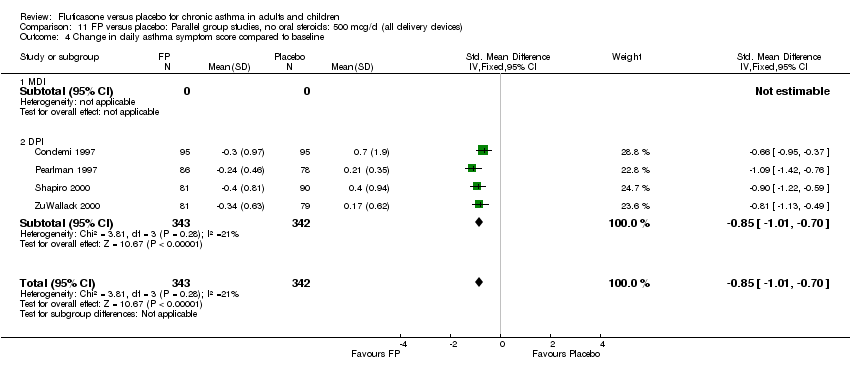
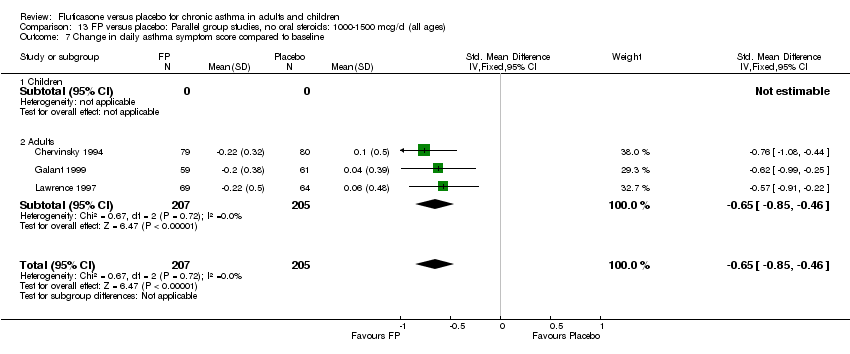
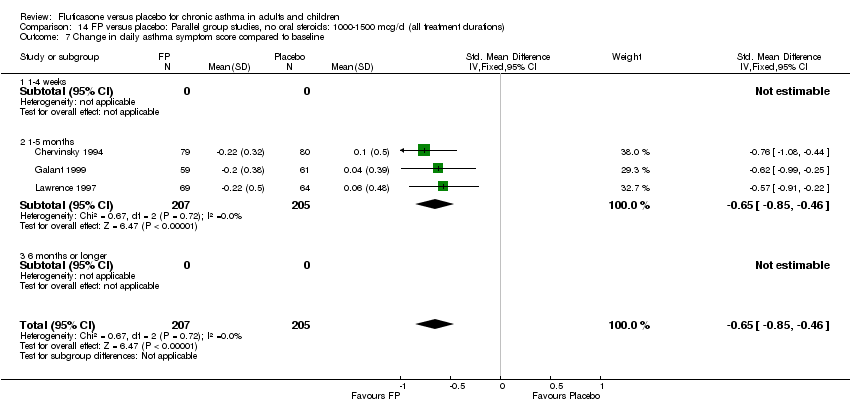
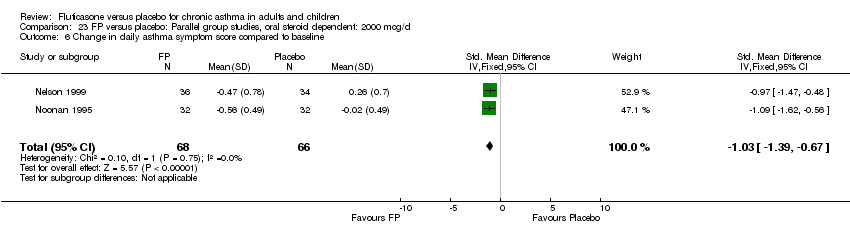
| 17 Change in daily asthma symptom score compared to baseline Show forest plot | 20 | 3671 | Std. Mean Difference (IV, Fixed, 95% CI) | ‐0.49 [‐0.56, ‐0.43] |
|
| 17.1 Children | 3 | 509 | Std. Mean Difference (IV, Fixed, 95% CI) | ‐0.55 [‐0.72, ‐0.37] |
| 17.2 Adults | 17 | 3162 | Std. Mean Difference (IV, Fixed, 95% CI) | ‐0.48 [‐0.56, ‐0.41] |
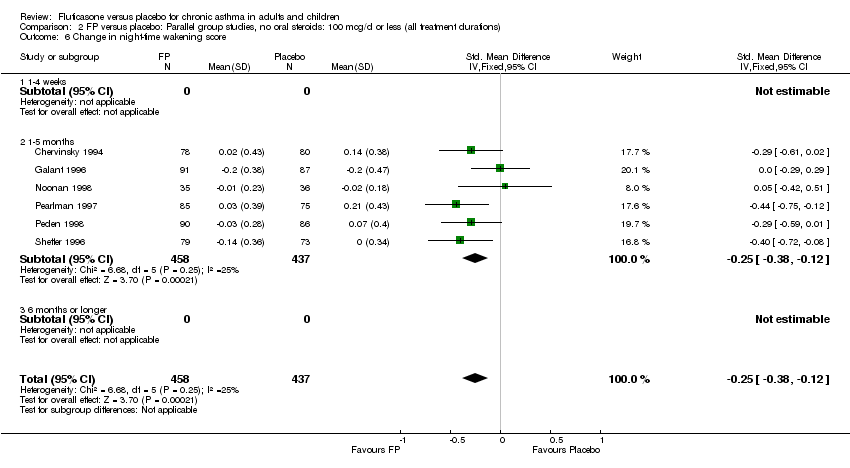
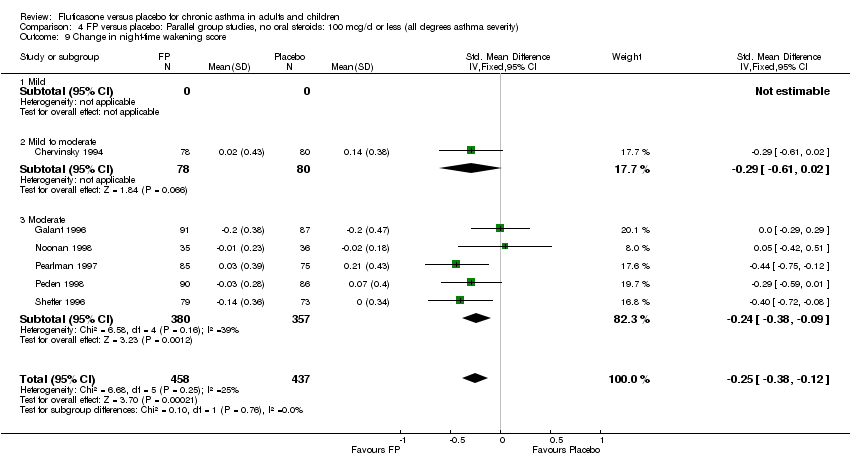
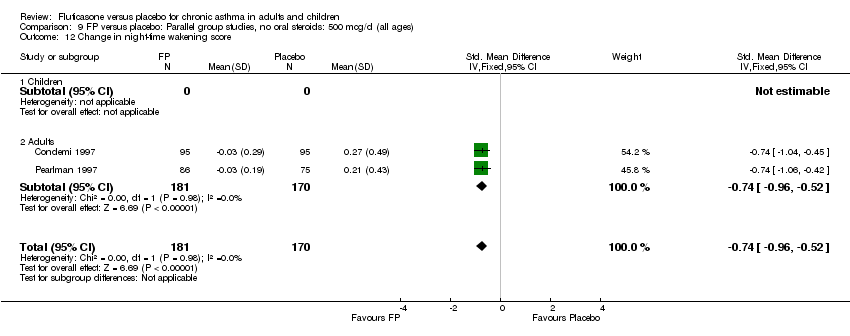
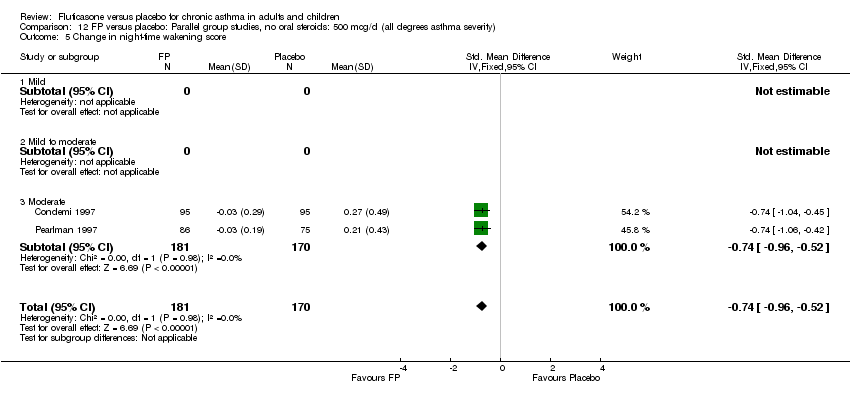
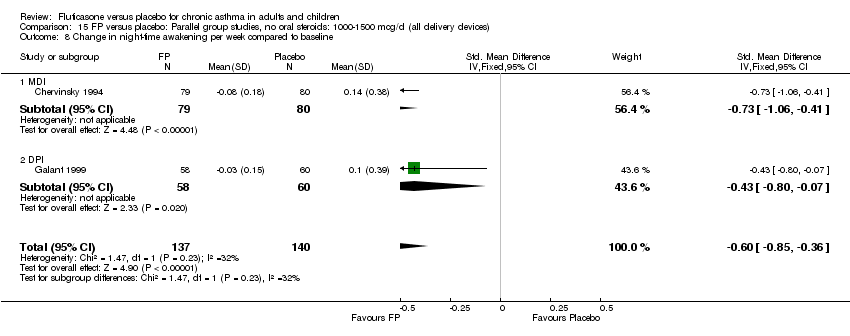
| 18 Change in night‐time wakening score Show forest plot | 6 | 884 | Std. Mean Difference (IV, Fixed, 95% CI) | ‐0.45 [‐0.59, ‐0.32] |
|
| 18.1 Children | 1 | 173 | Std. Mean Difference (IV, Fixed, 95% CI) | ‐0.41 [‐0.71, ‐0.11] |
| 18.2 Adults | 5 | 711 | Std. Mean Difference (IV, Fixed, 95% CI) | ‐0.47 [‐0.62, ‐0.32] |
| 19 Change in symptom free days Show forest plot | 1 | | Mean Difference (IV, Fixed, 95% CI) | Totals not selected |
|
| 19.1 Children | 0 | | Mean Difference (IV, Fixed, 95% CI) | 0.0 [0.0, 0.0] |
| 19.2 Adults | 1 | | Mean Difference (IV, Fixed, 95% CI) | 0.0 [0.0, 0.0] |
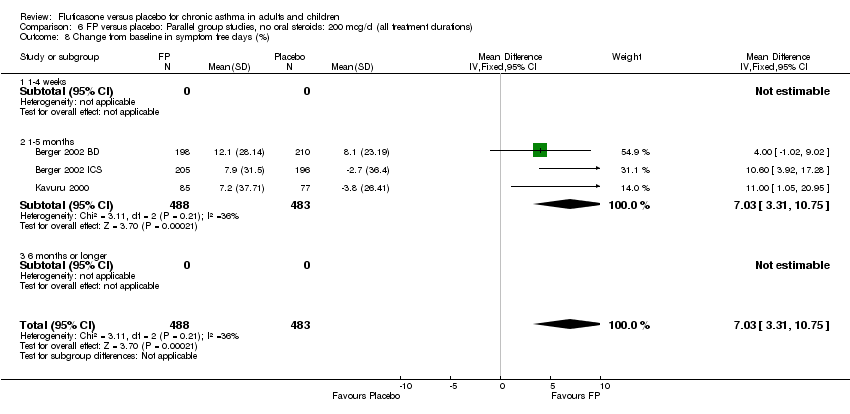
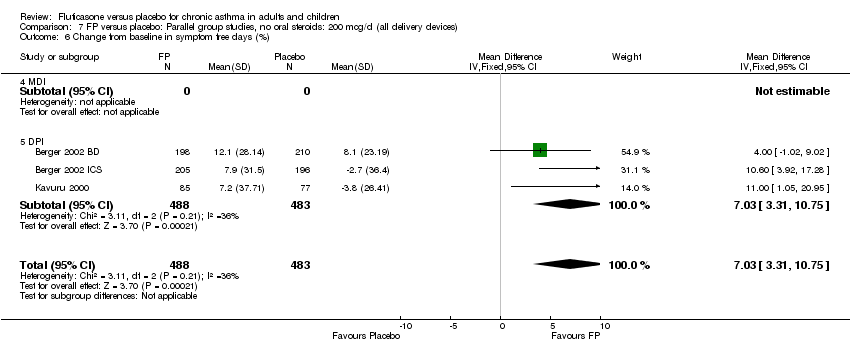
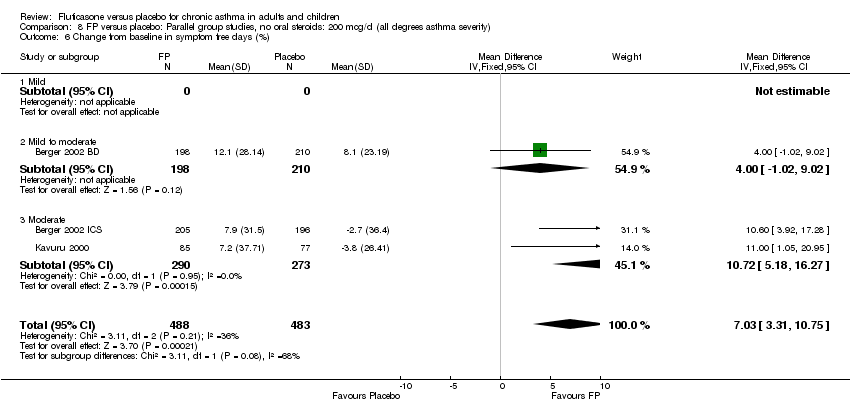
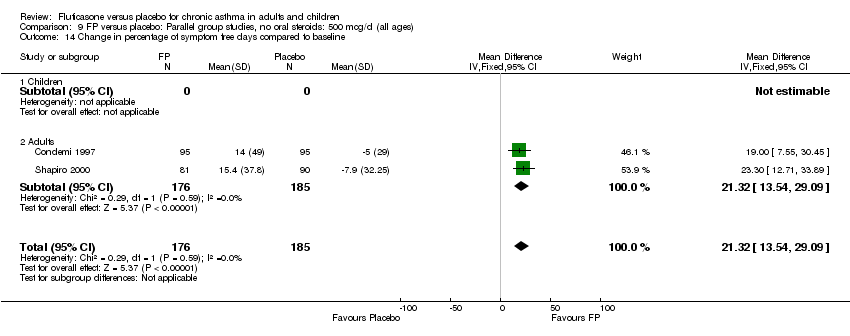
| 20 Change from baseline in symptom free days (%) Show forest plot | 3 | 971 | Mean Difference (IV, Fixed, 95% CI) | 7.03 [3.31, 10.75] |
|
| 20.1 Children | 0 | 0 | Mean Difference (IV, Fixed, 95% CI) | 0.0 [0.0, 0.0] |
| 20.2 Adults | 3 | 971 | Mean Difference (IV, Fixed, 95% CI) | 7.03 [3.31, 10.75] |
| 21 Percentage nights without awakening ‐ change from baseline Show forest plot | 2 | 208 | Mean Difference (IV, Fixed, 95% CI) | 10.65 [4.84, 16.46] |
|
| 21.1 Children | 0 | 0 | Mean Difference (IV, Fixed, 95% CI) | 0.0 [0.0, 0.0] |
| 21.2 Adults | 2 | 208 | Mean Difference (IV, Fixed, 95% CI) | 10.65 [4.84, 16.46] |
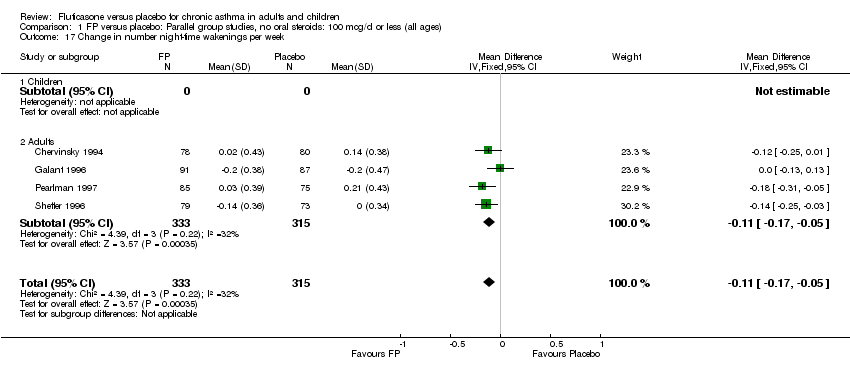
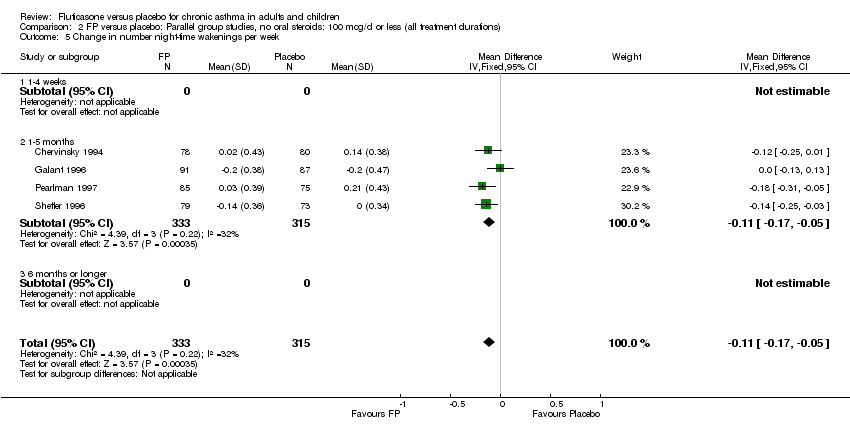
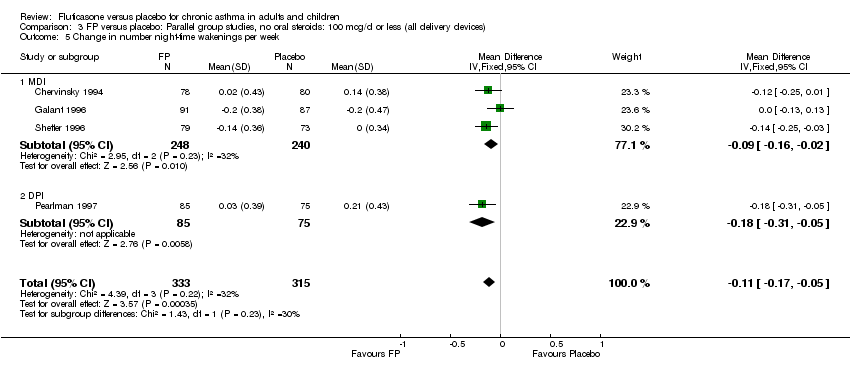
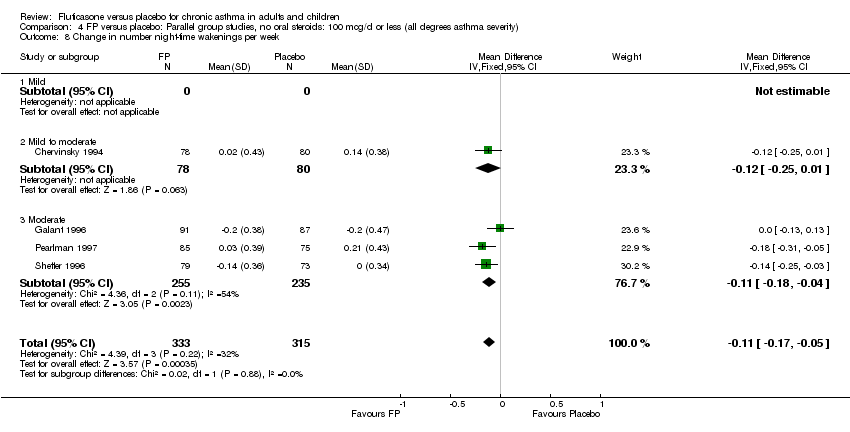
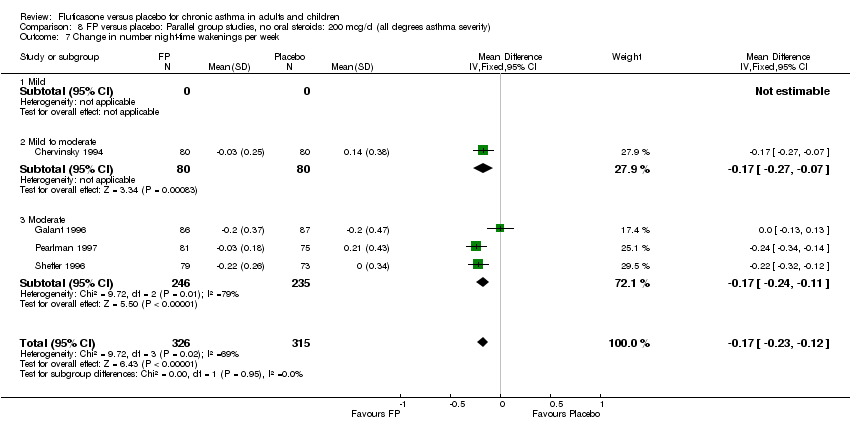
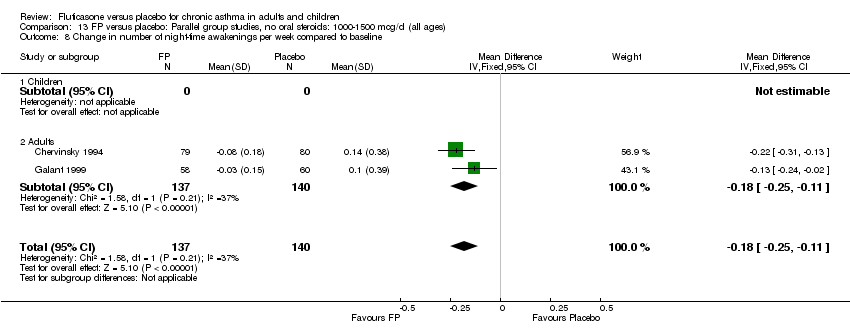
| 22 Change in number night‐time wakenings per week Show forest plot | 4 | 641 | Mean Difference (IV, Fixed, 95% CI) | ‐0.17 [‐0.23, ‐0.12] |
|
| 22.1 Children | 0 | 0 | Mean Difference (IV, Fixed, 95% CI) | 0.0 [0.0, 0.0] |
| 22.2 Adults | 4 | 641 | Mean Difference (IV, Fixed, 95% CI) | ‐0.17 [‐0.23, ‐0.12] |
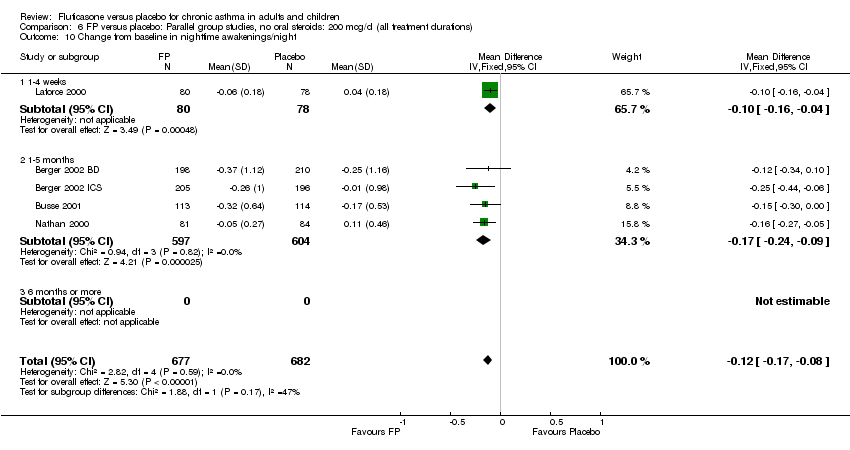
| 23 Change from baseline in nighttime awakenings/night Show forest plot | 5 | 1359 | Mean Difference (IV, Fixed, 95% CI) | ‐0.12 [‐0.17, ‐0.08] |
|
| 23.1 Children | 1 | 158 | Mean Difference (IV, Fixed, 95% CI) | ‐0.1 [‐0.16, ‐0.04] |
| 23.2 Adults | 4 | 1201 | Mean Difference (IV, Fixed, 95% CI) | ‐0.17 [‐0.24, ‐0.09] |
| 24 Change in nocturnal awakenings (unspecified time) Show forest plot | 2 | 280 | Mean Difference (IV, Fixed, 95% CI) | ‐0.07 [‐0.11, ‐0.02] |
|
| 24.1 Children | 0 | 0 | Mean Difference (IV, Fixed, 95% CI) | 0.0 [0.0, 0.0] |
| 24.2 Adults | 2 | 280 | Mean Difference (IV, Fixed, 95% CI) | ‐0.07 [‐0.11, ‐0.02] |
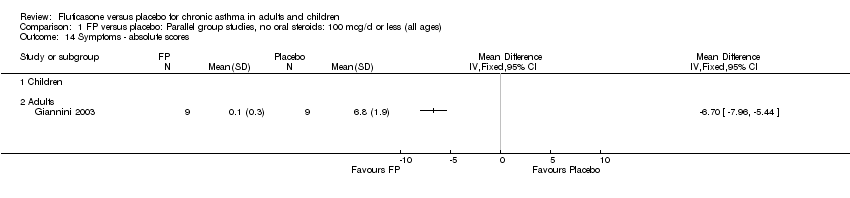
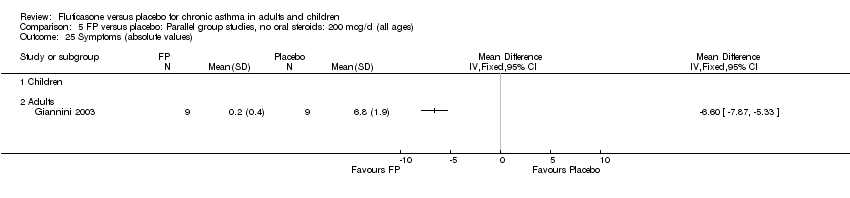
| 25 Symptoms (absolute values) Show forest plot | 1 | | Mean Difference (IV, Fixed, 95% CI) | Totals not selected |
|
| 25.1 Children | 0 | | Mean Difference (IV, Fixed, 95% CI) | 0.0 [0.0, 0.0] |
| 25.2 Adults | 1 | | Mean Difference (IV, Fixed, 95% CI) | 0.0 [0.0, 0.0] |
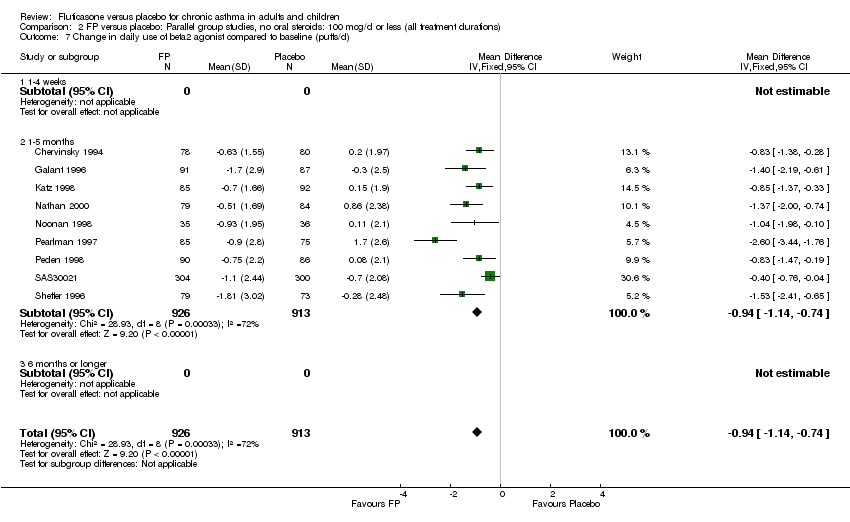
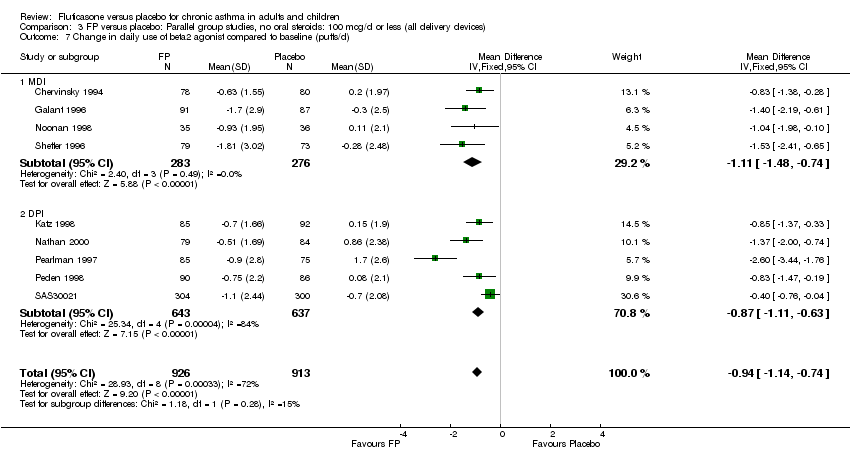
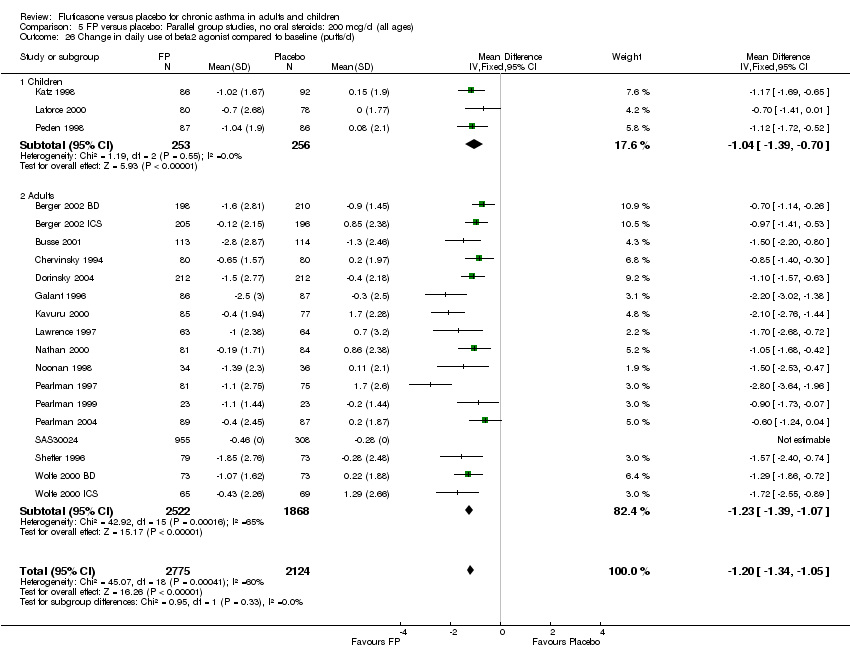
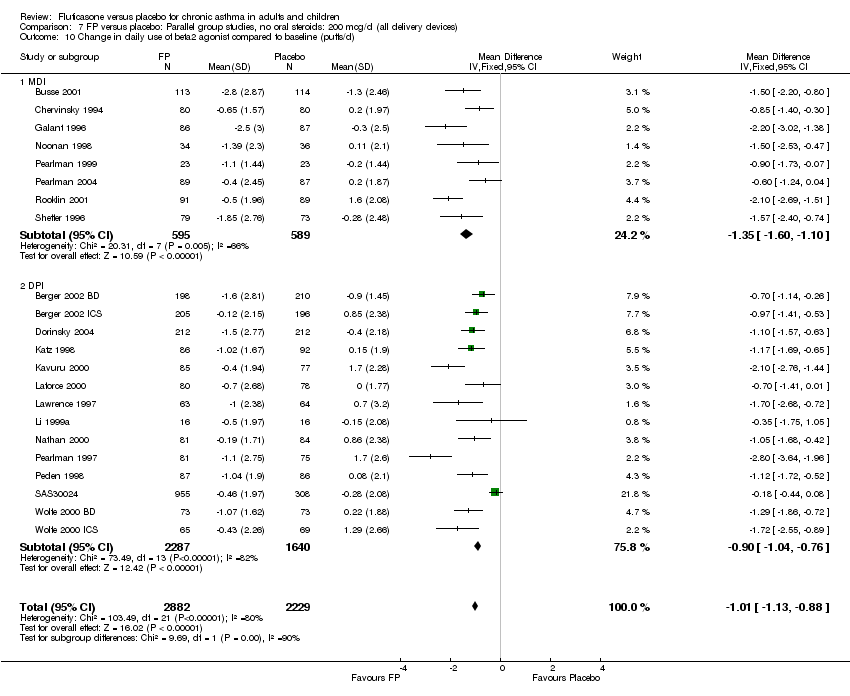
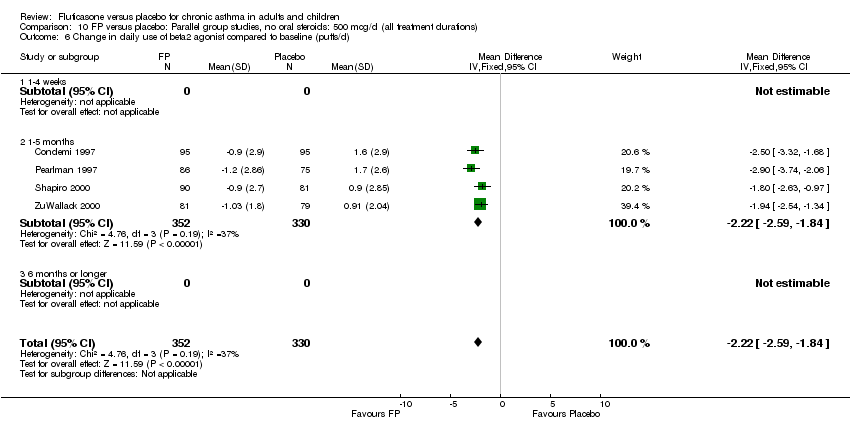
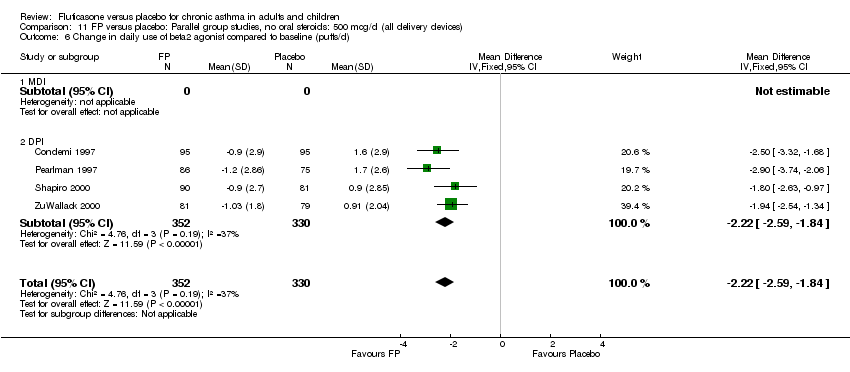
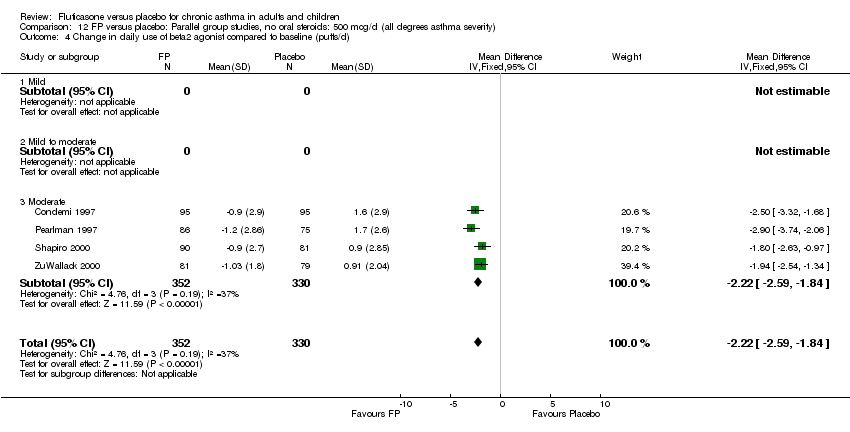
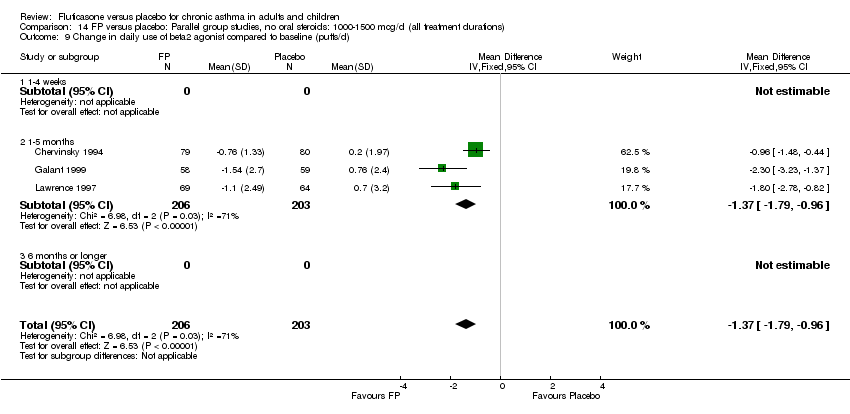
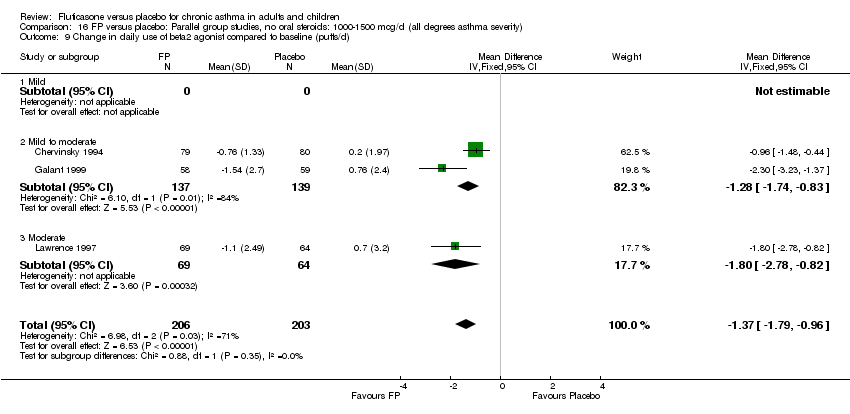
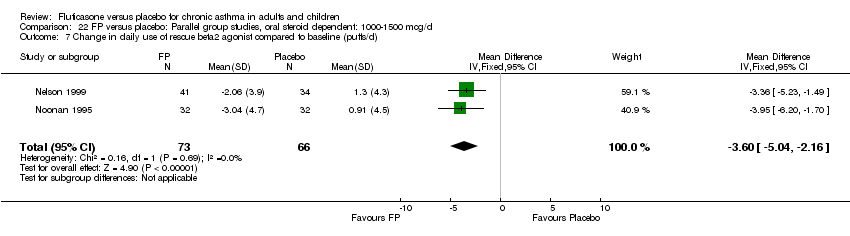
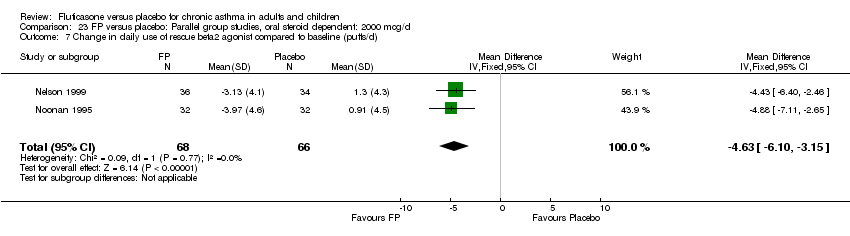
| 26 Change in daily use of beta2 agonist compared to baseline (puffs/d) Show forest plot | 20 | 4899 | Mean Difference (IV, Fixed, 95% CI) | ‐1.20 [‐1.34, ‐1.05] |
|
| 26.1 Children | 3 | 509 | Mean Difference (IV, Fixed, 95% CI) | ‐1.04 [‐1.39, ‐0.70] |
| 26.2 Adults | 17 | 4390 | Mean Difference (IV, Fixed, 95% CI) | ‐1.23 [‐1.39, ‐1.07] |
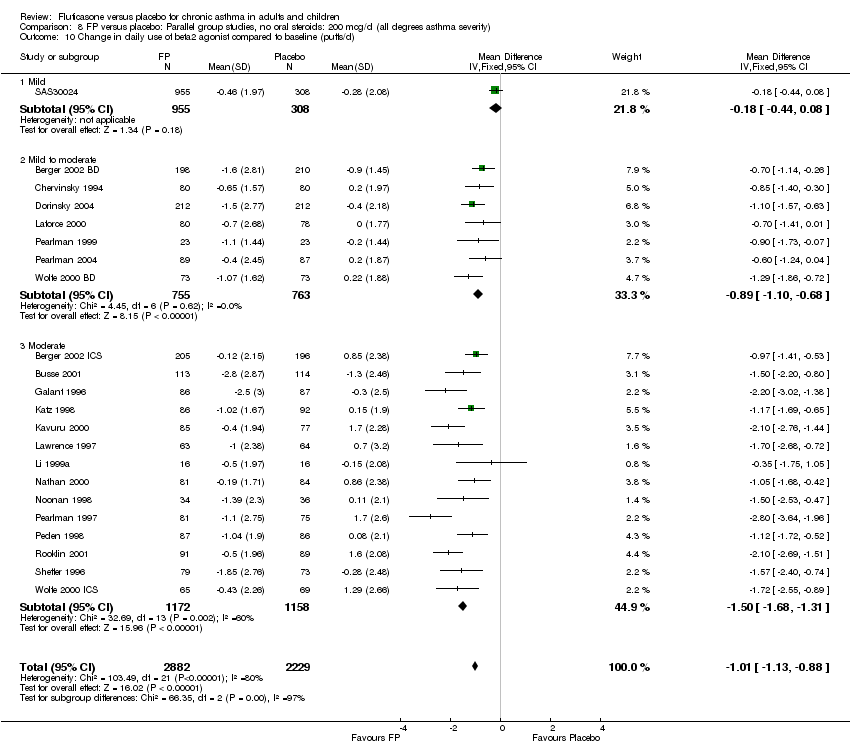
| 27 Change in daily use of beta2 agonist compared to baseline (puffs/d ‐ imputed estimates) Show forest plot | 22 | 5111 | Mean Difference (IV, Fixed, 95% CI) | ‐1.01 [‐1.13, ‐0.88] |
|
| 27.1 Children | 3 | 509 | Mean Difference (IV, Fixed, 95% CI) | ‐1.04 [‐1.39, ‐0.70] |
| 27.2 Adults | 19 | 4602 | Mean Difference (IV, Fixed, 95% CI) | ‐1.00 [‐1.13, ‐0.87] |
| 28 Change from baseline in rescue medication free days (%) Show forest plot | 2 | 809 | Mean Difference (IV, Fixed, 95% CI) | 10.49 [5.48, 15.51] |
|
| 28.1 Children | 0 | 0 | Mean Difference (IV, Fixed, 95% CI) | 0.0 [0.0, 0.0] |
| 28.2 Adults | 2 | 809 | Mean Difference (IV, Fixed, 95% CI) | 10.49 [5.48, 15.51] |
| 29 Rescue medication (absolute scores) Show forest plot | 1 | | Mean Difference (IV, Fixed, 95% CI) | Totals not selected |
|
| 29.1 Children | 0 | | Mean Difference (IV, Fixed, 95% CI) | 0.0 [0.0, 0.0] |
| 29.2 Adults | 1 | | Mean Difference (IV, Fixed, 95% CI) | 0.0 [0.0, 0.0] |
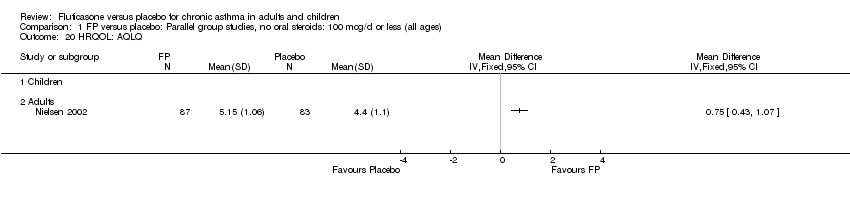
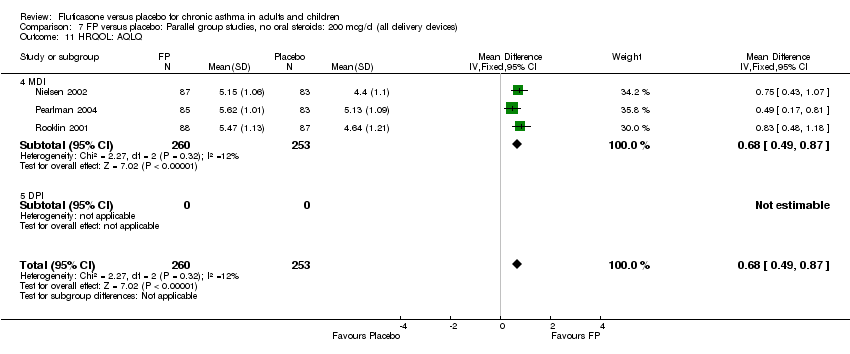
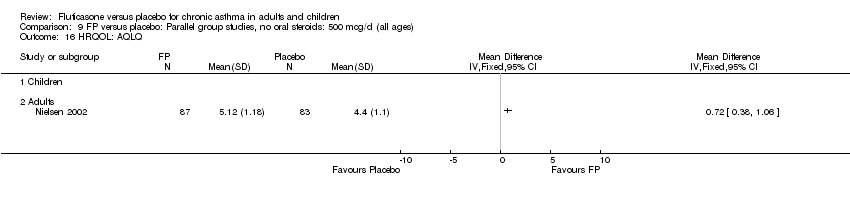
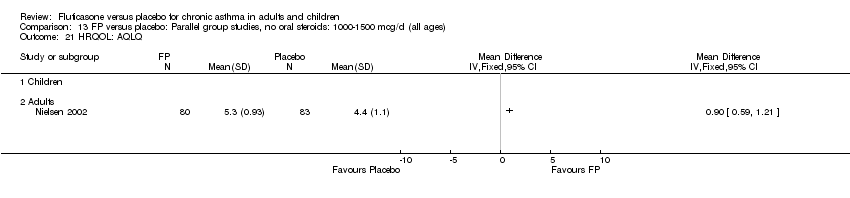
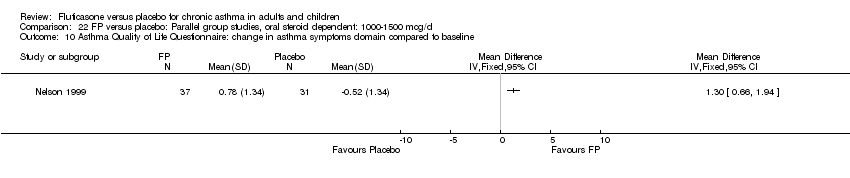
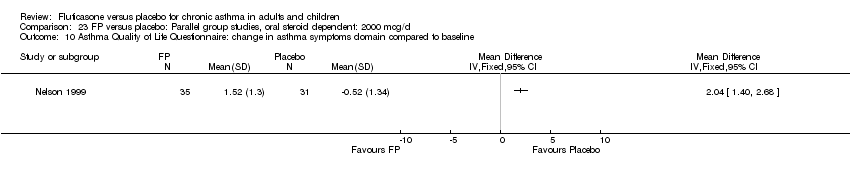
| 30 HRQOL: AQLQ (absolute socres) Show forest plot | 3 | 513 | Mean Difference (IV, Fixed, 95% CI) | 0.68 [0.49, 0.87] |
|
| 30.1 Children | 0 | 0 | Mean Difference (IV, Fixed, 95% CI) | 0.0 [0.0, 0.0] |
| 30.2 Adults | 3 | 513 | Mean Difference (IV, Fixed, 95% CI) | 0.68 [0.49, 0.87] |
| 31 HRQOL: Functional Status IIR questionaire (short version) Show forest plot | 1 | | Mean Difference (IV, Fixed, 95% CI) | Totals not selected |
|
| 31.1 Children | 1 | | Mean Difference (IV, Fixed, 95% CI) | 0.0 [0.0, 0.0] |
| 31.2 Adults | 0 | | Mean Difference (IV, Fixed, 95% CI) | 0.0 [0.0, 0.0] |
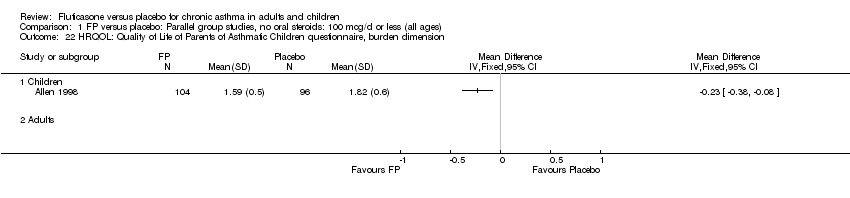
| 32 HRQOL: Quality of Life of Parents of Asthmatic Children questionnaire, burden dimension Show forest plot | 1 | | Mean Difference (IV, Fixed, 95% CI) | Totals not selected |
|
| 32.1 Children | 1 | | Mean Difference (IV, Fixed, 95% CI) | 0.0 [0.0, 0.0] |
| 32.2 Adults | 0 | | Mean Difference (IV, Fixed, 95% CI) | 0.0 [0.0, 0.0] |
| 33 HRQOL: Quality of Life of Parents of Asthmatic Children questionnaire, subjective norms dimension Show forest plot | 1 | | Mean Difference (IV, Fixed, 95% CI) | Totals not selected |
|
| 33.1 Children | 1 | | Mean Difference (IV, Fixed, 95% CI) | 0.0 [0.0, 0.0] |
| 33.2 Adults | 0 | | Mean Difference (IV, Fixed, 95% CI) | 0.0 [0.0, 0.0] |
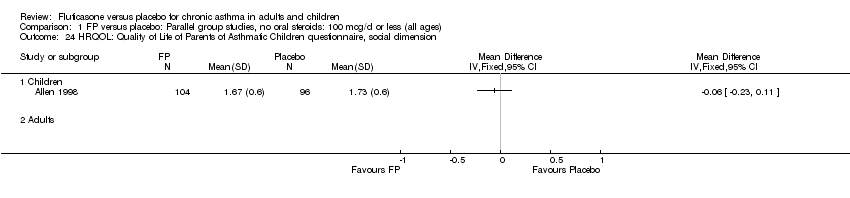
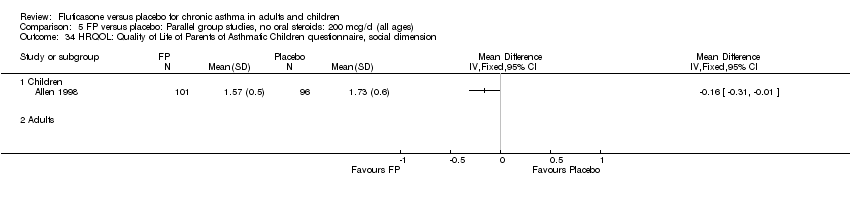
| 34 HRQOL: Quality of Life of Parents of Asthmatic Children questionnaire, social dimension Show forest plot | 1 | | Mean Difference (IV, Fixed, 95% CI) | Totals not selected |
|
| 34.1 Children | 1 | | Mean Difference (IV, Fixed, 95% CI) | 0.0 [0.0, 0.0] |
| 34.2 Adults | 0 | | Mean Difference (IV, Fixed, 95% CI) | 0.0 [0.0, 0.0] |
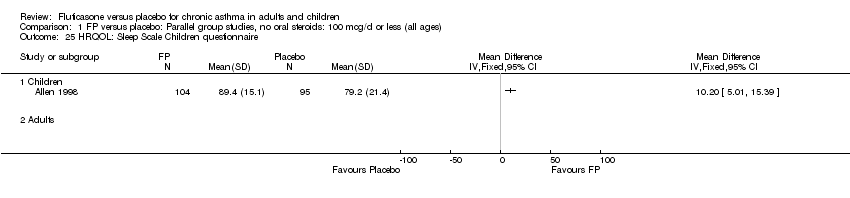
| 35 HRQOL: Sleep Scale Children questionnaire Show forest plot | 1 | | Mean Difference (IV, Fixed, 95% CI) | Totals not selected |
|
| 35.1 Children | 1 | | Mean Difference (IV, Fixed, 95% CI) | 0.0 [0.0, 0.0] |
| 35.2 Adults | 0 | | Mean Difference (IV, Fixed, 95% CI) | 0.0 [0.0, 0.0] |
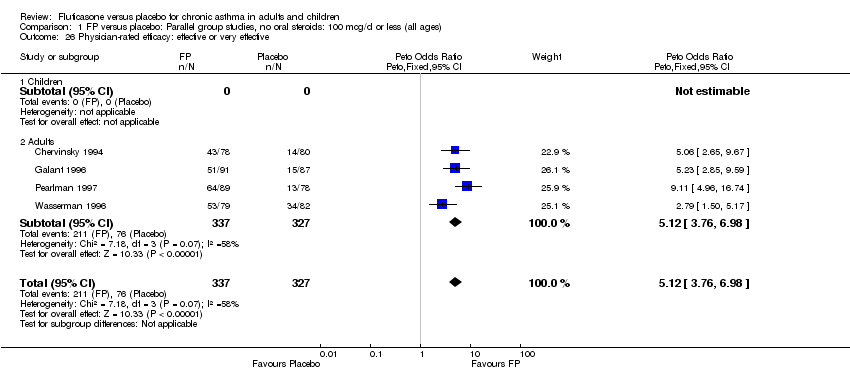
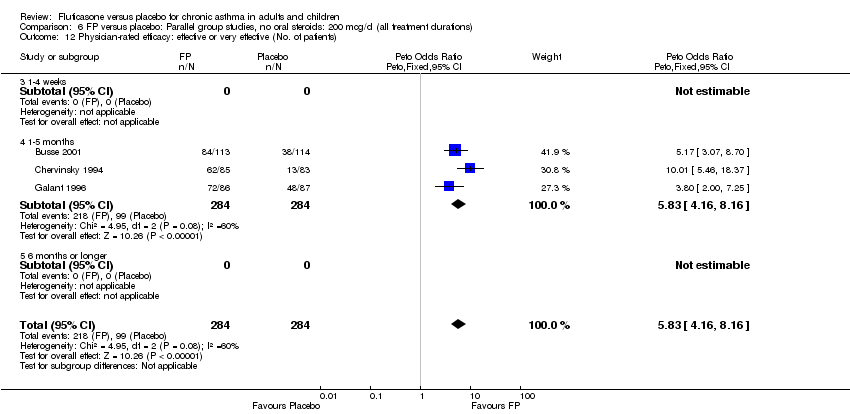
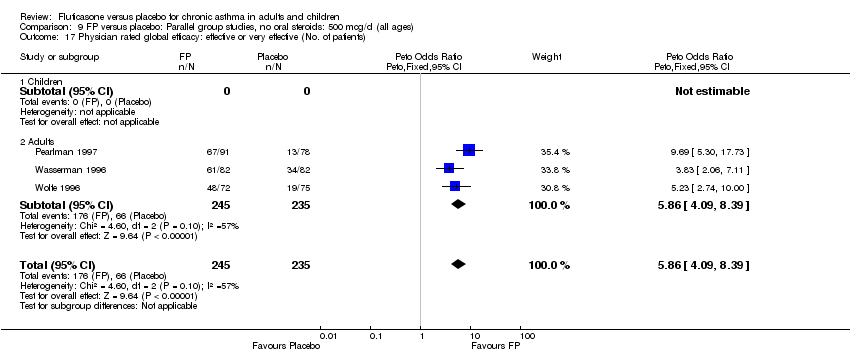
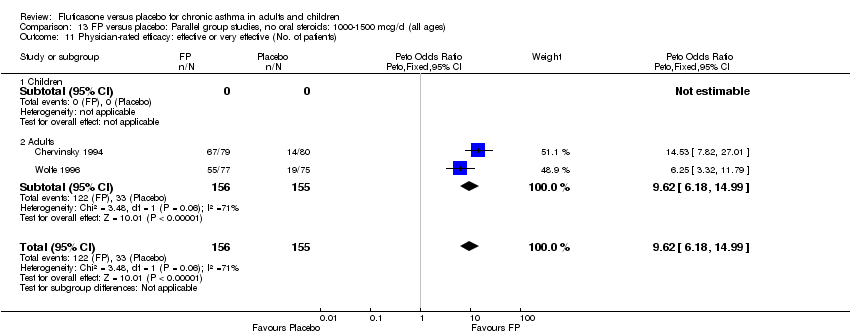
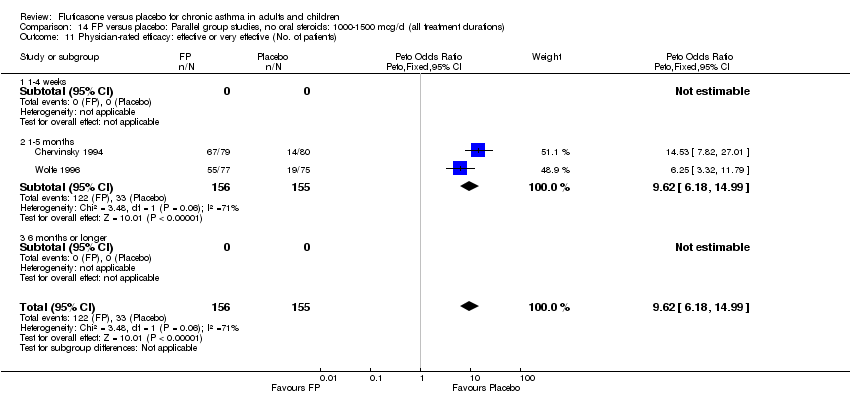
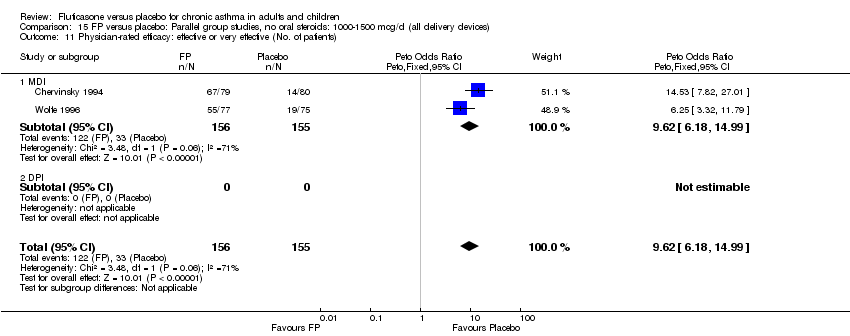
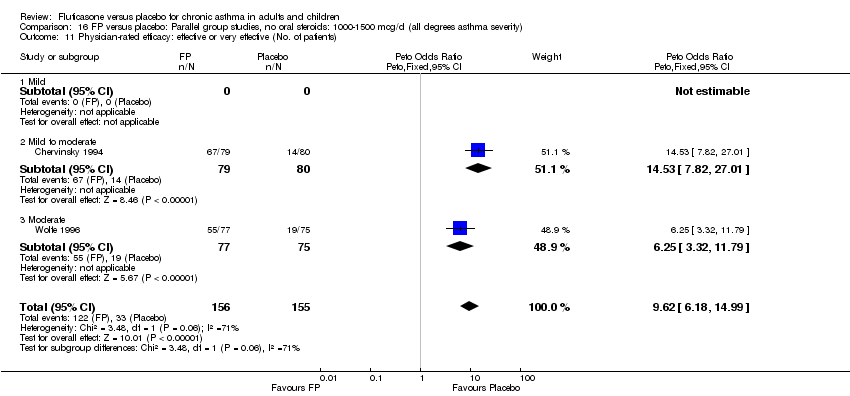
| 36 Physician‐rated efficacy: effective or very effective (No. of patients) Show forest plot | 3 | 568 | Peto Odds Ratio (Peto, Fixed, 95% CI) | 5.83 [4.16, 8.16] |
|
| 36.1 Children | 0 | 0 | Peto Odds Ratio (Peto, Fixed, 95% CI) | 0.0 [0.0, 0.0] |
| 36.2 Adults | 3 | 568 | Peto Odds Ratio (Peto, Fixed, 95% CI) | 5.83 [4.16, 8.16] |
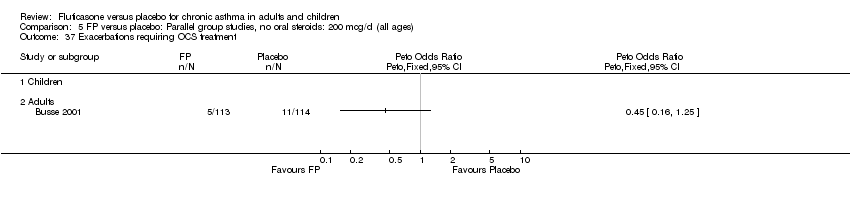
| 37 Exacerbations requiring OCS treatment Show forest plot | 1 | | Peto Odds Ratio (Peto, Fixed, 95% CI) | Totals not selected |
|
| 37.1 Children | 0 | | Peto Odds Ratio (Peto, Fixed, 95% CI) | 0.0 [0.0, 0.0] |
| 37.2 Adults | 1 | | Peto Odds Ratio (Peto, Fixed, 95% CI) | 0.0 [0.0, 0.0] |
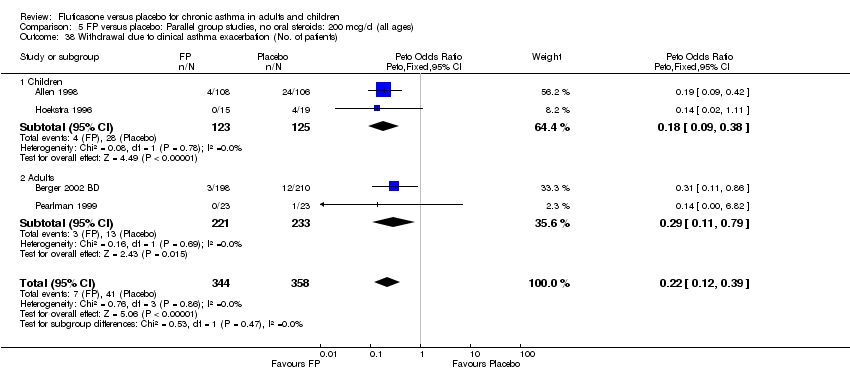
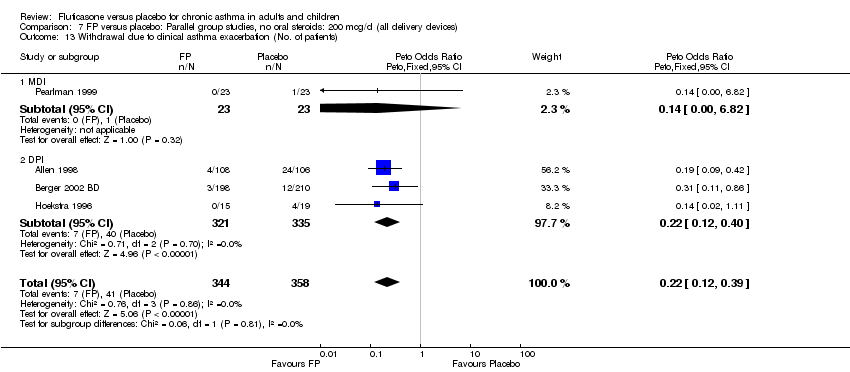
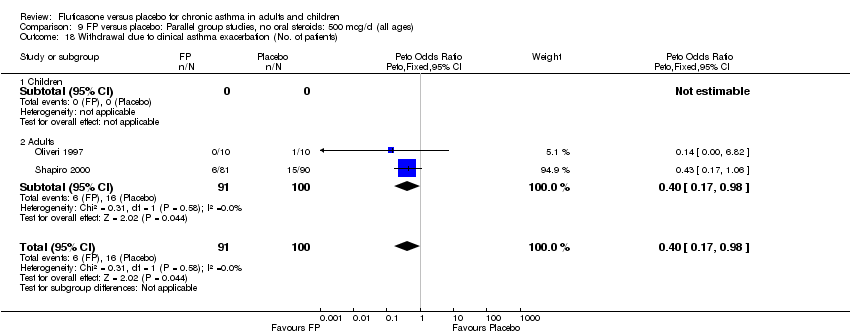
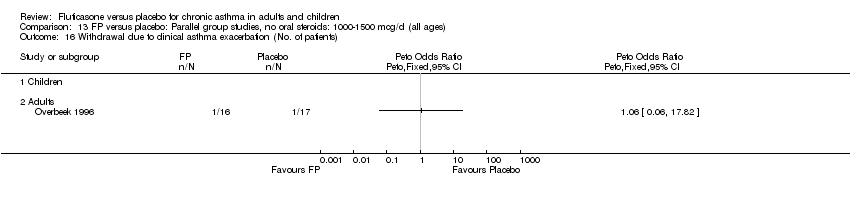
| 38 Withdrawal due to clinical asthma exacerbation (No. of patients) Show forest plot | 4 | 702 | Peto Odds Ratio (Peto, Fixed, 95% CI) | 0.22 [0.12, 0.39] |
|
| 38.1 Children | 2 | 248 | Peto Odds Ratio (Peto, Fixed, 95% CI) | 0.18 [0.09, 0.38] |
| 38.2 Adults | 2 | 454 | Peto Odds Ratio (Peto, Fixed, 95% CI) | 0.29 [0.11, 0.79] |
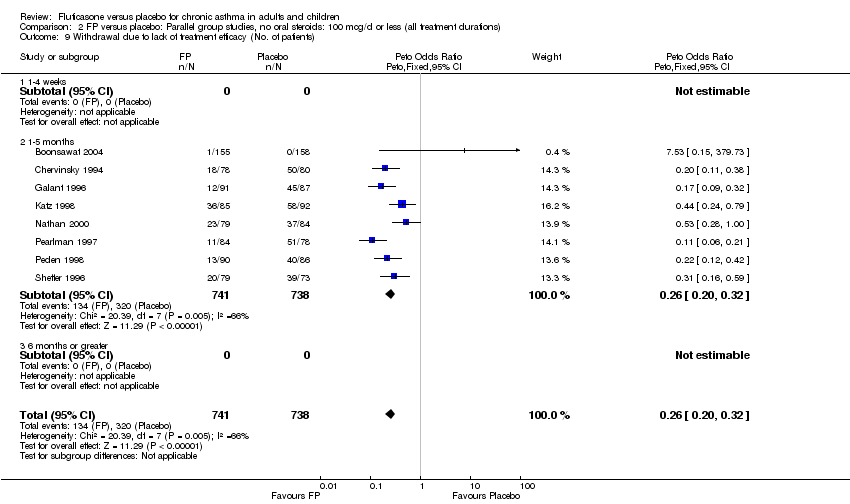
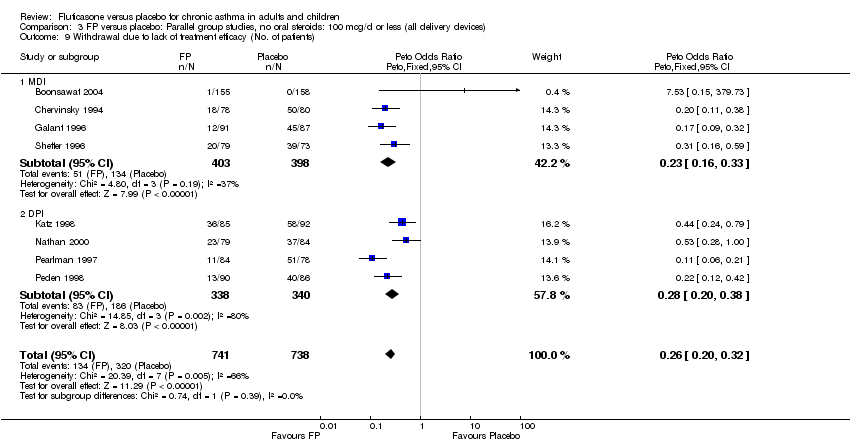
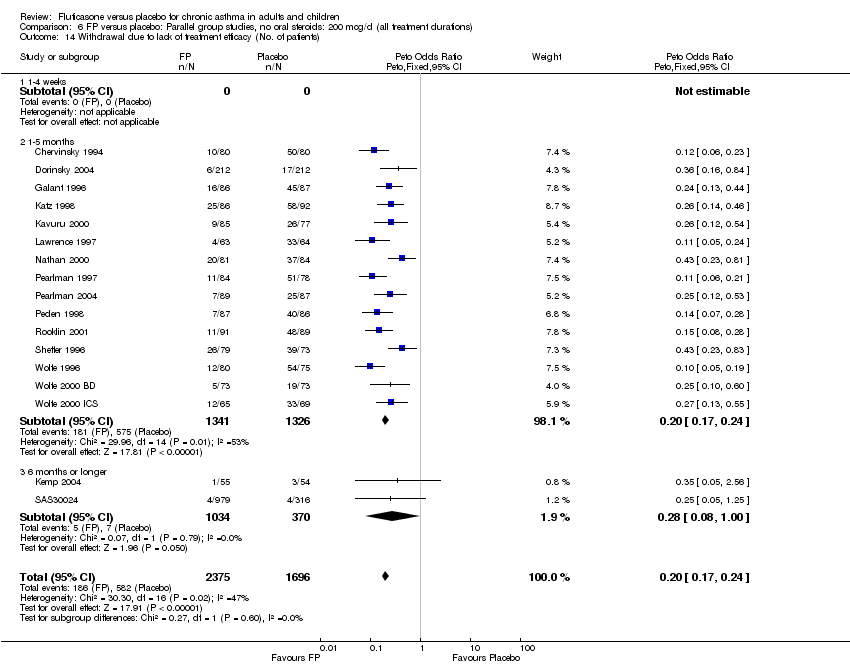
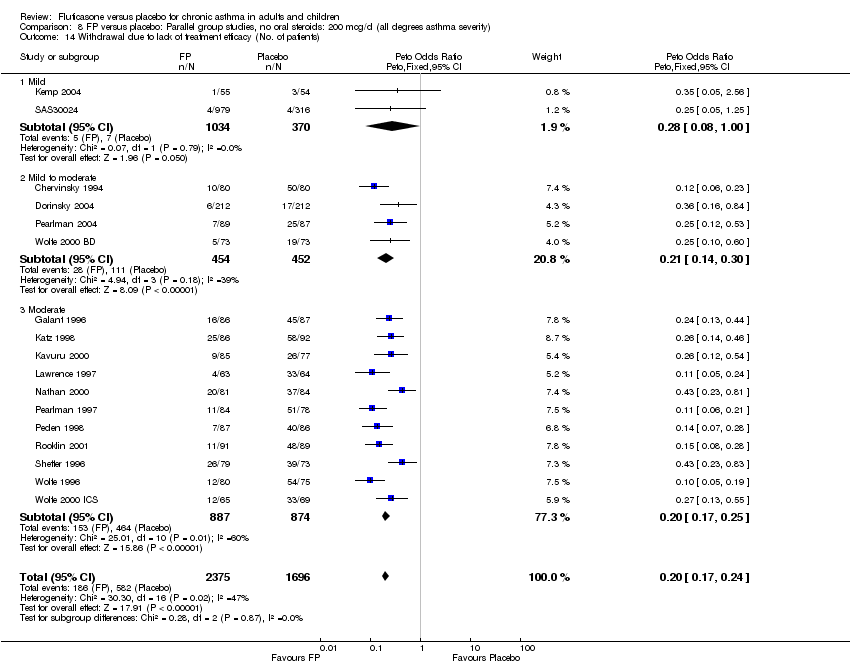
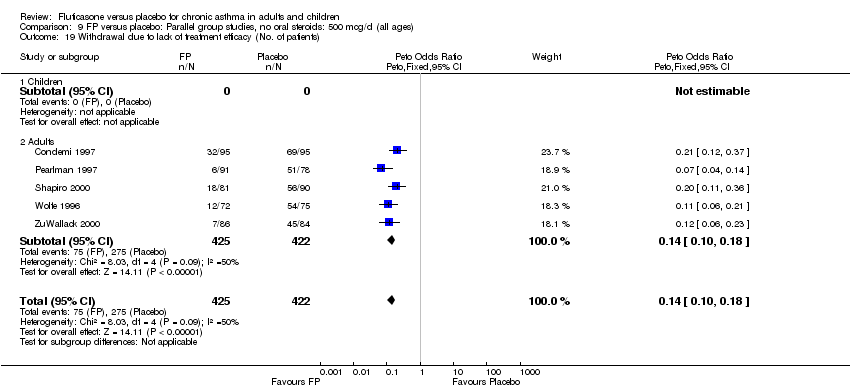
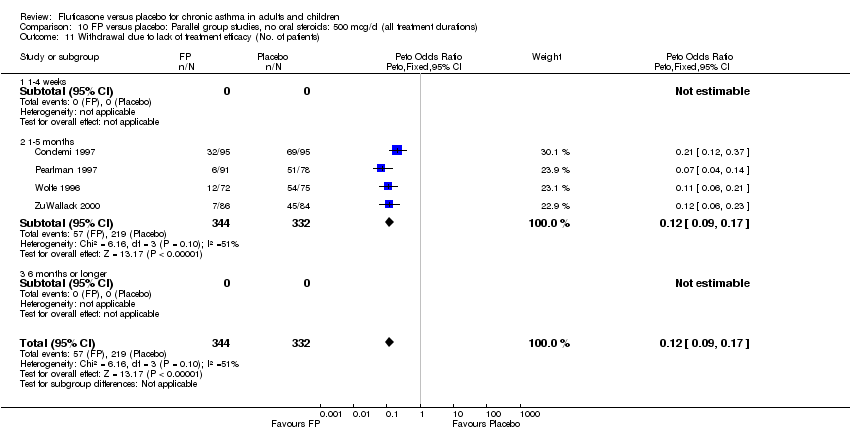
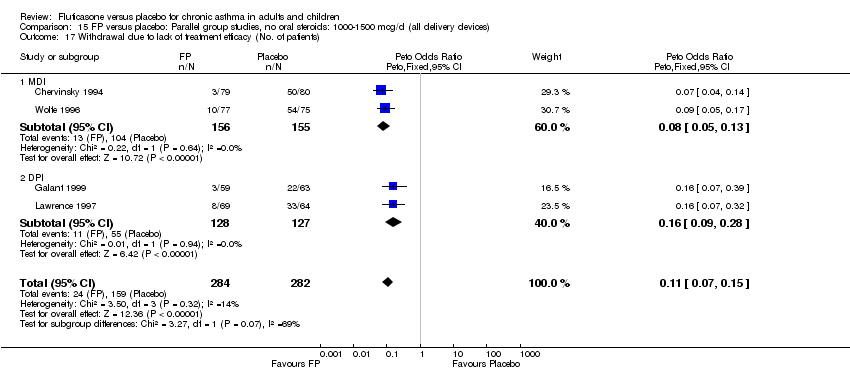
| 39 Withdrawal due to lack of treatment efficacy (No. of patients) Show forest plot | 17 | 4071 | Peto Odds Ratio (Peto, Fixed, 95% CI) | 0.20 [0.17, 0.24] |
|
| 39.1 Children | 2 | 351 | Peto Odds Ratio (Peto, Fixed, 95% CI) | 0.20 [0.13, 0.31] |
| 39.2 Adults | 15 | 3720 | Peto Odds Ratio (Peto, Fixed, 95% CI) | 0.21 [0.17, 0.25] |
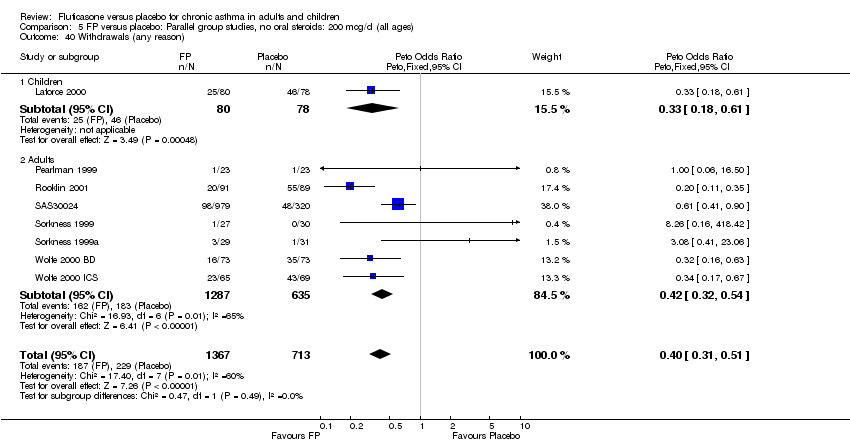
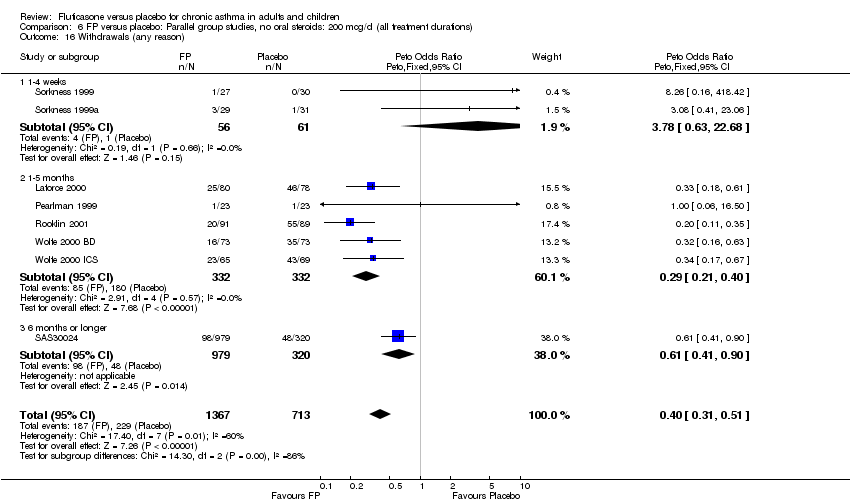
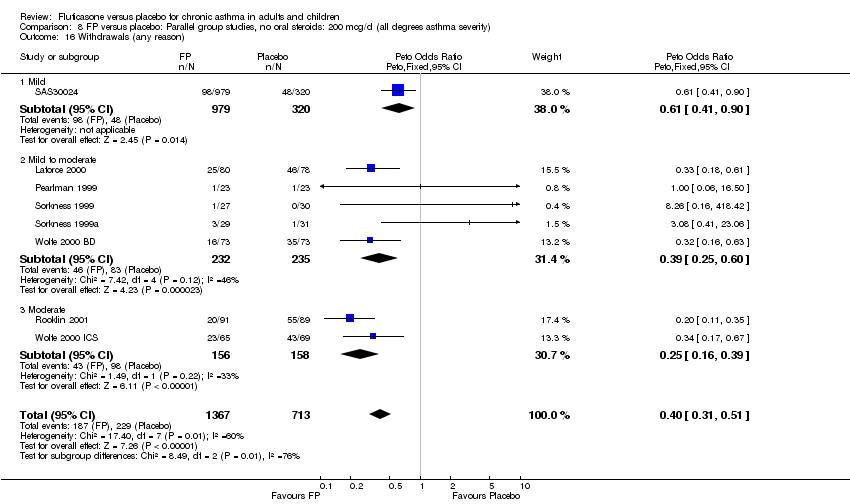
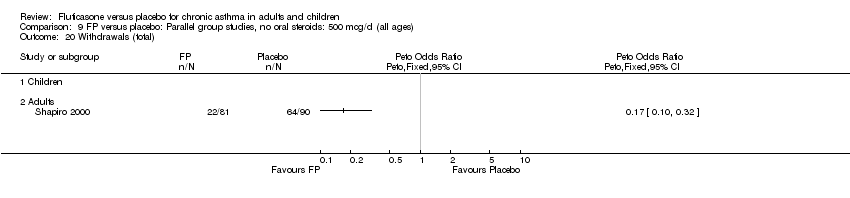
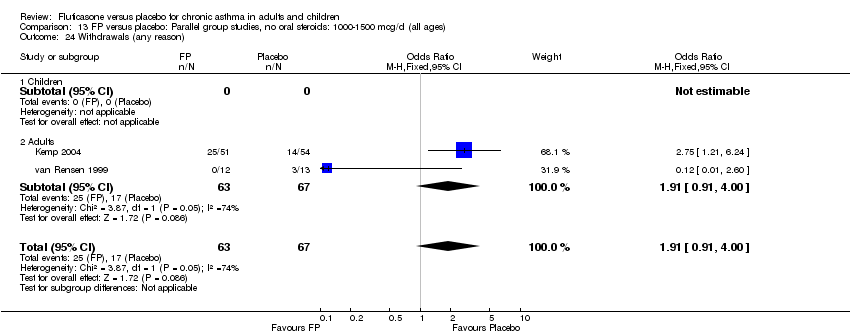
| 40 Withdrawals (any reason) Show forest plot | 8 | 2080 | Peto Odds Ratio (Peto, Fixed, 95% CI) | 0.40 [0.31, 0.51] |
|
| 40.1 Children | 1 | 158 | Peto Odds Ratio (Peto, Fixed, 95% CI) | 0.33 [0.18, 0.61] |
| 40.2 Adults | 7 | 1922 | Peto Odds Ratio (Peto, Fixed, 95% CI) | 0.42 [0.32, 0.54] |
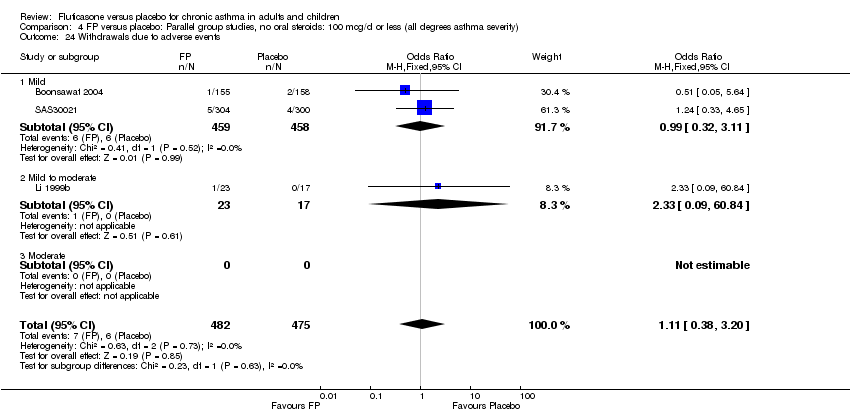
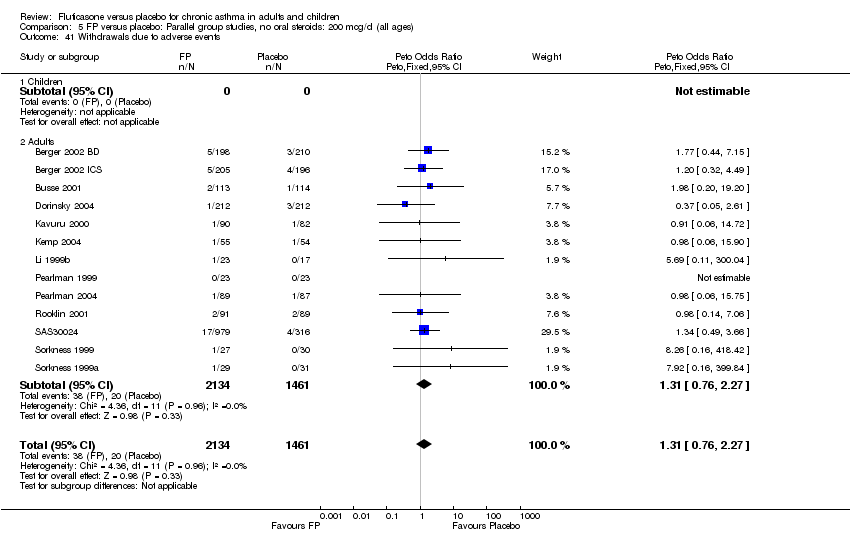
| 41 Withdrawals due to adverse events Show forest plot | 13 | 3595 | Peto Odds Ratio (Peto, Fixed, 95% CI) | 1.31 [0.76, 2.27] |
|
| 41.1 Children | 0 | 0 | Peto Odds Ratio (Peto, Fixed, 95% CI) | 0.0 [0.0, 0.0] |
| 41.2 Adults | 13 | 3595 | Peto Odds Ratio (Peto, Fixed, 95% CI) | 1.31 [0.76, 2.27] |
| 42 Adverse events (any) Show forest plot | 4 | 884 | Odds Ratio (M‐H, Fixed, 95% CI) | 1.13 [0.84, 1.52] |
|
| 42.1 Children | 0 | 0 | Odds Ratio (M‐H, Fixed, 95% CI) | 0.0 [0.0, 0.0] |
| 42.2 Adults | 4 | 884 | Odds Ratio (M‐H, Fixed, 95% CI) | 1.13 [0.84, 1.52] |
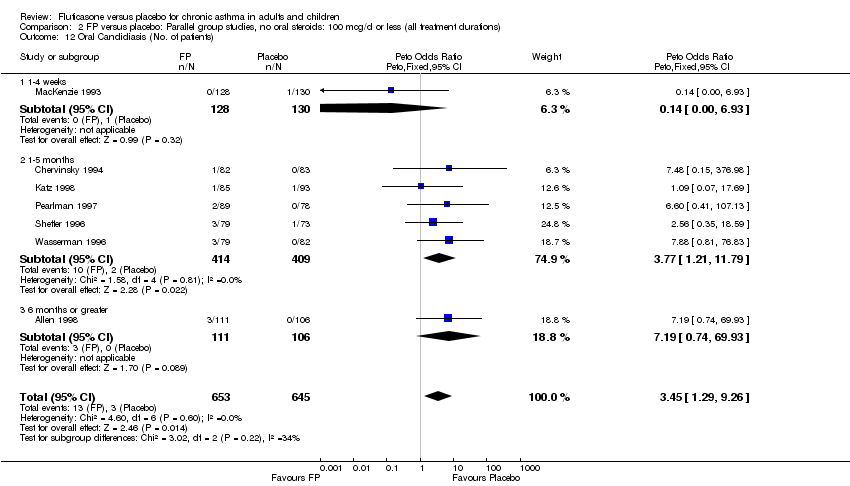
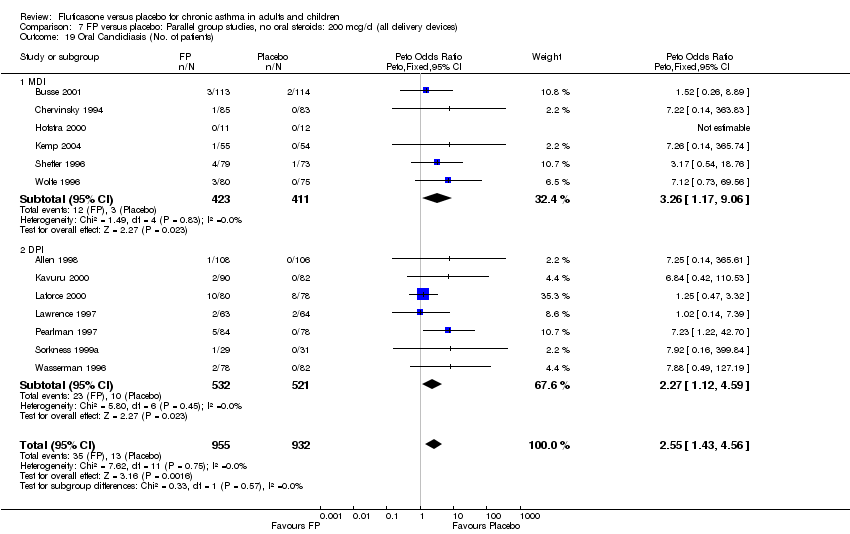
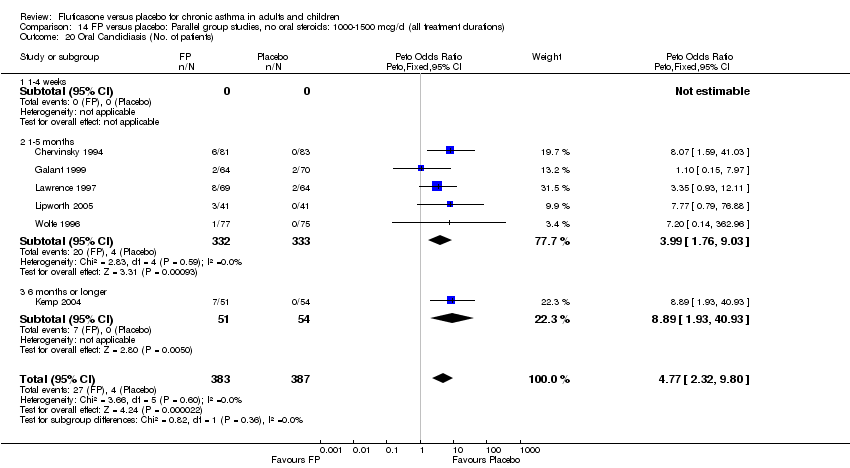
| 43 Oral Candidiasis (No. of patients) Show forest plot | 13 | 1887 | Peto Odds Ratio (Peto, Fixed, 95% CI) | 2.55 [1.43, 4.56] |
|
| 43.1 Children | 3 | 395 | Peto Odds Ratio (Peto, Fixed, 95% CI) | 1.38 [0.54, 3.57] |
| 43.2 Adults | 10 | 1492 | Peto Odds Ratio (Peto, Fixed, 95% CI) | 3.68 [1.76, 7.67] |
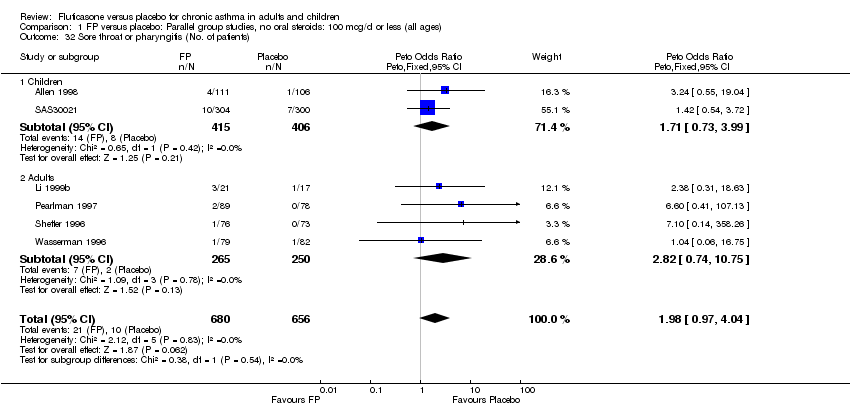
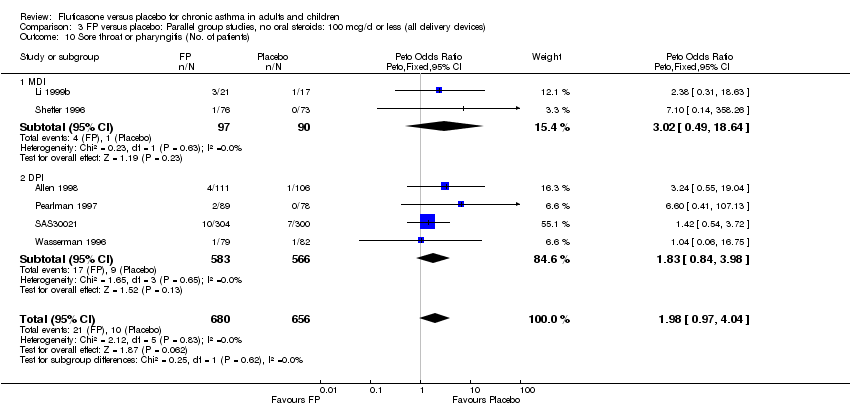
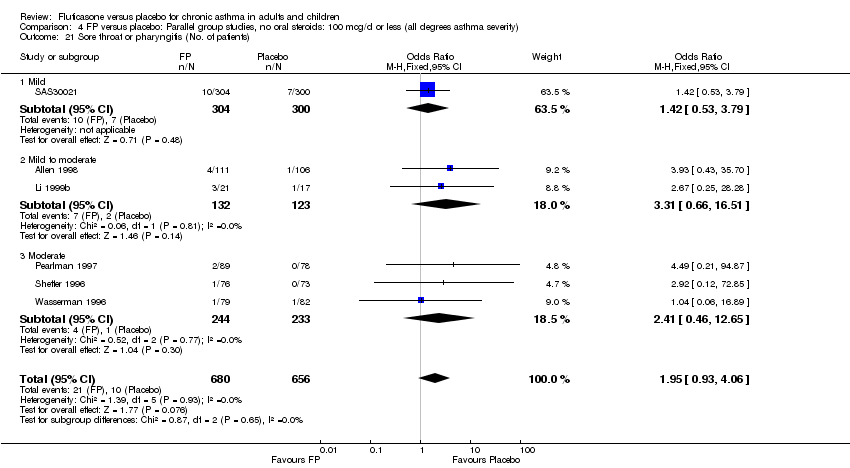
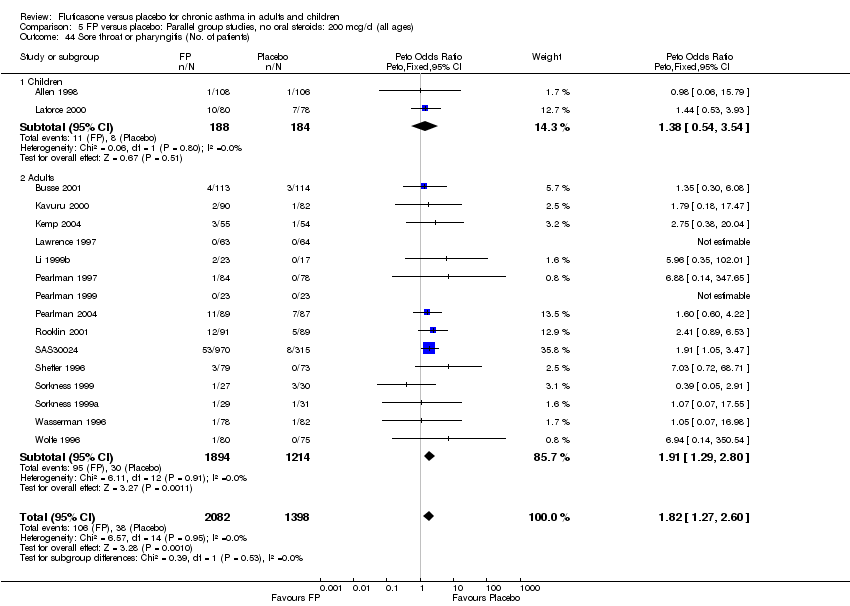
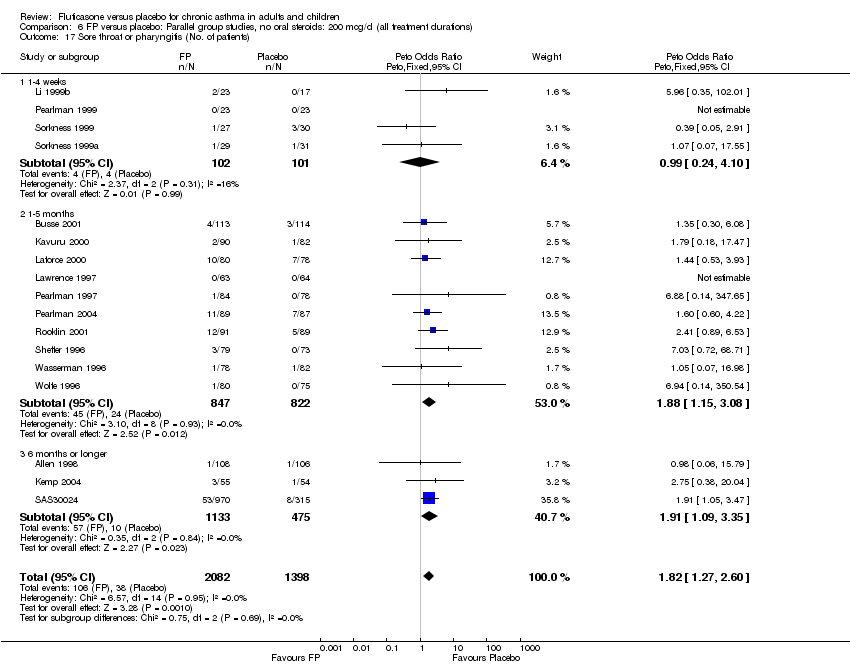
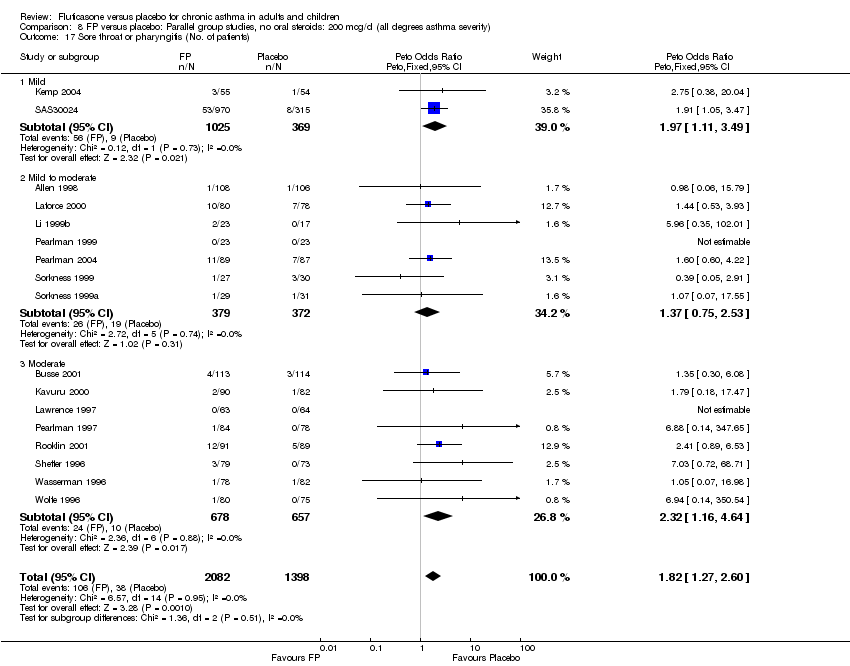
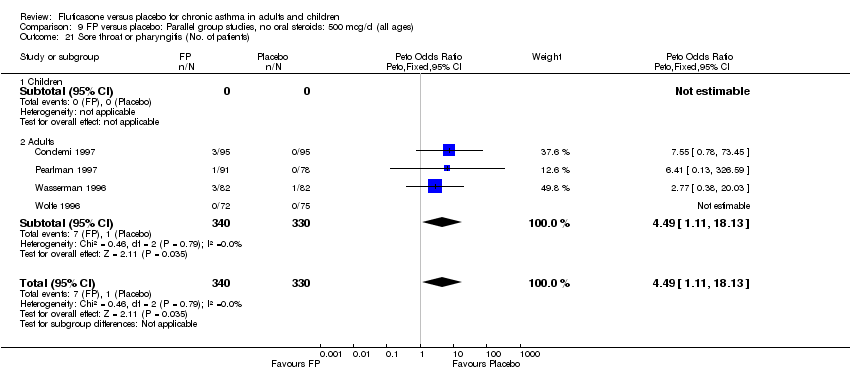
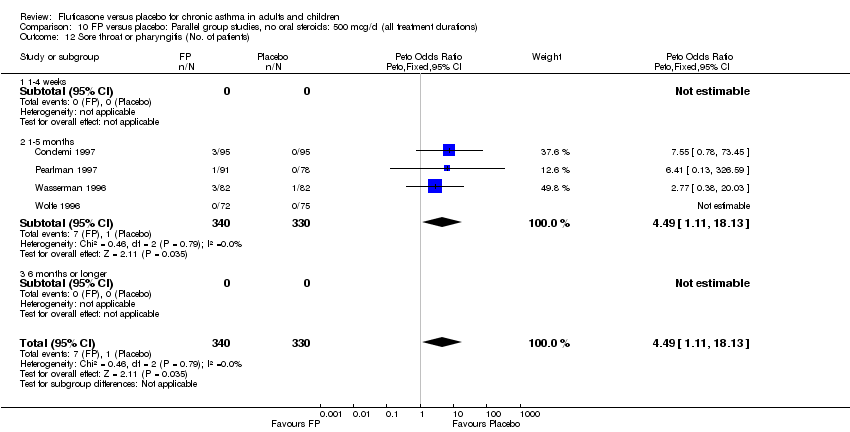
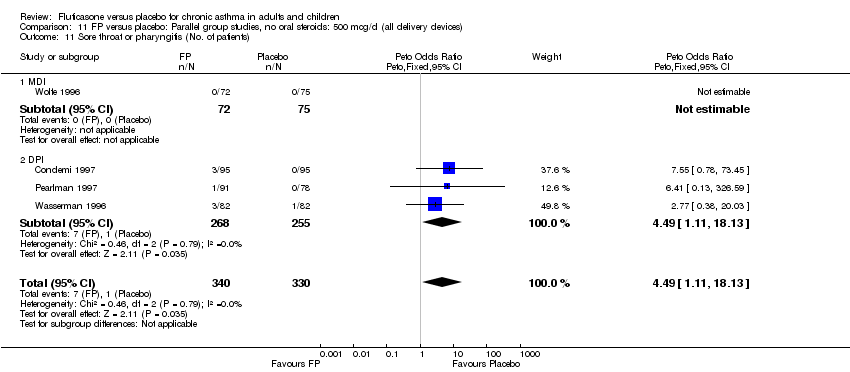
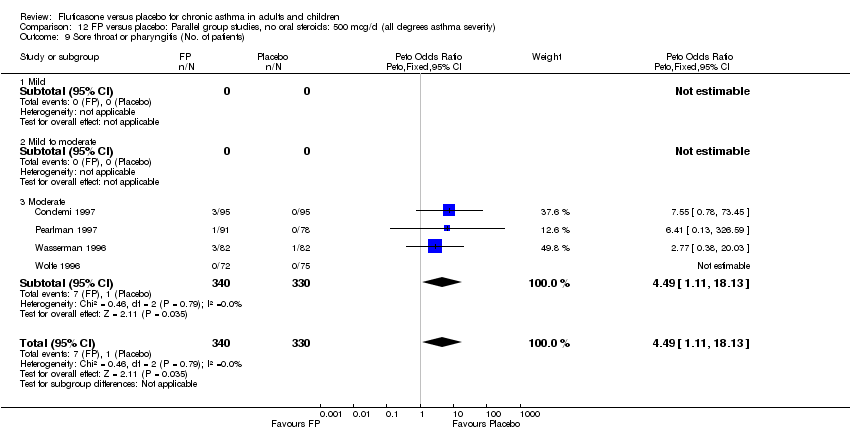
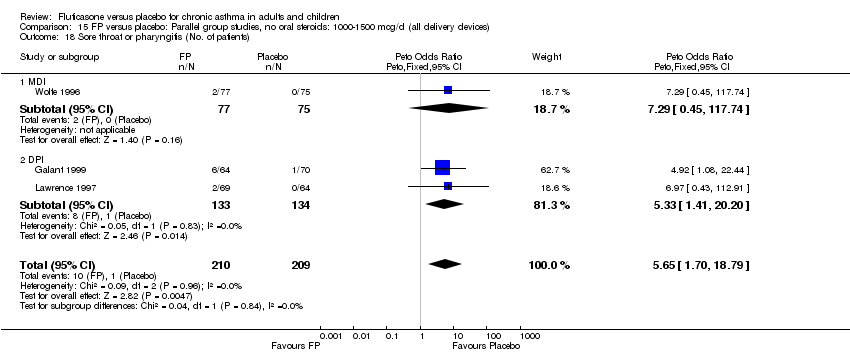
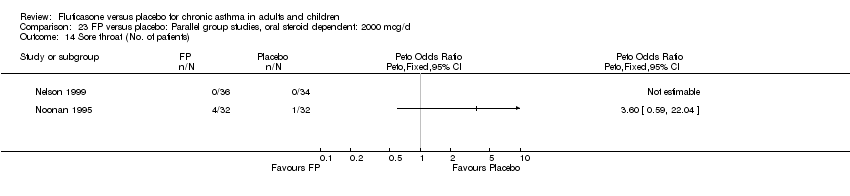
| 44 Sore throat or pharyngitis (No. of patients) Show forest plot | 17 | 3480 | Peto Odds Ratio (Peto, Fixed, 95% CI) | 1.82 [1.27, 2.60] |
|
| 44.1 Children | 2 | 372 | Peto Odds Ratio (Peto, Fixed, 95% CI) | 1.38 [0.54, 3.54] |
| 44.2 Adults | 15 | 3108 | Peto Odds Ratio (Peto, Fixed, 95% CI) | 1.91 [1.29, 2.80] |
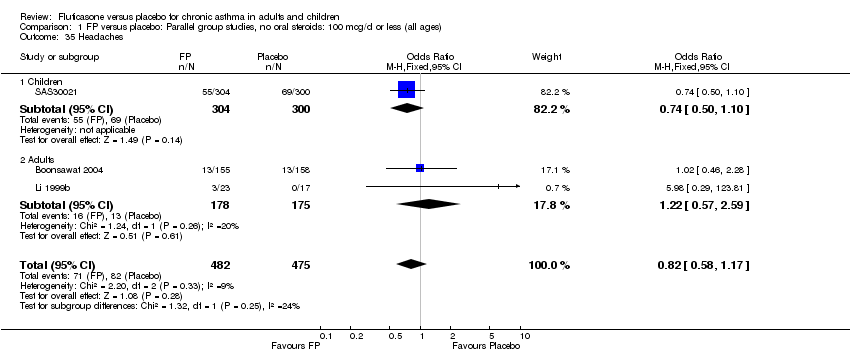
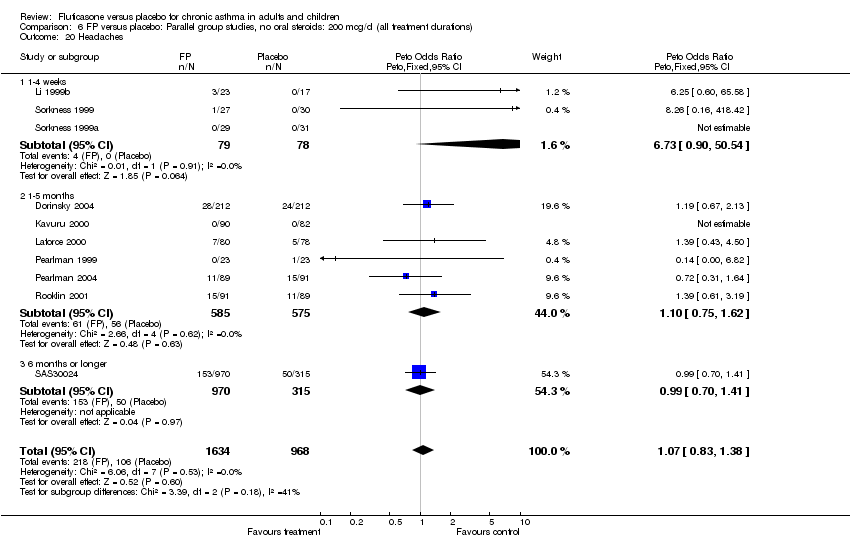
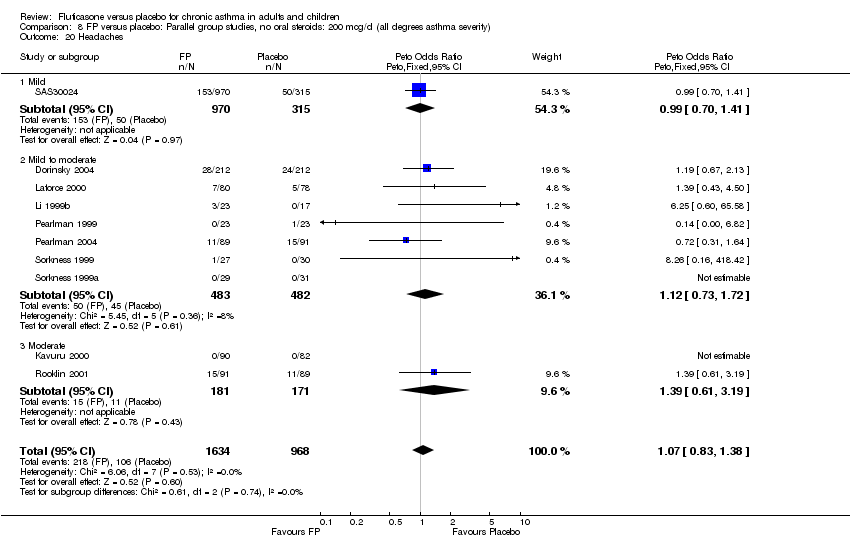
| 45 Headaches Show forest plot | 10 | 2602 | Peto Odds Ratio (Peto, Fixed, 95% CI) | 1.07 [0.83, 1.38] |
|
| 45.1 Children | 1 | 158 | Peto Odds Ratio (Peto, Fixed, 95% CI) | 1.39 [0.43, 4.50] |
| 45.2 Adults | 9 | 2444 | Peto Odds Ratio (Peto, Fixed, 95% CI) | 1.06 [0.81, 1.37] |
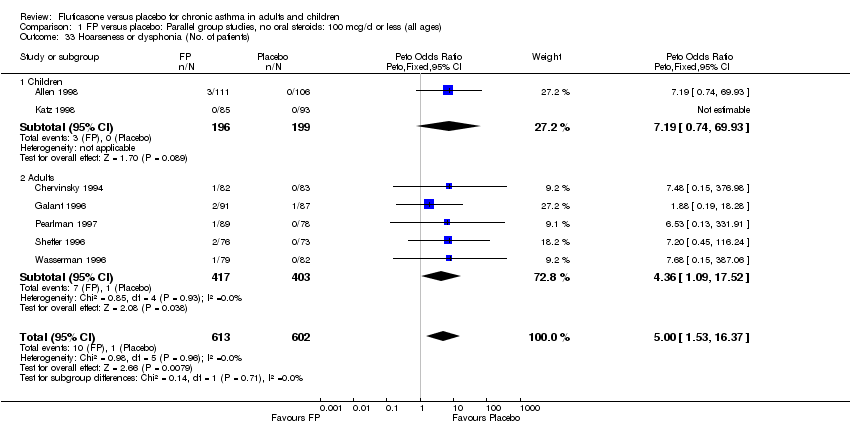
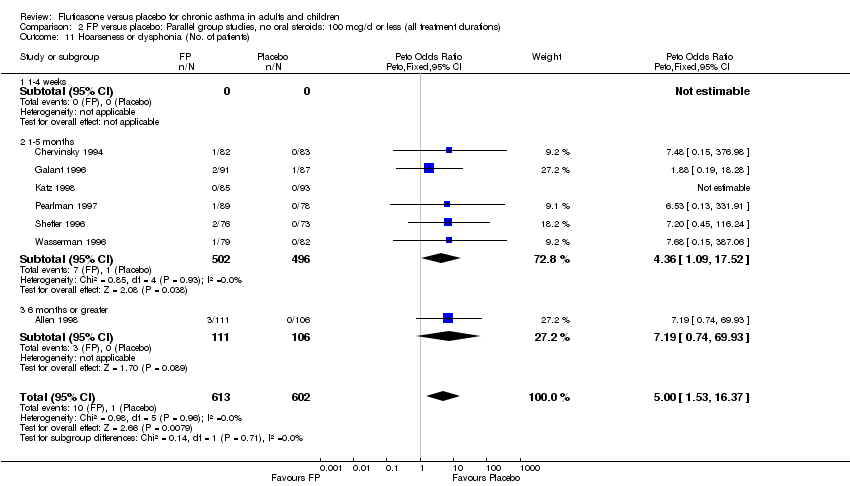
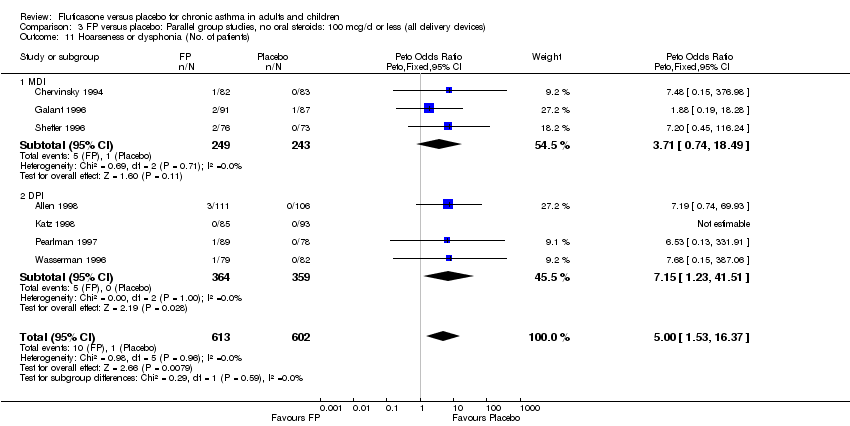
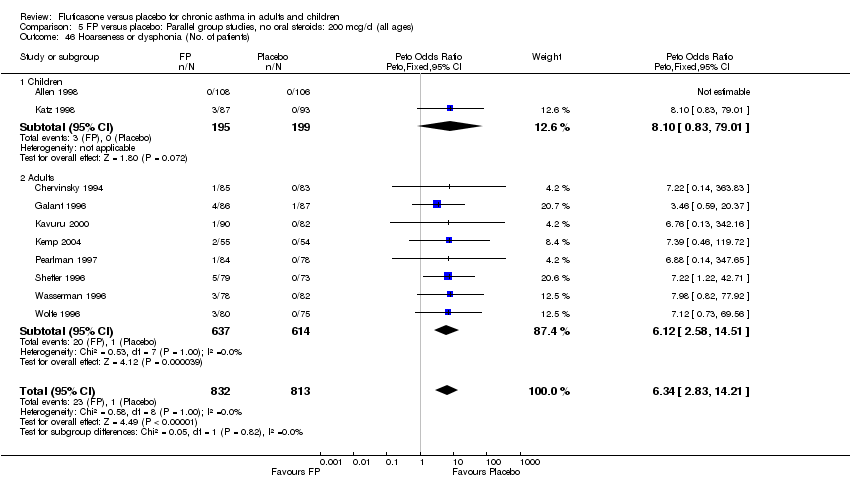
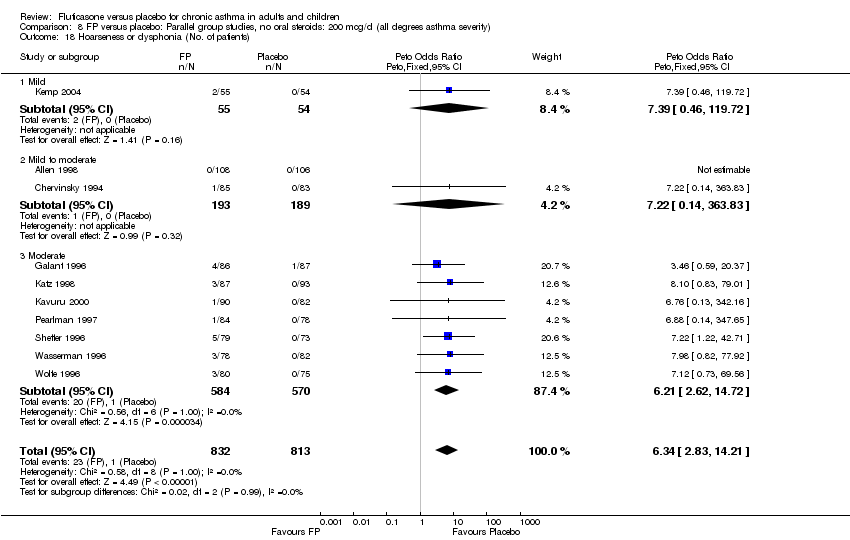
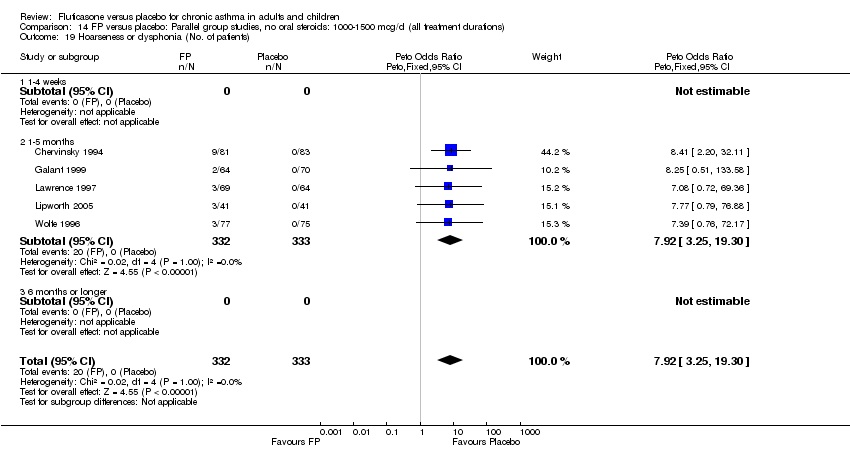
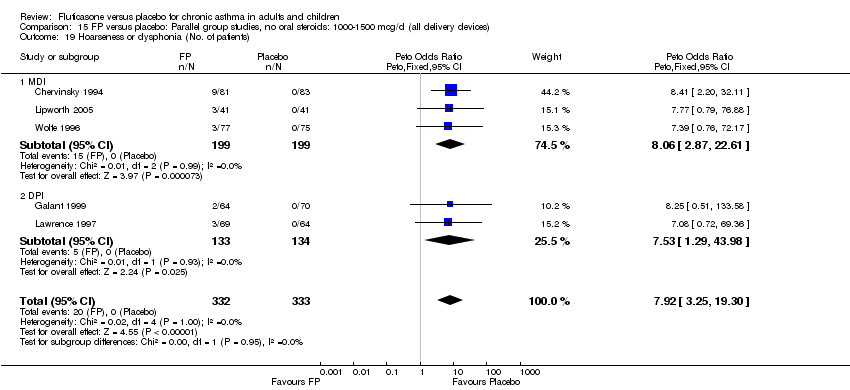
| 46 Hoarseness or dysphonia (No. of patients) Show forest plot | 10 | 1645 | Peto Odds Ratio (Peto, Fixed, 95% CI) | 6.34 [2.83, 14.21] |
|
| 46.1 Children | 2 | 394 | Peto Odds Ratio (Peto, Fixed, 95% CI) | 8.10 [0.83, 79.01] |
| 46.2 Adults | 8 | 1251 | Peto Odds Ratio (Peto, Fixed, 95% CI) | 6.12 [2.58, 14.51] |
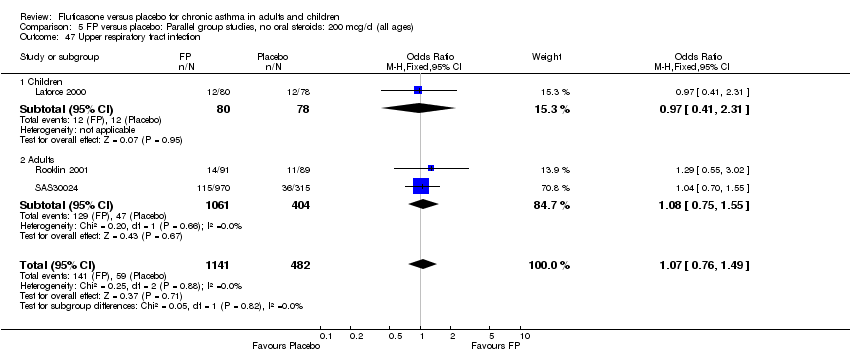
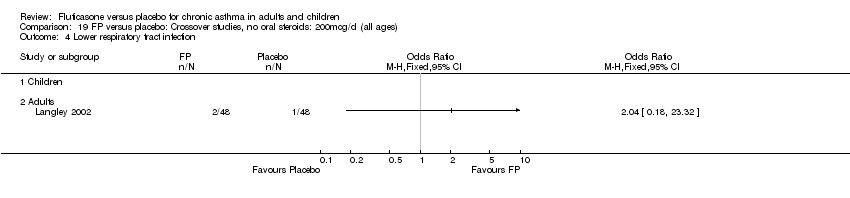
| 47 Upper respiratory tract infection Show forest plot | 3 | 1623 | Odds Ratio (M‐H, Fixed, 95% CI) | 1.07 [0.76, 1.49] |
|
| 47.1 Children | 1 | 158 | Odds Ratio (M‐H, Fixed, 95% CI) | 0.97 [0.41, 2.31] |
| 47.2 Adults | 2 | 1465 | Odds Ratio (M‐H, Fixed, 95% CI) | 1.08 [0.75, 1.55] |
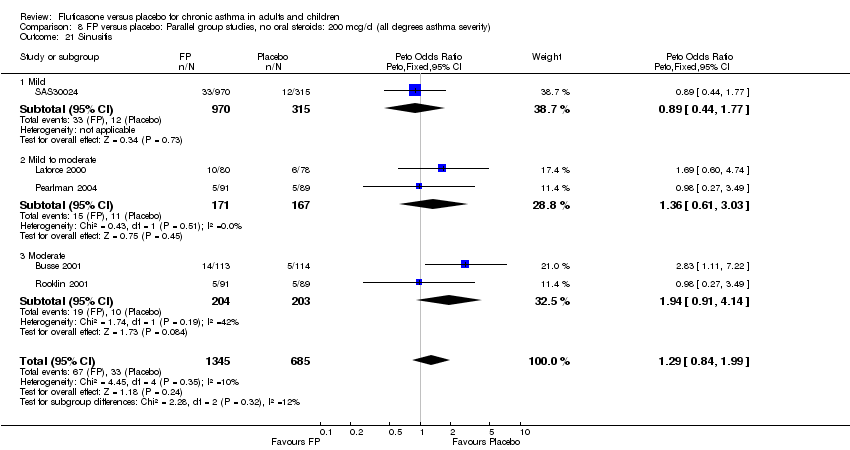
| 48 Sinusitis Show forest plot | 5 | 2030 | Peto Odds Ratio (Peto, Fixed, 95% CI) | 1.29 [0.84, 1.99] |
|
| 48.1 Children | 1 | 158 | Peto Odds Ratio (Peto, Fixed, 95% CI) | 1.69 [0.60, 4.74] |
| 48.2 Adults | 4 | 1872 | Peto Odds Ratio (Peto, Fixed, 95% CI) | 1.22 [0.76, 1.96] |
| 49 Total urinary free cortisol excretion (mcg/24 hours) Show forest plot | 1 | | Mean Difference (IV, Fixed, 95% CI) | Totals not selected |
|
| 49.1 Children | 1 | | Mean Difference (IV, Fixed, 95% CI) | 0.0 [0.0, 0.0] |
| 49.2 Adults | 0 | | Mean Difference (IV, Fixed, 95% CI) | 0.0 [0.0, 0.0] |
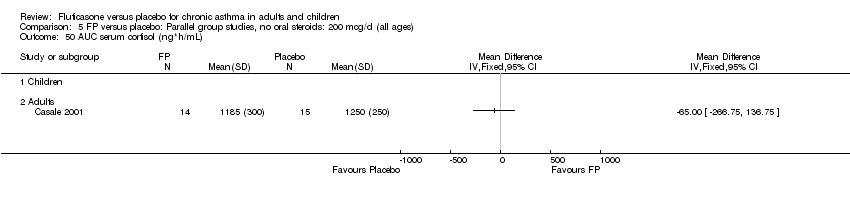
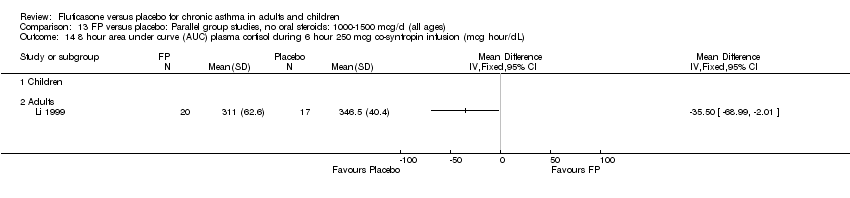
| 50 AUC serum cortisol (ng*h/mL) Show forest plot | 1 | | Mean Difference (IV, Fixed, 95% CI) | Totals not selected |
|
| 50.1 Children | 0 | | Mean Difference (IV, Fixed, 95% CI) | 0.0 [0.0, 0.0] |
| 50.2 Adults | 1 | | Mean Difference (IV, Fixed, 95% CI) | 0.0 [0.0, 0.0] |
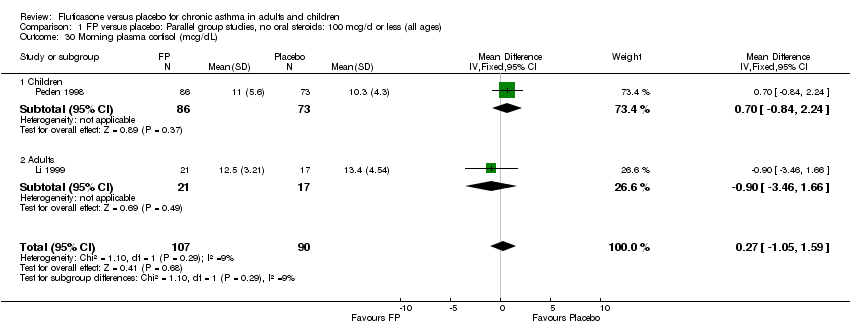
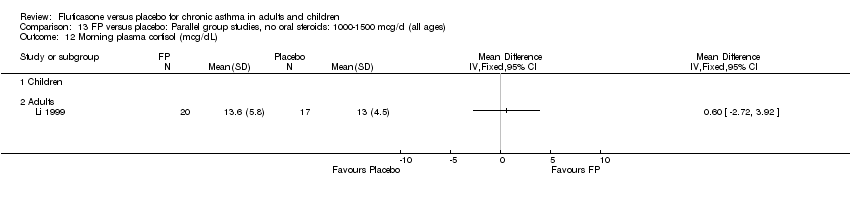
| 51 Morning plasma cortisol (mcg/dL) Show forest plot | 2 | 194 | Mean Difference (IV, Fixed, 95% CI) | 0.00 [‐1.33, 1.33] |
|
| 51.1 Children | 1 | 154 | Mean Difference (IV, Fixed, 95% CI) | 0.30 [‐1.23, 1.83] |
| 51.2 Adults | 1 | 40 | Mean Difference (IV, Fixed, 95% CI) | ‐0.90 [‐3.57, 1.77] |
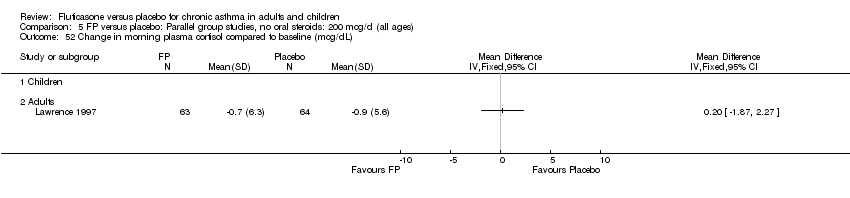
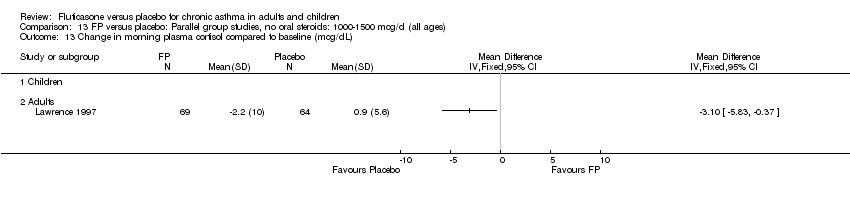
| 52 Change in morning plasma cortisol compared to baseline (mcg/dL) Show forest plot | 1 | | Mean Difference (IV, Fixed, 95% CI) | Totals not selected |
|
| 52.1 Children | 0 | | Mean Difference (IV, Fixed, 95% CI) | 0.0 [0.0, 0.0] |
| 52.2 Adults | 1 | | Mean Difference (IV, Fixed, 95% CI) | 0.0 [0.0, 0.0] |
| 53 Change in peak plasma cortisol expression (mcg/dL) Show forest plot | 2 | 117 | Mean Difference (IV, Fixed, 95% CI) | ‐0.60 [‐2.56, 1.36] |
|
| 53.1 Children | 0 | 0 | Mean Difference (IV, Fixed, 95% CI) | 0.0 [0.0, 0.0] |
| 53.2 Adults | 2 | 117 | Mean Difference (IV, Fixed, 95% CI) | ‐0.60 [‐2.56, 1.36] |