Fluticasone versus placebo for chronic asthma in adults and children
Referencias
References to studies included in this review
References to studies excluded from this review
References to studies awaiting assessment
Additional references
Characteristics of studies
Characteristics of included studies [ordered by study ID]
Ir a:
| Methods | Setting: Denmark, paediatric outpatient clinic Design: crossover, 2 week washout Length of intervention period: 2 weeks Randomisation: yes, computer generated random sequence with balanced blocks Masking: double‐blind Excluded: stated (none) Withdrawals: stated (one child from low dose group due to sore throat) Baseline characteristics: comparable between groups Jadad score: 5 | |
| Participants | 48 children: 27M 21F | |
| Interventions | Group 1 randomised to: 1. FP: 200mcg/d via Accuhaler DPI 2. BUD: 200 mcg/d via Turbuhaler DPI 3. Placebo Group 2 randomised to: 1. FP: 400mcg/d via Accuhaler DPI 2. BUD: 400 mcg/d via Turbuhaler DPI 3. Placebo | |
| Outcomes | 24 hour urinary cortisol excretion | |
| Notes | ||
| Risk of bias | ||
| Bias | Authors' judgement | Support for judgement |
| Allocation concealment (selection bias) | Low risk | A ‐ Adequate |
| Methods | Setting: multicentre study USA, paediatric outpatient clinic | |
| Participants | 344 children enrolled, 325 randomised: 81M 244F | |
| Interventions | FP: 2. 100 mcg 2xdaily (200 mcg/d) Placebo: 2xdaily via Delivery device: Diskhaler DPI | |
| Outcomes | Height assessment | |
| Notes | Authors confirmed use of allocation concealment Criteria for withdrawal due to lack of efficacy: requirement for more than two seven day courses of oral corticosteroid | |
| Risk of bias | ||
| Bias | Authors' judgement | Support for judgement |
| Allocation concealment (selection bias) | Low risk | A ‐ Adequate |
| Methods | Setting: muticentre study, USA Jadad score: 3 | |
| Participants | 111 adults randomised enrolled. Distribution between groups not clear. Mean FEV1: 61% | |
| Interventions | i) FP 1000mcg BiD (2000); ii) FP500mcg BiD (1000); iii) Placebo. | |
| Outcomes | Steroid consumption; lung function; adverse events Steroid consumption; lung function; adverse events | |
| Notes | ||
| Risk of bias | ||
| Bias | Authors' judgement | Support for judgement |
| Allocation concealment (selection bias) | Unclear risk | B ‐ Unclear |
| Methods | Setting: multicentre study, paediatric asthma hospital clinic, Europe Jadad score: 3 | |
| Participants | 88 children enrolled, 68 randomised. Mean age: FP: 6.86 (sd 1.5); PLA: 6.97 (sd 1.48); FEV1 (L): FP: 1.54 (sd 0.37); PLA: 1.53 (sd 0.39); FEV1 %: FP: 104.1 (sd 10.8); PLA: 99.8 (sd 17); Rescue medication free days: FP: 49.4 (sd 36.3); PLA: 45.8 (sd 38.3); am PEF L/min: FP: 213.4 (sd 63.9); PLA: 210.6 (sd 58.6); pm PEF: FP: 219.1 (sd 62.3); PLA: 219.8 (sd 58). Inclusion criteria: Age 5‐10; Physician diagnosed asthma Exclusion criteria: Use of systemic steroids in last 2 months; ICS >100mcg/d; Salbutamol >1600mcg/d during >30% days of last year; hospitalisation with asthma in last 2 weeks | |
| Interventions | FP250mcg/d versus Placebo. Inhaler device: MDI + spacer. | |
| Outcomes | FEV1; PEF; Symptom‐free days; wheeze score; parent global evaluation | |
| Notes | ||
| Risk of bias | ||
| Bias | Authors' judgement | Support for judgement |
| Allocation concealment (selection bias) | Unclear risk | B ‐ Unclear |
| Methods | Setting: multicentre study, USA Jadad score: 5 | |
| Participants | 408 adults randomised. Age range: 12‐74; FEV1 (L): FP: 2.52 (SEM 0.05); PLA: 2.51 (SEM 0.04); FEV1 (% pred): FP: 72 (SEM 7.3); PLA: 71.9 (SEM 6.9); am PEF (L/min): FP: 363.7 (SEM 7.3); PLA: 356.1 (SEM 6.7); pm PEF (L/min): FP: 394.2 (SEM 7.5); PLA: 380.9 (SEM 7.1); Composite asthma scores: FP: 2.45 (SEM 0.06); PLA: 2.40 (SEM 0.05); Symptom free days (%): FP: 3.1 (SEM 0.7); PLA: 3.5 (SEM 0.9); Rescue medication usage (% days): FP: 13.3 (SEM 1.6); PLA: 13.5 (SEM 1.5); Night awakenings (N during baseline week): FP: 0.94 (SEM 0.09); PLA: 0.82 (SEM 0.08). Inclusion criteria: >12 years of age; asthma confirmed by ATS criteria; requirement for pharmacotherapy for at least 6 mo; previous treatment with SABA; no ICS rx for 1 mo prior to study entry; FEV1 between 60‐85% predicted; >12% reversibility <30mins after inhalation of 180mcg SABA. Exclusion criteria: Life‐threatening/unstable asthma; other clinically significant uncontrolled disease; chicken‐pox within 3 weeks; hypersensitivity to ß‐agonists, sympathomimetics, or corticosteroids; respiratory infection; pregnancy; current tobacco usage or >10 pack‐year history of smoking; use of the investigational drugs; participants not allowed to use LABAs, sodium cromoglycate, nedocromil, anticholinergic agents, leukotriene antagonists | |
| Interventions | FP250 versus placebo. | |
| Outcomes | FEV1; am PEF; pm PEF; Symptoms; Rescue medication usage; Withdrawals; Tolerability; Exacerbations | |
| Notes | ||
| Risk of bias | ||
| Bias | Authors' judgement | Support for judgement |
| Allocation concealment (selection bias) | Unclear risk | B ‐ Unclear |
| Methods | Setting: multicentre study, USA Jadad score: 5 | |
| Participants | 401 adults randomised. Age range 12‐84; FEV1 (L): FP: 2.47 (SEM 0.04); PLA: 2.47 (SEM 0.04); FEV1 (%): FP: 75.9 (SEM 8.6); PLA: 75.8 (SEM 8.3); am PEF (L/min): FP: 384.5 (SEM 7.5); PLA: 372.9 (SEM 6.1); pm PEF (L/min): FP: 401.2 (SEM 7.9); PLA: 391.1 (SEM 6.43); Composite asthma scores: FP: 1.45 (SEM 0.07); PLA: 1.36 (SEM 0.07); Symptom free days: FP: 25.7 (SEM 2.6); PLA: 28.1 (SEM 2.6); Rescue medication usage (puffs/day): FP: 1.87 (0.12); PLA: 1.82 (SEM 0.11); Rescue medication free days: FP: 41 (SEM 2.7); PLA: 39.3 (SEM 2.8); Night awakenings (in baseline week): FP: 0.68 (SEM 0.06); PLA: 0.54 (sem 0.06) Inclusion criteria: >12 years of age; asthma confirmed by ATS criteria; use of ICS for 3 months prior to study entry; stable low dose of ICS for 1 month prior to study entry (BDP: 168‐504mcg/d; FP: 88‐264mcg/d; Flunisolide: 500‐1000mcg/d; TAA: 400‐1000; BUD: 200‐400mcg/d); FEV1: 60‐90% predicted; >12% reversibility <30mins after inhalation of 180mcg SABA. Exclusion criteria: Life‐threatening/unstable asthma; other clinically significant uncontrolled disease; chicken‐pox within 3 weeks; hypersensitivity to ß‐agonists, sympathomimetics, or corticosteroids; respiratory infection; pregnancy; current tobacco usage or >10 pack‐year history of smoking; use of the investigational drugs; participants not allowed to use LABAs, sodium cromoglycate, nedocromil, anticholinergic agents, leukotriene antagonists | |
| Interventions | FP250 versus placebo. Inhaler device: Diskus. | |
| Outcomes | FEV1; am PEF; pm PEF; Symptoms; Rescue medication usage; Withdrawals; Tolerability; Exacerbations | |
| Notes | ||
| Risk of bias | ||
| Bias | Authors' judgement | Support for judgement |
| Allocation concealment (selection bias) | Unclear risk | B ‐ Unclear |
| Methods | Setting: multicentre study in Australia, France, UK, Hungary, Ukraine, Italy, Philippines, Thailand, Russia Jadad score: 3 | |
| Participants | 464 adults with mild asthma randomised to three treatment groups (two groups of relevance to the review: FP100: 155; PLA: 158). Age range: 12‐80 (mean 33‐34 years); Mean baseline FEV1: 3.2‐3.3L Inclusion criteria: 12‐80 years; documented history of asthma >/=6 months; receiving SABA prn alone | |
| Interventions | FP100 OD versus placebo via HFA MDI | |
| Outcomes | mean am & pm PEF; FEV1; advere events; rescue medication usage; symptoms | |
| Notes | ||
| Risk of bias | ||
| Bias | Authors' judgement | Support for judgement |
| Allocation concealment (selection bias) | Unclear risk | B ‐ Unclear |
| Methods | Setting: multicentre study, USA Jadad score: 4 | |
| Participants | 338 adults randomised. Age range: 12‐75 years. Baseline pulmonary function 66‐67% predicted across treatment groups; % participants with 70.1‐80% FEV1 predicted: FP 51;Zaf: 55; Pla: 46; Participants with 50 ‐ 70 % predicted FEV1: FP: 60; Zaf: 52; Pla: 65; Participants with asthma diagnosed >/=10 years: 64‐73% across treatment groups. Inclusion criteria: >12 years; asthma diagnosed according to ATS; use of SABA (scheduled or prn) for at least 6 weeks preceding the study FEV1 between 50‐80% predicted; reversibility of FEV1 (12% increase within 30 minutes after inhaling 180mg albuterol). Exclusion criteria: Life‐threatening asthma; significant and uncontrolled disease (COPD/coronary disease); use of tobacco products in preceding year/smoking history of more than 10 pack‐years; systemic steroid within 1 mo of screening; leukotriene modifier within 1 wk of screening. | |
| Interventions | Inhaled FP (88mcg BID) via pMDI + oral placebo versus inhaled placebo + oral zafirlukast versus placebo. Inhaler device: MDI | |
| Outcomes | Lung function (Change in FEV1; am/pm PEF); Symptoms (symptom scores; symptom‐free days; awakenings due to asthma); Medication usage (albuterol use (puffs day); albuterol‐free days); | |
| Notes | Study reported in abstract form only Study also included a parallel treatment arm with oral zafirlukast 20 mcg 2xdaily | |
| Risk of bias | ||
| Bias | Authors' judgement | Support for judgement |
| Allocation concealment (selection bias) | Unclear risk | B ‐ Unclear |
| Methods | Setting: multicentre study, USA Jadad score: 3 | |
| Participants | 134 adults randomised. Age range: 18‐50. Mean FEV1 (SD): PLA: 3.0 (0.66); FP110: 3.3 (0.86); FP220: 3.2 (0.67); FP330: 3.0 (0.69); FP440: 3.2 (0.77). Inclusion criteria: non‐smokers; 18‐50 years; diagnosis of persistent mild to moderate asthma confirmed within previous 12 months by response to SABA (increase in FEV1 >/= 12%)/methacholine challenge <8mg/mL); FEV1 >/=65% predicted; no OCS/nasal/ICS use in previous 6 months. Exclusion criteria: significant pulmonary disease (e.g. COPD); exacerbation within 6 weeks; URTI within 30 days screening; oestrogen usage; current condition that might confound data interpretation | |
| Interventions | PLA versus FP220 versus FP440 versus FP660 versus FP880. Inhaler device: pMDI Participants also randomised to flunisolide 500 bid, 1000 bid and prednisolone 7.5mg qd | |
| Outcomes | HPA function | |
| Notes | ||
| Risk of bias | ||
| Bias | Authors' judgement | Support for judgement |
| Allocation concealment (selection bias) | Unclear risk | B ‐ Unclear |
| Methods | Setting: multicentre study USA, hospital outpatient clinic | |
| Participants | 331 adults | |
| Interventions | FP: 2. 100 mcg 2xdaily (200mcg/d) 3. 500 mcg 2xdaily (1000 mcg/d) Placebo: 2 xdaily Delivery device: MDI | |
| Outcomes | Probability of remaining in study All outcomes expressed as change compared to baseline: Physician‐rated global assessment of efficacy | |
| Notes | No reply from author to clarify details of randomisation method For continuous outcomes change scores from baseline to endpoint (i.e. point of withdrawal) were reported A priori criteria for withdrawal due to lack of efficacy were established based on FEV1, morning PEFR, night‐time awakenings or clinical exacerbation requiring emergency hospital treatment | |
| Risk of bias | ||
| Bias | Authors' judgement | Support for judgement |
| Allocation concealment (selection bias) | Unclear risk | B ‐ Unclear |
| Methods | Setting: multicentre study USA, hospital outpatient clinics | |
| Participants | 378 adults enrolled, 291 randomised: 142M 149F | |
| Interventions | FP: 250 mcg 2xdaily (500 mcg/d) Placebo: 2xdaily Delivery device: Diskhaler DPI | |
| Outcomes | Change in FEV1 compared to baseline | |
| Notes | No reply from author to clarify details of randomisation method Intention‐to‐treat analysis employed A priori criteria for withdrawal due to lack of efficacy were established based on FEV1, morning PEFR, night‐time awakenings or clinical exacerbation requiring emergency hospital treatment Study also included a TA treatment arm: results not considered in this review | |
| Risk of bias | ||
| Bias | Authors' judgement | Support for judgement |
| Allocation concealment (selection bias) | Unclear risk | B ‐ Unclear |
| Methods | Setting: Multicentre study, Europe and North America Jadad score: 2 | |
| Participants | 52 adults randomised. Age range 20‐50. FEV1 % predicted: PLA: 99.5 (SD 13.57); FP: 102.86 (SD 12.41); PD20 mcg: PLA: 5.47 (SD 1.33); FP2000: 5.58 (SD 0.93). Inclusion criteria: PD20 <1600mcg from 2 baseline methacholine tests conducted within 2 weeks but separated by 48 hours; 20‐50 years of age; nonsmokers and smokers who had smoked at least 5 cigarettes daily. Exclusion criteria: Use of ß‐blocking or antimuscarinic drugs; use of aspirin or nonsteroidal anti‐inflammatory; RTI requiring antibiotics in preceding 4 weeks; uncontrolled systemic disease; history of alcohol abuse | |
| Interventions | FP2000 versus PLA. Delivery device: pMDI. | |
| Outcomes | Expired levels of carbon monoxide; FEV1; PD20 | |
| Notes | Participants recruited had not knowingly been diagnosed with asthma ‐ Participants with positive PD20 tests were recruited. | |
| Risk of bias | ||
| Bias | Authors' judgement | Support for judgement |
| Allocation concealment (selection bias) | Unclear risk | B ‐ Unclear |
| Methods | Setting: single centre, Italy Jadad score: 2 | |
| Participants | 31 adults randomised. Age: FP: 31 (SD 9); PLA: 31 (SD 12); FEV1 %: FP: 98 (SD 15); PLA: 102 (SD 14); FVC % pred: FP: 110 (SD 12); PLA: 112 (SD 12). Participants were described as suffering from mild asthma according to ATS criteria. All participants were on SABAs as needed. Inclusion criteria: Positive response to inhalation challenge with methacholine; clinically stable for previous 2 months; FEV1 >80% predicted; not to have suffered URTI in previous 4 weeks | |
| Interventions | FP: 1500mcg versus PLA. Inhaler device: Unclear. | |
| Outcomes | FEV1; FVC; IVC; Vmax 50; Vp50; log max dose of MCh mcg; log PD20 mg; FVC versus FEV1; Intercept; slope; IVC versus Vp50; Intercept; Slope; Vmax 50 versus Vp 50; Intercept; Slope | |
| Notes | ||
| Risk of bias | ||
| Bias | Authors' judgement | Support for judgement |
| Allocation concealment (selection bias) | Unclear risk | B ‐ Unclear |
| Methods | Setting: single centre study, Belgium Jadad score: 3 | |
| Participants | 23 adults randomised; Age range: 19‐57; FEV1: 2.95 (SD 0.83) (FEV1 % predicted: 80.0 (SD 21.4)); Mean FVC: 4.42 L (SD 0.94). Inclusion criteria: either sex; 18‐60 years of age; ATS defined asthma; >/=40% predicted value; Either post‐BD increase in FEV1 of at least 200ml or >/=12% of baseline, OR diurnal variation of PEF >/=15% on at least 2 days/week during run‐in. Exclusion criteria: Exacerbation 4 wks before inclusion; use of oral steroids within 4 weeks; use of ICS within 6 months; other systemic steroids within 4 weeks | |
| Interventions | FP 200mcg; FP 1000mcg; BUD: 200mcg; BUD 800mcg; Placebo. Inhaler device: DPI | |
| Outcomes | FEV1; PEFR; Serum cortisol; White blood cell count; Neutrophils; Basophils | |
| Notes | Data reported for effects after 24 hours @ 1 week | |
| Risk of bias | ||
| Bias | Authors' judgement | Support for judgement |
| Allocation concealment (selection bias) | Unclear risk | B ‐ Unclear |
| Methods | Setting: single centre study, Belgium Jadad score: 2 | |
| Participants | 25 adults randomised | |
| Interventions | FP500 versus FP1000 versus PLA; washout period: 3 weeks. Study duration: 6 treatment periods unclear duration. Inhaler device: unclear. | |
| Outcomes | Cortisol suppression; PC20 | |
| Notes | Conference abstract | |
| Risk of bias | ||
| Bias | Authors' judgement | Support for judgement |
| Allocation concealment (selection bias) | Unclear risk | B ‐ Unclear |
| Methods | Setting: multicentre study in North America Jadad score: 3 | |
| Participants | FP and PLA groups: 224 adults randomised. Mean age: 32‐33 years; Baseline am PEF: 72‐3% predicted Inclusion criteria: >/=12 years; diagnosis of asthma for at least 3 months; FEV1 50‐85%; >/=15% reversibility to SABA; symptoms on 4 days of week preceding randomisation | |
| Interventions | 1. FP250 1 x daily Inhaler device: DPI | |
| Outcomes | am & pm PEF; symptoms; SABA usage; withdrawals; adverse events | |
| Notes | ||
| Risk of bias | ||
| Bias | Authors' judgement | Support for judgement |
| Allocation concealment (selection bias) | Unclear risk | B ‐ Unclear |
| Methods | Setting: Finland, hospital outpatient clinic | |
| Participants | 26 adults: 11M 15F | |
| Interventions | FP: 250 mcg 2xdaily (500 mcg/d) Placebo: 2xdaily Delivery device: MDI | |
| Outcomes | Exhaled nitric oxide concentration | |
| Notes | Study reported in abstract form only | |
| Risk of bias | ||
| Bias | Authors' judgement | Support for judgement |
| Allocation concealment (selection bias) | Unclear risk | B ‐ Unclear |
| Methods | Setting: multicentre study Jadad score: 3 | |
| Participants | 232 adults randomised; 230 evaluable. Age range: 18‐72 years. Participants suffered from mild‐to‐moderate asthma Inclusion criteria: Mild‐to‐moderate asthma (defined as FEV1 50‐80%) Exclusion criteria: Not stated | |
| Interventions | FP 100mcg versus FP 500mcg versus placebo. Duration 6 weeks. Inhaler device: DPI. | |
| Outcomes | Plasma concentrations | |
| Notes | Data taken only for study 1. Study 2 assessed equal dose of FP given via different inhalers | |
| Risk of bias | ||
| Bias | Authors' judgement | Support for judgement |
| Allocation concealment (selection bias) | Unclear risk | B ‐ Unclear |
| Methods | Setting: two centre study UK and Ireland, hospital outpatient clinics | |
| Participants | 27 adults randomised, 23 completed: 16M 7F | |
| Interventions | FP: 250 mcg 4 puffs 2xdaily (2000 mcg/d) Placebo: 4 pfs 2xdaily Delivery device: MDI+Volumatic spacer | |
| Outcomes | FEV1 (after:baseline ratio) | |
| Notes | No reply from author to clarify details of randomisation method Non‐parametric analyses for all outcomes | |
| Risk of bias | ||
| Bias | Authors' judgement | Support for judgement |
| Allocation concealment (selection bias) | Unclear risk | B ‐ Unclear |
| Methods | Setting: multicentre study USA, hospital outpatient clinic | |
| Participants | 353 adolescents/adults: 236M 117F | |
| Interventions | FP: 2. 50 mcg 2 puffs 2xdaily (200 mcg/d) Placebo: 2 puffs 2xdaily Delivery device: MDI | |
| Outcomes | Probability of remaining in study All outcomes expressed as change compared to baseline: FEV1 'Effective or very effective' Physician rated global assessment of efficacy (No. of patients) Oro‐pharyngeal side effects | |
| Notes | No reply from author to clarify details of randomisation method For continuous outcomes change scores from baseline to endpoint (i.e. point of withdrawal) were reported A priori criteria for withdrawal due to lack of efficacy were established based on diurnal variability in PEFR, night‐time awakenings, rescue beta2 agonist use and FEV1 Study also included an oral theophylline treatment arm: results not considered in this review | |
| Risk of bias | ||
| Bias | Authors' judgement | Support for judgement |
| Allocation concealment (selection bias) | Unclear risk | B ‐ Unclear |
| Methods | Setting: multicentre study USA, hospital outpatient clinic | |
| Participants | 229 adults and adolescents: 116M 113F | |
| Interventions | FP: 2. 500 mcg 2xdaily (1000 mcg/d) via Diskhaler DPI Placebo: via 2xdaily | |
| Outcomes | Probability of remaining in study Outcomes expressed as change compared to baseline: FEV1 Morning plasma cortisol Withdrawal due to lack of efficacy | |
| Notes | No reply from author to clarify details of randomisation method A priori criteria for withdrawal due to lack of efficacy were established based on FEV1, morning PEFR, night‐time awakenings, rescue beta2 agonist use or clinical exacerbation requiring emergency hospital treatment | |
| Risk of bias | ||
| Bias | Authors' judgement | Support for judgement |
| Allocation concealment (selection bias) | Unclear risk | B ‐ Unclear |
| Methods | Setting: single centre study, Italy Jadad score: 3 | |
| Participants | 27 randomised. Mean age: 38.67 (SD 16.97). M/F: 15/12; history of atopy: 18/6; FEV1: 3.23 (SD 0.91); FEV1 % predicted (median (range)): 96 (76‐122); PD20: 0.220 Inclusion criteria: diurnal/nocturnal symptoms=0, low PEF variability [maximal amplitude(‐MA) <10%). Exclusion criteria: no use of ß‐agonists throughout run‐in | |
| Interventions | FP100 versus FP250 versus PLA. Inhaler device: unclear. | |
| Outcomes | FEV1; PD20; Sputum eosinophils; max amplitude; PEF; Symptoms; Rescue medication use | |
| Notes | ||
| Risk of bias | ||
| Bias | Authors' judgement | Support for judgement |
| Allocation concealment (selection bias) | Unclear risk | B ‐ Unclear |
| Methods | Setting: Not stated Jadad score: 2 | |
| Participants | 241 children with asthma. Most children had NHLBI mderate‐severe persistent asthma (77‐9%) Inclusion criteria: 4‐11 years of age; >/=6 months diagnosis of asthma requireing treatment; PEF >/=85% predicted Exclusion criteria: systemic steroids >/=10 weeks prior to study entry | |
| Interventions | 1. FP 100 2 x daily (200mcg/d) 2. Placebo Inhaler device: HFA‐MDI | |
| Outcomes | Am PEF; symptoms; adverse events | |
| Notes | Unpublished conference abstract | |
| Risk of bias | ||
| Bias | Authors' judgement | Support for judgement |
| Allocation concealment (selection bias) | Unclear risk | B ‐ Unclear |
| Methods | Setting: single centre study, UK Jadad score: 2 | |
| Participants | 15 adults randomised; Age years: 28 (SE 1.4); FEV1 L: 3.7 (SE 0.2); FEV1 (% pred): 98.5 (SE 2.8); log 10 PC20: ‐0.35 (SE 0.15). Participants described as suffering from mild, stable asthma Inclusion criteria: <15% improvement in FEV1 after 200mcg SABA; PC20 <4mg/mL; Atopy (</=2 +ve skin prick test to common allergens; inhaled or oral steroids in preceding 6 months. Exclusion criteria: Current smokers/ex‐smokers of <5 pack years; patients <80% predicted | |
| Interventions | FP1000mcg daily versus placebo. Inhaler device: pMDI. | |
| Outcomes | Cell count; BHR; protein expression; DNA‐binding | |
| Notes | No clinical outcomes reported. Lung function (FEV1 and PEF recorded but not presented) | |
| Risk of bias | ||
| Bias | Authors' judgement | Support for judgement |
| Allocation concealment (selection bias) | Unclear risk | B ‐ Unclear |
| Methods | Setting: The Netherlands, primary care and hospital outpatient clinic | |
| Participants | 34 children: 26M 8F | |
| Interventions | FP: 100 mcg 2xdaily (200 mcg/d) Placebo: 2xdaily Delivery device: Diskhaler DPI | |
| Outcomes | FEV (% predicted) | |
| Notes | No reply from author to clarify details of randomisation method | |
| Risk of bias | ||
| Bias | Authors' judgement | Support for judgement |
| Allocation concealment (selection bias) | Unclear risk | B ‐ Unclear |
| Methods | Setting: The Netherlands, paediatric outpatient clinic | |
| Participants | 37 children | |
| Interventions | FP: 2. 250 mcg 2xdaily (500 mcg/d) Placebo: 2xdaily Delivery device: not stated | |
| Outcomes | % fall in FEV1 post exercise test | |
| Notes | Study reported in abstract form only Patients were randomised to receive FP or placebo and treated for 6 weeks. After 6 weeks patients receiving placebo were re‐randomised to either dose of FP for a further 18 weeks | |
| Risk of bias | ||
| Bias | Authors' judgement | Support for judgement |
| Allocation concealment (selection bias) | Unclear risk | B ‐ Unclear |
| Methods | Setting: unclear Jadad score: 1 | |
| Participants | N = 31 (PLA: N = 13; FP: N = 18) | |
| Interventions | FP versus PLA (dosage unclear) | |
| Outcomes | Sputum eosinophils; symptoms; rescue medication usage; exacerbations; spirometry; am & pm PEF; adverse events | |
| Notes | Conference abstract | |
| Risk of bias | ||
| Bias | Authors' judgement | Support for judgement |
| Allocation concealment (selection bias) | Unclear risk | B ‐ Unclear |
| Methods | Setting: single centre teaching hospital Jadad score: 3 | |
| Participants | 20 adults randomised; Mean age: 31.3 years; Mean FEV1 (L): 3; Mean FEV1 % pred: 75.6; Mean PC20: 0.29. Inclusion criteria: Diagnosis of asthma; >/=15% reversibility in FEV1; bronchial reactivity had to be <4mg/mL; non‐smoking; receiving SABA treatment only Exclusion criteria: URTI/exacerbation of asthma within 4 weeks of study entry; asthma medication in last 2 weeks (apart from SABA); ICS in last two months; OCS in previous 3 months; females who were pregnant or lactating were excluded; skin prick +ve pts were recruited only if it was outside the season of their allergy | |
| Interventions | FP 500 mcg/day versus SAL 100mcg per day versus PLA. All interventions given via Diskus. Study duration: 3 x 6 week treatment arms (no washout) | |
| Outcomes | Inflammatory cell markers; symptoms; FEV1; PEF; FVC; PC20; erythema | |
| Notes | ||
| Risk of bias | ||
| Bias | Authors' judgement | Support for judgement |
| Allocation concealment (selection bias) | Unclear risk | B ‐ Unclear |
| Methods | Setting: multicentre study, Europe, Middle East and Asia, hospital outpatient clinics | |
| Participants | 263 children: 166M 97F | |
| Interventions | FP: 2. 100 mcg 2xdaily (200 mcg/d) Placebo: 2xdaily Delivery device: Diskhaler DPI | |
| Outcomes | Outcomes expressed as change compared to baseline: FEV1 Probability of remaining in study | |
| Notes | Reply from author but unable to clarify details of randomisation method For continuous outcomes change scores from baseline to endpoint (i.e. point of withdrawal) were reported A priori criteria for withdrawal due to lack of efficacy were established based on FEV1, PEFR, sleep disturbance or rescue beta2 agonist use | |
| Risk of bias | ||
| Bias | Authors' judgement | Support for judgement |
| Allocation concealment (selection bias) | Unclear risk | B ‐ Unclear |
| Methods | Setting: multicentre study, USA Jadad score: 3 | |
| Participants | 527 adults and adolescents screened, 356 randomised (four arm study; PLA: N = 82; FP: N = 90), Age range: 12‐67; Mean baseline FEV1 (% predicted): PLA: 64; FP: 64. Reversibility (%): PLA: 32; FP: 30; Therapy @ baseline: PLA: ICS ‐ 55, SAL ‐ 27; FP: ICS ‐ 63, SAL ‐ 27 Inclusion criteria: >/= 12 years of age; medical history of asthma (ATS criteria); at least 6 months duration; FEV1 between 40‐85% predicted; >/= 15% reversibility post SAB; Participants treated with ICS prior to enrolment had to have been treated with BDP 252‐420mcg/d (6‐10 puffs/d), TRA 600‐1000mcg/d (6‐10 puffs/d); FLU: 1000mcg/d (250 QID); FP 176mcg/d (44 QID) for at least 1 month prior to enrolment without change in regimen; If participants using SAL, they had to do so for at least 1 week prior to screening, and demonstrated FEV1 </= 85% predicted post SABA and not received concurrent ICS for 1 month prior to screening; provision of signed consent Exclusion criteria: Female participants had ‐ve pregnancy test, and were sterile, post‐menopausal or using acceptable birth control measures; history of life‐threatening asthma; hypersensitivity to ICSor beta‐agonists; smoking history (>10 pack years); use of oral, inhaled (external to guidelines above) or IM CS therapy, intranasal CS (except for 'Flonase'); use of OCS in previous 6 months; use of over the counter medicines that might affect course of asthma; abnormal chest x‐ray; abnormal ECG; significant concurrent disease. During screening period, participants not eligible if they had >3 awakenings requiring asthma during 7 days immediately preceding randomisation. ICS patients not eligible if using >12 puffs SABA per day for more than 3 days, SAL patients not eligible using >6 puffs SABA per day for more than 3 days | |
| Interventions | FP200 versus PLA. Inhaler device: Diskus. Single‐blind run‐in with a placebo (2 weeks) | |
| Outcomes | FEV1; am PEF; pm PEF; adverse events; symptoms; ECG; rescue medication usage; withdrawals | |
| Notes | ||
| Risk of bias | ||
| Bias | Authors' judgement | Support for judgement |
| Allocation concealment (selection bias) | Unclear risk | B ‐ Unclear |
| Methods | Setting: multicentre study, USA Jadad score: 5 | |
| Participants | 190 adults and adolescents screened, 160 randomised (three arm study; PLA: N = 54; FP400: N = 55; FP1000: 51), Age range: 18‐50; Mean baseline FEV1 (% predicted): PLA: 83; FP100: 82; FP500: 85 Inclusion criteria: 18‐50 years (F: 18‐40); mild asthma (6 months); FEV1: 50‐100% predicted Exclusion criteria: Significant co‐morbidity of bone; alterations in body weight; reversal of nocturnal sleepiong hours; substance abuse | |
| Interventions | FP200 BID (400) versus FP1000 BID (1000) versus PLA. Inhaler device: MDI | |
| Outcomes | Bome mineral density; withdrawals; adverse events | |
| Notes | ||
| Risk of bias | ||
| Bias | Authors' judgement | Support for judgement |
| Allocation concealment (selection bias) | Low risk | A ‐ Adequate |
| Methods | Setting: mulitcentre study,USA Jadad score: 3 | |
| Participants | 242 children screened, 192 randomised. Age range: 4‐11; FEV1 (% predicted) (mean (SEM)): FP200: 70 (0.8); FP100: 70 (1.0); Placebo: 73 (0.8); FEV1 (L) (mean (SEM)): FP200: 1.40 (0.04); FP100: 1.36 (0.04); Placebo: 1.51 (0.04); Clinic am PEF (Mean (SEM)): FP200: 208 (7); FP100: 208 (6); Placebo: 219 (7); Diary am PEF L/min (mean (SEM)): FP200: 220 (8); FP100: 222 (7); Placebo: 234 (8); Asthma symptom scores (mean (SEM)): FP200: 0.88 (0.06); FP100: 0.93 (0.07); Placebo: 0.85 (0.06); Albuterol use (puffs/day) (mean (SEM)): FP200: 2.1 (0.3); FP100: 2.0 (0.3); Placebo: 1.7 (0.2); Nighttime awakenings/night (mean (SEM)): FP200: 0.10 (0.02); FP100: 0.10 (0.02); Placebo: 0.08 (0.02) Inclusion criteria: male and premenarchal females; ATS‐diagnosed asthma; Requirement for pharmacotherapy for 3 mo prior to start of the trial; Baseline PEF >/= 85% predicted; Baseline FEV1 50‐85% predicted; >/= 15% reversibility to albuterol or 15% variability in FEV1 within 6 months prior to the study (patients aged 6‐11); Stable asthma (no more than 3 days from preceding 7 where >/‐12 puffs of albuterol per day/6 doses of albuterol power per day; no more than 3 am PEFs more than 20% below previous pm PEF; no more than 3 nights awakening resulting from asthma Exclusion criteria: History of life threatening asthma or other severe chronic disease; any RTI within 2 weeks prior to study; chickenpox 3 weeks prior to study; oral and parenteral steroids within 1 mo prior to study; use of methotrexate/gold salts; use Pf prescription or over the counter medication which may have affected course of asthma; participation in previous Diskus trial. | |
| Interventions | FP200mcg QD (+ placebo for evening) versus FP 100mcg BD versus placebo. Inhaler device: Diskus. Single blind run‐in 7 days (placebo) | |
| Outcomes | Lung function (predose am FEV1; clinic PEF ‐ measurements taken between 7am and 10am; diary PEF (am and pm); Symptoms; Rescue medication use; nighttime awakenings requiring albuterol; Adverse events | |
| Notes | ||
| Risk of bias | ||
| Bias | Authors' judgement | Support for judgement |
| Allocation concealment (selection bias) | Unclear risk | B ‐ Unclear |
| Methods | Setting: single centre study, UK Jadad score: 5 | |
| Participants | 59 adults randomised. 48 completed; mean age: 32.6 (SD 9.2); M/F: 18/30; FEV1 (L): 3.2 (SD 0.7); Duration of reversible obstruction >15 years: 32; Patients using a spacer: 4; % predicted FEV1: 93.5 (11.8); Never smoked: 28; current smoker: 3. Inclusion criteria: Patients >/=18 years; resting FEV1: >/=60%; PD20 </=3.2MG; no significant asthma medication 4 weeks prior to study (steroids ‐ ICS, OCS, parenteral); LABA, oral beta‐agonists; methylxanthine; leukotriene antagonists); No change to regular medication in this period Exclusion criteria: Inability to perform methacholine test (recent MI/CVA in last 3 months); Females of child‐bearing age except if using appropriate contraception; ‐ve pregnancy test | |
| Interventions | HFA FP100mcg BID (200mcg) via either: 1) pMDI or 2)Diskhaler. Placebo given via two inhalers. Double‐dummy design maintained throughout. | |
| Outcomes | FEV1; rescue medication usage; side effects | |
| Notes | ||
| Risk of bias | ||
| Bias | Authors' judgement | Support for judgement |
| Allocation concealment (selection bias) | Unclear risk | B ‐ Unclear |
| Methods | Setting: single centre study, USA Jadad score: 4 Statistical analysis: paired t test. | |
| Participants | 18 adults randomised. Age range: 17‐63; FEV1% pre‐SABA: 75 (50‐85); Reversibility %: 25 (12‐50); M/F: 6/12; Caucasian/Hispanic: 3/15; Medications: SABA: 18; LABAs: 3; IGC in past year: 4; LT/Theo in past year: 4 Inclusion criteria: ATS diagnosed asthma; >/=12% reversibility Exclusion criteria: Use of inhaled/nasal/oral steroids; nasal/inhaled cromolyn; LTRA/theophylline in past 4 weeks | |
| Interventions | FP44 BID versus placebo. arms; Washout period: 4 weeks. Inhaler device: MDI | |
| Outcomes | Exhaled NO; FEV1 %; PEF %; QoL; Symptoms; SABA usage | |
| Notes | ||
| Risk of bias | ||
| Bias | Authors' judgement | Support for judgement |
| Allocation concealment (selection bias) | Unclear risk | B ‐ Unclear |
| Methods | Setting: multicentre study USA, hospital outpatient clinics | |
| Participants | 261 adults | |
| Interventions | FP: 2. 500 mcg 2xdaily (1000 mcg/d) Placebo: 2xdaily Delivery device: Diskhaler DPI | |
| Outcomes | Probability of remaining in study Outcomes expressed as change compared to baseline: FEV1 Oro‐pharyngeal side effects | |
| Notes | No reply from author to clarify details of randomisation method Results for continuous outcomes expressed as change to endpoint (point of withdrawal) A priori criteria for withdrawal due to lack of efficacy were established based on FEV1, morning PEFR, night‐time awakenings or clinical exacerbation requiring emergency hospital treatment | |
| Risk of bias | ||
| Bias | Authors' judgement | Support for judgement |
| Allocation concealment (selection bias) | Unclear risk | B ‐ Unclear |
| Methods | Setting: multicentre study USA, hospital outpatient clinics | |
| Participants | 63 adults: 55M 9F | |
| Interventions | FP: 500 mcg 2xdaily (1000 mcg/d) Placebo: 2xdaily Delivery device: Diskhaler DPI | |
| Outcomes | Morning plasma cortisol | |
| Notes | No reply from author to clarify details of randomisation method ITT analysis undertaken using endpoint data | |
| Risk of bias | ||
| Bias | Authors' judgement | Support for judgement |
| Allocation concealment (selection bias) | Unclear risk | B ‐ Unclear |
| Methods | Setting: single centre study, Australia Jadad score: 5 | |
| Participants | 71 adults enrolled. 50 randomised (45 completed). Age range: 18‐55; Atopy (+/‐): FP: 11/5; PLA: 12/4; Median PD20: FP: 0.021; PLA: 0.011; Median FEV1 % pred: FP: 80; PLA: 83; Symptom scores: FP: 1.39; PLA: 1.07; SABA (median puffs/day): FP: 1.82; PLA: 1.07; median am PEF (mL): FP: 420; PLA: 404; median pm PEF (mL): FP: 471; PLA: 445 Inclusion criteria: 20‐70 years of age; non‐smoker; diagnosed asthma for previous 12 months with ICS (daily does up to 500mcg BDP/BUD; baseline FEV1 >/=60% predicted; symptomatic post run‐in i.e. symptom score >2 on 7 of last 14 days; SABA more than 7 of last 14 days; variation of >/=15% PEF over 24hrs on at least 7 of last 14 days and some degree of symptoms and SABA use during that time. Exclusion criteria: Acute RTI, change in asthma medication, admission to hospital with airways disease in previous 4 weeks | |
| Interventions | FP200mcg/day versus placebo via diskhaler. Study duration 12 weeks. Inhaler device: unclear. | |
| Outcomes | am PEF; FEV1; symptom; SABA usage; BAL; | |
| Notes | ||
| Risk of bias | ||
| Bias | Authors' judgement | Support for judgement |
| Allocation concealment (selection bias) | Unclear risk | B ‐ Unclear |
| Methods | Setting: multicentre study, USA Jadad score: 4 (non‐ITT) Jadad score: 4 | |
| Participants | 128 adults randomised. Age range: 18‐53; Ethnic origin (%) (White/Other): PLA: 94/6; FP88: 95/5; FP220: 88/13; FEV1 % Predicted: PLA: 89.1; FP88: 82.5; FP220: 88.2; Concurrent medication: Salmeterol: PLA: 0; FP88: 0; FP220: 1; Theophylline: PLA: 2; FP88: 0; FP220: 3; Cromolyn: PLA: 0; FP88: 1; FP220: 1; Nedocromil: PLA: 0; FP88: 0; FP220: 1 Inclusion criteria: Non‐smokers; asthma according to ATS criteria; duration of disease >6 months; FEV1 >/=50% predicted. Exclusion criteria: Pregnancy/lactation; use of methotrexate/gold salts; use of inhaled cromolyn/nedocromil; use of oral, intranasal, inhaled or injectable steroids <4 weeks of study commencement; use of >/= 140mg prednisone or equivalent dosage in past year; significant concomitant illness; immunotherapy requiring change in dosage regimen within 12 weeks; reversal of nocturnal sleeping hours; concurrent use of over‐the‐counter medication that might affect course of asthma or interact with sympathomimetic amines or confound cortisol assay. | |
| Interventions | FP88 versus FP220 versus Placebo. Inhaler device: pMDI + spacer. | |
| Outcomes | HPA axis function; plasma concentration; area under the curve; adverse events | |
| Notes | ||
| Risk of bias | ||
| Bias | Authors' judgement | Support for judgement |
| Allocation concealment (selection bias) | Unclear risk | B ‐ Unclear |
| Methods | Setting: dual centre study, Finland Jadad score: 3 | |
| Participants | 83 adults enrolled, 80 randomised (four treatment arms; SAL, DCSG, FP & PLA); age range: 18‐60; asthma duration: <2 years; FEV1 % predicted: 81 (SEM 1.2). Inclusion criteria: 18‐60 years of age; newly diagnosed symptomatic ATS defined asthma (within previous 2 years); FEV1 60‐100%; moderate‐severe BHR; non‐smoker; Exclusion criteria: Rx with LABA or cromones in previous 4 weeks; ICS/OCS in 2 months prior to study; RTI or exacerbation of asthma; seasonal allergy | |
| Interventions | SAL, FP250 BID (1000mcg/d); DSCG 5mg BID; PLA. Inhaler device: not reported | |
| Outcomes | Eosinophils; lymphocytes; Tenascin; PD15; amPEF; Symptoms; rescue medication usage | |
| Notes | ||
| Risk of bias | ||
| Bias | Authors' judgement | Support for judgement |
| Allocation concealment (selection bias) | Unclear risk | B ‐ Unclear |
| Methods | Seting: multicentre study in USA | |
| Participants | 82 adults with mild to moderate asthma. Mean age: 36 years; FEV1: 81.7%. Inclusion criteria: >/‐18 years; mild to moderate persistent asthma; acceptable inhaler technique; SABA only for 6 months (at least 2 x daily); FEV1 >/=70% predicted Exclusion criteria: systemic steroid use within 6 months of screening; inhaled steroids within 2 months | |
| Interventions | 1. FP880mcg/d Inhaler device: MDI without a spacer | |
| Outcomes | Hypothalmic pituitary axis function; serum cortisol; safety | |
| Notes | ||
| Risk of bias | ||
| Bias | Authors' judgement | Support for judgement |
| Allocation concealment (selection bias) | Unclear risk | B ‐ Unclear |
| Methods | Setting: multicentre study Europe and South Africa, hospital outpatient clinics | |
| Participants | 258 children: 170M 88F | |
| Interventions | FP: 50 mcg 1 actuation 2xdaily (100 mcg/d) Placebo: 2xdaily Delivery device: Diskhaler DPI | |
| Outcomes | FEV1 | |
| Notes | No reply from author to clarify details of randomisation method ITT analysis | |
| Risk of bias | ||
| Bias | Authors' judgement | Support for judgement |
| Allocation concealment (selection bias) | Unclear risk | B ‐ Unclear |
| Methods | Setting: Single centre study Jadad score: 0 | |
| Participants | 24 adults randomised. Age range: 19‐51; FEV1% predicted: FP: 73.1 (SD 5.3); PLA: 74.2 (SD 13.2) Inclusion criteria: not reported Exclusion criteria: not reported | |
| Interventions | FP250 BID versus PLA BID via Diskhaler. | |
| Outcomes | Exhaled NO; FEV1 % predicted | |
| Notes | Unpublished conference. Pending confirmation from trialists of randomisation. | |
| Risk of bias | ||
| Bias | Authors' judgement | Support for judgement |
| Allocation concealment (selection bias) | Unclear risk | B ‐ Unclear |
| Methods | Setting: two multicentre studies USA | |
| Participants | 705 adults | |
| Interventions | Study A Placebo: 2xdaily Study B Placebo: 2xdaily Delivery device: Accuhaler DPI | |
| Outcomes | Withdrawal due to worsening asthma (% of patients) | |
| Notes | Report of two studies in abstract form only Study A also included treatment arms with salmeterol/FP combination (Seretide) 50/100 mcg 2xdaily, and salmeterol 50 mcg 2xdaily | |
| Risk of bias | ||
| Bias | Authors' judgement | Support for judgement |
| Allocation concealment (selection bias) | Unclear risk | B ‐ Unclear |
| Methods | Setting: mulitcentre study, USA Jadad score: 3 | |
| Participants | 330 adults and adolescents randomised. Gender (% M:F): PLA: 56:44; FP100: 65:35; FP200: 56:44; FP500: 55:45; Age range: 12‐75; FEV1 L: PLA: 2.22 (SEM 0.06); FP100: 2.40 (0.07); FP200: 2.21 (SEM 0.07); FP500: 2.26 (SEM 0.05); FEV1 % predicted: PLA: 62.6 (SEM 1.07); FP100: 64.3 (SEM 0.89); FP200: 63.3 (SEM 1.03); FP500: 63.7 (SEM 0.96); am PEF (L/min): PLA: 394 (SEM 10); FP100: 397 (SEM 10); FP200: 395 (SEM 10); FP500: 379 (SEM 10); pm PEF (L/min): PLA: 412 (SEM 10); FP100: 420 (SEM 10); FP200: 414 (SEM 10); FP500: 404 (SEM 10); Asthma symptom scores: PLA: 1.10 (SEM 0.07); FP100: 1.18 (SEM 0.06); FP200: 1.03 (SEM 0.07); FP500: 1.08 (SEM 0.07); Albuterol use (puffs/d): PLA: 3.05 (SEM 0.26); FP100: 3.43 (SEM 0.26); FP200: 2.62 (SEM 0.24); FP500: 3.18 (SEM 0.26); Nighttime awakenings, No. (%): PLA: 0.09 (SEM 0.02); FP100: 0.08 (SEM 0.02); FP200: 0.12 (SEM 0.02); FP500: 0.10 (SEM 0.02) | |
| Interventions | Inhaled FP100mcg QD versus FP200mcg QD versus FP500mcg QD versus placebo. Diskus inhaler. | |
| Outcomes | Lung function (FEV1; am PEF; pm PEF); asthma symptoms; albuterol use; nighttime awakenings; withdrawals; safety; HPA axis function | |
| Notes | ||
| Risk of bias | ||
| Bias | Authors' judgement | Support for judgement |
| Allocation concealment (selection bias) | Unclear risk | B ‐ Unclear |
| Methods | Setting: multicentre study USA, hospital outpatient clinics | |
| Participants | 111 adults: 44M 67F | |
| Interventions | FP: 2. 1000 mcg 2xdaily (2000 mcg/d) Placebo: 2xdaily Delivery device: Accuhaler DPI | |
| Outcomes | 100% reduction in daily dose oral prednisolone (% of patients) Outcomes reported as a change compared to baseline: Daily dose oral prednisolone Oro‐pharyngeal side effects | |
| Notes | No reply from author to clarify details of randomisation method Usual ICS discontinued at randomisation A priori criteria for prednisolone dose reduction based on FEV1 (% predicted), PEFR (% predicted), number of night‐time awakenings, beta‐2 agonist use compared to run in period values Patients were withdrawn from the study if they experienced asthma exacerbation requiring hospital admission, or 3 bursts of oral prednisolone due to exacerbation ITT analysis | |
| Risk of bias | ||
| Bias | Authors' judgement | Support for judgement |
| Allocation concealment (selection bias) | Unclear risk | B ‐ Unclear |
| Methods | Setting: multicentre study Jadad score: 2 | |
| Participants | N=337 (PLA: 83; HFA FP88: 87; HFA FP220: 87; HFA FP440: 80 Inclusion criteria: >/=12 years old; prior ICS therapy | |
| Interventions | HFA FP88 BID (172) versus HFA FP 220 BID (440) versus HFA FP 440 BID (880) versus HFA placebo. Inhaler device: MDI. | |
| Outcomes | Quality of life (AQLQ) | |
| Notes | Unpublished conference abstract | |
| Risk of bias | ||
| Bias | Authors' judgement | Support for judgement |
| Allocation concealment (selection bias) | Unclear risk | B ‐ Unclear |
| Methods | Setting: multicentre study USA, hospital outpatient clinics | |
| Participants | 96 adults: 46M 50F | |
| Interventions | FP: 2. 1000 mcg 2xdaily (2000 mcg/d) Placebo: 2xdaily Delivery device: MDI | |
| Outcomes | 100% reduction in daily oral steroid use (% patients) Outcomes expressed as change compared to baseline: Daily oral prednisolone dose Oro‐pharyngeal side effects | |
| Notes | No reply from author to clarify details of randomisation method Usual ICS discontinued at randomisation Daily dose oral prednsiolone reduced according to pre‐defined criteria ITT analysis An uncontrolled one year open label study was undertaken following the randomised 16 week trial, when all patients received FP 2000 mcg/d. Results not considered in this review | |
| Risk of bias | ||
| Bias | Authors' judgement | Support for judgement |
| Allocation concealment (selection bias) | Unclear risk | B ‐ Unclear |
| Methods | Setting: multicentre study USA, hospital outpatient clinic | |
| Participants | 138 adults: 84M 54F | |
| Interventions | FP: 2. 100 mcg 2xdaily (200 mcg/d) Placebo: 2xdaily Delivery device: MDI | |
| Outcomes | Outcomes expressed as change compared to baseline: FEV1 Probability of remaining in study Oro‐pharyngeal side effects | |
| Notes | No reply from author to clarify details of randomisation method For continuous outcomes change scores from baseline to endpoint (i.e. point of withdrawal) were reported A priori criteria for withdrawal due to lack of efficacy were established based on FEV1, morning PEFR, night‐time awakenings or clinical exacerbation requiring emergency hospital treatment MDI's used for all interventions. Formulations of FP with 1% lecthin and 10% lecthin used. Only data for 1% formulation included in meta‐analysis | |
| Risk of bias | ||
| Bias | Authors' judgement | Support for judgement |
| Allocation concealment (selection bias) | Unclear risk | B ‐ Unclear |
| Methods | Setting: UK, hospital outpatient clinic | |
| Participants | 11 subjects: 6M 5F | |
| Interventions | FP: 1000 mcg/d Placebo Delivery device: MDI+spacer | |
| Outcomes | Histamine bronchial responsiveness (change in doubling dose log 2 PC20 FEV1) | |
| Notes | No reply from author to clarify details of randomisation method | |
| Risk of bias | ||
| Bias | Authors' judgement | Support for judgement |
| Allocation concealment (selection bias) | Unclear risk | B ‐ Unclear |
| Methods | Setting: Italy, hospital outpatient clinic | |
| Participants | 20 adults | |
| Interventions | FP: 250 mcg 2xdaily (500 mcg/d) Placebo: 2xdaily Delivery device: not stated | |
| Outcomes | Methacholine BHR (PC20 FEV1) | |
| Notes | ||
| Risk of bias | ||
| Bias | Authors' judgement | Support for judgement |
| Allocation concealment (selection bias) | Unclear risk | B ‐ Unclear |
| Methods | Setting: The Netherlands, hospital outpatient clinic | |
| Participants | 33 subjects: 23 male 10 female | |
| Interventions | FP: 500 mcg 2xdaily (1000 mcg/d) Placebo: 2xdaily Delivery device: Diskhaler DPI | |
| Outcomes | Methacholine BHR (log 2 PC20 FEV1) Change in FEV1 as percentage of initial FEV1, per doubling dose methacholine post methacholine challenge % fall in FEV1 post methacholine challenge compared to test baseline FEV1 Daily asthma symptom score FEV1 | |
| Notes | No reply from author to clarify details of randomisation method | |
| Risk of bias | ||
| Bias | Authors' judgement | Support for judgement |
| Allocation concealment (selection bias) | Unclear risk | B ‐ Unclear |
| Methods | Setting: Single centre study, Canada Jadad score: 5 | |
| Participants | 10 adults randomised (6 male). Mean age: 25 (SD 9.14); mean FEV1 (% predicted): 90.2 (SD 14.33); Mean PC20: 2.56 (SD 1.76). All patients were non‐smokers. Study took place out of allergy season. Beta‐agonist withheld at least 8 hours before each visit. Participants instructed to refrain from rigorous exercise and caffeine in am before visits to laboratory. Inclusion criteria: Mild stable asthma: Few or no symptoms, inhaled SABA prn, FEV1 </= 70% predicted; moderate to borderline methacholine airway hyperresponsiveness | |
| Interventions | Four visit run‐in period: control inhalation test and allergen inhalation test; Randomisation to either: Pretreatment with FP 250mcg 30 mins before allergen challenge followed by 2 weeks of FP 250mcg BID, and allergen inhalation test at end of treatment or Treatment 2: Pretreatment with placebo 30 mins before allergen inhalation test followed by 2 weeks treatment with placebo. Three week washout period before crossover. Inhaler device not described | |
| Outcomes | FEV1; PC20; Sputum inflammatory markers | |
| Notes | Investigator may have noted effects of active treatment on airway responses | |
| Risk of bias | ||
| Bias | Authors' judgement | Support for judgement |
| Allocation concealment (selection bias) | Low risk | A ‐ Adequate |
| Methods | Setting: single centre study, Belgium Jadad score: 2 | |
| Participants | N=26, Other details not reported | |
| Interventions | Ciclesonide (400mcg QID; 800mcg QID; 800mcg QID), FP500 BID & FP1000 BID or PLA. | |
| Outcomes | % Cortisol suppression; PC20 | |
| Notes | Unpublished conference abstract | |
| Risk of bias | ||
| Bias | Authors' judgement | Support for judgement |
| Allocation concealment (selection bias) | Unclear risk | B ‐ Unclear |
| Methods | Setting: multicentre study USA, hospital outpatient clinic | |
| Participants | 342 subjects randomised | |
| Interventions | FP: 2. 100mcg 1 actuation 2xdaily (200 mcg/d) 3. 250 mcg 1 actuation 2xdaily (500 mcg/d) Placebo: 2xdaily Delivery device: Diskhaler DPI | |
| Outcomes | Outcomes expressed as change compared to baseline: FEV1 Probability of remaining in study Physician global assessment of efficacy Plasma cortisol | |
| Notes | No reply from author to clarify details of randomisation method For continuous outcomes change scores from baseline to endpoint (i.e. point of withdrawal) were reported A priori criteria for withdrawal due to lack of efficacy were established based on FEV1, morning PEFR, night‐time awakenings or clinical exacerbation requiring emergency hospital treatment | |
| Risk of bias | ||
| Bias | Authors' judgement | Support for judgement |
| Allocation concealment (selection bias) | Unclear risk | B ‐ Unclear |
| Methods | Setting: multicentre study, USA Jadad score: 3 | |
| Participants | N = 136 (PLA: 23; FP88: 23; FP220: 23; SAL: 21; SAL/FP88: 25; SAL/FP220: 21).Mean age (range): PLA: 35 (12‐62); SAL: 29 (15‐57); FP88: 27 (13‐50); FP220: 32 (14‐61); SAL/FP88: 33 (14‐60); SAL/FP220: 26 (13‐52); Gender (M:F %): PLA: 43:57; SAL42: 67:33; FP88: 74:26; FP220: 57:43; SAL/FP88: 40:60; SAL/FP220: 67:33; Mean FEV1 (% predicted): PLA: 68; SAL: 70; FP88: 69; FP220: 65; SAL/FP88: 67; SAL/FP220: 69. Inclusion criteria: >/=12 years of age; ATS defined asthma (at least 6 months), requiring medical treatment; FEV1 between 50‐80% predicted; >/=15% increase in FEV1 post‐SABA; treatment with prn SABA; female participants had ‐ve pregnancy tests and either surgically sterile, postmenopausal at 1 year or using acceptable birth control for 1 month prior to participation Exclusion criteria: History of life‐threatening asthma; hypersensitivity reaction to beta‐agonists/corticosteroids; smoking within previous year/history >10 pack years; use of OCS/ICS or parenteral steroids (except for Flonase); use of steroid therapy in previous month; OCS treatment in previous 6 months; use of OTC medication that may affect the course of asthma; abnormal CXR; clinically significant abnormal 12‐lead ECG; history of concurrent disease (glaucoma, diabetes + hypertension) | |
| Interventions | PLA versus FP88mcg versus FP220mcg versus SAL42mcg/FP88mcg versus SAL42mcg/FP220mcg daily. Inhaler device: MDI. | |
| Outcomes | FEV1; Am PEF; Symptoms; % days without asthma; % nights awakening due to asthma; rescue medication use; adverse effects | |
| Notes | ||
| Risk of bias | ||
| Bias | Authors' judgement | Support for judgement |
| Allocation concealment (selection bias) | Unclear risk | B ‐ Unclear |
| Methods | Setting: multicentre study, USA Jadad score: 3 | |
| Participants | 415 adults and adolescents randomised; Mean FEV1 % predicted: PLA: 65.6; FP172: 65.3; FP440: 65.5; FP880: 66.2; mean am PEF (l/min): PLA: 346; FP172: 334; FP440: 329; FP880: 333.1 Inclusion criteria: >/=12 years; asthma for >6 months requiring tx with ICS for >/=3 months; FEV1: 45‐80% predicted; >/=12% reversibility Exclusion criteria: not reported | |
| Interventions | HFA FP88 BID (172 mcg/d) versus HFA FP220 BID (440) versus HFA FP440 BID (880). Study duration: 12 weeks. Inhaler device: MDI | |
| Outcomes | am PEF; FEV1 (% predicted) | |
| Notes | Unpublished conference abstract | |
| Risk of bias | ||
| Bias | Authors' judgement | Support for judgement |
| Allocation concealment (selection bias) | Unclear risk | B ‐ Unclear |
| Methods | Setting: multicentre study, USA Jadad score: 2 | |
| Participants | N = 360. No details on distribution between the groups provided. Participants described as symptomatic. Baseline medication: prn SABA alone: 142; SAL: 84; ICS: 134) Inclusion criteria: FEV1 40‐85% predicted; Reversibility: >/=15%. No other details provided Exclusion criteria: not listed | |
| Interventions | CFC FP88 BID (176mcg/d) versus HFA PLA. Inhaler device: MDI. 2 week run‐in. | |
| Outcomes | am PEF; probability of remaining in the study; withdrawals due to worsening asthma; FEV1; AUC | |
| Notes | Unpublished conference abstract | |
| Risk of bias | ||
| Bias | Authors' judgement | Support for judgement |
| Allocation concealment (selection bias) | Unclear risk | B ‐ Unclear |
| Methods | Setting: multicentre study USA, paediatric outpatient clinic | |
| Participants | 437 children: 268M 169F | |
| Interventions | FP: 2. 100mcg 2xdaily (200mcg/d) via Accuhaler DPI 3. 50 mcg 2xdaily (100 mcg/d) via Diskhaler DPI 4. 100 mcg 2xdaily (200 mcg/d) via Diskhaler DPI Placebo: 2xdaily, Diskhaler and Diskus/Accuhaler | |
| Outcomes | Outcomes expressed as change compared to baseline: FEV1 Morning plasma cortisol Probability of remaining in study | |
| Notes | No reply from author to clarify details of randomisation method For continuous outcomes change scores from baseline to endpoint (i.e. point of withdrawal) were reported Only data concerning FP v placebo delivered via Accuhaler has been included in the meta‐analysis | |
| Risk of bias | ||
| Bias | Authors' judgement | Support for judgement |
| Allocation concealment (selection bias) | Unclear risk | B ‐ Unclear |
| Methods | Setting: multicentre study Jadad score: 2 | |
| Participants | 365 adults and adolescents randomised. Age range: 12‐82 years. Unclear distribution between the treatment groups. Age range: 12‐82 years. M/F (%): 40/60; Caucasian: 84%; mean FEV1 68%; Reversibility: 28% Inclusion criteria: FP440‐660 mcg/d for at least 3 months prior to study entry; FEV1 40‐85%; reversibility >=15% | |
| Interventions | Combination HFA FP/SAL 110/42 BID (220/84) versus CFC SAL 42 BID (84) versus CFC FP 110 BID (220) versus HFA PLA. Inhaler devices: MDI. Run‐in: 2 weeks | |
| Outcomes | Remaining in study; AUC; withdrawals due to deterioration; FEV1 | |
| Notes | Unpublished conference abstract | |
| Risk of bias | ||
| Bias | Authors' judgement | Support for judgement |
| Allocation concealment (selection bias) | Unclear risk | B ‐ Unclear |
| Methods | Setting: multicentre study in North & South America. Jadad score: 3 | |
| Participants | 608 children. Mean age: 7.6‐7 years; am PEF: 75.2‐76.6% predicted. Inclusion criteria: 4‐11 years; diagnosis of asthma for 6 months; treated with SABA or non‐ICS controller only for 1 month prior to screening; am PEF: 50‐85% predicted; >/=15% reversibility post SABA; symptoms on 4 days of previous week/use of SABA on 4 days of previous week | |
| Interventions | 1. FP 100 once daily Inhaler device: DPI | |
| Outcomes | am & pm PEF; symptoms; SABA usage; adverse events | |
| Notes | ||
| Risk of bias | ||
| Bias | Authors' judgement | Support for judgement |
| Allocation concealment (selection bias) | Unclear risk | B ‐ Unclear |
| Methods | Setting: multicentre study (28 countries in North & South America, Asia, Europe, Africa & Australia) Jadad score: 3 | |
| Participants | 1295 adolescents and adults with mild asthma (block randomisation 3:1) Inclusion criteria: 12‐79 years; documented history of asthma >/=6 months; SABA prn; pre‐BD PEF >/=80% predicted; symptom score >/=1 on 3‐6 days during last 7 daysof run‐in; reversibility of >/=15% PEF | |
| Interventions | FP 100 BID versus Placebo | |
| Outcomes | am PEF; symptoms; FEF25‐75; FEV1; rescue medication use; adverse events; exacerbation rates | |
| Notes | Unpublished data | |
| Risk of bias | ||
| Bias | Authors' judgement | Support for judgement |
| Allocation concealment (selection bias) | Unclear risk | B ‐ Unclear |
| Methods | Setting: multicentre study, USA Jadad score: 3 | |
| Participants | 484 adults and adolescents screened. 349 randomised (four treatment arm study; PLA: 93; FP: 84. Data from 13 participants excluded from the analysis due to poor procedure at one site). M/F %: PLA: 41/59; FP250: 54/46; age range: 12‐69; FEV1 mean % predicted (% reversibility): PLA: 68 (29); FP250: 66 (28); FEV1 L: PLA: 2.19 (SE 0.07); FP250: 2.12 (0.06); Symptom scores: PLA: 1.6 (SE 0.12); FP250: 1.6 (SE 0.12); SABA usage (puffs/d): PLA: 3.8 (0.3); FP250: 3.2 (0.3) Inclusion criteria: >/=12 years; ATS defined asthma of >/=6 mo duration requiring pharmacotherapy for at least 6 months; FEV1 between 40 and 85% predicted; >/=15% increase in FEV1 30 mins after 2 puffs of albuterol; use of ICS 12 weeks prior to the study. Exclusion criteria: Females with negative pregnancy tests; life‐threatening asthma; hypersensitivity to sympathomimetic drugs/steroids; smoking within previous year; smoking history of >10 pack years; use of oral/injectable steroid therapy within 1 month of study; use of daily oral steroids within 6 months prior to the study; use of any prescription or over the counter medication that could have affected asthma or course of treatment; abnormal CXR; clinically significant abnormal 12‐lead ECGs history of concurrent disease. | |
| Interventions | PLA versus FP250 BID (500mcg/d) via Diskus inhaler. Duration: 12 weeks | |
| Outcomes | FEV1; PEF; AUC; Symptoms; Rescue medication usage; Adverse Effects | |
| Notes | ||
| Risk of bias | ||
| Bias | Authors' judgement | Support for judgement |
| Allocation concealment (selection bias) | Unclear risk | B ‐ Unclear |
| Methods | Setting: multicentre study USA, hospital outpatient clinics | |
| Participants | 307 patients: 185M 122F | |
| Interventions | FP: 2. 50 mcg 1 puff 2xdaily (100 mcg/d) 3. 50 mcg 2 puffs 2xdaily (200 mcg/d) Placebo: 2xdaily Delivery device: MDI | |
| Outcomes | Outcomes expressed as change compared to baseline: FEV1 Probability of remaining in study | |
| Notes | Randomisation details confirmed by author For continuous outcomes change scores from baseline to endpoint (i.e. point of withdrawal) were reported A priori criteria for withdrawal due to lack of efficacy were established based on FEV1, morning and evening PEFR, diurnal variability in PEFR, night‐time awakenings or clinical exacerbation requiring emergency hospital treatment | |
| Risk of bias | ||
| Bias | Authors' judgement | Support for judgement |
| Allocation concealment (selection bias) | Low risk | A ‐ Adequate |
| Methods | Setting: multicentre study Jadad score: 5 (ITT) | |
| Participants | 168 adults randomised (N for treatment groups considered by the review: Placebo: 30; FP100: 27; FP500: 30); Mean age (SE): PLA: 27.9 (1.6); FP100: 27.7 (1.7); FP500: 28.2 (1.6); Gender (M/F): PLA: 26/4; FP100: 26/1; FP500: 24/6; Race (White/other %): PLA: 67/33; FP100: 81/19; FP500: 77/23; FEV1 % predicted (SE): PLA: 87 (2.5); FP100: 88 (3.1); FP500: 83 (3.9) Inclusion criteria: 18‐51 years of age; documented diagnosis of asthma (>/=6 months according to ATS criteria; FEV1 at least 50% predicted Exclusion criteria: Pregnancy or lactation; corticosteroid/immunosuppressive therapy for 3 months prior to study entry; use of 140mg prednisone or equivalent in any dosage or form in previous year; current/prior use of antiasthma medication other than beta‐agonists, theophylline or cromolyn sodium; historical or current evidence of significant concomitant disease; use of oral contraceptives or other hormonal therapy; current use of prescription or over the counter medication known to interact with corticosteroids or to cause an abnormal response to exogenous glucocorticoids or reversal of normal nocturnal sleeping hours | |
| Interventions | FP100 versus FP500 versus Placebo. Delivery device: Rotadisk. | |
| Outcomes | AUC; Plasma cortisol; withdrawals; adverse events | |
| Notes | ||
| Risk of bias | ||
| Bias | Authors' judgement | Support for judgement |
| Allocation concealment (selection bias) | Unclear risk | B ‐ Unclear |
| Methods | Setting: multicentre study Jadad score: 5 (ITT) | |
| Participants | 119 adults randomised (N for treatment groups considered by the review: PLA: 31; FP100: 29; FP250: 30); Mean age (SE): PLA: 32.1 (1.7); FP100: 31.4 (1.8); FP250: 33 (1.6); Gender (M/F): PLA: 25/6; FP100: 26/3; FP250: 26/4; Race (White/other %): PLA: 94/6; FP100: 93/7; FP250: 90/10; FEV1 % predicted (SE): PLA: 87 (2.7); FP100: 86 (2.7); FP250: 88 (3) Inclusion criteria: 18‐51 years of age; documented diagnosis of asthma (>/=6 months according to ATS criteria; FEV1 at least 50% predicted Exclusion criteria: Pregnancy or lactation; corticosteroid/immunosuppressive therapy for 3 months prior to study entry; use of 140mg prednisone or equivalent in any dosage or form in previous year; current/prior use of antiasthma medication other than beta‐agonists, theophylline or cromolyn sodium; historical or current evidence of significant concomitant disease; use of oral contraceptives or other hormonal therapy; current use of prescription or over the counter medication known to interact with corticosteroids or to cause an abnormal response to exogenous glucocorticoids or reversal of normal nocturnal sleeping hours | |
| Interventions | FP100 versus FP500 versus Placebo. Delivery device: Rotadisk. | |
| Outcomes | AUC; Plasma cortisol; withdrawals; adverse events | |
| Notes | ||
| Risk of bias | ||
| Bias | Authors' judgement | Support for judgement |
| Allocation concealment (selection bias) | Unclear risk | B ‐ Unclear |
| Methods | Setting: single centre study, Finland Jadad score: 2 | |
| Participants | 26 adults randomised. Age range: 21‐59; M/F: FP: 4/9; PLA: 7/6; Atopic asthma: FP: 9/13; PLA: 10/13; Mean duration of reversible airway obstruction (years): FP: 12.9 (0.1‐37); PLA: 8 (0.1‐33); FEV1 % pred: FP: 79.3 (70‐88); PLA: 84.3 (69‐100); am PEF: FP: 81 (64‐99); PLA: 92 (71‐112); pm PEF: FP: 83 (63‐99); PLA: 95 (72‐116); Symptoms (DAY): FP: 0.12; PLA: 0.27; Symptoms (NIGHT): FP: 0.46; PLA: 0.51. Rescue medication usage (puffs/week): FP: 3.8; PLA: 4.6 Inclusion criteria: >/=18 years; improvement by 15% in FEV1/PEF; FEV1 >/=65% predicted; 15% fall in FEV1 at a dose of </=0.6mg Exclusion criteria: Seasonal/unstable angina; RTI; exacerbation of asthma during 4 weeks prior to study entry; current smoking/cessation of smoking within year preceding study; history of pulmonary disease other than asthma; use of ICS/OCS, inhaled cromones, anti‐leux for 2 months prior to study; use of antihistamines within 2 weeks, and LABAs within 4 weeks of study entry; pregnancy or breast feeding; severe/chronic disease; alcohol or drug abuse | |
| Interventions | FP250 BID (500) versus placebo. Inhaler device: MDI + spacer. Run‐in: 1‐2 weeks (usual asthma medication and monitoring symptoms) | |
| Outcomes | PD15; FEV1 % predicted; PEF; Symptoms; rescue medication usage | |
| Notes | ||
| Risk of bias | ||
| Bias | Authors' judgement | Support for judgement |
| Allocation concealment (selection bias) | Unclear risk | B ‐ Unclear |
| Methods | Setting: Single centre study Jadad score: 2 | |
| Participants | 45 adults screened, 29 randomised (N for FP500mcg or Placebo not reported); Age range: 30‐70; 10M, 19F; FEV1 % predicted: 93 (SD 11); Pack years (mean): 7 (0‐31); PC20 histamine (mg/mL): 5.3 (SD 3.5); Reversibility FEV1 % predicted: 5 (SD 3); Symptoms: 0.6 (SD 0.9); Bronchodilators y/n: 2/27 Inclusion criteria: Bronchial hperresponsiveness (concentration of Methcholine causing a 20% reduction in FEV1 histamine </= 8mg/mL and/or reversibility of obstruction (increase in FEV1 by 10% as percentage of FEV1 predicted after application of 800mcg inhaled salbutamol Exclusion criteria: Not reported | |
| Interventions | FP500 or placebo via diskhaler. | |
| Outcomes | Compliance | |
| Notes | No outcomes of interest measured adequately in published trial report. | |
| Risk of bias | ||
| Bias | Authors' judgement | Support for judgement |
| Allocation concealment (selection bias) | Unclear risk | B ‐ Unclear |
| Methods | Setting: Single centre study, Netherlands Jadad score: 3 | |
| Participants | 25 adults randomsied (FP 1500: 12; Placebo: 13); Mean age: FP 1500: 23.3 (SD 2.4); Placebo: 25.1 (SD 3.9); FEV % predicted: FP1500: 96.2 (SD 9); Placebo: 95.6 (SD 10.6); PC20: FP1500: 0.91 (SD 1.62); Placebo: 0.52 (SD 1.38); Eosinophils %: FP1500: 2.85 (SD 2.46); Placebo: 4.91 (SD 8.98); NO (ppb): FP1500: 6.30 (SD 3.34); Placebo: 7.47 (SD 4.37) Inclusion criteria: Stable (symptom free and free from RTI) for two weeks previously; Atopic disease (>3 mm weal); FEV1 % predicted >75% predicted; hyperresponsiveness to inhaled histamine | |
| Interventions | FP 500mcg per day versus Placebo. Inhaler device: unclear | |
| Outcomes | PC20; Sputum eosinophils; Exhaled NO | |
| Notes | ||
| Risk of bias | ||
| Bias | Authors' judgement | Support for judgement |
| Allocation concealment (selection bias) | Unclear risk | B ‐ Unclear |
| Methods | Setting: Belgium, hospital outpatient clinic | |
| Participants | N=11. Mean FEV1: 3.2 (SEM 0.16); FEV1 % pred: 88 (SEM 3.44). Mean methacholine log2 PC20: ‐5.96 (SEM 0.2). Mean NKA (neurokronin A) log2 PC20 : ‐12.71 (SEM 0.63); Gender: 4M 11F; mean age: 27.5 years Inclusion criteria: Adults (no age threshold defined ‐ all participants recruited were over 18 years); mild to moderate asthma (NHLBI 1997 guideline definition); non‐ or ex‐smokers (</=5 pack years, and ceased smoking >/=1 year prior to study entry); females of child‐bearing required to be using reliable contraception Exclusion criteria: pregnant/lactating women. | |
| Interventions | Inhaled FP500 BID versus PLA. Inhaler devices: Diskhaler. Study duration: 2 x 14 day treatment periods. Washout: 4 weeks. Only prn SABAs allowed as concomitant therapy. | |
| Outcomes | FEV1; Methacholine BHR (PC20 FEV1); Neurokinin A BHR (log 10 PC20 FEV1) | |
| Notes | Data on FEV1 presented at end of 1st arm | |
| Risk of bias | ||
| Bias | Authors' judgement | Support for judgement |
| Allocation concealment (selection bias) | Unclear risk | B ‐ Unclear |
| Methods | Setting: single centre study, Australia Jadad score: 5 | |
| Participants | 35 adults enrolled, 34 randomised. Age range: 20‐70; Mean FEV1 % pred: 91.3 (SEM 3). No patients had received LABAs or ICS for at least 3 months prior to the study. 34/35 patients had not had OCS treatment in previous 12 months. 1 patient had received OCS treatment within 3 months before the study. Inclusion criteria: mild‐moderate symptomatic asthma Exclusion criteria: not reported | |
| Interventions | Inhaled FP 1500 versus PLA. Inhaler device: MDI. Study duration: 12 months (preceded by 14‐day run in) | |
| Outcomes | FEV1, MMFEF25‐75, withdrawals, adverse events, PD20, BAL inflammatory cell counts, membrane thickening | |
| Notes | ||
| Risk of bias | ||
| Bias | Authors' judgement | Support for judgement |
| Allocation concealment (selection bias) | Unclear risk | B ‐ Unclear |
| Methods | Setting: multicentre study USA, primary care and hospital outpatient clinics | |
| Participants | 331 adults randomised, 265 completed: 265M 66F | |
| Interventions | FP: 2. 100 mcg 1 actuation 2xdaily (200 mcg/d) 3. 250 mcg 1 actuation 2xdaily (500 mcg/d) Placebo: 1 actuation 2xdaily Delivery device: Diskhaler DPI | |
| Outcomes | Outcomes expressed as change compared to baseline: FEV1 Probability of remaining in study Physician global assessment of efficacy Oro‐pharyngeal side effects | |
| Notes | No reply from author to clarify details of randomisation method For continuous outcomes change scores from baseline to endpoint (i.e. point of withdrawal) were reported A priori criteria for withdrawal due to lack of efficacy were established based on FEV1, morning PEFR, night‐time awakenings or clinical exacerbation requiring emergency hospital treatment | |
| Risk of bias | ||
| Bias | Authors' judgement | Support for judgement |
| Allocation concealment (selection bias) | Unclear risk | B ‐ Unclear |
| Methods | Setting: multicentre study USA, hospital outpatient clinics | |
| Participants | 304 adults: 169M 135F | |
| Interventions | FP: 2. 250 mcg 2xdaily (500 mcg/d) 3. 500 mcg 2xdaily (1000 mcg/d) Placebo: 2xdaily Delivery device: MDI | |
| Outcomes | Outcomes expressed as change compared to baseline: FEV1 Probability of remaining in the study Physician related global assessment of efficacy Oro‐pharyngeal side effects Morning plasma cortisol | |
| Notes | No reply from author to clarify details of randomisation method For continuous outcomes change scores from baseline to endpoint (i.e. point of withdrawal) were reported A priori criteria for withdrawal due to lack of efficacy were established based on FEV1, morning PEFR, night‐time awakenings or clinical exacerbation requiring emergency hospital treatment | |
| Risk of bias | ||
| Bias | Authors' judgement | Support for judgement |
| Allocation concealment (selection bias) | Unclear risk | B ‐ Unclear |
| Methods | Setting: multicentre study, USA Jadad score: 4 | |
| Participants | 390 adults and adolescents screened. 253 randomised; Gender M/F (%): PLA: 63/37; FP100BID: 58/42; FP200QD: 47/43. Mean age: PLA: 33; FP100BID: 33; FP200QD: 35; FEV1 (L): PLA: 2.62 (SEM 0.07); FP100BID: 2.6 (SEM 0.07); FP200QD: 2.58 (SEM 0.07); FEV1 % predicted: PLA: 68.52 (SEM 0.94); FP100BID: 68.79 (Sem 1.05); FP200QD: 67.72 (SEM 0.99); am PEF (L/min): PLA: 428 (SEM 10); FP100BID: 434 (SEM 13); FP200QD: 434 (SEM 11); pm PEF (L/min): PLA: 449 (SEM 11); FP100BID: 454 (SEM 12); FP200QD: 452 (SEM 11). Rescue medication usage (puffs/d): PLA: 2.66 (SEM 0.3); FP100BID: 2.46 (SEM 0.26); FP200QD: 2.25 (SEM 0.28); Nocturnal awakenings: PLA: 0.11 (SEM 0.03); FP100BID: 0.1 (0.02); FP200QD: 0.09 (0.01) Inclusion criteria: >/=12 years old; diagnosis of asthma based upon ATS criteria; requirement for pharmacotherapy for 6 months; BD ‐ study: no steroid treatment for 1 month prior to study entry; FEV1 50‐80% predicted; reversibility >/=15% Exclusion criteria: pregnancy/lactation; use of methotrexate/gold; use inhaled cromolyn; use of oral, intranasal or parenteral steroids within 4 weeks of study start; significant concomitant illness; immunotherapy requiring change in dose within 12 weeks; concurrent use of prescription/over the counter medication that may affect course of asthma/interact with sympathomimetic amines. Use of loratadine/intranasal cromolyn for allergic rhinitis permitted if treatment started before screening visit and continued without change | |
| Interventions | FP100BID (200mcg/d) versus FP100QD (200mcg/d) versus PLA. Inhaler device: Diskus. Study duration: 12 weeks, preceded by run‐in period ‐ placebo device for 2 weeks; prn SABA, SAL and XANTH continued (if SAL and XANTH used pre‐run‐in) | |
| Outcomes | FEV1; am PEF; pm PEF; symptoms; rescue medication usage; nocturnal awakenings; withdrawals; adverse events | |
| Notes | ||
| Risk of bias | ||
| Bias | Authors' judgement | Support for judgement |
| Allocation concealment (selection bias) | Unclear risk | B ‐ Unclear |
| Methods | Setting: multicentre study, USA Jadad score: 4 | |
| Participants | 358 adults and adolescents screened. 199 randomised; PLA: 69; FP100BID: 65; FP200QD: 65. Gender M/F (%): PLA: 58/42; FP100BID: 48/52; FP200QD: 60/40; Mean age: PLA: 36; FP100BID: 39; FP200QID: 36; FEV1 L: PLA: 2.35 (SEM 0.07); FP100BID: 2.26 (SEM 0.07); FP200QD: 2.38 (SEM 0.08); FEV1 (% predicted): PLA: 67.87 (SEM 1.17); FP100BID: 65.93 (SEM 1.19); FP200QD: 66.6 (SEM 1.02); am PEF (L/min): PLA: 408 (SEM 12); FP100BID: 396 (SEM 11); FP200QD: 421 (SEM 11); pm PEF (L/min): PLA: 426 (SEM 12); FP100BID: 411 (SEM 11); FP200QD: 438 (SEM 11); Symptoms: PLA: 2.62 (SEM 0.3); FP100BID: 2.91 (SEM 0.34); FP200QD: 2.82 (SEM 0.32); Nocturnal awakenings: 0.08 (SEM 0.02); FP100BID: 0.06 (SEM 0.01); FP200QD: 0.07 (SEM 0.02) Inclusion criteria: ICS >/=8 puffs day of BDP (42mcg/puff) or TAA (100mcg/puff) for three months; asthma stability defined as 0 days with >/= 12 puffs of SABA prn; </=4 mornings when PEF decreased by >/= 20% from previous pm's PEF; </=2 nights with awakenings caused by asthma requiring inhaled SABA; FEV1 between 50 & 80% predicted & +/‐15% screening value; adequate compliance during run‐in. Exclusion criteria: Exclusion criteria: pregnancy/lactation; use of methotrexate/gold; use inhaled cromolyn; use of oral, intranasal or parenteral steroids within 4 weeks of study start; significant concomitant illness; immunotherapy requiring change in dose within 12 weeks; concurrent use of prescription/over the counter medication that may affect course of asthma/interact with sympathomimetic amines. Use of loratadine/intranasal cromolyn for allergic rhinitis permitted if treatment started before screening visit and continued without change | |
| Interventions | FP100BID versus FP200QD versus PLA. Inhaler device: Diskus. Run‐in period: 2 weeks (ICS dosage regimen maintained). | |
| Outcomes | FEV1; am PEF; pm PEF; symptoms; rescue medication usage; nocturnal awakenings; withdrawals; adverse events | |
| Notes | ||
| Risk of bias | ||
| Bias | Authors' judgement | Support for judgement |
| Allocation concealment (selection bias) | Unclear risk | B ‐ Unclear |
| Methods | Setting: multicentre study, USA Jadad score: 3 | |
| Participants | 253 adults and adolescents randomsied; Gender: M:F (%): FP500: 51:49; FP1000: 59:41; PLA: 58:42; Age range: 12‐69; FEV1 (L)*: FP500: 2.44 (SEM: 0.07); FP1000: 2.51 (SEM 0.08); PLA: 2.46 (SEM 0.06); FEV1 (% predicted): FP500: 68 (SEM: 0.9); FP1000: 66 (SEM 1); PLA: 67 (SEM 1); am PEF (L/min)*: FP500: 410 (SEM 9); FP1000: 402 (SEM 10); PLA: 418 (SEM 11); pm PEF (L/min)*: FP500: 434 (SEM 10); FP1000: 429 (SEM 10); PLA: 441 (SEM 11); Asthma symptom scores*: FP500: 1.13 (SEM 0.05); FP1000: 1.06 (SEM 0.06); PLA: 1.08 (SEM 0.07); ß‐2 agonist use (puffs/d)*: FP500: 2.82 (SEM 0.24); FP1000 2.67 (SEM 0.27) ; PLA: 3.04 (SEM 0.28); Nighttime awakenings/night*: FP500: 0.08 (SEM 0.02); FP1000: 0.11 (SEM 0.02); PLA 0.15 (0.02) *denotes efficacy population Inclusion criteria: Chronic asthma (ATS diagnosis); requirement of daily pharmacotherapy over 6 mo prior to study; FEV1 50‐80% predicted; >/= 15% increase in FEV1 <15 minutes after 2 puffs of ß‐2 agonist OR documented >/=15% variation in FEV1 within 6 mo prior to study. Open label extension: Participants completing DB phase eligible Exclusion criteria: History of life‐threatening asthma or other severe chronic disease; use of oral/intranasal/parenteral steroids; inhaled nedocromil or cromolyn sodium within 1 mo prior to start of study; ise of methotrexate/gold salts, any prescription/over the counter medication which could affect course of asthma; participation in previous study with Diskus device | |
| Interventions | Inhaled FP 250mcg versus FP 500mcg versus placebo BID. Identical inhaler devices used (Diskus powder inhaler). Participants in FP500mcg given placebo inhaler for pm dose. Double‐blind phase duration: 12 weeks | |
| Outcomes | Lung function (FEV1, PEF); Probability of remaining in study; Symptoms; Medication use; Safety; HPA axis function | |
| Notes | ||
| Risk of bias | ||
| Bias | Authors' judgement | Support for judgement |
| Allocation concealment (selection bias) | Unclear risk | B ‐ Unclear |
ACTH: adrenocorticotropic hormone; ATS: American Thoracic Society; BAL: bronchoalveolar lavage; BDP: beclomethasone dipropionate; BID: twice daily; BHR: bronchial hyperresponsiveness; BUD: budesonide; DPI: dry powder inhaler; ECP: eosinophil cationic protein; EDN: eosinophil derived neurotoxinl; FEF25‐75: forced expiratory flow at 25 to 75% of FVC; FEV1: forced expired volume in one second; FP: fluticasone propionate; FVC: forced vital capacity; HPA: hypothalamo‐pituitary‐adrenal; ICAM‐1: intercellular adhesion molecule‐1; ICS: inhaled corticosteroid; ITT: intension‐to‐treat; mcg/d: micrograms per day; MDI: metered dose inhaler; PD15 FEV1: provocative dose of inhalant required to produce a 15% fall in FEV1; PC20 FEV1: provocative concentration of inhalant required to produce a 20% fall in FEV1; PD20 FEV1: provocative dose of inhalant required to produce a 20% fall in FEV1; PEFR: peak expiratory flow rate; TA: triamcinolone acetonide
Characteristics of excluded studies [ordered by study ID]
Ir a:
| Study | Reason for exclusion |
| Randomised study of the acute effects of inhalation of FP in mild asthmatics | |
| Comparison with combination product | |
| This study assessed a group of young children including infants under the age of two years | |
| Comparison between FP and LTRA | |
| No clear diagnosis of asthma | |
| FP as additional treatment to SAL | |
| Comparison between FP and BDP | |
| No PLA control | |
| Nebuliser delivery device | |
| Comparison with combination product | |
| Wrong comparison (FP versus FP via different inhalers) | |
| Comparison between FP and LTRA | |
| Nebuliser delivery device | |
| Comparison between different propellants | |
| Comparison between FP and BDP | |
| Comparison between FP and LTRA | |
| Not randomised | |
| Comparison with TAA | |
| Comparison between SAL and LTRA as add on to FP | |
| Crossover study with intervention periods of only 4 days | |
| Study of inadequate duration | |
| Comparison with BDP | |
| Wrong outcomes assessed | |
| Compaison with LTRA | |
| Participants had wheeze and not asthma | |
| Wrong comparison | |
| Study assesses infants | |
| Placebo was not a randomised intervention | |
| Crossover design study with intervention periods of 4 days | |
| Placebo was not a randomised intervention | |
| Infant age group |
FP: fluticasone; SAL: salmeterol; BUD: budesonide; F: formoterol; TAA: triamcinolone; LTRA: anti‐leukoptriene agent; PLA: placebo
Data and analyses
| Outcome or subgroup title | No. of studies | No. of participants | Statistical method | Effect size |
| 1 Change in FEV1 compared to baseline (litres) Show forest plot | 9 | 1364 | Mean Difference (IV, Fixed, 95% CI) | 0.30 [0.25, 0.34] |
| Analysis 1.1  Comparison 1 FP versus placebo: Parallel group studies, no oral steroids: 100 mcg/d or less (all ages), Outcome 1 Change in FEV1 compared to baseline (litres). | ||||
| 1.1 Children | 2 | 321 | Mean Difference (IV, Fixed, 95% CI) | 0.12 [0.04, 0.20] |
| 1.2 Adults | 7 | 1043 | Mean Difference (IV, Fixed, 95% CI) | 0.38 [0.32, 0.43] |
| 2 Change in FEV1 compared to baseline (litres) Show forest plot | 10 | 1673 | Litres (Fixed, 95% CI) | 0.21 [0.18, 0.25] |
| Analysis 1.2  Comparison 1 FP versus placebo: Parallel group studies, no oral steroids: 100 mcg/d or less (all ages), Outcome 2 Change in FEV1 compared to baseline (litres). | ||||
| 2.1 Children | 2 | 321 | Litres (Fixed, 95% CI) | 0.11 [0.05, 0.18] |
| 2.2 Adults | 8 | 1352 | Litres (Fixed, 95% CI) | 0.26 [0.21, 0.31] |
| 3 FEV1 ‐ Litres (absolute values) Show forest plot | 1 | Mean Difference (IV, Fixed, 95% CI) | Totals not selected | |
| Analysis 1.3  Comparison 1 FP versus placebo: Parallel group studies, no oral steroids: 100 mcg/d or less (all ages), Outcome 3 FEV1 ‐ Litres (absolute values). | ||||
| 3.1 Children | 0 | Mean Difference (IV, Fixed, 95% CI) | 0.0 [0.0, 0.0] | |
| 3.2 Adults | 1 | Mean Difference (IV, Fixed, 95% CI) | 0.0 [0.0, 0.0] | |
| 4 Change in morning PEFR compared to baseline (L/min) Show forest plot | 10 | 1705 | Mean Difference (IV, Fixed, 95% CI) | 22.79 [19.07, 26.51] |
| Analysis 1.4  Comparison 1 FP versus placebo: Parallel group studies, no oral steroids: 100 mcg/d or less (all ages), Outcome 4 Change in morning PEFR compared to baseline (L/min). | ||||
| 4.1 Children | 2 | 353 | Mean Difference (IV, Fixed, 95% CI) | 26.41 [18.03, 34.79] |
| 4.2 Adults | 8 | 1352 | Mean Difference (IV, Fixed, 95% CI) | 21.91 [17.76, 26.06] |
| 5 Change in am PEF (predicted) Show forest plot | 1 | % (Fixed, 95% CI) | Totals not selected | |
| Analysis 1.5  Comparison 1 FP versus placebo: Parallel group studies, no oral steroids: 100 mcg/d or less (all ages), Outcome 5 Change in am PEF (predicted). | ||||
| 5.1 Children | 1 | % (Fixed, 95% CI) | 0.0 [0.0, 0.0] | |
| 5.2 Adults | 0 | % (Fixed, 95% CI) | 0.0 [0.0, 0.0] | |
| 6 Change in evening PEFR compared to baseline (L/min) Show forest plot | 8 | 1794 | Mean Difference (IV, Fixed, 95% CI) | 11.46 [8.19, 14.74] |
| Analysis 1.6  Comparison 1 FP versus placebo: Parallel group studies, no oral steroids: 100 mcg/d or less (all ages), Outcome 6 Change in evening PEFR compared to baseline (L/min). | ||||
| 6.1 Children | 2 | 780 | Mean Difference (IV, Fixed, 95% CI) | 6.98 [2.26, 11.71] |
| 6.2 Adults | 6 | 1014 | Mean Difference (IV, Fixed, 95% CI) | 15.60 [11.06, 20.15] |
| 7 Change in evening PEFR compared to baseline Show forest plot | 9 | 1954 | Litres/min (Fixed, 95% CI) | 12.08 [8.87, 15.30] |
| Analysis 1.7  Comparison 1 FP versus placebo: Parallel group studies, no oral steroids: 100 mcg/d or less (all ages), Outcome 7 Change in evening PEFR compared to baseline. | ||||
| 7.1 Children | 2 | 780 | Litres/min (Fixed, 95% CI) | 6.98 [2.26, 11.70] |
| 7.2 Adults | 7 | 1174 | Litres/min (Fixed, 95% CI) | 16.51 [12.12, 20.91] |
| 8 Change in evening PEF (predicted) Show forest plot | 1 | % (Fixed, 95% CI) | Totals not selected | |
| Analysis 1.8  Comparison 1 FP versus placebo: Parallel group studies, no oral steroids: 100 mcg/d or less (all ages), Outcome 8 Change in evening PEF (predicted). | ||||
| 8.1 Children | 1 | % (Fixed, 95% CI) | 0.0 [0.0, 0.0] | |
| 8.2 Adults | 0 | % (Fixed, 95% CI) | 0.0 [0.0, 0.0] | |
| 9 Peak flow ‐ L/min (absolute values) Show forest plot | 1 | Mean Difference (IV, Fixed, 95% CI) | Totals not selected | |
| Analysis 1.9  Comparison 1 FP versus placebo: Parallel group studies, no oral steroids: 100 mcg/d or less (all ages), Outcome 9 Peak flow ‐ L/min (absolute values). | ||||
| 9.1 Children | 0 | Mean Difference (IV, Fixed, 95% CI) | 0.0 [0.0, 0.0] | |
| 9.2 Adults | 1 | Mean Difference (IV, Fixed, 95% CI) | 0.0 [0.0, 0.0] | |
| 10 Change in clinic PEFR compared to baseline (L/min) Show forest plot | 1 | Mean Difference (IV, Fixed, 95% CI) | Totals not selected | |
| Analysis 1.10  Comparison 1 FP versus placebo: Parallel group studies, no oral steroids: 100 mcg/d or less (all ages), Outcome 10 Change in clinic PEFR compared to baseline (L/min). | ||||
| 10.1 Children | 1 | Mean Difference (IV, Fixed, 95% CI) | 0.0 [0.0, 0.0] | |
| 10.2 Adults | 0 | Mean Difference (IV, Fixed, 95% CI) | 0.0 [0.0, 0.0] | |
| 11 Change in FVC compared to baseline (litres) Show forest plot | 1 | Mean Difference (IV, Fixed, 95% CI) | Totals not selected | |
| Analysis 1.11  Comparison 1 FP versus placebo: Parallel group studies, no oral steroids: 100 mcg/d or less (all ages), Outcome 11 Change in FVC compared to baseline (litres). | ||||
| 11.1 Children | 0 | Mean Difference (IV, Fixed, 95% CI) | 0.0 [0.0, 0.0] | |
| 11.2 Adults | 1 | Mean Difference (IV, Fixed, 95% CI) | 0.0 [0.0, 0.0] | |
| 12 Change in FEF25‐75 compared to baseline (L/second) Show forest plot | 2 | 467 | Mean Difference (IV, Fixed, 95% CI) | 0.20 [0.05, 0.34] |
| Analysis 1.12  Comparison 1 FP versus placebo: Parallel group studies, no oral steroids: 100 mcg/d or less (all ages), Outcome 12 Change in FEF25‐75 compared to baseline (L/second). | ||||
| 12.1 Children | 0 | 0 | Mean Difference (IV, Fixed, 95% CI) | 0.0 [0.0, 0.0] |
| 12.2 Adults | 2 | 467 | Mean Difference (IV, Fixed, 95% CI) | 0.20 [0.05, 0.34] |
| 13 Change in daily asthma symptom score compared to baseline Show forest plot | 8 | 1238 | Std. Mean Difference (IV, Fixed, 95% CI) | ‐0.57 [‐0.69, ‐0.46] |
| Analysis 1.13  Comparison 1 FP versus placebo: Parallel group studies, no oral steroids: 100 mcg/d or less (all ages), Outcome 13 Change in daily asthma symptom score compared to baseline. | ||||
| 13.1 Children | 2 | 353 | Std. Mean Difference (IV, Fixed, 95% CI) | ‐0.52 [‐0.73, ‐0.31] |
| 13.2 Adults | 6 | 885 | Std. Mean Difference (IV, Fixed, 95% CI) | ‐0.60 [‐0.73, ‐0.46] |
| 14 Symptoms ‐ absolute scores Show forest plot | 1 | Mean Difference (IV, Fixed, 95% CI) | Totals not selected | |
| Analysis 1.14  Comparison 1 FP versus placebo: Parallel group studies, no oral steroids: 100 mcg/d or less (all ages), Outcome 14 Symptoms ‐ absolute scores. | ||||
| 14.1 Children | 0 | Mean Difference (IV, Fixed, 95% CI) | 0.0 [0.0, 0.0] | |
| 14.2 Adults | 1 | Mean Difference (IV, Fixed, 95% CI) | 0.0 [0.0, 0.0] | |
| 15 Change in night‐time wakening score Show forest plot | 6 | 895 | Std. Mean Difference (IV, Fixed, 95% CI) | ‐0.25 [‐0.38, ‐0.12] |
| Analysis 1.15  Comparison 1 FP versus placebo: Parallel group studies, no oral steroids: 100 mcg/d or less (all ages), Outcome 15 Change in night‐time wakening score. | ||||
| 15.1 Children | 1 | 176 | Std. Mean Difference (IV, Fixed, 95% CI) | ‐0.29 [‐0.59, 0.01] |
| 15.2 Adults | 5 | 719 | Std. Mean Difference (IV, Fixed, 95% CI) | ‐0.24 [‐0.39, ‐0.09] |
| 16 Nighttime awakenings/night Show forest plot | 1 | Mean Difference (IV, Fixed, 95% CI) | Totals not selected | |
| Analysis 1.16  Comparison 1 FP versus placebo: Parallel group studies, no oral steroids: 100 mcg/d or less (all ages), Outcome 16 Nighttime awakenings/night. | ||||
| 16.1 Children | 0 | Mean Difference (IV, Fixed, 95% CI) | 0.0 [0.0, 0.0] | |
| 16.2 Adults | 1 | Mean Difference (IV, Fixed, 95% CI) | 0.0 [0.0, 0.0] | |
| 17 Change in number night‐time wakenings per week Show forest plot | 4 | 648 | Mean Difference (IV, Fixed, 95% CI) | ‐0.11 [‐0.17, ‐0.05] |
| Analysis 1.17  Comparison 1 FP versus placebo: Parallel group studies, no oral steroids: 100 mcg/d or less (all ages), Outcome 17 Change in number night‐time wakenings per week. | ||||
| 17.1 Children | 0 | 0 | Mean Difference (IV, Fixed, 95% CI) | 0.0 [0.0, 0.0] |
| 17.2 Adults | 4 | 648 | Mean Difference (IV, Fixed, 95% CI) | ‐0.11 [‐0.17, ‐0.05] |
| 18 Change in daily use of beta2 agonist compared to baseline (puffs/d) Show forest plot | 9 | 1839 | Mean Difference (IV, Fixed, 95% CI) | ‐0.94 [‐1.14, ‐0.74] |
| Analysis 1.18  Comparison 1 FP versus placebo: Parallel group studies, no oral steroids: 100 mcg/d or less (all ages), Outcome 18 Change in daily use of beta2 agonist compared to baseline (puffs/d). | ||||
| 18.1 Children | 3 | 957 | Mean Difference (IV, Fixed, 95% CI) | ‐0.60 [‐0.87, ‐0.33] |
| 18.2 Adults | 6 | 882 | Mean Difference (IV, Fixed, 95% CI) | ‐1.36 [‐1.66, ‐1.06] |
| 19 Rescue medication usage ‐ puffs/d (absolute scores) Show forest plot | 1 | Mean Difference (IV, Fixed, 95% CI) | Totals not selected | |
| Analysis 1.19  Comparison 1 FP versus placebo: Parallel group studies, no oral steroids: 100 mcg/d or less (all ages), Outcome 19 Rescue medication usage ‐ puffs/d (absolute scores). | ||||
| 19.1 Children | 0 | Mean Difference (IV, Fixed, 95% CI) | 0.0 [0.0, 0.0] | |
| 19.2 Adults | 1 | Mean Difference (IV, Fixed, 95% CI) | 0.0 [0.0, 0.0] | |
| 20 HRQOL: AQLQ Show forest plot | 1 | Mean Difference (IV, Fixed, 95% CI) | Totals not selected | |
| Analysis 1.20  Comparison 1 FP versus placebo: Parallel group studies, no oral steroids: 100 mcg/d or less (all ages), Outcome 20 HRQOL: AQLQ. | ||||
| 20.1 Children | 0 | Mean Difference (IV, Fixed, 95% CI) | 0.0 [0.0, 0.0] | |
| 20.2 Adults | 1 | Mean Difference (IV, Fixed, 95% CI) | 0.0 [0.0, 0.0] | |
| 21 HRQOL: Functional Status IIR questionaire (short version) Show forest plot | 1 | Mean Difference (IV, Fixed, 95% CI) | Totals not selected | |
| Analysis 1.21  Comparison 1 FP versus placebo: Parallel group studies, no oral steroids: 100 mcg/d or less (all ages), Outcome 21 HRQOL: Functional Status IIR questionaire (short version). | ||||
| 21.1 Children | 1 | Mean Difference (IV, Fixed, 95% CI) | 0.0 [0.0, 0.0] | |
| 21.2 Adults | 0 | Mean Difference (IV, Fixed, 95% CI) | 0.0 [0.0, 0.0] | |
| 22 HRQOL: Quality of Life of Parents of Asthmatic Children questionnaire, burden dimension Show forest plot | 1 | Mean Difference (IV, Fixed, 95% CI) | Totals not selected | |
| Analysis 1.22  Comparison 1 FP versus placebo: Parallel group studies, no oral steroids: 100 mcg/d or less (all ages), Outcome 22 HRQOL: Quality of Life of Parents of Asthmatic Children questionnaire, burden dimension. | ||||
| 22.1 Children | 1 | Mean Difference (IV, Fixed, 95% CI) | 0.0 [0.0, 0.0] | |
| 22.2 Adults | 0 | Mean Difference (IV, Fixed, 95% CI) | 0.0 [0.0, 0.0] | |
| 23 HRQOL: Quality of Life of Parents of Asthmatic Children questionnaire, subjective norms dimension Show forest plot | 1 | Mean Difference (IV, Fixed, 95% CI) | Totals not selected | |
| Analysis 1.23  Comparison 1 FP versus placebo: Parallel group studies, no oral steroids: 100 mcg/d or less (all ages), Outcome 23 HRQOL: Quality of Life of Parents of Asthmatic Children questionnaire, subjective norms dimension. | ||||
| 23.1 Children | 1 | Mean Difference (IV, Fixed, 95% CI) | 0.0 [0.0, 0.0] | |
| 23.2 Adults | 0 | Mean Difference (IV, Fixed, 95% CI) | 0.0 [0.0, 0.0] | |
| 24 HRQOL: Quality of Life of Parents of Asthmatic Children questionnaire, social dimension Show forest plot | 1 | Mean Difference (IV, Fixed, 95% CI) | Totals not selected | |
| Analysis 1.24  Comparison 1 FP versus placebo: Parallel group studies, no oral steroids: 100 mcg/d or less (all ages), Outcome 24 HRQOL: Quality of Life of Parents of Asthmatic Children questionnaire, social dimension. | ||||
| 24.1 Children | 1 | Mean Difference (IV, Fixed, 95% CI) | 0.0 [0.0, 0.0] | |
| 24.2 Adults | 0 | Mean Difference (IV, Fixed, 95% CI) | 0.0 [0.0, 0.0] | |
| 25 HRQOL: Sleep Scale Children questionnaire Show forest plot | 1 | Mean Difference (IV, Fixed, 95% CI) | Totals not selected | |
| Analysis 1.25  Comparison 1 FP versus placebo: Parallel group studies, no oral steroids: 100 mcg/d or less (all ages), Outcome 25 HRQOL: Sleep Scale Children questionnaire. | ||||
| 25.1 Children | 1 | Mean Difference (IV, Fixed, 95% CI) | 0.0 [0.0, 0.0] | |
| 25.2 Adults | 0 | Mean Difference (IV, Fixed, 95% CI) | 0.0 [0.0, 0.0] | |
| 26 Physician‐rated efficacy: effective or very effective Show forest plot | 4 | 664 | Peto Odds Ratio (Peto, Fixed, 95% CI) | 5.12 [3.76, 6.98] |
| Analysis 1.26  Comparison 1 FP versus placebo: Parallel group studies, no oral steroids: 100 mcg/d or less (all ages), Outcome 26 Physician‐rated efficacy: effective or very effective. | ||||
| 26.1 Children | 0 | 0 | Peto Odds Ratio (Peto, Fixed, 95% CI) | 0.0 [0.0, 0.0] |
| 26.2 Adults | 4 | 664 | Peto Odds Ratio (Peto, Fixed, 95% CI) | 5.12 [3.76, 6.98] |
| 27 Withdrawal due to clinical asthma exacerbation (No. of patients) Show forest plot | 1 | Peto Odds Ratio (Peto, Fixed, 95% CI) | Totals not selected | |
| Analysis 1.27  Comparison 1 FP versus placebo: Parallel group studies, no oral steroids: 100 mcg/d or less (all ages), Outcome 27 Withdrawal due to clinical asthma exacerbation (No. of patients). | ||||
| 27.1 Children | 1 | Peto Odds Ratio (Peto, Fixed, 95% CI) | 0.0 [0.0, 0.0] | |
| 27.2 Adults | 0 | Peto Odds Ratio (Peto, Fixed, 95% CI) | 0.0 [0.0, 0.0] | |
| 28 Withdrawal due to lack of treatment efficacy (No. of patients) Show forest plot | 8 | 1479 | Peto Odds Ratio (Peto, Fixed, 95% CI) | 0.26 [0.20, 0.32] |
| Analysis 1.28  Comparison 1 FP versus placebo: Parallel group studies, no oral steroids: 100 mcg/d or less (all ages), Outcome 28 Withdrawal due to lack of treatment efficacy (No. of patients). | ||||
| 28.1 Children | 2 | 353 | Peto Odds Ratio (Peto, Fixed, 95% CI) | 0.32 [0.21, 0.49] |
| 28.2 Adults | 6 | 1126 | Peto Odds Ratio (Peto, Fixed, 95% CI) | 0.23 [0.17, 0.31] |
| 29 Withdrawals due to adverse events Show forest plot | 3 | 957 | Odds Ratio (M‐H, Fixed, 95% CI) | 1.11 [0.38, 3.20] |
| Analysis 1.29  Comparison 1 FP versus placebo: Parallel group studies, no oral steroids: 100 mcg/d or less (all ages), Outcome 29 Withdrawals due to adverse events. | ||||
| 29.1 Children | 1 | 604 | Odds Ratio (M‐H, Fixed, 95% CI) | 1.24 [0.33, 4.65] |
| 29.2 Adults | 2 | 353 | Odds Ratio (M‐H, Fixed, 95% CI) | 0.90 [0.15, 5.43] |
| 30 Morning plasma cortisol (mcg/dL) Show forest plot | 2 | 197 | Mean Difference (IV, Fixed, 95% CI) | 0.27 [‐1.05, 1.59] |
| Analysis 1.30  Comparison 1 FP versus placebo: Parallel group studies, no oral steroids: 100 mcg/d or less (all ages), Outcome 30 Morning plasma cortisol (mcg/dL). | ||||
| 30.1 Children | 1 | 159 | Mean Difference (IV, Fixed, 95% CI) | 0.70 [‐0.84, 2.24] |
| 30.2 Adults | 1 | 38 | Mean Difference (IV, Fixed, 95% CI) | ‐0.90 [‐3.46, 1.66] |
| 31 Total urinary free cortisol excretion (mcg/24 hours) Show forest plot | 1 | Mean Difference (IV, Fixed, 95% CI) | Totals not selected | |
| Analysis 1.31  Comparison 1 FP versus placebo: Parallel group studies, no oral steroids: 100 mcg/d or less (all ages), Outcome 31 Total urinary free cortisol excretion (mcg/24 hours). | ||||
| 31.1 Children | 1 | Mean Difference (IV, Fixed, 95% CI) | 0.0 [0.0, 0.0] | |
| 31.2 Adults | 0 | Mean Difference (IV, Fixed, 95% CI) | 0.0 [0.0, 0.0] | |
| 32 Sore throat or pharyngitis (No. of patients) Show forest plot | 6 | 1336 | Peto Odds Ratio (Peto, Fixed, 95% CI) | 1.98 [0.97, 4.04] |
| Analysis 1.32  Comparison 1 FP versus placebo: Parallel group studies, no oral steroids: 100 mcg/d or less (all ages), Outcome 32 Sore throat or pharyngitis (No. of patients). | ||||
| 32.1 Children | 2 | 821 | Peto Odds Ratio (Peto, Fixed, 95% CI) | 1.71 [0.73, 3.99] |
| 32.2 Adults | 4 | 515 | Peto Odds Ratio (Peto, Fixed, 95% CI) | 2.82 [0.74, 10.75] |
| 33 Hoarseness or dysphonia (No. of patients) Show forest plot | 7 | 1215 | Peto Odds Ratio (Peto, Fixed, 95% CI) | 5.00 [1.53, 16.37] |
| Analysis 1.33  Comparison 1 FP versus placebo: Parallel group studies, no oral steroids: 100 mcg/d or less (all ages), Outcome 33 Hoarseness or dysphonia (No. of patients). | ||||
| 33.1 Children | 2 | 395 | Peto Odds Ratio (Peto, Fixed, 95% CI) | 7.19 [0.74, 69.93] |
| 33.2 Adults | 5 | 820 | Peto Odds Ratio (Peto, Fixed, 95% CI) | 4.36 [1.09, 17.52] |
| 34 Oral Candidiasis (No. of patients) Show forest plot | 7 | 1298 | Peto Odds Ratio (Peto, Fixed, 95% CI) | 3.45 [1.29, 9.26] |
| Analysis 1.34  Comparison 1 FP versus placebo: Parallel group studies, no oral steroids: 100 mcg/d or less (all ages), Outcome 34 Oral Candidiasis (No. of patients). | ||||
| 34.1 Children | 3 | 653 | Peto Odds Ratio (Peto, Fixed, 95% CI) | 1.98 [0.40, 9.85] |
| 34.2 Adults | 4 | 645 | Peto Odds Ratio (Peto, Fixed, 95% CI) | 4.84 [1.39, 16.88] |
| 35 Headaches Show forest plot | 3 | 957 | Odds Ratio (M‐H, Fixed, 95% CI) | 0.82 [0.58, 1.17] |
| Analysis 1.35  Comparison 1 FP versus placebo: Parallel group studies, no oral steroids: 100 mcg/d or less (all ages), Outcome 35 Headaches. | ||||
| 35.1 Children | 1 | 604 | Odds Ratio (M‐H, Fixed, 95% CI) | 0.74 [0.50, 1.10] |
| 35.2 Adults | 2 | 353 | Odds Ratio (M‐H, Fixed, 95% CI) | 1.22 [0.57, 2.59] |
| Outcome or subgroup title | No. of studies | No. of participants | Statistical method | Effect size |
| 1 Change in FEV1 compared to baseline (litres) Show forest plot | 10 | 1673 | Litres (Fixed, 95% CI) | 0.21 [0.18, 0.25] |
| Analysis 2.1  Comparison 2 FP versus placebo: Parallel group studies, no oral steroids: 100 mcg/d or less (all treatment durations), Outcome 1 Change in FEV1 compared to baseline (litres). | ||||
| 1.1 1‐4 weeks | 0 | 0 | Litres (Fixed, 95% CI) | 0.0 [0.0, 0.0] |
| 1.2 1‐5 months | 10 | 1673 | Litres (Fixed, 95% CI) | 0.21 [0.18, 0.25] |
| 1.3 6 months or longer | 0 | 0 | Litres (Fixed, 95% CI) | 0.0 [0.0, 0.0] |
| 2 Change in morning PEFR compared to baseline (L/min) Show forest plot | 10 | 1705 | Mean Difference (IV, Fixed, 95% CI) | 22.79 [19.07, 26.51] |
| Analysis 2.2  Comparison 2 FP versus placebo: Parallel group studies, no oral steroids: 100 mcg/d or less (all treatment durations), Outcome 2 Change in morning PEFR compared to baseline (L/min). | ||||
| 2.1 1‐4 weeks | 0 | 0 | Mean Difference (IV, Fixed, 95% CI) | 0.0 [0.0, 0.0] |
| 2.2 1‐5 months | 10 | 1705 | Mean Difference (IV, Fixed, 95% CI) | 22.79 [19.07, 26.51] |
| 2.3 6 months or longer | 0 | 0 | Mean Difference (IV, Fixed, 95% CI) | 0.0 [0.0, 0.0] |
| 3 Change in evening PEFR compared to baseline Show forest plot | 9 | 1954 | Litres/min (Fixed, 95% CI) | 12.08 [8.87, 15.30] |
| Analysis 2.3  Comparison 2 FP versus placebo: Parallel group studies, no oral steroids: 100 mcg/d or less (all treatment durations), Outcome 3 Change in evening PEFR compared to baseline. | ||||
| 3.1 1‐4 weeks | 0 | 0 | Litres/min (Fixed, 95% CI) | 0.0 [0.0, 0.0] |
| 3.2 1‐5 months | 9 | 1954 | Litres/min (Fixed, 95% CI) | 12.08 [8.87, 15.30] |
| 3.3 6 months or greater | 0 | 0 | Litres/min (Fixed, 95% CI) | 0.0 [0.0, 0.0] |
| 4 Change in daily asthma symptom score compared to baseline Show forest plot | 8 | 1238 | Std. Mean Difference (IV, Fixed, 95% CI) | ‐0.57 [‐0.69, ‐0.46] |
| Analysis 2.4  Comparison 2 FP versus placebo: Parallel group studies, no oral steroids: 100 mcg/d or less (all treatment durations), Outcome 4 Change in daily asthma symptom score compared to baseline. | ||||
| 4.1 1‐4 weeks | 0 | 0 | Std. Mean Difference (IV, Fixed, 95% CI) | 0.0 [0.0, 0.0] |
| 4.2 1‐5 months | 8 | 1238 | Std. Mean Difference (IV, Fixed, 95% CI) | ‐0.57 [‐0.69, ‐0.46] |
| 4.3 6 months or longer | 0 | 0 | Std. Mean Difference (IV, Fixed, 95% CI) | 0.0 [0.0, 0.0] |
| 5 Change in number night‐time wakenings per week Show forest plot | 4 | 648 | Mean Difference (IV, Fixed, 95% CI) | ‐0.11 [‐0.17, ‐0.05] |
| Analysis 2.5  Comparison 2 FP versus placebo: Parallel group studies, no oral steroids: 100 mcg/d or less (all treatment durations), Outcome 5 Change in number night‐time wakenings per week. | ||||
| 5.1 1‐4 weeks | 0 | 0 | Mean Difference (IV, Fixed, 95% CI) | 0.0 [0.0, 0.0] |
| 5.2 1‐5 months | 4 | 648 | Mean Difference (IV, Fixed, 95% CI) | ‐0.11 [‐0.17, ‐0.05] |
| 5.3 6 months or longer | 0 | 0 | Mean Difference (IV, Fixed, 95% CI) | 0.0 [0.0, 0.0] |
| 6 Change in night‐time wakening score Show forest plot | 6 | 895 | Std. Mean Difference (IV, Fixed, 95% CI) | ‐0.25 [‐0.38, ‐0.12] |
| Analysis 2.6  Comparison 2 FP versus placebo: Parallel group studies, no oral steroids: 100 mcg/d or less (all treatment durations), Outcome 6 Change in night‐time wakening score. | ||||
| 6.1 1‐4 weeks | 0 | 0 | Std. Mean Difference (IV, Fixed, 95% CI) | 0.0 [0.0, 0.0] |
| 6.2 1‐5 months | 6 | 895 | Std. Mean Difference (IV, Fixed, 95% CI) | ‐0.25 [‐0.38, ‐0.12] |
| 6.3 6 months or longer | 0 | 0 | Std. Mean Difference (IV, Fixed, 95% CI) | 0.0 [0.0, 0.0] |
| 7 Change in daily use of beta2 agonist compared to baseline (puffs/d) Show forest plot | 9 | 1839 | Mean Difference (IV, Fixed, 95% CI) | ‐0.94 [‐1.14, ‐0.74] |
| Analysis 2.7  Comparison 2 FP versus placebo: Parallel group studies, no oral steroids: 100 mcg/d or less (all treatment durations), Outcome 7 Change in daily use of beta2 agonist compared to baseline (puffs/d). | ||||
| 7.1 1‐4 weeks | 0 | 0 | Mean Difference (IV, Fixed, 95% CI) | 0.0 [0.0, 0.0] |
| 7.2 1‐5 months | 9 | 1839 | Mean Difference (IV, Fixed, 95% CI) | ‐0.94 [‐1.14, ‐0.74] |
| 7.3 6 months or longer | 0 | 0 | Mean Difference (IV, Fixed, 95% CI) | 0.0 [0.0, 0.0] |
| 8 Physician‐rated efficacy: effective or very effective Show forest plot | 4 | 664 | Peto Odds Ratio (Peto, Fixed, 95% CI) | 5.12 [3.76, 6.98] |
| Analysis 2.8  Comparison 2 FP versus placebo: Parallel group studies, no oral steroids: 100 mcg/d or less (all treatment durations), Outcome 8 Physician‐rated efficacy: effective or very effective. | ||||
| 8.1 1‐4 weeks | 0 | 0 | Peto Odds Ratio (Peto, Fixed, 95% CI) | 0.0 [0.0, 0.0] |
| 8.2 1‐5 months | 4 | 664 | Peto Odds Ratio (Peto, Fixed, 95% CI) | 5.12 [3.76, 6.98] |
| 8.3 6 months or greater | 0 | 0 | Peto Odds Ratio (Peto, Fixed, 95% CI) | 0.0 [0.0, 0.0] |
| 9 Withdrawal due to lack of treatment efficacy (No. of patients) Show forest plot | 8 | 1479 | Peto Odds Ratio (Peto, Fixed, 95% CI) | 0.26 [0.20, 0.32] |
| Analysis 2.9  Comparison 2 FP versus placebo: Parallel group studies, no oral steroids: 100 mcg/d or less (all treatment durations), Outcome 9 Withdrawal due to lack of treatment efficacy (No. of patients). | ||||
| 9.1 1‐4 weeks | 0 | 0 | Peto Odds Ratio (Peto, Fixed, 95% CI) | 0.0 [0.0, 0.0] |
| 9.2 1‐5 months | 8 | 1479 | Peto Odds Ratio (Peto, Fixed, 95% CI) | 0.26 [0.20, 0.32] |
| 9.3 6 months or greater | 0 | 0 | Peto Odds Ratio (Peto, Fixed, 95% CI) | 0.0 [0.0, 0.0] |
| 10 Sore throat or pharyngitis (No. of patients) Show forest plot | 6 | 1336 | Peto Odds Ratio (Peto, Fixed, 95% CI) | 1.98 [0.97, 4.04] |
| Analysis 2.10  Comparison 2 FP versus placebo: Parallel group studies, no oral steroids: 100 mcg/d or less (all treatment durations), Outcome 10 Sore throat or pharyngitis (No. of patients). | ||||
| 10.1 1‐4 weeks | 1 | 38 | Peto Odds Ratio (Peto, Fixed, 95% CI) | 2.38 [0.31, 18.63] |
| 10.2 1‐5 months | 4 | 1081 | Peto Odds Ratio (Peto, Fixed, 95% CI) | 1.71 [0.73, 3.98] |
| 10.3 6 months or greater | 1 | 217 | Peto Odds Ratio (Peto, Fixed, 95% CI) | 3.24 [0.55, 19.04] |
| 11 Hoarseness or dysphonia (No. of patients) Show forest plot | 7 | 1215 | Peto Odds Ratio (Peto, Fixed, 95% CI) | 5.00 [1.53, 16.37] |
| Analysis 2.11  Comparison 2 FP versus placebo: Parallel group studies, no oral steroids: 100 mcg/d or less (all treatment durations), Outcome 11 Hoarseness or dysphonia (No. of patients). | ||||
| 11.1 1‐4 weeks | 0 | 0 | Peto Odds Ratio (Peto, Fixed, 95% CI) | 0.0 [0.0, 0.0] |
| 11.2 1‐5 months | 6 | 998 | Peto Odds Ratio (Peto, Fixed, 95% CI) | 4.36 [1.09, 17.52] |
| 11.3 6 months or greater | 1 | 217 | Peto Odds Ratio (Peto, Fixed, 95% CI) | 7.19 [0.74, 69.93] |
| 12 Oral Candidiasis (No. of patients) Show forest plot | 7 | 1298 | Peto Odds Ratio (Peto, Fixed, 95% CI) | 3.45 [1.29, 9.26] |
| Analysis 2.12  Comparison 2 FP versus placebo: Parallel group studies, no oral steroids: 100 mcg/d or less (all treatment durations), Outcome 12 Oral Candidiasis (No. of patients). | ||||
| 12.1 1‐4 weeks | 1 | 258 | Peto Odds Ratio (Peto, Fixed, 95% CI) | 0.14 [0.00, 6.93] |
| 12.2 1‐5 months | 5 | 823 | Peto Odds Ratio (Peto, Fixed, 95% CI) | 3.77 [1.21, 11.79] |
| 12.3 6 months or greater | 1 | 217 | Peto Odds Ratio (Peto, Fixed, 95% CI) | 7.19 [0.74, 69.93] |
| 13 Withdrawals due to adverse events Show forest plot | 3 | 957 | Odds Ratio (M‐H, Fixed, 95% CI) | 1.11 [0.38, 3.20] |
| Analysis 2.13  Comparison 2 FP versus placebo: Parallel group studies, no oral steroids: 100 mcg/d or less (all treatment durations), Outcome 13 Withdrawals due to adverse events. | ||||
| 13.1 1‐4 weeks | 0 | 0 | Odds Ratio (M‐H, Fixed, 95% CI) | 0.0 [0.0, 0.0] |
| 13.2 1‐5 months | 3 | 957 | Odds Ratio (M‐H, Fixed, 95% CI) | 1.11 [0.38, 3.20] |
| 13.3 6 months or greater | 0 | 0 | Odds Ratio (M‐H, Fixed, 95% CI) | 0.0 [0.0, 0.0] |
| Outcome or subgroup title | No. of studies | No. of participants | Statistical method | Effect size |
| 1 Change in FEV1 compared to baseline (litres) Show forest plot | 10 | 1673 | Litres (Fixed, 95% CI) | 0.21 [0.18, 0.25] |
| Analysis 3.1  Comparison 3 FP versus placebo: Parallel group studies, no oral steroids: 100 mcg/d or less (all delivery devices), Outcome 1 Change in FEV1 compared to baseline (litres). | ||||
| 1.1 MDI | 4 | 559 | Litres (Fixed, 95% CI) | 0.40 [0.32, 0.48] |
| 1.2 DPI | 6 | 1114 | Litres (Fixed, 95% CI) | 0.16 [0.12, 0.21] |
| 2 Change in morning PEFR compared to baseline (L/min) Show forest plot | 10 | 1705 | Mean Difference (IV, Fixed, 95% CI) | 22.79 [19.07, 26.51] |
| Analysis 3.2  Comparison 3 FP versus placebo: Parallel group studies, no oral steroids: 100 mcg/d or less (all delivery devices), Outcome 2 Change in morning PEFR compared to baseline (L/min). | ||||
| 2.1 MDI | 5 | 868 | Mean Difference (IV, Fixed, 95% CI) | 17.86 [12.36, 23.35] |
| 2.2 DPI | 5 | 837 | Mean Difference (IV, Fixed, 95% CI) | 26.98 [21.92, 32.04] |
| 3 Change in evening PEFR compared to baseline Show forest plot | 9 | 1954 | Litres/min (Fixed, 95% CI) | 12.08 [8.87, 15.30] |
| Analysis 3.3  Comparison 3 FP versus placebo: Parallel group studies, no oral steroids: 100 mcg/d or less (all delivery devices), Outcome 3 Change in evening PEFR compared to baseline. | ||||
| 3.1 MDI | 3 | 381 | Litres/min (Fixed, 95% CI) | 19.11 [12.08, 26.14] |
| 3.2 DPI | 6 | 1573 | Litres/min (Fixed, 95% CI) | 10.22 [6.61, 13.84] |
| 4 Change in daily asthma symptom score compared to baseline Show forest plot | 8 | 1238 | Std. Mean Difference (IV, Fixed, 95% CI) | ‐0.57 [‐0.69, ‐0.46] |
| Analysis 3.4  Comparison 3 FP versus placebo: Parallel group studies, no oral steroids: 100 mcg/d or less (all delivery devices), Outcome 4 Change in daily asthma symptom score compared to baseline. | ||||
| 4.1 MDI | 4 | 559 | Std. Mean Difference (IV, Fixed, 95% CI) | ‐0.52 [‐0.69, ‐0.35] |
| 4.2 DPI | 4 | 679 | Std. Mean Difference (IV, Fixed, 95% CI) | ‐0.62 [‐0.78, ‐0.47] |
| 5 Change in number night‐time wakenings per week Show forest plot | 4 | 648 | Mean Difference (IV, Fixed, 95% CI) | ‐0.11 [‐0.17, ‐0.05] |
| Analysis 3.5  Comparison 3 FP versus placebo: Parallel group studies, no oral steroids: 100 mcg/d or less (all delivery devices), Outcome 5 Change in number night‐time wakenings per week. | ||||
| 5.1 MDI | 3 | 488 | Mean Difference (IV, Fixed, 95% CI) | ‐0.09 [‐0.16, ‐0.02] |
| 5.2 DPI | 1 | 160 | Mean Difference (IV, Fixed, 95% CI) | ‐0.18 [‐0.31, ‐0.05] |
| 6 Change in night‐time wakening score Show forest plot | 6 | 895 | Std. Mean Difference (IV, Fixed, 95% CI) | ‐0.25 [‐0.38, ‐0.12] |
| Analysis 3.6  Comparison 3 FP versus placebo: Parallel group studies, no oral steroids: 100 mcg/d or less (all delivery devices), Outcome 6 Change in night‐time wakening score. | ||||
| 6.1 MDI | 4 | 559 | Std. Mean Difference (IV, Fixed, 95% CI) | ‐0.18 [‐0.35, ‐0.02] |
| 6.2 DPI | 2 | 336 | Std. Mean Difference (IV, Fixed, 95% CI) | ‐0.36 [‐0.58, ‐0.14] |
| 7 Change in daily use of beta2 agonist compared to baseline (puffs/d) Show forest plot | 9 | 1839 | Mean Difference (IV, Fixed, 95% CI) | ‐0.94 [‐1.14, ‐0.74] |
| Analysis 3.7  Comparison 3 FP versus placebo: Parallel group studies, no oral steroids: 100 mcg/d or less (all delivery devices), Outcome 7 Change in daily use of beta2 agonist compared to baseline (puffs/d). | ||||
| 7.1 MDI | 4 | 559 | Mean Difference (IV, Fixed, 95% CI) | ‐1.11 [‐1.48, ‐0.74] |
| 7.2 DPI | 5 | 1280 | Mean Difference (IV, Fixed, 95% CI) | ‐0.87 [‐1.11, ‐0.63] |
| 8 Physician‐rated efficacy: effective or very effective Show forest plot | 4 | 664 | Peto Odds Ratio (Peto, Fixed, 95% CI) | 5.12 [3.76, 6.98] |
| Analysis 3.8  Comparison 3 FP versus placebo: Parallel group studies, no oral steroids: 100 mcg/d or less (all delivery devices), Outcome 8 Physician‐rated efficacy: effective or very effective. | ||||
| 8.1 MDI | 2 | 336 | Peto Odds Ratio (Peto, Fixed, 95% CI) | 5.15 [3.31, 8.02] |
| 8.2 DPI | 2 | 328 | Peto Odds Ratio (Peto, Fixed, 95% CI) | 5.09 [3.30, 7.85] |
| 9 Withdrawal due to lack of treatment efficacy (No. of patients) Show forest plot | 8 | 1479 | Peto Odds Ratio (Peto, Fixed, 95% CI) | 0.26 [0.20, 0.32] |
| Analysis 3.9  Comparison 3 FP versus placebo: Parallel group studies, no oral steroids: 100 mcg/d or less (all delivery devices), Outcome 9 Withdrawal due to lack of treatment efficacy (No. of patients). | ||||
| 9.1 MDI | 4 | 801 | Peto Odds Ratio (Peto, Fixed, 95% CI) | 0.23 [0.16, 0.33] |
| 9.2 DPI | 4 | 678 | Peto Odds Ratio (Peto, Fixed, 95% CI) | 0.28 [0.20, 0.38] |
| 10 Sore throat or pharyngitis (No. of patients) Show forest plot | 6 | 1336 | Peto Odds Ratio (Peto, Fixed, 95% CI) | 1.98 [0.97, 4.04] |
| Analysis 3.10  Comparison 3 FP versus placebo: Parallel group studies, no oral steroids: 100 mcg/d or less (all delivery devices), Outcome 10 Sore throat or pharyngitis (No. of patients). | ||||
| 10.1 MDI | 2 | 187 | Peto Odds Ratio (Peto, Fixed, 95% CI) | 3.02 [0.49, 18.64] |
| 10.2 DPI | 4 | 1149 | Peto Odds Ratio (Peto, Fixed, 95% CI) | 1.83 [0.84, 3.98] |
| 11 Hoarseness or dysphonia (No. of patients) Show forest plot | 7 | 1215 | Peto Odds Ratio (Peto, Fixed, 95% CI) | 5.00 [1.53, 16.37] |
| Analysis 3.11  Comparison 3 FP versus placebo: Parallel group studies, no oral steroids: 100 mcg/d or less (all delivery devices), Outcome 11 Hoarseness or dysphonia (No. of patients). | ||||
| 11.1 MDI | 3 | 492 | Peto Odds Ratio (Peto, Fixed, 95% CI) | 3.71 [0.74, 18.49] |
| 11.2 DPI | 4 | 723 | Peto Odds Ratio (Peto, Fixed, 95% CI) | 7.15 [1.23, 41.51] |
| 12 Oral Candidiasis (No. of patients) Show forest plot | 7 | 1298 | Peto Odds Ratio (Peto, Fixed, 95% CI) | 3.45 [1.29, 9.26] |
| Analysis 3.12  Comparison 3 FP versus placebo: Parallel group studies, no oral steroids: 100 mcg/d or less (all delivery devices), Outcome 12 Oral Candidiasis (No. of patients). | ||||
| 12.1 MDI | 2 | 317 | Peto Odds Ratio (Peto, Fixed, 95% CI) | 3.19 [0.54, 18.68] |
| 12.2 DPI | 5 | 981 | Peto Odds Ratio (Peto, Fixed, 95% CI) | 3.58 [1.09, 11.75] |
| 13 Withdrawals due to adverse events Show forest plot | 3 | 957 | Odds Ratio (M‐H, Fixed, 95% CI) | 1.11 [0.38, 3.20] |
| Analysis 3.13  Comparison 3 FP versus placebo: Parallel group studies, no oral steroids: 100 mcg/d or less (all delivery devices), Outcome 13 Withdrawals due to adverse events. | ||||
| 13.1 MDI | 2 | 353 | Odds Ratio (M‐H, Fixed, 95% CI) | 0.90 [0.15, 5.43] |
| 13.2 DPI | 1 | 604 | Odds Ratio (M‐H, Fixed, 95% CI) | 1.24 [0.33, 4.65] |
| Outcome or subgroup title | No. of studies | No. of participants | Statistical method | Effect size |
| 1 Change in FEV1 compared to baseline (litres) Show forest plot | 10 | 1673 | Litres (Fixed, 95% CI) | 0.21 [0.18, 0.25] |
| Analysis 4.1  Comparison 4 FP versus placebo: Parallel group studies, no oral steroids: 100 mcg/d or less (all degrees asthma severity), Outcome 1 Change in FEV1 compared to baseline (litres). | ||||
| 1.1 Mild | 1 | 309 | Litres (Fixed, 95% CI) | 0.02 [‐0.06, 0.10] |
| 1.2 Mild to moderate | 1 | 158 | Litres (Fixed, 95% CI) | 0.35 [0.19, 0.51] |
| 1.3 Moderate | 8 | 1206 | Litres (Fixed, 95% CI) | 0.26 [0.22, 0.31] |
| 2 Change in morning PEFR compared to baseline (L/min) Show forest plot | 10 | 1705 | Mean Difference (IV, Fixed, 95% CI) | 22.79 [19.07, 26.51] |
| Analysis 4.2  Comparison 4 FP versus placebo: Parallel group studies, no oral steroids: 100 mcg/d or less (all degrees asthma severity), Outcome 2 Change in morning PEFR compared to baseline (L/min). | ||||
| 2.1 Mild | 1 | 309 | Mean Difference (IV, Fixed, 95% CI) | 8.60 [0.84, 16.36] |
| 2.2 Mild to moderate | 1 | 158 | Mean Difference (IV, Fixed, 95% CI) | 30.0 [17.98, 42.02] |
| 2.3 Moderate | 8 | 1238 | Mean Difference (IV, Fixed, 95% CI) | 26.61 [22.08, 31.14] |
| 3 Change in evening PEFR compared to baseline Show forest plot | 9 | 1954 | Litres/min (Fixed, 95% CI) | 12.08 [8.87, 15.30] |
| Analysis 4.3  Comparison 4 FP versus placebo: Parallel group studies, no oral steroids: 100 mcg/d or less (all degrees asthma severity), Outcome 3 Change in evening PEFR compared to baseline. | ||||
| 3.1 Mild | 2 | 913 | Litres/min (Fixed, 95% CI) | 5.92 [1.52, 10.33] |
| 3.2 Mild to moderate | 1 | 158 | Litres/min (Fixed, 95% CI) | 30.00 [19.32, 40.68] |
| 3.3 Moderate | 6 | 883 | Litres/min (Fixed, 95% CI) | 16.51 [11.26, 21.76] |
| 7 Change in daily asthma symptom score compared to baseline Show forest plot | 8 | 1238 | Std. Mean Difference (IV, Fixed, 95% CI) | ‐0.57 [‐0.69, ‐0.46] |
| Analysis 4.7  Comparison 4 FP versus placebo: Parallel group studies, no oral steroids: 100 mcg/d or less (all degrees asthma severity), Outcome 7 Change in daily asthma symptom score compared to baseline. | ||||
| 7.1 Mild | 0 | 0 | Std. Mean Difference (IV, Fixed, 95% CI) | 0.0 [0.0, 0.0] |
| 7.2 Mild to moderate | 1 | 158 | Std. Mean Difference (IV, Fixed, 95% CI) | ‐0.53 [‐0.85, ‐0.21] |
| 7.3 Moderate | 7 | 1080 | Std. Mean Difference (IV, Fixed, 95% CI) | ‐0.58 [‐0.70, ‐0.46] |
| 8 Change in number night‐time wakenings per week Show forest plot | 4 | 648 | Mean Difference (IV, Fixed, 95% CI) | ‐0.11 [‐0.17, ‐0.05] |
| Analysis 4.8  Comparison 4 FP versus placebo: Parallel group studies, no oral steroids: 100 mcg/d or less (all degrees asthma severity), Outcome 8 Change in number night‐time wakenings per week. | ||||
| 8.1 Mild | 0 | 0 | Mean Difference (IV, Fixed, 95% CI) | 0.0 [0.0, 0.0] |
| 8.2 Mild to moderate | 1 | 158 | Mean Difference (IV, Fixed, 95% CI) | ‐0.12 [‐0.25, 0.01] |
| 8.3 Moderate | 3 | 490 | Mean Difference (IV, Fixed, 95% CI) | ‐0.11 [‐0.18, ‐0.04] |
| 9 Change in night‐time wakening score Show forest plot | 6 | 895 | Std. Mean Difference (IV, Fixed, 95% CI) | ‐0.25 [‐0.38, ‐0.12] |
| Analysis 4.9  Comparison 4 FP versus placebo: Parallel group studies, no oral steroids: 100 mcg/d or less (all degrees asthma severity), Outcome 9 Change in night‐time wakening score. | ||||
| 9.1 Mild | 0 | 0 | Std. Mean Difference (IV, Fixed, 95% CI) | 0.0 [0.0, 0.0] |
| 9.2 Mild to moderate | 1 | 158 | Std. Mean Difference (IV, Fixed, 95% CI) | ‐0.29 [‐0.61, 0.02] |
| 9.3 Moderate | 5 | 737 | Std. Mean Difference (IV, Fixed, 95% CI) | ‐0.24 [‐0.38, ‐0.09] |
| 10 Change in daily use of beta2 agonist compared to baseline (puffs/d) Show forest plot | 9 | 1839 | Mean Difference (IV, Fixed, 95% CI) | ‐0.94 [‐1.14, ‐0.74] |
| Analysis 4.10  Comparison 4 FP versus placebo: Parallel group studies, no oral steroids: 100 mcg/d or less (all degrees asthma severity), Outcome 10 Change in daily use of beta2 agonist compared to baseline (puffs/d). | ||||
| 10.1 Mild | 1 | 604 | Mean Difference (IV, Fixed, 95% CI) | ‐0.40 [‐0.76, ‐0.04] |
| 10.2 Mild to moderate | 1 | 158 | Mean Difference (IV, Fixed, 95% CI) | ‐0.83 [‐1.38, ‐0.28] |
| 10.3 Moderate | 7 | 1077 | Mean Difference (IV, Fixed, 95% CI) | ‐1.26 [‐1.52, ‐0.99] |
| 16 Physician‐rated efficacy: effective or very effective Show forest plot | 4 | 664 | Peto Odds Ratio (Peto, Fixed, 95% CI) | 5.12 [3.76, 6.98] |
| Analysis 4.16  Comparison 4 FP versus placebo: Parallel group studies, no oral steroids: 100 mcg/d or less (all degrees asthma severity), Outcome 16 Physician‐rated efficacy: effective or very effective. | ||||
| 16.1 Mild | 0 | 0 | Peto Odds Ratio (Peto, Fixed, 95% CI) | 0.0 [0.0, 0.0] |
| 16.2 Mild to moderate | 1 | 158 | Peto Odds Ratio (Peto, Fixed, 95% CI) | 5.06 [2.65, 9.67] |
| 16.3 Moderate | 3 | 506 | Peto Odds Ratio (Peto, Fixed, 95% CI) | 5.14 [3.61, 7.31] |
| 18 Withdrawal due to lack of treatment efficacy (No. of patients) Show forest plot | 8 | 1479 | Peto Odds Ratio (Peto, Fixed, 95% CI) | 0.26 [0.20, 0.32] |
| Analysis 4.18  Comparison 4 FP versus placebo: Parallel group studies, no oral steroids: 100 mcg/d or less (all degrees asthma severity), Outcome 18 Withdrawal due to lack of treatment efficacy (No. of patients). | ||||
| 18.1 Mild | 1 | 313 | Peto Odds Ratio (Peto, Fixed, 95% CI) | 7.53 [0.15, 379.73] |
| 18.2 Mild to moderate | 1 | 158 | Peto Odds Ratio (Peto, Fixed, 95% CI) | 0.20 [0.11, 0.38] |
| 18.3 Moderate | 6 | 1008 | Peto Odds Ratio (Peto, Fixed, 95% CI) | 0.26 [0.20, 0.34] |
| 21 Sore throat or pharyngitis (No. of patients) Show forest plot | 6 | 1336 | Odds Ratio (M‐H, Fixed, 95% CI) | 1.95 [0.93, 4.06] |
| Analysis 4.21  Comparison 4 FP versus placebo: Parallel group studies, no oral steroids: 100 mcg/d or less (all degrees asthma severity), Outcome 21 Sore throat or pharyngitis (No. of patients). | ||||
| 21.1 Mild | 1 | 604 | Odds Ratio (M‐H, Fixed, 95% CI) | 1.42 [0.53, 3.79] |
| 21.2 Mild to moderate | 2 | 255 | Odds Ratio (M‐H, Fixed, 95% CI) | 3.31 [0.66, 16.51] |
| 21.3 Moderate | 3 | 477 | Odds Ratio (M‐H, Fixed, 95% CI) | 2.41 [0.46, 12.65] |
| 22 Hoarseness or dysphonia (No. of patients) Show forest plot | 7 | 1215 | Odds Ratio (M‐H, Fixed, 95% CI) | 3.50 [1.06, 11.52] |
| Analysis 4.22  Comparison 4 FP versus placebo: Parallel group studies, no oral steroids: 100 mcg/d or less (all degrees asthma severity), Outcome 22 Hoarseness or dysphonia (No. of patients). | ||||
| 22.1 Mild | 0 | 0 | Odds Ratio (M‐H, Fixed, 95% CI) | 0.0 [0.0, 0.0] |
| 22.2 Mild to moderate | 2 | 382 | Odds Ratio (M‐H, Fixed, 95% CI) | 4.99 [0.58, 43.17] |
| 22.3 Moderate | 5 | 833 | Odds Ratio (M‐H, Fixed, 95% CI) | 2.91 [0.69, 12.29] |
| 23 Oral Candidiasis (No. of patients) Show forest plot | 7 | 1298 | Odds Ratio (M‐H, Fixed, 95% CI) | 2.81 [1.05, 7.48] |
| Analysis 4.23  Comparison 4 FP versus placebo: Parallel group studies, no oral steroids: 100 mcg/d or less (all degrees asthma severity), Outcome 23 Oral Candidiasis (No. of patients). | ||||
| 23.1 Mild | 0 | 0 | Odds Ratio (M‐H, Fixed, 95% CI) | 0.0 [0.0, 0.0] |
| 23.2 Mild to moderate | 3 | 560 | Odds Ratio (M‐H, Fixed, 95% CI) | 3.08 [0.61, 15.51] |
| 23.3 Moderate | 4 | 738 | Odds Ratio (M‐H, Fixed, 95% CI) | 2.65 [0.77, 9.11] |
| 24 Withdrawals due to adverse events Show forest plot | 3 | 957 | Odds Ratio (M‐H, Fixed, 95% CI) | 1.11 [0.38, 3.20] |
| Analysis 4.24  Comparison 4 FP versus placebo: Parallel group studies, no oral steroids: 100 mcg/d or less (all degrees asthma severity), Outcome 24 Withdrawals due to adverse events. | ||||
| 24.1 Mild | 2 | 917 | Odds Ratio (M‐H, Fixed, 95% CI) | 0.99 [0.32, 3.11] |
| 24.2 Mild to moderate | 1 | 40 | Odds Ratio (M‐H, Fixed, 95% CI) | 2.33 [0.09, 60.84] |
| 24.3 Moderate | 0 | 0 | Odds Ratio (M‐H, Fixed, 95% CI) | 0.0 [0.0, 0.0] |
| Outcome or subgroup title | No. of studies | No. of participants | Statistical method | Effect size |
| 1 Change in FEV1 compared to baseline (litres) Show forest plot | 21 | 4790 | Mean Difference (IV, Fixed, 95% CI) | 0.24 [0.21, 0.26] |
| Analysis 5.1  Comparison 5 FP versus placebo: Parallel group studies, no oral steroids: 200 mcg/d (all ages), Outcome 1 Change in FEV1 compared to baseline (litres). | ||||
| 1.1 Children | 2 | 331 | Mean Difference (IV, Fixed, 95% CI) | 0.19 [0.12, 0.25] |
| 1.2 Adults | 19 | 4459 | Mean Difference (IV, Fixed, 95% CI) | 0.25 [0.22, 0.27] |
| 2 Change in FEV1 compared to baseline (imputed estimates) Show forest plot | 22 | 4936 | Litres (Fixed, 95% CI) | 0.24 [0.21, 0.26] |
| Analysis 5.2  Comparison 5 FP versus placebo: Parallel group studies, no oral steroids: 200 mcg/d (all ages), Outcome 2 Change in FEV1 compared to baseline (imputed estimates). | ||||
| 2.1 Children | 3 | 477 | Litres (Fixed, 95% CI) | 0.18 [0.13, 0.24] |
| 2.2 Adults | 19 | 4459 | Litres (Fixed, 95% CI) | 0.25 [0.22, 0.28] |
| 3 Change in FEV1 (% predicted) Show forest plot | 5 | 674 | % (Fixed, 95% CI) | 9.95 [7.98, 11.91] |
| Analysis 5.3  Comparison 5 FP versus placebo: Parallel group studies, no oral steroids: 200 mcg/d (all ages), Outcome 3 Change in FEV1 (% predicted). | ||||
| 3.1 Children | 2 | 192 | % (Fixed, 95% CI) | 11.28 [7.62, 14.94] |
| 3.2 Adults | 3 | 482 | % (Fixed, 95% CI) | 9.41 [7.07, 11.74] |
| 4 Change in FEV1 (%) Show forest plot | 2 | 280 | Mean Difference (IV, Fixed, 95% CI) | 13.05 [7.85, 18.25] |
| Analysis 5.4  Comparison 5 FP versus placebo: Parallel group studies, no oral steroids: 200 mcg/d (all ages), Outcome 4 Change in FEV1 (%). | ||||
| 4.1 Children | 0 | 0 | Mean Difference (IV, Fixed, 95% CI) | 0.0 [0.0, 0.0] |
| 4.2 Adults | 2 | 280 | Mean Difference (IV, Fixed, 95% CI) | 13.05 [7.85, 18.25] |
| 5 FEV1 (% predicted ‐ absolute values) Show forest plot | 4 | 157 | % (Fixed, 95% CI) | 4.22 [0.94, 7.50] |
| Analysis 5.5  Comparison 5 FP versus placebo: Parallel group studies, no oral steroids: 200 mcg/d (all ages), Outcome 5 FEV1 (% predicted ‐ absolute values). | ||||
| 5.1 Children | 3 | 125 | % (Fixed, 95% CI) | 5.92 [2.22, 9.62] |
| 5.2 Adults | 1 | 32 | % (Fixed, 95% CI) | ‐2.0 [‐9.08, 5.08] |
| 6 FEV1 (absolute values) Show forest plot | 2 | 86 | Litres (Fixed, 95% CI) | 0.06 [‐0.00, 0.13] |
| Analysis 5.6  Comparison 5 FP versus placebo: Parallel group studies, no oral steroids: 200 mcg/d (all ages), Outcome 6 FEV1 (absolute values). | ||||
| 6.1 Children | 1 | 68 | Litres (Fixed, 95% CI) | 0.06 [‐0.00, 0.12] |
| 6.2 Adults | 1 | 18 | Litres (Fixed, 95% CI) | 0.59 [‐0.31, 1.49] |
| 7 Change in morning PEFR compared with baseline Show forest plot | 24 | 5117 | Litres/min (Fixed, 95% CI) | 26.96 [24.51, 29.40] |
| Analysis 5.7  Comparison 5 FP versus placebo: Parallel group studies, no oral steroids: 200 mcg/d (all ages), Outcome 7 Change in morning PEFR compared with baseline. | ||||
| 7.1 Children | 5 | 611 | Litres/min (Fixed, 95% CI) | 25.68 [20.09, 31.27] |
| 7.2 Adults | 19 | 4506 | Litres/min (Fixed, 95% CI) | 27.26 [24.54, 29.98] |
| 8 Change in morning PEFR compared to baseline (L/min) Show forest plot | 21 | 3752 | Mean Difference (IV, Fixed, 95% CI) | 29.29 [26.44, 32.14] |
| Analysis 5.8  Comparison 5 FP versus placebo: Parallel group studies, no oral steroids: 200 mcg/d (all ages), Outcome 8 Change in morning PEFR compared to baseline (L/min). | ||||
| 8.1 Children | 3 | 509 | Mean Difference (IV, Fixed, 95% CI) | 27.50 [20.79, 34.21] |
| 8.2 Adults | 18 | 3243 | Mean Difference (IV, Fixed, 95% CI) | 29.69 [26.54, 32.83] |
| 9 Mean change in am PEF (% predicted) Show forest plot | 2 | 665 | % (Fixed, 95% CI) | 4.49 [2.92, 6.05] |
| Analysis 5.9  Comparison 5 FP versus placebo: Parallel group studies, no oral steroids: 200 mcg/d (all ages), Outcome 9 Mean change in am PEF (% predicted). | ||||
| 9.1 Children | 1 | 241 | % (Fixed, 95% CI) | 6.0 [2.08, 9.92] |
| 9.2 Adults | 1 | 424 | % (Fixed, 95% CI) | 4.2 [2.49, 5.91] |
| 10 Change in evening PEFR compared to baseline (L/min) Show forest plot | 15 | 3118 | Mean Difference (IV, Fixed, 95% CI) | 21.33 [18.26, 24.40] |
| Analysis 5.10  Comparison 5 FP versus placebo: Parallel group studies, no oral steroids: 200 mcg/d (all ages), Outcome 10 Change in evening PEFR compared to baseline (L/min). | ||||
| 10.1 Children | 2 | 331 | Mean Difference (IV, Fixed, 95% CI) | 20.77 [13.06, 28.47] |
| 10.2 Adults | 13 | 2787 | Mean Difference (IV, Fixed, 95% CI) | 21.44 [18.09, 24.79] |
| 11 Change in evening PEFR compared to baseline Show forest plot | 16 | 3283 | Litres/min (Fixed, 95% CI) | 21.59 [18.55, 24.62] |
| Analysis 5.11  Comparison 5 FP versus placebo: Parallel group studies, no oral steroids: 200 mcg/d (all ages), Outcome 11 Change in evening PEFR compared to baseline. | ||||
| 11.1 Children | 2 | 331 | Litres/min (Fixed, 95% CI) | 20.77 [13.07, 28.46] |
| 11.2 Adults | 14 | 2952 | Litres/min (Fixed, 95% CI) | 21.74 [18.44, 25.03] |
| 12 Change in clinic PEFR compared to baseline (L/min) Show forest plot | 1 | Mean Difference (IV, Fixed, 95% CI) | Totals not selected | |
| Analysis 5.12  Comparison 5 FP versus placebo: Parallel group studies, no oral steroids: 200 mcg/d (all ages), Outcome 12 Change in clinic PEFR compared to baseline (L/min). | ||||
| 12.1 Children | 1 | Mean Difference (IV, Fixed, 95% CI) | 0.0 [0.0, 0.0] | |
| 12.2 Adults | 0 | Mean Difference (IV, Fixed, 95% CI) | 0.0 [0.0, 0.0] | |
| 13 Peak flow L/min (absolute values) Show forest plot | 2 | 50 | Mean Difference (IV, Fixed, 95% CI) | 68.07 [7.89, 128.25] |
| Analysis 5.13  Comparison 5 FP versus placebo: Parallel group studies, no oral steroids: 200 mcg/d (all ages), Outcome 13 Peak flow L/min (absolute values). | ||||
| 13.1 Children | 0 | 0 | Mean Difference (IV, Fixed, 95% CI) | 0.0 [0.0, 0.0] |
| 13.2 Adults | 2 | 50 | Mean Difference (IV, Fixed, 95% CI) | 68.07 [7.89, 128.25] |
| 14 Change in FVC compared to baseline (litres) Show forest plot | 1 | Mean Difference (IV, Fixed, 95% CI) | Totals not selected | |
| Analysis 5.14  Comparison 5 FP versus placebo: Parallel group studies, no oral steroids: 200 mcg/d (all ages), Outcome 14 Change in FVC compared to baseline (litres). | ||||
| 14.1 Children | 0 | Mean Difference (IV, Fixed, 95% CI) | 0.0 [0.0, 0.0] | |
| 14.2 Adults | 1 | Mean Difference (IV, Fixed, 95% CI) | 0.0 [0.0, 0.0] | |
| 15 Change in FEF25‐75 compared to baseline (L/second) Show forest plot | 2 | 1423 | Mean Difference (IV, Fixed, 95% CI) | 0.25 [0.16, 0.34] |
| Analysis 5.15  Comparison 5 FP versus placebo: Parallel group studies, no oral steroids: 200 mcg/d (all ages), Outcome 15 Change in FEF25‐75 compared to baseline (L/second). | ||||
| 15.1 Children | 0 | 0 | Mean Difference (IV, Fixed, 95% CI) | 0.0 [0.0, 0.0] |
| 15.2 Adults | 2 | 1423 | Mean Difference (IV, Fixed, 95% CI) | 0.25 [0.16, 0.34] |
| 16 Histamine BHR (log base 2 PC20 FEV1 mg/ml) Show forest plot | 1 | Mean Difference (IV, Fixed, 95% CI) | Totals not selected | |
| Analysis 5.16  Comparison 5 FP versus placebo: Parallel group studies, no oral steroids: 200 mcg/d (all ages), Outcome 16 Histamine BHR (log base 2 PC20 FEV1 mg/ml). | ||||
| 16.1 Children | 1 | Mean Difference (IV, Fixed, 95% CI) | 0.0 [0.0, 0.0] | |
| 16.2 Adults | 0 | Mean Difference (IV, Fixed, 95% CI) | 0.0 [0.0, 0.0] | |
| 17 Change in daily asthma symptom score compared to baseline Show forest plot | 20 | 3671 | Std. Mean Difference (IV, Fixed, 95% CI) | ‐0.49 [‐0.56, ‐0.43] |
| Analysis 5.17  Comparison 5 FP versus placebo: Parallel group studies, no oral steroids: 200 mcg/d (all ages), Outcome 17 Change in daily asthma symptom score compared to baseline. | ||||
| 17.1 Children | 3 | 509 | Std. Mean Difference (IV, Fixed, 95% CI) | ‐0.55 [‐0.72, ‐0.37] |
| 17.2 Adults | 17 | 3162 | Std. Mean Difference (IV, Fixed, 95% CI) | ‐0.48 [‐0.56, ‐0.41] |
| 18 Change in night‐time wakening score Show forest plot | 6 | 884 | Std. Mean Difference (IV, Fixed, 95% CI) | ‐0.45 [‐0.59, ‐0.32] |
| Analysis 5.18  Comparison 5 FP versus placebo: Parallel group studies, no oral steroids: 200 mcg/d (all ages), Outcome 18 Change in night‐time wakening score. | ||||
| 18.1 Children | 1 | 173 | Std. Mean Difference (IV, Fixed, 95% CI) | ‐0.41 [‐0.71, ‐0.11] |
| 18.2 Adults | 5 | 711 | Std. Mean Difference (IV, Fixed, 95% CI) | ‐0.47 [‐0.62, ‐0.32] |
| 19 Change in symptom free days Show forest plot | 1 | Mean Difference (IV, Fixed, 95% CI) | Totals not selected | |
| Analysis 5.19  Comparison 5 FP versus placebo: Parallel group studies, no oral steroids: 200 mcg/d (all ages), Outcome 19 Change in symptom free days. | ||||
| 19.1 Children | 0 | Mean Difference (IV, Fixed, 95% CI) | 0.0 [0.0, 0.0] | |
| 19.2 Adults | 1 | Mean Difference (IV, Fixed, 95% CI) | 0.0 [0.0, 0.0] | |
| 20 Change from baseline in symptom free days (%) Show forest plot | 3 | 971 | Mean Difference (IV, Fixed, 95% CI) | 7.03 [3.31, 10.75] |
| Analysis 5.20  Comparison 5 FP versus placebo: Parallel group studies, no oral steroids: 200 mcg/d (all ages), Outcome 20 Change from baseline in symptom free days (%). | ||||
| 20.1 Children | 0 | 0 | Mean Difference (IV, Fixed, 95% CI) | 0.0 [0.0, 0.0] |
| 20.2 Adults | 3 | 971 | Mean Difference (IV, Fixed, 95% CI) | 7.03 [3.31, 10.75] |
| 21 Percentage nights without awakening ‐ change from baseline Show forest plot | 2 | 208 | Mean Difference (IV, Fixed, 95% CI) | 10.65 [4.84, 16.46] |
| Analysis 5.21  Comparison 5 FP versus placebo: Parallel group studies, no oral steroids: 200 mcg/d (all ages), Outcome 21 Percentage nights without awakening ‐ change from baseline. | ||||
| 21.1 Children | 0 | 0 | Mean Difference (IV, Fixed, 95% CI) | 0.0 [0.0, 0.0] |
| 21.2 Adults | 2 | 208 | Mean Difference (IV, Fixed, 95% CI) | 10.65 [4.84, 16.46] |
| 22 Change in number night‐time wakenings per week Show forest plot | 4 | 641 | Mean Difference (IV, Fixed, 95% CI) | ‐0.17 [‐0.23, ‐0.12] |
| Analysis 5.22  Comparison 5 FP versus placebo: Parallel group studies, no oral steroids: 200 mcg/d (all ages), Outcome 22 Change in number night‐time wakenings per week. | ||||
| 22.1 Children | 0 | 0 | Mean Difference (IV, Fixed, 95% CI) | 0.0 [0.0, 0.0] |
| 22.2 Adults | 4 | 641 | Mean Difference (IV, Fixed, 95% CI) | ‐0.17 [‐0.23, ‐0.12] |
| 23 Change from baseline in nighttime awakenings/night Show forest plot | 5 | 1359 | Mean Difference (IV, Fixed, 95% CI) | ‐0.12 [‐0.17, ‐0.08] |
| Analysis 5.23  Comparison 5 FP versus placebo: Parallel group studies, no oral steroids: 200 mcg/d (all ages), Outcome 23 Change from baseline in nighttime awakenings/night. | ||||
| 23.1 Children | 1 | 158 | Mean Difference (IV, Fixed, 95% CI) | ‐0.1 [‐0.16, ‐0.04] |
| 23.2 Adults | 4 | 1201 | Mean Difference (IV, Fixed, 95% CI) | ‐0.17 [‐0.24, ‐0.09] |
| 24 Change in nocturnal awakenings (unspecified time) Show forest plot | 2 | 280 | Mean Difference (IV, Fixed, 95% CI) | ‐0.07 [‐0.11, ‐0.02] |
| Analysis 5.24  Comparison 5 FP versus placebo: Parallel group studies, no oral steroids: 200 mcg/d (all ages), Outcome 24 Change in nocturnal awakenings (unspecified time). | ||||
| 24.1 Children | 0 | 0 | Mean Difference (IV, Fixed, 95% CI) | 0.0 [0.0, 0.0] |
| 24.2 Adults | 2 | 280 | Mean Difference (IV, Fixed, 95% CI) | ‐0.07 [‐0.11, ‐0.02] |
| 25 Symptoms (absolute values) Show forest plot | 1 | Mean Difference (IV, Fixed, 95% CI) | Totals not selected | |
| Analysis 5.25  Comparison 5 FP versus placebo: Parallel group studies, no oral steroids: 200 mcg/d (all ages), Outcome 25 Symptoms (absolute values). | ||||
| 25.1 Children | 0 | Mean Difference (IV, Fixed, 95% CI) | 0.0 [0.0, 0.0] | |
| 25.2 Adults | 1 | Mean Difference (IV, Fixed, 95% CI) | 0.0 [0.0, 0.0] | |
| 26 Change in daily use of beta2 agonist compared to baseline (puffs/d) Show forest plot | 20 | 4899 | Mean Difference (IV, Fixed, 95% CI) | ‐1.20 [‐1.34, ‐1.05] |
| Analysis 5.26  Comparison 5 FP versus placebo: Parallel group studies, no oral steroids: 200 mcg/d (all ages), Outcome 26 Change in daily use of beta2 agonist compared to baseline (puffs/d). | ||||
| 26.1 Children | 3 | 509 | Mean Difference (IV, Fixed, 95% CI) | ‐1.04 [‐1.39, ‐0.70] |
| 26.2 Adults | 17 | 4390 | Mean Difference (IV, Fixed, 95% CI) | ‐1.23 [‐1.39, ‐1.07] |
| 27 Change in daily use of beta2 agonist compared to baseline (puffs/d ‐ imputed estimates) Show forest plot | 22 | 5111 | Mean Difference (IV, Fixed, 95% CI) | ‐1.01 [‐1.13, ‐0.88] |
| Analysis 5.27  Comparison 5 FP versus placebo: Parallel group studies, no oral steroids: 200 mcg/d (all ages), Outcome 27 Change in daily use of beta2 agonist compared to baseline (puffs/d ‐ imputed estimates). | ||||
| 27.1 Children | 3 | 509 | Mean Difference (IV, Fixed, 95% CI) | ‐1.04 [‐1.39, ‐0.70] |
| 27.2 Adults | 19 | 4602 | Mean Difference (IV, Fixed, 95% CI) | ‐1.00 [‐1.13, ‐0.87] |
| 28 Change from baseline in rescue medication free days (%) Show forest plot | 2 | 809 | Mean Difference (IV, Fixed, 95% CI) | 10.49 [5.48, 15.51] |
| Analysis 5.28  Comparison 5 FP versus placebo: Parallel group studies, no oral steroids: 200 mcg/d (all ages), Outcome 28 Change from baseline in rescue medication free days (%). | ||||
| 28.1 Children | 0 | 0 | Mean Difference (IV, Fixed, 95% CI) | 0.0 [0.0, 0.0] |
| 28.2 Adults | 2 | 809 | Mean Difference (IV, Fixed, 95% CI) | 10.49 [5.48, 15.51] |
| 29 Rescue medication (absolute scores) Show forest plot | 1 | Mean Difference (IV, Fixed, 95% CI) | Totals not selected | |
| Analysis 5.29  Comparison 5 FP versus placebo: Parallel group studies, no oral steroids: 200 mcg/d (all ages), Outcome 29 Rescue medication (absolute scores). | ||||
| 29.1 Children | 0 | Mean Difference (IV, Fixed, 95% CI) | 0.0 [0.0, 0.0] | |
| 29.2 Adults | 1 | Mean Difference (IV, Fixed, 95% CI) | 0.0 [0.0, 0.0] | |
| 30 HRQOL: AQLQ (absolute socres) Show forest plot | 3 | 513 | Mean Difference (IV, Fixed, 95% CI) | 0.68 [0.49, 0.87] |
| Analysis 5.30  Comparison 5 FP versus placebo: Parallel group studies, no oral steroids: 200 mcg/d (all ages), Outcome 30 HRQOL: AQLQ (absolute socres). | ||||
| 30.1 Children | 0 | 0 | Mean Difference (IV, Fixed, 95% CI) | 0.0 [0.0, 0.0] |
| 30.2 Adults | 3 | 513 | Mean Difference (IV, Fixed, 95% CI) | 0.68 [0.49, 0.87] |
| 31 HRQOL: Functional Status IIR questionaire (short version) Show forest plot | 1 | Mean Difference (IV, Fixed, 95% CI) | Totals not selected | |
| Analysis 5.31  Comparison 5 FP versus placebo: Parallel group studies, no oral steroids: 200 mcg/d (all ages), Outcome 31 HRQOL: Functional Status IIR questionaire (short version). | ||||
| 31.1 Children | 1 | Mean Difference (IV, Fixed, 95% CI) | 0.0 [0.0, 0.0] | |
| 31.2 Adults | 0 | Mean Difference (IV, Fixed, 95% CI) | 0.0 [0.0, 0.0] | |
| 32 HRQOL: Quality of Life of Parents of Asthmatic Children questionnaire, burden dimension Show forest plot | 1 | Mean Difference (IV, Fixed, 95% CI) | Totals not selected | |
| Analysis 5.32  Comparison 5 FP versus placebo: Parallel group studies, no oral steroids: 200 mcg/d (all ages), Outcome 32 HRQOL: Quality of Life of Parents of Asthmatic Children questionnaire, burden dimension. | ||||
| 32.1 Children | 1 | Mean Difference (IV, Fixed, 95% CI) | 0.0 [0.0, 0.0] | |
| 32.2 Adults | 0 | Mean Difference (IV, Fixed, 95% CI) | 0.0 [0.0, 0.0] | |
| 33 HRQOL: Quality of Life of Parents of Asthmatic Children questionnaire, subjective norms dimension Show forest plot | 1 | Mean Difference (IV, Fixed, 95% CI) | Totals not selected | |
| Analysis 5.33  Comparison 5 FP versus placebo: Parallel group studies, no oral steroids: 200 mcg/d (all ages), Outcome 33 HRQOL: Quality of Life of Parents of Asthmatic Children questionnaire, subjective norms dimension. | ||||
| 33.1 Children | 1 | Mean Difference (IV, Fixed, 95% CI) | 0.0 [0.0, 0.0] | |
| 33.2 Adults | 0 | Mean Difference (IV, Fixed, 95% CI) | 0.0 [0.0, 0.0] | |
| 34 HRQOL: Quality of Life of Parents of Asthmatic Children questionnaire, social dimension Show forest plot | 1 | Mean Difference (IV, Fixed, 95% CI) | Totals not selected | |
| Analysis 5.34  Comparison 5 FP versus placebo: Parallel group studies, no oral steroids: 200 mcg/d (all ages), Outcome 34 HRQOL: Quality of Life of Parents of Asthmatic Children questionnaire, social dimension. | ||||
| 34.1 Children | 1 | Mean Difference (IV, Fixed, 95% CI) | 0.0 [0.0, 0.0] | |
| 34.2 Adults | 0 | Mean Difference (IV, Fixed, 95% CI) | 0.0 [0.0, 0.0] | |
| 35 HRQOL: Sleep Scale Children questionnaire Show forest plot | 1 | Mean Difference (IV, Fixed, 95% CI) | Totals not selected | |
| Analysis 5.35  Comparison 5 FP versus placebo: Parallel group studies, no oral steroids: 200 mcg/d (all ages), Outcome 35 HRQOL: Sleep Scale Children questionnaire. | ||||
| 35.1 Children | 1 | Mean Difference (IV, Fixed, 95% CI) | 0.0 [0.0, 0.0] | |
| 35.2 Adults | 0 | Mean Difference (IV, Fixed, 95% CI) | 0.0 [0.0, 0.0] | |
| 36 Physician‐rated efficacy: effective or very effective (No. of patients) Show forest plot | 3 | 568 | Peto Odds Ratio (Peto, Fixed, 95% CI) | 5.83 [4.16, 8.16] |
| Analysis 5.36  Comparison 5 FP versus placebo: Parallel group studies, no oral steroids: 200 mcg/d (all ages), Outcome 36 Physician‐rated efficacy: effective or very effective (No. of patients). | ||||
| 36.1 Children | 0 | 0 | Peto Odds Ratio (Peto, Fixed, 95% CI) | 0.0 [0.0, 0.0] |
| 36.2 Adults | 3 | 568 | Peto Odds Ratio (Peto, Fixed, 95% CI) | 5.83 [4.16, 8.16] |
| 37 Exacerbations requiring OCS treatment Show forest plot | 1 | Peto Odds Ratio (Peto, Fixed, 95% CI) | Totals not selected | |
| Analysis 5.37  Comparison 5 FP versus placebo: Parallel group studies, no oral steroids: 200 mcg/d (all ages), Outcome 37 Exacerbations requiring OCS treatment. | ||||
| 37.1 Children | 0 | Peto Odds Ratio (Peto, Fixed, 95% CI) | 0.0 [0.0, 0.0] | |
| 37.2 Adults | 1 | Peto Odds Ratio (Peto, Fixed, 95% CI) | 0.0 [0.0, 0.0] | |
| 38 Withdrawal due to clinical asthma exacerbation (No. of patients) Show forest plot | 4 | 702 | Peto Odds Ratio (Peto, Fixed, 95% CI) | 0.22 [0.12, 0.39] |
| Analysis 5.38  Comparison 5 FP versus placebo: Parallel group studies, no oral steroids: 200 mcg/d (all ages), Outcome 38 Withdrawal due to clinical asthma exacerbation (No. of patients). | ||||
| 38.1 Children | 2 | 248 | Peto Odds Ratio (Peto, Fixed, 95% CI) | 0.18 [0.09, 0.38] |
| 38.2 Adults | 2 | 454 | Peto Odds Ratio (Peto, Fixed, 95% CI) | 0.29 [0.11, 0.79] |
| 39 Withdrawal due to lack of treatment efficacy (No. of patients) Show forest plot | 17 | 4071 | Peto Odds Ratio (Peto, Fixed, 95% CI) | 0.20 [0.17, 0.24] |
| Analysis 5.39  Comparison 5 FP versus placebo: Parallel group studies, no oral steroids: 200 mcg/d (all ages), Outcome 39 Withdrawal due to lack of treatment efficacy (No. of patients). | ||||
| 39.1 Children | 2 | 351 | Peto Odds Ratio (Peto, Fixed, 95% CI) | 0.20 [0.13, 0.31] |
| 39.2 Adults | 15 | 3720 | Peto Odds Ratio (Peto, Fixed, 95% CI) | 0.21 [0.17, 0.25] |
| 40 Withdrawals (any reason) Show forest plot | 8 | 2080 | Peto Odds Ratio (Peto, Fixed, 95% CI) | 0.40 [0.31, 0.51] |
| Analysis 5.40  Comparison 5 FP versus placebo: Parallel group studies, no oral steroids: 200 mcg/d (all ages), Outcome 40 Withdrawals (any reason). | ||||
| 40.1 Children | 1 | 158 | Peto Odds Ratio (Peto, Fixed, 95% CI) | 0.33 [0.18, 0.61] |
| 40.2 Adults | 7 | 1922 | Peto Odds Ratio (Peto, Fixed, 95% CI) | 0.42 [0.32, 0.54] |
| 41 Withdrawals due to adverse events Show forest plot | 13 | 3595 | Peto Odds Ratio (Peto, Fixed, 95% CI) | 1.31 [0.76, 2.27] |
| Analysis 5.41  Comparison 5 FP versus placebo: Parallel group studies, no oral steroids: 200 mcg/d (all ages), Outcome 41 Withdrawals due to adverse events. | ||||
| 41.1 Children | 0 | 0 | Peto Odds Ratio (Peto, Fixed, 95% CI) | 0.0 [0.0, 0.0] |
| 41.2 Adults | 13 | 3595 | Peto Odds Ratio (Peto, Fixed, 95% CI) | 1.31 [0.76, 2.27] |
| 42 Adverse events (any) Show forest plot | 4 | 884 | Odds Ratio (M‐H, Fixed, 95% CI) | 1.13 [0.84, 1.52] |
| Analysis 5.42  Comparison 5 FP versus placebo: Parallel group studies, no oral steroids: 200 mcg/d (all ages), Outcome 42 Adverse events (any). | ||||
| 42.1 Children | 0 | 0 | Odds Ratio (M‐H, Fixed, 95% CI) | 0.0 [0.0, 0.0] |
| 42.2 Adults | 4 | 884 | Odds Ratio (M‐H, Fixed, 95% CI) | 1.13 [0.84, 1.52] |
| 43 Oral Candidiasis (No. of patients) Show forest plot | 13 | 1887 | Peto Odds Ratio (Peto, Fixed, 95% CI) | 2.55 [1.43, 4.56] |
| Analysis 5.43  Comparison 5 FP versus placebo: Parallel group studies, no oral steroids: 200 mcg/d (all ages), Outcome 43 Oral Candidiasis (No. of patients). | ||||
| 43.1 Children | 3 | 395 | Peto Odds Ratio (Peto, Fixed, 95% CI) | 1.38 [0.54, 3.57] |
| 43.2 Adults | 10 | 1492 | Peto Odds Ratio (Peto, Fixed, 95% CI) | 3.68 [1.76, 7.67] |
| 44 Sore throat or pharyngitis (No. of patients) Show forest plot | 17 | 3480 | Peto Odds Ratio (Peto, Fixed, 95% CI) | 1.82 [1.27, 2.60] |
| Analysis 5.44  Comparison 5 FP versus placebo: Parallel group studies, no oral steroids: 200 mcg/d (all ages), Outcome 44 Sore throat or pharyngitis (No. of patients). | ||||
| 44.1 Children | 2 | 372 | Peto Odds Ratio (Peto, Fixed, 95% CI) | 1.38 [0.54, 3.54] |
| 44.2 Adults | 15 | 3108 | Peto Odds Ratio (Peto, Fixed, 95% CI) | 1.91 [1.29, 2.80] |
| 45 Headaches Show forest plot | 10 | 2602 | Peto Odds Ratio (Peto, Fixed, 95% CI) | 1.07 [0.83, 1.38] |
| Analysis 5.45  Comparison 5 FP versus placebo: Parallel group studies, no oral steroids: 200 mcg/d (all ages), Outcome 45 Headaches. | ||||
| 45.1 Children | 1 | 158 | Peto Odds Ratio (Peto, Fixed, 95% CI) | 1.39 [0.43, 4.50] |
| 45.2 Adults | 9 | 2444 | Peto Odds Ratio (Peto, Fixed, 95% CI) | 1.06 [0.81, 1.37] |
| 46 Hoarseness or dysphonia (No. of patients) Show forest plot | 10 | 1645 | Peto Odds Ratio (Peto, Fixed, 95% CI) | 6.34 [2.83, 14.21] |
| Analysis 5.46  Comparison 5 FP versus placebo: Parallel group studies, no oral steroids: 200 mcg/d (all ages), Outcome 46 Hoarseness or dysphonia (No. of patients). | ||||
| 46.1 Children | 2 | 394 | Peto Odds Ratio (Peto, Fixed, 95% CI) | 8.10 [0.83, 79.01] |
| 46.2 Adults | 8 | 1251 | Peto Odds Ratio (Peto, Fixed, 95% CI) | 6.12 [2.58, 14.51] |
| 47 Upper respiratory tract infection Show forest plot | 3 | 1623 | Odds Ratio (M‐H, Fixed, 95% CI) | 1.07 [0.76, 1.49] |
| Analysis 5.47  Comparison 5 FP versus placebo: Parallel group studies, no oral steroids: 200 mcg/d (all ages), Outcome 47 Upper respiratory tract infection. | ||||
| 47.1 Children | 1 | 158 | Odds Ratio (M‐H, Fixed, 95% CI) | 0.97 [0.41, 2.31] |
| 47.2 Adults | 2 | 1465 | Odds Ratio (M‐H, Fixed, 95% CI) | 1.08 [0.75, 1.55] |
| 48 Sinusitis Show forest plot | 5 | 2030 | Peto Odds Ratio (Peto, Fixed, 95% CI) | 1.29 [0.84, 1.99] |
| Analysis 5.48  Comparison 5 FP versus placebo: Parallel group studies, no oral steroids: 200 mcg/d (all ages), Outcome 48 Sinusitis. | ||||
| 48.1 Children | 1 | 158 | Peto Odds Ratio (Peto, Fixed, 95% CI) | 1.69 [0.60, 4.74] |
| 48.2 Adults | 4 | 1872 | Peto Odds Ratio (Peto, Fixed, 95% CI) | 1.22 [0.76, 1.96] |
| 49 Total urinary free cortisol excretion (mcg/24 hours) Show forest plot | 1 | Mean Difference (IV, Fixed, 95% CI) | Totals not selected | |
| Analysis 5.49  Comparison 5 FP versus placebo: Parallel group studies, no oral steroids: 200 mcg/d (all ages), Outcome 49 Total urinary free cortisol excretion (mcg/24 hours). | ||||
| 49.1 Children | 1 | Mean Difference (IV, Fixed, 95% CI) | 0.0 [0.0, 0.0] | |
| 49.2 Adults | 0 | Mean Difference (IV, Fixed, 95% CI) | 0.0 [0.0, 0.0] | |
| 50 AUC serum cortisol (ng*h/mL) Show forest plot | 1 | Mean Difference (IV, Fixed, 95% CI) | Totals not selected | |
| Analysis 5.50  Comparison 5 FP versus placebo: Parallel group studies, no oral steroids: 200 mcg/d (all ages), Outcome 50 AUC serum cortisol (ng*h/mL). | ||||
| 50.1 Children | 0 | Mean Difference (IV, Fixed, 95% CI) | 0.0 [0.0, 0.0] | |
| 50.2 Adults | 1 | Mean Difference (IV, Fixed, 95% CI) | 0.0 [0.0, 0.0] | |
| 51 Morning plasma cortisol (mcg/dL) Show forest plot | 2 | 194 | Mean Difference (IV, Fixed, 95% CI) | 0.00 [‐1.33, 1.33] |
| Analysis 5.51  Comparison 5 FP versus placebo: Parallel group studies, no oral steroids: 200 mcg/d (all ages), Outcome 51 Morning plasma cortisol (mcg/dL). | ||||
| 51.1 Children | 1 | 154 | Mean Difference (IV, Fixed, 95% CI) | 0.30 [‐1.23, 1.83] |
| 51.2 Adults | 1 | 40 | Mean Difference (IV, Fixed, 95% CI) | ‐0.90 [‐3.57, 1.77] |
| 52 Change in morning plasma cortisol compared to baseline (mcg/dL) Show forest plot | 1 | Mean Difference (IV, Fixed, 95% CI) | Totals not selected | |
| Analysis 5.52  Comparison 5 FP versus placebo: Parallel group studies, no oral steroids: 200 mcg/d (all ages), Outcome 52 Change in morning plasma cortisol compared to baseline (mcg/dL). | ||||
| 52.1 Children | 0 | Mean Difference (IV, Fixed, 95% CI) | 0.0 [0.0, 0.0] | |
| 52.2 Adults | 1 | Mean Difference (IV, Fixed, 95% CI) | 0.0 [0.0, 0.0] | |
| 53 Change in peak plasma cortisol expression (mcg/dL) Show forest plot | 2 | 117 | Mean Difference (IV, Fixed, 95% CI) | ‐0.60 [‐2.56, 1.36] |
| Analysis 5.53  Comparison 5 FP versus placebo: Parallel group studies, no oral steroids: 200 mcg/d (all ages), Outcome 53 Change in peak plasma cortisol expression (mcg/dL). | ||||
| 53.1 Children | 0 | 0 | Mean Difference (IV, Fixed, 95% CI) | 0.0 [0.0, 0.0] |
| 53.2 Adults | 2 | 117 | Mean Difference (IV, Fixed, 95% CI) | ‐0.60 [‐2.56, 1.36] |
| Outcome or subgroup title | No. of studies | No. of participants | Statistical method | Effect size |
| 1 Change in FEV1 compared to baseline (litres) Show forest plot | 22 | 4936 | Litres (Fixed, 95% CI) | 0.24 [0.21, 0.26] |
| Analysis 6.1  Comparison 6 FP versus placebo: Parallel group studies, no oral steroids: 200 mcg/d (all treatment durations), Outcome 1 Change in FEV1 compared to baseline (litres). | ||||
| 1.1 1‐4 weeks | 1 | 46 | Litres (Fixed, 95% CI) | 0.27 [0.05, 0.49] |
| 1.2 1‐5 months | 20 | 3627 | Litres (Fixed, 95% CI) | 0.27 [0.24, 0.29] |
| 1.3 6 months or longer | 1 | 1263 | Litres (Fixed, 95% CI) | 0.1 [0.04, 0.16] |
| 2 Change in FEV1 (% predicted) Show forest plot | 5 | 674 | % (Fixed, 95% CI) | 9.95 [7.98, 11.91] |
| Analysis 6.2  Comparison 6 FP versus placebo: Parallel group studies, no oral steroids: 200 mcg/d (all treatment durations), Outcome 2 Change in FEV1 (% predicted). | ||||
| 2.1 1‐4 weeks | 0 | 0 | % (Fixed, 95% CI) | 0.0 [0.0, 0.0] |
| 2.2 1‐5 months | 5 | 674 | % (Fixed, 95% CI) | 9.95 [7.98, 11.91] |
| 2.3 6 months or longer | 0 | 0 | % (Fixed, 95% CI) | 0.0 [0.0, 0.0] |
| 3 Change in morning PEFR compared with baseline Show forest plot | 24 | 5117 | Litres/min (Fixed, 95% CI) | 26.96 [24.51, 29.40] |
| Analysis 6.3  Comparison 6 FP versus placebo: Parallel group studies, no oral steroids: 200 mcg/d (all treatment durations), Outcome 3 Change in morning PEFR compared with baseline. | ||||
| 3.1 1‐4 weeks | 1 | 46 | Litres/min (Fixed, 95% CI) | 11.0 [‐9.83, 31.83] |
| 3.2 1‐5 months | 22 | 3808 | Litres/min (Fixed, 95% CI) | 29.03 [26.27, 31.80] |
| 3.3 6 months or longer | 1 | 1263 | Litres/min (Fixed, 95% CI) | 20.1 [14.70, 25.50] |
| 4 Change in evening PEFR compared to baseline Show forest plot | 16 | 3283 | Litres/min (Fixed, 95% CI) | 21.59 [18.55, 24.62] |
| Analysis 6.4  Comparison 6 FP versus placebo: Parallel group studies, no oral steroids: 200 mcg/d (all treatment durations), Outcome 4 Change in evening PEFR compared to baseline. | ||||
| 4.1 1‐4 weeks | 0 | 0 | Litres/min (Fixed, 95% CI) | 0.0 [0.0, 0.0] |
| 4.2 1‐5 months | 16 | 3283 | Litres/min (Fixed, 95% CI) | 21.59 [18.55, 24.62] |
| 4.3 6 months or longer | 0 | 0 | Litres/min (Fixed, 95% CI) | 0.0 [0.0, 0.0] |
| 5 Change in daily use of beta2 agonist compared to baseline (puffs/d) Show forest plot | 22 | 5111 | Mean Difference (IV, Fixed, 95% CI) | ‐1.01 [‐1.13, ‐0.88] |
| Analysis 6.5  Comparison 6 FP versus placebo: Parallel group studies, no oral steroids: 200 mcg/d (all treatment durations), Outcome 5 Change in daily use of beta2 agonist compared to baseline (puffs/d). | ||||
| 5.1 1‐4 weeks | 1 | 46 | Mean Difference (IV, Fixed, 95% CI) | ‐0.90 [‐1.73, ‐0.07] |
| 5.2 1‐5 months | 20 | 3802 | Mean Difference (IV, Fixed, 95% CI) | ‐1.25 [‐1.39, ‐1.11] |
| 5.3 6 months or longer | 1 | 1263 | Mean Difference (IV, Fixed, 95% CI) | ‐0.18 [‐0.44, 0.08] |
| 6 HRQOL: AQLQ Show forest plot | 3 | 513 | Mean Difference (IV, Fixed, 95% CI) | 0.68 [0.49, 0.87] |
| Analysis 6.6  Comparison 6 FP versus placebo: Parallel group studies, no oral steroids: 200 mcg/d (all treatment durations), Outcome 6 HRQOL: AQLQ. | ||||
| 6.1 1‐4 weeks | 0 | 0 | Mean Difference (IV, Fixed, 95% CI) | 0.0 [0.0, 0.0] |
| 6.2 1‐5 months | 3 | 513 | Mean Difference (IV, Fixed, 95% CI) | 0.68 [0.49, 0.87] |
| 6.3 6 months or longer | 0 | 0 | Mean Difference (IV, Fixed, 95% CI) | 0.0 [0.0, 0.0] |
| 7 Change in daily asthma symptom score compared to baseline Show forest plot | 20 | 3671 | Std. Mean Difference (IV, Fixed, 95% CI) | ‐0.49 [‐0.56, ‐0.43] |
| Analysis 6.7  Comparison 6 FP versus placebo: Parallel group studies, no oral steroids: 200 mcg/d (all treatment durations), Outcome 7 Change in daily asthma symptom score compared to baseline. | ||||
| 7.1 1‐4 weeks | 1 | 46 | Std. Mean Difference (IV, Fixed, 95% CI) | 0.20 [‐0.37, 0.78] |
| 7.2 1‐5 months | 19 | 3625 | Std. Mean Difference (IV, Fixed, 95% CI) | ‐0.50 [‐0.57, ‐0.44] |
| 7.3 6 months or longer | 0 | 0 | Std. Mean Difference (IV, Fixed, 95% CI) | 0.0 [0.0, 0.0] |
| 8 Change from baseline in symptom free days (%) Show forest plot | 3 | 971 | Mean Difference (IV, Fixed, 95% CI) | 7.03 [3.31, 10.75] |
| Analysis 6.8  Comparison 6 FP versus placebo: Parallel group studies, no oral steroids: 200 mcg/d (all treatment durations), Outcome 8 Change from baseline in symptom free days (%). | ||||
| 8.1 1‐4 weeks | 0 | 0 | Mean Difference (IV, Fixed, 95% CI) | 0.0 [0.0, 0.0] |
| 8.2 1‐5 months | 3 | 971 | Mean Difference (IV, Fixed, 95% CI) | 7.03 [3.31, 10.75] |
| 8.3 6 months or longer | 0 | 0 | Mean Difference (IV, Fixed, 95% CI) | 0.0 [0.0, 0.0] |
| 9 Change in night‐time wakening score Show forest plot | 6 | 884 | Std. Mean Difference (IV, Fixed, 95% CI) | ‐0.45 [‐0.59, ‐0.32] |
| Analysis 6.9  Comparison 6 FP versus placebo: Parallel group studies, no oral steroids: 200 mcg/d (all treatment durations), Outcome 9 Change in night‐time wakening score. | ||||
| 9.1 1‐4 weeks | 0 | 0 | Std. Mean Difference (IV, Fixed, 95% CI) | 0.0 [0.0, 0.0] |
| 9.2 1‐5 months | 6 | 884 | Std. Mean Difference (IV, Fixed, 95% CI) | ‐0.45 [‐0.59, ‐0.32] |
| 9.3 6 months or longer | 0 | 0 | Std. Mean Difference (IV, Fixed, 95% CI) | 0.0 [0.0, 0.0] |
| 10 Change from baseline in nighttime awakenings/night Show forest plot | 5 | 1359 | Mean Difference (IV, Fixed, 95% CI) | ‐0.12 [‐0.17, ‐0.08] |
| Analysis 6.10  Comparison 6 FP versus placebo: Parallel group studies, no oral steroids: 200 mcg/d (all treatment durations), Outcome 10 Change from baseline in nighttime awakenings/night. | ||||
| 10.1 1‐4 weeks | 1 | 158 | Mean Difference (IV, Fixed, 95% CI) | ‐0.1 [‐0.16, ‐0.04] |
| 10.2 1‐5 months | 4 | 1201 | Mean Difference (IV, Fixed, 95% CI) | ‐0.17 [‐0.24, ‐0.09] |
| 10.3 6 months or more | 0 | 0 | Mean Difference (IV, Fixed, 95% CI) | 0.0 [0.0, 0.0] |
| 11 Change in number night‐time wakenings per week Show forest plot | 4 | 641 | Mean Difference (IV, Fixed, 95% CI) | ‐0.17 [‐0.23, ‐0.12] |
| Analysis 6.11  Comparison 6 FP versus placebo: Parallel group studies, no oral steroids: 200 mcg/d (all treatment durations), Outcome 11 Change in number night‐time wakenings per week. | ||||
| 11.1 1‐4 weeks | 0 | 0 | Mean Difference (IV, Fixed, 95% CI) | 0.0 [0.0, 0.0] |
| 11.2 1‐5 months | 4 | 641 | Mean Difference (IV, Fixed, 95% CI) | ‐0.17 [‐0.23, ‐0.12] |
| 11.3 6 months or longer | 0 | 0 | Mean Difference (IV, Fixed, 95% CI) | 0.0 [0.0, 0.0] |
| 12 Physician‐rated efficacy: effective or very effective (No. of patients) Show forest plot | 3 | 568 | Peto Odds Ratio (Peto, Fixed, 95% CI) | 5.83 [4.16, 8.16] |
| Analysis 6.12  Comparison 6 FP versus placebo: Parallel group studies, no oral steroids: 200 mcg/d (all treatment durations), Outcome 12 Physician‐rated efficacy: effective or very effective (No. of patients). | ||||
| 12.3 1‐4 weeks | 0 | 0 | Peto Odds Ratio (Peto, Fixed, 95% CI) | 0.0 [0.0, 0.0] |
| 12.4 1‐5 months | 3 | 568 | Peto Odds Ratio (Peto, Fixed, 95% CI) | 5.83 [4.16, 8.16] |
| 12.5 6 months or longer | 0 | 0 | Peto Odds Ratio (Peto, Fixed, 95% CI) | 0.0 [0.0, 0.0] |
| 13 Withdrawal due to clinical asthma exacerbation (No. of patients) Show forest plot | 4 | 702 | Peto Odds Ratio (Peto, Fixed, 95% CI) | 0.22 [0.12, 0.39] |
| Analysis 6.13  Comparison 6 FP versus placebo: Parallel group studies, no oral steroids: 200 mcg/d (all treatment durations), Outcome 13 Withdrawal due to clinical asthma exacerbation (No. of patients). | ||||
| 13.1 1‐4 weeks | 1 | 46 | Peto Odds Ratio (Peto, Fixed, 95% CI) | 0.14 [0.00, 6.82] |
| 13.2 1‐5 months | 2 | 442 | Peto Odds Ratio (Peto, Fixed, 95% CI) | 0.26 [0.10, 0.66] |
| 13.3 6 months or longer | 1 | 214 | Peto Odds Ratio (Peto, Fixed, 95% CI) | 0.19 [0.09, 0.42] |
| 14 Withdrawal due to lack of treatment efficacy (No. of patients) Show forest plot | 17 | 4071 | Peto Odds Ratio (Peto, Fixed, 95% CI) | 0.20 [0.17, 0.24] |
| Analysis 6.14  Comparison 6 FP versus placebo: Parallel group studies, no oral steroids: 200 mcg/d (all treatment durations), Outcome 14 Withdrawal due to lack of treatment efficacy (No. of patients). | ||||
| 14.1 1‐4 weeks | 0 | 0 | Peto Odds Ratio (Peto, Fixed, 95% CI) | 0.0 [0.0, 0.0] |
| 14.2 1‐5 months | 15 | 2667 | Peto Odds Ratio (Peto, Fixed, 95% CI) | 0.20 [0.17, 0.24] |
| 14.3 6 months or longer | 2 | 1404 | Peto Odds Ratio (Peto, Fixed, 95% CI) | 0.28 [0.08, 1.00] |
| 15 Withdrawals due to adverse events Show forest plot | 13 | 3595 | Peto Odds Ratio (Peto, Fixed, 95% CI) | 1.31 [0.76, 2.27] |
| Analysis 6.15  Comparison 6 FP versus placebo: Parallel group studies, no oral steroids: 200 mcg/d (all treatment durations), Outcome 15 Withdrawals due to adverse events. | ||||
| 15.1 1‐4 weeks | 4 | 203 | Peto Odds Ratio (Peto, Fixed, 95% CI) | 7.20 [0.74, 69.96] |
| 15.2 1‐5 months | 7 | 1988 | Peto Odds Ratio (Peto, Fixed, 95% CI) | 1.13 [0.56, 2.27] |
| 15.3 6 months or longer | 2 | 1404 | Peto Odds Ratio (Peto, Fixed, 95% CI) | 1.30 [0.50, 3.33] |
| 16 Withdrawals (any reason) Show forest plot | 8 | 2080 | Peto Odds Ratio (Peto, Fixed, 95% CI) | 0.40 [0.31, 0.51] |
| Analysis 6.16  Comparison 6 FP versus placebo: Parallel group studies, no oral steroids: 200 mcg/d (all treatment durations), Outcome 16 Withdrawals (any reason). | ||||
| 16.1 1‐4 weeks | 2 | 117 | Peto Odds Ratio (Peto, Fixed, 95% CI) | 3.78 [0.63, 22.68] |
| 16.2 1‐5 months | 5 | 664 | Peto Odds Ratio (Peto, Fixed, 95% CI) | 0.29 [0.21, 0.40] |
| 16.3 6 months or longer | 1 | 1299 | Peto Odds Ratio (Peto, Fixed, 95% CI) | 0.61 [0.41, 0.90] |
| 17 Sore throat or pharyngitis (No. of patients) Show forest plot | 17 | 3480 | Peto Odds Ratio (Peto, Fixed, 95% CI) | 1.82 [1.27, 2.60] |
| Analysis 6.17  Comparison 6 FP versus placebo: Parallel group studies, no oral steroids: 200 mcg/d (all treatment durations), Outcome 17 Sore throat or pharyngitis (No. of patients). | ||||
| 17.1 1‐4 weeks | 4 | 203 | Peto Odds Ratio (Peto, Fixed, 95% CI) | 0.99 [0.24, 4.10] |
| 17.2 1‐5 months | 10 | 1669 | Peto Odds Ratio (Peto, Fixed, 95% CI) | 1.88 [1.15, 3.08] |
| 17.3 6 months or longer | 3 | 1608 | Peto Odds Ratio (Peto, Fixed, 95% CI) | 1.91 [1.09, 3.35] |
| 18 Hoarseness or dysphonia (No. of patients) Show forest plot | 10 | 1645 | Peto Odds Ratio (Peto, Fixed, 95% CI) | 6.34 [2.83, 14.21] |
| Analysis 6.18  Comparison 6 FP versus placebo: Parallel group studies, no oral steroids: 200 mcg/d (all treatment durations), Outcome 18 Hoarseness or dysphonia (No. of patients). | ||||
| 18.1 1‐4 weeks | 0 | 0 | Peto Odds Ratio (Peto, Fixed, 95% CI) | 0.0 [0.0, 0.0] |
| 18.2 1‐5 months | 8 | 1322 | Peto Odds Ratio (Peto, Fixed, 95% CI) | 6.25 [2.69, 14.52] |
| 18.3 6 months or longer | 2 | 323 | Peto Odds Ratio (Peto, Fixed, 95% CI) | 7.39 [0.46, 119.72] |
| 19 Oral Candidiasis (No. of patients) Show forest plot | 13 | 1887 | Peto Odds Ratio (Peto, Fixed, 95% CI) | 2.55 [1.43, 4.56] |
| Analysis 6.19  Comparison 6 FP versus placebo: Parallel group studies, no oral steroids: 200 mcg/d (all treatment durations), Outcome 19 Oral Candidiasis (No. of patients). | ||||
| 19.1 1‐4 weeks | 1 | 60 | Peto Odds Ratio (Peto, Fixed, 95% CI) | 7.92 [0.16, 399.84] |
| 19.2 1‐5 months | 10 | 1504 | Peto Odds Ratio (Peto, Fixed, 95% CI) | 2.36 [1.30, 4.31] |
| 19.3 6 months or longer | 2 | 323 | Peto Odds Ratio (Peto, Fixed, 95% CI) | 7.25 [0.45, 116.00] |
| 20 Headaches Show forest plot | 10 | 2602 | Peto Odds Ratio (Peto, Fixed, 95% CI) | 1.07 [0.83, 1.38] |
| Analysis 6.20  Comparison 6 FP versus placebo: Parallel group studies, no oral steroids: 200 mcg/d (all treatment durations), Outcome 20 Headaches. | ||||
| 20.1 1‐4 weeks | 3 | 157 | Peto Odds Ratio (Peto, Fixed, 95% CI) | 6.73 [0.90, 50.54] |
| 20.2 1‐5 months | 6 | 1160 | Peto Odds Ratio (Peto, Fixed, 95% CI) | 1.10 [0.75, 1.62] |
| 20.3 6 months or longer | 1 | 1285 | Peto Odds Ratio (Peto, Fixed, 95% CI) | 0.99 [0.70, 1.41] |
| 21 Sinusitis Show forest plot | 5 | 2030 | Peto Odds Ratio (Peto, Fixed, 95% CI) | 1.29 [0.84, 1.99] |
| Analysis 6.21  Comparison 6 FP versus placebo: Parallel group studies, no oral steroids: 200 mcg/d (all treatment durations), Outcome 21 Sinusitis. | ||||
| 21.1 1‐4 weeks | 0 | 0 | Peto Odds Ratio (Peto, Fixed, 95% CI) | 0.0 [0.0, 0.0] |
| 21.2 1‐5 months | 4 | 745 | Peto Odds Ratio (Peto, Fixed, 95% CI) | 1.64 [0.95, 2.85] |
| 21.3 6 months or longer | 1 | 1285 | Peto Odds Ratio (Peto, Fixed, 95% CI) | 0.89 [0.44, 1.77] |
| Outcome or subgroup title | No. of studies | No. of participants | Statistical method | Effect size |
| 1 Change in FEV1 compared to baseline (litres) Show forest plot | 22 | 4936 | Litres (Fixed, 95% CI) | 0.24 [0.21, 0.26] |
| Analysis 7.1  Comparison 7 FP versus placebo: Parallel group studies, no oral steroids: 200 mcg/d (all delivery devices), Outcome 1 Change in FEV1 compared to baseline (litres). | ||||
| 1.1 MDI | 9 | 1337 | Litres (Fixed, 95% CI) | 0.38 [0.33, 0.43] |
| 1.2 DPI | 13 | 3599 | Litres (Fixed, 95% CI) | 0.19 [0.16, 0.22] |
| 2 Change in FEV1 (% predicted) Show forest plot | 5 | 674 | % (Fixed, 95% CI) | 9.95 [7.98, 11.91] |
| Analysis 7.2  Comparison 7 FP versus placebo: Parallel group studies, no oral steroids: 200 mcg/d (all delivery devices), Outcome 2 Change in FEV1 (% predicted). | ||||
| 2.1 MDI | 1 | 202 | % (Fixed, 95% CI) | 10.5 [7.19, 13.81] |
| 2.2 DPI | 4 | 472 | % (Fixed, 95% CI) | 9.65 [7.20, 12.09] |
| 3 Change in morning PEFR compared with baseline Show forest plot | 24 | 5117 | Litres/min (Fixed, 95% CI) | 26.96 [24.51, 29.40] |
| Analysis 7.3  Comparison 7 FP versus placebo: Parallel group studies, no oral steroids: 200 mcg/d (all delivery devices), Outcome 3 Change in morning PEFR compared with baseline. | ||||
| 3.1 MDI | 10 | 1452 | Litres/min (Fixed, 95% CI) | 29.45 [24.97, 33.93] |
| 3.2 DPI | 14 | 3665 | Litres/min (Fixed, 95% CI) | 25.90 [22.98, 28.82] |
| 4 Change in evening PEFR compared to baseline Show forest plot | 16 | 3283 | Litres/min (Fixed, 95% CI) | 21.59 [18.55, 24.62] |
| Analysis 7.4  Comparison 7 FP versus placebo: Parallel group studies, no oral steroids: 200 mcg/d (all delivery devices), Outcome 4 Change in evening PEFR compared to baseline. | ||||
| 4.1 MDI | 5 | 787 | Litres/min (Fixed, 95% CI) | 27.98 [22.34, 33.62] |
| 4.2 DPI | 11 | 2496 | Litres/min (Fixed, 95% CI) | 18.99 [15.40, 22.59] |
| 5 Change in daily asthma symptom score compared to baseline Show forest plot | 20 | 3671 | Std. Mean Difference (IV, Fixed, 95% CI) | ‐0.49 [‐0.56, ‐0.43] |
| Analysis 7.5  Comparison 7 FP versus placebo: Parallel group studies, no oral steroids: 200 mcg/d (all delivery devices), Outcome 5 Change in daily asthma symptom score compared to baseline. | ||||
| 5.1 MDI | 7 | 1004 | Std. Mean Difference (IV, Fixed, 95% CI) | ‐0.44 [‐0.57, ‐0.32] |
| 5.2 DPI | 12 | 2635 | Std. Mean Difference (IV, Fixed, 95% CI) | ‐0.51 [‐0.59, ‐0.43] |
| 5.3 Unclear | 1 | 32 | Std. Mean Difference (IV, Fixed, 95% CI) | 0.0 [0.0, 0.0] |
| 6 Change from baseline in symptom free days (%) Show forest plot | 3 | 971 | Mean Difference (IV, Fixed, 95% CI) | 7.03 [3.31, 10.75] |
| Analysis 7.6  Comparison 7 FP versus placebo: Parallel group studies, no oral steroids: 200 mcg/d (all delivery devices), Outcome 6 Change from baseline in symptom free days (%). | ||||
| 6.4 MDI | 0 | 0 | Mean Difference (IV, Fixed, 95% CI) | 0.0 [0.0, 0.0] |
| 6.5 DPI | 3 | 971 | Mean Difference (IV, Fixed, 95% CI) | 7.03 [3.31, 10.75] |
| 7 Change from baseline in nighttime awakenings/night Show forest plot | 5 | 1359 | Mean Difference (IV, Fixed, 95% CI) | ‐0.12 [‐0.17, ‐0.08] |
| Analysis 7.7  Comparison 7 FP versus placebo: Parallel group studies, no oral steroids: 200 mcg/d (all delivery devices), Outcome 7 Change from baseline in nighttime awakenings/night. | ||||
| 7.1 MDI | 1 | 227 | Mean Difference (IV, Fixed, 95% CI) | ‐0.15 [‐0.30, 0.00] |
| 7.2 DPI | 4 | 1132 | Mean Difference (IV, Fixed, 95% CI) | ‐0.12 [‐0.17, ‐0.07] |
| 8 Change in number night‐time wakenings per week Show forest plot | 4 | 641 | Mean Difference (IV, Fixed, 95% CI) | ‐0.17 [‐0.23, ‐0.12] |
| Analysis 7.8  Comparison 7 FP versus placebo: Parallel group studies, no oral steroids: 200 mcg/d (all delivery devices), Outcome 8 Change in number night‐time wakenings per week. | ||||
| 8.1 MDI | 3 | 485 | Mean Difference (IV, Fixed, 95% CI) | ‐0.15 [‐0.21, ‐0.09] |
| 8.2 DPI | 1 | 156 | Mean Difference (IV, Fixed, 95% CI) | ‐0.24 [‐0.34, ‐0.14] |
| 9 Change in night‐time wakening score Show forest plot | 6 | 884 | Std. Mean Difference (IV, Fixed, 95% CI) | ‐0.45 [‐0.59, ‐0.32] |
| Analysis 7.9  Comparison 7 FP versus placebo: Parallel group studies, no oral steroids: 200 mcg/d (all delivery devices), Outcome 9 Change in night‐time wakening score. | ||||
| 9.1 MDI | 4 | 555 | Std. Mean Difference (IV, Fixed, 95% CI) | ‐0.39 [‐0.56, ‐0.22] |
| 9.2 DPI | 2 | 329 | Std. Mean Difference (IV, Fixed, 95% CI) | ‐0.56 [‐0.78, ‐0.34] |
| 10 Change in daily use of beta2 agonist compared to baseline (puffs/d) Show forest plot | 22 | 5111 | Mean Difference (IV, Fixed, 95% CI) | ‐1.01 [‐1.13, ‐0.88] |
| Analysis 7.10  Comparison 7 FP versus placebo: Parallel group studies, no oral steroids: 200 mcg/d (all delivery devices), Outcome 10 Change in daily use of beta2 agonist compared to baseline (puffs/d). | ||||
| 10.1 MDI | 8 | 1184 | Mean Difference (IV, Fixed, 95% CI) | ‐1.35 [‐1.60, ‐1.10] |
| 10.2 DPI | 14 | 3927 | Mean Difference (IV, Fixed, 95% CI) | ‐0.90 [‐1.04, ‐0.76] |
| 11 HRQOL: AQLQ Show forest plot | 3 | 513 | Mean Difference (IV, Fixed, 95% CI) | 0.68 [0.49, 0.87] |
| Analysis 7.11  Comparison 7 FP versus placebo: Parallel group studies, no oral steroids: 200 mcg/d (all delivery devices), Outcome 11 HRQOL: AQLQ. | ||||
| 11.4 MDI | 3 | 513 | Mean Difference (IV, Fixed, 95% CI) | 0.68 [0.49, 0.87] |
| 11.5 DPI | 0 | 0 | Mean Difference (IV, Fixed, 95% CI) | 0.0 [0.0, 0.0] |
| 12 Physician‐rated efficacy: effective or very effective (No. of patients) Show forest plot | 3 | 568 | Peto Odds Ratio (Peto, Fixed, 95% CI) | 5.83 [4.16, 8.16] |
| Analysis 7.12  Comparison 7 FP versus placebo: Parallel group studies, no oral steroids: 200 mcg/d (all delivery devices), Outcome 12 Physician‐rated efficacy: effective or very effective (No. of patients). | ||||
| 12.1 MDI | 3 | 568 | Peto Odds Ratio (Peto, Fixed, 95% CI) | 5.83 [4.16, 8.16] |
| 12.2 DPI | 0 | 0 | Peto Odds Ratio (Peto, Fixed, 95% CI) | 0.0 [0.0, 0.0] |
| 13 Withdrawal due to clinical asthma exacerbation (No. of patients) Show forest plot | 4 | 702 | Peto Odds Ratio (Peto, Fixed, 95% CI) | 0.22 [0.12, 0.39] |
| Analysis 7.13  Comparison 7 FP versus placebo: Parallel group studies, no oral steroids: 200 mcg/d (all delivery devices), Outcome 13 Withdrawal due to clinical asthma exacerbation (No. of patients). | ||||
| 13.1 MDI | 1 | 46 | Peto Odds Ratio (Peto, Fixed, 95% CI) | 0.14 [0.00, 6.82] |
| 13.2 DPI | 3 | 656 | Peto Odds Ratio (Peto, Fixed, 95% CI) | 0.22 [0.12, 0.40] |
| 14 Withdrawal due to lack of treatment efficacy (No. of patients) Show forest plot | 17 | 4071 | Peto Odds Ratio (Peto, Fixed, 95% CI) | 0.20 [0.17, 0.24] |
| Analysis 7.14  Comparison 7 FP versus placebo: Parallel group studies, no oral steroids: 200 mcg/d (all delivery devices), Outcome 14 Withdrawal due to lack of treatment efficacy (No. of patients). | ||||
| 14.1 MDI | 7 | 1105 | Peto Odds Ratio (Peto, Fixed, 95% CI) | 0.19 [0.14, 0.24] |
| 14.2 DPI | 10 | 2966 | Peto Odds Ratio (Peto, Fixed, 95% CI) | 0.22 [0.17, 0.28] |
| 15 Withdrawals due to adverse events Show forest plot | 13 | 3595 | Peto Odds Ratio (Peto, Fixed, 95% CI) | 1.31 [0.76, 2.27] |
| Analysis 7.15  Comparison 7 FP versus placebo: Parallel group studies, no oral steroids: 200 mcg/d (all delivery devices), Outcome 15 Withdrawals due to adverse events. | ||||
| 15.1 MDI | 6 | 778 | Peto Odds Ratio (Peto, Fixed, 95% CI) | 1.35 [0.43, 4.21] |
| 15.2 DPI | 7 | 2817 | Peto Odds Ratio (Peto, Fixed, 95% CI) | 1.30 [0.70, 2.42] |
| 16 Withdrawals (any reason) Show forest plot | 8 | 2080 | Peto Odds Ratio (Peto, Fixed, 95% CI) | 0.40 [0.31, 0.51] |
| Analysis 7.16  Comparison 7 FP versus placebo: Parallel group studies, no oral steroids: 200 mcg/d (all delivery devices), Outcome 16 Withdrawals (any reason). | ||||
| 16.1 MDI | 2 | 226 | Peto Odds Ratio (Peto, Fixed, 95% CI) | 0.21 [0.12, 0.37] |
| 16.2 DPI | 6 | 1854 | Peto Odds Ratio (Peto, Fixed, 95% CI) | 0.46 [0.35, 0.61] |
| 17 Sore throat or pharyngitis (No. of patients) Show forest plot | 17 | 3480 | Peto Odds Ratio (Peto, Fixed, 95% CI) | 1.82 [1.27, 2.60] |
| Analysis 7.17  Comparison 7 FP versus placebo: Parallel group studies, no oral steroids: 200 mcg/d (all delivery devices), Outcome 17 Sore throat or pharyngitis (No. of patients). | ||||
| 17.1 MDI | 8 | 1085 | Peto Odds Ratio (Peto, Fixed, 95% CI) | 2.21 [1.26, 3.89] |
| 17.2 DPI | 9 | 2395 | Peto Odds Ratio (Peto, Fixed, 95% CI) | 1.60 [1.01, 2.53] |
| 18 Hoarseness or dysphonia (No. of patients) Show forest plot | 10 | 1645 | Peto Odds Ratio (Peto, Fixed, 95% CI) | 6.34 [2.83, 14.21] |
| Analysis 7.18  Comparison 7 FP versus placebo: Parallel group studies, no oral steroids: 200 mcg/d (all delivery devices), Outcome 18 Hoarseness or dysphonia (No. of patients). | ||||
| 18.1 MDI | 5 | 757 | Peto Odds Ratio (Peto, Fixed, 95% CI) | 5.74 [2.13, 15.45] |
| 18.2 DPI | 5 | 888 | Peto Odds Ratio (Peto, Fixed, 95% CI) | 7.72 [1.92, 31.07] |
| 19 Oral Candidiasis (No. of patients) Show forest plot | 13 | 1887 | Peto Odds Ratio (Peto, Fixed, 95% CI) | 2.55 [1.43, 4.56] |
| Analysis 7.19  Comparison 7 FP versus placebo: Parallel group studies, no oral steroids: 200 mcg/d (all delivery devices), Outcome 19 Oral Candidiasis (No. of patients). | ||||
| 19.1 MDI | 6 | 834 | Peto Odds Ratio (Peto, Fixed, 95% CI) | 3.26 [1.17, 9.06] |
| 19.2 DPI | 7 | 1053 | Peto Odds Ratio (Peto, Fixed, 95% CI) | 2.27 [1.12, 4.59] |
| 20 Headaches Show forest plot | 10 | 2602 | Peto Odds Ratio (Peto, Fixed, 95% CI) | 1.07 [0.83, 1.38] |
| Analysis 7.20  Comparison 7 FP versus placebo: Parallel group studies, no oral steroids: 200 mcg/d (all delivery devices), Outcome 20 Headaches. | ||||
| 20.1 MDI | 4 | 446 | Peto Odds Ratio (Peto, Fixed, 95% CI) | 1.07 [0.61, 1.87] |
| 20.2 DPI | 6 | 2156 | Peto Odds Ratio (Peto, Fixed, 95% CI) | 1.07 [0.80, 1.43] |
| 21 Sinusitis Show forest plot | 5 | 2030 | Peto Odds Ratio (Peto, Fixed, 95% CI) | 1.29 [0.84, 1.99] |
| Analysis 7.21  Comparison 7 FP versus placebo: Parallel group studies, no oral steroids: 200 mcg/d (all delivery devices), Outcome 21 Sinusitis. | ||||
| 21.1 MDI | 3 | 587 | Peto Odds Ratio (Peto, Fixed, 95% CI) | 1.63 [0.85, 3.11] |
| 21.2 DPI | 2 | 1443 | Peto Odds Ratio (Peto, Fixed, 95% CI) | 1.08 [0.61, 1.92] |
| Outcome or subgroup title | No. of studies | No. of participants | Statistical method | Effect size |
| 1 Change in FEV1 compared to baseline (litres) Show forest plot | 22 | 4936 | Litres (Fixed, 95% CI) | 0.24 [0.21, 0.26] |
| Analysis 8.1  Comparison 8 FP versus placebo: Parallel group studies, no oral steroids: 200 mcg/d (all degrees asthma severity), Outcome 1 Change in FEV1 compared to baseline (litres). | ||||
| 1.1 Mild | 1 | 1263 | Litres (Fixed, 95% CI) | 0.1 [0.04, 0.16] |
| 1.2 Mild to moderate | 8 | 1320 | Litres (Fixed, 95% CI) | 0.26 [0.22, 0.31] |
| 1.3 Moderate | 13 | 2353 | Litres (Fixed, 95% CI) | 0.27 [0.23, 0.30] |
| 2 Change in FEV1 (% predicted) Show forest plot | 5 | 674 | % (Fixed, 95% CI) | 9.95 [7.98, 11.91] |
| Analysis 8.2  Comparison 8 FP versus placebo: Parallel group studies, no oral steroids: 200 mcg/d (all degrees asthma severity), Outcome 2 Change in FEV1 (% predicted). | ||||
| 2.1 Mild | 0 | 0 | % (Fixed, 95% CI) | 0.0 [0.0, 0.0] |
| 2.2 Mild to moderate | 2 | 304 | % (Fixed, 95% CI) | 10.08 [6.69, 13.48] |
| 2.3 Moderate | 3 | 370 | % (Fixed, 95% CI) | 9.88 [7.47, 12.29] |
| 3 Change in morning PEFR compared with baseline Show forest plot | 24 | 5117 | Litres/min (Fixed, 95% CI) | 26.96 [24.51, 29.40] |
| Analysis 8.3  Comparison 8 FP versus placebo: Parallel group studies, no oral steroids: 200 mcg/d (all degrees asthma severity), Outcome 3 Change in morning PEFR compared with baseline. | ||||
| 3.1 Mild | 2 | 1331 | Litres/min (Fixed, 95% CI) | 19.35 [14.47, 24.24] |
| 3.2 Mild to moderate | 6 | 1094 | Litres/min (Fixed, 95% CI) | 24.48 [19.32, 29.64] |
| 3.3 Moderate | 16 | 2692 | Litres/min (Fixed, 95% CI) | 31.64 [28.27, 35.01] |
| 4 Change in evening PEFR compared to baseline Show forest plot | 16 | 3283 | Litres/min (Fixed, 95% CI) | 21.59 [18.55, 24.62] |
| Analysis 8.4  Comparison 8 FP versus placebo: Parallel group studies, no oral steroids: 200 mcg/d (all degrees asthma severity), Outcome 4 Change in evening PEFR compared to baseline. | ||||
| 4.1 Mild | 0 | 0 | Litres/min (Fixed, 95% CI) | 0.0 [0.0, 0.0] |
| 4.2 Mild to moderate | 5 | 1305 | Litres/min (Fixed, 95% CI) | 18.22 [13.35, 23.09] |
| 4.3 Moderate | 11 | 1978 | Litres/min (Fixed, 95% CI) | 23.72 [19.84, 27.59] |
| 5 Change in daily asthma symptom score compared to baseline Show forest plot | 20 | 3671 | Std. Mean Difference (IV, Fixed, 95% CI) | ‐0.49 [‐0.56, ‐0.43] |
| Analysis 8.5  Comparison 8 FP versus placebo: Parallel group studies, no oral steroids: 200 mcg/d (all degrees asthma severity), Outcome 5 Change in daily asthma symptom score compared to baseline. | ||||
| 5.1 Mild | 0 | 0 | Std. Mean Difference (IV, Fixed, 95% CI) | 0.0 [0.0, 0.0] |
| 5.2 Mild to moderate | 7 | 1518 | Std. Mean Difference (IV, Fixed, 95% CI) | ‐0.43 [‐0.53, ‐0.33] |
| 5.3 Moderate | 13 | 2153 | Std. Mean Difference (IV, Fixed, 95% CI) | ‐0.54 [‐0.63, ‐0.45] |
| 6 Change from baseline in symptom free days (%) Show forest plot | 3 | 971 | Mean Difference (IV, Fixed, 95% CI) | 7.03 [3.31, 10.75] |
| Analysis 8.6  Comparison 8 FP versus placebo: Parallel group studies, no oral steroids: 200 mcg/d (all degrees asthma severity), Outcome 6 Change from baseline in symptom free days (%). | ||||
| 6.1 Mild | 0 | 0 | Mean Difference (IV, Fixed, 95% CI) | 0.0 [0.0, 0.0] |
| 6.2 Mild to moderate | 1 | 408 | Mean Difference (IV, Fixed, 95% CI) | 4.0 [‐1.02, 9.02] |
| 6.3 Moderate | 2 | 563 | Mean Difference (IV, Fixed, 95% CI) | 10.72 [5.18, 16.27] |
| 7 Change in number night‐time wakenings per week Show forest plot | 4 | 641 | Mean Difference (IV, Fixed, 95% CI) | ‐0.17 [‐0.23, ‐0.12] |
| Analysis 8.7  Comparison 8 FP versus placebo: Parallel group studies, no oral steroids: 200 mcg/d (all degrees asthma severity), Outcome 7 Change in number night‐time wakenings per week. | ||||
| 7.1 Mild | 0 | 0 | Mean Difference (IV, Fixed, 95% CI) | 0.0 [0.0, 0.0] |
| 7.2 Mild to moderate | 1 | 160 | Mean Difference (IV, Fixed, 95% CI) | ‐0.17 [‐0.27, ‐0.07] |
| 7.3 Moderate | 3 | 481 | Mean Difference (IV, Fixed, 95% CI) | ‐0.17 [‐0.24, ‐0.11] |
| 8 Change from baseline in nighttime awakenings/night Show forest plot | 5 | 1359 | Mean Difference (IV, Fixed, 95% CI) | ‐0.12 [‐0.17, ‐0.08] |
| Analysis 8.8  Comparison 8 FP versus placebo: Parallel group studies, no oral steroids: 200 mcg/d (all degrees asthma severity), Outcome 8 Change from baseline in nighttime awakenings/night. | ||||
| 8.1 MDI | 1 | 227 | Mean Difference (IV, Fixed, 95% CI) | ‐0.15 [‐0.30, 0.00] |
| 8.2 DPI | 4 | 1132 | Mean Difference (IV, Fixed, 95% CI) | ‐0.12 [‐0.17, ‐0.07] |
| 9 Change in night‐time wakening score Show forest plot | 6 | 884 | Std. Mean Difference (IV, Fixed, 95% CI) | ‐0.45 [‐0.59, ‐0.32] |
| Analysis 8.9  Comparison 8 FP versus placebo: Parallel group studies, no oral steroids: 200 mcg/d (all degrees asthma severity), Outcome 9 Change in night‐time wakening score. | ||||
| 9.1 Mild | 0 | 0 | Std. Mean Difference (IV, Fixed, 95% CI) | 0.0 [0.0, 0.0] |
| 9.2 Mild to moderate | 1 | 160 | Std. Mean Difference (IV, Fixed, 95% CI) | ‐0.53 [‐0.84, ‐0.21] |
| 9.3 Moderate | 5 | 724 | Std. Mean Difference (IV, Fixed, 95% CI) | ‐0.44 [‐0.59, ‐0.29] |
| 10 Change in daily use of beta2 agonist compared to baseline (puffs/d) Show forest plot | 22 | 5111 | Mean Difference (IV, Fixed, 95% CI) | ‐1.01 [‐1.13, ‐0.88] |
| Analysis 8.10  Comparison 8 FP versus placebo: Parallel group studies, no oral steroids: 200 mcg/d (all degrees asthma severity), Outcome 10 Change in daily use of beta2 agonist compared to baseline (puffs/d). | ||||
| 10.1 Mild | 1 | 1263 | Mean Difference (IV, Fixed, 95% CI) | ‐0.18 [‐0.44, 0.08] |
| 10.2 Mild to moderate | 7 | 1518 | Mean Difference (IV, Fixed, 95% CI) | ‐0.89 [‐1.10, ‐0.68] |
| 10.3 Moderate | 14 | 2330 | Mean Difference (IV, Fixed, 95% CI) | ‐1.50 [‐1.68, ‐1.31] |
| 11 HRQOL: AQLQ Show forest plot | 3 | 513 | Mean Difference (IV, Fixed, 95% CI) | 0.68 [0.49, 0.87] |
| Analysis 8.11  Comparison 8 FP versus placebo: Parallel group studies, no oral steroids: 200 mcg/d (all degrees asthma severity), Outcome 11 HRQOL: AQLQ. | ||||
| 11.1 Mild | 0 | 0 | Mean Difference (IV, Fixed, 95% CI) | 0.0 [0.0, 0.0] |
| 11.2 Mild to moderate | 1 | 168 | Mean Difference (IV, Fixed, 95% CI) | 0.49 [0.17, 0.81] |
| 11.3 Moderate | 1 | 175 | Mean Difference (IV, Fixed, 95% CI) | 0.83 [0.48, 1.18] |
| 11.4 Unclear | 1 | 170 | Mean Difference (IV, Fixed, 95% CI) | 0.75 [0.43, 1.07] |
| 12 Physician‐rated efficacy: effective or very effective (No. of patients) Show forest plot | 3 | 568 | Peto Odds Ratio (Peto, Fixed, 95% CI) | 5.83 [4.16, 8.16] |
| Analysis 8.12  Comparison 8 FP versus placebo: Parallel group studies, no oral steroids: 200 mcg/d (all degrees asthma severity), Outcome 12 Physician‐rated efficacy: effective or very effective (No. of patients). | ||||
| 12.1 Mild | 0 | 0 | Peto Odds Ratio (Peto, Fixed, 95% CI) | 0.0 [0.0, 0.0] |
| 12.2 Mild to moderate | 1 | 168 | Peto Odds Ratio (Peto, Fixed, 95% CI) | 10.01 [5.46, 18.37] |
| 12.3 Moderate | 2 | 400 | Peto Odds Ratio (Peto, Fixed, 95% CI) | 4.58 [3.05, 6.86] |
| 13 Withdrawal due to clinical asthma exacerbation (No. of patients) Show forest plot | 4 | 702 | Peto Odds Ratio (Peto, Fixed, 95% CI) | 0.22 [0.12, 0.39] |
| Analysis 8.13  Comparison 8 FP versus placebo: Parallel group studies, no oral steroids: 200 mcg/d (all degrees asthma severity), Outcome 13 Withdrawal due to clinical asthma exacerbation (No. of patients). | ||||
| 13.1 Mild | 0 | 0 | Peto Odds Ratio (Peto, Fixed, 95% CI) | 0.0 [0.0, 0.0] |
| 13.2 Mild to moderate | 3 | 668 | Peto Odds Ratio (Peto, Fixed, 95% CI) | 0.22 [0.12, 0.42] |
| 13.3 Moderate | 1 | 34 | Peto Odds Ratio (Peto, Fixed, 95% CI) | 0.14 [0.02, 1.11] |
| 14 Withdrawal due to lack of treatment efficacy (No. of patients) Show forest plot | 17 | 4071 | Peto Odds Ratio (Peto, Fixed, 95% CI) | 0.20 [0.17, 0.24] |
| Analysis 8.14  Comparison 8 FP versus placebo: Parallel group studies, no oral steroids: 200 mcg/d (all degrees asthma severity), Outcome 14 Withdrawal due to lack of treatment efficacy (No. of patients). | ||||
| 14.1 Mild | 2 | 1404 | Peto Odds Ratio (Peto, Fixed, 95% CI) | 0.28 [0.08, 1.00] |
| 14.2 Mild to moderate | 4 | 906 | Peto Odds Ratio (Peto, Fixed, 95% CI) | 0.21 [0.14, 0.30] |
| 14.3 Moderate | 11 | 1761 | Peto Odds Ratio (Peto, Fixed, 95% CI) | 0.20 [0.17, 0.25] |
| 15 Withdrawals due to adverse events Show forest plot | 13 | 3595 | Peto Odds Ratio (Peto, Fixed, 95% CI) | 1.31 [0.76, 2.27] |
| Analysis 8.15  Comparison 8 FP versus placebo: Parallel group studies, no oral steroids: 200 mcg/d (all degrees asthma severity), Outcome 15 Withdrawals due to adverse events. | ||||
| 15.1 Mild | 3 | 1444 | Peto Odds Ratio (Peto, Fixed, 95% CI) | 1.40 [0.56, 3.51] |
| 15.2 Mild to moderate | 6 | 1171 | Peto Odds Ratio (Peto, Fixed, 95% CI) | 1.34 [0.50, 3.58] |
| 15.3 Moderate | 4 | 980 | Peto Odds Ratio (Peto, Fixed, 95% CI) | 1.21 [0.48, 3.07] |
| 16 Withdrawals (any reason) Show forest plot | 8 | 2080 | Peto Odds Ratio (Peto, Fixed, 95% CI) | 0.40 [0.31, 0.51] |
| Analysis 8.16  Comparison 8 FP versus placebo: Parallel group studies, no oral steroids: 200 mcg/d (all degrees asthma severity), Outcome 16 Withdrawals (any reason). | ||||
| 16.1 Mild | 1 | 1299 | Peto Odds Ratio (Peto, Fixed, 95% CI) | 0.61 [0.41, 0.90] |
| 16.2 Mild to moderate | 5 | 467 | Peto Odds Ratio (Peto, Fixed, 95% CI) | 0.39 [0.25, 0.60] |
| 16.3 Moderate | 2 | 314 | Peto Odds Ratio (Peto, Fixed, 95% CI) | 0.25 [0.16, 0.39] |
| 17 Sore throat or pharyngitis (No. of patients) Show forest plot | 17 | 3480 | Peto Odds Ratio (Peto, Fixed, 95% CI) | 1.82 [1.27, 2.60] |
| Analysis 8.17  Comparison 8 FP versus placebo: Parallel group studies, no oral steroids: 200 mcg/d (all degrees asthma severity), Outcome 17 Sore throat or pharyngitis (No. of patients). | ||||
| 17.1 Mild | 2 | 1394 | Peto Odds Ratio (Peto, Fixed, 95% CI) | 1.97 [1.11, 3.49] |
| 17.2 Mild to moderate | 7 | 751 | Peto Odds Ratio (Peto, Fixed, 95% CI) | 1.37 [0.75, 2.53] |
| 17.3 Moderate | 8 | 1335 | Peto Odds Ratio (Peto, Fixed, 95% CI) | 2.32 [1.16, 4.64] |
| 18 Hoarseness or dysphonia (No. of patients) Show forest plot | 10 | 1645 | Peto Odds Ratio (Peto, Fixed, 95% CI) | 6.34 [2.83, 14.21] |
| Analysis 8.18  Comparison 8 FP versus placebo: Parallel group studies, no oral steroids: 200 mcg/d (all degrees asthma severity), Outcome 18 Hoarseness or dysphonia (No. of patients). | ||||
| 18.1 Mild | 1 | 109 | Peto Odds Ratio (Peto, Fixed, 95% CI) | 7.39 [0.46, 119.72] |
| 18.2 Mild to moderate | 2 | 382 | Peto Odds Ratio (Peto, Fixed, 95% CI) | 7.22 [0.14, 363.83] |
| 18.3 Moderate | 7 | 1154 | Peto Odds Ratio (Peto, Fixed, 95% CI) | 6.21 [2.62, 14.72] |
| 19 Oral Candidiasis (No. of patients) Show forest plot | 13 | 1887 | Peto Odds Ratio (Peto, Fixed, 95% CI) | 2.55 [1.43, 4.56] |
| Analysis 8.19  Comparison 8 FP versus placebo: Parallel group studies, no oral steroids: 200 mcg/d (all degrees asthma severity), Outcome 19 Oral Candidiasis (No. of patients). | ||||
| 19.1 Mild | 1 | 109 | Peto Odds Ratio (Peto, Fixed, 95% CI) | 7.26 [0.14, 365.74] |
| 19.2 Mild to moderate | 4 | 600 | Peto Odds Ratio (Peto, Fixed, 95% CI) | 1.65 [0.67, 4.06] |
| 19.3 Moderate | 7 | 1155 | Peto Odds Ratio (Peto, Fixed, 95% CI) | 3.39 [1.56, 7.36] |
| 19.4 Unclear | 1 | 23 | Peto Odds Ratio (Peto, Fixed, 95% CI) | 0.0 [0.0, 0.0] |
| 20 Headaches Show forest plot | 10 | 2602 | Peto Odds Ratio (Peto, Fixed, 95% CI) | 1.07 [0.83, 1.38] |
| Analysis 8.20  Comparison 8 FP versus placebo: Parallel group studies, no oral steroids: 200 mcg/d (all degrees asthma severity), Outcome 20 Headaches. | ||||
| 20.1 Mild | 1 | 1285 | Peto Odds Ratio (Peto, Fixed, 95% CI) | 0.99 [0.70, 1.41] |
| 20.2 Mild to moderate | 7 | 965 | Peto Odds Ratio (Peto, Fixed, 95% CI) | 1.12 [0.73, 1.72] |
| 20.3 Moderate | 2 | 352 | Peto Odds Ratio (Peto, Fixed, 95% CI) | 1.39 [0.61, 3.19] |
| 21 Sinusitis Show forest plot | 5 | 2030 | Peto Odds Ratio (Peto, Fixed, 95% CI) | 1.29 [0.84, 1.99] |
| Analysis 8.21  Comparison 8 FP versus placebo: Parallel group studies, no oral steroids: 200 mcg/d (all degrees asthma severity), Outcome 21 Sinusitis. | ||||
| 21.1 Mild | 1 | 1285 | Peto Odds Ratio (Peto, Fixed, 95% CI) | 0.89 [0.44, 1.77] |
| 21.2 Mild to moderate | 2 | 338 | Peto Odds Ratio (Peto, Fixed, 95% CI) | 1.36 [0.61, 3.03] |
| 21.3 Moderate | 2 | 407 | Peto Odds Ratio (Peto, Fixed, 95% CI) | 1.94 [0.91, 4.14] |
| Outcome or subgroup title | No. of studies | No. of participants | Statistical method | Effect size |
| 1 Change in FEV1 compared to baseline (litres) Show forest plot | 6 | 872 | Mean Difference (IV, Fixed, 95% CI) | 0.44 [0.39, 0.50] |
| Analysis 9.1  Comparison 9 FP versus placebo: Parallel group studies, no oral steroids: 500 mcg/d (all ages), Outcome 1 Change in FEV1 compared to baseline (litres). | ||||
| 1.1 Children | 0 | 0 | Mean Difference (IV, Fixed, 95% CI) | 0.0 [0.0, 0.0] |
| 1.2 Adults | 6 | 872 | Mean Difference (IV, Fixed, 95% CI) | 0.44 [0.39, 0.50] |
| 2 FEV1 (% predicted ‐ absolute scores) Show forest plot | 2 | 50 | Mean Difference (IV, Fixed, 95% CI) | 24.43 [15.90, 32.95] |
| Analysis 9.2  Comparison 9 FP versus placebo: Parallel group studies, no oral steroids: 500 mcg/d (all ages), Outcome 2 FEV1 (% predicted ‐ absolute scores). | ||||
| 2.1 Children | 1 | 26 | Mean Difference (IV, Fixed, 95% CI) | 4.30 [‐25.66, 34.26] |
| 2.2 Adults | 1 | 24 | Mean Difference (IV, Fixed, 95% CI) | 26.20 [17.31, 35.09] |
| 3 Change in morning PEF Show forest plot | 8 | 1116 | Litres/min (Fixed, 95% CI) | 40.44 [35.43, 45.45] |
| Analysis 9.3  Comparison 9 FP versus placebo: Parallel group studies, no oral steroids: 500 mcg/d (all ages), Outcome 3 Change in morning PEF. | ||||
| 3.1 Children | 0 | 0 | Litres/min (Fixed, 95% CI) | 0.0 [0.0, 0.0] |
| 3.2 Adults | 8 | 1116 | Litres/min (Fixed, 95% CI) | 40.44 [35.43, 45.45] |
| 4 Change in morning PEFR compared to baseline (L/min) Show forest plot | 7 | 1076 | Mean Difference (IV, Fixed, 95% CI) | 40.12 [35.06, 45.17] |
| Analysis 9.4  Comparison 9 FP versus placebo: Parallel group studies, no oral steroids: 500 mcg/d (all ages), Outcome 4 Change in morning PEFR compared to baseline (L/min). | ||||
| 4.1 Children | 0 | 0 | Mean Difference (IV, Fixed, 95% CI) | 0.0 [0.0, 0.0] |
| 4.2 Adults | 7 | 1076 | Mean Difference (IV, Fixed, 95% CI) | 40.12 [35.06, 45.17] |
| 5 Change in am PEF (% predicted) Show forest plot | 1 | Mean Difference (IV, Fixed, 95% CI) | Totals not selected | |
| Analysis 9.5  Comparison 9 FP versus placebo: Parallel group studies, no oral steroids: 500 mcg/d (all ages), Outcome 5 Change in am PEF (% predicted). | ||||
| 5.1 Children | 0 | Mean Difference (IV, Fixed, 95% CI) | 0.0 [0.0, 0.0] | |
| 5.2 Adults | 1 | Mean Difference (IV, Fixed, 95% CI) | 0.0 [0.0, 0.0] | |
| 6 Change in evening PEF compared with baseline Show forest plot | 4 | 515 | Litres/min (Fixed, 95% CI) | 30.20 [22.52, 37.87] |
| Analysis 9.6  Comparison 9 FP versus placebo: Parallel group studies, no oral steroids: 500 mcg/d (all ages), Outcome 6 Change in evening PEF compared with baseline. | ||||
| 6.1 Children | 0 | 0 | Litres/min (Fixed, 95% CI) | 0.0 [0.0, 0.0] |
| 6.2 Adults | 4 | 515 | Litres/min (Fixed, 95% CI) | 30.20 [22.52, 37.87] |
| 7 Change in evening PEF compared with baseline (L/min) Show forest plot | 3 | 354 | Mean Difference (IV, Fixed, 95% CI) | 28.96 [20.86, 37.06] |
| Analysis 9.7  Comparison 9 FP versus placebo: Parallel group studies, no oral steroids: 500 mcg/d (all ages), Outcome 7 Change in evening PEF compared with baseline (L/min). | ||||
| 7.1 Children | 0 | 0 | Mean Difference (IV, Fixed, 95% CI) | 0.0 [0.0, 0.0] |
| 7.2 Adults | 3 | 354 | Mean Difference (IV, Fixed, 95% CI) | 28.96 [20.86, 37.06] |
| 8 Change in daily asthma symptom score compared to baseline Show forest plot | 4 | 685 | Std. Mean Difference (IV, Fixed, 95% CI) | ‐0.85 [‐1.01, ‐0.70] |
| Analysis 9.8  Comparison 9 FP versus placebo: Parallel group studies, no oral steroids: 500 mcg/d (all ages), Outcome 8 Change in daily asthma symptom score compared to baseline. | ||||
| 8.1 Children | 0 | 0 | Std. Mean Difference (IV, Fixed, 95% CI) | 0.0 [0.0, 0.0] |
| 8.2 Adults | 4 | 685 | Std. Mean Difference (IV, Fixed, 95% CI) | ‐0.85 [‐1.01, ‐0.70] |
| 9 Change in number night‐time wakenings per week Show forest plot | 1 | Mean Difference (IV, Fixed, 95% CI) | Totals not selected | |
| Analysis 9.9  Comparison 9 FP versus placebo: Parallel group studies, no oral steroids: 500 mcg/d (all ages), Outcome 9 Change in number night‐time wakenings per week. | ||||
| 9.1 Children | 0 | Mean Difference (IV, Fixed, 95% CI) | 0.0 [0.0, 0.0] | |
| 9.2 Adults | 1 | Mean Difference (IV, Fixed, 95% CI) | 0.0 [0.0, 0.0] | |
| 10 Change in number of night‐time awakenings per night Show forest plot | 1 | Mean Difference (IV, Fixed, 95% CI) | Totals not selected | |
| Analysis 9.10  Comparison 9 FP versus placebo: Parallel group studies, no oral steroids: 500 mcg/d (all ages), Outcome 10 Change in number of night‐time awakenings per night. | ||||
| 10.1 Children | 0 | Mean Difference (IV, Fixed, 95% CI) | 0.0 [0.0, 0.0] | |
| 10.2 Adults | 1 | Mean Difference (IV, Fixed, 95% CI) | 0.0 [0.0, 0.0] | |
| 11 Change in % nights with no awakenings Show forest plot | 1 | Mean Difference (IV, Fixed, 95% CI) | Totals not selected | |
| Analysis 9.11  Comparison 9 FP versus placebo: Parallel group studies, no oral steroids: 500 mcg/d (all ages), Outcome 11 Change in % nights with no awakenings. | ||||
| 11.1 Children | 0 | Mean Difference (IV, Fixed, 95% CI) | 0.0 [0.0, 0.0] | |
| 11.2 Adults | 1 | Mean Difference (IV, Fixed, 95% CI) | 0.0 [0.0, 0.0] | |
| 12 Change in night‐time wakening score Show forest plot | 2 | 351 | Std. Mean Difference (IV, Fixed, 95% CI) | ‐0.74 [‐0.96, ‐0.52] |
| Analysis 9.12  Comparison 9 FP versus placebo: Parallel group studies, no oral steroids: 500 mcg/d (all ages), Outcome 12 Change in night‐time wakening score. | ||||
| 12.1 Children | 0 | 0 | Std. Mean Difference (IV, Fixed, 95% CI) | 0.0 [0.0, 0.0] |
| 12.2 Adults | 2 | 351 | Std. Mean Difference (IV, Fixed, 95% CI) | ‐0.74 [‐0.96, ‐0.52] |
| 13 Change in daily use of beta2 agonist compared to baseline (puffs/d) Show forest plot | 4 | 682 | Mean Difference (IV, Fixed, 95% CI) | ‐2.22 [‐2.59, ‐1.84] |
| Analysis 9.13  Comparison 9 FP versus placebo: Parallel group studies, no oral steroids: 500 mcg/d (all ages), Outcome 13 Change in daily use of beta2 agonist compared to baseline (puffs/d). | ||||
| 13.1 Children | 0 | 0 | Mean Difference (IV, Fixed, 95% CI) | 0.0 [0.0, 0.0] |
| 13.2 Adults | 4 | 682 | Mean Difference (IV, Fixed, 95% CI) | ‐2.22 [‐2.59, ‐1.84] |
| 14 Change in percentage of symptom free days compared to baseline Show forest plot | 2 | 361 | Mean Difference (IV, Fixed, 95% CI) | 21.32 [13.54, 29.09] |
| Analysis 9.14  Comparison 9 FP versus placebo: Parallel group studies, no oral steroids: 500 mcg/d (all ages), Outcome 14 Change in percentage of symptom free days compared to baseline. | ||||
| 14.1 Children | 0 | 0 | Mean Difference (IV, Fixed, 95% CI) | 0.0 [0.0, 0.0] |
| 14.2 Adults | 2 | 361 | Mean Difference (IV, Fixed, 95% CI) | 21.32 [13.54, 29.09] |
| 15 Change in percentage of rescue beta2 agonist free days compared to baseline Show forest plot | 1 | Mean Difference (IV, Fixed, 95% CI) | Totals not selected | |
| Analysis 9.15  Comparison 9 FP versus placebo: Parallel group studies, no oral steroids: 500 mcg/d (all ages), Outcome 15 Change in percentage of rescue beta2 agonist free days compared to baseline. | ||||
| 15.1 Children | 0 | Mean Difference (IV, Fixed, 95% CI) | 0.0 [0.0, 0.0] | |
| 15.2 Adults | 1 | Mean Difference (IV, Fixed, 95% CI) | 0.0 [0.0, 0.0] | |
| 16 HRQOL: AQLQ Show forest plot | 1 | Mean Difference (IV, Fixed, 95% CI) | Totals not selected | |
| Analysis 9.16  Comparison 9 FP versus placebo: Parallel group studies, no oral steroids: 500 mcg/d (all ages), Outcome 16 HRQOL: AQLQ. | ||||
| 16.1 Children | 0 | Mean Difference (IV, Fixed, 95% CI) | 0.0 [0.0, 0.0] | |
| 16.2 Adults | 1 | Mean Difference (IV, Fixed, 95% CI) | 0.0 [0.0, 0.0] | |
| 17 Physician rated global efficacy: effective or very effective (No. of patients) Show forest plot | 3 | 480 | Peto Odds Ratio (Peto, Fixed, 95% CI) | 5.86 [4.09, 8.39] |
| Analysis 9.17  Comparison 9 FP versus placebo: Parallel group studies, no oral steroids: 500 mcg/d (all ages), Outcome 17 Physician rated global efficacy: effective or very effective (No. of patients). | ||||
| 17.1 Children | 0 | 0 | Peto Odds Ratio (Peto, Fixed, 95% CI) | 0.0 [0.0, 0.0] |
| 17.2 Adults | 3 | 480 | Peto Odds Ratio (Peto, Fixed, 95% CI) | 5.86 [4.09, 8.39] |
| 18 Withdrawal due to clinical asthma exacerbation (No. of patients) Show forest plot | 2 | 191 | Peto Odds Ratio (Peto, Fixed, 95% CI) | 0.40 [0.17, 0.98] |
| Analysis 9.18  Comparison 9 FP versus placebo: Parallel group studies, no oral steroids: 500 mcg/d (all ages), Outcome 18 Withdrawal due to clinical asthma exacerbation (No. of patients). | ||||
| 18.1 Children | 0 | 0 | Peto Odds Ratio (Peto, Fixed, 95% CI) | 0.0 [0.0, 0.0] |
| 18.2 Adults | 2 | 191 | Peto Odds Ratio (Peto, Fixed, 95% CI) | 0.40 [0.17, 0.98] |
| 19 Withdrawal due to lack of treatment efficacy (No. of patients) Show forest plot | 5 | 847 | Peto Odds Ratio (Peto, Fixed, 95% CI) | 0.14 [0.10, 0.18] |
| Analysis 9.19  Comparison 9 FP versus placebo: Parallel group studies, no oral steroids: 500 mcg/d (all ages), Outcome 19 Withdrawal due to lack of treatment efficacy (No. of patients). | ||||
| 19.1 Children | 0 | 0 | Peto Odds Ratio (Peto, Fixed, 95% CI) | 0.0 [0.0, 0.0] |
| 19.2 Adults | 5 | 847 | Peto Odds Ratio (Peto, Fixed, 95% CI) | 0.14 [0.10, 0.18] |
| 20 Withdrawals (total) Show forest plot | 1 | Peto Odds Ratio (Peto, Fixed, 95% CI) | Totals not selected | |
| Analysis 9.20  Comparison 9 FP versus placebo: Parallel group studies, no oral steroids: 500 mcg/d (all ages), Outcome 20 Withdrawals (total). | ||||
| 20.1 Children | 0 | Peto Odds Ratio (Peto, Fixed, 95% CI) | 0.0 [0.0, 0.0] | |
| 20.2 Adults | 1 | Peto Odds Ratio (Peto, Fixed, 95% CI) | 0.0 [0.0, 0.0] | |
| 21 Sore throat or pharyngitis (No. of patients) Show forest plot | 4 | 670 | Peto Odds Ratio (Peto, Fixed, 95% CI) | 4.49 [1.11, 18.13] |
| Analysis 9.21  Comparison 9 FP versus placebo: Parallel group studies, no oral steroids: 500 mcg/d (all ages), Outcome 21 Sore throat or pharyngitis (No. of patients). | ||||
| 21.1 Children | 0 | 0 | Peto Odds Ratio (Peto, Fixed, 95% CI) | 0.0 [0.0, 0.0] |
| 21.2 Adults | 4 | 670 | Peto Odds Ratio (Peto, Fixed, 95% CI) | 4.49 [1.11, 18.13] |
| 22 Hoarseness or dysphonia (No. of patients) Show forest plot | 4 | 670 | Peto Odds Ratio (Peto, Fixed, 95% CI) | 7.36 [2.65, 20.46] |
| Analysis 9.22  Comparison 9 FP versus placebo: Parallel group studies, no oral steroids: 500 mcg/d (all ages), Outcome 22 Hoarseness or dysphonia (No. of patients). | ||||
| 22.1 Children | 0 | 0 | Peto Odds Ratio (Peto, Fixed, 95% CI) | 0.0 [0.0, 0.0] |
| 22.2 Adults | 4 | 670 | Peto Odds Ratio (Peto, Fixed, 95% CI) | 7.36 [2.65, 20.46] |
| 23 Oral Candidiasis (No. of patients) Show forest plot | 5 | 841 | Peto Odds Ratio (Peto, Fixed, 95% CI) | 6.37 [2.62, 15.48] |
| Analysis 9.23  Comparison 9 FP versus placebo: Parallel group studies, no oral steroids: 500 mcg/d (all ages), Outcome 23 Oral Candidiasis (No. of patients). | ||||
| 23.1 Children | 0 | 0 | Peto Odds Ratio (Peto, Fixed, 95% CI) | 0.0 [0.0, 0.0] |
| 23.2 Adults | 5 | 841 | Peto Odds Ratio (Peto, Fixed, 95% CI) | 6.37 [2.62, 15.48] |
| 25 No. patients with </=18 mcg/dL poststimulation cortisol Show forest plot | 1 | Peto Odds Ratio (Peto, Fixed, 95% CI) | Totals not selected | |
| Analysis 9.25  Comparison 9 FP versus placebo: Parallel group studies, no oral steroids: 500 mcg/d (all ages), Outcome 25 No. patients with </=18 mcg/dL poststimulation cortisol. | ||||
| 25.1 Children | 0 | Peto Odds Ratio (Peto, Fixed, 95% CI) | 0.0 [0.0, 0.0] | |
| 25.2 Adults | 1 | Peto Odds Ratio (Peto, Fixed, 95% CI) | 0.0 [0.0, 0.0] | |
| 26 Plasma cortisol (AUC) Show forest plot | 1 | Mean Difference (IV, Fixed, 95% CI) | Totals not selected | |
| Analysis 9.26  Comparison 9 FP versus placebo: Parallel group studies, no oral steroids: 500 mcg/d (all ages), Outcome 26 Plasma cortisol (AUC). | ||||
| 26.1 Children | 0 | Mean Difference (IV, Fixed, 95% CI) | 0.0 [0.0, 0.0] | |
| 26.2 Adults | 1 | Mean Difference (IV, Fixed, 95% CI) | 0.0 [0.0, 0.0] | |
| Outcome or subgroup title | No. of studies | No. of participants | Statistical method | Effect size |
| 1 Change in FEV1 compared to baseline (litres) Show forest plot | 6 | 872 | Mean Difference (IV, Fixed, 95% CI) | 0.44 [0.39, 0.50] |
| Analysis 10.1  Comparison 10 FP versus placebo: Parallel group studies, no oral steroids: 500 mcg/d (all treatment durations), Outcome 1 Change in FEV1 compared to baseline (litres). | ||||
| 1.1 1‐4 weeks | 0 | 0 | Mean Difference (IV, Fixed, 95% CI) | 0.0 [0.0, 0.0] |
| 1.2 1‐5 months | 6 | 872 | Mean Difference (IV, Fixed, 95% CI) | 0.44 [0.39, 0.50] |
| 1.3 6 months or longer | 0 | 0 | Mean Difference (IV, Fixed, 95% CI) | 0.0 [0.0, 0.0] |
| 2 Change in morning PEFR compared to baseline Show forest plot | 8 | 1116 | Litres/min (Fixed, 95% CI) | 40.44 [35.43, 45.45] |
| Analysis 10.2  Comparison 10 FP versus placebo: Parallel group studies, no oral steroids: 500 mcg/d (all treatment durations), Outcome 2 Change in morning PEFR compared to baseline. | ||||
| 2.1 1‐4 weeks | 0 | 0 | Litres/min (Fixed, 95% CI) | 0.0 [0.0, 0.0] |
| 2.2 1‐5 months | 8 | 1116 | Litres/min (Fixed, 95% CI) | 40.44 [35.43, 45.45] |
| 2.3 6 months or longer | 0 | 0 | Litres/min (Fixed, 95% CI) | 0.0 [0.0, 0.0] |
| 3 Change in evening PEF compared with baseline (L/min) Show forest plot | 3 | 354 | Mean Difference (IV, Fixed, 95% CI) | 28.96 [20.86, 37.06] |
| Analysis 10.3  Comparison 10 FP versus placebo: Parallel group studies, no oral steroids: 500 mcg/d (all treatment durations), Outcome 3 Change in evening PEF compared with baseline (L/min). | ||||
| 3.1 1‐4 weeks | 0 | 0 | Mean Difference (IV, Fixed, 95% CI) | 0.0 [0.0, 0.0] |
| 3.2 1‐5 months | 3 | 354 | Mean Difference (IV, Fixed, 95% CI) | 28.96 [20.86, 37.06] |
| 3.3 6 months or longer | 0 | 0 | Mean Difference (IV, Fixed, 95% CI) | 0.0 [0.0, 0.0] |
| 4 Change in daily asthma symptom score compared to baseline Show forest plot | 4 | 685 | Std. Mean Difference (IV, Fixed, 95% CI) | ‐0.85 [‐1.01, ‐0.70] |
| Analysis 10.4  Comparison 10 FP versus placebo: Parallel group studies, no oral steroids: 500 mcg/d (all treatment durations), Outcome 4 Change in daily asthma symptom score compared to baseline. | ||||
| 4.1 1‐4 weeks | 0 | 0 | Std. Mean Difference (IV, Fixed, 95% CI) | 0.0 [0.0, 0.0] |
| 4.2 1‐5 months | 4 | 685 | Std. Mean Difference (IV, Fixed, 95% CI) | ‐0.85 [‐1.01, ‐0.70] |
| 4.3 6 months or longer | 0 | 0 | Std. Mean Difference (IV, Fixed, 95% CI) | 0.0 [0.0, 0.0] |
| 5 Change in night‐time wakening score Show forest plot | 2 | 351 | Std. Mean Difference (IV, Fixed, 95% CI) | ‐0.74 [‐0.96, ‐0.52] |
| Analysis 10.5  Comparison 10 FP versus placebo: Parallel group studies, no oral steroids: 500 mcg/d (all treatment durations), Outcome 5 Change in night‐time wakening score. | ||||
| 5.1 1‐4 weeks | 0 | 0 | Std. Mean Difference (IV, Fixed, 95% CI) | 0.0 [0.0, 0.0] |
| 5.2 1‐5 months | 2 | 351 | Std. Mean Difference (IV, Fixed, 95% CI) | ‐0.74 [‐0.96, ‐0.52] |
| 5.3 6 months or longer | 0 | 0 | Std. Mean Difference (IV, Fixed, 95% CI) | 0.0 [0.0, 0.0] |
| 6 Change in daily use of beta2 agonist compared to baseline (puffs/d) Show forest plot | 4 | 682 | Mean Difference (IV, Fixed, 95% CI) | ‐2.22 [‐2.59, ‐1.84] |
| Analysis 10.6  Comparison 10 FP versus placebo: Parallel group studies, no oral steroids: 500 mcg/d (all treatment durations), Outcome 6 Change in daily use of beta2 agonist compared to baseline (puffs/d). | ||||
| 6.1 1‐4 weeks | 0 | 0 | Mean Difference (IV, Fixed, 95% CI) | 0.0 [0.0, 0.0] |
| 6.2 1‐5 months | 4 | 682 | Mean Difference (IV, Fixed, 95% CI) | ‐2.22 [‐2.59, ‐1.84] |
| 6.3 6 months or longer | 0 | 0 | Mean Difference (IV, Fixed, 95% CI) | 0.0 [0.0, 0.0] |
| 9 Physician rated global efficacy: effective or very effective (No. of patients) Show forest plot | 3 | 480 | Peto Odds Ratio (Peto, Fixed, 95% CI) | 5.86 [4.09, 8.39] |
| Analysis 10.9  Comparison 10 FP versus placebo: Parallel group studies, no oral steroids: 500 mcg/d (all treatment durations), Outcome 9 Physician rated global efficacy: effective or very effective (No. of patients). | ||||
| 9.1 1‐4 weeks | 0 | 0 | Peto Odds Ratio (Peto, Fixed, 95% CI) | 0.0 [0.0, 0.0] |
| 9.2 1‐5 months | 3 | 480 | Peto Odds Ratio (Peto, Fixed, 95% CI) | 5.86 [4.09, 8.39] |
| 9.3 6 months or longer | 0 | 0 | Peto Odds Ratio (Peto, Fixed, 95% CI) | 0.0 [0.0, 0.0] |
| 11 Withdrawal due to lack of treatment efficacy (No. of patients) Show forest plot | 4 | 676 | Peto Odds Ratio (Peto, Fixed, 95% CI) | 0.12 [0.09, 0.17] |
| Analysis 10.11  Comparison 10 FP versus placebo: Parallel group studies, no oral steroids: 500 mcg/d (all treatment durations), Outcome 11 Withdrawal due to lack of treatment efficacy (No. of patients). | ||||
| 11.1 1‐4 weeks | 0 | 0 | Peto Odds Ratio (Peto, Fixed, 95% CI) | 0.0 [0.0, 0.0] |
| 11.2 1‐5 months | 4 | 676 | Peto Odds Ratio (Peto, Fixed, 95% CI) | 0.12 [0.09, 0.17] |
| 11.3 6 months or longer | 0 | 0 | Peto Odds Ratio (Peto, Fixed, 95% CI) | 0.0 [0.0, 0.0] |
| 12 Sore throat or pharyngitis (No. of patients) Show forest plot | 4 | 670 | Peto Odds Ratio (Peto, Fixed, 95% CI) | 4.49 [1.11, 18.13] |
| Analysis 10.12  Comparison 10 FP versus placebo: Parallel group studies, no oral steroids: 500 mcg/d (all treatment durations), Outcome 12 Sore throat or pharyngitis (No. of patients). | ||||
| 12.1 1‐4 weeks | 0 | 0 | Peto Odds Ratio (Peto, Fixed, 95% CI) | 0.0 [0.0, 0.0] |
| 12.2 1‐5 months | 4 | 670 | Peto Odds Ratio (Peto, Fixed, 95% CI) | 4.49 [1.11, 18.13] |
| 12.3 6 months or longer | 0 | 0 | Peto Odds Ratio (Peto, Fixed, 95% CI) | 0.0 [0.0, 0.0] |
| 13 Hoarseness or dysphonia (No. of patients) Show forest plot | 4 | 670 | Peto Odds Ratio (Peto, Fixed, 95% CI) | 7.36 [2.65, 20.46] |
| Analysis 10.13  Comparison 10 FP versus placebo: Parallel group studies, no oral steroids: 500 mcg/d (all treatment durations), Outcome 13 Hoarseness or dysphonia (No. of patients). | ||||
| 13.1 1‐4 weeks | 0 | 0 | Peto Odds Ratio (Peto, Fixed, 95% CI) | 0.0 [0.0, 0.0] |
| 13.2 1‐5 months | 4 | 670 | Peto Odds Ratio (Peto, Fixed, 95% CI) | 7.36 [2.65, 20.46] |
| 13.3 6 months or longer | 0 | 0 | Peto Odds Ratio (Peto, Fixed, 95% CI) | 0.0 [0.0, 0.0] |
| 14 Oral Candidiasis (No. of patients) Show forest plot | 5 | 841 | Peto Odds Ratio (Peto, Fixed, 95% CI) | 6.37 [2.62, 15.48] |
| Analysis 10.14  Comparison 10 FP versus placebo: Parallel group studies, no oral steroids: 500 mcg/d (all treatment durations), Outcome 14 Oral Candidiasis (No. of patients). | ||||
| 14.1 1‐4 weeks | 0 | 0 | Peto Odds Ratio (Peto, Fixed, 95% CI) | 0.0 [0.0, 0.0] |
| 14.2 1‐5 months | 5 | 841 | Peto Odds Ratio (Peto, Fixed, 95% CI) | 6.37 [2.62, 15.48] |
| 14.3 6 months or longer | 0 | 0 | Peto Odds Ratio (Peto, Fixed, 95% CI) | 0.0 [0.0, 0.0] |
| Outcome or subgroup title | No. of studies | No. of participants | Statistical method | Effect size |
| 1 Change in FEV1 compared to baseline (litres) Show forest plot | 6 | 872 | Mean Difference (IV, Fixed, 95% CI) | 0.44 [0.39, 0.50] |
| Analysis 11.1  Comparison 11 FP versus placebo: Parallel group studies, no oral steroids: 500 mcg/d (all delivery devices), Outcome 1 Change in FEV1 compared to baseline (litres). | ||||
| 1.1 MDI | 1 | 26 | Mean Difference (IV, Fixed, 95% CI) | 0.46 [0.29, 0.63] |
| 1.2 DPI | 5 | 846 | Mean Difference (IV, Fixed, 95% CI) | 0.44 [0.38, 0.50] |
| 2 Change in morning PEFR compared with baseline Show forest plot | 8 | 1116 | Litres/min (Fixed, 95% CI) | 40.44 [35.43, 45.45] |
| Analysis 11.2  Comparison 11 FP versus placebo: Parallel group studies, no oral steroids: 500 mcg/d (all delivery devices), Outcome 2 Change in morning PEFR compared with baseline. | ||||
| 2.1 MDI | 2 | 230 | Litres/min (Fixed, 95% CI) | 34.84 [23.10, 46.58] |
| 2.2 DPI | 6 | 886 | Litres/min (Fixed, 95% CI) | 41.69 [36.15, 47.23] |
| 3 Change in evening PEF compared with baseline (L/min) Show forest plot | 3 | 354 | Mean Difference (IV, Fixed, 95% CI) | 28.96 [20.86, 37.06] |
| Analysis 11.3  Comparison 11 FP versus placebo: Parallel group studies, no oral steroids: 500 mcg/d (all delivery devices), Outcome 3 Change in evening PEF compared with baseline (L/min). | ||||
| 3.1 MDI | 1 | 23 | Mean Difference (IV, Fixed, 95% CI) | 8.3 [‐12.40, 29.00] |
| 3.2 1DPI | 2 | 331 | Mean Difference (IV, Fixed, 95% CI) | 32.69 [23.90, 41.49] |
| 4 Change in daily asthma symptom score compared to baseline Show forest plot | 4 | 685 | Std. Mean Difference (IV, Fixed, 95% CI) | ‐0.85 [‐1.01, ‐0.70] |
| Analysis 11.4  Comparison 11 FP versus placebo: Parallel group studies, no oral steroids: 500 mcg/d (all delivery devices), Outcome 4 Change in daily asthma symptom score compared to baseline. | ||||
| 4.1 MDI | 0 | 0 | Std. Mean Difference (IV, Fixed, 95% CI) | 0.0 [0.0, 0.0] |
| 4.2 DPI | 4 | 685 | Std. Mean Difference (IV, Fixed, 95% CI) | ‐0.85 [‐1.01, ‐0.70] |
| 5 Change in night‐time wakening score Show forest plot | 2 | 351 | Std. Mean Difference (IV, Fixed, 95% CI) | ‐0.74 [‐0.96, ‐0.52] |
| Analysis 11.5  Comparison 11 FP versus placebo: Parallel group studies, no oral steroids: 500 mcg/d (all delivery devices), Outcome 5 Change in night‐time wakening score. | ||||
| 5.1 MDI | 0 | 0 | Std. Mean Difference (IV, Fixed, 95% CI) | 0.0 [0.0, 0.0] |
| 5.2 DPI | 2 | 351 | Std. Mean Difference (IV, Fixed, 95% CI) | ‐0.74 [‐0.96, ‐0.52] |
| 6 Change in daily use of beta2 agonist compared to baseline (puffs/d) Show forest plot | 4 | 682 | Mean Difference (IV, Fixed, 95% CI) | ‐2.22 [‐2.59, ‐1.84] |
| Analysis 11.6  Comparison 11 FP versus placebo: Parallel group studies, no oral steroids: 500 mcg/d (all delivery devices), Outcome 6 Change in daily use of beta2 agonist compared to baseline (puffs/d). | ||||
| 6.1 MDI | 0 | 0 | Mean Difference (IV, Fixed, 95% CI) | 0.0 [0.0, 0.0] |
| 6.2 DPI | 4 | 682 | Mean Difference (IV, Fixed, 95% CI) | ‐2.22 [‐2.59, ‐1.84] |
| 9 Physician rated global efficacy: effective or very effective (No. of patients) Show forest plot | 3 | 480 | Peto Odds Ratio (Peto, Fixed, 95% CI) | 5.86 [4.09, 8.39] |
| Analysis 11.9  Comparison 11 FP versus placebo: Parallel group studies, no oral steroids: 500 mcg/d (all delivery devices), Outcome 9 Physician rated global efficacy: effective or very effective (No. of patients). | ||||
| 9.1 MDI | 1 | 147 | Peto Odds Ratio (Peto, Fixed, 95% CI) | 5.23 [2.74, 10.00] |
| 9.2 DPI | 2 | 333 | Peto Odds Ratio (Peto, Fixed, 95% CI) | 6.16 [4.00, 9.49] |
| 10 Withdrawal due to lack of treatment efficacy (No. of patients) Show forest plot | 4 | 676 | Peto Odds Ratio (Peto, Fixed, 95% CI) | 0.12 [0.09, 0.17] |
| Analysis 11.10  Comparison 11 FP versus placebo: Parallel group studies, no oral steroids: 500 mcg/d (all delivery devices), Outcome 10 Withdrawal due to lack of treatment efficacy (No. of patients). | ||||
| 10.1 MDI | 1 | 147 | Peto Odds Ratio (Peto, Fixed, 95% CI) | 0.11 [0.06, 0.21] |
| 10.2 DPI | 3 | 529 | Peto Odds Ratio (Peto, Fixed, 95% CI) | 0.13 [0.09, 0.18] |
| 11 Sore throat or pharyngitis (No. of patients) Show forest plot | 4 | 670 | Peto Odds Ratio (Peto, Fixed, 95% CI) | 4.49 [1.11, 18.13] |
| Analysis 11.11  Comparison 11 FP versus placebo: Parallel group studies, no oral steroids: 500 mcg/d (all delivery devices), Outcome 11 Sore throat or pharyngitis (No. of patients). | ||||
| 11.1 MDI | 1 | 147 | Peto Odds Ratio (Peto, Fixed, 95% CI) | 0.0 [0.0, 0.0] |
| 11.2 DPI | 3 | 523 | Peto Odds Ratio (Peto, Fixed, 95% CI) | 4.49 [1.11, 18.13] |
| 12 Hoarseness or dysphonia (No. of patients) Show forest plot | 4 | 670 | Peto Odds Ratio (Peto, Fixed, 95% CI) | 7.36 [2.65, 20.46] |
| Analysis 11.12  Comparison 11 FP versus placebo: Parallel group studies, no oral steroids: 500 mcg/d (all delivery devices), Outcome 12 Hoarseness or dysphonia (No. of patients). | ||||
| 12.1 MDI | 1 | 147 | Peto Odds Ratio (Peto, Fixed, 95% CI) | 7.93 [0.81, 77.43] |
| 12.2 DPI | 3 | 523 | Peto Odds Ratio (Peto, Fixed, 95% CI) | 7.23 [2.30, 22.68] |
| 13 Oral Candidiasis (No. of patients) Show forest plot | 5 | 841 | Peto Odds Ratio (Peto, Fixed, 95% CI) | 6.37 [2.62, 15.48] |
| Analysis 11.13  Comparison 11 FP versus placebo: Parallel group studies, no oral steroids: 500 mcg/d (all delivery devices), Outcome 13 Oral Candidiasis (No. of patients). | ||||
| 13.1 MDI | 1 | 147 | Peto Odds Ratio (Peto, Fixed, 95% CI) | 7.93 [0.81, 77.43] |
| 13.2 DPI | 4 | 694 | Peto Odds Ratio (Peto, Fixed, 95% CI) | 6.12 [2.33, 16.07] |
| Outcome or subgroup title | No. of studies | No. of participants | Statistical method | Effect size |
| 1 Change in FEV1 compared to baseline (litres) Show forest plot | 6 | 872 | Mean Difference (IV, Fixed, 95% CI) | 0.44 [0.39, 0.50] |
| Analysis 12.1  Comparison 12 FP versus placebo: Parallel group studies, no oral steroids: 500 mcg/d (all degrees asthma severity), Outcome 1 Change in FEV1 compared to baseline (litres). | ||||
| 1.1 Mild | 1 | 26 | Mean Difference (IV, Fixed, 95% CI) | 0.46 [0.29, 0.63] |
| 1.2 Mild to moderate | 0 | 0 | Mean Difference (IV, Fixed, 95% CI) | 0.0 [0.0, 0.0] |
| 1.3 Moderate | 5 | 846 | Mean Difference (IV, Fixed, 95% CI) | 0.44 [0.38, 0.50] |
| 2 Change in morning PEFR compared with baseline Show forest plot | 8 | 1116 | Litres/min (Fixed, 95% CI) | 40.44 [35.43, 45.45] |
| Analysis 12.2  Comparison 12 FP versus placebo: Parallel group studies, no oral steroids: 500 mcg/d (all degrees asthma severity), Outcome 2 Change in morning PEFR compared with baseline. | ||||
| 2.1 Mild | 2 | 63 | Litres/min (Fixed, 95% CI) | 32.91 [12.00, 53.81] |
| 2.2 Mild to moderate | 0 | 0 | Litres/min (Fixed, 95% CI) | 0.0 [0.0, 0.0] |
| 2.3 Moderate | 6 | 1053 | Litres/min (Fixed, 95% CI) | 40.90 [35.74, 46.06] |
| 3 Change in evening PEF compared with baseline (L/min) Show forest plot | 3 | 354 | Mean Difference (IV, Fixed, 95% CI) | 28.96 [20.86, 37.06] |
| Analysis 12.3  Comparison 12 FP versus placebo: Parallel group studies, no oral steroids: 500 mcg/d (all degrees asthma severity), Outcome 3 Change in evening PEF compared with baseline (L/min). | ||||
| 3.1 Mild | 1 | 23 | Mean Difference (IV, Fixed, 95% CI) | 8.3 [‐12.40, 29.00] |
| 3.2 Mild to moderate | 0 | 0 | Mean Difference (IV, Fixed, 95% CI) | 0.0 [0.0, 0.0] |
| 3.3 Moderate | 2 | 331 | Mean Difference (IV, Fixed, 95% CI) | 32.69 [23.90, 41.49] |
| 4 Change in daily use of beta2 agonist compared to baseline (puffs/d) Show forest plot | 4 | 682 | Mean Difference (IV, Fixed, 95% CI) | ‐2.22 [‐2.59, ‐1.84] |
| Analysis 12.4  Comparison 12 FP versus placebo: Parallel group studies, no oral steroids: 500 mcg/d (all degrees asthma severity), Outcome 4 Change in daily use of beta2 agonist compared to baseline (puffs/d). | ||||
| 4.1 Mild | 0 | 0 | Mean Difference (IV, Fixed, 95% CI) | 0.0 [0.0, 0.0] |
| 4.2 Mild to moderate | 0 | 0 | Mean Difference (IV, Fixed, 95% CI) | 0.0 [0.0, 0.0] |
| 4.3 Moderate | 4 | 682 | Mean Difference (IV, Fixed, 95% CI) | ‐2.22 [‐2.59, ‐1.84] |
| 5 Change in night‐time wakening score Show forest plot | 2 | 351 | Std. Mean Difference (IV, Fixed, 95% CI) | ‐0.74 [‐0.96, ‐0.52] |
| Analysis 12.5  Comparison 12 FP versus placebo: Parallel group studies, no oral steroids: 500 mcg/d (all degrees asthma severity), Outcome 5 Change in night‐time wakening score. | ||||
| 5.1 Mild | 0 | 0 | Std. Mean Difference (IV, Fixed, 95% CI) | 0.0 [0.0, 0.0] |
| 5.2 Mild to moderate | 0 | 0 | Std. Mean Difference (IV, Fixed, 95% CI) | 0.0 [0.0, 0.0] |
| 5.3 Moderate | 2 | 351 | Std. Mean Difference (IV, Fixed, 95% CI) | ‐0.74 [‐0.96, ‐0.52] |
| 6 Change in daily asthma symptom score compared to baseline Show forest plot | 4 | 685 | Std. Mean Difference (IV, Fixed, 95% CI) | ‐0.85 [‐1.01, ‐0.70] |
| Analysis 12.6  Comparison 12 FP versus placebo: Parallel group studies, no oral steroids: 500 mcg/d (all degrees asthma severity), Outcome 6 Change in daily asthma symptom score compared to baseline. | ||||
| 6.1 Mild | 0 | 0 | Std. Mean Difference (IV, Fixed, 95% CI) | 0.0 [0.0, 0.0] |
| 6.2 Mild to moderate | 0 | 0 | Std. Mean Difference (IV, Fixed, 95% CI) | 0.0 [0.0, 0.0] |
| 6.3 Moderate | 4 | 685 | Std. Mean Difference (IV, Fixed, 95% CI) | ‐0.85 [‐1.01, ‐0.70] |
| 7 Physician rated global efficacy: effective or very effective (No. of patients) Show forest plot | 3 | 480 | Peto Odds Ratio (Peto, Fixed, 95% CI) | 5.86 [4.09, 8.39] |
| Analysis 12.7  Comparison 12 FP versus placebo: Parallel group studies, no oral steroids: 500 mcg/d (all degrees asthma severity), Outcome 7 Physician rated global efficacy: effective or very effective (No. of patients). | ||||
| 7.1 Mild | 0 | 0 | Peto Odds Ratio (Peto, Fixed, 95% CI) | 0.0 [0.0, 0.0] |
| 7.2 Mild to moderate | 0 | 0 | Peto Odds Ratio (Peto, Fixed, 95% CI) | 0.0 [0.0, 0.0] |
| 7.3 Moderate | 3 | 480 | Peto Odds Ratio (Peto, Fixed, 95% CI) | 5.86 [4.09, 8.39] |
| 8 Withdrawal due to lack of treatment efficacy (No. of patients) Show forest plot | 3 | 506 | Peto Odds Ratio (Peto, Fixed, 95% CI) | 0.12 [0.09, 0.18] |
| Analysis 12.8  Comparison 12 FP versus placebo: Parallel group studies, no oral steroids: 500 mcg/d (all degrees asthma severity), Outcome 8 Withdrawal due to lack of treatment efficacy (No. of patients). | ||||
| 8.1 Mild | 0 | 0 | Peto Odds Ratio (Peto, Fixed, 95% CI) | 0.0 [0.0, 0.0] |
| 8.2 Mild to moderate | 0 | 0 | Peto Odds Ratio (Peto, Fixed, 95% CI) | 0.0 [0.0, 0.0] |
| 8.3 Moderate | 3 | 506 | Peto Odds Ratio (Peto, Fixed, 95% CI) | 0.12 [0.09, 0.18] |
| 9 Sore throat or pharyngitis (No. of patients) Show forest plot | 4 | 670 | Peto Odds Ratio (Peto, Fixed, 95% CI) | 4.49 [1.11, 18.13] |
| Analysis 12.9  Comparison 12 FP versus placebo: Parallel group studies, no oral steroids: 500 mcg/d (all degrees asthma severity), Outcome 9 Sore throat or pharyngitis (No. of patients). | ||||
| 9.1 Mild | 0 | 0 | Peto Odds Ratio (Peto, Fixed, 95% CI) | 0.0 [0.0, 0.0] |
| 9.2 Mild to moderate | 0 | 0 | Peto Odds Ratio (Peto, Fixed, 95% CI) | 0.0 [0.0, 0.0] |
| 9.3 Moderate | 4 | 670 | Peto Odds Ratio (Peto, Fixed, 95% CI) | 4.49 [1.11, 18.13] |
| 10 Hoarseness or dysphonia (No. of patients) Show forest plot | 4 | 670 | Peto Odds Ratio (Peto, Fixed, 95% CI) | 7.36 [2.65, 20.46] |
| Analysis 12.10  Comparison 12 FP versus placebo: Parallel group studies, no oral steroids: 500 mcg/d (all degrees asthma severity), Outcome 10 Hoarseness or dysphonia (No. of patients). | ||||
| 10.1 Mild | 0 | 0 | Peto Odds Ratio (Peto, Fixed, 95% CI) | 0.0 [0.0, 0.0] |
| 10.2 Mild to moderate | 0 | 0 | Peto Odds Ratio (Peto, Fixed, 95% CI) | 0.0 [0.0, 0.0] |
| 10.3 Moderate | 4 | 670 | Peto Odds Ratio (Peto, Fixed, 95% CI) | 7.36 [2.65, 20.46] |
| 11 Oral Candidiasis (No. of patients) Show forest plot | 5 | 841 | Peto Odds Ratio (Peto, Fixed, 95% CI) | 6.37 [2.62, 15.48] |
| Analysis 12.11  Comparison 12 FP versus placebo: Parallel group studies, no oral steroids: 500 mcg/d (all degrees asthma severity), Outcome 11 Oral Candidiasis (No. of patients). | ||||
| 11.1 Mild | 0 | 0 | Peto Odds Ratio (Peto, Fixed, 95% CI) | 0.0 [0.0, 0.0] |
| 11.2 Mild to moderate | 0 | 0 | Peto Odds Ratio (Peto, Fixed, 95% CI) | 0.0 [0.0, 0.0] |
| 11.3 Moderate | 5 | 841 | Peto Odds Ratio (Peto, Fixed, 95% CI) | 6.37 [2.62, 15.48] |
| Outcome or subgroup title | No. of studies | No. of participants | Statistical method | Effect size |
| 1 FEV1 (litres) Show forest plot | 3 | 73 | Mean Difference (IV, Fixed, 95% CI) | 0.13 [‐0.22, 0.48] |
| Analysis 13.1  Comparison 13 FP versus placebo: Parallel group studies, no oral steroids: 1000‐1500 mcg/d (all ages), Outcome 1 FEV1 (litres). | ||||
| 1.1 Children | 0 | 0 | Mean Difference (IV, Fixed, 95% CI) | 0.0 [0.0, 0.0] |
| 1.2 Adults | 3 | 73 | Mean Difference (IV, Fixed, 95% CI) | 0.13 [‐0.22, 0.48] |
| 2 Change in FEV1 compared to baseline (litres) Show forest plot | 3 | 414 | Mean Difference (IV, Fixed, 95% CI) | 0.53 [0.43, 0.63] |
| Analysis 13.2  Comparison 13 FP versus placebo: Parallel group studies, no oral steroids: 1000‐1500 mcg/d (all ages), Outcome 2 Change in FEV1 compared to baseline (litres). | ||||
| 2.1 Children | 0 | 0 | Mean Difference (IV, Fixed, 95% CI) | 0.0 [0.0, 0.0] |
| 2.2 Adults | 3 | 414 | Mean Difference (IV, Fixed, 95% CI) | 0.53 [0.43, 0.63] |
| 3 Change in FVC compared to baseline (litres) Show forest plot | 1 | Mean Difference (IV, Fixed, 95% CI) | Totals not selected | |
| Analysis 13.3  Comparison 13 FP versus placebo: Parallel group studies, no oral steroids: 1000‐1500 mcg/d (all ages), Outcome 3 Change in FVC compared to baseline (litres). | ||||
| 3.1 Children | 0 | Mean Difference (IV, Fixed, 95% CI) | 0.0 [0.0, 0.0] | |
| 3.2 Adults | 1 | Mean Difference (IV, Fixed, 95% CI) | 0.0 [0.0, 0.0] | |
| 4 Change in FEF25‐75 compared to baseline (L/second) Show forest plot | 1 | Mean Difference (IV, Fixed, 95% CI) | Totals not selected | |
| Analysis 13.4  Comparison 13 FP versus placebo: Parallel group studies, no oral steroids: 1000‐1500 mcg/d (all ages), Outcome 4 Change in FEF25‐75 compared to baseline (L/second). | ||||
| 4.1 Children | 0 | Mean Difference (IV, Fixed, 95% CI) | 0.0 [0.0, 0.0] | |
| 4.2 Adults | 1 | Mean Difference (IV, Fixed, 95% CI) | 0.0 [0.0, 0.0] | |
| 5 Change in morning PEFR compared to baseline (L/min) Show forest plot | 4 | 624 | Mean Difference (IV, Fixed, 95% CI) | 46.85 [39.64, 54.07] |
| Analysis 13.5  Comparison 13 FP versus placebo: Parallel group studies, no oral steroids: 1000‐1500 mcg/d (all ages), Outcome 5 Change in morning PEFR compared to baseline (L/min). | ||||
| 5.1 Children | 0 | 0 | Mean Difference (IV, Fixed, 95% CI) | 0.0 [0.0, 0.0] |
| 5.2 Adults | 4 | 624 | Mean Difference (IV, Fixed, 95% CI) | 46.85 [39.64, 54.07] |
| 6 Change in evening PEFR compared to baseline (L/min) Show forest plot | 2 | 278 | Mean Difference (IV, Fixed, 95% CI) | 41.12 [31.36, 50.87] |
| Analysis 13.6  Comparison 13 FP versus placebo: Parallel group studies, no oral steroids: 1000‐1500 mcg/d (all ages), Outcome 6 Change in evening PEFR compared to baseline (L/min). | ||||
| 6.1 Children | 0 | 0 | Mean Difference (IV, Fixed, 95% CI) | 0.0 [0.0, 0.0] |
| 6.2 Adults | 2 | 278 | Mean Difference (IV, Fixed, 95% CI) | 41.12 [31.36, 50.87] |
| 7 Change in daily asthma symptom score compared to baseline Show forest plot | 3 | 412 | Std. Mean Difference (IV, Fixed, 95% CI) | ‐0.65 [‐0.85, ‐0.46] |
| Analysis 13.7  Comparison 13 FP versus placebo: Parallel group studies, no oral steroids: 1000‐1500 mcg/d (all ages), Outcome 7 Change in daily asthma symptom score compared to baseline. | ||||
| 7.1 Children | 0 | 0 | Std. Mean Difference (IV, Fixed, 95% CI) | 0.0 [0.0, 0.0] |
| 7.2 Adults | 3 | 412 | Std. Mean Difference (IV, Fixed, 95% CI) | ‐0.65 [‐0.85, ‐0.46] |
| 8 Change in number of night‐time awakenings per week compared to baseline Show forest plot | 2 | 277 | Mean Difference (IV, Fixed, 95% CI) | ‐0.18 [‐0.25, ‐0.11] |
| Analysis 13.8  Comparison 13 FP versus placebo: Parallel group studies, no oral steroids: 1000‐1500 mcg/d (all ages), Outcome 8 Change in number of night‐time awakenings per week compared to baseline. | ||||
| 8.1 Children | 0 | 0 | Mean Difference (IV, Fixed, 95% CI) | 0.0 [0.0, 0.0] |
| 8.2 Adults | 2 | 277 | Mean Difference (IV, Fixed, 95% CI) | ‐0.18 [‐0.25, ‐0.11] |
| 9 Change in daily use of beta2 agonist compared to baseline (puffs/d) Show forest plot | 3 | 409 | Mean Difference (IV, Fixed, 95% CI) | ‐1.37 [‐1.79, ‐0.96] |
| Analysis 13.9  Comparison 13 FP versus placebo: Parallel group studies, no oral steroids: 1000‐1500 mcg/d (all ages), Outcome 9 Change in daily use of beta2 agonist compared to baseline (puffs/d). | ||||
| 9.1 Children | 0 | 0 | Mean Difference (IV, Fixed, 95% CI) | 0.0 [0.0, 0.0] |
| 9.2 Adults | 3 | 409 | Mean Difference (IV, Fixed, 95% CI) | ‐1.37 [‐1.79, ‐0.96] |
| 10 Methacholine BHR (log base 2 PC20 FEV1 mg/ml) Show forest plot | 1 | Mean Difference (IV, Fixed, 95% CI) | Totals not selected | |
| Analysis 13.10  Comparison 13 FP versus placebo: Parallel group studies, no oral steroids: 1000‐1500 mcg/d (all ages), Outcome 10 Methacholine BHR (log base 2 PC20 FEV1 mg/ml). | ||||
| 10.1 Children | 0 | Mean Difference (IV, Fixed, 95% CI) | 0.0 [0.0, 0.0] | |
| 10.2 Adults | 1 | Mean Difference (IV, Fixed, 95% CI) | 0.0 [0.0, 0.0] | |
| 11 Physician‐rated efficacy: effective or very effective (No. of patients) Show forest plot | 2 | 311 | Peto Odds Ratio (Peto, Fixed, 95% CI) | 9.62 [6.18, 14.99] |
| Analysis 13.11  Comparison 13 FP versus placebo: Parallel group studies, no oral steroids: 1000‐1500 mcg/d (all ages), Outcome 11 Physician‐rated efficacy: effective or very effective (No. of patients). | ||||
| 11.1 Children | 0 | 0 | Peto Odds Ratio (Peto, Fixed, 95% CI) | 0.0 [0.0, 0.0] |
| 11.2 Adults | 2 | 311 | Peto Odds Ratio (Peto, Fixed, 95% CI) | 9.62 [6.18, 14.99] |
| 12 Morning plasma cortisol (mcg/dL) Show forest plot | 1 | Mean Difference (IV, Fixed, 95% CI) | Totals not selected | |
| Analysis 13.12  Comparison 13 FP versus placebo: Parallel group studies, no oral steroids: 1000‐1500 mcg/d (all ages), Outcome 12 Morning plasma cortisol (mcg/dL). | ||||
| 12.1 Children | 0 | Mean Difference (IV, Fixed, 95% CI) | 0.0 [0.0, 0.0] | |
| 12.2 Adults | 1 | Mean Difference (IV, Fixed, 95% CI) | 0.0 [0.0, 0.0] | |
| 13 Change in morning plasma cortisol compared to baseline (mcg/dL) Show forest plot | 1 | Mean Difference (IV, Fixed, 95% CI) | Totals not selected | |
| Analysis 13.13  Comparison 13 FP versus placebo: Parallel group studies, no oral steroids: 1000‐1500 mcg/d (all ages), Outcome 13 Change in morning plasma cortisol compared to baseline (mcg/dL). | ||||
| 13.1 Children | 0 | Mean Difference (IV, Fixed, 95% CI) | 0.0 [0.0, 0.0] | |
| 13.2 Adults | 1 | Mean Difference (IV, Fixed, 95% CI) | 0.0 [0.0, 0.0] | |
| 14 8 hour area under curve (AUC) plasma cortisol during 6 hour 250 mcg co‐syntropin infusion (mcg hour/dL) Show forest plot | 1 | Mean Difference (IV, Fixed, 95% CI) | Totals not selected | |
| Analysis 13.14  Comparison 13 FP versus placebo: Parallel group studies, no oral steroids: 1000‐1500 mcg/d (all ages), Outcome 14 8 hour area under curve (AUC) plasma cortisol during 6 hour 250 mcg co‐syntropin infusion (mcg hour/dL). | ||||
| 14.1 Children | 0 | Mean Difference (IV, Fixed, 95% CI) | 0.0 [0.0, 0.0] | |
| 14.2 Adults | 1 | Mean Difference (IV, Fixed, 95% CI) | 0.0 [0.0, 0.0] | |
| 15 Peak plasma cortisol during during 6 hour 250 mcg co‐syntropin infusion (mcg/dL) Show forest plot | 1 | Mean Difference (IV, Fixed, 95% CI) | Totals not selected | |
| Analysis 13.15  Comparison 13 FP versus placebo: Parallel group studies, no oral steroids: 1000‐1500 mcg/d (all ages), Outcome 15 Peak plasma cortisol during during 6 hour 250 mcg co‐syntropin infusion (mcg/dL). | ||||
| 15.1 Children | 0 | Mean Difference (IV, Fixed, 95% CI) | 0.0 [0.0, 0.0] | |
| 15.2 Adults | 1 | Mean Difference (IV, Fixed, 95% CI) | 0.0 [0.0, 0.0] | |
| 16 Withdrawal due to clinical asthma exacerbation (No. of patients) Show forest plot | 1 | Peto Odds Ratio (Peto, Fixed, 95% CI) | Totals not selected | |
| Analysis 13.16  Comparison 13 FP versus placebo: Parallel group studies, no oral steroids: 1000‐1500 mcg/d (all ages), Outcome 16 Withdrawal due to clinical asthma exacerbation (No. of patients). | ||||
| 16.1 Children | 0 | Peto Odds Ratio (Peto, Fixed, 95% CI) | 0.0 [0.0, 0.0] | |
| 16.2 Adults | 1 | Peto Odds Ratio (Peto, Fixed, 95% CI) | 0.0 [0.0, 0.0] | |
| 17 Withdrawal due to lack of treatment efficacy (No. of patients) Show forest plot | 5 | 671 | Peto Odds Ratio (Peto, Fixed, 95% CI) | 0.11 [0.08, 0.15] |
| Analysis 13.17  Comparison 13 FP versus placebo: Parallel group studies, no oral steroids: 1000‐1500 mcg/d (all ages), Outcome 17 Withdrawal due to lack of treatment efficacy (No. of patients). | ||||
| 17.1 Children | 0 | 0 | Peto Odds Ratio (Peto, Fixed, 95% CI) | 0.0 [0.0, 0.0] |
| 17.2 Adults | 5 | 671 | Peto Odds Ratio (Peto, Fixed, 95% CI) | 0.11 [0.08, 0.15] |
| 18 Sore throat or pharyngitis (No. of patients) Show forest plot | 4 | 524 | Peto Odds Ratio (Peto, Fixed, 95% CI) | 4.95 [1.83, 13.43] |
| Analysis 13.18  Comparison 13 FP versus placebo: Parallel group studies, no oral steroids: 1000‐1500 mcg/d (all ages), Outcome 18 Sore throat or pharyngitis (No. of patients). | ||||
| 18.1 Children | 0 | 0 | Peto Odds Ratio (Peto, Fixed, 95% CI) | 0.0 [0.0, 0.0] |
| 18.2 Adults | 4 | 524 | Peto Odds Ratio (Peto, Fixed, 95% CI) | 4.95 [1.83, 13.43] |
| 19 Hoarseness or dysphonia (No. of patients) Show forest plot | 6 | 770 | Peto Odds Ratio (Peto, Fixed, 95% CI) | 7.99 [3.54, 18.01] |
| Analysis 13.19  Comparison 13 FP versus placebo: Parallel group studies, no oral steroids: 1000‐1500 mcg/d (all ages), Outcome 19 Hoarseness or dysphonia (No. of patients). | ||||
| 19.1 Children | 0 | 0 | Peto Odds Ratio (Peto, Fixed, 95% CI) | 0.0 [0.0, 0.0] |
| 19.2 Adults | 6 | 770 | Peto Odds Ratio (Peto, Fixed, 95% CI) | 7.99 [3.54, 18.01] |
| 20 Oral Candidiasis (No. of patients) Show forest plot | 6 | 770 | Peto Odds Ratio (Peto, Fixed, 95% CI) | 4.77 [2.32, 9.80] |
| Analysis 13.20  Comparison 13 FP versus placebo: Parallel group studies, no oral steroids: 1000‐1500 mcg/d (all ages), Outcome 20 Oral Candidiasis (No. of patients). | ||||
| 20.1 Children | 0 | 0 | Peto Odds Ratio (Peto, Fixed, 95% CI) | 0.0 [0.0, 0.0] |
| 20.2 Adults | 6 | 770 | Peto Odds Ratio (Peto, Fixed, 95% CI) | 4.77 [2.32, 9.80] |
| 21 HRQOL: AQLQ Show forest plot | 1 | Mean Difference (IV, Fixed, 95% CI) | Totals not selected | |
| Analysis 13.21  Comparison 13 FP versus placebo: Parallel group studies, no oral steroids: 1000‐1500 mcg/d (all ages), Outcome 21 HRQOL: AQLQ. | ||||
| 21.1 Children | 0 | Mean Difference (IV, Fixed, 95% CI) | 0.0 [0.0, 0.0] | |
| 21.2 Adults | 1 | Mean Difference (IV, Fixed, 95% CI) | 0.0 [0.0, 0.0] | |
| 22 Log PD20 mg Show forest plot | 1 | Mean Difference (IV, Fixed, 95% CI) | Totals not selected | |
| Analysis 13.22  Comparison 13 FP versus placebo: Parallel group studies, no oral steroids: 1000‐1500 mcg/d (all ages), Outcome 22 Log PD20 mg. | ||||
| 22.1 Children | 0 | Mean Difference (IV, Fixed, 95% CI) | 0.0 [0.0, 0.0] | |
| 22.2 Adults | 1 | Mean Difference (IV, Fixed, 95% CI) | 0.0 [0.0, 0.0] | |
| 23 FVC (absolute values ‐ Litres) Show forest plot | 1 | Mean Difference (IV, Fixed, 95% CI) | Totals not selected | |
| Analysis 13.23  Comparison 13 FP versus placebo: Parallel group studies, no oral steroids: 1000‐1500 mcg/d (all ages), Outcome 23 FVC (absolute values ‐ Litres). | ||||
| 23.1 Children | 0 | Mean Difference (IV, Fixed, 95% CI) | 0.0 [0.0, 0.0] | |
| 23.2 Adults | 1 | Mean Difference (IV, Fixed, 95% CI) | 0.0 [0.0, 0.0] | |
| 24 Withdrawals (any reason) Show forest plot | 2 | 130 | Odds Ratio (M‐H, Fixed, 95% CI) | 1.91 [0.91, 4.00] |
| Analysis 13.24  Comparison 13 FP versus placebo: Parallel group studies, no oral steroids: 1000‐1500 mcg/d (all ages), Outcome 24 Withdrawals (any reason). | ||||
| 24.1 Children | 0 | 0 | Odds Ratio (M‐H, Fixed, 95% CI) | 0.0 [0.0, 0.0] |
| 24.2 Adults | 2 | 130 | Odds Ratio (M‐H, Fixed, 95% CI) | 1.91 [0.91, 4.00] |
| Outcome or subgroup title | No. of studies | No. of participants | Statistical method | Effect size |
| 1 FEV1 (litres) Show forest plot | 3 | 73 | Mean Difference (IV, Fixed, 95% CI) | 0.13 [‐0.22, 0.48] |
| Analysis 14.1  Comparison 14 FP versus placebo: Parallel group studies, no oral steroids: 1000‐1500 mcg/d (all treatment durations), Outcome 1 FEV1 (litres). | ||||
| 1.1 1‐4 weeks | 2 | 42 | Mean Difference (IV, Fixed, 95% CI) | ‐0.12 [‐0.54, 0.30] |
| 1.2 1‐5 months | 1 | 31 | Mean Difference (IV, Fixed, 95% CI) | 0.66 [0.04, 1.28] |
| 1.3 6 months or longer | 0 | 0 | Mean Difference (IV, Fixed, 95% CI) | 0.0 [0.0, 0.0] |
| 2 Change in FEV1 compared to baseline (litres) Show forest plot | 3 | 414 | Mean Difference (IV, Fixed, 95% CI) | 0.53 [0.43, 0.63] |
| Analysis 14.2  Comparison 14 FP versus placebo: Parallel group studies, no oral steroids: 1000‐1500 mcg/d (all treatment durations), Outcome 2 Change in FEV1 compared to baseline (litres). | ||||
| 2.1 1‐4 weeks | 0 | 0 | Mean Difference (IV, Fixed, 95% CI) | 0.0 [0.0, 0.0] |
| 2.2 1‐5 months | 3 | 414 | Mean Difference (IV, Fixed, 95% CI) | 0.53 [0.43, 0.63] |
| 2.3 6 months or longer | 0 | 0 | Mean Difference (IV, Fixed, 95% CI) | 0.0 [0.0, 0.0] |
| 5 Change in morning PEFR compared to baseline (L/min) Show forest plot | 4 | 624 | Mean Difference (IV, Fixed, 95% CI) | 46.85 [39.64, 54.07] |
| Analysis 14.5  Comparison 14 FP versus placebo: Parallel group studies, no oral steroids: 1000‐1500 mcg/d (all treatment durations), Outcome 5 Change in morning PEFR compared to baseline (L/min). | ||||
| 5.1 1‐4 weeks | 0 | 0 | Mean Difference (IV, Fixed, 95% CI) | 0.0 [0.0, 0.0] |
| 5.2 1‐5 months | 4 | 624 | Mean Difference (IV, Fixed, 95% CI) | 46.85 [39.64, 54.07] |
| 5.3 6 months or longer | 0 | 0 | Mean Difference (IV, Fixed, 95% CI) | 0.0 [0.0, 0.0] |
| 6 Change in evening PEFR compared to baseline (L/min) Show forest plot | 2 | 278 | Mean Difference (IV, Fixed, 95% CI) | 41.12 [31.36, 50.87] |
| Analysis 14.6  Comparison 14 FP versus placebo: Parallel group studies, no oral steroids: 1000‐1500 mcg/d (all treatment durations), Outcome 6 Change in evening PEFR compared to baseline (L/min). | ||||
| 6.1 1‐4 weeks | 0 | 0 | Mean Difference (IV, Fixed, 95% CI) | 0.0 [0.0, 0.0] |
| 6.2 1‐5 months | 2 | 278 | Mean Difference (IV, Fixed, 95% CI) | 41.12 [31.36, 50.87] |
| 6.3 6 months or longer | 0 | 0 | Mean Difference (IV, Fixed, 95% CI) | 0.0 [0.0, 0.0] |
| 7 Change in daily asthma symptom score compared to baseline Show forest plot | 3 | 412 | Std. Mean Difference (IV, Fixed, 95% CI) | ‐0.65 [‐0.85, ‐0.46] |
| Analysis 14.7  Comparison 14 FP versus placebo: Parallel group studies, no oral steroids: 1000‐1500 mcg/d (all treatment durations), Outcome 7 Change in daily asthma symptom score compared to baseline. | ||||
| 7.1 1‐4 weeks | 0 | 0 | Std. Mean Difference (IV, Fixed, 95% CI) | 0.0 [0.0, 0.0] |
| 7.2 1‐5 months | 3 | 412 | Std. Mean Difference (IV, Fixed, 95% CI) | ‐0.65 [‐0.85, ‐0.46] |
| 7.3 6 months or longer | 0 | 0 | Std. Mean Difference (IV, Fixed, 95% CI) | 0.0 [0.0, 0.0] |
| 8 Change in number of night‐time awakening per week compared to baseline score Show forest plot | 2 | 277 | Std. Mean Difference (IV, Fixed, 95% CI) | ‐0.60 [‐0.85, ‐0.36] |
| Analysis 14.8  Comparison 14 FP versus placebo: Parallel group studies, no oral steroids: 1000‐1500 mcg/d (all treatment durations), Outcome 8 Change in number of night‐time awakening per week compared to baseline score. | ||||
| 8.1 1‐4 weeks | 0 | 0 | Std. Mean Difference (IV, Fixed, 95% CI) | 0.0 [0.0, 0.0] |
| 8.2 1‐5 months | 2 | 277 | Std. Mean Difference (IV, Fixed, 95% CI) | ‐0.60 [‐0.85, ‐0.36] |
| 8.3 6 months or longer | 0 | 0 | Std. Mean Difference (IV, Fixed, 95% CI) | 0.0 [0.0, 0.0] |
| 9 Change in daily use of beta2 agonist compared to baseline (puffs/d) Show forest plot | 3 | 409 | Mean Difference (IV, Fixed, 95% CI) | ‐1.37 [‐1.79, ‐0.96] |
| Analysis 14.9  Comparison 14 FP versus placebo: Parallel group studies, no oral steroids: 1000‐1500 mcg/d (all treatment durations), Outcome 9 Change in daily use of beta2 agonist compared to baseline (puffs/d). | ||||
| 9.1 1‐4 weeks | 0 | 0 | Mean Difference (IV, Fixed, 95% CI) | 0.0 [0.0, 0.0] |
| 9.2 1‐5 months | 3 | 409 | Mean Difference (IV, Fixed, 95% CI) | ‐1.37 [‐1.79, ‐0.96] |
| 9.3 6 months or longer | 0 | 0 | Mean Difference (IV, Fixed, 95% CI) | 0.0 [0.0, 0.0] |
| 11 Physician‐rated efficacy: effective or very effective (No. of patients) Show forest plot | 2 | 311 | Peto Odds Ratio (Peto, Fixed, 95% CI) | 9.62 [6.18, 14.99] |
| Analysis 14.11  Comparison 14 FP versus placebo: Parallel group studies, no oral steroids: 1000‐1500 mcg/d (all treatment durations), Outcome 11 Physician‐rated efficacy: effective or very effective (No. of patients). | ||||
| 11.1 1‐4 weeks | 0 | 0 | Peto Odds Ratio (Peto, Fixed, 95% CI) | 0.0 [0.0, 0.0] |
| 11.2 1‐5 months | 2 | 311 | Peto Odds Ratio (Peto, Fixed, 95% CI) | 9.62 [6.18, 14.99] |
| 11.3 6 months or longer | 0 | 0 | Peto Odds Ratio (Peto, Fixed, 95% CI) | 0.0 [0.0, 0.0] |
| 17 Withdrawal due to lack of treatment efficacy (No.of patients) Show forest plot | 4 | 566 | Peto Odds Ratio (Peto, Fixed, 95% CI) | 0.11 [0.07, 0.15] |
| Analysis 14.17  Comparison 14 FP versus placebo: Parallel group studies, no oral steroids: 1000‐1500 mcg/d (all treatment durations), Outcome 17 Withdrawal due to lack of treatment efficacy (No.of patients). | ||||
| 17.1 1‐4 weeks | 0 | 0 | Peto Odds Ratio (Peto, Fixed, 95% CI) | 0.0 [0.0, 0.0] |
| 17.2 1‐5 months | 4 | 566 | Peto Odds Ratio (Peto, Fixed, 95% CI) | 0.11 [0.07, 0.15] |
| 17.3 6 months or longer | 0 | 0 | Peto Odds Ratio (Peto, Fixed, 95% CI) | 0.0 [0.0, 0.0] |
| 18 Sore throat or pharyngitis (No. of patients) Show forest plot | 3 | 419 | Peto Odds Ratio (Peto, Fixed, 95% CI) | 5.65 [1.70, 18.79] |
| Analysis 14.18  Comparison 14 FP versus placebo: Parallel group studies, no oral steroids: 1000‐1500 mcg/d (all treatment durations), Outcome 18 Sore throat or pharyngitis (No. of patients). | ||||
| 18.1 1‐4 weeks | 0 | 0 | Peto Odds Ratio (Peto, Fixed, 95% CI) | 0.0 [0.0, 0.0] |
| 18.2 1‐5 months | 3 | 419 | Peto Odds Ratio (Peto, Fixed, 95% CI) | 5.65 [1.70, 18.79] |
| 18.3 6 months or longer | 0 | 0 | Peto Odds Ratio (Peto, Fixed, 95% CI) | 0.0 [0.0, 0.0] |
| 19 Hoarseness or dysphonia (No. of patients) Show forest plot | 5 | 665 | Peto Odds Ratio (Peto, Fixed, 95% CI) | 7.92 [3.25, 19.30] |
| Analysis 14.19  Comparison 14 FP versus placebo: Parallel group studies, no oral steroids: 1000‐1500 mcg/d (all treatment durations), Outcome 19 Hoarseness or dysphonia (No. of patients). | ||||
| 19.1 1‐4 weeks | 0 | 0 | Peto Odds Ratio (Peto, Fixed, 95% CI) | 0.0 [0.0, 0.0] |
| 19.2 1‐5 months | 5 | 665 | Peto Odds Ratio (Peto, Fixed, 95% CI) | 7.92 [3.25, 19.30] |
| 19.3 6 months or longer | 0 | 0 | Peto Odds Ratio (Peto, Fixed, 95% CI) | 0.0 [0.0, 0.0] |
| 20 Oral Candidiasis (No. of patients) Show forest plot | 6 | 770 | Peto Odds Ratio (Peto, Fixed, 95% CI) | 4.77 [2.32, 9.80] |
| Analysis 14.20  Comparison 14 FP versus placebo: Parallel group studies, no oral steroids: 1000‐1500 mcg/d (all treatment durations), Outcome 20 Oral Candidiasis (No. of patients). | ||||
| 20.1 1‐4 weeks | 0 | 0 | Peto Odds Ratio (Peto, Fixed, 95% CI) | 0.0 [0.0, 0.0] |
| 20.2 1‐5 months | 5 | 665 | Peto Odds Ratio (Peto, Fixed, 95% CI) | 3.99 [1.76, 9.03] |
| 20.3 6 months or longer | 1 | 105 | Peto Odds Ratio (Peto, Fixed, 95% CI) | 8.89 [1.93, 40.93] |
| Outcome or subgroup title | No. of studies | No. of participants | Statistical method | Effect size |
| 1 FEV1 (litres) Show forest plot | 3 | 73 | Mean Difference (IV, Fixed, 95% CI) | 0.13 [‐0.22, 0.48] |
| Analysis 15.1  Comparison 15 FP versus placebo: Parallel group studies, no oral steroids: 1000‐1500 mcg/d (all delivery devices), Outcome 1 FEV1 (litres). | ||||
| 1.1 1‐4 weeks | 2 | 42 | Mean Difference (IV, Fixed, 95% CI) | ‐0.12 [‐0.54, 0.30] |
| 1.3 MDI | 0 | 0 | Mean Difference (IV, Fixed, 95% CI) | 0.0 [0.0, 0.0] |
| 1.4 DPI | 1 | 31 | Mean Difference (IV, Fixed, 95% CI) | 0.66 [0.04, 1.28] |
| 2 Change in FEV1 compared to baseline (litres) Show forest plot | 3 | 414 | Mean Difference (IV, Fixed, 95% CI) | 0.53 [0.43, 0.63] |
| Analysis 15.2  Comparison 15 FP versus placebo: Parallel group studies, no oral steroids: 1000‐1500 mcg/d (all delivery devices), Outcome 2 Change in FEV1 compared to baseline (litres). | ||||
| 2.1 MDI | 1 | 159 | Mean Difference (IV, Fixed, 95% CI) | 0.52 [0.38, 0.66] |
| 2.2 DPI | 2 | 255 | Mean Difference (IV, Fixed, 95% CI) | 0.53 [0.40, 0.67] |
| 5 Change in morning PEFR compared to baseline (L/min) Show forest plot | 3 | 422 | Mean Difference (IV, Fixed, 95% CI) | 49.38 [40.83, 57.93] |
| Analysis 15.5  Comparison 15 FP versus placebo: Parallel group studies, no oral steroids: 1000‐1500 mcg/d (all delivery devices), Outcome 5 Change in morning PEFR compared to baseline (L/min). | ||||
| 5.1 MDI | 1 | 169 | Mean Difference (IV, Fixed, 95% CI) | 58.0 [43.82, 72.18] |
| 5.2 DPI | 2 | 253 | Mean Difference (IV, Fixed, 95% CI) | 44.46 [33.75, 55.17] |
| 6 Change in evening PEFR compared to baseline (L/min) Show forest plot | 2 | 278 | Mean Difference (IV, Fixed, 95% CI) | 41.12 [31.36, 50.87] |
| Analysis 15.6  Comparison 15 FP versus placebo: Parallel group studies, no oral steroids: 1000‐1500 mcg/d (all delivery devices), Outcome 6 Change in evening PEFR compared to baseline (L/min). | ||||
| 6.1 MDI | 1 | 159 | Mean Difference (IV, Fixed, 95% CI) | 48.0 [35.35, 60.65] |
| 6.2 DPI | 1 | 119 | Mean Difference (IV, Fixed, 95% CI) | 31.0 [15.67, 46.33] |
| 7 Change in daily asthma symptom score compared to baseline Show forest plot | 3 | 412 | Std. Mean Difference (IV, Fixed, 95% CI) | ‐0.65 [‐0.85, ‐0.46] |
| Analysis 15.7  Comparison 15 FP versus placebo: Parallel group studies, no oral steroids: 1000‐1500 mcg/d (all delivery devices), Outcome 7 Change in daily asthma symptom score compared to baseline. | ||||
| 7.1 MDI | 1 | 159 | Std. Mean Difference (IV, Fixed, 95% CI) | ‐0.76 [‐1.08, ‐0.44] |
| 7.2 DPI | 2 | 253 | Std. Mean Difference (IV, Fixed, 95% CI) | ‐0.59 [‐0.84, ‐0.34] |
| 8 Change in night‐time awakening per week compared to baseline Show forest plot | 2 | 277 | Std. Mean Difference (IV, Fixed, 95% CI) | ‐0.60 [‐0.85, ‐0.36] |
| Analysis 15.8  Comparison 15 FP versus placebo: Parallel group studies, no oral steroids: 1000‐1500 mcg/d (all delivery devices), Outcome 8 Change in night‐time awakening per week compared to baseline. | ||||
| 8.1 MDI | 1 | 159 | Std. Mean Difference (IV, Fixed, 95% CI) | ‐0.73 [‐1.06, ‐0.41] |
| 8.2 DPI | 1 | 118 | Std. Mean Difference (IV, Fixed, 95% CI) | ‐0.43 [‐0.80, ‐0.07] |
| 9 Change in daily use of beta2 agonist compared to baseline (puffs/d) Show forest plot | 3 | 409 | Mean Difference (IV, Fixed, 95% CI) | ‐1.37 [‐1.79, ‐0.96] |
| Analysis 15.9  Comparison 15 FP versus placebo: Parallel group studies, no oral steroids: 1000‐1500 mcg/d (all delivery devices), Outcome 9 Change in daily use of beta2 agonist compared to baseline (puffs/d). | ||||
| 9.1 MDI | 1 | 159 | Mean Difference (IV, Fixed, 95% CI) | ‐0.96 [‐1.48, ‐0.44] |
| 9.2 DPI | 2 | 250 | Mean Difference (IV, Fixed, 95% CI) | ‐2.06 [‐2.74, ‐1.39] |
| 11 Physician‐rated efficacy: effective or very effective (No. of patients) Show forest plot | 2 | 311 | Peto Odds Ratio (Peto, Fixed, 95% CI) | 9.62 [6.18, 14.99] |
| Analysis 15.11  Comparison 15 FP versus placebo: Parallel group studies, no oral steroids: 1000‐1500 mcg/d (all delivery devices), Outcome 11 Physician‐rated efficacy: effective or very effective (No. of patients). | ||||
| 11.1 MDI | 2 | 311 | Peto Odds Ratio (Peto, Fixed, 95% CI) | 9.62 [6.18, 14.99] |
| 11.2 DPI | 0 | 0 | Peto Odds Ratio (Peto, Fixed, 95% CI) | 0.0 [0.0, 0.0] |
| 17 Withdrawal due to lack of treatment efficacy (No. of patients) Show forest plot | 4 | 566 | Peto Odds Ratio (Peto, Fixed, 95% CI) | 0.11 [0.07, 0.15] |
| Analysis 15.17  Comparison 15 FP versus placebo: Parallel group studies, no oral steroids: 1000‐1500 mcg/d (all delivery devices), Outcome 17 Withdrawal due to lack of treatment efficacy (No. of patients). | ||||
| 17.1 MDI | 2 | 311 | Peto Odds Ratio (Peto, Fixed, 95% CI) | 0.08 [0.05, 0.13] |
| 17.2 DPI | 2 | 255 | Peto Odds Ratio (Peto, Fixed, 95% CI) | 0.16 [0.09, 0.28] |
| 18 Sore throat or pharyngitis (No. of patients) Show forest plot | 3 | 419 | Peto Odds Ratio (Peto, Fixed, 95% CI) | 5.65 [1.70, 18.79] |
| Analysis 15.18  Comparison 15 FP versus placebo: Parallel group studies, no oral steroids: 1000‐1500 mcg/d (all delivery devices), Outcome 18 Sore throat or pharyngitis (No. of patients). | ||||
| 18.1 MDI | 1 | 152 | Peto Odds Ratio (Peto, Fixed, 95% CI) | 7.29 [0.45, 117.74] |
| 18.2 DPI | 2 | 267 | Peto Odds Ratio (Peto, Fixed, 95% CI) | 5.33 [1.41, 20.20] |
| 19 Hoarseness or dysphonia (No. of patients) Show forest plot | 5 | 665 | Peto Odds Ratio (Peto, Fixed, 95% CI) | 7.92 [3.25, 19.30] |
| Analysis 15.19  Comparison 15 FP versus placebo: Parallel group studies, no oral steroids: 1000‐1500 mcg/d (all delivery devices), Outcome 19 Hoarseness or dysphonia (No. of patients). | ||||
| 19.1 MDI | 3 | 398 | Peto Odds Ratio (Peto, Fixed, 95% CI) | 8.06 [2.87, 22.61] |
| 19.2 DPI | 2 | 267 | Peto Odds Ratio (Peto, Fixed, 95% CI) | 7.53 [1.29, 43.98] |
| 20 Oral Candidiasis (No. of patients) Show forest plot | 6 | 770 | Peto Odds Ratio (Peto, Fixed, 95% CI) | 4.77 [2.32, 9.80] |
| Analysis 15.20  Comparison 15 FP versus placebo: Parallel group studies, no oral steroids: 1000‐1500 mcg/d (all delivery devices), Outcome 20 Oral Candidiasis (No. of patients). | ||||
| 20.1 MDI | 4 | 503 | Peto Odds Ratio (Peto, Fixed, 95% CI) | 8.28 [3.14, 21.84] |
| 20.2 DPI | 2 | 267 | Peto Odds Ratio (Peto, Fixed, 95% CI) | 2.41 [0.82, 7.08] |
| Outcome or subgroup title | No. of studies | No. of participants | Statistical method | Effect size |
| 1 FEV1 (litres) Show forest plot | 3 | 73 | Mean Difference (IV, Fixed, 95% CI) | 0.13 [‐0.22, 0.48] |
| Analysis 16.1  Comparison 16 FP versus placebo: Parallel group studies, no oral steroids: 1000‐1500 mcg/d (all degrees asthma severity), Outcome 1 FEV1 (litres). | ||||
| 1.1 Mild | 3 | 73 | Mean Difference (IV, Fixed, 95% CI) | 0.13 [‐0.22, 0.48] |
| 1.2 Mild to moderate | 0 | 0 | Mean Difference (IV, Fixed, 95% CI) | 0.0 [0.0, 0.0] |
| 1.3 Moderate | 0 | 0 | Mean Difference (IV, Fixed, 95% CI) | 0.0 [0.0, 0.0] |
| 2 Change in FEV1 compared to baseline (litres) Show forest plot | 3 | 414 | Mean Difference (IV, Fixed, 95% CI) | 0.53 [0.43, 0.63] |
| Analysis 16.2  Comparison 16 FP versus placebo: Parallel group studies, no oral steroids: 1000‐1500 mcg/d (all degrees asthma severity), Outcome 2 Change in FEV1 compared to baseline (litres). | ||||
| 2.1 Mild | 0 | 0 | Mean Difference (IV, Fixed, 95% CI) | 0.0 [0.0, 0.0] |
| 2.2 Mild to moderate | 2 | 281 | Mean Difference (IV, Fixed, 95% CI) | 0.50 [0.39, 0.61] |
| 2.3 Moderate | 1 | 133 | Mean Difference (IV, Fixed, 95% CI) | 0.61 [0.41, 0.81] |
| 5 Change in morning PEFR compared to baseline (L/min) Show forest plot | 3 | 422 | Mean Difference (IV, Fixed, 95% CI) | 49.38 [40.83, 57.93] |
| Analysis 16.5  Comparison 16 FP versus placebo: Parallel group studies, no oral steroids: 1000‐1500 mcg/d (all degrees asthma severity), Outcome 5 Change in morning PEFR compared to baseline (L/min). | ||||
| 5.1 Mild | 0 | 0 | Mean Difference (IV, Fixed, 95% CI) | 0.0 [0.0, 0.0] |
| 5.2 Mild to moderate | 2 | 289 | Mean Difference (IV, Fixed, 95% CI) | 59.25 [48.43, 70.07] |
| 5.3 Moderate | 1 | 133 | Mean Difference (IV, Fixed, 95% CI) | 33.0 [19.06, 46.94] |
| 6 Change in evening PEFR compared to baseline (L/min) Show forest plot | 2 | 278 | Mean Difference (IV, Fixed, 95% CI) | 41.12 [31.36, 50.87] |
| Analysis 16.6  Comparison 16 FP versus placebo: Parallel group studies, no oral steroids: 1000‐1500 mcg/d (all degrees asthma severity), Outcome 6 Change in evening PEFR compared to baseline (L/min). | ||||
| 6.1 Mild | 0 | 0 | Mean Difference (IV, Fixed, 95% CI) | 0.0 [0.0, 0.0] |
| 6.2 Mild to moderate | 2 | 278 | Mean Difference (IV, Fixed, 95% CI) | 41.12 [31.36, 50.87] |
| 6.3 Moderate | 0 | 0 | Mean Difference (IV, Fixed, 95% CI) | 0.0 [0.0, 0.0] |
| 7 Change in daily asthma symptom score compared to baseline Show forest plot | 3 | 412 | Std. Mean Difference (IV, Fixed, 95% CI) | ‐0.65 [‐0.85, ‐0.46] |
| Analysis 16.7  Comparison 16 FP versus placebo: Parallel group studies, no oral steroids: 1000‐1500 mcg/d (all degrees asthma severity), Outcome 7 Change in daily asthma symptom score compared to baseline. | ||||
| 7.1 Mild | 0 | 0 | Std. Mean Difference (IV, Fixed, 95% CI) | 0.0 [0.0, 0.0] |
| 7.2 Mild to moderate | 2 | 279 | Std. Mean Difference (IV, Fixed, 95% CI) | ‐0.70 [‐0.94, ‐0.46] |
| 7.3 Moderate | 1 | 133 | Std. Mean Difference (IV, Fixed, 95% CI) | ‐0.57 [‐0.91, ‐0.22] |
| 8 Change in night‐time wakening score Show forest plot | 2 | 277 | Std. Mean Difference (IV, Fixed, 95% CI) | ‐0.60 [‐0.85, ‐0.36] |
| Analysis 16.8  Comparison 16 FP versus placebo: Parallel group studies, no oral steroids: 1000‐1500 mcg/d (all degrees asthma severity), Outcome 8 Change in night‐time wakening score. | ||||
| 8.1 Mild | 0 | 0 | Std. Mean Difference (IV, Fixed, 95% CI) | 0.0 [0.0, 0.0] |
| 8.2 Mild to moderate | 2 | 277 | Std. Mean Difference (IV, Fixed, 95% CI) | ‐0.60 [‐0.85, ‐0.36] |
| 8.3 Moderate | 0 | 0 | Std. Mean Difference (IV, Fixed, 95% CI) | 0.0 [0.0, 0.0] |
| 9 Change in daily use of beta2 agonist compared to baseline (puffs/d) Show forest plot | 3 | 409 | Mean Difference (IV, Fixed, 95% CI) | ‐1.37 [‐1.79, ‐0.96] |
| Analysis 16.9  Comparison 16 FP versus placebo: Parallel group studies, no oral steroids: 1000‐1500 mcg/d (all degrees asthma severity), Outcome 9 Change in daily use of beta2 agonist compared to baseline (puffs/d). | ||||
| 9.1 Mild | 0 | 0 | Mean Difference (IV, Fixed, 95% CI) | 0.0 [0.0, 0.0] |
| 9.2 Mild to moderate | 2 | 276 | Mean Difference (IV, Fixed, 95% CI) | ‐1.28 [‐1.74, ‐0.83] |
| 9.3 Moderate | 1 | 133 | Mean Difference (IV, Fixed, 95% CI) | ‐1.8 [‐2.78, ‐0.82] |
| 11 Physician‐rated efficacy: effective or very effective (No. of patients) Show forest plot | 2 | 311 | Peto Odds Ratio (Peto, Fixed, 95% CI) | 9.62 [6.18, 14.99] |
| Analysis 16.11  Comparison 16 FP versus placebo: Parallel group studies, no oral steroids: 1000‐1500 mcg/d (all degrees asthma severity), Outcome 11 Physician‐rated efficacy: effective or very effective (No. of patients). | ||||
| 11.1 Mild | 0 | 0 | Peto Odds Ratio (Peto, Fixed, 95% CI) | 0.0 [0.0, 0.0] |
| 11.2 Mild to moderate | 1 | 159 | Peto Odds Ratio (Peto, Fixed, 95% CI) | 14.53 [7.82, 27.01] |
| 11.3 Moderate | 1 | 152 | Peto Odds Ratio (Peto, Fixed, 95% CI) | 6.25 [3.32, 11.79] |
| 17 Withdrawal due to lack of treatment efficacy (No.of patients) Show forest plot | 4 | 566 | Peto Odds Ratio (Peto, Fixed, 95% CI) | 0.11 [0.07, 0.15] |
| Analysis 16.17  Comparison 16 FP versus placebo: Parallel group studies, no oral steroids: 1000‐1500 mcg/d (all degrees asthma severity), Outcome 17 Withdrawal due to lack of treatment efficacy (No.of patients). | ||||
| 17.1 Mild | 0 | 0 | Peto Odds Ratio (Peto, Fixed, 95% CI) | 0.0 [0.0, 0.0] |
| 17.2 Mild to moderate | 2 | 281 | Peto Odds Ratio (Peto, Fixed, 95% CI) | 0.10 [0.06, 0.16] |
| 17.3 Moderate | 2 | 285 | Peto Odds Ratio (Peto, Fixed, 95% CI) | 0.11 [0.07, 0.19] |
| 18 Sore throat or pharyngitis (No. of patients) Show forest plot | 3 | 419 | Peto Odds Ratio (Peto, Fixed, 95% CI) | 5.65 [1.70, 18.79] |
| Analysis 16.18  Comparison 16 FP versus placebo: Parallel group studies, no oral steroids: 1000‐1500 mcg/d (all degrees asthma severity), Outcome 18 Sore throat or pharyngitis (No. of patients). | ||||
| 18.1 Mild | 0 | 0 | Peto Odds Ratio (Peto, Fixed, 95% CI) | 0.0 [0.0, 0.0] |
| 18.2 Mild to moderate | 1 | 134 | Peto Odds Ratio (Peto, Fixed, 95% CI) | 4.92 [1.08, 22.44] |
| 18.3 Moderate | 2 | 285 | Peto Odds Ratio (Peto, Fixed, 95% CI) | 7.13 [1.00, 51.03] |
| 19 Hoarseness or dysphonia (No. of patients) Show forest plot | 5 | 665 | Peto Odds Ratio (Peto, Fixed, 95% CI) | 7.92 [3.25, 19.30] |
| Analysis 16.19  Comparison 16 FP versus placebo: Parallel group studies, no oral steroids: 1000‐1500 mcg/d (all degrees asthma severity), Outcome 19 Hoarseness or dysphonia (No. of patients). | ||||
| 19.1 Mild | 1 | 82 | Peto Odds Ratio (Peto, Fixed, 95% CI) | 7.77 [0.79, 76.88] |
| 19.2 Mild to moderate | 2 | 298 | Peto Odds Ratio (Peto, Fixed, 95% CI) | 8.38 [2.50, 28.02] |
| 19.3 Moderate | 2 | 285 | Peto Odds Ratio (Peto, Fixed, 95% CI) | 7.23 [1.44, 36.28] |
| 20 Oral Candidiasis (No. of patients) Show forest plot | 6 | 770 | Peto Odds Ratio (Peto, Fixed, 95% CI) | 4.77 [2.32, 9.80] |
| Analysis 16.20  Comparison 16 FP versus placebo: Parallel group studies, no oral steroids: 1000‐1500 mcg/d (all degrees asthma severity), Outcome 20 Oral Candidiasis (No. of patients). | ||||
| 20.1 Mild | 2 | 187 | Peto Odds Ratio (Peto, Fixed, 95% CI) | 8.53 [2.39, 30.39] |
| 20.2 Mild to moderate | 2 | 298 | Peto Odds Ratio (Peto, Fixed, 95% CI) | 3.62 [1.03, 12.74] |
| 20.3 Moderate | 2 | 285 | Peto Odds Ratio (Peto, Fixed, 95% CI) | 3.61 [1.06, 12.23] |
| Outcome or subgroup title | No. of studies | No. of participants | Statistical method | Effect size |
| 1 PD20 ‐ change from baseline Show forest plot | 1 | Mean Difference (IV, Fixed, 95% CI) | Totals not selected | |
| Analysis 17.1  Comparison 17 FP versus placebo: Parallel group studies, no oral steroids: 2000 mcg/d (all ages), Outcome 1 PD20 ‐ change from baseline. | ||||
| 1.1 Children | 0 | Mean Difference (IV, Fixed, 95% CI) | 0.0 [0.0, 0.0] | |
| 1.2 Adults | 1 | Mean Difference (IV, Fixed, 95% CI) | 0.0 [0.0, 0.0] | |
| Outcome or subgroup title | No. of studies | No. of participants | Statistical method | Effect size |
| 1 FEV1 (% predicted ‐ absolute values) Show forest plot | 1 | % (Fixed, 95% CI) | Totals not selected | |
| Analysis 18.1  Comparison 18 FP versus placebo: Crossover studies, no oral steroids: 100mcg/d or less (all ages), Outcome 1 FEV1 (% predicted ‐ absolute values). | ||||
| 1.1 Children | 0 | % (Fixed, 95% CI) | 0.0 [0.0, 0.0] | |
| 1.2 Adults | 1 | % (Fixed, 95% CI) | 0.0 [0.0, 0.0] | |
| 2 PEF (% predicted ‐ absolute values) Show forest plot | 1 | % (Fixed, 95% CI) | Totals not selected | |
| Analysis 18.2  Comparison 18 FP versus placebo: Crossover studies, no oral steroids: 100mcg/d or less (all ages), Outcome 2 PEF (% predicted ‐ absolute values). | ||||
| 2.1 Children | 0 | % (Fixed, 95% CI) | 0.0 [0.0, 0.0] | |
| 2.2 Adults | 1 | % (Fixed, 95% CI) | 0.0 [0.0, 0.0] | |
| 3 Quality of life (absolute scores ‐ AQLQ) Show forest plot | 1 | QoL (Fixed, 95% CI) | Totals not selected | |
| Analysis 18.3  Comparison 18 FP versus placebo: Crossover studies, no oral steroids: 100mcg/d or less (all ages), Outcome 3 Quality of life (absolute scores ‐ AQLQ). | ||||
| 3.1 Children | 0 | QoL (Fixed, 95% CI) | 0.0 [0.0, 0.0] | |
| 3.2 Adults | 1 | QoL (Fixed, 95% CI) | 0.0 [0.0, 0.0] | |
| 4 Symptoms Show forest plot | 1 | Symptom score (Fixed, 95% CI) | Totals not selected | |
| Analysis 18.4  Comparison 18 FP versus placebo: Crossover studies, no oral steroids: 100mcg/d or less (all ages), Outcome 4 Symptoms. | ||||
| 4.1 Children | 0 | Symptom score (Fixed, 95% CI) | 0.0 [0.0, 0.0] | |
| 4.2 Adults | 1 | Symptom score (Fixed, 95% CI) | 0.0 [0.0, 0.0] | |
| 6 Rescue medication usage (unclear time frame ‐ absolute values) Show forest plot | 1 | Puffs (Fixed, 95% CI) | Totals not selected | |
| Analysis 18.6  Comparison 18 FP versus placebo: Crossover studies, no oral steroids: 100mcg/d or less (all ages), Outcome 6 Rescue medication usage (unclear time frame ‐ absolute values). | ||||
| 6.1 Children | 0 | Puffs (Fixed, 95% CI) | 0.0 [0.0, 0.0] | |
| 6.2 Adults | 1 | Puffs (Fixed, 95% CI) | 0.0 [0.0, 0.0] | |
| Outcome or subgroup title | No. of studies | No. of participants | Statistical method | Effect size |
| 1 FEV1 Show forest plot | 1 | Litres (Fixed, 95% CI) | Totals not selected | |
| Analysis 19.1  Comparison 19 FP versus placebo: Crossover studies, no oral steroids: 200mcg/d (all ages), Outcome 1 FEV1. | ||||
| 1.1 Children | 0 | Litres (Fixed, 95% CI) | 0.0 [0.0, 0.0] | |
| 1.2 Adults | 1 | Litres (Fixed, 95% CI) | 0.0 [0.0, 0.0] | |
| 2 Throat irritation Show forest plot | 1 | Odds Ratio (M‐H, Fixed, 95% CI) | Totals not selected | |
| Analysis 19.2  Comparison 19 FP versus placebo: Crossover studies, no oral steroids: 200mcg/d (all ages), Outcome 2 Throat irritation. | ||||
| 2.1 Children | 0 | Odds Ratio (M‐H, Fixed, 95% CI) | 0.0 [0.0, 0.0] | |
| 2.2 Adults | 1 | Odds Ratio (M‐H, Fixed, 95% CI) | 0.0 [0.0, 0.0] | |
| 3 Upper respiratory tract infections Show forest plot | 1 | Odds Ratio (M‐H, Fixed, 95% CI) | Totals not selected | |
| Analysis 19.3  Comparison 19 FP versus placebo: Crossover studies, no oral steroids: 200mcg/d (all ages), Outcome 3 Upper respiratory tract infections. | ||||
| 3.1 Children | 0 | Odds Ratio (M‐H, Fixed, 95% CI) | 0.0 [0.0, 0.0] | |
| 3.2 Adults | 1 | Odds Ratio (M‐H, Fixed, 95% CI) | 0.0 [0.0, 0.0] | |
| 4 Lower respiratory tract infection Show forest plot | 1 | Odds Ratio (M‐H, Fixed, 95% CI) | Totals not selected | |
| Analysis 19.4  Comparison 19 FP versus placebo: Crossover studies, no oral steroids: 200mcg/d (all ages), Outcome 4 Lower respiratory tract infection. | ||||
| 4.1 Children | 0 | Odds Ratio (M‐H, Fixed, 95% CI) | 0.0 [0.0, 0.0] | |
| 4.2 Adults | 1 | Odds Ratio (M‐H, Fixed, 95% CI) | 0.0 [0.0, 0.0] | |
| Outcome or subgroup title | No. of studies | No. of participants | Statistical method | Effect size |
| 1 FEV1 (absolute values) Show forest plot | 1 | Litres (Fixed, 95% CI) | Totals not selected | |
| Analysis 20.1  Comparison 20 FP versus placebo: Crossover studies, no oral steroids: 500mcg/d (all ages), Outcome 1 FEV1 (absolute values). | ||||
| 1.1 Children | 0 | Litres (Fixed, 95% CI) | 0.0 [0.0, 0.0] | |
| 1.2 Adults | 1 | Litres (Fixed, 95% CI) | 0.0 [0.0, 0.0] | |
| 2 PC 20 Show forest plot | 2 | 70 | Doses (n) (Fixed, 95% CI) | 2.45 [1.63, 3.27] |
| Analysis 20.2  Comparison 20 FP versus placebo: Crossover studies, no oral steroids: 500mcg/d (all ages), Outcome 2 PC 20. | ||||
| 2.1 Children | 0 | 0 | Doses (n) (Fixed, 95% CI) | 0.0 [0.0, 0.0] |
| 2.2 Adults | 2 | 70 | Doses (n) (Fixed, 95% CI) | 2.45 [1.63, 3.27] |
| 3 Cortisol suppression Show forest plot | 1 | % (Fixed, 95% CI) | Totals not selected | |
| Analysis 20.3  Comparison 20 FP versus placebo: Crossover studies, no oral steroids: 500mcg/d (all ages), Outcome 3 Cortisol suppression. | ||||
| 3.1 Children | 0 | % (Fixed, 95% CI) | 0.0 [0.0, 0.0] | |
| 3.2 Adults | 1 | % (Fixed, 95% CI) | 0.0 [0.0, 0.0] | |
| Outcome or subgroup title | No. of studies | No. of participants | Statistical method | Effect size |
| 1 Cortisol suppression Show forest plot | 1 | % (Fixed, 95% CI) | Totals not selected | |
| Analysis 21.1  Comparison 21 FP versus placebo: Crossover studies, no oral steroids: 1000mcg/d (all ages), Outcome 1 Cortisol suppression. | ||||
| 1.1 Children | 0 | % (Fixed, 95% CI) | 0.0 [0.0, 0.0] | |
| 1.2 Adults | 1 | % (Fixed, 95% CI) | 0.0 [0.0, 0.0] | |
| 2 PC 20 Show forest plot | 2 | 100 | Doses (n) (Fixed, 95% CI) | 2.82 [2.13, 3.51] |
| Analysis 21.2  Comparison 21 FP versus placebo: Crossover studies, no oral steroids: 1000mcg/d (all ages), Outcome 2 PC 20. | ||||
| 2.1 Children | 0 | 0 | Doses (n) (Fixed, 95% CI) | 0.0 [0.0, 0.0] |
| 2.2 Adults | 2 | 100 | Doses (n) (Fixed, 95% CI) | 2.82 [2.13, 3.51] |
| Outcome or subgroup title | No. of studies | No. of participants | Statistical method | Effect size |
| 1 Number of patients able to discontinue OCS completely Show forest plot | 2 | 139 | Peto Odds Ratio (Peto, Fixed, 95% CI) | 14.07 [7.17, 27.57] |
| Analysis 22.1  Comparison 22 FP versus placebo: Parallel group studies, oral steroid dependent: 1000‐1500 mcg/d, Outcome 1 Number of patients able to discontinue OCS completely. | ||||
| 2 Change in daily dose of oral prednisolone compared to baseline (mg) Show forest plot | 2 | 139 | Mean Difference (IV, Fixed, 95% CI) | ‐7.59 [‐9.92, ‐5.25] |
| Analysis 22.2  Comparison 22 FP versus placebo: Parallel group studies, oral steroid dependent: 1000‐1500 mcg/d, Outcome 2 Change in daily dose of oral prednisolone compared to baseline (mg). | ||||
| 3 Change in FEV1 compared to baseline (litres) Show forest plot | 2 | 139 | Mean Difference (IV, Fixed, 95% CI) | 0.26 [0.09, 0.43] |
| Analysis 22.3  Comparison 22 FP versus placebo: Parallel group studies, oral steroid dependent: 1000‐1500 mcg/d, Outcome 3 Change in FEV1 compared to baseline (litres). | ||||
| 4 Change in morning PEFR compared to baseline (L/min) Show forest plot | 2 | 139 | Mean Difference (IV, Fixed, 95% CI) | 50.85 [30.96, 70.73] |
| Analysis 22.4  Comparison 22 FP versus placebo: Parallel group studies, oral steroid dependent: 1000‐1500 mcg/d, Outcome 4 Change in morning PEFR compared to baseline (L/min). | ||||
| 5 Change in evening PEFR compared to baseline (L/min) Show forest plot | 2 | 139 | Mean Difference (IV, Fixed, 95% CI) | 26.52 [6.40, 46.65] |
| Analysis 22.5  Comparison 22 FP versus placebo: Parallel group studies, oral steroid dependent: 1000‐1500 mcg/d, Outcome 5 Change in evening PEFR compared to baseline (L/min). | ||||
| 6 Change in daily asthma symptom score compared to baseline Show forest plot | 2 | 139 | Std. Mean Difference (IV, Fixed, 95% CI) | ‐0.76 [‐1.10, ‐0.41] |
| Analysis 22.6  Comparison 22 FP versus placebo: Parallel group studies, oral steroid dependent: 1000‐1500 mcg/d, Outcome 6 Change in daily asthma symptom score compared to baseline. | ||||
| 7 Change in daily use of rescue beta2 agonist compared to baseline (puffs/d) Show forest plot | 2 | 139 | Mean Difference (IV, Fixed, 95% CI) | ‐3.60 [‐5.04, ‐2.16] |
| Analysis 22.7  Comparison 22 FP versus placebo: Parallel group studies, oral steroid dependent: 1000‐1500 mcg/d, Outcome 7 Change in daily use of rescue beta2 agonist compared to baseline (puffs/d). | ||||
| 8 Asthma Quality of Life Questionnaire: change in overall score compared to baseline Show forest plot | 1 | Mean Difference (IV, Fixed, 95% CI) | Totals not selected | |
| Analysis 22.8  Comparison 22 FP versus placebo: Parallel group studies, oral steroid dependent: 1000‐1500 mcg/d, Outcome 8 Asthma Quality of Life Questionnaire: change in overall score compared to baseline. | ||||
| 9 Asthma Quality of Life Questionnaire: change in activity limitation domain compared to baseline Show forest plot | 1 | Mean Difference (IV, Fixed, 95% CI) | Totals not selected | |
| Analysis 22.9  Comparison 22 FP versus placebo: Parallel group studies, oral steroid dependent: 1000‐1500 mcg/d, Outcome 9 Asthma Quality of Life Questionnaire: change in activity limitation domain compared to baseline. | ||||
| 10 Asthma Quality of Life Questionnaire: change in asthma symptoms domain compared to baseline Show forest plot | 1 | Mean Difference (IV, Fixed, 95% CI) | Totals not selected | |
| Analysis 22.10  Comparison 22 FP versus placebo: Parallel group studies, oral steroid dependent: 1000‐1500 mcg/d, Outcome 10 Asthma Quality of Life Questionnaire: change in asthma symptoms domain compared to baseline. | ||||
| 11 Asthma Quality of Life Questionnaire: change in emotional function domain compared to baseline Show forest plot | 1 | Mean Difference (IV, Fixed, 95% CI) | Totals not selected | |
| Analysis 22.11  Comparison 22 FP versus placebo: Parallel group studies, oral steroid dependent: 1000‐1500 mcg/d, Outcome 11 Asthma Quality of Life Questionnaire: change in emotional function domain compared to baseline. | ||||
| 12 Asthma Quality of Life Questionnaire: change in enviromental exposure domain compared to baseline Show forest plot | 1 | Mean Difference (IV, Fixed, 95% CI) | Totals not selected | |
| Analysis 22.12  Comparison 22 FP versus placebo: Parallel group studies, oral steroid dependent: 1000‐1500 mcg/d, Outcome 12 Asthma Quality of Life Questionnaire: change in enviromental exposure domain compared to baseline. | ||||
| 14 Sore throat (No. of patients) Show forest plot | 2 | 139 | Peto Odds Ratio (Peto, Fixed, 95% CI) | 2.42 [0.33, 17.64] |
| Analysis 22.14  Comparison 22 FP versus placebo: Parallel group studies, oral steroid dependent: 1000‐1500 mcg/d, Outcome 14 Sore throat (No. of patients). | ||||
| 15 Hoarseness or dysphonia (No. of patients) Show forest plot | 2 | 139 | Peto Odds Ratio (Peto, Fixed, 95% CI) | 7.19 [1.41, 36.63] |
| Analysis 22.15  Comparison 22 FP versus placebo: Parallel group studies, oral steroid dependent: 1000‐1500 mcg/d, Outcome 15 Hoarseness or dysphonia (No. of patients). | ||||
| 17 Oral Candidiasis (No. of patients) Show forest plot | 2 | 139 | Peto Odds Ratio (Peto, Fixed, 95% CI) | 5.71 [1.98, 16.47] |
| Analysis 22.17  Comparison 22 FP versus placebo: Parallel group studies, oral steroid dependent: 1000‐1500 mcg/d, Outcome 17 Oral Candidiasis (No. of patients). | ||||
| Outcome or subgroup title | No. of studies | No. of participants | Statistical method | Effect size |
| 1 Number of patients able to discontinue OCS completely Show forest plot | 2 | 134 | Peto Odds Ratio (Peto, Fixed, 95% CI) | 0.04 [0.02, 0.08] |
| Analysis 23.1  Comparison 23 FP versus placebo: Parallel group studies, oral steroid dependent: 2000 mcg/d, Outcome 1 Number of patients able to discontinue OCS completely. | ||||
| 2 Change in daily dose of oral prednisolone compared to baseline (mg) Show forest plot | 2 | 134 | Mean Difference (IV, Fixed, 95% CI) | ‐9.72 [‐12.10, ‐7.35] |
| Analysis 23.2  Comparison 23 FP versus placebo: Parallel group studies, oral steroid dependent: 2000 mcg/d, Outcome 2 Change in daily dose of oral prednisolone compared to baseline (mg). | ||||
| 3 Change in FEV1 compared to baseline (litres) Show forest plot | 2 | 134 | Mean Difference (IV, Fixed, 95% CI) | 0.58 [0.40, 0.76] |
| Analysis 23.3  Comparison 23 FP versus placebo: Parallel group studies, oral steroid dependent: 2000 mcg/d, Outcome 3 Change in FEV1 compared to baseline (litres). | ||||
| 4 Change in morning PEFR compared to baseline (L/min) Show forest plot | 2 | 134 | Mean Difference (IV, Fixed, 95% CI) | 94.35 [72.51, 116.19] |
| Analysis 23.4  Comparison 23 FP versus placebo: Parallel group studies, oral steroid dependent: 2000 mcg/d, Outcome 4 Change in morning PEFR compared to baseline (L/min). | ||||
| 5 Change in evening PEFR compared to baseline (L/min) Show forest plot | 2 | 134 | Mean Difference (IV, Fixed, 95% CI) | 66.14 [43.04, 89.24] |
| Analysis 23.5  Comparison 23 FP versus placebo: Parallel group studies, oral steroid dependent: 2000 mcg/d, Outcome 5 Change in evening PEFR compared to baseline (L/min). | ||||
| 6 Change in daily asthma symptom score compared to baseline Show forest plot | 2 | 134 | Std. Mean Difference (IV, Fixed, 95% CI) | ‐1.03 [‐1.39, ‐0.67] |
| Analysis 23.6  Comparison 23 FP versus placebo: Parallel group studies, oral steroid dependent: 2000 mcg/d, Outcome 6 Change in daily asthma symptom score compared to baseline. | ||||
| 7 Change in daily use of rescue beta2 agonist compared to baseline (puffs/d) Show forest plot | 2 | 134 | Mean Difference (IV, Fixed, 95% CI) | ‐4.63 [‐6.10, ‐3.15] |
| Analysis 23.7  Comparison 23 FP versus placebo: Parallel group studies, oral steroid dependent: 2000 mcg/d, Outcome 7 Change in daily use of rescue beta2 agonist compared to baseline (puffs/d). | ||||
| 8 Asthma Quality of Life Questionnaire: change in overall score compared to baseline Show forest plot | 1 | Mean Difference (IV, Fixed, 95% CI) | Totals not selected | |
| Analysis 23.8  Comparison 23 FP versus placebo: Parallel group studies, oral steroid dependent: 2000 mcg/d, Outcome 8 Asthma Quality of Life Questionnaire: change in overall score compared to baseline. | ||||
| 9 Asthma Quality of Life Questionnaire: change in activity limitation domain compared to baseline Show forest plot | 1 | Mean Difference (IV, Fixed, 95% CI) | Totals not selected | |
| Analysis 23.9  Comparison 23 FP versus placebo: Parallel group studies, oral steroid dependent: 2000 mcg/d, Outcome 9 Asthma Quality of Life Questionnaire: change in activity limitation domain compared to baseline. | ||||
| 10 Asthma Quality of Life Questionnaire: change in asthma symptoms domain compared to baseline Show forest plot | 1 | Mean Difference (IV, Fixed, 95% CI) | Totals not selected | |
| Analysis 23.10  Comparison 23 FP versus placebo: Parallel group studies, oral steroid dependent: 2000 mcg/d, Outcome 10 Asthma Quality of Life Questionnaire: change in asthma symptoms domain compared to baseline. | ||||
| 11 Asthma Quality of Life Questionnaire: change in emotional function domain compared to baseline Show forest plot | 1 | Mean Difference (IV, Fixed, 95% CI) | Totals not selected | |
| Analysis 23.11  Comparison 23 FP versus placebo: Parallel group studies, oral steroid dependent: 2000 mcg/d, Outcome 11 Asthma Quality of Life Questionnaire: change in emotional function domain compared to baseline. | ||||
| 12 Asthma Quality of Life Questionnaire: change in enviromental exposure domain compared to baseline Show forest plot | 1 | Mean Difference (IV, Fixed, 95% CI) | Totals not selected | |
| Analysis 23.12  Comparison 23 FP versus placebo: Parallel group studies, oral steroid dependent: 2000 mcg/d, Outcome 12 Asthma Quality of Life Questionnaire: change in enviromental exposure domain compared to baseline. | ||||
| 14 Sore throat (No. of patients) Show forest plot | 2 | Peto Odds Ratio (Peto, Fixed, 95% CI) | Totals not selected | |
| Analysis 23.14  Comparison 23 FP versus placebo: Parallel group studies, oral steroid dependent: 2000 mcg/d, Outcome 14 Sore throat (No. of patients). | ||||
| 15 Hoarseness or dysphonia (No. of patients) Show forest plot | 2 | 134 | Peto Odds Ratio (Peto, Fixed, 95% CI) | 7.63 [1.50, 38.92] |
| Analysis 23.15  Comparison 23 FP versus placebo: Parallel group studies, oral steroid dependent: 2000 mcg/d, Outcome 15 Hoarseness or dysphonia (No. of patients). | ||||
| 16 Oral Candidiasis (No. of patients) Show forest plot | 2 | 134 | Peto Odds Ratio (Peto, Fixed, 95% CI) | 4.62 [1.70, 12.51] |
| Analysis 23.16  Comparison 23 FP versus placebo: Parallel group studies, oral steroid dependent: 2000 mcg/d, Outcome 16 Oral Candidiasis (No. of patients). | ||||
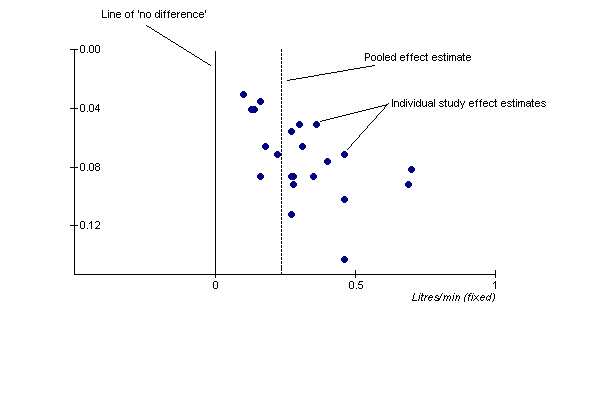
FEV1 funnel plot.
Funnel plot asymmetry of studies reporting change in FEV1 in the studies assembled. The distribution of effect estimates could actually be attributable to more than one common effect, rather than underreporting of negative data for this outcome.

FP100 withdrawals.
In order to prevent 1 trial withdrawal due to clinical deterioration of asthma, 4 people would need to be treated with FP at 100mcg/d.

FP200 withdrawals.
NNT to show that three people need treatment with FP at 200mcg/d to prevent 1 withdrawal due to deterioration of asthma
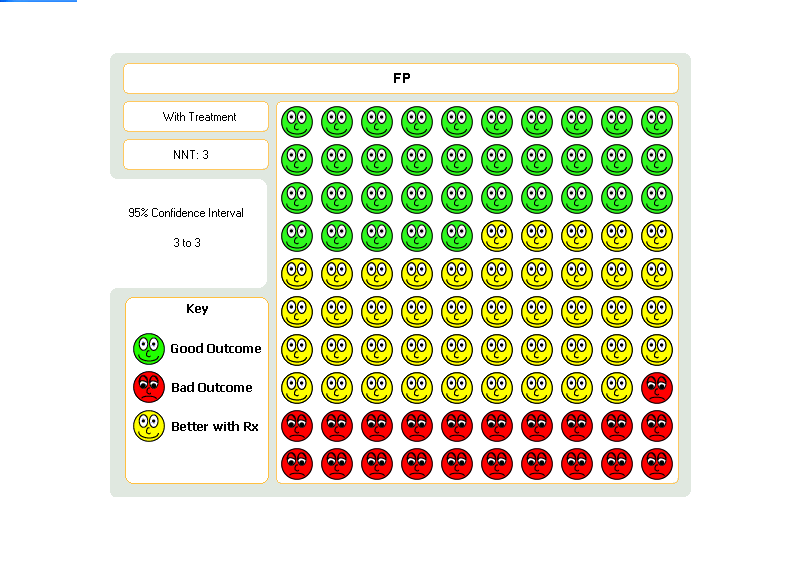
FP500 wthdrawals.
NNT to show that 3 people need to be treated with FP at 500mcg/d to prevent one trial withdrawal due to deteriorating asthma
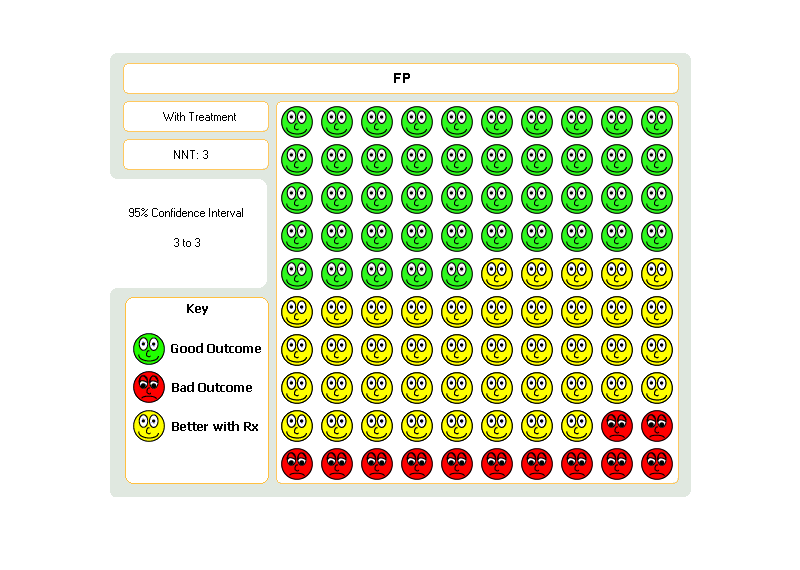
FP1000 withdrawals.
NNT to show that 3 people need treatment with FP at 1000mcg/d to prevent one withdrawal due to deterioration of asthma.

FP500 pharyngitis.
Graphic to demonstrate that for every 100 people treated with FP at a dose of 500 mcg, around 73 would need to be treated in order for one person to develop sore throat.

FP1000 pharyngitis.

FP500 hoarse/dysphon.
Graphic to demonstrate that 148 people need to be treated with FP500 in order for one to develop hoarseness/dysphonia

FP1000 hoarse/dyspho.
Graphic to demonstrate that 30 people need to be treated with FP1000 mcg/d in order for one to develop hoarseness/dysphonia

FP500 candidiasis.
Visual graphic to demonstrate that 76 people would need to be treated with 500mcg/d of FP in order for one person to develop oral candidiasis
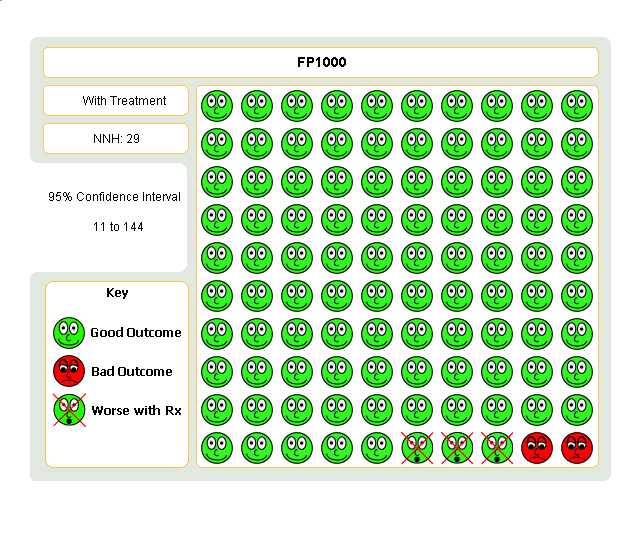
FP1000 candidiasis.
Graphic to demonstrate that 29 people need to be treated with FP1000mcg/d in order for one person to develop oral candidiasis
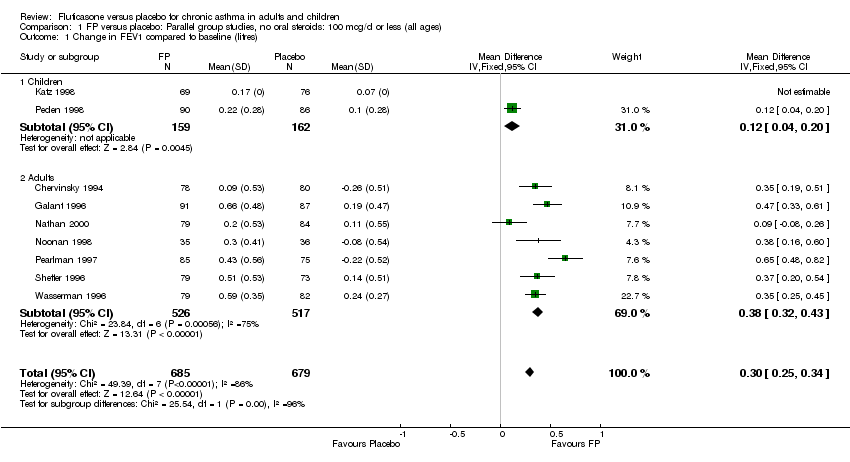
Comparison 1 FP versus placebo: Parallel group studies, no oral steroids: 100 mcg/d or less (all ages), Outcome 1 Change in FEV1 compared to baseline (litres).
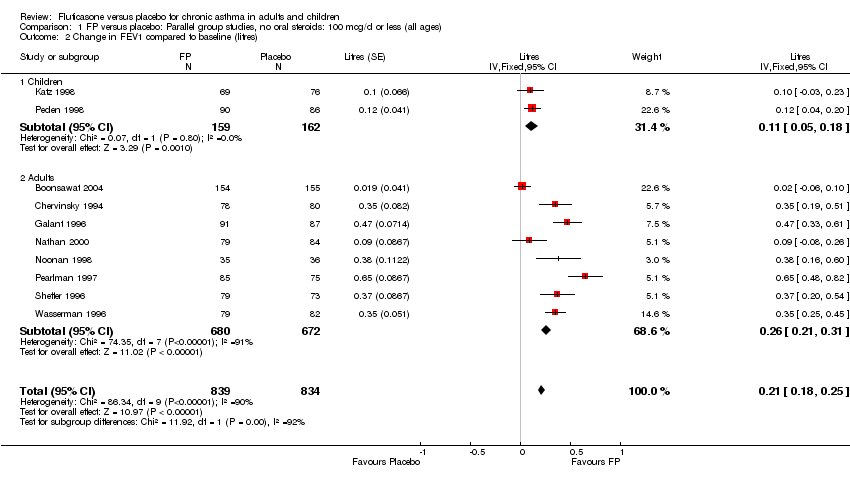
Comparison 1 FP versus placebo: Parallel group studies, no oral steroids: 100 mcg/d or less (all ages), Outcome 2 Change in FEV1 compared to baseline (litres).

Comparison 1 FP versus placebo: Parallel group studies, no oral steroids: 100 mcg/d or less (all ages), Outcome 3 FEV1 ‐ Litres (absolute values).

Comparison 1 FP versus placebo: Parallel group studies, no oral steroids: 100 mcg/d or less (all ages), Outcome 4 Change in morning PEFR compared to baseline (L/min).

Comparison 1 FP versus placebo: Parallel group studies, no oral steroids: 100 mcg/d or less (all ages), Outcome 5 Change in am PEF (predicted).

Comparison 1 FP versus placebo: Parallel group studies, no oral steroids: 100 mcg/d or less (all ages), Outcome 6 Change in evening PEFR compared to baseline (L/min).
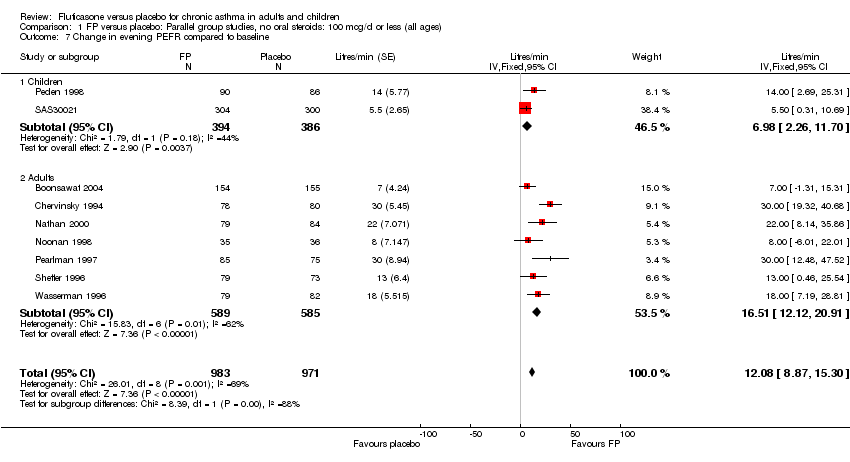
Comparison 1 FP versus placebo: Parallel group studies, no oral steroids: 100 mcg/d or less (all ages), Outcome 7 Change in evening PEFR compared to baseline.

Comparison 1 FP versus placebo: Parallel group studies, no oral steroids: 100 mcg/d or less (all ages), Outcome 8 Change in evening PEF (predicted).

Comparison 1 FP versus placebo: Parallel group studies, no oral steroids: 100 mcg/d or less (all ages), Outcome 9 Peak flow ‐ L/min (absolute values).

Comparison 1 FP versus placebo: Parallel group studies, no oral steroids: 100 mcg/d or less (all ages), Outcome 10 Change in clinic PEFR compared to baseline (L/min).
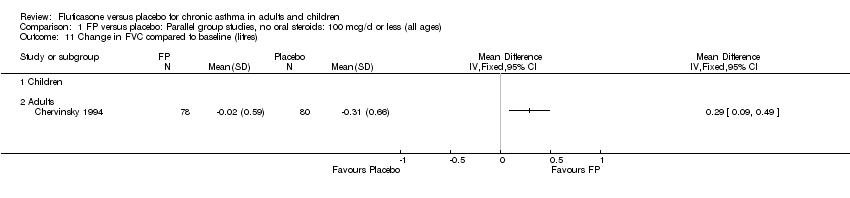
Comparison 1 FP versus placebo: Parallel group studies, no oral steroids: 100 mcg/d or less (all ages), Outcome 11 Change in FVC compared to baseline (litres).
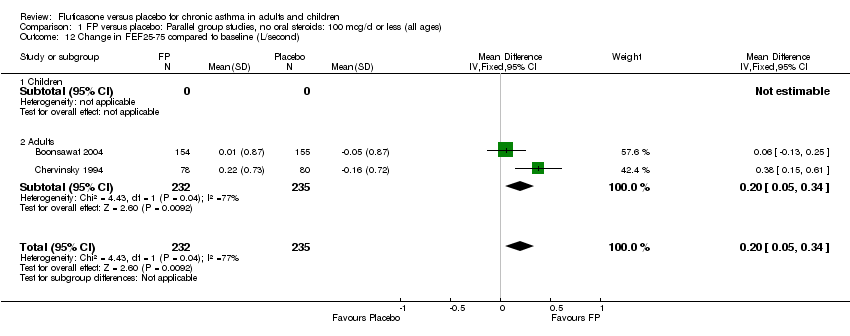
Comparison 1 FP versus placebo: Parallel group studies, no oral steroids: 100 mcg/d or less (all ages), Outcome 12 Change in FEF25‐75 compared to baseline (L/second).
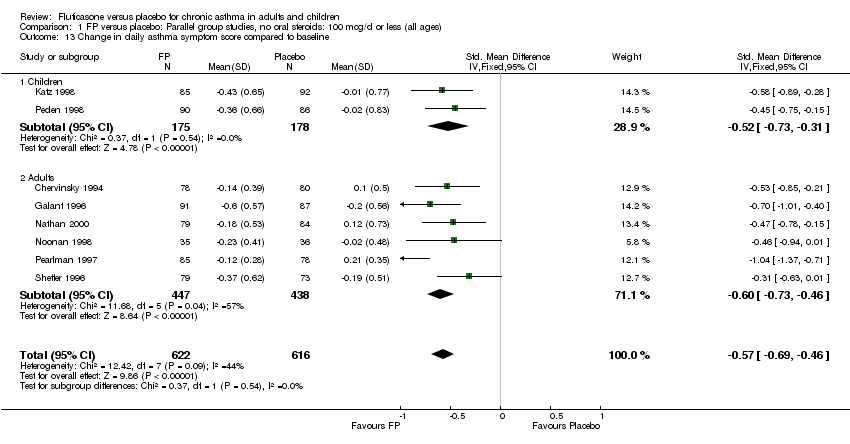
Comparison 1 FP versus placebo: Parallel group studies, no oral steroids: 100 mcg/d or less (all ages), Outcome 13 Change in daily asthma symptom score compared to baseline.
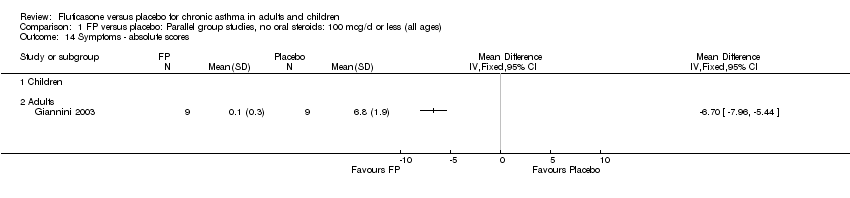
Comparison 1 FP versus placebo: Parallel group studies, no oral steroids: 100 mcg/d or less (all ages), Outcome 14 Symptoms ‐ absolute scores.

Comparison 1 FP versus placebo: Parallel group studies, no oral steroids: 100 mcg/d or less (all ages), Outcome 15 Change in night‐time wakening score.

Comparison 1 FP versus placebo: Parallel group studies, no oral steroids: 100 mcg/d or less (all ages), Outcome 16 Nighttime awakenings/night.
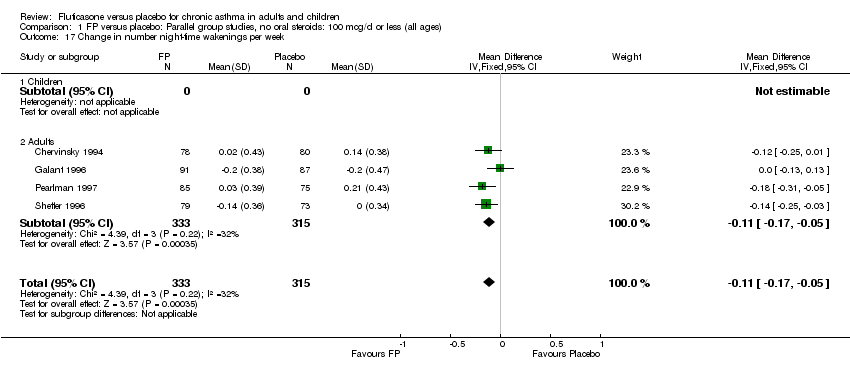
Comparison 1 FP versus placebo: Parallel group studies, no oral steroids: 100 mcg/d or less (all ages), Outcome 17 Change in number night‐time wakenings per week.

Comparison 1 FP versus placebo: Parallel group studies, no oral steroids: 100 mcg/d or less (all ages), Outcome 18 Change in daily use of beta2 agonist compared to baseline (puffs/d).

Comparison 1 FP versus placebo: Parallel group studies, no oral steroids: 100 mcg/d or less (all ages), Outcome 19 Rescue medication usage ‐ puffs/d (absolute scores).
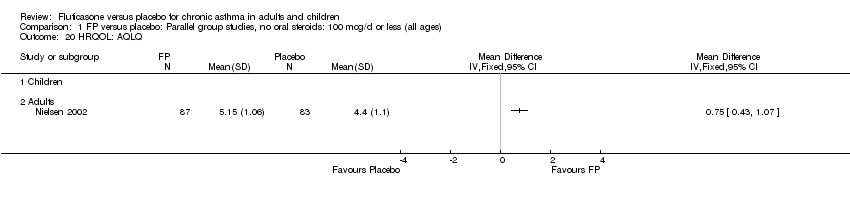
Comparison 1 FP versus placebo: Parallel group studies, no oral steroids: 100 mcg/d or less (all ages), Outcome 20 HRQOL: AQLQ.

Comparison 1 FP versus placebo: Parallel group studies, no oral steroids: 100 mcg/d or less (all ages), Outcome 21 HRQOL: Functional Status IIR questionaire (short version).
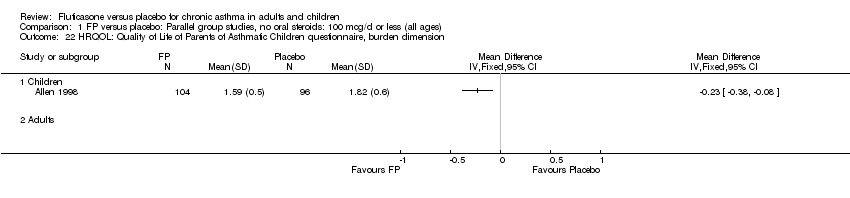
Comparison 1 FP versus placebo: Parallel group studies, no oral steroids: 100 mcg/d or less (all ages), Outcome 22 HRQOL: Quality of Life of Parents of Asthmatic Children questionnaire, burden dimension.

Comparison 1 FP versus placebo: Parallel group studies, no oral steroids: 100 mcg/d or less (all ages), Outcome 23 HRQOL: Quality of Life of Parents of Asthmatic Children questionnaire, subjective norms dimension.
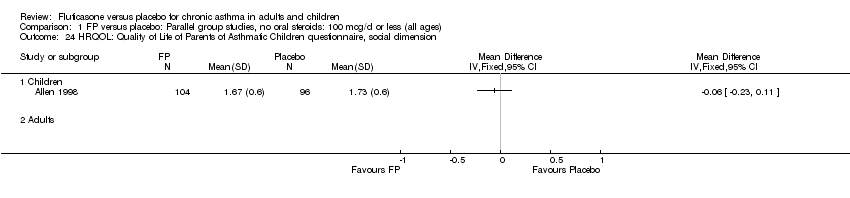
Comparison 1 FP versus placebo: Parallel group studies, no oral steroids: 100 mcg/d or less (all ages), Outcome 24 HRQOL: Quality of Life of Parents of Asthmatic Children questionnaire, social dimension.
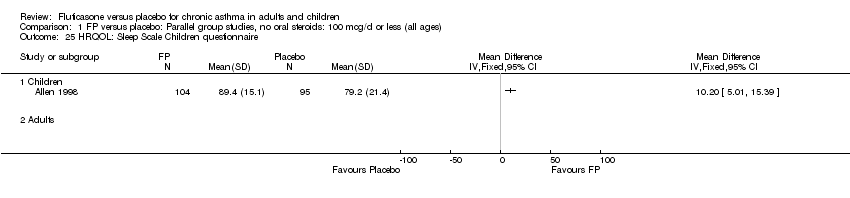
Comparison 1 FP versus placebo: Parallel group studies, no oral steroids: 100 mcg/d or less (all ages), Outcome 25 HRQOL: Sleep Scale Children questionnaire.
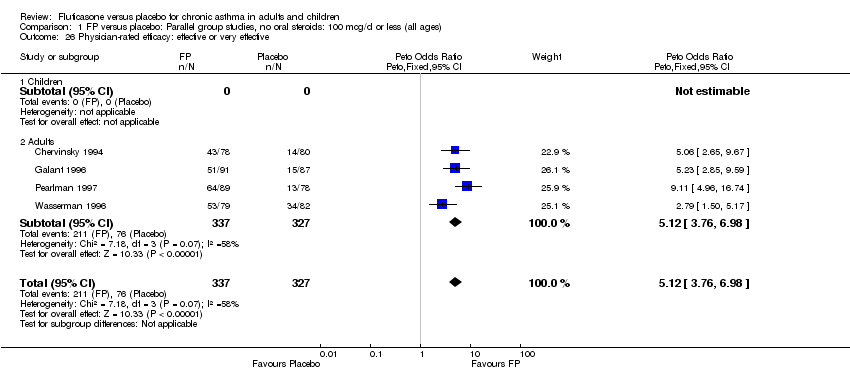
Comparison 1 FP versus placebo: Parallel group studies, no oral steroids: 100 mcg/d or less (all ages), Outcome 26 Physician‐rated efficacy: effective or very effective.

Comparison 1 FP versus placebo: Parallel group studies, no oral steroids: 100 mcg/d or less (all ages), Outcome 27 Withdrawal due to clinical asthma exacerbation (No. of patients).

Comparison 1 FP versus placebo: Parallel group studies, no oral steroids: 100 mcg/d or less (all ages), Outcome 28 Withdrawal due to lack of treatment efficacy (No. of patients).

Comparison 1 FP versus placebo: Parallel group studies, no oral steroids: 100 mcg/d or less (all ages), Outcome 29 Withdrawals due to adverse events.
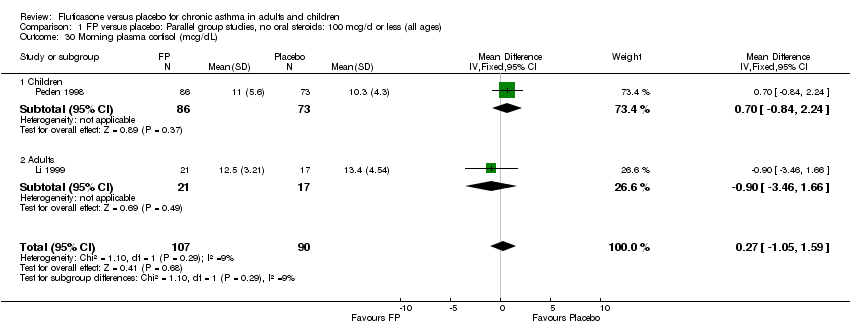
Comparison 1 FP versus placebo: Parallel group studies, no oral steroids: 100 mcg/d or less (all ages), Outcome 30 Morning plasma cortisol (mcg/dL).

Comparison 1 FP versus placebo: Parallel group studies, no oral steroids: 100 mcg/d or less (all ages), Outcome 31 Total urinary free cortisol excretion (mcg/24 hours).
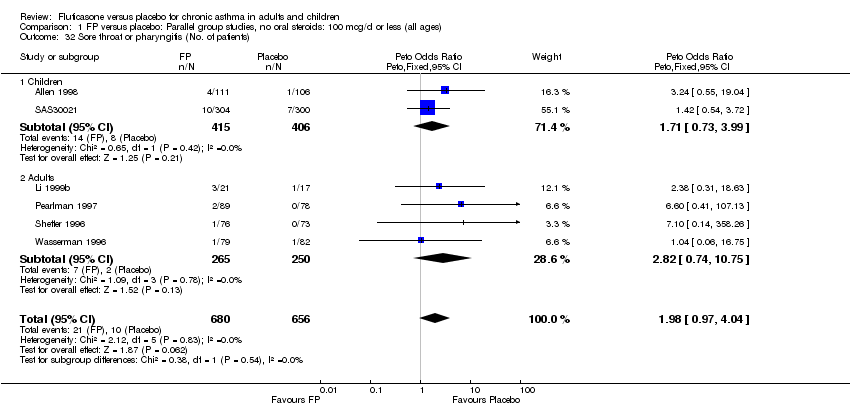
Comparison 1 FP versus placebo: Parallel group studies, no oral steroids: 100 mcg/d or less (all ages), Outcome 32 Sore throat or pharyngitis (No. of patients).
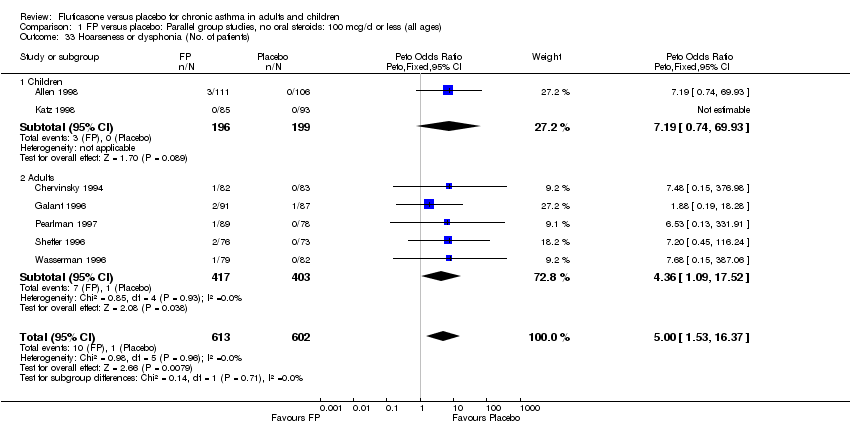
Comparison 1 FP versus placebo: Parallel group studies, no oral steroids: 100 mcg/d or less (all ages), Outcome 33 Hoarseness or dysphonia (No. of patients).

Comparison 1 FP versus placebo: Parallel group studies, no oral steroids: 100 mcg/d or less (all ages), Outcome 34 Oral Candidiasis (No. of patients).
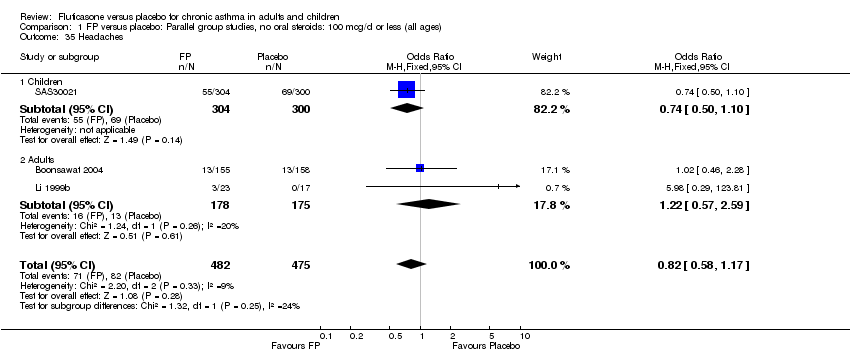
Comparison 1 FP versus placebo: Parallel group studies, no oral steroids: 100 mcg/d or less (all ages), Outcome 35 Headaches.
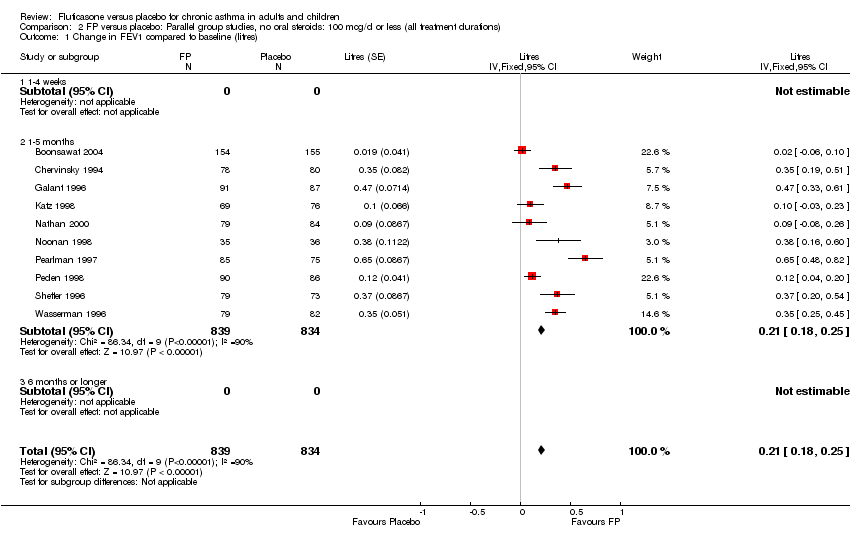
Comparison 2 FP versus placebo: Parallel group studies, no oral steroids: 100 mcg/d or less (all treatment durations), Outcome 1 Change in FEV1 compared to baseline (litres).
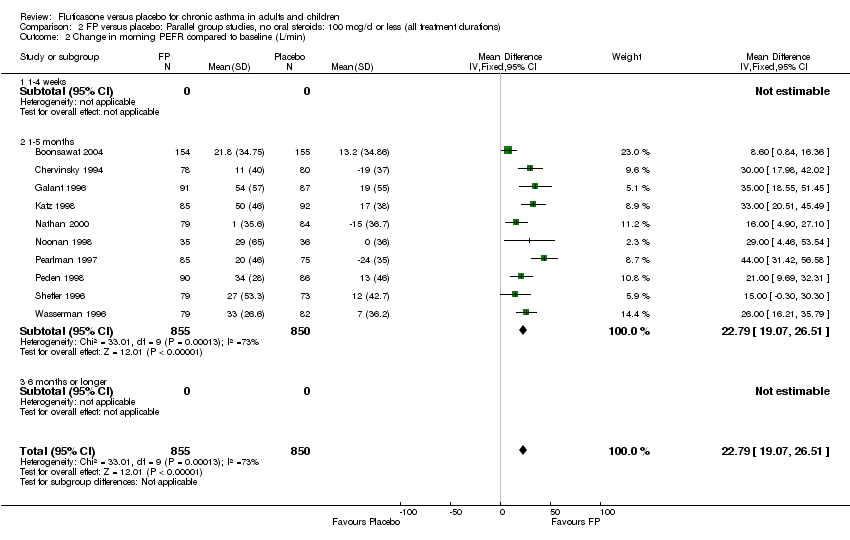
Comparison 2 FP versus placebo: Parallel group studies, no oral steroids: 100 mcg/d or less (all treatment durations), Outcome 2 Change in morning PEFR compared to baseline (L/min).

Comparison 2 FP versus placebo: Parallel group studies, no oral steroids: 100 mcg/d or less (all treatment durations), Outcome 3 Change in evening PEFR compared to baseline.
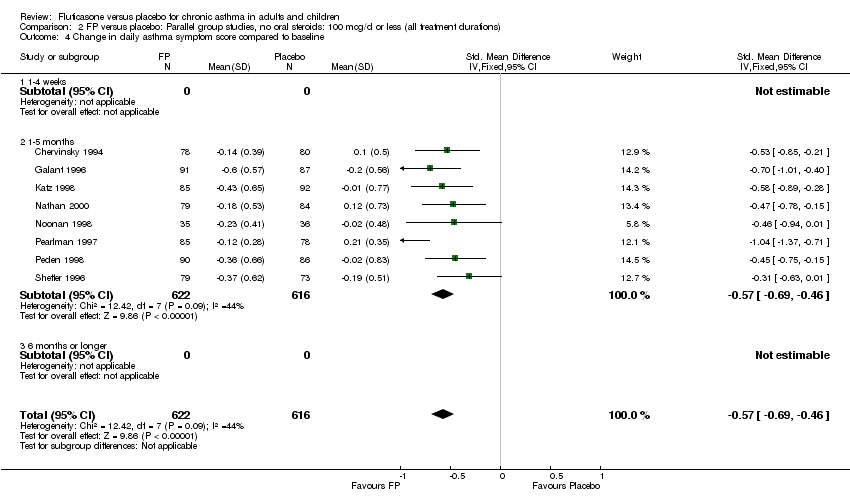
Comparison 2 FP versus placebo: Parallel group studies, no oral steroids: 100 mcg/d or less (all treatment durations), Outcome 4 Change in daily asthma symptom score compared to baseline.
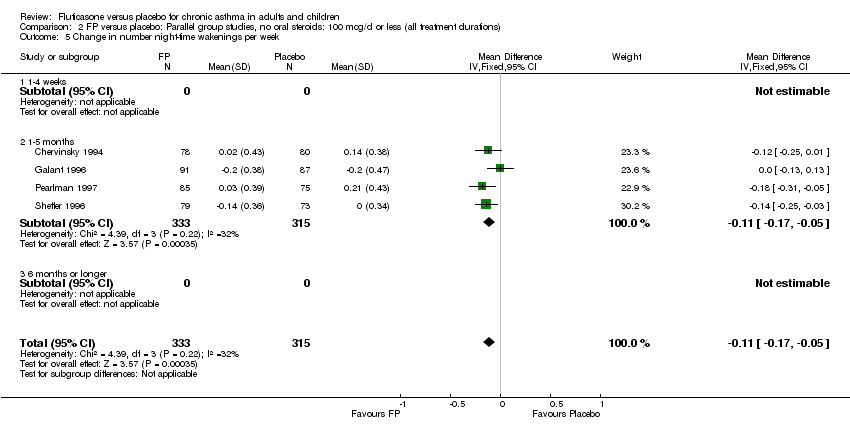
Comparison 2 FP versus placebo: Parallel group studies, no oral steroids: 100 mcg/d or less (all treatment durations), Outcome 5 Change in number night‐time wakenings per week.
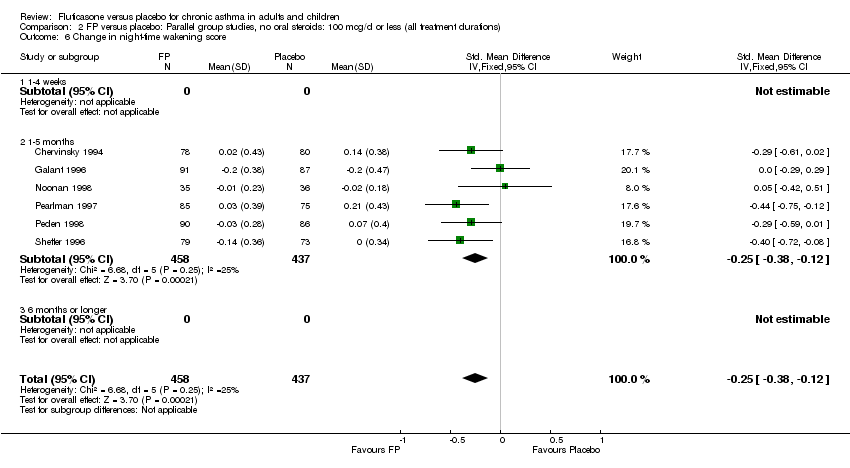
Comparison 2 FP versus placebo: Parallel group studies, no oral steroids: 100 mcg/d or less (all treatment durations), Outcome 6 Change in night‐time wakening score.
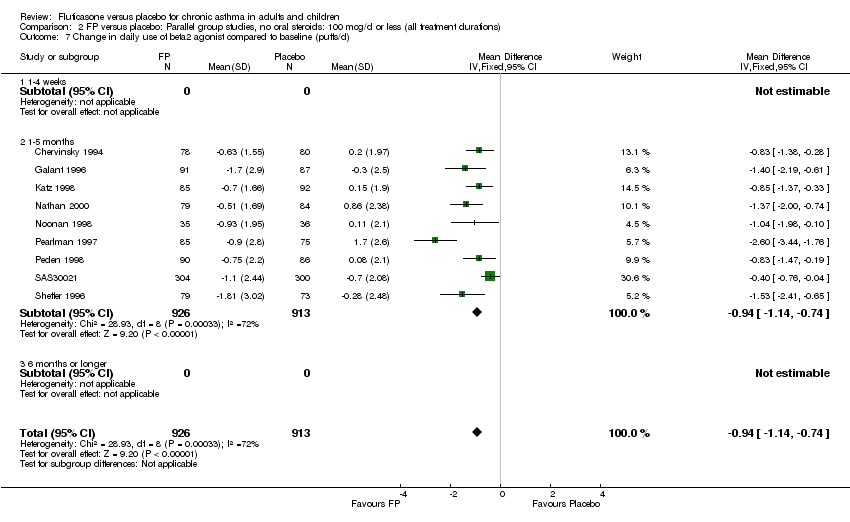
Comparison 2 FP versus placebo: Parallel group studies, no oral steroids: 100 mcg/d or less (all treatment durations), Outcome 7 Change in daily use of beta2 agonist compared to baseline (puffs/d).

Comparison 2 FP versus placebo: Parallel group studies, no oral steroids: 100 mcg/d or less (all treatment durations), Outcome 8 Physician‐rated efficacy: effective or very effective.
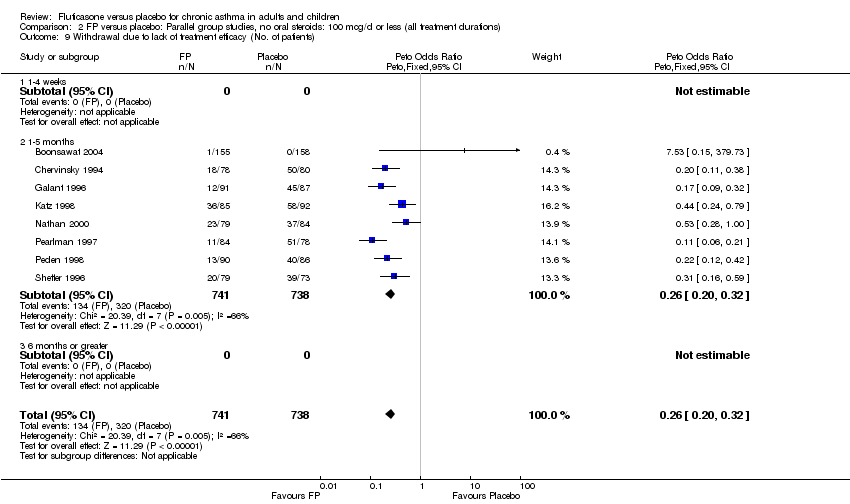
Comparison 2 FP versus placebo: Parallel group studies, no oral steroids: 100 mcg/d or less (all treatment durations), Outcome 9 Withdrawal due to lack of treatment efficacy (No. of patients).

Comparison 2 FP versus placebo: Parallel group studies, no oral steroids: 100 mcg/d or less (all treatment durations), Outcome 10 Sore throat or pharyngitis (No. of patients).
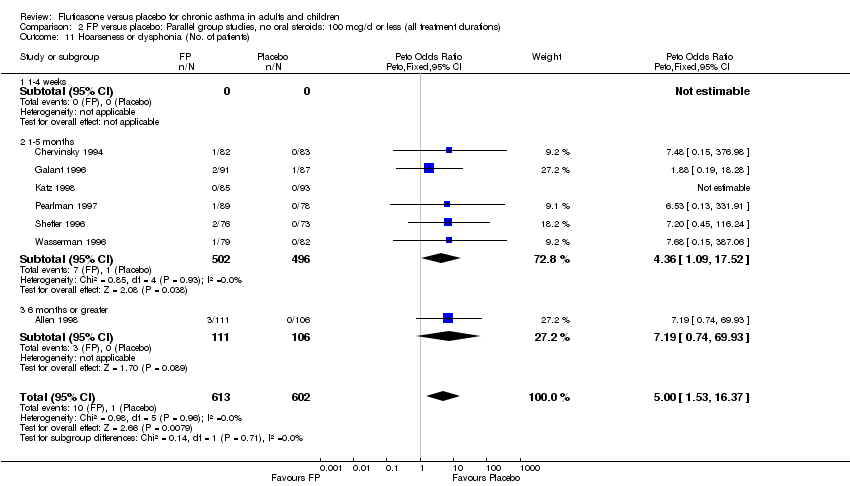
Comparison 2 FP versus placebo: Parallel group studies, no oral steroids: 100 mcg/d or less (all treatment durations), Outcome 11 Hoarseness or dysphonia (No. of patients).
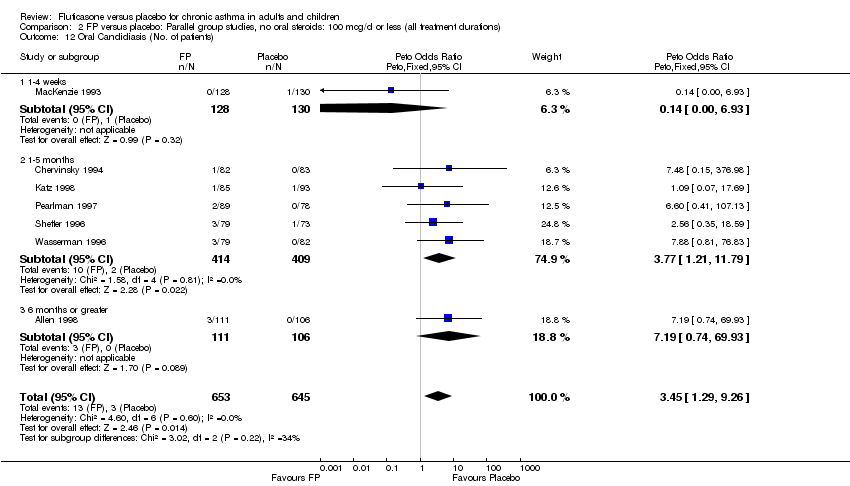
Comparison 2 FP versus placebo: Parallel group studies, no oral steroids: 100 mcg/d or less (all treatment durations), Outcome 12 Oral Candidiasis (No. of patients).

Comparison 2 FP versus placebo: Parallel group studies, no oral steroids: 100 mcg/d or less (all treatment durations), Outcome 13 Withdrawals due to adverse events.

Comparison 3 FP versus placebo: Parallel group studies, no oral steroids: 100 mcg/d or less (all delivery devices), Outcome 1 Change in FEV1 compared to baseline (litres).

Comparison 3 FP versus placebo: Parallel group studies, no oral steroids: 100 mcg/d or less (all delivery devices), Outcome 2 Change in morning PEFR compared to baseline (L/min).
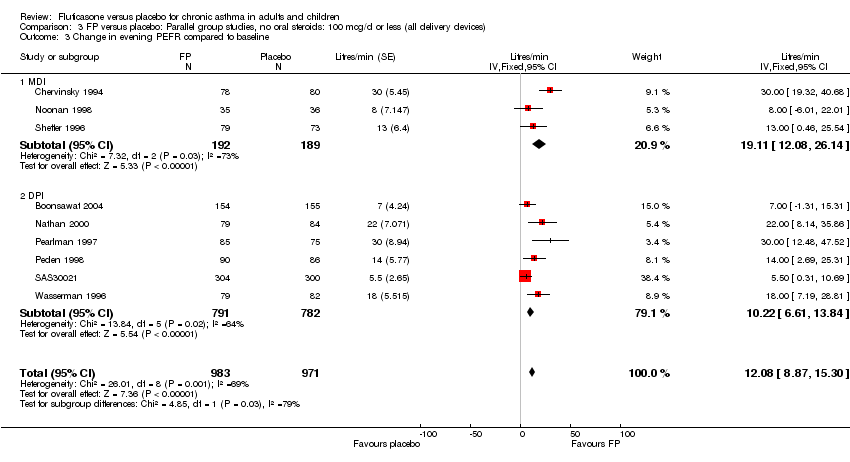
Comparison 3 FP versus placebo: Parallel group studies, no oral steroids: 100 mcg/d or less (all delivery devices), Outcome 3 Change in evening PEFR compared to baseline.

Comparison 3 FP versus placebo: Parallel group studies, no oral steroids: 100 mcg/d or less (all delivery devices), Outcome 4 Change in daily asthma symptom score compared to baseline.
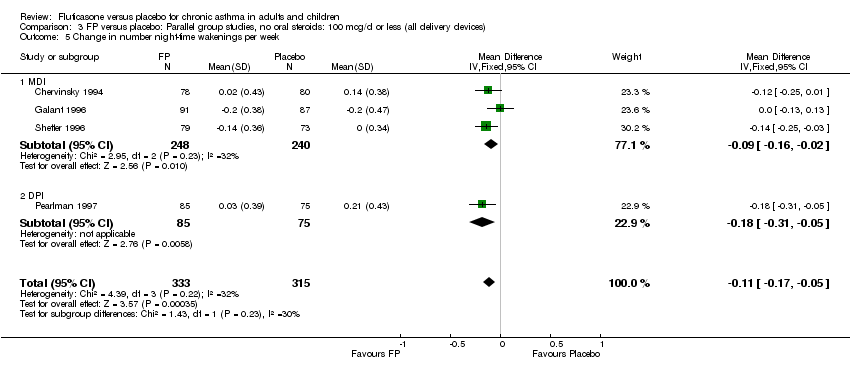
Comparison 3 FP versus placebo: Parallel group studies, no oral steroids: 100 mcg/d or less (all delivery devices), Outcome 5 Change in number night‐time wakenings per week.

Comparison 3 FP versus placebo: Parallel group studies, no oral steroids: 100 mcg/d or less (all delivery devices), Outcome 6 Change in night‐time wakening score.
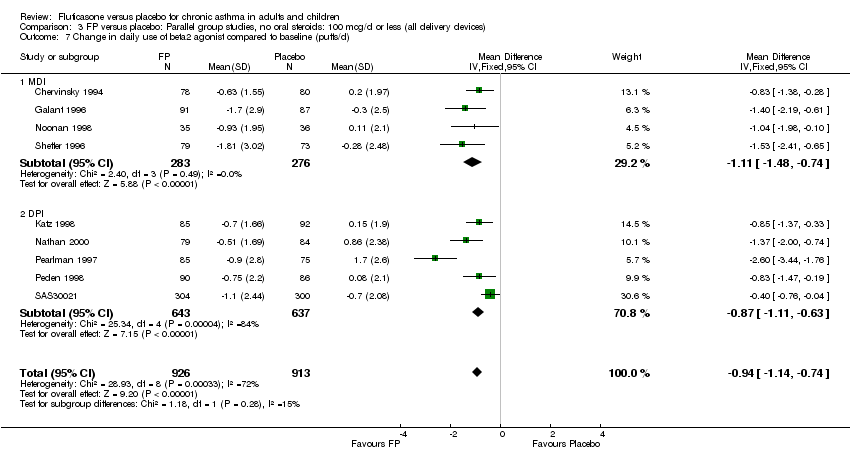
Comparison 3 FP versus placebo: Parallel group studies, no oral steroids: 100 mcg/d or less (all delivery devices), Outcome 7 Change in daily use of beta2 agonist compared to baseline (puffs/d).

Comparison 3 FP versus placebo: Parallel group studies, no oral steroids: 100 mcg/d or less (all delivery devices), Outcome 8 Physician‐rated efficacy: effective or very effective.
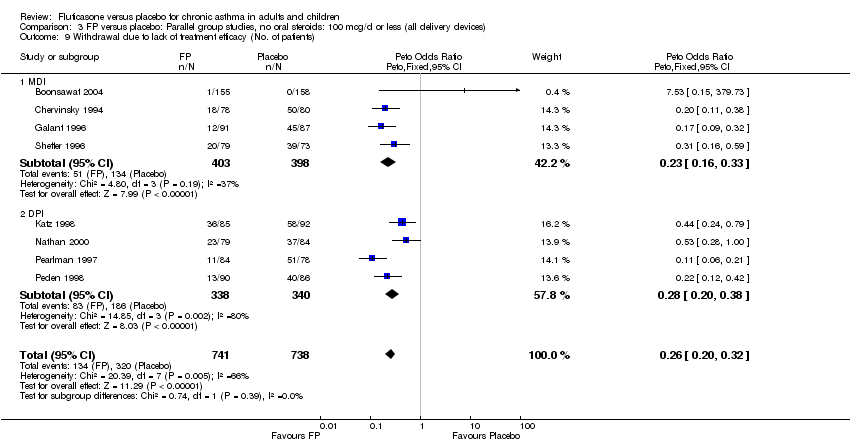
Comparison 3 FP versus placebo: Parallel group studies, no oral steroids: 100 mcg/d or less (all delivery devices), Outcome 9 Withdrawal due to lack of treatment efficacy (No. of patients).
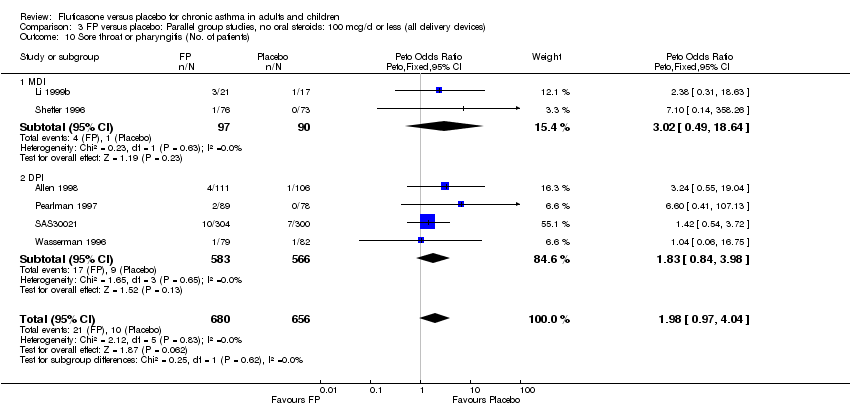
Comparison 3 FP versus placebo: Parallel group studies, no oral steroids: 100 mcg/d or less (all delivery devices), Outcome 10 Sore throat or pharyngitis (No. of patients).
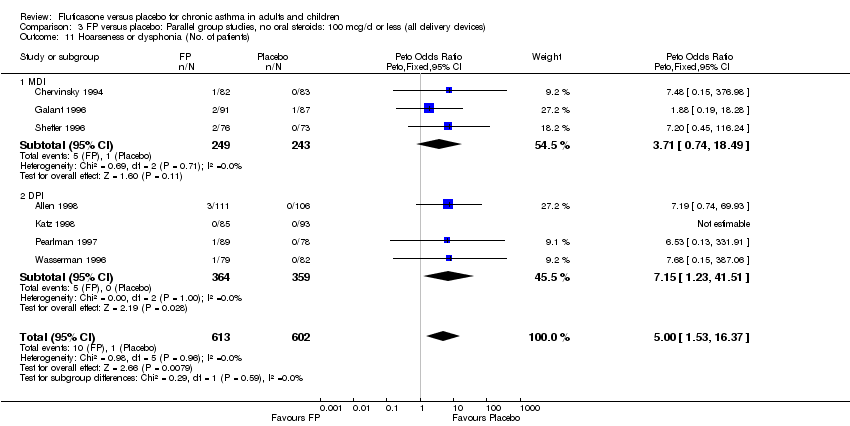
Comparison 3 FP versus placebo: Parallel group studies, no oral steroids: 100 mcg/d or less (all delivery devices), Outcome 11 Hoarseness or dysphonia (No. of patients).

Comparison 3 FP versus placebo: Parallel group studies, no oral steroids: 100 mcg/d or less (all delivery devices), Outcome 12 Oral Candidiasis (No. of patients).

Comparison 3 FP versus placebo: Parallel group studies, no oral steroids: 100 mcg/d or less (all delivery devices), Outcome 13 Withdrawals due to adverse events.
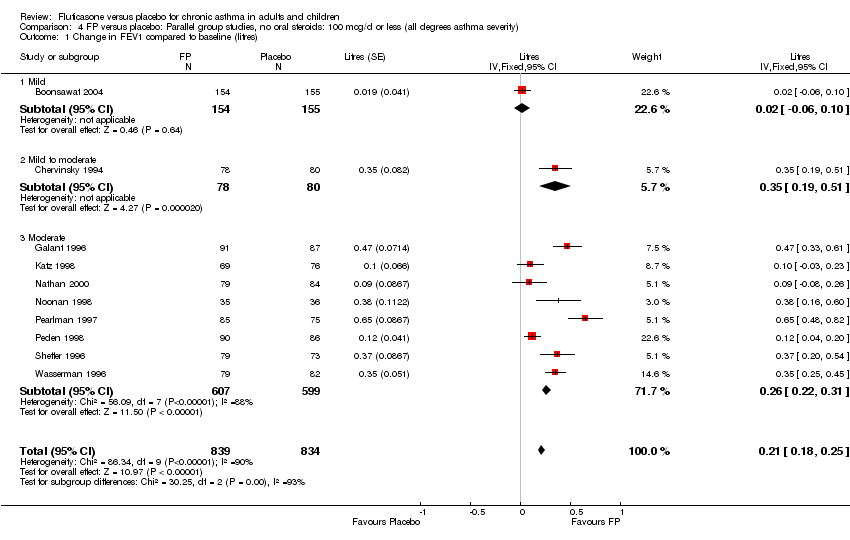
Comparison 4 FP versus placebo: Parallel group studies, no oral steroids: 100 mcg/d or less (all degrees asthma severity), Outcome 1 Change in FEV1 compared to baseline (litres).

Comparison 4 FP versus placebo: Parallel group studies, no oral steroids: 100 mcg/d or less (all degrees asthma severity), Outcome 2 Change in morning PEFR compared to baseline (L/min).
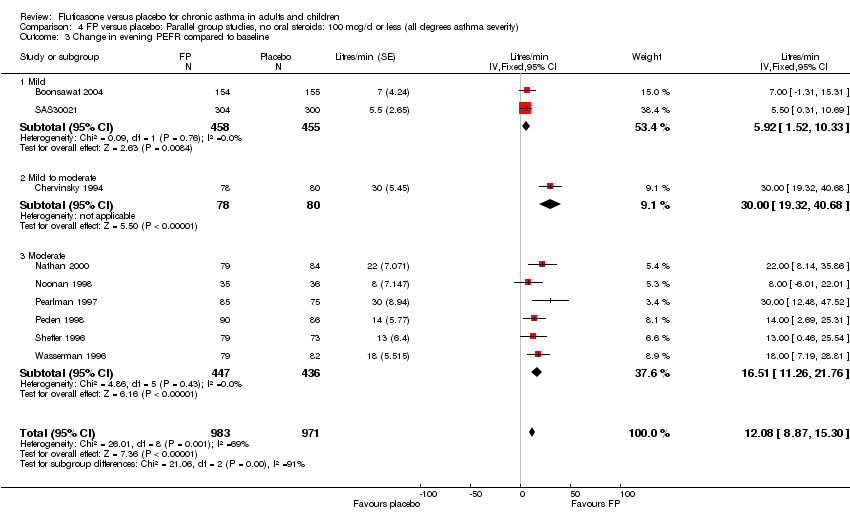
Comparison 4 FP versus placebo: Parallel group studies, no oral steroids: 100 mcg/d or less (all degrees asthma severity), Outcome 3 Change in evening PEFR compared to baseline.

Comparison 4 FP versus placebo: Parallel group studies, no oral steroids: 100 mcg/d or less (all degrees asthma severity), Outcome 7 Change in daily asthma symptom score compared to baseline.
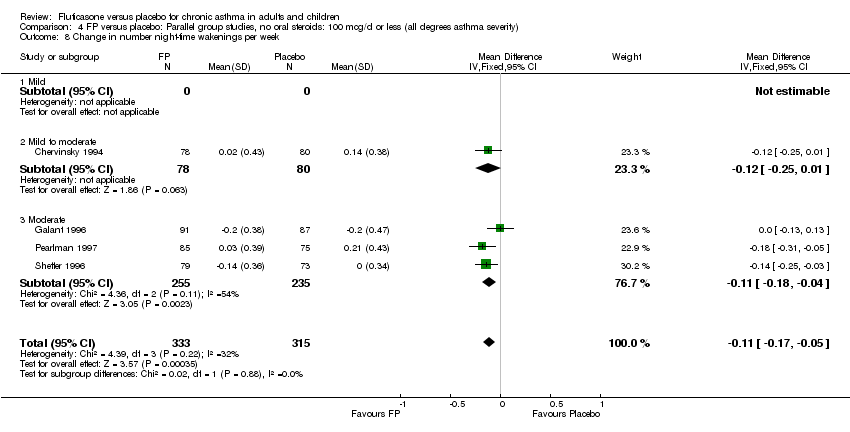
Comparison 4 FP versus placebo: Parallel group studies, no oral steroids: 100 mcg/d or less (all degrees asthma severity), Outcome 8 Change in number night‐time wakenings per week.
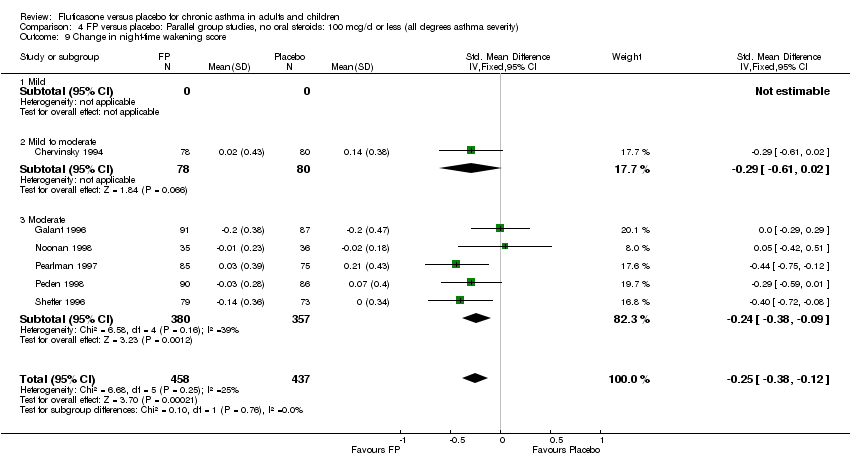
Comparison 4 FP versus placebo: Parallel group studies, no oral steroids: 100 mcg/d or less (all degrees asthma severity), Outcome 9 Change in night‐time wakening score.

Comparison 4 FP versus placebo: Parallel group studies, no oral steroids: 100 mcg/d or less (all degrees asthma severity), Outcome 10 Change in daily use of beta2 agonist compared to baseline (puffs/d).

Comparison 4 FP versus placebo: Parallel group studies, no oral steroids: 100 mcg/d or less (all degrees asthma severity), Outcome 16 Physician‐rated efficacy: effective or very effective.

Comparison 4 FP versus placebo: Parallel group studies, no oral steroids: 100 mcg/d or less (all degrees asthma severity), Outcome 18 Withdrawal due to lack of treatment efficacy (No. of patients).
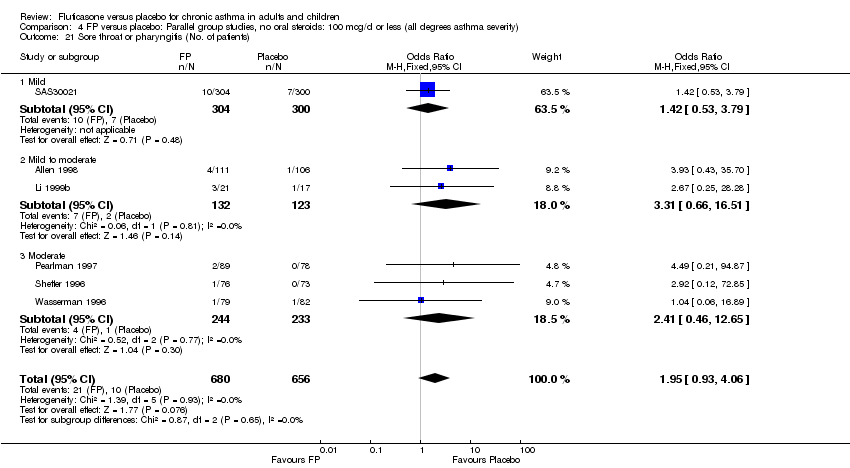
Comparison 4 FP versus placebo: Parallel group studies, no oral steroids: 100 mcg/d or less (all degrees asthma severity), Outcome 21 Sore throat or pharyngitis (No. of patients).

Comparison 4 FP versus placebo: Parallel group studies, no oral steroids: 100 mcg/d or less (all degrees asthma severity), Outcome 22 Hoarseness or dysphonia (No. of patients).

Comparison 4 FP versus placebo: Parallel group studies, no oral steroids: 100 mcg/d or less (all degrees asthma severity), Outcome 23 Oral Candidiasis (No. of patients).
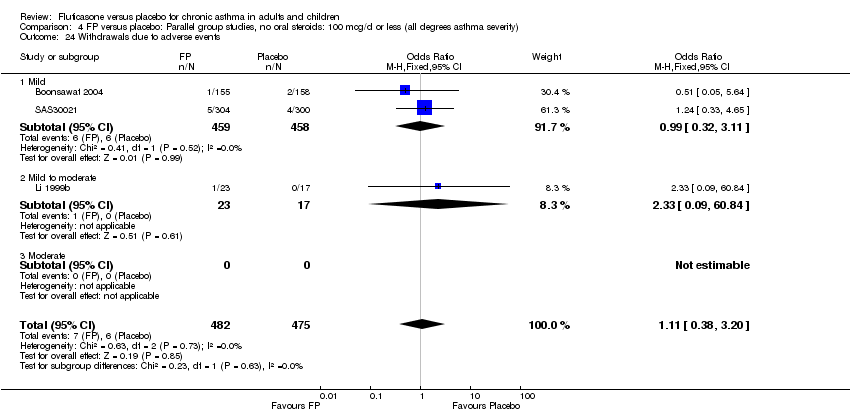
Comparison 4 FP versus placebo: Parallel group studies, no oral steroids: 100 mcg/d or less (all degrees asthma severity), Outcome 24 Withdrawals due to adverse events.

Comparison 5 FP versus placebo: Parallel group studies, no oral steroids: 200 mcg/d (all ages), Outcome 1 Change in FEV1 compared to baseline (litres).

Comparison 5 FP versus placebo: Parallel group studies, no oral steroids: 200 mcg/d (all ages), Outcome 2 Change in FEV1 compared to baseline (imputed estimates).

Comparison 5 FP versus placebo: Parallel group studies, no oral steroids: 200 mcg/d (all ages), Outcome 3 Change in FEV1 (% predicted).
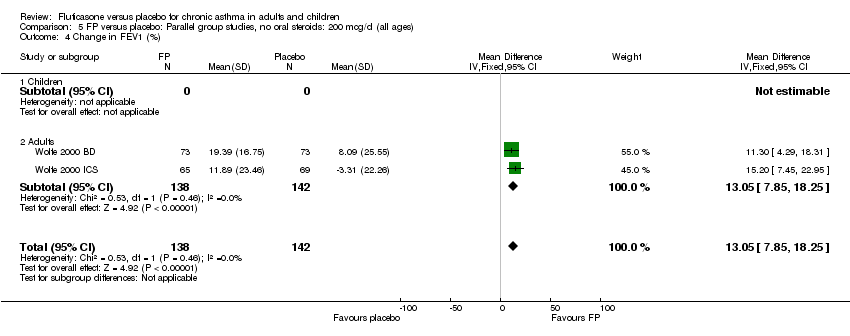
Comparison 5 FP versus placebo: Parallel group studies, no oral steroids: 200 mcg/d (all ages), Outcome 4 Change in FEV1 (%).
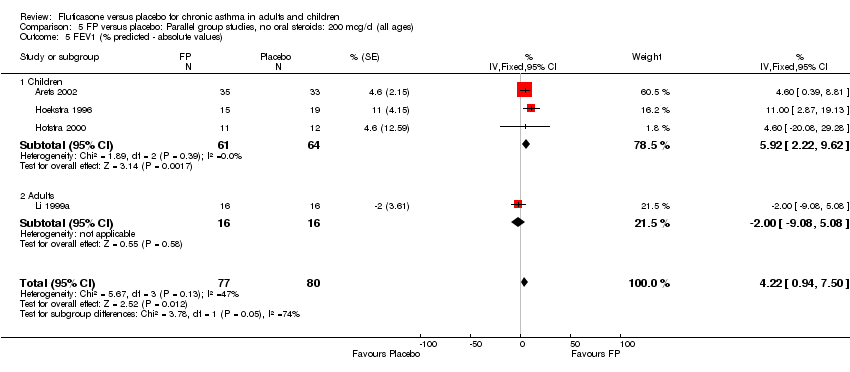
Comparison 5 FP versus placebo: Parallel group studies, no oral steroids: 200 mcg/d (all ages), Outcome 5 FEV1 (% predicted ‐ absolute values).

Comparison 5 FP versus placebo: Parallel group studies, no oral steroids: 200 mcg/d (all ages), Outcome 6 FEV1 (absolute values).

Comparison 5 FP versus placebo: Parallel group studies, no oral steroids: 200 mcg/d (all ages), Outcome 7 Change in morning PEFR compared with baseline.

Comparison 5 FP versus placebo: Parallel group studies, no oral steroids: 200 mcg/d (all ages), Outcome 8 Change in morning PEFR compared to baseline (L/min).

Comparison 5 FP versus placebo: Parallel group studies, no oral steroids: 200 mcg/d (all ages), Outcome 9 Mean change in am PEF (% predicted).
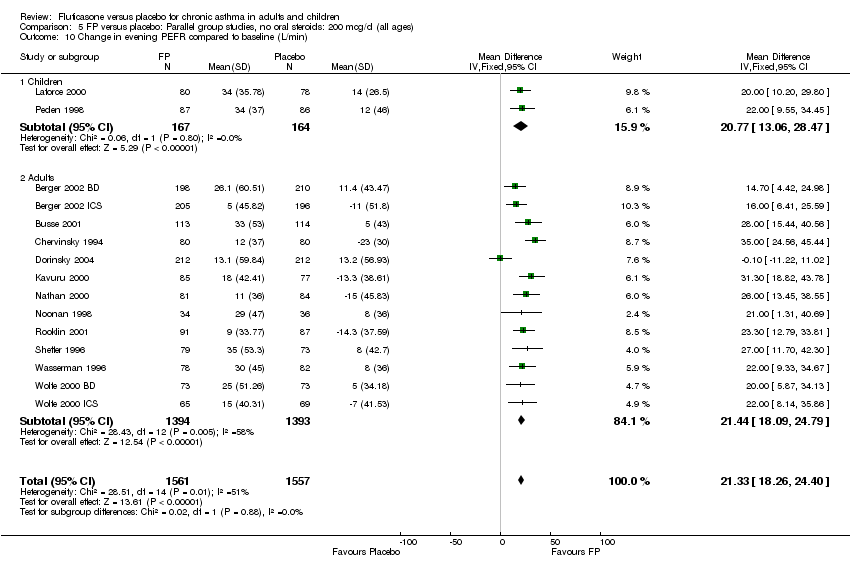
Comparison 5 FP versus placebo: Parallel group studies, no oral steroids: 200 mcg/d (all ages), Outcome 10 Change in evening PEFR compared to baseline (L/min).

Comparison 5 FP versus placebo: Parallel group studies, no oral steroids: 200 mcg/d (all ages), Outcome 11 Change in evening PEFR compared to baseline.
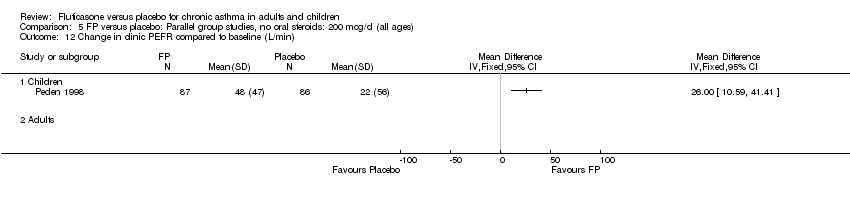
Comparison 5 FP versus placebo: Parallel group studies, no oral steroids: 200 mcg/d (all ages), Outcome 12 Change in clinic PEFR compared to baseline (L/min).
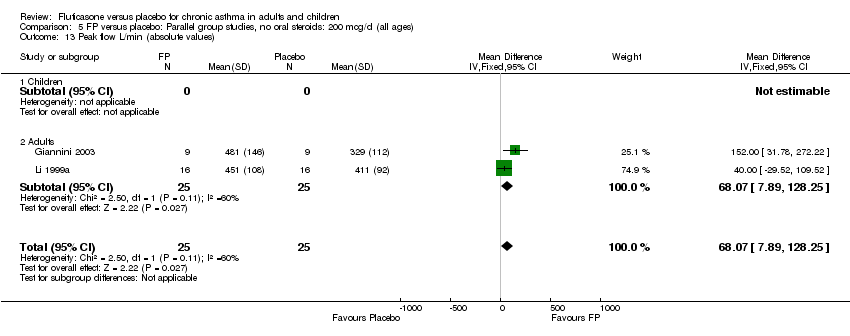
Comparison 5 FP versus placebo: Parallel group studies, no oral steroids: 200 mcg/d (all ages), Outcome 13 Peak flow L/min (absolute values).
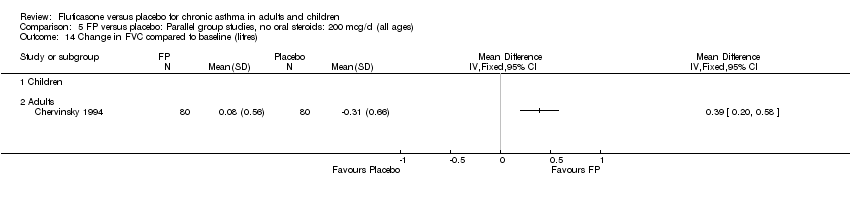
Comparison 5 FP versus placebo: Parallel group studies, no oral steroids: 200 mcg/d (all ages), Outcome 14 Change in FVC compared to baseline (litres).
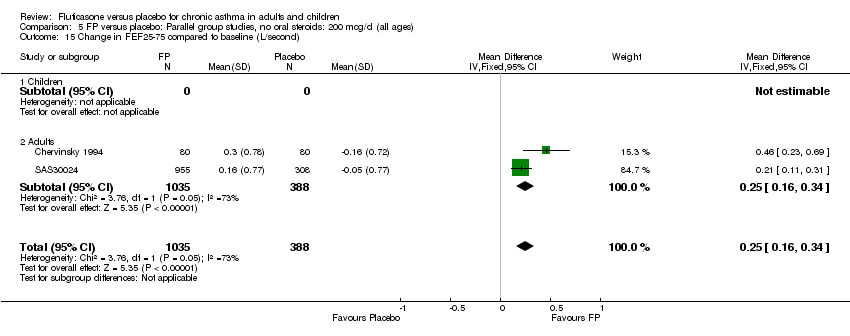
Comparison 5 FP versus placebo: Parallel group studies, no oral steroids: 200 mcg/d (all ages), Outcome 15 Change in FEF25‐75 compared to baseline (L/second).

Comparison 5 FP versus placebo: Parallel group studies, no oral steroids: 200 mcg/d (all ages), Outcome 16 Histamine BHR (log base 2 PC20 FEV1 mg/ml).

Comparison 5 FP versus placebo: Parallel group studies, no oral steroids: 200 mcg/d (all ages), Outcome 17 Change in daily asthma symptom score compared to baseline.

Comparison 5 FP versus placebo: Parallel group studies, no oral steroids: 200 mcg/d (all ages), Outcome 18 Change in night‐time wakening score.

Comparison 5 FP versus placebo: Parallel group studies, no oral steroids: 200 mcg/d (all ages), Outcome 19 Change in symptom free days.

Comparison 5 FP versus placebo: Parallel group studies, no oral steroids: 200 mcg/d (all ages), Outcome 20 Change from baseline in symptom free days (%).

Comparison 5 FP versus placebo: Parallel group studies, no oral steroids: 200 mcg/d (all ages), Outcome 21 Percentage nights without awakening ‐ change from baseline.

Comparison 5 FP versus placebo: Parallel group studies, no oral steroids: 200 mcg/d (all ages), Outcome 22 Change in number night‐time wakenings per week.

Comparison 5 FP versus placebo: Parallel group studies, no oral steroids: 200 mcg/d (all ages), Outcome 23 Change from baseline in nighttime awakenings/night.

Comparison 5 FP versus placebo: Parallel group studies, no oral steroids: 200 mcg/d (all ages), Outcome 24 Change in nocturnal awakenings (unspecified time).
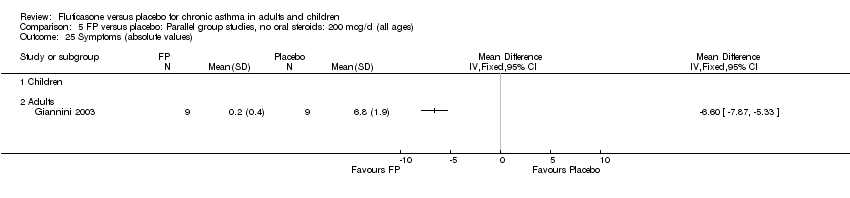
Comparison 5 FP versus placebo: Parallel group studies, no oral steroids: 200 mcg/d (all ages), Outcome 25 Symptoms (absolute values).
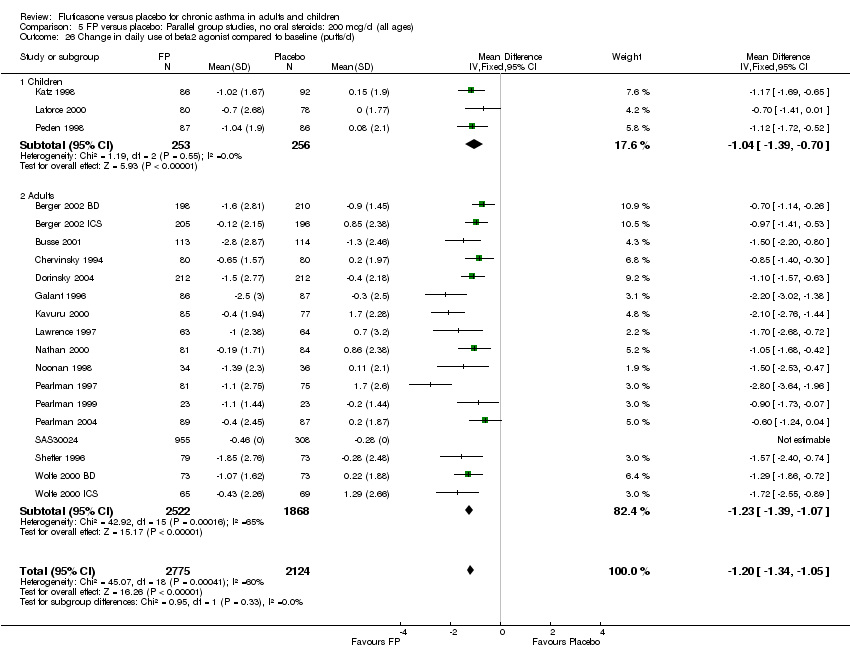
Comparison 5 FP versus placebo: Parallel group studies, no oral steroids: 200 mcg/d (all ages), Outcome 26 Change in daily use of beta2 agonist compared to baseline (puffs/d).

Comparison 5 FP versus placebo: Parallel group studies, no oral steroids: 200 mcg/d (all ages), Outcome 27 Change in daily use of beta2 agonist compared to baseline (puffs/d ‐ imputed estimates).

Comparison 5 FP versus placebo: Parallel group studies, no oral steroids: 200 mcg/d (all ages), Outcome 28 Change from baseline in rescue medication free days (%).

Comparison 5 FP versus placebo: Parallel group studies, no oral steroids: 200 mcg/d (all ages), Outcome 29 Rescue medication (absolute scores).

Comparison 5 FP versus placebo: Parallel group studies, no oral steroids: 200 mcg/d (all ages), Outcome 30 HRQOL: AQLQ (absolute socres).

Comparison 5 FP versus placebo: Parallel group studies, no oral steroids: 200 mcg/d (all ages), Outcome 31 HRQOL: Functional Status IIR questionaire (short version).

Comparison 5 FP versus placebo: Parallel group studies, no oral steroids: 200 mcg/d (all ages), Outcome 32 HRQOL: Quality of Life of Parents of Asthmatic Children questionnaire, burden dimension.

Comparison 5 FP versus placebo: Parallel group studies, no oral steroids: 200 mcg/d (all ages), Outcome 33 HRQOL: Quality of Life of Parents of Asthmatic Children questionnaire, subjective norms dimension.
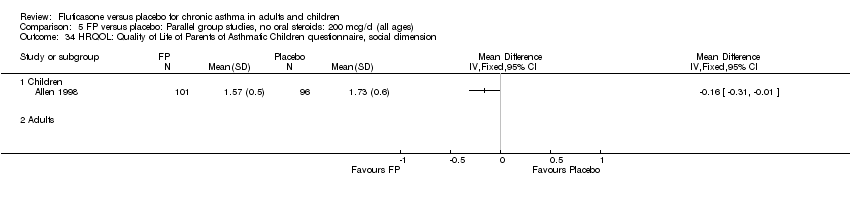
Comparison 5 FP versus placebo: Parallel group studies, no oral steroids: 200 mcg/d (all ages), Outcome 34 HRQOL: Quality of Life of Parents of Asthmatic Children questionnaire, social dimension.

Comparison 5 FP versus placebo: Parallel group studies, no oral steroids: 200 mcg/d (all ages), Outcome 35 HRQOL: Sleep Scale Children questionnaire.

Comparison 5 FP versus placebo: Parallel group studies, no oral steroids: 200 mcg/d (all ages), Outcome 36 Physician‐rated efficacy: effective or very effective (No. of patients).
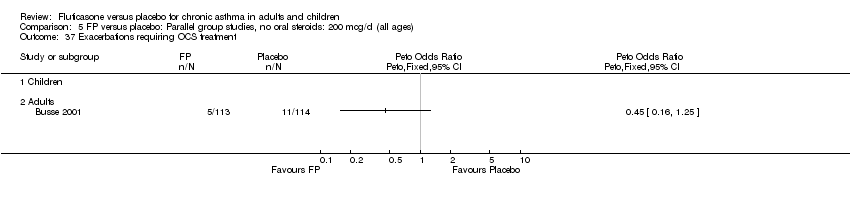
Comparison 5 FP versus placebo: Parallel group studies, no oral steroids: 200 mcg/d (all ages), Outcome 37 Exacerbations requiring OCS treatment.
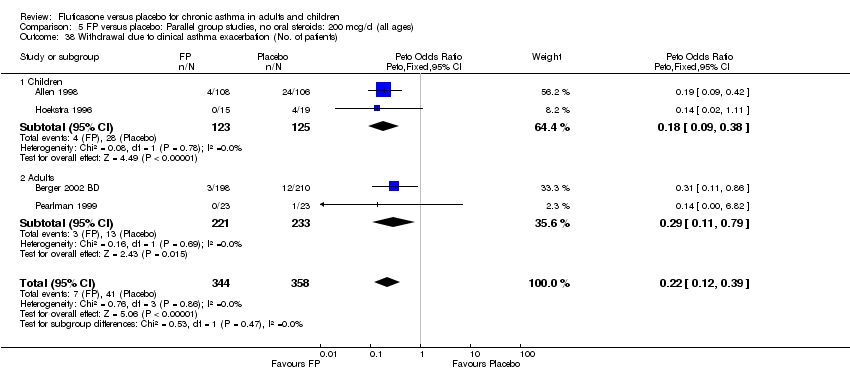
Comparison 5 FP versus placebo: Parallel group studies, no oral steroids: 200 mcg/d (all ages), Outcome 38 Withdrawal due to clinical asthma exacerbation (No. of patients).

Comparison 5 FP versus placebo: Parallel group studies, no oral steroids: 200 mcg/d (all ages), Outcome 39 Withdrawal due to lack of treatment efficacy (No. of patients).
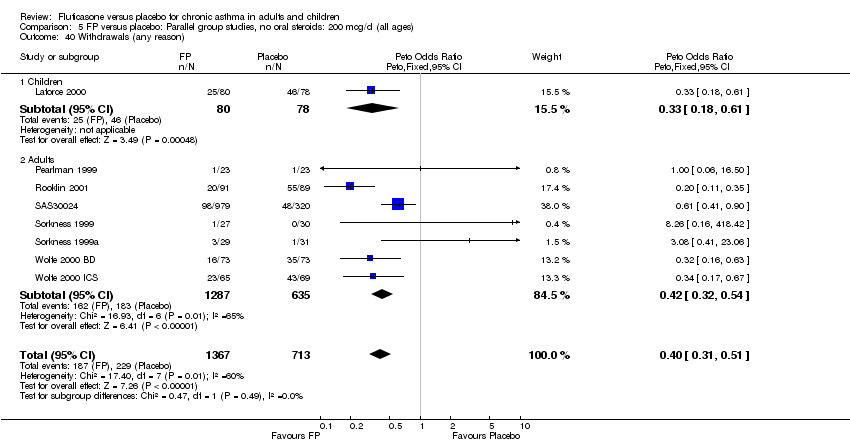
Comparison 5 FP versus placebo: Parallel group studies, no oral steroids: 200 mcg/d (all ages), Outcome 40 Withdrawals (any reason).
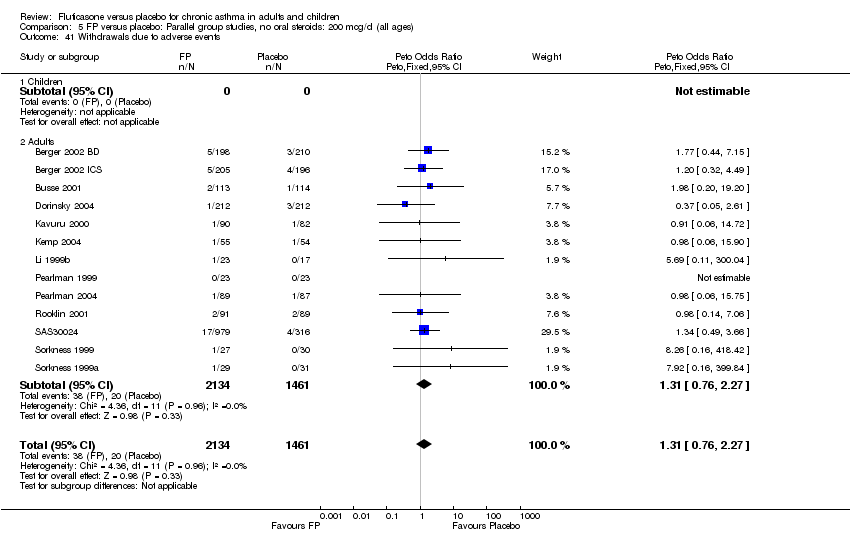
Comparison 5 FP versus placebo: Parallel group studies, no oral steroids: 200 mcg/d (all ages), Outcome 41 Withdrawals due to adverse events.

Comparison 5 FP versus placebo: Parallel group studies, no oral steroids: 200 mcg/d (all ages), Outcome 42 Adverse events (any).

Comparison 5 FP versus placebo: Parallel group studies, no oral steroids: 200 mcg/d (all ages), Outcome 43 Oral Candidiasis (No. of patients).
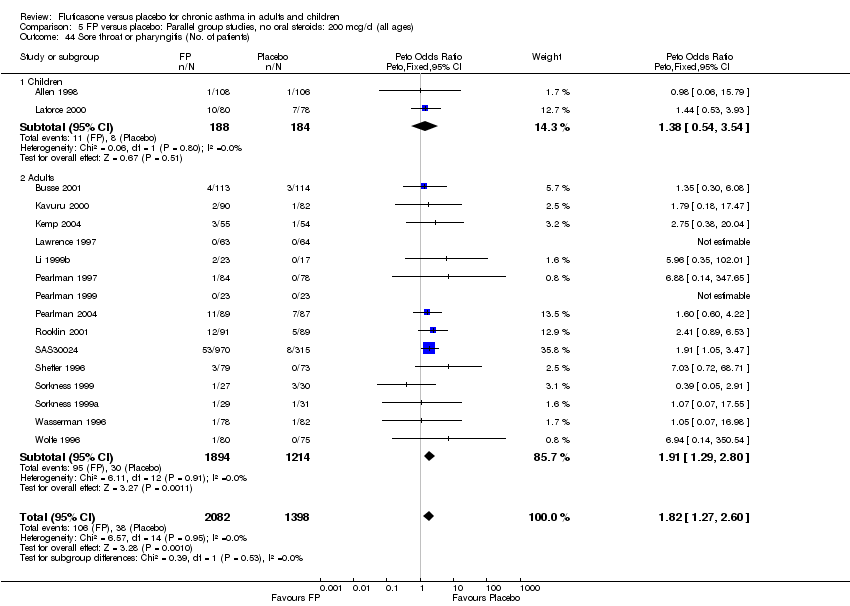
Comparison 5 FP versus placebo: Parallel group studies, no oral steroids: 200 mcg/d (all ages), Outcome 44 Sore throat or pharyngitis (No. of patients).

Comparison 5 FP versus placebo: Parallel group studies, no oral steroids: 200 mcg/d (all ages), Outcome 45 Headaches.
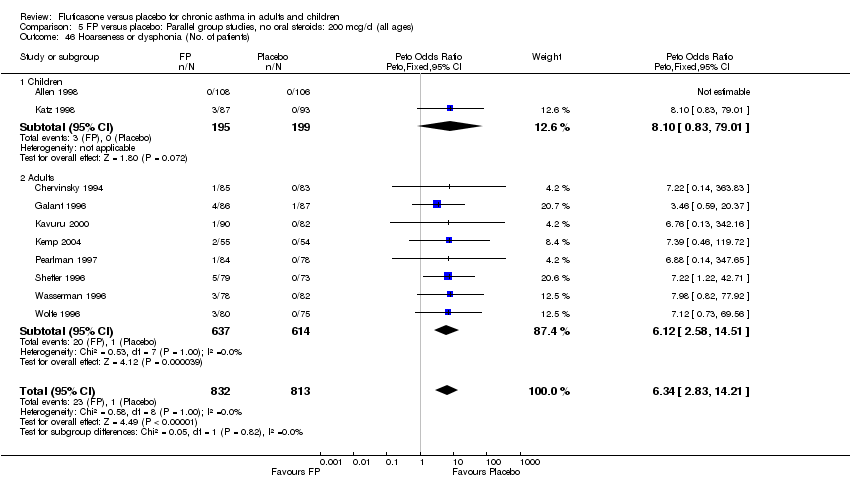
Comparison 5 FP versus placebo: Parallel group studies, no oral steroids: 200 mcg/d (all ages), Outcome 46 Hoarseness or dysphonia (No. of patients).
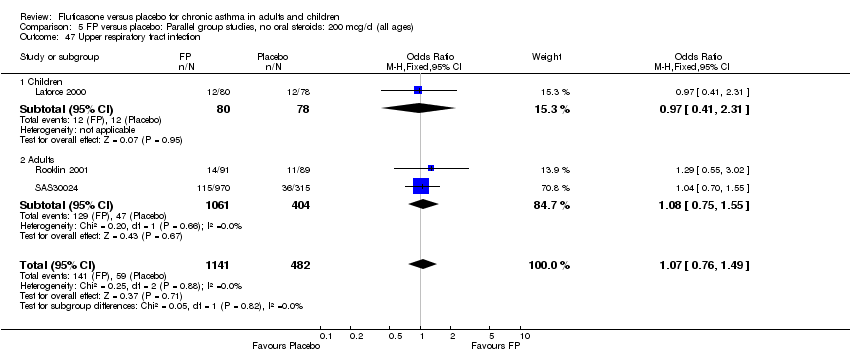
Comparison 5 FP versus placebo: Parallel group studies, no oral steroids: 200 mcg/d (all ages), Outcome 47 Upper respiratory tract infection.

Comparison 5 FP versus placebo: Parallel group studies, no oral steroids: 200 mcg/d (all ages), Outcome 48 Sinusitis.

Comparison 5 FP versus placebo: Parallel group studies, no oral steroids: 200 mcg/d (all ages), Outcome 49 Total urinary free cortisol excretion (mcg/24 hours).
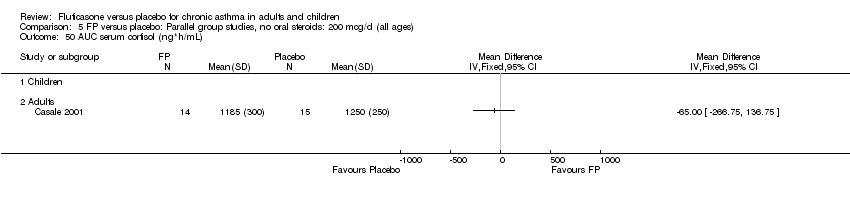
Comparison 5 FP versus placebo: Parallel group studies, no oral steroids: 200 mcg/d (all ages), Outcome 50 AUC serum cortisol (ng*h/mL).

Comparison 5 FP versus placebo: Parallel group studies, no oral steroids: 200 mcg/d (all ages), Outcome 51 Morning plasma cortisol (mcg/dL).
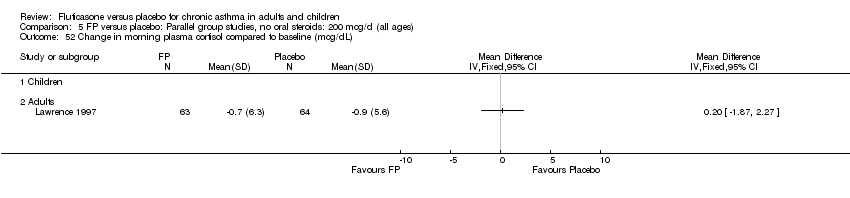
Comparison 5 FP versus placebo: Parallel group studies, no oral steroids: 200 mcg/d (all ages), Outcome 52 Change in morning plasma cortisol compared to baseline (mcg/dL).

Comparison 5 FP versus placebo: Parallel group studies, no oral steroids: 200 mcg/d (all ages), Outcome 53 Change in peak plasma cortisol expression (mcg/dL).
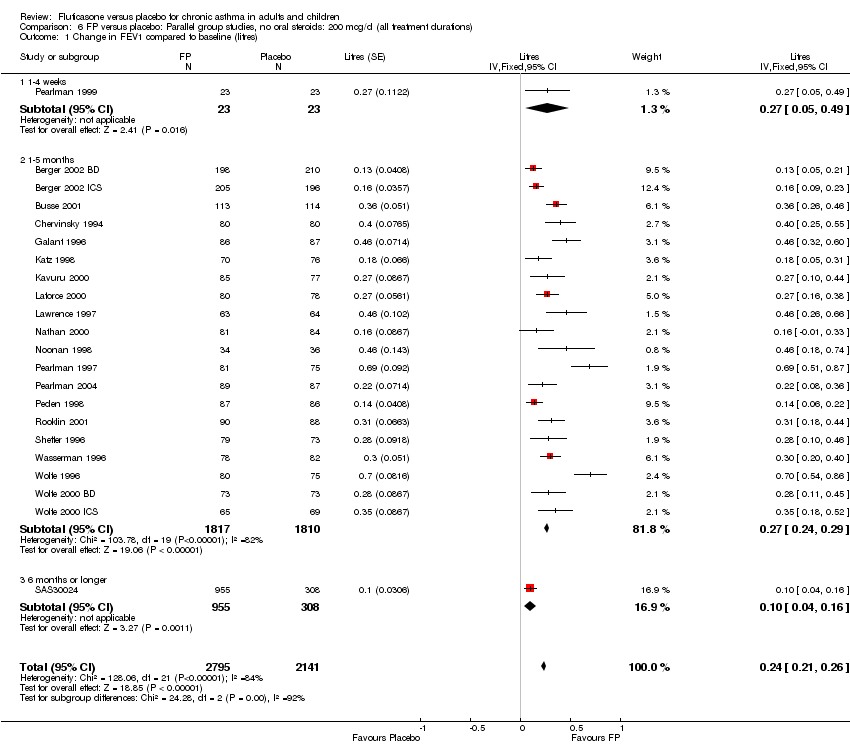
Comparison 6 FP versus placebo: Parallel group studies, no oral steroids: 200 mcg/d (all treatment durations), Outcome 1 Change in FEV1 compared to baseline (litres).

Comparison 6 FP versus placebo: Parallel group studies, no oral steroids: 200 mcg/d (all treatment durations), Outcome 2 Change in FEV1 (% predicted).

Comparison 6 FP versus placebo: Parallel group studies, no oral steroids: 200 mcg/d (all treatment durations), Outcome 3 Change in morning PEFR compared with baseline.

Comparison 6 FP versus placebo: Parallel group studies, no oral steroids: 200 mcg/d (all treatment durations), Outcome 4 Change in evening PEFR compared to baseline.

Comparison 6 FP versus placebo: Parallel group studies, no oral steroids: 200 mcg/d (all treatment durations), Outcome 5 Change in daily use of beta2 agonist compared to baseline (puffs/d).

Comparison 6 FP versus placebo: Parallel group studies, no oral steroids: 200 mcg/d (all treatment durations), Outcome 6 HRQOL: AQLQ.
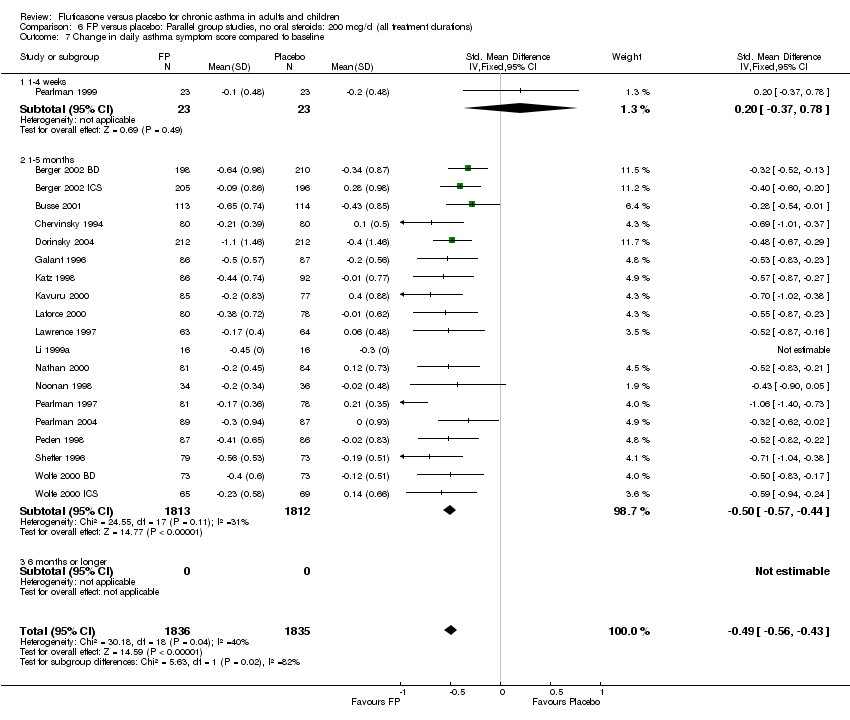
Comparison 6 FP versus placebo: Parallel group studies, no oral steroids: 200 mcg/d (all treatment durations), Outcome 7 Change in daily asthma symptom score compared to baseline.
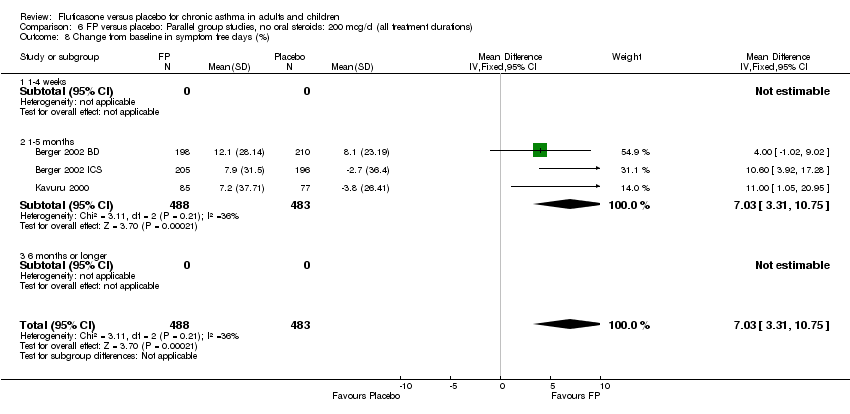
Comparison 6 FP versus placebo: Parallel group studies, no oral steroids: 200 mcg/d (all treatment durations), Outcome 8 Change from baseline in symptom free days (%).

Comparison 6 FP versus placebo: Parallel group studies, no oral steroids: 200 mcg/d (all treatment durations), Outcome 9 Change in night‐time wakening score.
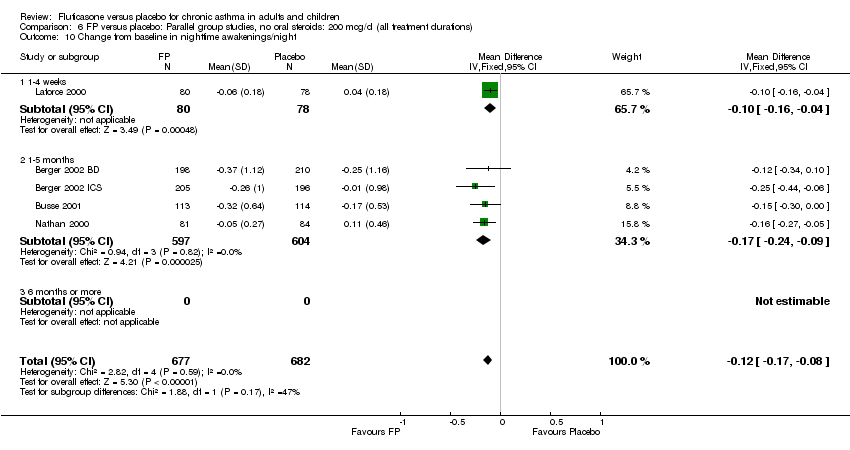
Comparison 6 FP versus placebo: Parallel group studies, no oral steroids: 200 mcg/d (all treatment durations), Outcome 10 Change from baseline in nighttime awakenings/night.

Comparison 6 FP versus placebo: Parallel group studies, no oral steroids: 200 mcg/d (all treatment durations), Outcome 11 Change in number night‐time wakenings per week.
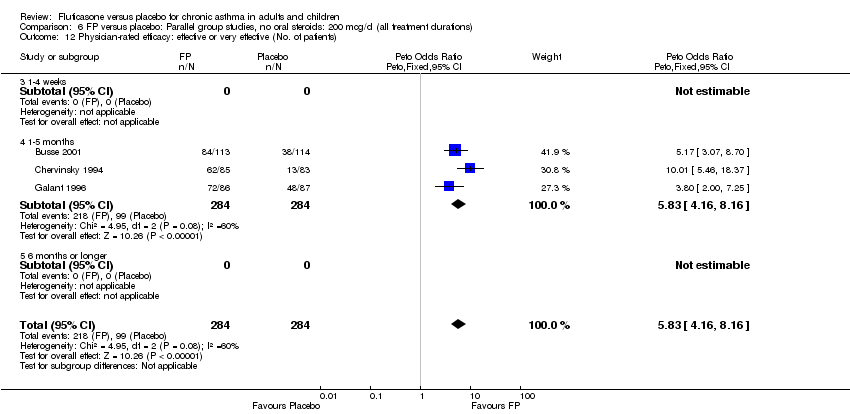
Comparison 6 FP versus placebo: Parallel group studies, no oral steroids: 200 mcg/d (all treatment durations), Outcome 12 Physician‐rated efficacy: effective or very effective (No. of patients).

Comparison 6 FP versus placebo: Parallel group studies, no oral steroids: 200 mcg/d (all treatment durations), Outcome 13 Withdrawal due to clinical asthma exacerbation (No. of patients).
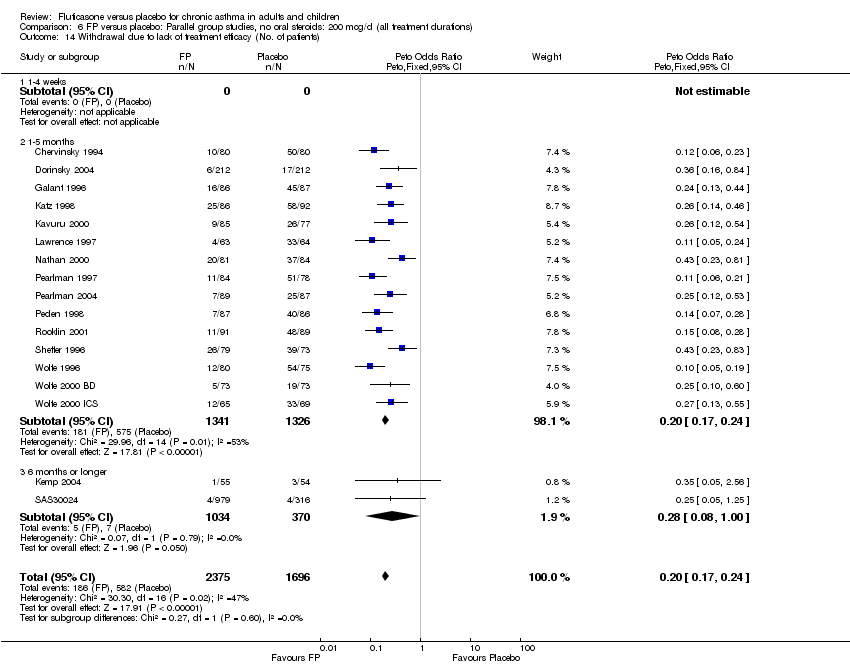
Comparison 6 FP versus placebo: Parallel group studies, no oral steroids: 200 mcg/d (all treatment durations), Outcome 14 Withdrawal due to lack of treatment efficacy (No. of patients).

Comparison 6 FP versus placebo: Parallel group studies, no oral steroids: 200 mcg/d (all treatment durations), Outcome 15 Withdrawals due to adverse events.
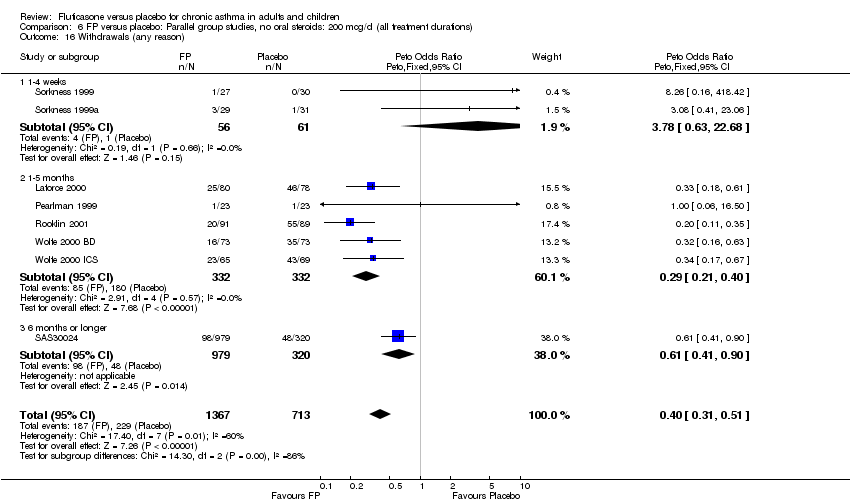
Comparison 6 FP versus placebo: Parallel group studies, no oral steroids: 200 mcg/d (all treatment durations), Outcome 16 Withdrawals (any reason).
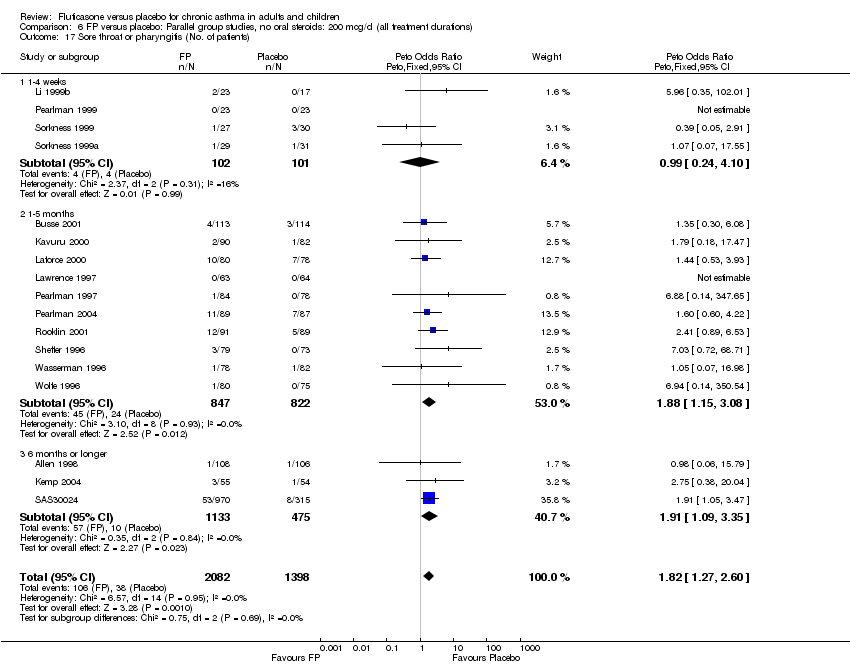
Comparison 6 FP versus placebo: Parallel group studies, no oral steroids: 200 mcg/d (all treatment durations), Outcome 17 Sore throat or pharyngitis (No. of patients).

Comparison 6 FP versus placebo: Parallel group studies, no oral steroids: 200 mcg/d (all treatment durations), Outcome 18 Hoarseness or dysphonia (No. of patients).

Comparison 6 FP versus placebo: Parallel group studies, no oral steroids: 200 mcg/d (all treatment durations), Outcome 19 Oral Candidiasis (No. of patients).
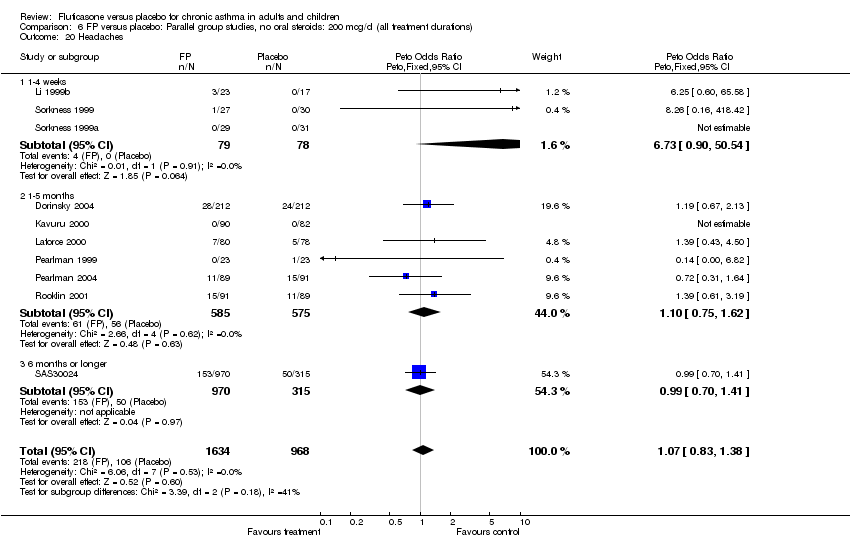
Comparison 6 FP versus placebo: Parallel group studies, no oral steroids: 200 mcg/d (all treatment durations), Outcome 20 Headaches.

Comparison 6 FP versus placebo: Parallel group studies, no oral steroids: 200 mcg/d (all treatment durations), Outcome 21 Sinusitis.

Comparison 7 FP versus placebo: Parallel group studies, no oral steroids: 200 mcg/d (all delivery devices), Outcome 1 Change in FEV1 compared to baseline (litres).
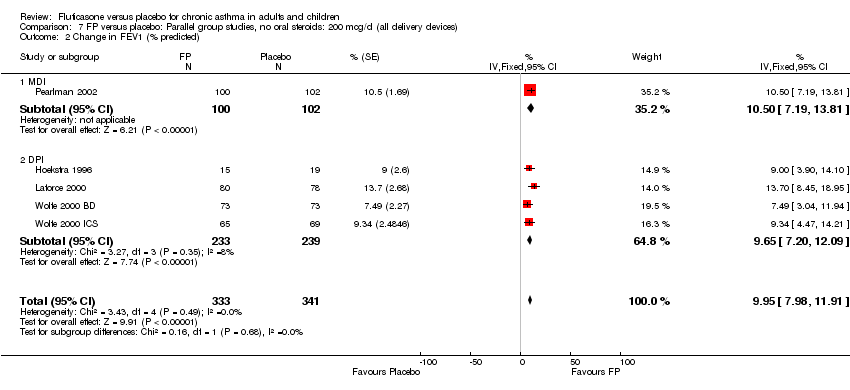
Comparison 7 FP versus placebo: Parallel group studies, no oral steroids: 200 mcg/d (all delivery devices), Outcome 2 Change in FEV1 (% predicted).
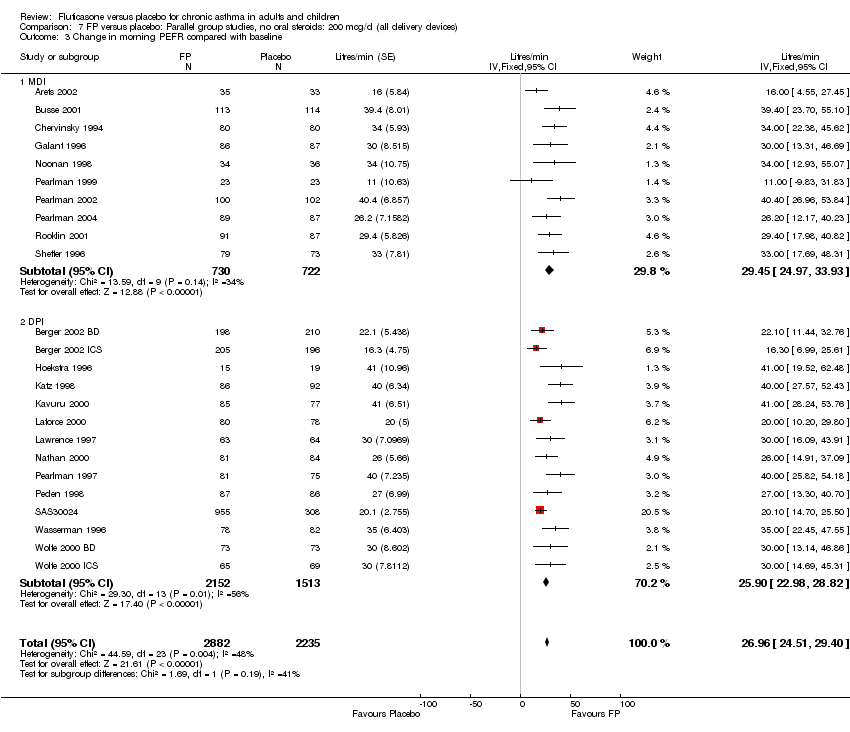
Comparison 7 FP versus placebo: Parallel group studies, no oral steroids: 200 mcg/d (all delivery devices), Outcome 3 Change in morning PEFR compared with baseline.
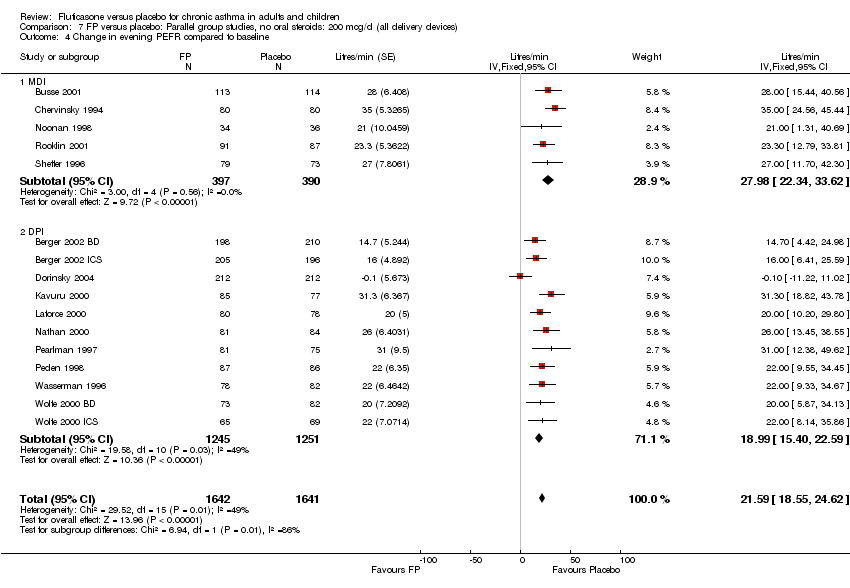
Comparison 7 FP versus placebo: Parallel group studies, no oral steroids: 200 mcg/d (all delivery devices), Outcome 4 Change in evening PEFR compared to baseline.
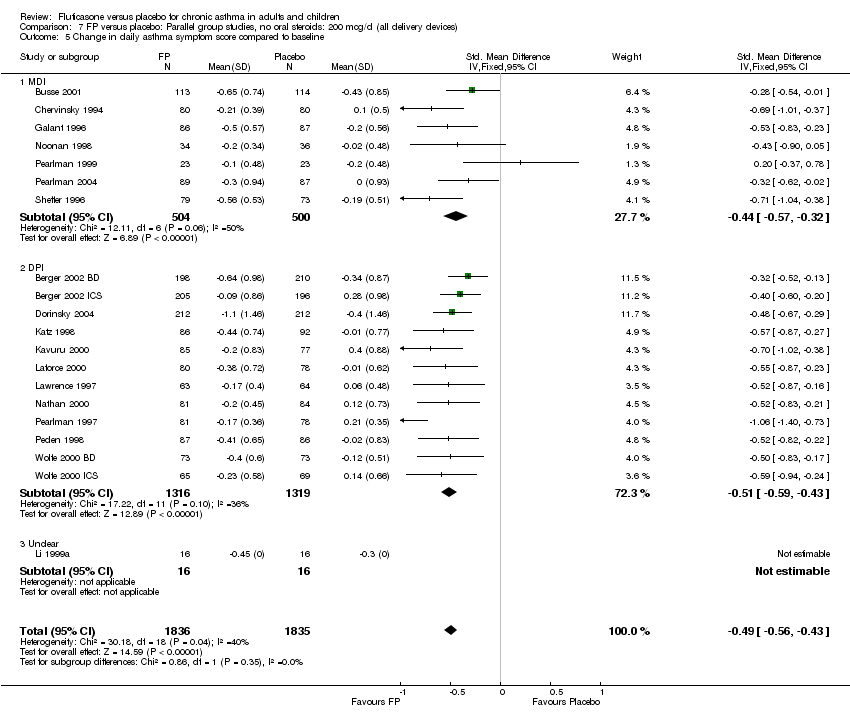
Comparison 7 FP versus placebo: Parallel group studies, no oral steroids: 200 mcg/d (all delivery devices), Outcome 5 Change in daily asthma symptom score compared to baseline.
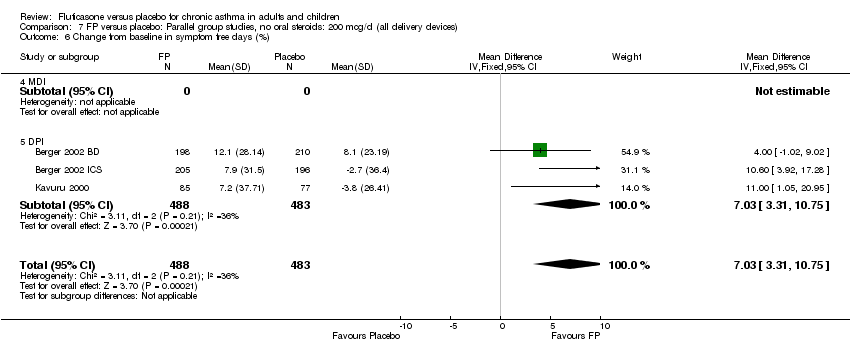
Comparison 7 FP versus placebo: Parallel group studies, no oral steroids: 200 mcg/d (all delivery devices), Outcome 6 Change from baseline in symptom free days (%).

Comparison 7 FP versus placebo: Parallel group studies, no oral steroids: 200 mcg/d (all delivery devices), Outcome 7 Change from baseline in nighttime awakenings/night.

Comparison 7 FP versus placebo: Parallel group studies, no oral steroids: 200 mcg/d (all delivery devices), Outcome 8 Change in number night‐time wakenings per week.

Comparison 7 FP versus placebo: Parallel group studies, no oral steroids: 200 mcg/d (all delivery devices), Outcome 9 Change in night‐time wakening score.
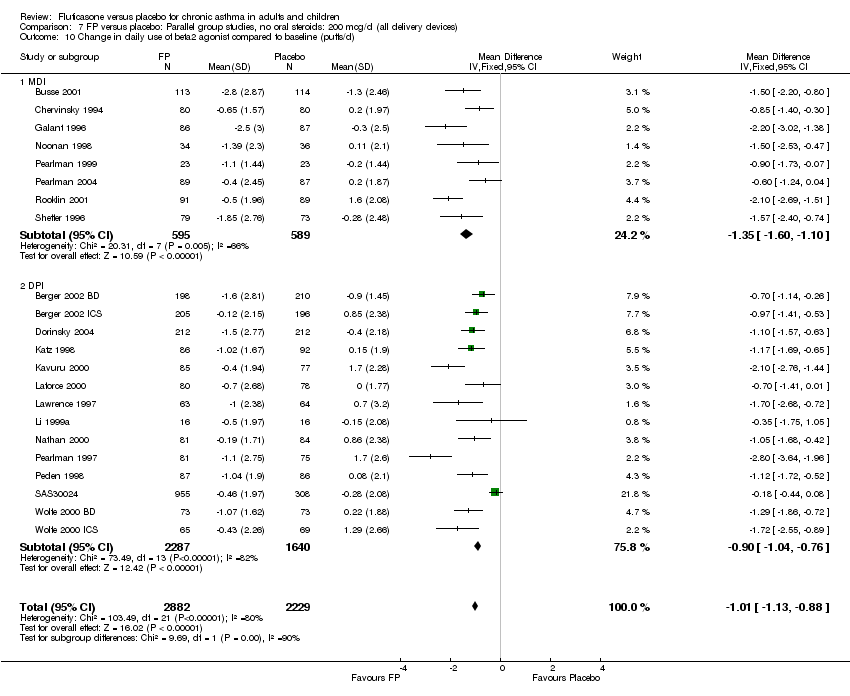
Comparison 7 FP versus placebo: Parallel group studies, no oral steroids: 200 mcg/d (all delivery devices), Outcome 10 Change in daily use of beta2 agonist compared to baseline (puffs/d).
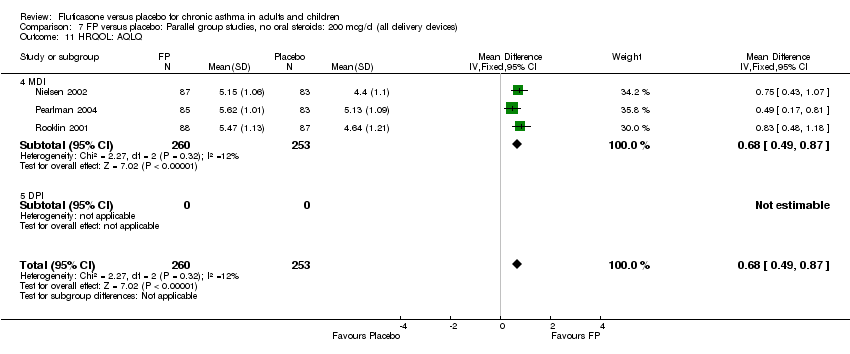
Comparison 7 FP versus placebo: Parallel group studies, no oral steroids: 200 mcg/d (all delivery devices), Outcome 11 HRQOL: AQLQ.

Comparison 7 FP versus placebo: Parallel group studies, no oral steroids: 200 mcg/d (all delivery devices), Outcome 12 Physician‐rated efficacy: effective or very effective (No. of patients).
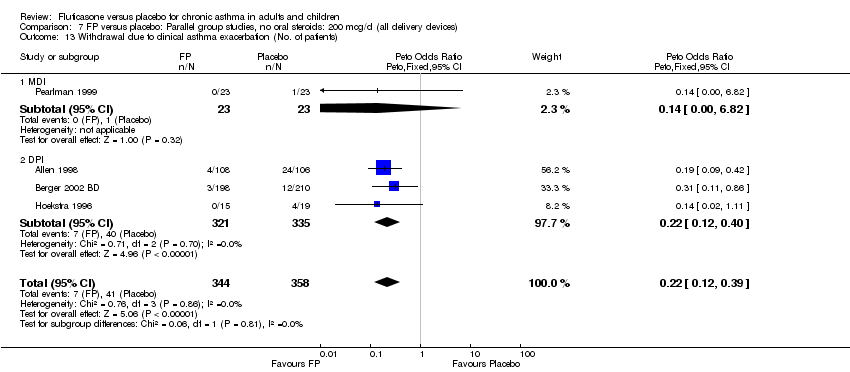
Comparison 7 FP versus placebo: Parallel group studies, no oral steroids: 200 mcg/d (all delivery devices), Outcome 13 Withdrawal due to clinical asthma exacerbation (No. of patients).

Comparison 7 FP versus placebo: Parallel group studies, no oral steroids: 200 mcg/d (all delivery devices), Outcome 14 Withdrawal due to lack of treatment efficacy (No. of patients).

Comparison 7 FP versus placebo: Parallel group studies, no oral steroids: 200 mcg/d (all delivery devices), Outcome 15 Withdrawals due to adverse events.

Comparison 7 FP versus placebo: Parallel group studies, no oral steroids: 200 mcg/d (all delivery devices), Outcome 16 Withdrawals (any reason).

Comparison 7 FP versus placebo: Parallel group studies, no oral steroids: 200 mcg/d (all delivery devices), Outcome 17 Sore throat or pharyngitis (No. of patients).

Comparison 7 FP versus placebo: Parallel group studies, no oral steroids: 200 mcg/d (all delivery devices), Outcome 18 Hoarseness or dysphonia (No. of patients).
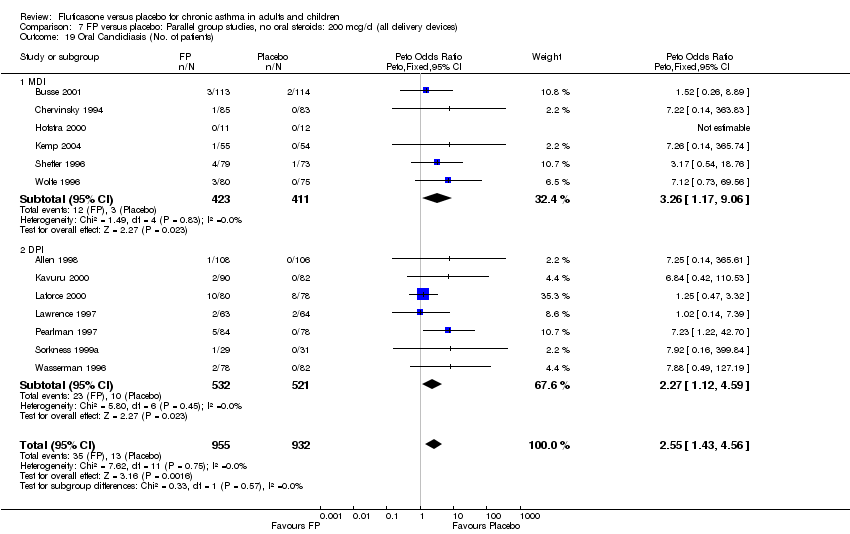
Comparison 7 FP versus placebo: Parallel group studies, no oral steroids: 200 mcg/d (all delivery devices), Outcome 19 Oral Candidiasis (No. of patients).

Comparison 7 FP versus placebo: Parallel group studies, no oral steroids: 200 mcg/d (all delivery devices), Outcome 20 Headaches.

Comparison 7 FP versus placebo: Parallel group studies, no oral steroids: 200 mcg/d (all delivery devices), Outcome 21 Sinusitis.
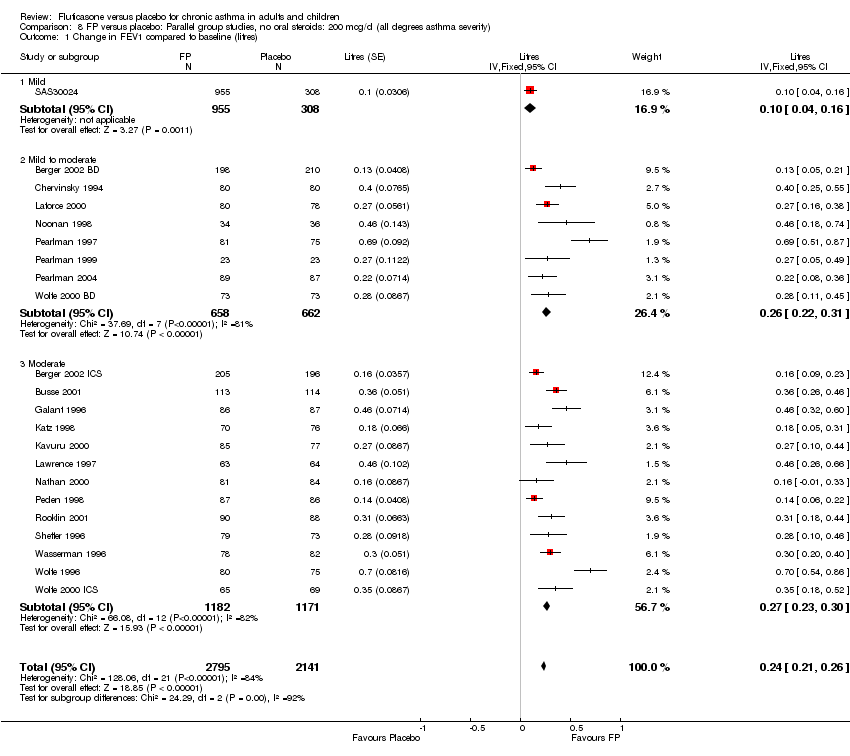
Comparison 8 FP versus placebo: Parallel group studies, no oral steroids: 200 mcg/d (all degrees asthma severity), Outcome 1 Change in FEV1 compared to baseline (litres).

Comparison 8 FP versus placebo: Parallel group studies, no oral steroids: 200 mcg/d (all degrees asthma severity), Outcome 2 Change in FEV1 (% predicted).
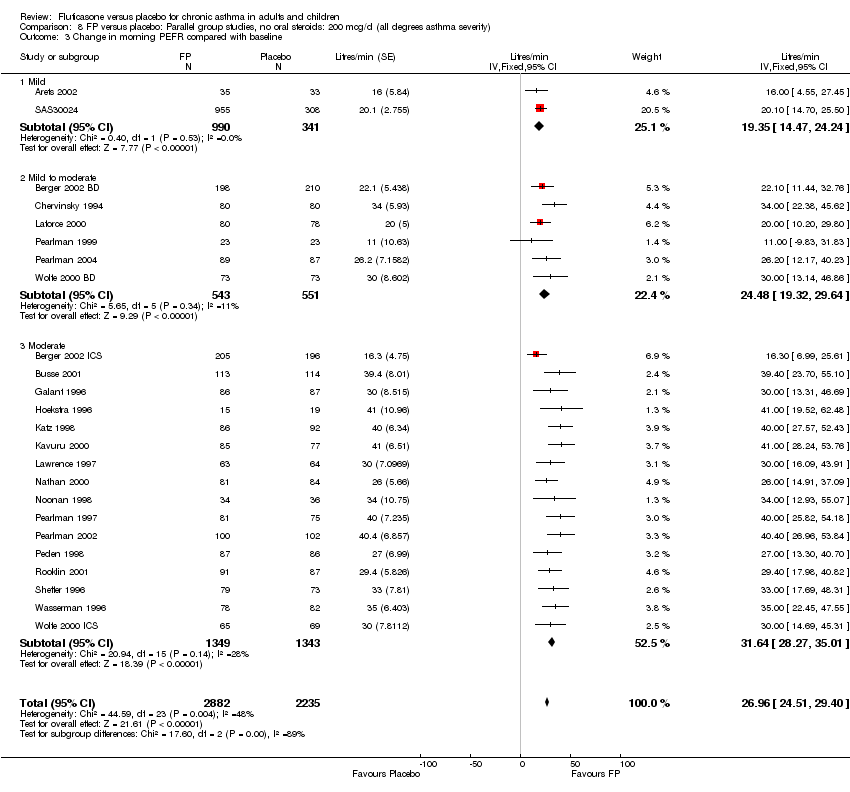
Comparison 8 FP versus placebo: Parallel group studies, no oral steroids: 200 mcg/d (all degrees asthma severity), Outcome 3 Change in morning PEFR compared with baseline.

Comparison 8 FP versus placebo: Parallel group studies, no oral steroids: 200 mcg/d (all degrees asthma severity), Outcome 4 Change in evening PEFR compared to baseline.

Comparison 8 FP versus placebo: Parallel group studies, no oral steroids: 200 mcg/d (all degrees asthma severity), Outcome 5 Change in daily asthma symptom score compared to baseline.
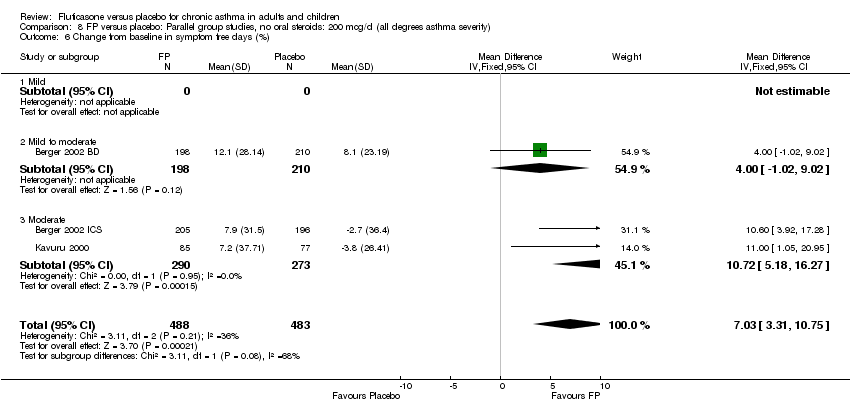
Comparison 8 FP versus placebo: Parallel group studies, no oral steroids: 200 mcg/d (all degrees asthma severity), Outcome 6 Change from baseline in symptom free days (%).
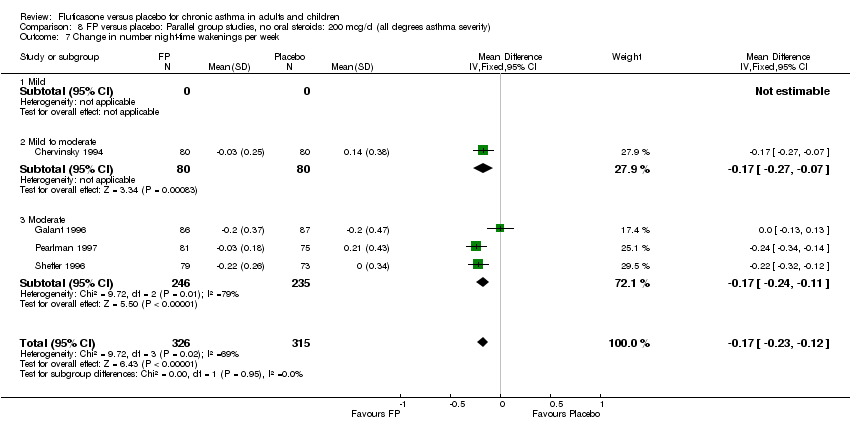
Comparison 8 FP versus placebo: Parallel group studies, no oral steroids: 200 mcg/d (all degrees asthma severity), Outcome 7 Change in number night‐time wakenings per week.

Comparison 8 FP versus placebo: Parallel group studies, no oral steroids: 200 mcg/d (all degrees asthma severity), Outcome 8 Change from baseline in nighttime awakenings/night.

Comparison 8 FP versus placebo: Parallel group studies, no oral steroids: 200 mcg/d (all degrees asthma severity), Outcome 9 Change in night‐time wakening score.
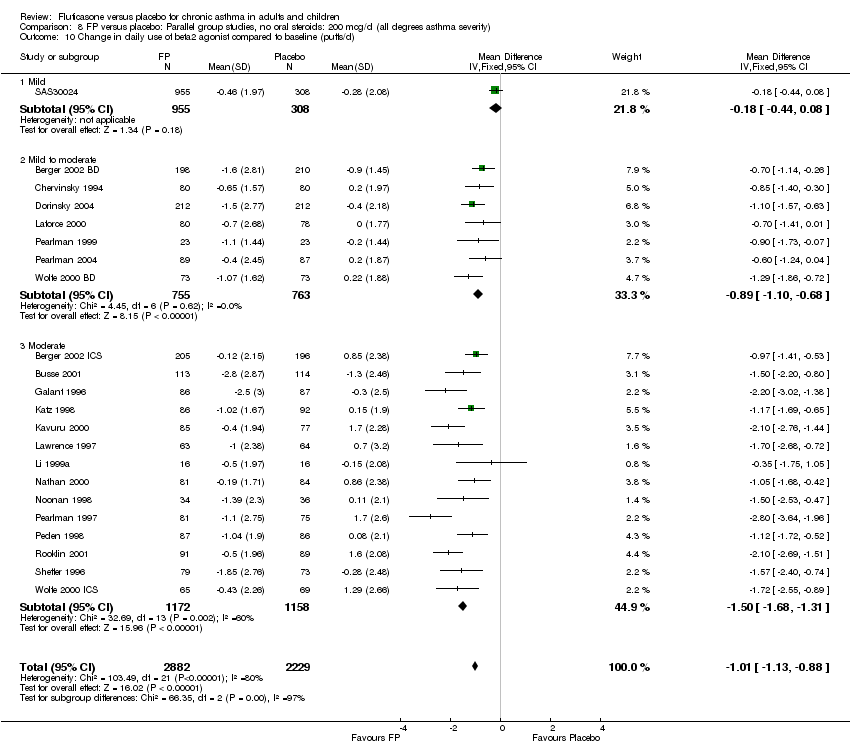
Comparison 8 FP versus placebo: Parallel group studies, no oral steroids: 200 mcg/d (all degrees asthma severity), Outcome 10 Change in daily use of beta2 agonist compared to baseline (puffs/d).

Comparison 8 FP versus placebo: Parallel group studies, no oral steroids: 200 mcg/d (all degrees asthma severity), Outcome 11 HRQOL: AQLQ.

Comparison 8 FP versus placebo: Parallel group studies, no oral steroids: 200 mcg/d (all degrees asthma severity), Outcome 12 Physician‐rated efficacy: effective or very effective (No. of patients).

Comparison 8 FP versus placebo: Parallel group studies, no oral steroids: 200 mcg/d (all degrees asthma severity), Outcome 13 Withdrawal due to clinical asthma exacerbation (No. of patients).
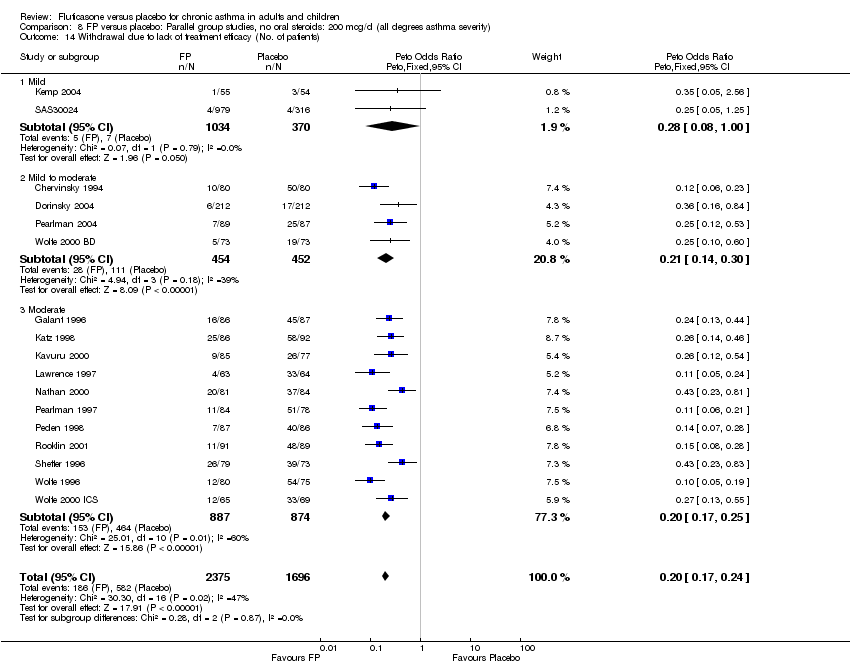
Comparison 8 FP versus placebo: Parallel group studies, no oral steroids: 200 mcg/d (all degrees asthma severity), Outcome 14 Withdrawal due to lack of treatment efficacy (No. of patients).

Comparison 8 FP versus placebo: Parallel group studies, no oral steroids: 200 mcg/d (all degrees asthma severity), Outcome 15 Withdrawals due to adverse events.
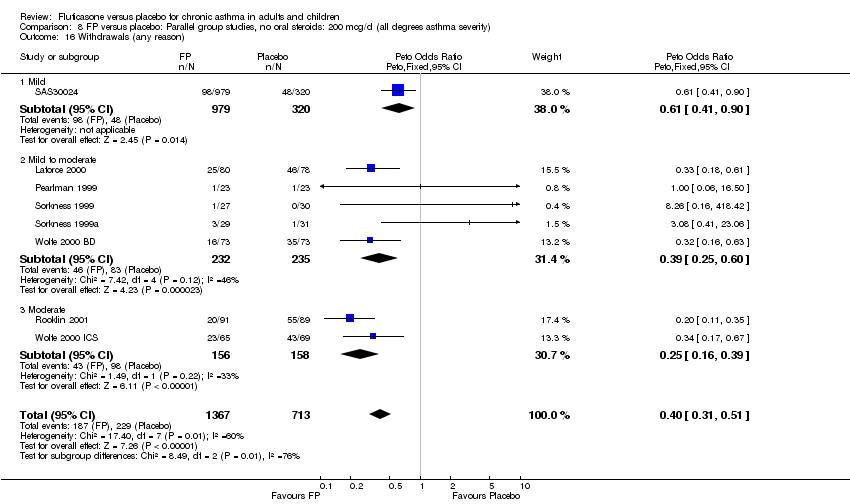
Comparison 8 FP versus placebo: Parallel group studies, no oral steroids: 200 mcg/d (all degrees asthma severity), Outcome 16 Withdrawals (any reason).
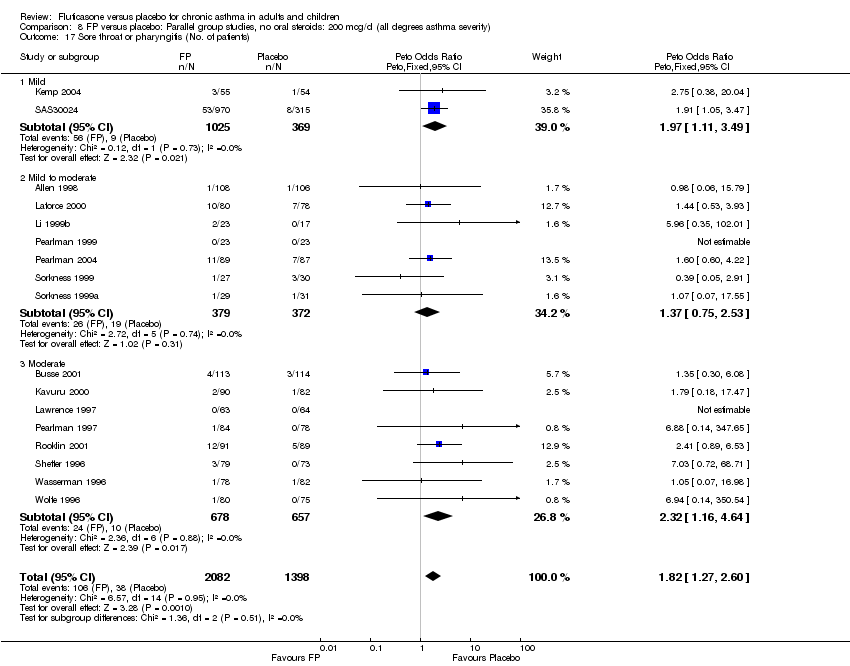
Comparison 8 FP versus placebo: Parallel group studies, no oral steroids: 200 mcg/d (all degrees asthma severity), Outcome 17 Sore throat or pharyngitis (No. of patients).
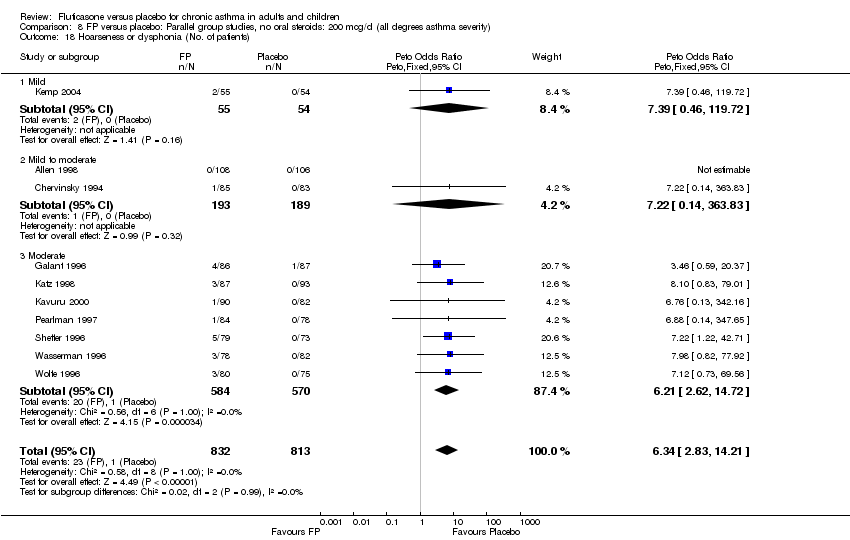
Comparison 8 FP versus placebo: Parallel group studies, no oral steroids: 200 mcg/d (all degrees asthma severity), Outcome 18 Hoarseness or dysphonia (No. of patients).

Comparison 8 FP versus placebo: Parallel group studies, no oral steroids: 200 mcg/d (all degrees asthma severity), Outcome 19 Oral Candidiasis (No. of patients).
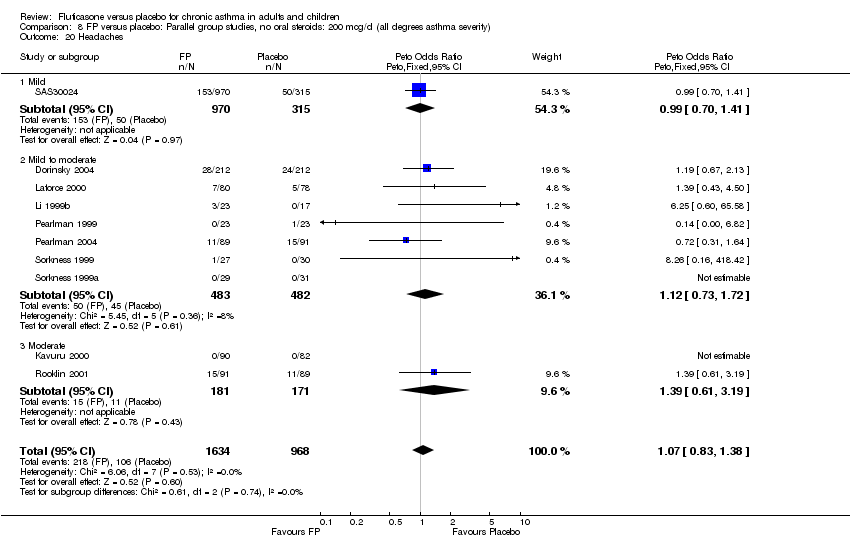
Comparison 8 FP versus placebo: Parallel group studies, no oral steroids: 200 mcg/d (all degrees asthma severity), Outcome 20 Headaches.
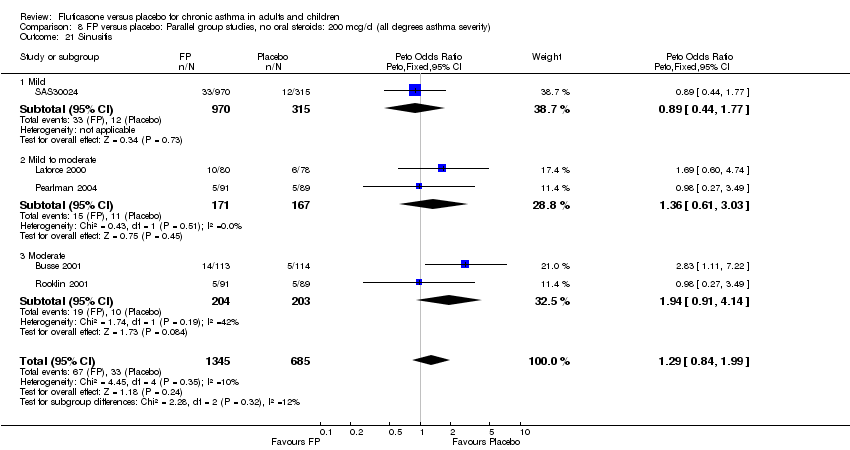
Comparison 8 FP versus placebo: Parallel group studies, no oral steroids: 200 mcg/d (all degrees asthma severity), Outcome 21 Sinusitis.
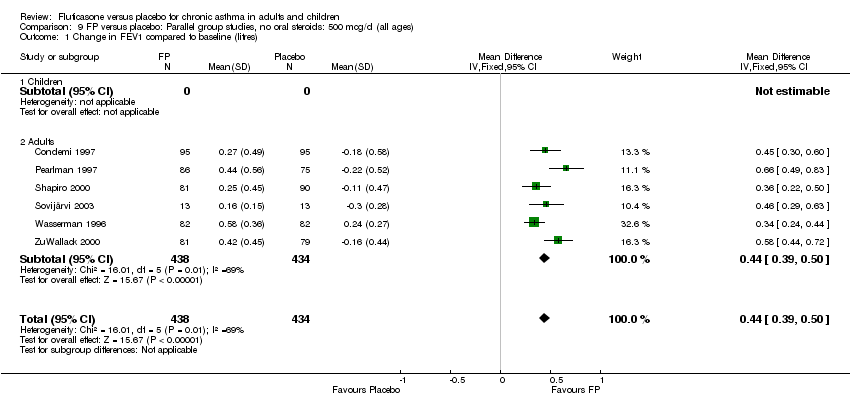
Comparison 9 FP versus placebo: Parallel group studies, no oral steroids: 500 mcg/d (all ages), Outcome 1 Change in FEV1 compared to baseline (litres).

Comparison 9 FP versus placebo: Parallel group studies, no oral steroids: 500 mcg/d (all ages), Outcome 2 FEV1 (% predicted ‐ absolute scores).

Comparison 9 FP versus placebo: Parallel group studies, no oral steroids: 500 mcg/d (all ages), Outcome 3 Change in morning PEF.

Comparison 9 FP versus placebo: Parallel group studies, no oral steroids: 500 mcg/d (all ages), Outcome 4 Change in morning PEFR compared to baseline (L/min).
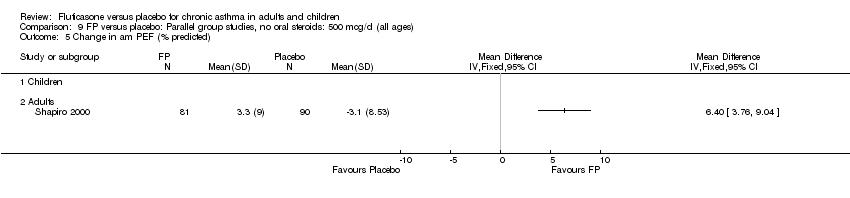
Comparison 9 FP versus placebo: Parallel group studies, no oral steroids: 500 mcg/d (all ages), Outcome 5 Change in am PEF (% predicted).

Comparison 9 FP versus placebo: Parallel group studies, no oral steroids: 500 mcg/d (all ages), Outcome 6 Change in evening PEF compared with baseline.

Comparison 9 FP versus placebo: Parallel group studies, no oral steroids: 500 mcg/d (all ages), Outcome 7 Change in evening PEF compared with baseline (L/min).
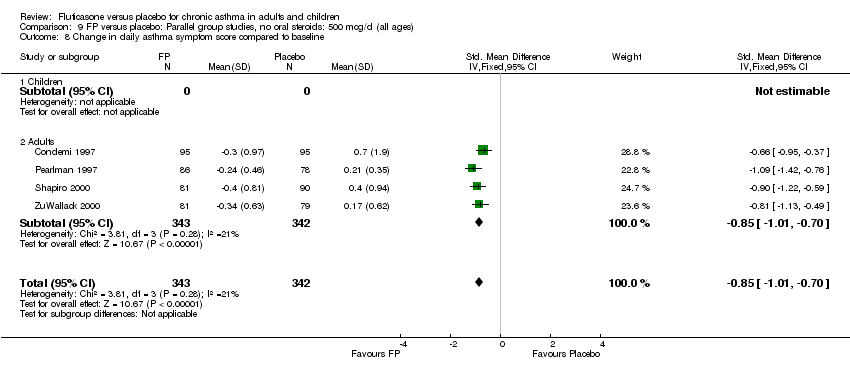
Comparison 9 FP versus placebo: Parallel group studies, no oral steroids: 500 mcg/d (all ages), Outcome 8 Change in daily asthma symptom score compared to baseline.

Comparison 9 FP versus placebo: Parallel group studies, no oral steroids: 500 mcg/d (all ages), Outcome 9 Change in number night‐time wakenings per week.

Comparison 9 FP versus placebo: Parallel group studies, no oral steroids: 500 mcg/d (all ages), Outcome 10 Change in number of night‐time awakenings per night.

Comparison 9 FP versus placebo: Parallel group studies, no oral steroids: 500 mcg/d (all ages), Outcome 11 Change in % nights with no awakenings.
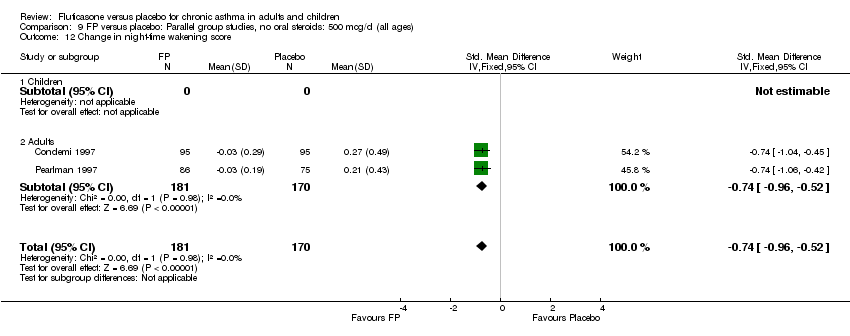
Comparison 9 FP versus placebo: Parallel group studies, no oral steroids: 500 mcg/d (all ages), Outcome 12 Change in night‐time wakening score.

Comparison 9 FP versus placebo: Parallel group studies, no oral steroids: 500 mcg/d (all ages), Outcome 13 Change in daily use of beta2 agonist compared to baseline (puffs/d).
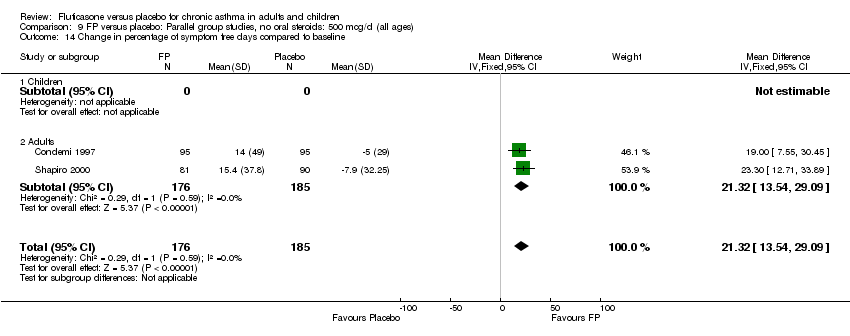
Comparison 9 FP versus placebo: Parallel group studies, no oral steroids: 500 mcg/d (all ages), Outcome 14 Change in percentage of symptom free days compared to baseline.

Comparison 9 FP versus placebo: Parallel group studies, no oral steroids: 500 mcg/d (all ages), Outcome 15 Change in percentage of rescue beta2 agonist free days compared to baseline.
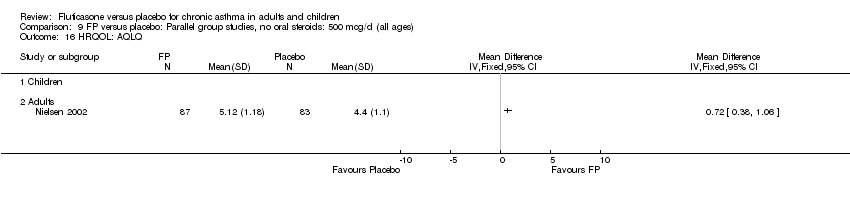
Comparison 9 FP versus placebo: Parallel group studies, no oral steroids: 500 mcg/d (all ages), Outcome 16 HRQOL: AQLQ.
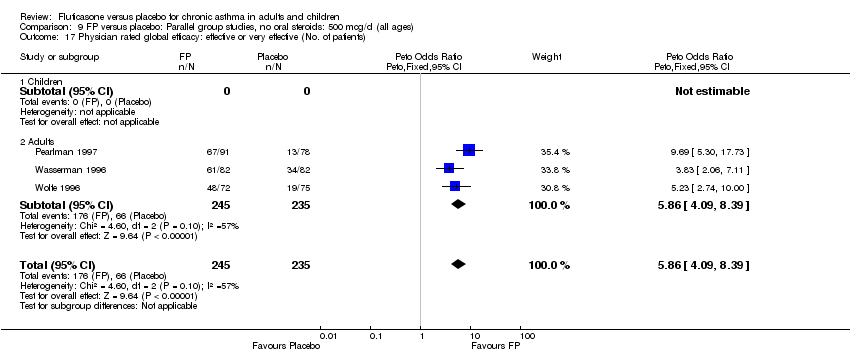
Comparison 9 FP versus placebo: Parallel group studies, no oral steroids: 500 mcg/d (all ages), Outcome 17 Physician rated global efficacy: effective or very effective (No. of patients).
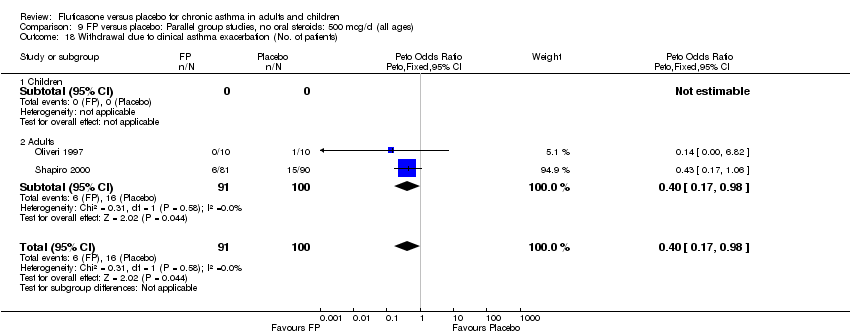
Comparison 9 FP versus placebo: Parallel group studies, no oral steroids: 500 mcg/d (all ages), Outcome 18 Withdrawal due to clinical asthma exacerbation (No. of patients).
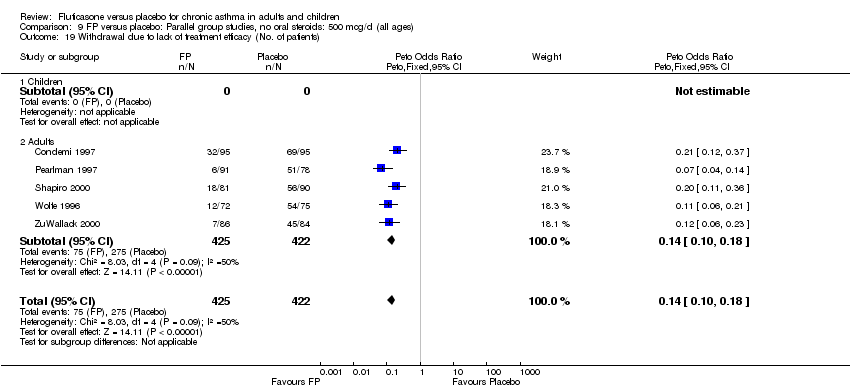
Comparison 9 FP versus placebo: Parallel group studies, no oral steroids: 500 mcg/d (all ages), Outcome 19 Withdrawal due to lack of treatment efficacy (No. of patients).
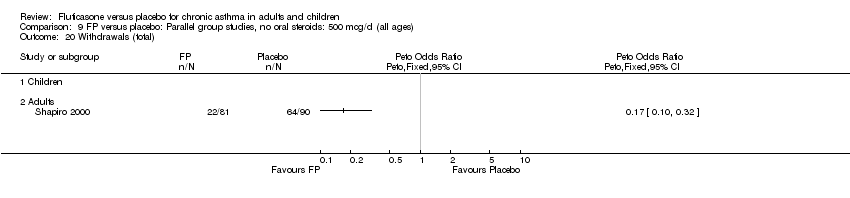
Comparison 9 FP versus placebo: Parallel group studies, no oral steroids: 500 mcg/d (all ages), Outcome 20 Withdrawals (total).
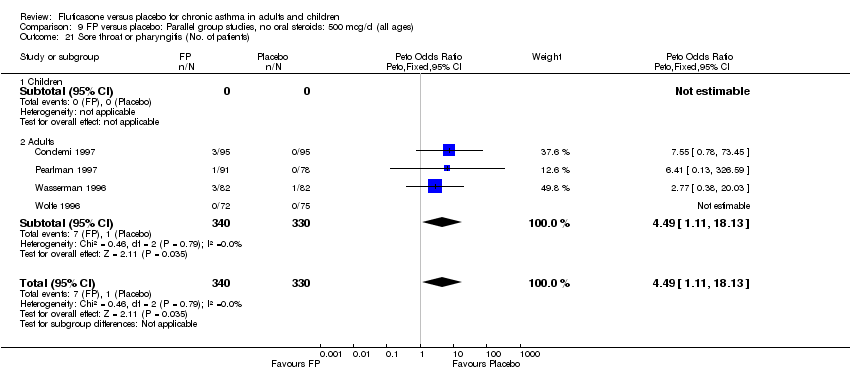
Comparison 9 FP versus placebo: Parallel group studies, no oral steroids: 500 mcg/d (all ages), Outcome 21 Sore throat or pharyngitis (No. of patients).

Comparison 9 FP versus placebo: Parallel group studies, no oral steroids: 500 mcg/d (all ages), Outcome 22 Hoarseness or dysphonia (No. of patients).

Comparison 9 FP versus placebo: Parallel group studies, no oral steroids: 500 mcg/d (all ages), Outcome 23 Oral Candidiasis (No. of patients).
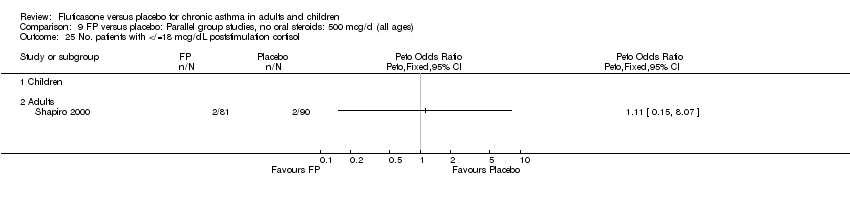
Comparison 9 FP versus placebo: Parallel group studies, no oral steroids: 500 mcg/d (all ages), Outcome 25 No. patients with </=18 mcg/dL poststimulation cortisol.

Comparison 9 FP versus placebo: Parallel group studies, no oral steroids: 500 mcg/d (all ages), Outcome 26 Plasma cortisol (AUC).
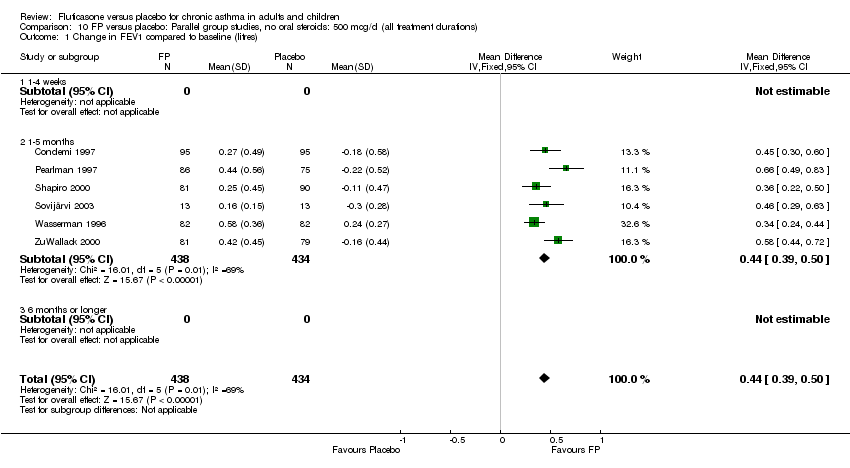
Comparison 10 FP versus placebo: Parallel group studies, no oral steroids: 500 mcg/d (all treatment durations), Outcome 1 Change in FEV1 compared to baseline (litres).

Comparison 10 FP versus placebo: Parallel group studies, no oral steroids: 500 mcg/d (all treatment durations), Outcome 2 Change in morning PEFR compared to baseline.
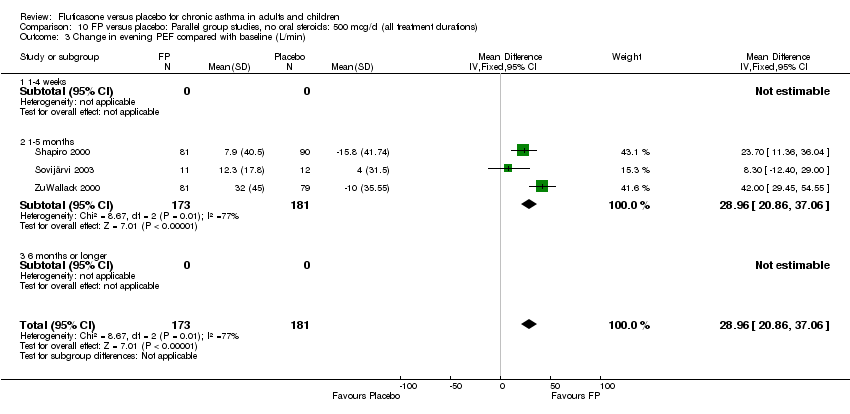
Comparison 10 FP versus placebo: Parallel group studies, no oral steroids: 500 mcg/d (all treatment durations), Outcome 3 Change in evening PEF compared with baseline (L/min).

Comparison 10 FP versus placebo: Parallel group studies, no oral steroids: 500 mcg/d (all treatment durations), Outcome 4 Change in daily asthma symptom score compared to baseline.

Comparison 10 FP versus placebo: Parallel group studies, no oral steroids: 500 mcg/d (all treatment durations), Outcome 5 Change in night‐time wakening score.
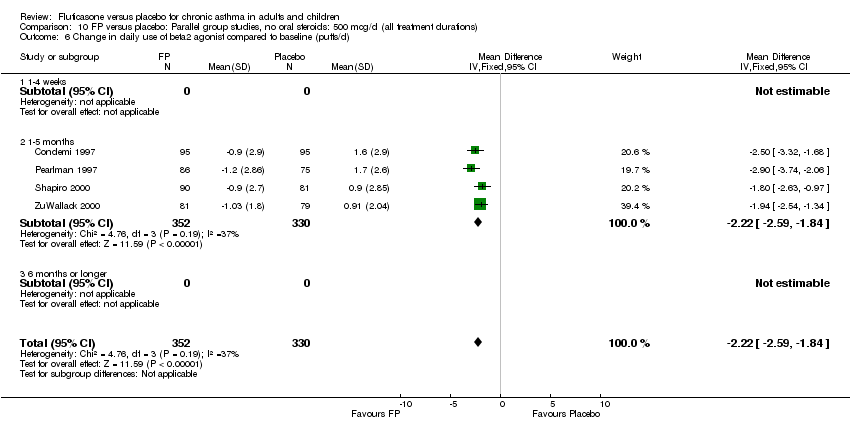
Comparison 10 FP versus placebo: Parallel group studies, no oral steroids: 500 mcg/d (all treatment durations), Outcome 6 Change in daily use of beta2 agonist compared to baseline (puffs/d).

Comparison 10 FP versus placebo: Parallel group studies, no oral steroids: 500 mcg/d (all treatment durations), Outcome 9 Physician rated global efficacy: effective or very effective (No. of patients).
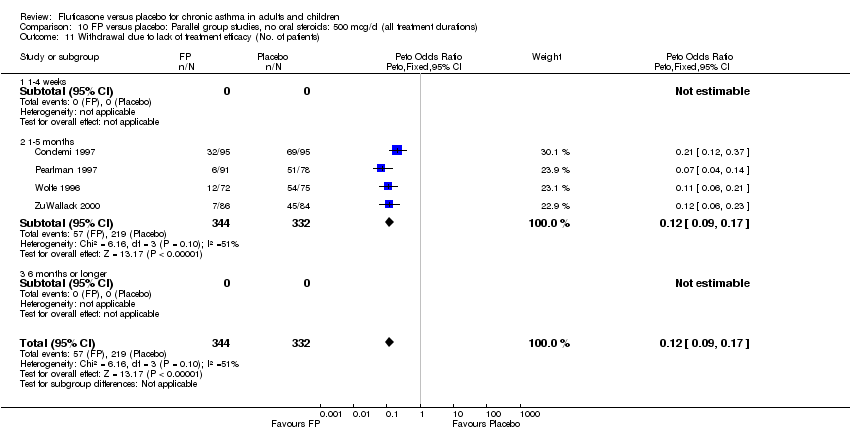
Comparison 10 FP versus placebo: Parallel group studies, no oral steroids: 500 mcg/d (all treatment durations), Outcome 11 Withdrawal due to lack of treatment efficacy (No. of patients).
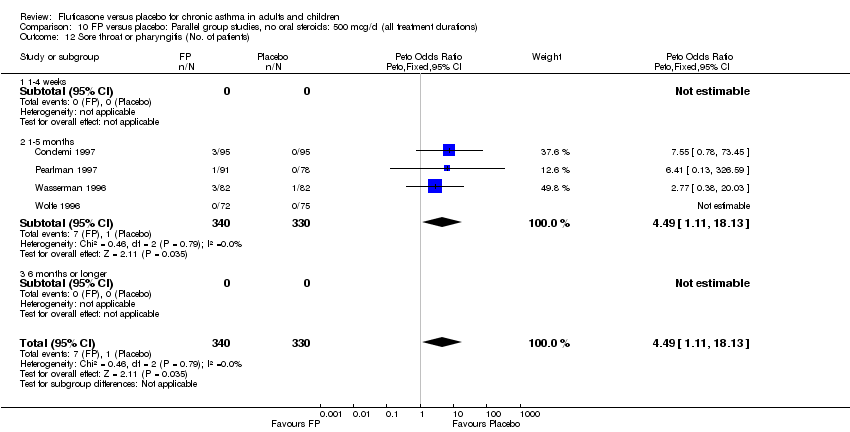
Comparison 10 FP versus placebo: Parallel group studies, no oral steroids: 500 mcg/d (all treatment durations), Outcome 12 Sore throat or pharyngitis (No. of patients).

Comparison 10 FP versus placebo: Parallel group studies, no oral steroids: 500 mcg/d (all treatment durations), Outcome 13 Hoarseness or dysphonia (No. of patients).

Comparison 10 FP versus placebo: Parallel group studies, no oral steroids: 500 mcg/d (all treatment durations), Outcome 14 Oral Candidiasis (No. of patients).

Comparison 11 FP versus placebo: Parallel group studies, no oral steroids: 500 mcg/d (all delivery devices), Outcome 1 Change in FEV1 compared to baseline (litres).
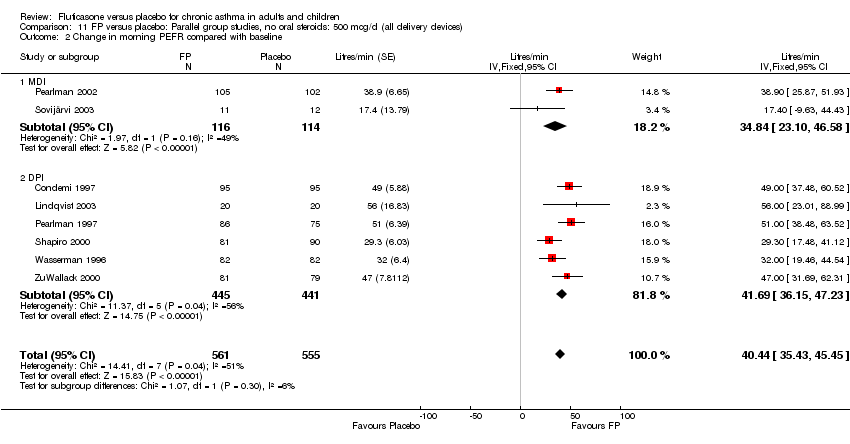
Comparison 11 FP versus placebo: Parallel group studies, no oral steroids: 500 mcg/d (all delivery devices), Outcome 2 Change in morning PEFR compared with baseline.

Comparison 11 FP versus placebo: Parallel group studies, no oral steroids: 500 mcg/d (all delivery devices), Outcome 3 Change in evening PEF compared with baseline (L/min).
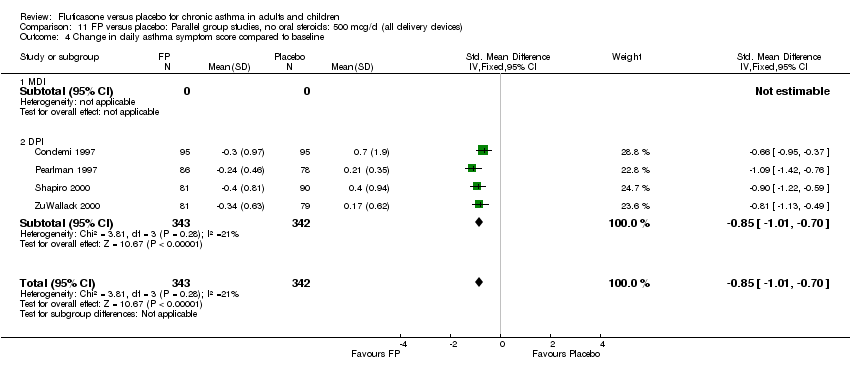
Comparison 11 FP versus placebo: Parallel group studies, no oral steroids: 500 mcg/d (all delivery devices), Outcome 4 Change in daily asthma symptom score compared to baseline.

Comparison 11 FP versus placebo: Parallel group studies, no oral steroids: 500 mcg/d (all delivery devices), Outcome 5 Change in night‐time wakening score.
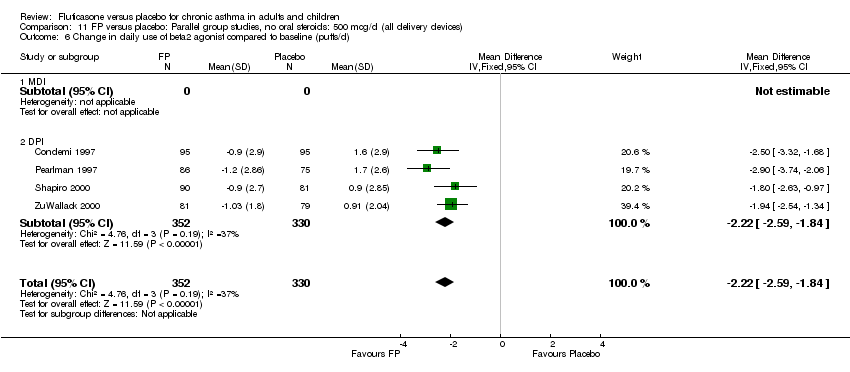
Comparison 11 FP versus placebo: Parallel group studies, no oral steroids: 500 mcg/d (all delivery devices), Outcome 6 Change in daily use of beta2 agonist compared to baseline (puffs/d).

Comparison 11 FP versus placebo: Parallel group studies, no oral steroids: 500 mcg/d (all delivery devices), Outcome 9 Physician rated global efficacy: effective or very effective (No. of patients).

Comparison 11 FP versus placebo: Parallel group studies, no oral steroids: 500 mcg/d (all delivery devices), Outcome 10 Withdrawal due to lack of treatment efficacy (No. of patients).
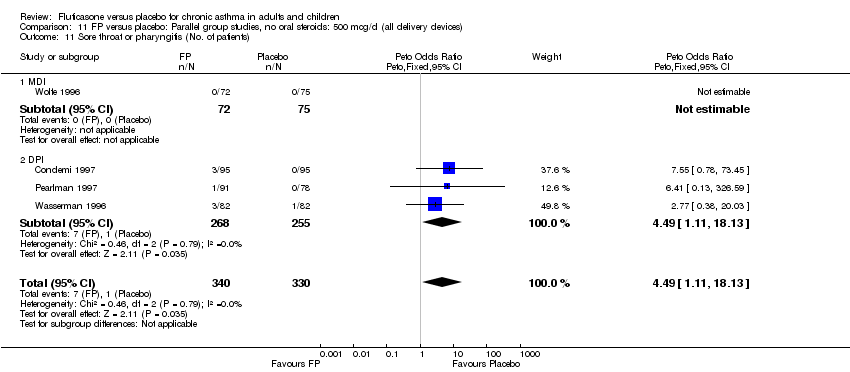
Comparison 11 FP versus placebo: Parallel group studies, no oral steroids: 500 mcg/d (all delivery devices), Outcome 11 Sore throat or pharyngitis (No. of patients).

Comparison 11 FP versus placebo: Parallel group studies, no oral steroids: 500 mcg/d (all delivery devices), Outcome 12 Hoarseness or dysphonia (No. of patients).

Comparison 11 FP versus placebo: Parallel group studies, no oral steroids: 500 mcg/d (all delivery devices), Outcome 13 Oral Candidiasis (No. of patients).

Comparison 12 FP versus placebo: Parallel group studies, no oral steroids: 500 mcg/d (all degrees asthma severity), Outcome 1 Change in FEV1 compared to baseline (litres).

Comparison 12 FP versus placebo: Parallel group studies, no oral steroids: 500 mcg/d (all degrees asthma severity), Outcome 2 Change in morning PEFR compared with baseline.
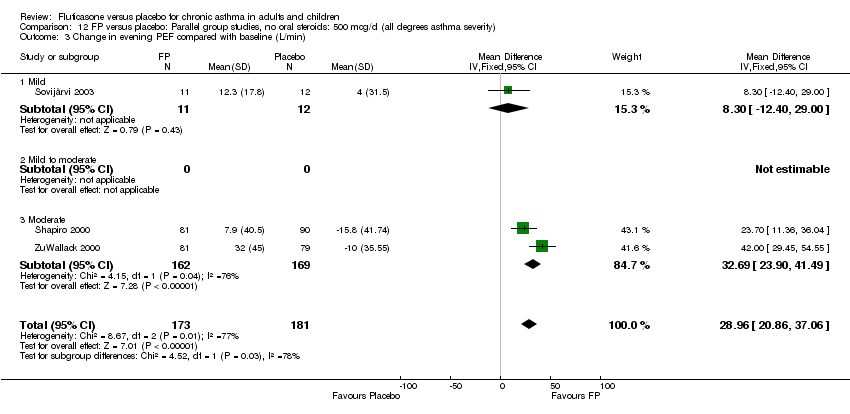
Comparison 12 FP versus placebo: Parallel group studies, no oral steroids: 500 mcg/d (all degrees asthma severity), Outcome 3 Change in evening PEF compared with baseline (L/min).
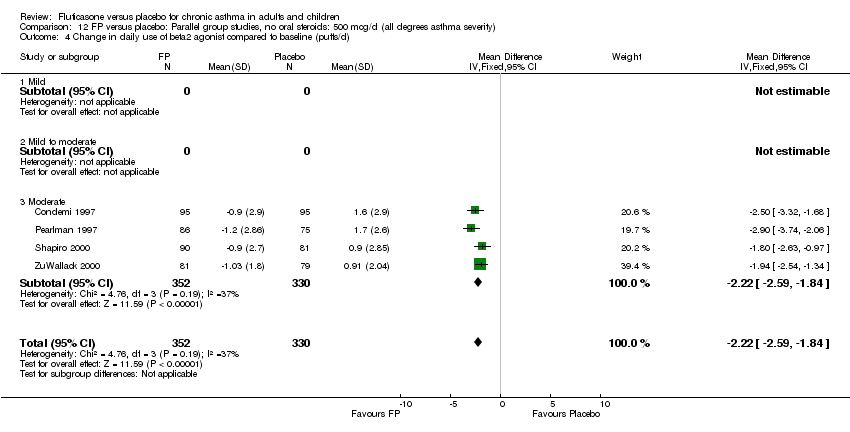
Comparison 12 FP versus placebo: Parallel group studies, no oral steroids: 500 mcg/d (all degrees asthma severity), Outcome 4 Change in daily use of beta2 agonist compared to baseline (puffs/d).
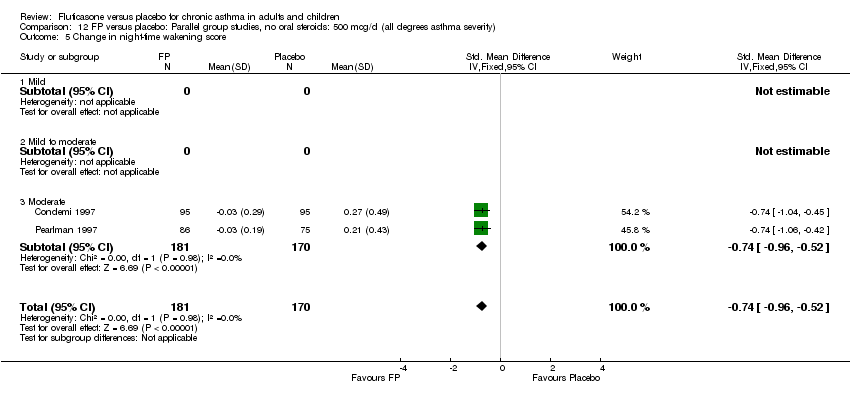
Comparison 12 FP versus placebo: Parallel group studies, no oral steroids: 500 mcg/d (all degrees asthma severity), Outcome 5 Change in night‐time wakening score.

Comparison 12 FP versus placebo: Parallel group studies, no oral steroids: 500 mcg/d (all degrees asthma severity), Outcome 6 Change in daily asthma symptom score compared to baseline.

Comparison 12 FP versus placebo: Parallel group studies, no oral steroids: 500 mcg/d (all degrees asthma severity), Outcome 7 Physician rated global efficacy: effective or very effective (No. of patients).

Comparison 12 FP versus placebo: Parallel group studies, no oral steroids: 500 mcg/d (all degrees asthma severity), Outcome 8 Withdrawal due to lack of treatment efficacy (No. of patients).
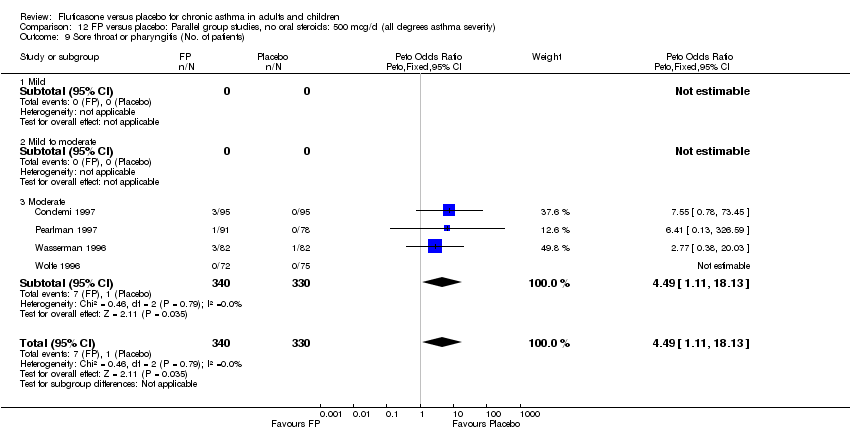
Comparison 12 FP versus placebo: Parallel group studies, no oral steroids: 500 mcg/d (all degrees asthma severity), Outcome 9 Sore throat or pharyngitis (No. of patients).

Comparison 12 FP versus placebo: Parallel group studies, no oral steroids: 500 mcg/d (all degrees asthma severity), Outcome 10 Hoarseness or dysphonia (No. of patients).

Comparison 12 FP versus placebo: Parallel group studies, no oral steroids: 500 mcg/d (all degrees asthma severity), Outcome 11 Oral Candidiasis (No. of patients).
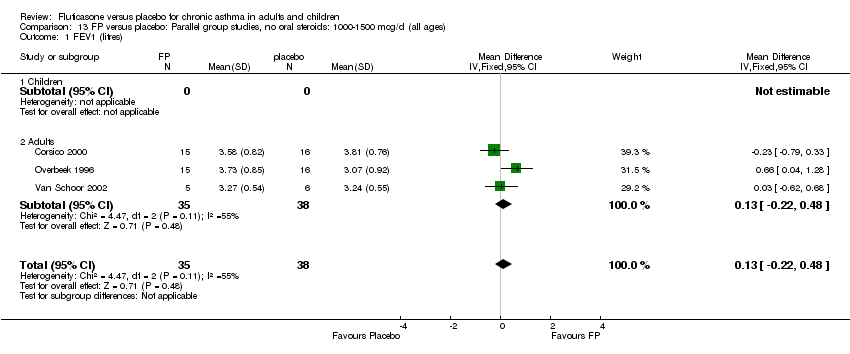
Comparison 13 FP versus placebo: Parallel group studies, no oral steroids: 1000‐1500 mcg/d (all ages), Outcome 1 FEV1 (litres).
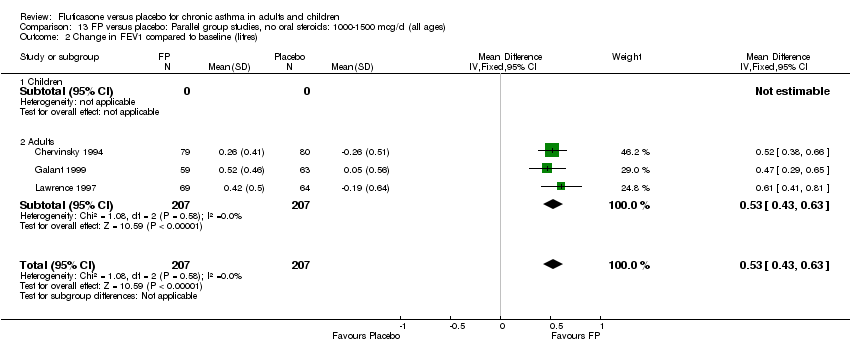
Comparison 13 FP versus placebo: Parallel group studies, no oral steroids: 1000‐1500 mcg/d (all ages), Outcome 2 Change in FEV1 compared to baseline (litres).

Comparison 13 FP versus placebo: Parallel group studies, no oral steroids: 1000‐1500 mcg/d (all ages), Outcome 3 Change in FVC compared to baseline (litres).

Comparison 13 FP versus placebo: Parallel group studies, no oral steroids: 1000‐1500 mcg/d (all ages), Outcome 4 Change in FEF25‐75 compared to baseline (L/second).
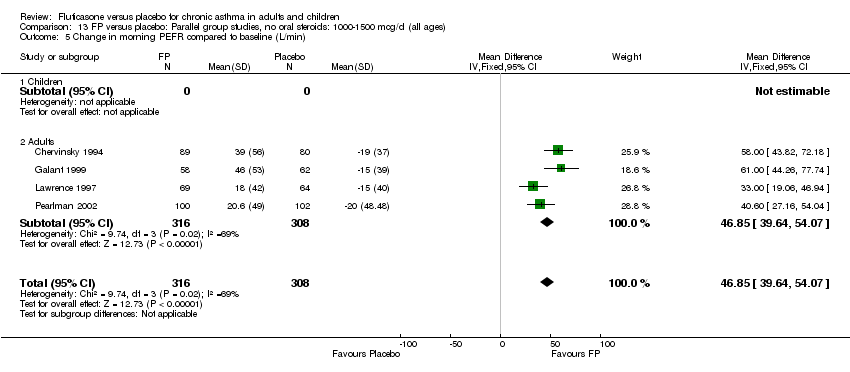
Comparison 13 FP versus placebo: Parallel group studies, no oral steroids: 1000‐1500 mcg/d (all ages), Outcome 5 Change in morning PEFR compared to baseline (L/min).

Comparison 13 FP versus placebo: Parallel group studies, no oral steroids: 1000‐1500 mcg/d (all ages), Outcome 6 Change in evening PEFR compared to baseline (L/min).
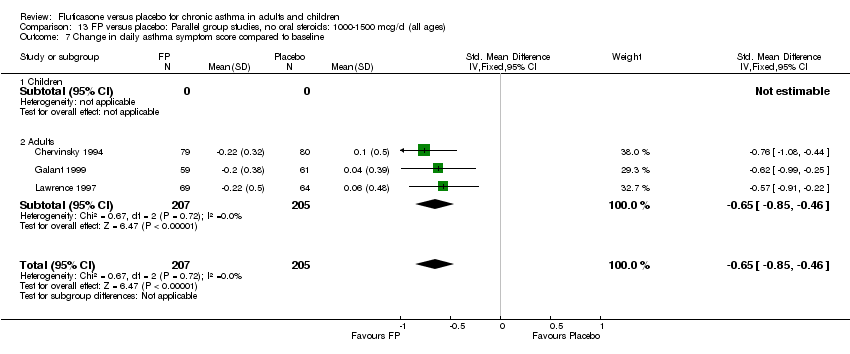
Comparison 13 FP versus placebo: Parallel group studies, no oral steroids: 1000‐1500 mcg/d (all ages), Outcome 7 Change in daily asthma symptom score compared to baseline.
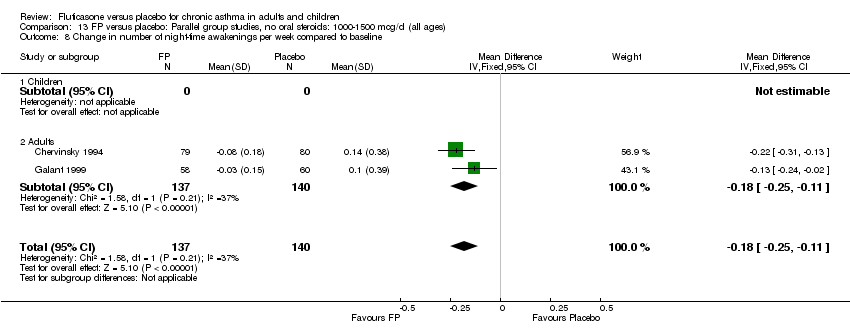
Comparison 13 FP versus placebo: Parallel group studies, no oral steroids: 1000‐1500 mcg/d (all ages), Outcome 8 Change in number of night‐time awakenings per week compared to baseline.

Comparison 13 FP versus placebo: Parallel group studies, no oral steroids: 1000‐1500 mcg/d (all ages), Outcome 9 Change in daily use of beta2 agonist compared to baseline (puffs/d).

Comparison 13 FP versus placebo: Parallel group studies, no oral steroids: 1000‐1500 mcg/d (all ages), Outcome 10 Methacholine BHR (log base 2 PC20 FEV1 mg/ml).
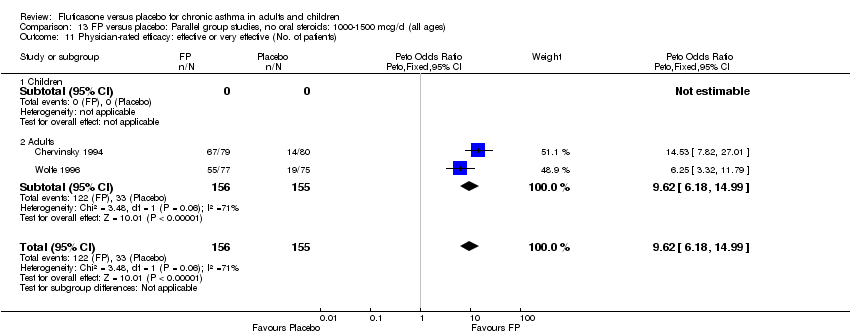
Comparison 13 FP versus placebo: Parallel group studies, no oral steroids: 1000‐1500 mcg/d (all ages), Outcome 11 Physician‐rated efficacy: effective or very effective (No. of patients).
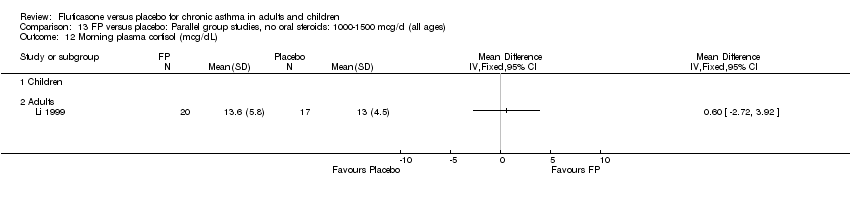
Comparison 13 FP versus placebo: Parallel group studies, no oral steroids: 1000‐1500 mcg/d (all ages), Outcome 12 Morning plasma cortisol (mcg/dL).
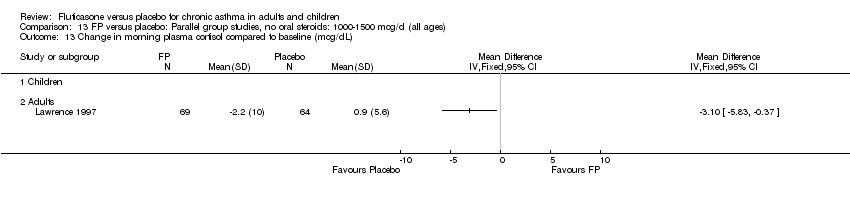
Comparison 13 FP versus placebo: Parallel group studies, no oral steroids: 1000‐1500 mcg/d (all ages), Outcome 13 Change in morning plasma cortisol compared to baseline (mcg/dL).
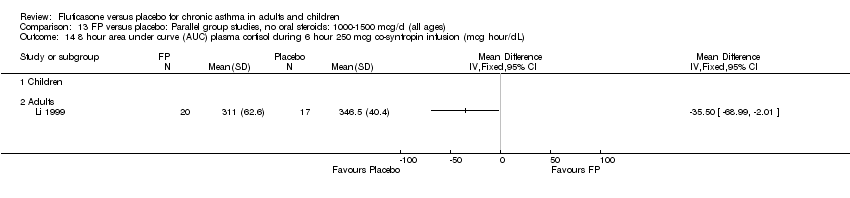
Comparison 13 FP versus placebo: Parallel group studies, no oral steroids: 1000‐1500 mcg/d (all ages), Outcome 14 8 hour area under curve (AUC) plasma cortisol during 6 hour 250 mcg co‐syntropin infusion (mcg hour/dL).

Comparison 13 FP versus placebo: Parallel group studies, no oral steroids: 1000‐1500 mcg/d (all ages), Outcome 15 Peak plasma cortisol during during 6 hour 250 mcg co‐syntropin infusion (mcg/dL).
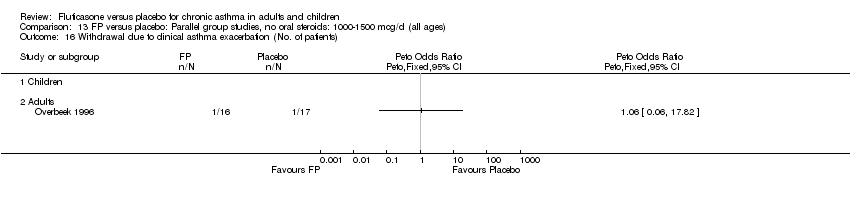
Comparison 13 FP versus placebo: Parallel group studies, no oral steroids: 1000‐1500 mcg/d (all ages), Outcome 16 Withdrawal due to clinical asthma exacerbation (No. of patients).

Comparison 13 FP versus placebo: Parallel group studies, no oral steroids: 1000‐1500 mcg/d (all ages), Outcome 17 Withdrawal due to lack of treatment efficacy (No. of patients).

Comparison 13 FP versus placebo: Parallel group studies, no oral steroids: 1000‐1500 mcg/d (all ages), Outcome 18 Sore throat or pharyngitis (No. of patients).

Comparison 13 FP versus placebo: Parallel group studies, no oral steroids: 1000‐1500 mcg/d (all ages), Outcome 19 Hoarseness or dysphonia (No. of patients).

Comparison 13 FP versus placebo: Parallel group studies, no oral steroids: 1000‐1500 mcg/d (all ages), Outcome 20 Oral Candidiasis (No. of patients).
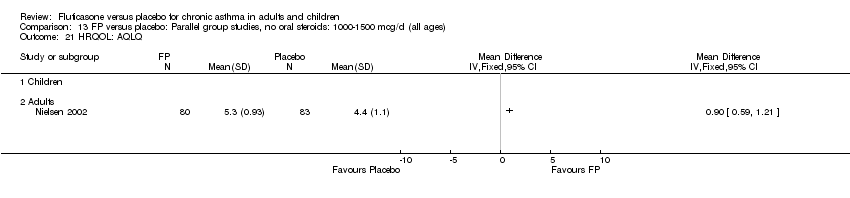
Comparison 13 FP versus placebo: Parallel group studies, no oral steroids: 1000‐1500 mcg/d (all ages), Outcome 21 HRQOL: AQLQ.

Comparison 13 FP versus placebo: Parallel group studies, no oral steroids: 1000‐1500 mcg/d (all ages), Outcome 22 Log PD20 mg.
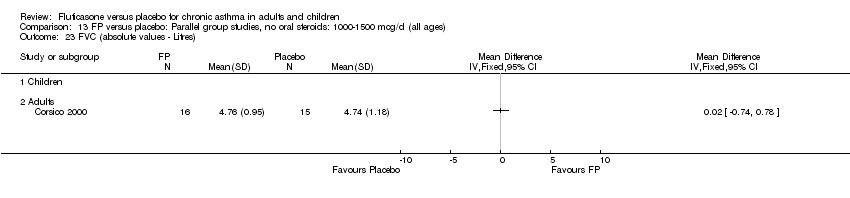
Comparison 13 FP versus placebo: Parallel group studies, no oral steroids: 1000‐1500 mcg/d (all ages), Outcome 23 FVC (absolute values ‐ Litres).
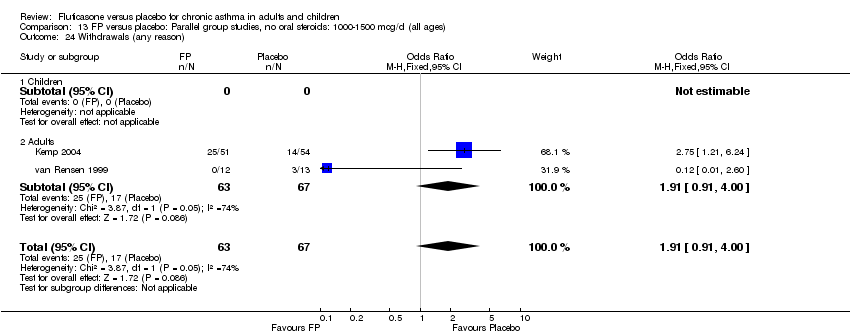
Comparison 13 FP versus placebo: Parallel group studies, no oral steroids: 1000‐1500 mcg/d (all ages), Outcome 24 Withdrawals (any reason).

Comparison 14 FP versus placebo: Parallel group studies, no oral steroids: 1000‐1500 mcg/d (all treatment durations), Outcome 1 FEV1 (litres).
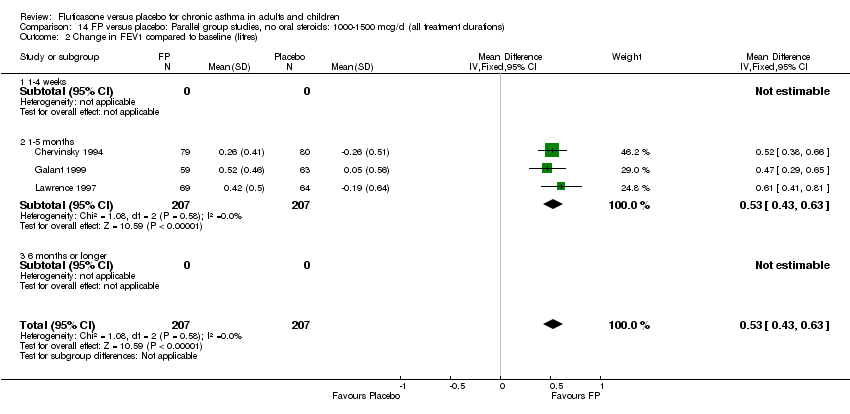
Comparison 14 FP versus placebo: Parallel group studies, no oral steroids: 1000‐1500 mcg/d (all treatment durations), Outcome 2 Change in FEV1 compared to baseline (litres).

Comparison 14 FP versus placebo: Parallel group studies, no oral steroids: 1000‐1500 mcg/d (all treatment durations), Outcome 5 Change in morning PEFR compared to baseline (L/min).

Comparison 14 FP versus placebo: Parallel group studies, no oral steroids: 1000‐1500 mcg/d (all treatment durations), Outcome 6 Change in evening PEFR compared to baseline (L/min).
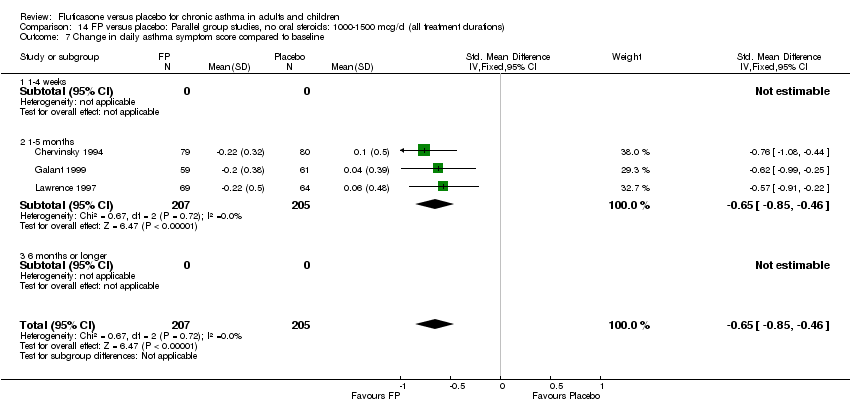
Comparison 14 FP versus placebo: Parallel group studies, no oral steroids: 1000‐1500 mcg/d (all treatment durations), Outcome 7 Change in daily asthma symptom score compared to baseline.

Comparison 14 FP versus placebo: Parallel group studies, no oral steroids: 1000‐1500 mcg/d (all treatment durations), Outcome 8 Change in number of night‐time awakening per week compared to baseline score.
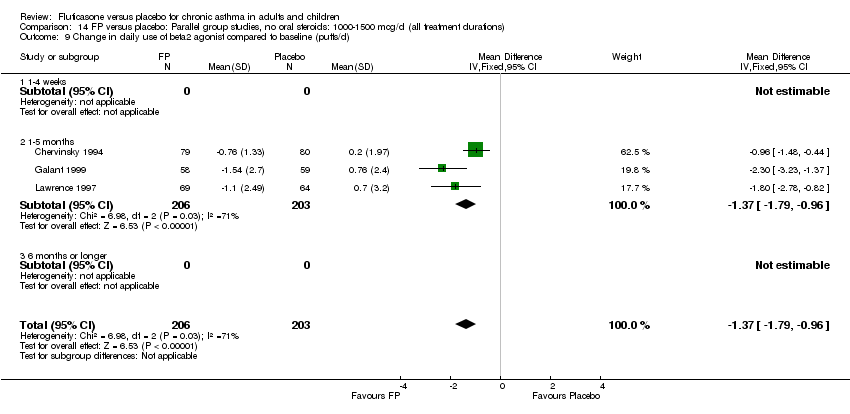
Comparison 14 FP versus placebo: Parallel group studies, no oral steroids: 1000‐1500 mcg/d (all treatment durations), Outcome 9 Change in daily use of beta2 agonist compared to baseline (puffs/d).
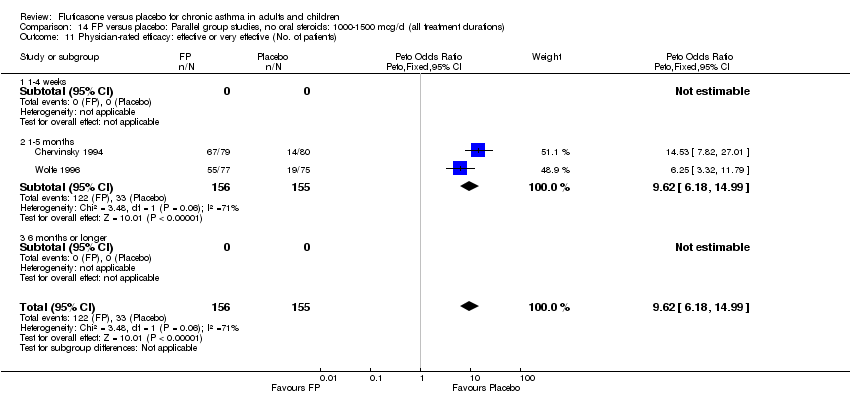
Comparison 14 FP versus placebo: Parallel group studies, no oral steroids: 1000‐1500 mcg/d (all treatment durations), Outcome 11 Physician‐rated efficacy: effective or very effective (No. of patients).

Comparison 14 FP versus placebo: Parallel group studies, no oral steroids: 1000‐1500 mcg/d (all treatment durations), Outcome 17 Withdrawal due to lack of treatment efficacy (No.of patients).

Comparison 14 FP versus placebo: Parallel group studies, no oral steroids: 1000‐1500 mcg/d (all treatment durations), Outcome 18 Sore throat or pharyngitis (No. of patients).
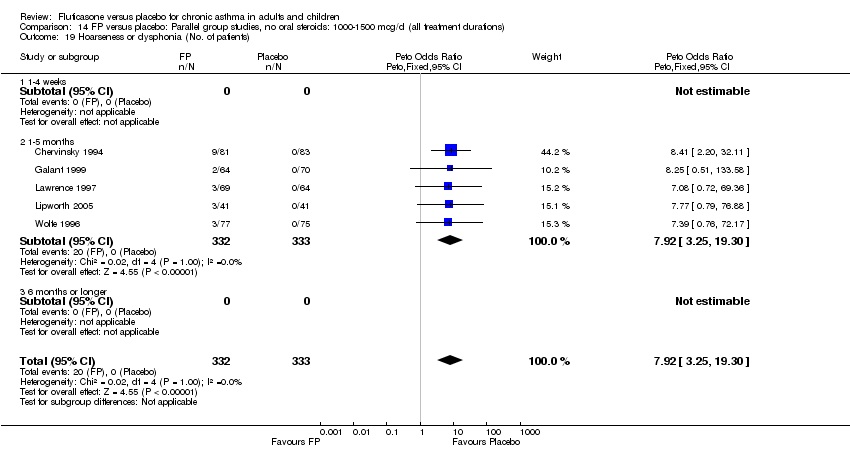
Comparison 14 FP versus placebo: Parallel group studies, no oral steroids: 1000‐1500 mcg/d (all treatment durations), Outcome 19 Hoarseness or dysphonia (No. of patients).
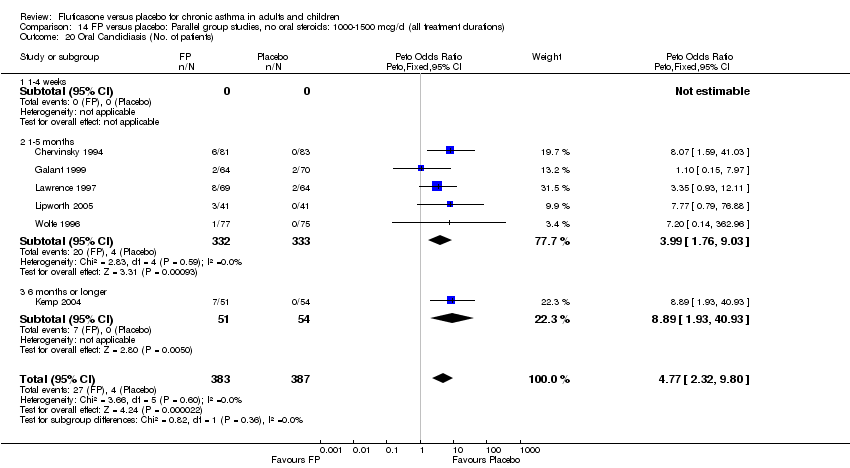
Comparison 14 FP versus placebo: Parallel group studies, no oral steroids: 1000‐1500 mcg/d (all treatment durations), Outcome 20 Oral Candidiasis (No. of patients).

Comparison 15 FP versus placebo: Parallel group studies, no oral steroids: 1000‐1500 mcg/d (all delivery devices), Outcome 1 FEV1 (litres).
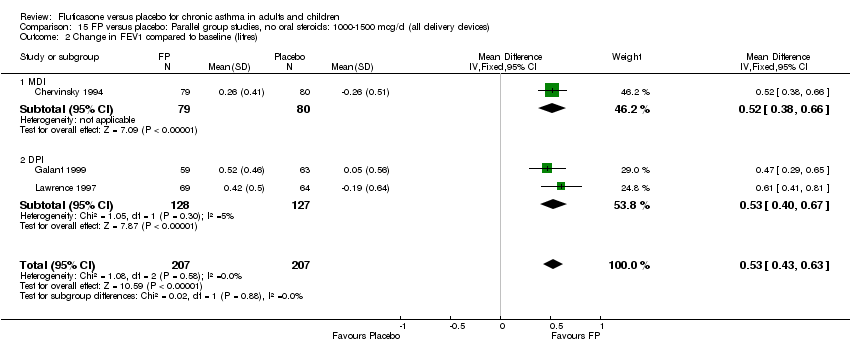
Comparison 15 FP versus placebo: Parallel group studies, no oral steroids: 1000‐1500 mcg/d (all delivery devices), Outcome 2 Change in FEV1 compared to baseline (litres).

Comparison 15 FP versus placebo: Parallel group studies, no oral steroids: 1000‐1500 mcg/d (all delivery devices), Outcome 5 Change in morning PEFR compared to baseline (L/min).
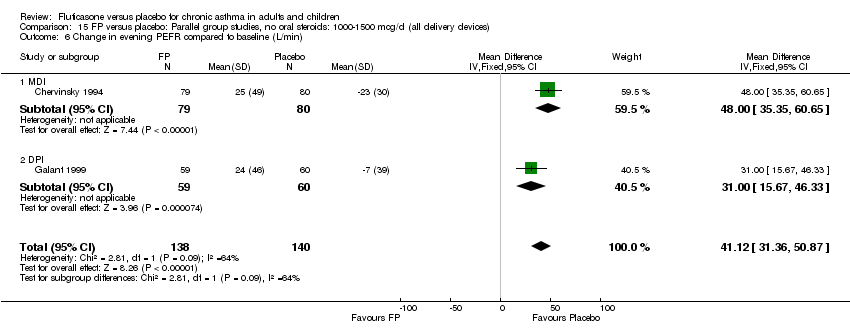
Comparison 15 FP versus placebo: Parallel group studies, no oral steroids: 1000‐1500 mcg/d (all delivery devices), Outcome 6 Change in evening PEFR compared to baseline (L/min).

Comparison 15 FP versus placebo: Parallel group studies, no oral steroids: 1000‐1500 mcg/d (all delivery devices), Outcome 7 Change in daily asthma symptom score compared to baseline.
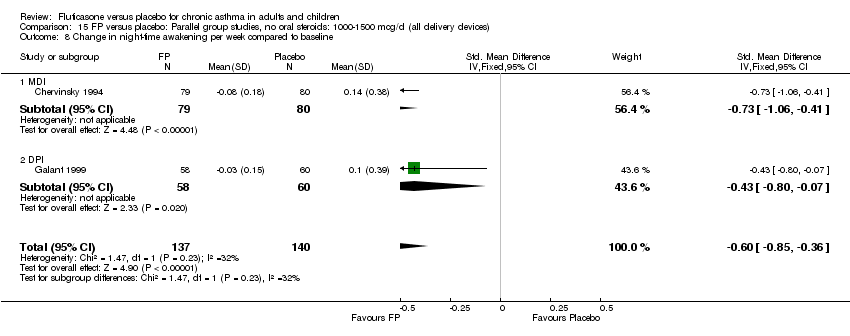
Comparison 15 FP versus placebo: Parallel group studies, no oral steroids: 1000‐1500 mcg/d (all delivery devices), Outcome 8 Change in night‐time awakening per week compared to baseline.

Comparison 15 FP versus placebo: Parallel group studies, no oral steroids: 1000‐1500 mcg/d (all delivery devices), Outcome 9 Change in daily use of beta2 agonist compared to baseline (puffs/d).
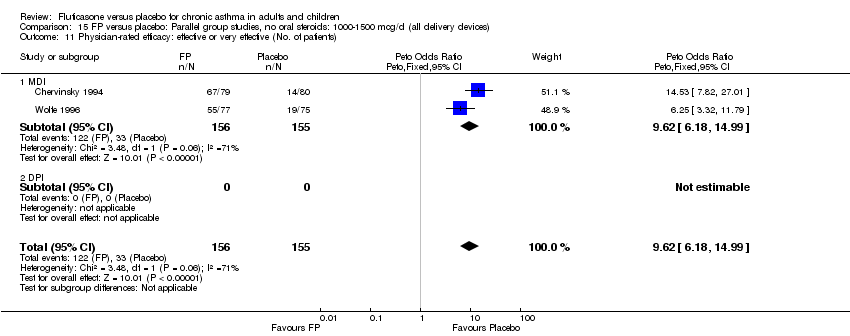
Comparison 15 FP versus placebo: Parallel group studies, no oral steroids: 1000‐1500 mcg/d (all delivery devices), Outcome 11 Physician‐rated efficacy: effective or very effective (No. of patients).
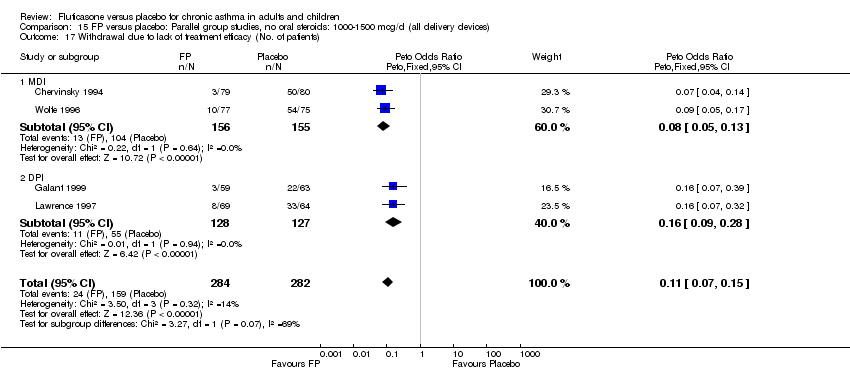
Comparison 15 FP versus placebo: Parallel group studies, no oral steroids: 1000‐1500 mcg/d (all delivery devices), Outcome 17 Withdrawal due to lack of treatment efficacy (No. of patients).
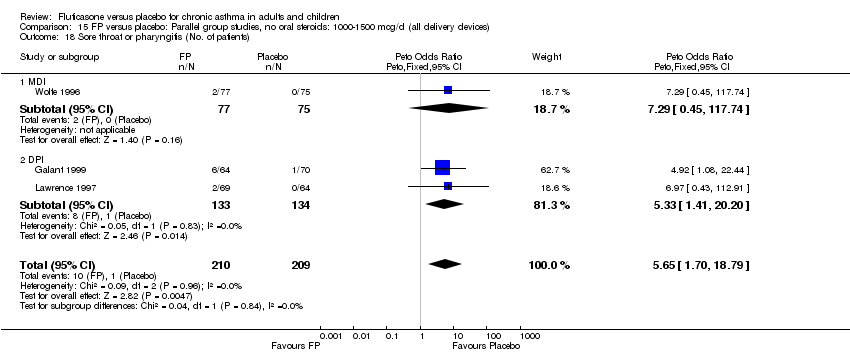
Comparison 15 FP versus placebo: Parallel group studies, no oral steroids: 1000‐1500 mcg/d (all delivery devices), Outcome 18 Sore throat or pharyngitis (No. of patients).
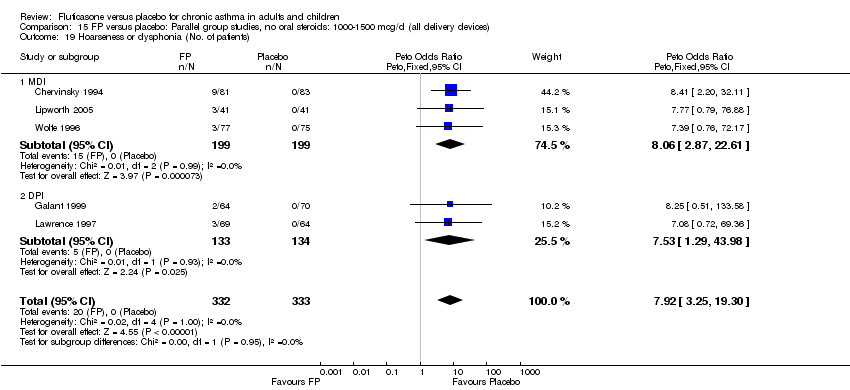
Comparison 15 FP versus placebo: Parallel group studies, no oral steroids: 1000‐1500 mcg/d (all delivery devices), Outcome 19 Hoarseness or dysphonia (No. of patients).

Comparison 15 FP versus placebo: Parallel group studies, no oral steroids: 1000‐1500 mcg/d (all delivery devices), Outcome 20 Oral Candidiasis (No. of patients).

Comparison 16 FP versus placebo: Parallel group studies, no oral steroids: 1000‐1500 mcg/d (all degrees asthma severity), Outcome 1 FEV1 (litres).

Comparison 16 FP versus placebo: Parallel group studies, no oral steroids: 1000‐1500 mcg/d (all degrees asthma severity), Outcome 2 Change in FEV1 compared to baseline (litres).

Comparison 16 FP versus placebo: Parallel group studies, no oral steroids: 1000‐1500 mcg/d (all degrees asthma severity), Outcome 5 Change in morning PEFR compared to baseline (L/min).

Comparison 16 FP versus placebo: Parallel group studies, no oral steroids: 1000‐1500 mcg/d (all degrees asthma severity), Outcome 6 Change in evening PEFR compared to baseline (L/min).

Comparison 16 FP versus placebo: Parallel group studies, no oral steroids: 1000‐1500 mcg/d (all degrees asthma severity), Outcome 7 Change in daily asthma symptom score compared to baseline.

Comparison 16 FP versus placebo: Parallel group studies, no oral steroids: 1000‐1500 mcg/d (all degrees asthma severity), Outcome 8 Change in night‐time wakening score.
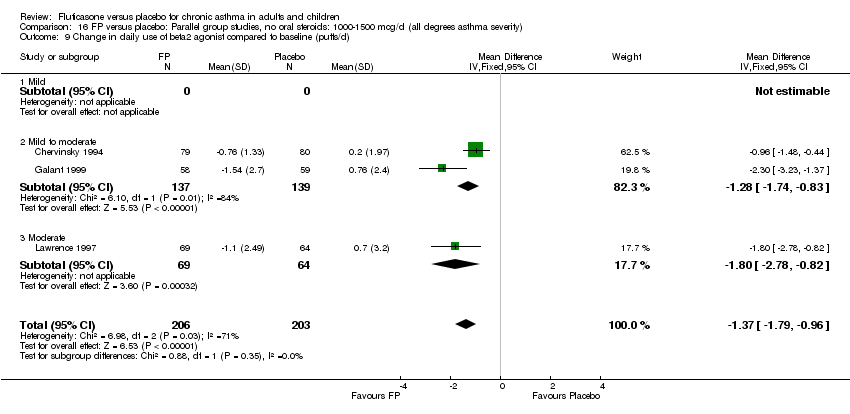
Comparison 16 FP versus placebo: Parallel group studies, no oral steroids: 1000‐1500 mcg/d (all degrees asthma severity), Outcome 9 Change in daily use of beta2 agonist compared to baseline (puffs/d).
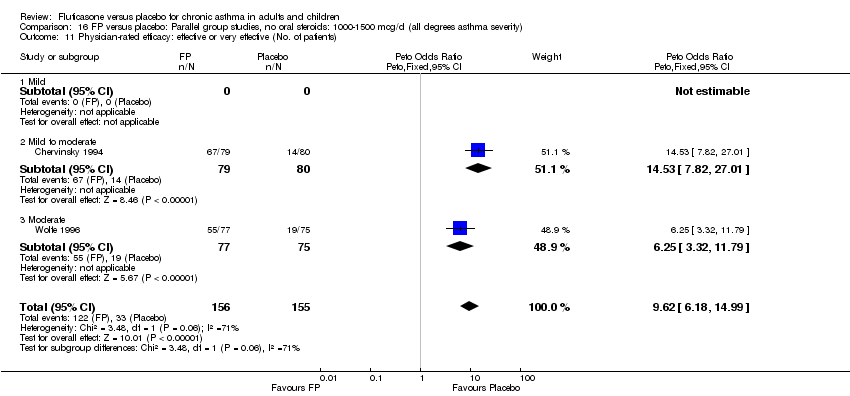
Comparison 16 FP versus placebo: Parallel group studies, no oral steroids: 1000‐1500 mcg/d (all degrees asthma severity), Outcome 11 Physician‐rated efficacy: effective or very effective (No. of patients).

Comparison 16 FP versus placebo: Parallel group studies, no oral steroids: 1000‐1500 mcg/d (all degrees asthma severity), Outcome 17 Withdrawal due to lack of treatment efficacy (No.of patients).

Comparison 16 FP versus placebo: Parallel group studies, no oral steroids: 1000‐1500 mcg/d (all degrees asthma severity), Outcome 18 Sore throat or pharyngitis (No. of patients).

Comparison 16 FP versus placebo: Parallel group studies, no oral steroids: 1000‐1500 mcg/d (all degrees asthma severity), Outcome 19 Hoarseness or dysphonia (No. of patients).

Comparison 16 FP versus placebo: Parallel group studies, no oral steroids: 1000‐1500 mcg/d (all degrees asthma severity), Outcome 20 Oral Candidiasis (No. of patients).
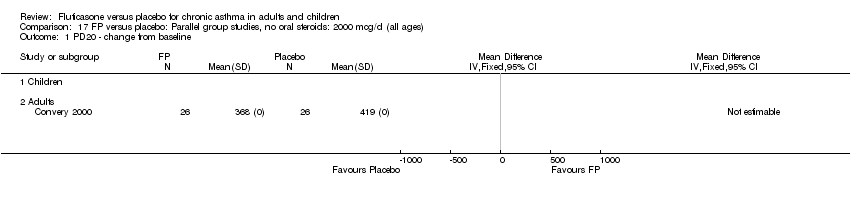
Comparison 17 FP versus placebo: Parallel group studies, no oral steroids: 2000 mcg/d (all ages), Outcome 1 PD20 ‐ change from baseline.
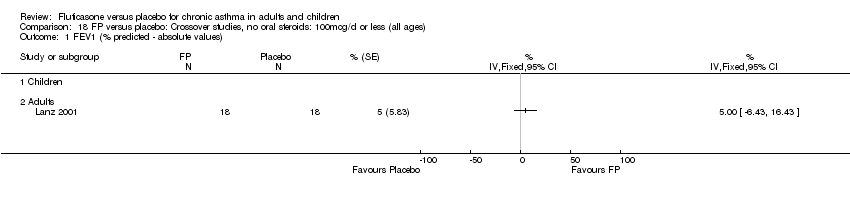
Comparison 18 FP versus placebo: Crossover studies, no oral steroids: 100mcg/d or less (all ages), Outcome 1 FEV1 (% predicted ‐ absolute values).
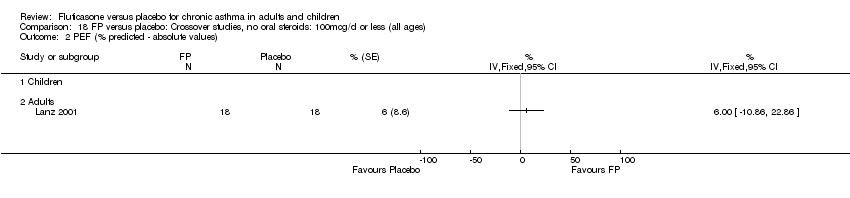
Comparison 18 FP versus placebo: Crossover studies, no oral steroids: 100mcg/d or less (all ages), Outcome 2 PEF (% predicted ‐ absolute values).

Comparison 18 FP versus placebo: Crossover studies, no oral steroids: 100mcg/d or less (all ages), Outcome 3 Quality of life (absolute scores ‐ AQLQ).

Comparison 18 FP versus placebo: Crossover studies, no oral steroids: 100mcg/d or less (all ages), Outcome 4 Symptoms.
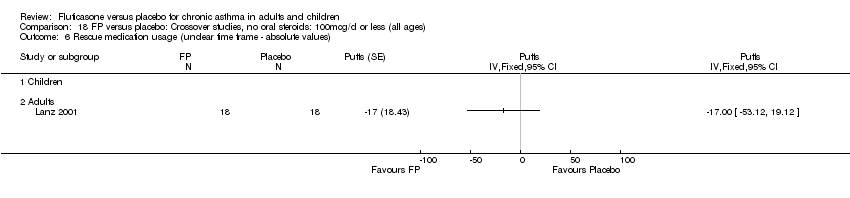
Comparison 18 FP versus placebo: Crossover studies, no oral steroids: 100mcg/d or less (all ages), Outcome 6 Rescue medication usage (unclear time frame ‐ absolute values).

Comparison 19 FP versus placebo: Crossover studies, no oral steroids: 200mcg/d (all ages), Outcome 1 FEV1.
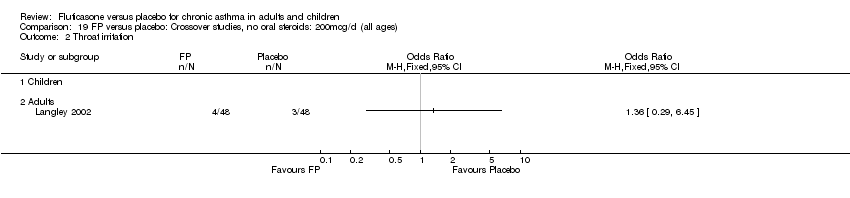
Comparison 19 FP versus placebo: Crossover studies, no oral steroids: 200mcg/d (all ages), Outcome 2 Throat irritation.

Comparison 19 FP versus placebo: Crossover studies, no oral steroids: 200mcg/d (all ages), Outcome 3 Upper respiratory tract infections.
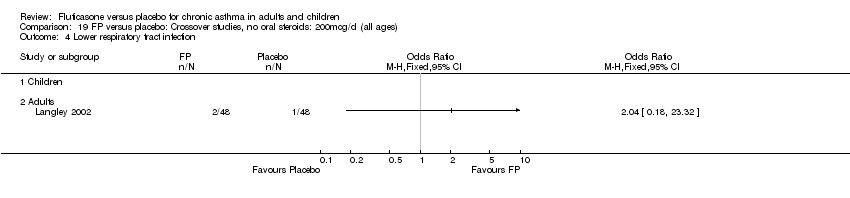
Comparison 19 FP versus placebo: Crossover studies, no oral steroids: 200mcg/d (all ages), Outcome 4 Lower respiratory tract infection.

Comparison 20 FP versus placebo: Crossover studies, no oral steroids: 500mcg/d (all ages), Outcome 1 FEV1 (absolute values).

Comparison 20 FP versus placebo: Crossover studies, no oral steroids: 500mcg/d (all ages), Outcome 2 PC 20.

Comparison 20 FP versus placebo: Crossover studies, no oral steroids: 500mcg/d (all ages), Outcome 3 Cortisol suppression.
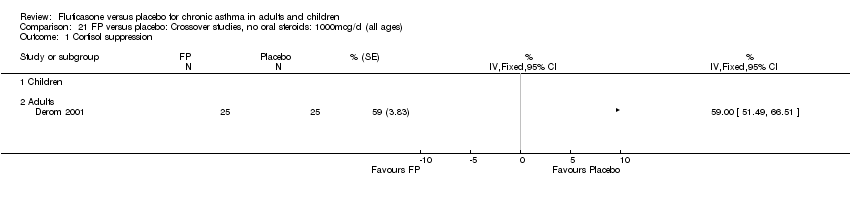
Comparison 21 FP versus placebo: Crossover studies, no oral steroids: 1000mcg/d (all ages), Outcome 1 Cortisol suppression.
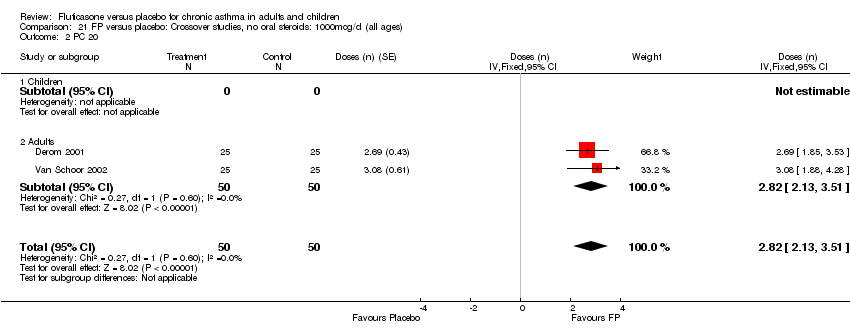
Comparison 21 FP versus placebo: Crossover studies, no oral steroids: 1000mcg/d (all ages), Outcome 2 PC 20.
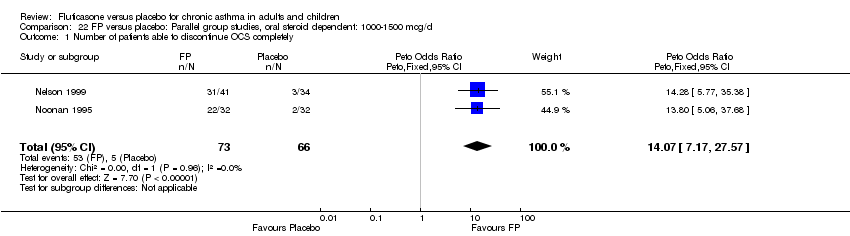
Comparison 22 FP versus placebo: Parallel group studies, oral steroid dependent: 1000‐1500 mcg/d, Outcome 1 Number of patients able to discontinue OCS completely.

Comparison 22 FP versus placebo: Parallel group studies, oral steroid dependent: 1000‐1500 mcg/d, Outcome 2 Change in daily dose of oral prednisolone compared to baseline (mg).
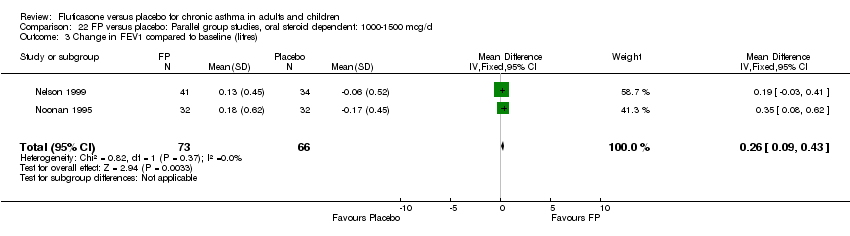
Comparison 22 FP versus placebo: Parallel group studies, oral steroid dependent: 1000‐1500 mcg/d, Outcome 3 Change in FEV1 compared to baseline (litres).

Comparison 22 FP versus placebo: Parallel group studies, oral steroid dependent: 1000‐1500 mcg/d, Outcome 4 Change in morning PEFR compared to baseline (L/min).

Comparison 22 FP versus placebo: Parallel group studies, oral steroid dependent: 1000‐1500 mcg/d, Outcome 5 Change in evening PEFR compared to baseline (L/min).

Comparison 22 FP versus placebo: Parallel group studies, oral steroid dependent: 1000‐1500 mcg/d, Outcome 6 Change in daily asthma symptom score compared to baseline.
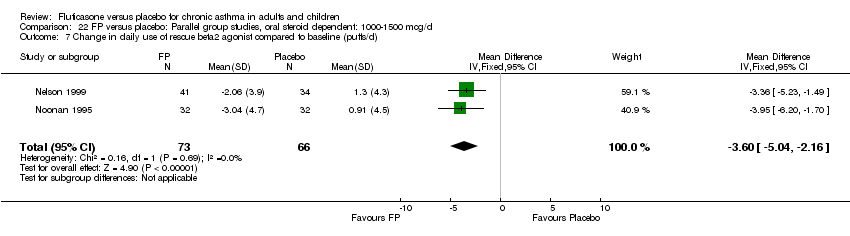
Comparison 22 FP versus placebo: Parallel group studies, oral steroid dependent: 1000‐1500 mcg/d, Outcome 7 Change in daily use of rescue beta2 agonist compared to baseline (puffs/d).

Comparison 22 FP versus placebo: Parallel group studies, oral steroid dependent: 1000‐1500 mcg/d, Outcome 8 Asthma Quality of Life Questionnaire: change in overall score compared to baseline.

Comparison 22 FP versus placebo: Parallel group studies, oral steroid dependent: 1000‐1500 mcg/d, Outcome 9 Asthma Quality of Life Questionnaire: change in activity limitation domain compared to baseline.
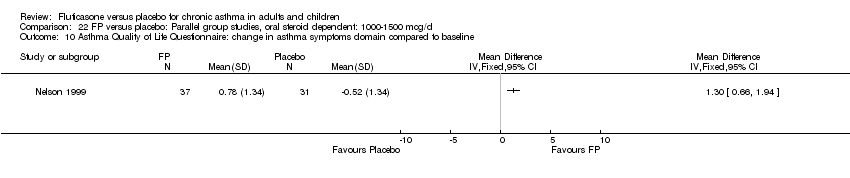
Comparison 22 FP versus placebo: Parallel group studies, oral steroid dependent: 1000‐1500 mcg/d, Outcome 10 Asthma Quality of Life Questionnaire: change in asthma symptoms domain compared to baseline.

Comparison 22 FP versus placebo: Parallel group studies, oral steroid dependent: 1000‐1500 mcg/d, Outcome 11 Asthma Quality of Life Questionnaire: change in emotional function domain compared to baseline.

Comparison 22 FP versus placebo: Parallel group studies, oral steroid dependent: 1000‐1500 mcg/d, Outcome 12 Asthma Quality of Life Questionnaire: change in enviromental exposure domain compared to baseline.

Comparison 22 FP versus placebo: Parallel group studies, oral steroid dependent: 1000‐1500 mcg/d, Outcome 14 Sore throat (No. of patients).

Comparison 22 FP versus placebo: Parallel group studies, oral steroid dependent: 1000‐1500 mcg/d, Outcome 15 Hoarseness or dysphonia (No. of patients).

Comparison 22 FP versus placebo: Parallel group studies, oral steroid dependent: 1000‐1500 mcg/d, Outcome 17 Oral Candidiasis (No. of patients).
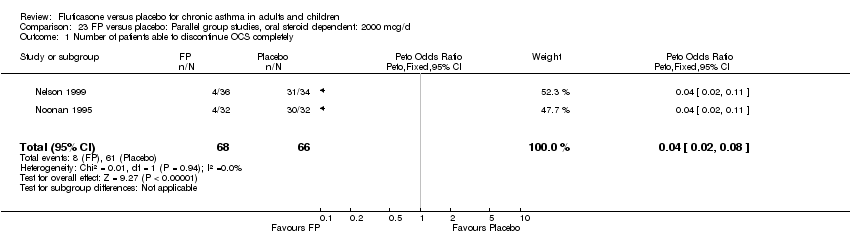
Comparison 23 FP versus placebo: Parallel group studies, oral steroid dependent: 2000 mcg/d, Outcome 1 Number of patients able to discontinue OCS completely.

Comparison 23 FP versus placebo: Parallel group studies, oral steroid dependent: 2000 mcg/d, Outcome 2 Change in daily dose of oral prednisolone compared to baseline (mg).

Comparison 23 FP versus placebo: Parallel group studies, oral steroid dependent: 2000 mcg/d, Outcome 3 Change in FEV1 compared to baseline (litres).

Comparison 23 FP versus placebo: Parallel group studies, oral steroid dependent: 2000 mcg/d, Outcome 4 Change in morning PEFR compared to baseline (L/min).

Comparison 23 FP versus placebo: Parallel group studies, oral steroid dependent: 2000 mcg/d, Outcome 5 Change in evening PEFR compared to baseline (L/min).
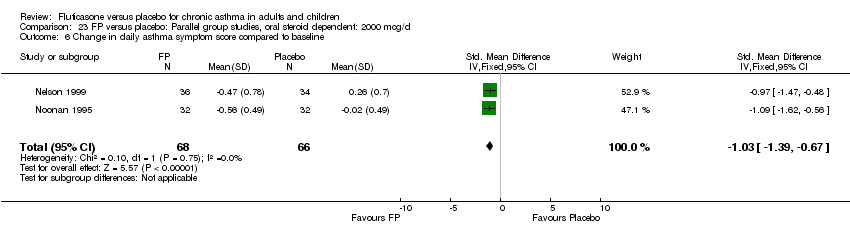
Comparison 23 FP versus placebo: Parallel group studies, oral steroid dependent: 2000 mcg/d, Outcome 6 Change in daily asthma symptom score compared to baseline.
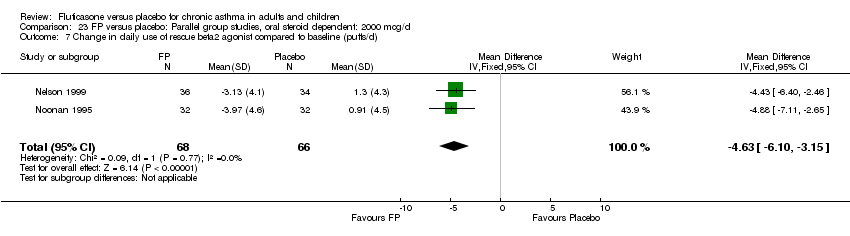
Comparison 23 FP versus placebo: Parallel group studies, oral steroid dependent: 2000 mcg/d, Outcome 7 Change in daily use of rescue beta2 agonist compared to baseline (puffs/d).

Comparison 23 FP versus placebo: Parallel group studies, oral steroid dependent: 2000 mcg/d, Outcome 8 Asthma Quality of Life Questionnaire: change in overall score compared to baseline.

Comparison 23 FP versus placebo: Parallel group studies, oral steroid dependent: 2000 mcg/d, Outcome 9 Asthma Quality of Life Questionnaire: change in activity limitation domain compared to baseline.
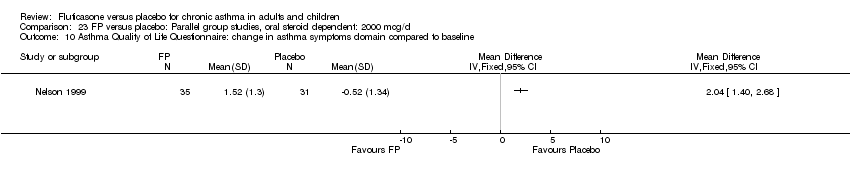
Comparison 23 FP versus placebo: Parallel group studies, oral steroid dependent: 2000 mcg/d, Outcome 10 Asthma Quality of Life Questionnaire: change in asthma symptoms domain compared to baseline.

Comparison 23 FP versus placebo: Parallel group studies, oral steroid dependent: 2000 mcg/d, Outcome 11 Asthma Quality of Life Questionnaire: change in emotional function domain compared to baseline.

Comparison 23 FP versus placebo: Parallel group studies, oral steroid dependent: 2000 mcg/d, Outcome 12 Asthma Quality of Life Questionnaire: change in enviromental exposure domain compared to baseline.
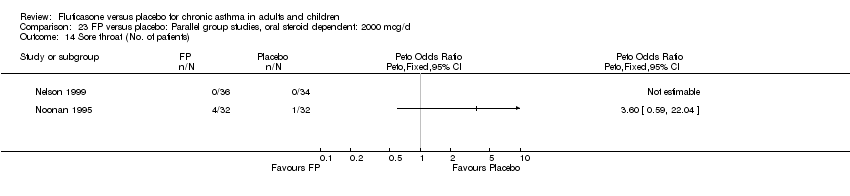
Comparison 23 FP versus placebo: Parallel group studies, oral steroid dependent: 2000 mcg/d, Outcome 14 Sore throat (No. of patients).

Comparison 23 FP versus placebo: Parallel group studies, oral steroid dependent: 2000 mcg/d, Outcome 15 Hoarseness or dysphonia (No. of patients).

Comparison 23 FP versus placebo: Parallel group studies, oral steroid dependent: 2000 mcg/d, Outcome 16 Oral Candidiasis (No. of patients).
| Study ID | Data |
| Allen 1997 | Medical Outcomes Study Short Form (SF‐36A) |
| Chervinsky 1994 | Change in urinary free cortisol compared to baseline |
| Ekroos 1998 | Histamine bronchial hyperresponsiveness (PD15 FEV1) |
| Faul 1998 | FEV1 (after treatment: baseline ratio) |
| Galant 1999 | Morning plasma cortisol |
| Hart 2000 | FEV1(reported as non‐significant) |
| Hofstra 2000 | PD20 |
| Hoekstra 1997 | Night‐time (4am) PEFR |
| Jayaram 2002 | All outcomes reported in study could not be entered as dosage was unclear. |
| Jeffery 2002 | FEV1; am PEF |
| Katz 1998 | Change in FEV1 compared to baseline |
| Langley 2002 | Rescue medication usage |
| Lindqvist 2003 | FEV1 ‐ change from baseline in L/min |
| MacKenzie 1993 | FEV1 |
| Noonan 1998 | Change in log e methacholine bronchial responsiveness PD20 FEV1 |
| Olivieri 1997 | Methacholine bronchial responsiveness PC20 FEV1 |
| Overbeek 1996 | Daily asthma symptom score |
| Pearlman 1997 | Change in evening PEFR compared to baseline |
| Wasserman 1996 | Physician‐rated global assessment of effectiveness |
| Wolfe 1996 | Change FEV1 compared to baseline |
| Issue of CLIB | Time frame of search | Search detail |
| Issue 3, 2001 | All years to March 1999 | Stage 1 electronic search: 6494 citations retrieved, 2162 unique citations imported to Inhaled Steroid Register; Stage 2 electronic search: Fluticasone Register: 258 citations (180 excluded on basis of abstract: 150 not RCT; 30 not chronic asthma in humans). 78 papers retrieved in full text form ‐ 50 excluded on full paper: 6 not RCT, 38 no randomised placebo arm, 2 treatment period < 1 week; 1 infants; 3 nebuliser delivery device; 28 papers meeting inclusion criteria; 21 unique studies meeting inclusion criteria. Other sources: Two studies (Galant 1999; Li 1999) were identified by GSK. These studies were published after the date of the final electronic search (March 1999). Five studies (Ekroos 1999; Hofstra 2000; Nathan 1999; Busse 2001; Van Schoor 2002) were identified as a result of searching respiratory society meeting abstracts. |
| Issue 2, 2005 | March 1999 to January 2004 | From handsearching the updated inhaled steroids search results (1301 additional references), a 'fluticasone' register was created consisting of 197 citations (121 references excluded from abstracts as irrelevant comparisons). Three studies reported data from two different trials each, and so two study identities were created for each study (Berger 2002 BD; Berger 2002 ICS; Sorkness 1999; Sorkness 1999a; Wolfe 2000 BD; Wolfe 2000 ICS). Seventy‐five references, pertaining to 55 studies were retrieved in full. We excluded studies for the following reasons: Wrong comparison (11); no clear diagnosis of asthma (2); acute asthma (1); not randomised (1). One study was a full published version of a previously included abstract (Busse 2001). Forty new studies were included in the January 2004 update: |
| Issue 4, 2005 | January 2004‐2005 |
| Study ID | FEV1: incl. criteria | FEV1: mean baseline | Symptom frequency | OCS treatment | ICS treatment | Author opinion | Overall estimation |
| Agertoft 1997 | Not stated | Not stated | No | Not stated | Mild | Mild | |
| Allen 1998 | >60 | 88‐89 | Not stated | No | Approx. 50% patients ICS naive at baseline, 50% previous regular ICS use | Mild to moderate | Mild to moderate |
| Allen 2000 | Not stated | 61% | Not stated | Yes | Not stated | Not stated | Severe |
| Arets 2002 | Not stated | 99‐104 | SABA >1600mcg/d during >30% days of last year excluded | No | Only ICS <100mcg/d | Mild | Mild |
| Berger 2002 BD | 60‐85% | 72‐71.9% | >/=2 puffs BD on 2 of last 7 days of run‐in; symptom scores >/=2 of last 7 days | No | Not within 1 month of study | Not stated | Mild to moderate |
| Berger 2002 ICS | 60‐90% | 75.9‐75.8% | </=30 puffs over past 7 days | No | For three months prior to randomisation | Not stated | Moderate |
| Boonsawat 2004 | Not stated | Not stated | Requirement for SABAs alone | No | No | Mild | Mild |
| Busse 2001 | 50‐80 | 68‐69 | Symptomatic despite treatment with short acting beta2 agonist | No | No | Not stated | Moderate |
| Casale 2001 | >/=65% | 3 Litres | Not stated | No | No | Mild to moderate | Mild to moderate |
| Chervinsky 1994 | 60‐90 | 71‐73 | Not stated | No | Yes: at least 1 month regular treatment with BDP prior to study | Mild to moderate | Mild to moderate |
| Condemi 1997 | 50‐80 | 66‐68 | "< 3 days needing > 12 puffs beta2 agonist in 7 days< 4 days with diurnal PEFR variability of > 20% in 7 days" | No | Yes: ICS for at least 1 month prior to study | Not stated | Moderate |
| Convery 2000 | Not stated | 100‐103 | Not stated | Not stated | Not stated | Not stated | Mild |
| Corsico 2000 | >80% | 98‐102 | Stable asthma for previous 2 months | Not stated | Not stated | Mild | Mild |
| Derom 1999 | >/=40% | 80% | Exacerbation free for 1 month | No | No | Not stated | Mild |
| Derom 2001 | Not stated | Not stated | Not stated | Not stated | Not stated | Not stated | Unclear |
| Dorinsky 2004 | 50‐85% | Not stated | 4 days of week preceding randomisation; pre‐treatment with SABA only | No | No | Not stated | Mild‐moderate |
| Ekroos 1999 | Not stated | Not stated | Not stated | No | No | Mild | Mild |
| Falcoz 2000 | 50‐80% | Not stated | Not stated | Not stated | Not stated | Mild‐moderate | Mild‐moderate |
| Falcoz 2000a | 50‐80% | Not stated | Not stated | Not stated | Not stated | Mild‐moderate | Mild‐moderate |
| Faul 1998 | >40 | 73 | Not stated | No | No | Not stated | Unclear |
| Galant 1999 | 50‐80 | 65‐67 | "Mean beta2 agonist use 3.5 puffs/dMean night awakenings/week 0.05 to 0.08" | No | 24‐30% of patients ICS treated | Mild to moderate | Mild to moderate |
| Galant 1996 | 45‐75 | 60‐62 | > 8 puffs/d beta2 agonist or 2‐4 night‐time awakenings in week run‐in | No | No | Mild to moderate | Moderate |
| Giannini 2003 | Not stated | 3.23 L | Use of ß‐agonist during run‐in (unspecified) | Not stated | Not stated | Mild‐moderate | Mild |
| Given 2004 | Not stated | Not stated | Not stated | No | Not stated | Unclear | Unclear |
| Hart 2000 | Not stated | 98.5% | Not stated | Not stated | Not stated | Mild | Mild |
| Hoekstra 1996 | >75 | 88‐92 | Not stated | No | No | Moderate | Moderate |
| Hofstra 2000 | Not stated | 96.6‐93.2% | Not stated | No | No | Not stated | Unclear |
| Jayaram 2002 | Not stated | Not stated | Not stated | Not stated | Not stated | Not stated | Unclear |
| Jeffery 2002 | Not stated | 75.6% | Not stated | No | No ‐ SABA treatment only | Not stated | Mild |
| Katz 1998 | Not stated | PEFR 75 (% predicted) or less | Asthma symptoms on at least 4 out of 10 days of run in period or at least one night‐time awakening in 10 days or 4 or puffs beta2 agonist on at least 4 days | No | No | Not stated | Moderate |
| Kavuru 2000 | 40‐85% predicted | 64% predicted | Participants excluded if excessive use of SABA during run‐in, and frequent nocturnal awakenings | No | Yes | Not stated | Moderate |
| Kemp 2004 | 50‐100% predicted | 82‐85% predicted | Mild stable asthma | No | No | Mild | Mild |
| LaForce 2000 | 50‐85% predicted | 70‐73% predicted | Participants had to have stable asthma during run‐in | No | Pharmacotherapy required for at least 3 months prior to the study (irresepective of whether ICS or not) | Not stated | Mild‐moderate |
| Langley 2002 | >/=60% | 93.5% | Not stated | No | No | Not stated | Mild |
| Lanz 2001 | 50‐85% | 75% | Not stated | No | No | Moderate | Mild‐moderate |
| Lawrence 1997 | 50‐80% | 65‐68 | "Mean beta2 agonist use 3.2 ‐ 4.2 puffs/d " | No | Yes: 3 months treatment or longer prior to study | Not stated | Moderate |
| Li 1999 | >60 | 91 | Not stated | No | No | Mild | Mild |
| Li 1999a | >60% | 80‐83% | Use of SABA on 50% days in run‐in | No | Yes ‐ 12 months with BDP up to 500mcg/d | Not stated | Moderate |
| Li 1999b | >/=50% | 82‐89% | Not stated | Prednisolone </=140mg in past year or equivalent | No | Not stated | Mild‐moderate |
| Lindqvist 2003 | 60‐100% | 79‐83% | Participants were to have been 'symptomatic' | No | No | Not stated | Mild |
| Lipworth 2005 | >/=70% | 82% | Use of SABA 2 x per week for 6 months | No | No | Mild to moderate | Mild |
| MacKenzie 1993 | Not stated | Not stated | "Patients had experienced a worsening of asthma with deterioration in lung function leading to change in medication or hospitalisation in last monthsymptoms on at least 4 out of 7 days " | No | No | Moderate | Moderate |
| Michelletto 2000 | Not stated | 73‐74% | Not stated | Not stated | Not stated | Mild‐moderate | Unclear |
| Nathan 1999 | Not stated | Not stated | Not stated | No | 85% of patients receiving ICS | Not stated | Unclear |
| Nathan 2000 | 45‐75% predicted | 63.3‐64.3 | Not stated | No | Yes | Moderate | Moderate |
| Nelson 1999 | 40‐80 | 60‐62 | Not stated | Yes | Almost 100% of patients receiving ICS | Severe | Severe |
| Nielsen 2002 | Not stated | Not stated | Not stated | No | Yes | Not stated | Unclear |
| Noonan 1998 | 60‐85 | 73‐76 | "No more than 12 puffs/d beta2 agonistand no more than 3 nights with awakening due to asthma" | No | No | Mild to moderate | Moderate |
| Noonan 1995 | 40‐80 | 56‐57.4 | Requirement for rescue beta2 agonist for 2 weeks prior to study due to symptoms | Yes | 87% of patients receiving ICS | Severe | Severe |
| Olivieri 1997 | > 80 | 98 | < 2 puffs/d beta2 agonist | No | No | Mild | Mild |
| O'Shaughnessy 1993 | > 60 | Not stated | No | No | Not stated | Mild | Mild |
| Overbeek 1996 | Not stated | 84‐86 | Not stated | No | Not stated | Not stated | Mild |
| Parameswaren 2000 | Not stated | 90.2 | Few or no symptoms | No | No | Mild | Mild |
| Pauwels 2002 | Not stated | Not stated | Not stated | Not stated | Not stated | Not stated | Unclear |
| Pearlman 1997 | 50‐80 | 66‐67 | "Mean beta2 agonist use 3.4‐4.1 puffs/dNo more than 12 puffs/d beta2 agonist and no more than 2 nights with awakening due to asthma symptoms in last 7 days" | No | Yes: at least 3 months | Moderate | Moderate |
| Pearlman 1999 | 50‐80% predicted | 65‐69 | No more than 12 puffs of SABA on more than 2 days during run‐in | No | Not in previous month | Not stated | Mild‐moderate |
| Pearlman 2002 | 45‐80% predicted | 65.3‐65.6 | Not stated | Not stated | Yes | Not stated | Moderate |
| Pearlman 2004 | 40‐85% | Not reported | Described as symptomatic | Not stated | Not stated | Not stated | Mild to moderate |
| Peden 1998 | 50‐85 | 72‐73 | "No more than 12 puffs/d beta2 agonistand no more than 3 nights with awakening due to asthmaMean awakenings per night due to asthma 0.05 to 0.09Mean beta2 agonist use 1.4 to 2.0 puffs/d" | No | Some patients: amount and type of ICS not stated | Not stated | Moderate |
| Rooklin 2001 | 40‐85% | 68% | Not stated | Not stated | Yes | Not stated | Moderate |
| SAS30021 | Not stated (am PEF 50‐85% predicted) | Not stated (am PEF 75.2‐76.7% predicted) | Symptoms on >/=4 days of week prior to randomisation | No | No | Not stated | Mild |
| SAS30024 | Not stated (pre‐BD PEF had to be >80% predicted) | 3.1 Litres | 0.57 puffs rescue medication per day | No | Not stated | Mild | Mild |
| Shapiro 2000 | 40‐85% | 66‐68% | Not stated | No | Yes | Not stated | Moderate |
| Sheffer 1996 | 45‐75 | 62‐64 | "During 7 day run‐in:> 2 night‐time awakenings due to asthma in last 7 days20% or greater PEFR diurnal variabilityat least one day in which 8 puffs beta2 agonist used " | No | No | Mild to moderate | Moderate |
| Sorkness 1999 | >/=50% | 83‐88% | Not stated | No | No | Mild to moderate | Mild to moderate |
| Sorkness 1999a | >/=50% | 83‐88% | Not stated | No | No | Mild to moderate | Mild to moderate |
| Sovijärvi 2003 | >/=65% | 79‐84 | Stable asthma | No | No | Mild | MIld |
| van Grunsven 2000 | Not stated | 93% | Not stated | Not stated | Not stated | Not stated | Mild to moderate |
| van Rensen 1999 | >75% | 95.6‐96.2% | Stable asthma | No | No | Not stated | Mild |
| Van Schoor 2002 | Not stated | Not stated | Not stated | No | Not stated | Mild | Mild |
| Ward 2001 | Not stated | 91.3% | Mild to moderate symptomatic asthma | No | No | Mild to moderater | Mild to moderate |
| Wasserman 1996 | 50‐80 | Not stated | "Mean beta2 agonist use 3.1 to 3.3 puffs/dDuring last 7 days run‐in no more than 12 puffs/d beta2 agonist and no more than 2 nights with awakening due to asthma" | No | No | Not stated | Moderate |
| Wolfe 1996 | 50‐80 | 64‐66 | During 2 week run‐in period no more than 12 puffs/d beta2 agonist and no more than 2 nights with awakening due to asthma | No | Yes | Moderate | Moderate |
| Wolfe 2000 BD | 50‐80 | 69 | During 2 week run‐in: 0 days with >/= 12 puffs of SABA prn | No | No | Not stated | Mild‐moderate |
| Wolfe 2000 ICS | 50‐80 | 70 | During 2 week run‐in: 0 days with >/= 12 puffs of SABA prn | No | Yes ‐ for 3 months prior to study entry | Not stated | Moderate |
| ZuWallack 2000 | 50‐80% | 66‐68% | Not stated | No | Yes | Not stated | Moderate |
| Study ID | FEV1 | PEFR | Beta2 agonist use | Night‐time awakening | Exacerbations |
| Chervinsky 1994 | 20% or greater decrease compared to baseline | 20% decrease in morning or evening PEFR on 4 or more days out of 7 in week prior to clinic visit | 12 or more puffs on 3 or more days out of 7 in week prior to clinic visit | 2 or more nights with 2 awakening out of 7 in week prior to clinic visit | Any clinical exacerbation requiring emergency treatment, hospital admission or additional asthma medication other than rescue beta 2 agonist |
| Galant 1996 | 15% or greater decrease compared to baseline | 20% or greater decrease in morning PEFR on 3 or more days out of 7 in week prior to clinic visit | 12 or more puffs on 3 or more days out of 7 in week prior to clinic visit | 3 or more awakening in week prior to clinic visit | |
| Katz 1997 | 15% or greater decrease compared to baseline | 15% or greater decrease in morning PEFR on 3 or more days out of 7 in week prior to clinic visit | 8 or more puffs on 2 or more days out of 7 in week prior to clinic visit | 2 or more nights with awakening out of 7 in week prior to clinic visit | |
| Kavuru 2000 | 20% or greater decrease compared to baseline | 20% or greater decrease from mean am PEF compared to baseline on 3 or more days out of 7 in week prior to clinic visit | 12 or more puffs on 2 or more days out of 7 in week prior to clinic visit | 2 or more awakening in week prior to clinic visit | Any clinical exacerbation requiring emergency treatment, hospital admission or additional asthma medication other than rescue beta 2 agonist |
| Nathan 2000 | 20% or greater decrease compared to baseline | 20% or greater decrease compared to baseline | 12 or more puffs on 2 or more days out of 7 in week prior to clinic visit | 2 or more awakening in week prior to clinic visit | Any clinical exacerbation requiring emergency treatment, hospital admission or additional asthma medication other than rescue beta 2 agonist |
| Pearlman 1997 | 20% or greater decrease compared to baseline | 20% or greater decrease in morning PEFR on 3 or more days out of 7 in week prior to clinic visit | 12 or more puffs on 2 or more days out of 7 in week prior to clinic visit | 2 or more awakening in week prior to clinic visit | Any clinical exacerbation requiring emergency treatment, hospital admission or additional asthma medication other than rescue beta 2 agonist |
| Peden 1997 | 15% or greater decrease compared to baseline | 20% or greater decrease in morning PEFR on 3 or more days out of 7 in week prior to clinic visit | 12 or more puffs on 3 or more days out of 7 in week prior to clinic visit | 3 or more awakening in week prior to clinic visit | Any clinical exacerbation requiring emergency treatment, hospital admission or additional asthma medication other than rescue beta 2 agonist |
| Shapiro 2000 | 20% or greater decrease compared to baseline | 20% or greater decrease compared to baseline on 3+ days out of preceding 7 prior to clinic visit | 12 or more puffs on 2 or more days out of 7 in week prior to clinic visit | 2 or more awakening in week prior to clinic visit | Any clinical exacerbation requiring emergency treatment, hospital admission or additional asthma medication other than rescue beta 2 agonist |
| Sheffer 1996 | 15% or greater decrease compared to baseline | 20% or greater decrease in morning PEFR on 3 or more days out of 7 in week prior to clinic visit | 12 or more puffs on 3 or more days out of 7 in week prior to clinic visit | 3 or more nights with awakening out of 7 in week prior to clinic visit | Any clinical exacerbation requiring emergency treatment, hospital admission or additional asthma medication other than rescue beta 2 agonist |
| Wolfe 2000 (BD and ICS studies) | 20% or greater decrease compared to baseline | 20% or greater decrease compared to baseline | 12 or more puffs on 2 or more days out of 7 in week prior to clinic visit | 2 or more awakening in week prior to clinic visit | Any clinical exacerbation requiring emergency treatment, hospital admission or additional asthma medication other than rescue beta 2 agonist |
| ZuWallack 2000 | 20% or greater decrease compared to baseline | 20% or greater decrease compared to baseline on 3+ days out of preceding 7 prior to clinic visit | 12 or more puffs on 2 or more days out of 7 in week prior to clinic visit | 2 or more awakening in week prior to clinic visit | Any clinical exacerbation requiring emergency treatment, hospital admission or additional asthma medication other than rescue beta 2 agonist |
| Study ID | Definition |
| Allen 1998 | Requirement for more than two 7‐day courses of oral corticosteroid for asthma exacerbation |
| Berger 2002 | Requirement for treatmen with oral or parenteral steroids |
| Hoekstra 1996 | Treatment with oral steroids |
| Oliveri 1997 | Not given |
| Overbeek 1996 | Not given |
| Pearlman 1999 | Not given |
| Shapiro 2000 | Requirement for emergency treatment, hospitalisation or usage of medication not allowed by study protocol |
| Outcome or subgroup title | No. of studies | No. of participants | Statistical method | Effect size |
| 1 Change in FEV1 compared to baseline (litres) Show forest plot | 9 | 1364 | Mean Difference (IV, Fixed, 95% CI) | 0.30 [0.25, 0.34] |
| 1.1 Children | 2 | 321 | Mean Difference (IV, Fixed, 95% CI) | 0.12 [0.04, 0.20] |
| 1.2 Adults | 7 | 1043 | Mean Difference (IV, Fixed, 95% CI) | 0.38 [0.32, 0.43] |
| 2 Change in FEV1 compared to baseline (litres) Show forest plot | 10 | 1673 | Litres (Fixed, 95% CI) | 0.21 [0.18, 0.25] |
| 2.1 Children | 2 | 321 | Litres (Fixed, 95% CI) | 0.11 [0.05, 0.18] |
| 2.2 Adults | 8 | 1352 | Litres (Fixed, 95% CI) | 0.26 [0.21, 0.31] |
| 3 FEV1 ‐ Litres (absolute values) Show forest plot | 1 | Mean Difference (IV, Fixed, 95% CI) | Totals not selected | |
| 3.1 Children | 0 | Mean Difference (IV, Fixed, 95% CI) | 0.0 [0.0, 0.0] | |
| 3.2 Adults | 1 | Mean Difference (IV, Fixed, 95% CI) | 0.0 [0.0, 0.0] | |
| 4 Change in morning PEFR compared to baseline (L/min) Show forest plot | 10 | 1705 | Mean Difference (IV, Fixed, 95% CI) | 22.79 [19.07, 26.51] |
| 4.1 Children | 2 | 353 | Mean Difference (IV, Fixed, 95% CI) | 26.41 [18.03, 34.79] |
| 4.2 Adults | 8 | 1352 | Mean Difference (IV, Fixed, 95% CI) | 21.91 [17.76, 26.06] |
| 5 Change in am PEF (predicted) Show forest plot | 1 | % (Fixed, 95% CI) | Totals not selected | |
| 5.1 Children | 1 | % (Fixed, 95% CI) | 0.0 [0.0, 0.0] | |
| 5.2 Adults | 0 | % (Fixed, 95% CI) | 0.0 [0.0, 0.0] | |
| 6 Change in evening PEFR compared to baseline (L/min) Show forest plot | 8 | 1794 | Mean Difference (IV, Fixed, 95% CI) | 11.46 [8.19, 14.74] |
| 6.1 Children | 2 | 780 | Mean Difference (IV, Fixed, 95% CI) | 6.98 [2.26, 11.71] |
| 6.2 Adults | 6 | 1014 | Mean Difference (IV, Fixed, 95% CI) | 15.60 [11.06, 20.15] |
| 7 Change in evening PEFR compared to baseline Show forest plot | 9 | 1954 | Litres/min (Fixed, 95% CI) | 12.08 [8.87, 15.30] |
| 7.1 Children | 2 | 780 | Litres/min (Fixed, 95% CI) | 6.98 [2.26, 11.70] |
| 7.2 Adults | 7 | 1174 | Litres/min (Fixed, 95% CI) | 16.51 [12.12, 20.91] |
| 8 Change in evening PEF (predicted) Show forest plot | 1 | % (Fixed, 95% CI) | Totals not selected | |
| 8.1 Children | 1 | % (Fixed, 95% CI) | 0.0 [0.0, 0.0] | |
| 8.2 Adults | 0 | % (Fixed, 95% CI) | 0.0 [0.0, 0.0] | |
| 9 Peak flow ‐ L/min (absolute values) Show forest plot | 1 | Mean Difference (IV, Fixed, 95% CI) | Totals not selected | |
| 9.1 Children | 0 | Mean Difference (IV, Fixed, 95% CI) | 0.0 [0.0, 0.0] | |
| 9.2 Adults | 1 | Mean Difference (IV, Fixed, 95% CI) | 0.0 [0.0, 0.0] | |
| 10 Change in clinic PEFR compared to baseline (L/min) Show forest plot | 1 | Mean Difference (IV, Fixed, 95% CI) | Totals not selected | |
| 10.1 Children | 1 | Mean Difference (IV, Fixed, 95% CI) | 0.0 [0.0, 0.0] | |
| 10.2 Adults | 0 | Mean Difference (IV, Fixed, 95% CI) | 0.0 [0.0, 0.0] | |
| 11 Change in FVC compared to baseline (litres) Show forest plot | 1 | Mean Difference (IV, Fixed, 95% CI) | Totals not selected | |
| 11.1 Children | 0 | Mean Difference (IV, Fixed, 95% CI) | 0.0 [0.0, 0.0] | |
| 11.2 Adults | 1 | Mean Difference (IV, Fixed, 95% CI) | 0.0 [0.0, 0.0] | |
| 12 Change in FEF25‐75 compared to baseline (L/second) Show forest plot | 2 | 467 | Mean Difference (IV, Fixed, 95% CI) | 0.20 [0.05, 0.34] |
| 12.1 Children | 0 | 0 | Mean Difference (IV, Fixed, 95% CI) | 0.0 [0.0, 0.0] |
| 12.2 Adults | 2 | 467 | Mean Difference (IV, Fixed, 95% CI) | 0.20 [0.05, 0.34] |
| 13 Change in daily asthma symptom score compared to baseline Show forest plot | 8 | 1238 | Std. Mean Difference (IV, Fixed, 95% CI) | ‐0.57 [‐0.69, ‐0.46] |
| 13.1 Children | 2 | 353 | Std. Mean Difference (IV, Fixed, 95% CI) | ‐0.52 [‐0.73, ‐0.31] |
| 13.2 Adults | 6 | 885 | Std. Mean Difference (IV, Fixed, 95% CI) | ‐0.60 [‐0.73, ‐0.46] |
| 14 Symptoms ‐ absolute scores Show forest plot | 1 | Mean Difference (IV, Fixed, 95% CI) | Totals not selected | |
| 14.1 Children | 0 | Mean Difference (IV, Fixed, 95% CI) | 0.0 [0.0, 0.0] | |
| 14.2 Adults | 1 | Mean Difference (IV, Fixed, 95% CI) | 0.0 [0.0, 0.0] | |
| 15 Change in night‐time wakening score Show forest plot | 6 | 895 | Std. Mean Difference (IV, Fixed, 95% CI) | ‐0.25 [‐0.38, ‐0.12] |
| 15.1 Children | 1 | 176 | Std. Mean Difference (IV, Fixed, 95% CI) | ‐0.29 [‐0.59, 0.01] |
| 15.2 Adults | 5 | 719 | Std. Mean Difference (IV, Fixed, 95% CI) | ‐0.24 [‐0.39, ‐0.09] |
| 16 Nighttime awakenings/night Show forest plot | 1 | Mean Difference (IV, Fixed, 95% CI) | Totals not selected | |
| 16.1 Children | 0 | Mean Difference (IV, Fixed, 95% CI) | 0.0 [0.0, 0.0] | |
| 16.2 Adults | 1 | Mean Difference (IV, Fixed, 95% CI) | 0.0 [0.0, 0.0] | |
| 17 Change in number night‐time wakenings per week Show forest plot | 4 | 648 | Mean Difference (IV, Fixed, 95% CI) | ‐0.11 [‐0.17, ‐0.05] |
| 17.1 Children | 0 | 0 | Mean Difference (IV, Fixed, 95% CI) | 0.0 [0.0, 0.0] |
| 17.2 Adults | 4 | 648 | Mean Difference (IV, Fixed, 95% CI) | ‐0.11 [‐0.17, ‐0.05] |
| 18 Change in daily use of beta2 agonist compared to baseline (puffs/d) Show forest plot | 9 | 1839 | Mean Difference (IV, Fixed, 95% CI) | ‐0.94 [‐1.14, ‐0.74] |
| 18.1 Children | 3 | 957 | Mean Difference (IV, Fixed, 95% CI) | ‐0.60 [‐0.87, ‐0.33] |
| 18.2 Adults | 6 | 882 | Mean Difference (IV, Fixed, 95% CI) | ‐1.36 [‐1.66, ‐1.06] |
| 19 Rescue medication usage ‐ puffs/d (absolute scores) Show forest plot | 1 | Mean Difference (IV, Fixed, 95% CI) | Totals not selected | |
| 19.1 Children | 0 | Mean Difference (IV, Fixed, 95% CI) | 0.0 [0.0, 0.0] | |
| 19.2 Adults | 1 | Mean Difference (IV, Fixed, 95% CI) | 0.0 [0.0, 0.0] | |
| 20 HRQOL: AQLQ Show forest plot | 1 | Mean Difference (IV, Fixed, 95% CI) | Totals not selected | |
| 20.1 Children | 0 | Mean Difference (IV, Fixed, 95% CI) | 0.0 [0.0, 0.0] | |
| 20.2 Adults | 1 | Mean Difference (IV, Fixed, 95% CI) | 0.0 [0.0, 0.0] | |
| 21 HRQOL: Functional Status IIR questionaire (short version) Show forest plot | 1 | Mean Difference (IV, Fixed, 95% CI) | Totals not selected | |
| 21.1 Children | 1 | Mean Difference (IV, Fixed, 95% CI) | 0.0 [0.0, 0.0] | |
| 21.2 Adults | 0 | Mean Difference (IV, Fixed, 95% CI) | 0.0 [0.0, 0.0] | |
| 22 HRQOL: Quality of Life of Parents of Asthmatic Children questionnaire, burden dimension Show forest plot | 1 | Mean Difference (IV, Fixed, 95% CI) | Totals not selected | |
| 22.1 Children | 1 | Mean Difference (IV, Fixed, 95% CI) | 0.0 [0.0, 0.0] | |
| 22.2 Adults | 0 | Mean Difference (IV, Fixed, 95% CI) | 0.0 [0.0, 0.0] | |
| 23 HRQOL: Quality of Life of Parents of Asthmatic Children questionnaire, subjective norms dimension Show forest plot | 1 | Mean Difference (IV, Fixed, 95% CI) | Totals not selected | |
| 23.1 Children | 1 | Mean Difference (IV, Fixed, 95% CI) | 0.0 [0.0, 0.0] | |
| 23.2 Adults | 0 | Mean Difference (IV, Fixed, 95% CI) | 0.0 [0.0, 0.0] | |
| 24 HRQOL: Quality of Life of Parents of Asthmatic Children questionnaire, social dimension Show forest plot | 1 | Mean Difference (IV, Fixed, 95% CI) | Totals not selected | |
| 24.1 Children | 1 | Mean Difference (IV, Fixed, 95% CI) | 0.0 [0.0, 0.0] | |
| 24.2 Adults | 0 | Mean Difference (IV, Fixed, 95% CI) | 0.0 [0.0, 0.0] | |
| 25 HRQOL: Sleep Scale Children questionnaire Show forest plot | 1 | Mean Difference (IV, Fixed, 95% CI) | Totals not selected | |
| 25.1 Children | 1 | Mean Difference (IV, Fixed, 95% CI) | 0.0 [0.0, 0.0] | |
| 25.2 Adults | 0 | Mean Difference (IV, Fixed, 95% CI) | 0.0 [0.0, 0.0] | |
| 26 Physician‐rated efficacy: effective or very effective Show forest plot | 4 | 664 | Peto Odds Ratio (Peto, Fixed, 95% CI) | 5.12 [3.76, 6.98] |
| 26.1 Children | 0 | 0 | Peto Odds Ratio (Peto, Fixed, 95% CI) | 0.0 [0.0, 0.0] |
| 26.2 Adults | 4 | 664 | Peto Odds Ratio (Peto, Fixed, 95% CI) | 5.12 [3.76, 6.98] |
| 27 Withdrawal due to clinical asthma exacerbation (No. of patients) Show forest plot | 1 | Peto Odds Ratio (Peto, Fixed, 95% CI) | Totals not selected | |
| 27.1 Children | 1 | Peto Odds Ratio (Peto, Fixed, 95% CI) | 0.0 [0.0, 0.0] | |
| 27.2 Adults | 0 | Peto Odds Ratio (Peto, Fixed, 95% CI) | 0.0 [0.0, 0.0] | |
| 28 Withdrawal due to lack of treatment efficacy (No. of patients) Show forest plot | 8 | 1479 | Peto Odds Ratio (Peto, Fixed, 95% CI) | 0.26 [0.20, 0.32] |
| 28.1 Children | 2 | 353 | Peto Odds Ratio (Peto, Fixed, 95% CI) | 0.32 [0.21, 0.49] |
| 28.2 Adults | 6 | 1126 | Peto Odds Ratio (Peto, Fixed, 95% CI) | 0.23 [0.17, 0.31] |
| 29 Withdrawals due to adverse events Show forest plot | 3 | 957 | Odds Ratio (M‐H, Fixed, 95% CI) | 1.11 [0.38, 3.20] |
| 29.1 Children | 1 | 604 | Odds Ratio (M‐H, Fixed, 95% CI) | 1.24 [0.33, 4.65] |
| 29.2 Adults | 2 | 353 | Odds Ratio (M‐H, Fixed, 95% CI) | 0.90 [0.15, 5.43] |
| 30 Morning plasma cortisol (mcg/dL) Show forest plot | 2 | 197 | Mean Difference (IV, Fixed, 95% CI) | 0.27 [‐1.05, 1.59] |
| 30.1 Children | 1 | 159 | Mean Difference (IV, Fixed, 95% CI) | 0.70 [‐0.84, 2.24] |
| 30.2 Adults | 1 | 38 | Mean Difference (IV, Fixed, 95% CI) | ‐0.90 [‐3.46, 1.66] |
| 31 Total urinary free cortisol excretion (mcg/24 hours) Show forest plot | 1 | Mean Difference (IV, Fixed, 95% CI) | Totals not selected | |
| 31.1 Children | 1 | Mean Difference (IV, Fixed, 95% CI) | 0.0 [0.0, 0.0] | |
| 31.2 Adults | 0 | Mean Difference (IV, Fixed, 95% CI) | 0.0 [0.0, 0.0] | |
| 32 Sore throat or pharyngitis (No. of patients) Show forest plot | 6 | 1336 | Peto Odds Ratio (Peto, Fixed, 95% CI) | 1.98 [0.97, 4.04] |
| 32.1 Children | 2 | 821 | Peto Odds Ratio (Peto, Fixed, 95% CI) | 1.71 [0.73, 3.99] |
| 32.2 Adults | 4 | 515 | Peto Odds Ratio (Peto, Fixed, 95% CI) | 2.82 [0.74, 10.75] |
| 33 Hoarseness or dysphonia (No. of patients) Show forest plot | 7 | 1215 | Peto Odds Ratio (Peto, Fixed, 95% CI) | 5.00 [1.53, 16.37] |
| 33.1 Children | 2 | 395 | Peto Odds Ratio (Peto, Fixed, 95% CI) | 7.19 [0.74, 69.93] |
| 33.2 Adults | 5 | 820 | Peto Odds Ratio (Peto, Fixed, 95% CI) | 4.36 [1.09, 17.52] |
| 34 Oral Candidiasis (No. of patients) Show forest plot | 7 | 1298 | Peto Odds Ratio (Peto, Fixed, 95% CI) | 3.45 [1.29, 9.26] |
| 34.1 Children | 3 | 653 | Peto Odds Ratio (Peto, Fixed, 95% CI) | 1.98 [0.40, 9.85] |
| 34.2 Adults | 4 | 645 | Peto Odds Ratio (Peto, Fixed, 95% CI) | 4.84 [1.39, 16.88] |
| 35 Headaches Show forest plot | 3 | 957 | Odds Ratio (M‐H, Fixed, 95% CI) | 0.82 [0.58, 1.17] |
| 35.1 Children | 1 | 604 | Odds Ratio (M‐H, Fixed, 95% CI) | 0.74 [0.50, 1.10] |
| 35.2 Adults | 2 | 353 | Odds Ratio (M‐H, Fixed, 95% CI) | 1.22 [0.57, 2.59] |
| Outcome or subgroup title | No. of studies | No. of participants | Statistical method | Effect size |
| 1 Change in FEV1 compared to baseline (litres) Show forest plot | 10 | 1673 | Litres (Fixed, 95% CI) | 0.21 [0.18, 0.25] |
| 1.1 1‐4 weeks | 0 | 0 | Litres (Fixed, 95% CI) | 0.0 [0.0, 0.0] |
| 1.2 1‐5 months | 10 | 1673 | Litres (Fixed, 95% CI) | 0.21 [0.18, 0.25] |
| 1.3 6 months or longer | 0 | 0 | Litres (Fixed, 95% CI) | 0.0 [0.0, 0.0] |
| 2 Change in morning PEFR compared to baseline (L/min) Show forest plot | 10 | 1705 | Mean Difference (IV, Fixed, 95% CI) | 22.79 [19.07, 26.51] |
| 2.1 1‐4 weeks | 0 | 0 | Mean Difference (IV, Fixed, 95% CI) | 0.0 [0.0, 0.0] |
| 2.2 1‐5 months | 10 | 1705 | Mean Difference (IV, Fixed, 95% CI) | 22.79 [19.07, 26.51] |
| 2.3 6 months or longer | 0 | 0 | Mean Difference (IV, Fixed, 95% CI) | 0.0 [0.0, 0.0] |
| 3 Change in evening PEFR compared to baseline Show forest plot | 9 | 1954 | Litres/min (Fixed, 95% CI) | 12.08 [8.87, 15.30] |
| 3.1 1‐4 weeks | 0 | 0 | Litres/min (Fixed, 95% CI) | 0.0 [0.0, 0.0] |
| 3.2 1‐5 months | 9 | 1954 | Litres/min (Fixed, 95% CI) | 12.08 [8.87, 15.30] |
| 3.3 6 months or greater | 0 | 0 | Litres/min (Fixed, 95% CI) | 0.0 [0.0, 0.0] |
| 4 Change in daily asthma symptom score compared to baseline Show forest plot | 8 | 1238 | Std. Mean Difference (IV, Fixed, 95% CI) | ‐0.57 [‐0.69, ‐0.46] |
| 4.1 1‐4 weeks | 0 | 0 | Std. Mean Difference (IV, Fixed, 95% CI) | 0.0 [0.0, 0.0] |
| 4.2 1‐5 months | 8 | 1238 | Std. Mean Difference (IV, Fixed, 95% CI) | ‐0.57 [‐0.69, ‐0.46] |
| 4.3 6 months or longer | 0 | 0 | Std. Mean Difference (IV, Fixed, 95% CI) | 0.0 [0.0, 0.0] |
| 5 Change in number night‐time wakenings per week Show forest plot | 4 | 648 | Mean Difference (IV, Fixed, 95% CI) | ‐0.11 [‐0.17, ‐0.05] |
| 5.1 1‐4 weeks | 0 | 0 | Mean Difference (IV, Fixed, 95% CI) | 0.0 [0.0, 0.0] |
| 5.2 1‐5 months | 4 | 648 | Mean Difference (IV, Fixed, 95% CI) | ‐0.11 [‐0.17, ‐0.05] |
| 5.3 6 months or longer | 0 | 0 | Mean Difference (IV, Fixed, 95% CI) | 0.0 [0.0, 0.0] |
| 6 Change in night‐time wakening score Show forest plot | 6 | 895 | Std. Mean Difference (IV, Fixed, 95% CI) | ‐0.25 [‐0.38, ‐0.12] |
| 6.1 1‐4 weeks | 0 | 0 | Std. Mean Difference (IV, Fixed, 95% CI) | 0.0 [0.0, 0.0] |
| 6.2 1‐5 months | 6 | 895 | Std. Mean Difference (IV, Fixed, 95% CI) | ‐0.25 [‐0.38, ‐0.12] |
| 6.3 6 months or longer | 0 | 0 | Std. Mean Difference (IV, Fixed, 95% CI) | 0.0 [0.0, 0.0] |
| 7 Change in daily use of beta2 agonist compared to baseline (puffs/d) Show forest plot | 9 | 1839 | Mean Difference (IV, Fixed, 95% CI) | ‐0.94 [‐1.14, ‐0.74] |
| 7.1 1‐4 weeks | 0 | 0 | Mean Difference (IV, Fixed, 95% CI) | 0.0 [0.0, 0.0] |
| 7.2 1‐5 months | 9 | 1839 | Mean Difference (IV, Fixed, 95% CI) | ‐0.94 [‐1.14, ‐0.74] |
| 7.3 6 months or longer | 0 | 0 | Mean Difference (IV, Fixed, 95% CI) | 0.0 [0.0, 0.0] |
| 8 Physician‐rated efficacy: effective or very effective Show forest plot | 4 | 664 | Peto Odds Ratio (Peto, Fixed, 95% CI) | 5.12 [3.76, 6.98] |
| 8.1 1‐4 weeks | 0 | 0 | Peto Odds Ratio (Peto, Fixed, 95% CI) | 0.0 [0.0, 0.0] |
| 8.2 1‐5 months | 4 | 664 | Peto Odds Ratio (Peto, Fixed, 95% CI) | 5.12 [3.76, 6.98] |
| 8.3 6 months or greater | 0 | 0 | Peto Odds Ratio (Peto, Fixed, 95% CI) | 0.0 [0.0, 0.0] |
| 9 Withdrawal due to lack of treatment efficacy (No. of patients) Show forest plot | 8 | 1479 | Peto Odds Ratio (Peto, Fixed, 95% CI) | 0.26 [0.20, 0.32] |
| 9.1 1‐4 weeks | 0 | 0 | Peto Odds Ratio (Peto, Fixed, 95% CI) | 0.0 [0.0, 0.0] |
| 9.2 1‐5 months | 8 | 1479 | Peto Odds Ratio (Peto, Fixed, 95% CI) | 0.26 [0.20, 0.32] |
| 9.3 6 months or greater | 0 | 0 | Peto Odds Ratio (Peto, Fixed, 95% CI) | 0.0 [0.0, 0.0] |
| 10 Sore throat or pharyngitis (No. of patients) Show forest plot | 6 | 1336 | Peto Odds Ratio (Peto, Fixed, 95% CI) | 1.98 [0.97, 4.04] |
| 10.1 1‐4 weeks | 1 | 38 | Peto Odds Ratio (Peto, Fixed, 95% CI) | 2.38 [0.31, 18.63] |
| 10.2 1‐5 months | 4 | 1081 | Peto Odds Ratio (Peto, Fixed, 95% CI) | 1.71 [0.73, 3.98] |
| 10.3 6 months or greater | 1 | 217 | Peto Odds Ratio (Peto, Fixed, 95% CI) | 3.24 [0.55, 19.04] |
| 11 Hoarseness or dysphonia (No. of patients) Show forest plot | 7 | 1215 | Peto Odds Ratio (Peto, Fixed, 95% CI) | 5.00 [1.53, 16.37] |
| 11.1 1‐4 weeks | 0 | 0 | Peto Odds Ratio (Peto, Fixed, 95% CI) | 0.0 [0.0, 0.0] |
| 11.2 1‐5 months | 6 | 998 | Peto Odds Ratio (Peto, Fixed, 95% CI) | 4.36 [1.09, 17.52] |
| 11.3 6 months or greater | 1 | 217 | Peto Odds Ratio (Peto, Fixed, 95% CI) | 7.19 [0.74, 69.93] |
| 12 Oral Candidiasis (No. of patients) Show forest plot | 7 | 1298 | Peto Odds Ratio (Peto, Fixed, 95% CI) | 3.45 [1.29, 9.26] |
| 12.1 1‐4 weeks | 1 | 258 | Peto Odds Ratio (Peto, Fixed, 95% CI) | 0.14 [0.00, 6.93] |
| 12.2 1‐5 months | 5 | 823 | Peto Odds Ratio (Peto, Fixed, 95% CI) | 3.77 [1.21, 11.79] |
| 12.3 6 months or greater | 1 | 217 | Peto Odds Ratio (Peto, Fixed, 95% CI) | 7.19 [0.74, 69.93] |
| 13 Withdrawals due to adverse events Show forest plot | 3 | 957 | Odds Ratio (M‐H, Fixed, 95% CI) | 1.11 [0.38, 3.20] |
| 13.1 1‐4 weeks | 0 | 0 | Odds Ratio (M‐H, Fixed, 95% CI) | 0.0 [0.0, 0.0] |
| 13.2 1‐5 months | 3 | 957 | Odds Ratio (M‐H, Fixed, 95% CI) | 1.11 [0.38, 3.20] |
| 13.3 6 months or greater | 0 | 0 | Odds Ratio (M‐H, Fixed, 95% CI) | 0.0 [0.0, 0.0] |
| Outcome or subgroup title | No. of studies | No. of participants | Statistical method | Effect size |
| 1 Change in FEV1 compared to baseline (litres) Show forest plot | 10 | 1673 | Litres (Fixed, 95% CI) | 0.21 [0.18, 0.25] |
| 1.1 MDI | 4 | 559 | Litres (Fixed, 95% CI) | 0.40 [0.32, 0.48] |
| 1.2 DPI | 6 | 1114 | Litres (Fixed, 95% CI) | 0.16 [0.12, 0.21] |
| 2 Change in morning PEFR compared to baseline (L/min) Show forest plot | 10 | 1705 | Mean Difference (IV, Fixed, 95% CI) | 22.79 [19.07, 26.51] |
| 2.1 MDI | 5 | 868 | Mean Difference (IV, Fixed, 95% CI) | 17.86 [12.36, 23.35] |
| 2.2 DPI | 5 | 837 | Mean Difference (IV, Fixed, 95% CI) | 26.98 [21.92, 32.04] |
| 3 Change in evening PEFR compared to baseline Show forest plot | 9 | 1954 | Litres/min (Fixed, 95% CI) | 12.08 [8.87, 15.30] |
| 3.1 MDI | 3 | 381 | Litres/min (Fixed, 95% CI) | 19.11 [12.08, 26.14] |
| 3.2 DPI | 6 | 1573 | Litres/min (Fixed, 95% CI) | 10.22 [6.61, 13.84] |
| 4 Change in daily asthma symptom score compared to baseline Show forest plot | 8 | 1238 | Std. Mean Difference (IV, Fixed, 95% CI) | ‐0.57 [‐0.69, ‐0.46] |
| 4.1 MDI | 4 | 559 | Std. Mean Difference (IV, Fixed, 95% CI) | ‐0.52 [‐0.69, ‐0.35] |
| 4.2 DPI | 4 | 679 | Std. Mean Difference (IV, Fixed, 95% CI) | ‐0.62 [‐0.78, ‐0.47] |
| 5 Change in number night‐time wakenings per week Show forest plot | 4 | 648 | Mean Difference (IV, Fixed, 95% CI) | ‐0.11 [‐0.17, ‐0.05] |
| 5.1 MDI | 3 | 488 | Mean Difference (IV, Fixed, 95% CI) | ‐0.09 [‐0.16, ‐0.02] |
| 5.2 DPI | 1 | 160 | Mean Difference (IV, Fixed, 95% CI) | ‐0.18 [‐0.31, ‐0.05] |
| 6 Change in night‐time wakening score Show forest plot | 6 | 895 | Std. Mean Difference (IV, Fixed, 95% CI) | ‐0.25 [‐0.38, ‐0.12] |
| 6.1 MDI | 4 | 559 | Std. Mean Difference (IV, Fixed, 95% CI) | ‐0.18 [‐0.35, ‐0.02] |
| 6.2 DPI | 2 | 336 | Std. Mean Difference (IV, Fixed, 95% CI) | ‐0.36 [‐0.58, ‐0.14] |
| 7 Change in daily use of beta2 agonist compared to baseline (puffs/d) Show forest plot | 9 | 1839 | Mean Difference (IV, Fixed, 95% CI) | ‐0.94 [‐1.14, ‐0.74] |
| 7.1 MDI | 4 | 559 | Mean Difference (IV, Fixed, 95% CI) | ‐1.11 [‐1.48, ‐0.74] |
| 7.2 DPI | 5 | 1280 | Mean Difference (IV, Fixed, 95% CI) | ‐0.87 [‐1.11, ‐0.63] |
| 8 Physician‐rated efficacy: effective or very effective Show forest plot | 4 | 664 | Peto Odds Ratio (Peto, Fixed, 95% CI) | 5.12 [3.76, 6.98] |
| 8.1 MDI | 2 | 336 | Peto Odds Ratio (Peto, Fixed, 95% CI) | 5.15 [3.31, 8.02] |
| 8.2 DPI | 2 | 328 | Peto Odds Ratio (Peto, Fixed, 95% CI) | 5.09 [3.30, 7.85] |
| 9 Withdrawal due to lack of treatment efficacy (No. of patients) Show forest plot | 8 | 1479 | Peto Odds Ratio (Peto, Fixed, 95% CI) | 0.26 [0.20, 0.32] |
| 9.1 MDI | 4 | 801 | Peto Odds Ratio (Peto, Fixed, 95% CI) | 0.23 [0.16, 0.33] |
| 9.2 DPI | 4 | 678 | Peto Odds Ratio (Peto, Fixed, 95% CI) | 0.28 [0.20, 0.38] |
| 10 Sore throat or pharyngitis (No. of patients) Show forest plot | 6 | 1336 | Peto Odds Ratio (Peto, Fixed, 95% CI) | 1.98 [0.97, 4.04] |
| 10.1 MDI | 2 | 187 | Peto Odds Ratio (Peto, Fixed, 95% CI) | 3.02 [0.49, 18.64] |
| 10.2 DPI | 4 | 1149 | Peto Odds Ratio (Peto, Fixed, 95% CI) | 1.83 [0.84, 3.98] |
| 11 Hoarseness or dysphonia (No. of patients) Show forest plot | 7 | 1215 | Peto Odds Ratio (Peto, Fixed, 95% CI) | 5.00 [1.53, 16.37] |
| 11.1 MDI | 3 | 492 | Peto Odds Ratio (Peto, Fixed, 95% CI) | 3.71 [0.74, 18.49] |
| 11.2 DPI | 4 | 723 | Peto Odds Ratio (Peto, Fixed, 95% CI) | 7.15 [1.23, 41.51] |
| 12 Oral Candidiasis (No. of patients) Show forest plot | 7 | 1298 | Peto Odds Ratio (Peto, Fixed, 95% CI) | 3.45 [1.29, 9.26] |
| 12.1 MDI | 2 | 317 | Peto Odds Ratio (Peto, Fixed, 95% CI) | 3.19 [0.54, 18.68] |
| 12.2 DPI | 5 | 981 | Peto Odds Ratio (Peto, Fixed, 95% CI) | 3.58 [1.09, 11.75] |
| 13 Withdrawals due to adverse events Show forest plot | 3 | 957 | Odds Ratio (M‐H, Fixed, 95% CI) | 1.11 [0.38, 3.20] |
| 13.1 MDI | 2 | 353 | Odds Ratio (M‐H, Fixed, 95% CI) | 0.90 [0.15, 5.43] |
| 13.2 DPI | 1 | 604 | Odds Ratio (M‐H, Fixed, 95% CI) | 1.24 [0.33, 4.65] |
| Outcome or subgroup title | No. of studies | No. of participants | Statistical method | Effect size |
| 1 Change in FEV1 compared to baseline (litres) Show forest plot | 10 | 1673 | Litres (Fixed, 95% CI) | 0.21 [0.18, 0.25] |
| 1.1 Mild | 1 | 309 | Litres (Fixed, 95% CI) | 0.02 [‐0.06, 0.10] |
| 1.2 Mild to moderate | 1 | 158 | Litres (Fixed, 95% CI) | 0.35 [0.19, 0.51] |
| 1.3 Moderate | 8 | 1206 | Litres (Fixed, 95% CI) | 0.26 [0.22, 0.31] |
| 2 Change in morning PEFR compared to baseline (L/min) Show forest plot | 10 | 1705 | Mean Difference (IV, Fixed, 95% CI) | 22.79 [19.07, 26.51] |
| 2.1 Mild | 1 | 309 | Mean Difference (IV, Fixed, 95% CI) | 8.60 [0.84, 16.36] |
| 2.2 Mild to moderate | 1 | 158 | Mean Difference (IV, Fixed, 95% CI) | 30.0 [17.98, 42.02] |
| 2.3 Moderate | 8 | 1238 | Mean Difference (IV, Fixed, 95% CI) | 26.61 [22.08, 31.14] |
| 3 Change in evening PEFR compared to baseline Show forest plot | 9 | 1954 | Litres/min (Fixed, 95% CI) | 12.08 [8.87, 15.30] |
| 3.1 Mild | 2 | 913 | Litres/min (Fixed, 95% CI) | 5.92 [1.52, 10.33] |
| 3.2 Mild to moderate | 1 | 158 | Litres/min (Fixed, 95% CI) | 30.00 [19.32, 40.68] |
| 3.3 Moderate | 6 | 883 | Litres/min (Fixed, 95% CI) | 16.51 [11.26, 21.76] |
| 7 Change in daily asthma symptom score compared to baseline Show forest plot | 8 | 1238 | Std. Mean Difference (IV, Fixed, 95% CI) | ‐0.57 [‐0.69, ‐0.46] |
| 7.1 Mild | 0 | 0 | Std. Mean Difference (IV, Fixed, 95% CI) | 0.0 [0.0, 0.0] |
| 7.2 Mild to moderate | 1 | 158 | Std. Mean Difference (IV, Fixed, 95% CI) | ‐0.53 [‐0.85, ‐0.21] |
| 7.3 Moderate | 7 | 1080 | Std. Mean Difference (IV, Fixed, 95% CI) | ‐0.58 [‐0.70, ‐0.46] |
| 8 Change in number night‐time wakenings per week Show forest plot | 4 | 648 | Mean Difference (IV, Fixed, 95% CI) | ‐0.11 [‐0.17, ‐0.05] |
| 8.1 Mild | 0 | 0 | Mean Difference (IV, Fixed, 95% CI) | 0.0 [0.0, 0.0] |
| 8.2 Mild to moderate | 1 | 158 | Mean Difference (IV, Fixed, 95% CI) | ‐0.12 [‐0.25, 0.01] |
| 8.3 Moderate | 3 | 490 | Mean Difference (IV, Fixed, 95% CI) | ‐0.11 [‐0.18, ‐0.04] |
| 9 Change in night‐time wakening score Show forest plot | 6 | 895 | Std. Mean Difference (IV, Fixed, 95% CI) | ‐0.25 [‐0.38, ‐0.12] |
| 9.1 Mild | 0 | 0 | Std. Mean Difference (IV, Fixed, 95% CI) | 0.0 [0.0, 0.0] |
| 9.2 Mild to moderate | 1 | 158 | Std. Mean Difference (IV, Fixed, 95% CI) | ‐0.29 [‐0.61, 0.02] |
| 9.3 Moderate | 5 | 737 | Std. Mean Difference (IV, Fixed, 95% CI) | ‐0.24 [‐0.38, ‐0.09] |
| 10 Change in daily use of beta2 agonist compared to baseline (puffs/d) Show forest plot | 9 | 1839 | Mean Difference (IV, Fixed, 95% CI) | ‐0.94 [‐1.14, ‐0.74] |
| 10.1 Mild | 1 | 604 | Mean Difference (IV, Fixed, 95% CI) | ‐0.40 [‐0.76, ‐0.04] |
| 10.2 Mild to moderate | 1 | 158 | Mean Difference (IV, Fixed, 95% CI) | ‐0.83 [‐1.38, ‐0.28] |
| 10.3 Moderate | 7 | 1077 | Mean Difference (IV, Fixed, 95% CI) | ‐1.26 [‐1.52, ‐0.99] |
| 16 Physician‐rated efficacy: effective or very effective Show forest plot | 4 | 664 | Peto Odds Ratio (Peto, Fixed, 95% CI) | 5.12 [3.76, 6.98] |
| 16.1 Mild | 0 | 0 | Peto Odds Ratio (Peto, Fixed, 95% CI) | 0.0 [0.0, 0.0] |
| 16.2 Mild to moderate | 1 | 158 | Peto Odds Ratio (Peto, Fixed, 95% CI) | 5.06 [2.65, 9.67] |
| 16.3 Moderate | 3 | 506 | Peto Odds Ratio (Peto, Fixed, 95% CI) | 5.14 [3.61, 7.31] |
| 18 Withdrawal due to lack of treatment efficacy (No. of patients) Show forest plot | 8 | 1479 | Peto Odds Ratio (Peto, Fixed, 95% CI) | 0.26 [0.20, 0.32] |
| 18.1 Mild | 1 | 313 | Peto Odds Ratio (Peto, Fixed, 95% CI) | 7.53 [0.15, 379.73] |
| 18.2 Mild to moderate | 1 | 158 | Peto Odds Ratio (Peto, Fixed, 95% CI) | 0.20 [0.11, 0.38] |
| 18.3 Moderate | 6 | 1008 | Peto Odds Ratio (Peto, Fixed, 95% CI) | 0.26 [0.20, 0.34] |
| 21 Sore throat or pharyngitis (No. of patients) Show forest plot | 6 | 1336 | Odds Ratio (M‐H, Fixed, 95% CI) | 1.95 [0.93, 4.06] |
| 21.1 Mild | 1 | 604 | Odds Ratio (M‐H, Fixed, 95% CI) | 1.42 [0.53, 3.79] |
| 21.2 Mild to moderate | 2 | 255 | Odds Ratio (M‐H, Fixed, 95% CI) | 3.31 [0.66, 16.51] |
| 21.3 Moderate | 3 | 477 | Odds Ratio (M‐H, Fixed, 95% CI) | 2.41 [0.46, 12.65] |
| 22 Hoarseness or dysphonia (No. of patients) Show forest plot | 7 | 1215 | Odds Ratio (M‐H, Fixed, 95% CI) | 3.50 [1.06, 11.52] |
| 22.1 Mild | 0 | 0 | Odds Ratio (M‐H, Fixed, 95% CI) | 0.0 [0.0, 0.0] |
| 22.2 Mild to moderate | 2 | 382 | Odds Ratio (M‐H, Fixed, 95% CI) | 4.99 [0.58, 43.17] |
| 22.3 Moderate | 5 | 833 | Odds Ratio (M‐H, Fixed, 95% CI) | 2.91 [0.69, 12.29] |
| 23 Oral Candidiasis (No. of patients) Show forest plot | 7 | 1298 | Odds Ratio (M‐H, Fixed, 95% CI) | 2.81 [1.05, 7.48] |
| 23.1 Mild | 0 | 0 | Odds Ratio (M‐H, Fixed, 95% CI) | 0.0 [0.0, 0.0] |
| 23.2 Mild to moderate | 3 | 560 | Odds Ratio (M‐H, Fixed, 95% CI) | 3.08 [0.61, 15.51] |
| 23.3 Moderate | 4 | 738 | Odds Ratio (M‐H, Fixed, 95% CI) | 2.65 [0.77, 9.11] |
| 24 Withdrawals due to adverse events Show forest plot | 3 | 957 | Odds Ratio (M‐H, Fixed, 95% CI) | 1.11 [0.38, 3.20] |
| 24.1 Mild | 2 | 917 | Odds Ratio (M‐H, Fixed, 95% CI) | 0.99 [0.32, 3.11] |
| 24.2 Mild to moderate | 1 | 40 | Odds Ratio (M‐H, Fixed, 95% CI) | 2.33 [0.09, 60.84] |
| 24.3 Moderate | 0 | 0 | Odds Ratio (M‐H, Fixed, 95% CI) | 0.0 [0.0, 0.0] |
| Outcome or subgroup title | No. of studies | No. of participants | Statistical method | Effect size |
| 1 Change in FEV1 compared to baseline (litres) Show forest plot | 21 | 4790 | Mean Difference (IV, Fixed, 95% CI) | 0.24 [0.21, 0.26] |
| 1.1 Children | 2 | 331 | Mean Difference (IV, Fixed, 95% CI) | 0.19 [0.12, 0.25] |
| 1.2 Adults | 19 | 4459 | Mean Difference (IV, Fixed, 95% CI) | 0.25 [0.22, 0.27] |
| 2 Change in FEV1 compared to baseline (imputed estimates) Show forest plot | 22 | 4936 | Litres (Fixed, 95% CI) | 0.24 [0.21, 0.26] |
| 2.1 Children | 3 | 477 | Litres (Fixed, 95% CI) | 0.18 [0.13, 0.24] |
| 2.2 Adults | 19 | 4459 | Litres (Fixed, 95% CI) | 0.25 [0.22, 0.28] |
| 3 Change in FEV1 (% predicted) Show forest plot | 5 | 674 | % (Fixed, 95% CI) | 9.95 [7.98, 11.91] |
| 3.1 Children | 2 | 192 | % (Fixed, 95% CI) | 11.28 [7.62, 14.94] |
| 3.2 Adults | 3 | 482 | % (Fixed, 95% CI) | 9.41 [7.07, 11.74] |
| 4 Change in FEV1 (%) Show forest plot | 2 | 280 | Mean Difference (IV, Fixed, 95% CI) | 13.05 [7.85, 18.25] |
| 4.1 Children | 0 | 0 | Mean Difference (IV, Fixed, 95% CI) | 0.0 [0.0, 0.0] |
| 4.2 Adults | 2 | 280 | Mean Difference (IV, Fixed, 95% CI) | 13.05 [7.85, 18.25] |
| 5 FEV1 (% predicted ‐ absolute values) Show forest plot | 4 | 157 | % (Fixed, 95% CI) | 4.22 [0.94, 7.50] |
| 5.1 Children | 3 | 125 | % (Fixed, 95% CI) | 5.92 [2.22, 9.62] |
| 5.2 Adults | 1 | 32 | % (Fixed, 95% CI) | ‐2.0 [‐9.08, 5.08] |
| 6 FEV1 (absolute values) Show forest plot | 2 | 86 | Litres (Fixed, 95% CI) | 0.06 [‐0.00, 0.13] |
| 6.1 Children | 1 | 68 | Litres (Fixed, 95% CI) | 0.06 [‐0.00, 0.12] |
| 6.2 Adults | 1 | 18 | Litres (Fixed, 95% CI) | 0.59 [‐0.31, 1.49] |
| 7 Change in morning PEFR compared with baseline Show forest plot | 24 | 5117 | Litres/min (Fixed, 95% CI) | 26.96 [24.51, 29.40] |
| 7.1 Children | 5 | 611 | Litres/min (Fixed, 95% CI) | 25.68 [20.09, 31.27] |
| 7.2 Adults | 19 | 4506 | Litres/min (Fixed, 95% CI) | 27.26 [24.54, 29.98] |
| 8 Change in morning PEFR compared to baseline (L/min) Show forest plot | 21 | 3752 | Mean Difference (IV, Fixed, 95% CI) | 29.29 [26.44, 32.14] |
| 8.1 Children | 3 | 509 | Mean Difference (IV, Fixed, 95% CI) | 27.50 [20.79, 34.21] |
| 8.2 Adults | 18 | 3243 | Mean Difference (IV, Fixed, 95% CI) | 29.69 [26.54, 32.83] |
| 9 Mean change in am PEF (% predicted) Show forest plot | 2 | 665 | % (Fixed, 95% CI) | 4.49 [2.92, 6.05] |
| 9.1 Children | 1 | 241 | % (Fixed, 95% CI) | 6.0 [2.08, 9.92] |
| 9.2 Adults | 1 | 424 | % (Fixed, 95% CI) | 4.2 [2.49, 5.91] |
| 10 Change in evening PEFR compared to baseline (L/min) Show forest plot | 15 | 3118 | Mean Difference (IV, Fixed, 95% CI) | 21.33 [18.26, 24.40] |
| 10.1 Children | 2 | 331 | Mean Difference (IV, Fixed, 95% CI) | 20.77 [13.06, 28.47] |
| 10.2 Adults | 13 | 2787 | Mean Difference (IV, Fixed, 95% CI) | 21.44 [18.09, 24.79] |
| 11 Change in evening PEFR compared to baseline Show forest plot | 16 | 3283 | Litres/min (Fixed, 95% CI) | 21.59 [18.55, 24.62] |
| 11.1 Children | 2 | 331 | Litres/min (Fixed, 95% CI) | 20.77 [13.07, 28.46] |
| 11.2 Adults | 14 | 2952 | Litres/min (Fixed, 95% CI) | 21.74 [18.44, 25.03] |
| 12 Change in clinic PEFR compared to baseline (L/min) Show forest plot | 1 | Mean Difference (IV, Fixed, 95% CI) | Totals not selected | |
| 12.1 Children | 1 | Mean Difference (IV, Fixed, 95% CI) | 0.0 [0.0, 0.0] | |
| 12.2 Adults | 0 | Mean Difference (IV, Fixed, 95% CI) | 0.0 [0.0, 0.0] | |
| 13 Peak flow L/min (absolute values) Show forest plot | 2 | 50 | Mean Difference (IV, Fixed, 95% CI) | 68.07 [7.89, 128.25] |
| 13.1 Children | 0 | 0 | Mean Difference (IV, Fixed, 95% CI) | 0.0 [0.0, 0.0] |
| 13.2 Adults | 2 | 50 | Mean Difference (IV, Fixed, 95% CI) | 68.07 [7.89, 128.25] |
| 14 Change in FVC compared to baseline (litres) Show forest plot | 1 | Mean Difference (IV, Fixed, 95% CI) | Totals not selected | |
| 14.1 Children | 0 | Mean Difference (IV, Fixed, 95% CI) | 0.0 [0.0, 0.0] | |
| 14.2 Adults | 1 | Mean Difference (IV, Fixed, 95% CI) | 0.0 [0.0, 0.0] | |
| 15 Change in FEF25‐75 compared to baseline (L/second) Show forest plot | 2 | 1423 | Mean Difference (IV, Fixed, 95% CI) | 0.25 [0.16, 0.34] |
| 15.1 Children | 0 | 0 | Mean Difference (IV, Fixed, 95% CI) | 0.0 [0.0, 0.0] |
| 15.2 Adults | 2 | 1423 | Mean Difference (IV, Fixed, 95% CI) | 0.25 [0.16, 0.34] |
| 16 Histamine BHR (log base 2 PC20 FEV1 mg/ml) Show forest plot | 1 | Mean Difference (IV, Fixed, 95% CI) | Totals not selected | |
| 16.1 Children | 1 | Mean Difference (IV, Fixed, 95% CI) | 0.0 [0.0, 0.0] | |
| 16.2 Adults | 0 | Mean Difference (IV, Fixed, 95% CI) | 0.0 [0.0, 0.0] | |
| 17 Change in daily asthma symptom score compared to baseline Show forest plot | 20 | 3671 | Std. Mean Difference (IV, Fixed, 95% CI) | ‐0.49 [‐0.56, ‐0.43] |
| 17.1 Children | 3 | 509 | Std. Mean Difference (IV, Fixed, 95% CI) | ‐0.55 [‐0.72, ‐0.37] |
| 17.2 Adults | 17 | 3162 | Std. Mean Difference (IV, Fixed, 95% CI) | ‐0.48 [‐0.56, ‐0.41] |
| 18 Change in night‐time wakening score Show forest plot | 6 | 884 | Std. Mean Difference (IV, Fixed, 95% CI) | ‐0.45 [‐0.59, ‐0.32] |
| 18.1 Children | 1 | 173 | Std. Mean Difference (IV, Fixed, 95% CI) | ‐0.41 [‐0.71, ‐0.11] |
| 18.2 Adults | 5 | 711 | Std. Mean Difference (IV, Fixed, 95% CI) | ‐0.47 [‐0.62, ‐0.32] |
| 19 Change in symptom free days Show forest plot | 1 | Mean Difference (IV, Fixed, 95% CI) | Totals not selected | |
| 19.1 Children | 0 | Mean Difference (IV, Fixed, 95% CI) | 0.0 [0.0, 0.0] | |
| 19.2 Adults | 1 | Mean Difference (IV, Fixed, 95% CI) | 0.0 [0.0, 0.0] | |
| 20 Change from baseline in symptom free days (%) Show forest plot | 3 | 971 | Mean Difference (IV, Fixed, 95% CI) | 7.03 [3.31, 10.75] |
| 20.1 Children | 0 | 0 | Mean Difference (IV, Fixed, 95% CI) | 0.0 [0.0, 0.0] |
| 20.2 Adults | 3 | 971 | Mean Difference (IV, Fixed, 95% CI) | 7.03 [3.31, 10.75] |
| 21 Percentage nights without awakening ‐ change from baseline Show forest plot | 2 | 208 | Mean Difference (IV, Fixed, 95% CI) | 10.65 [4.84, 16.46] |
| 21.1 Children | 0 | 0 | Mean Difference (IV, Fixed, 95% CI) | 0.0 [0.0, 0.0] |
| 21.2 Adults | 2 | 208 | Mean Difference (IV, Fixed, 95% CI) | 10.65 [4.84, 16.46] |
| 22 Change in number night‐time wakenings per week Show forest plot | 4 | 641 | Mean Difference (IV, Fixed, 95% CI) | ‐0.17 [‐0.23, ‐0.12] |
| 22.1 Children | 0 | 0 | Mean Difference (IV, Fixed, 95% CI) | 0.0 [0.0, 0.0] |
| 22.2 Adults | 4 | 641 | Mean Difference (IV, Fixed, 95% CI) | ‐0.17 [‐0.23, ‐0.12] |
| 23 Change from baseline in nighttime awakenings/night Show forest plot | 5 | 1359 | Mean Difference (IV, Fixed, 95% CI) | ‐0.12 [‐0.17, ‐0.08] |
| 23.1 Children | 1 | 158 | Mean Difference (IV, Fixed, 95% CI) | ‐0.1 [‐0.16, ‐0.04] |
| 23.2 Adults | 4 | 1201 | Mean Difference (IV, Fixed, 95% CI) | ‐0.17 [‐0.24, ‐0.09] |
| 24 Change in nocturnal awakenings (unspecified time) Show forest plot | 2 | 280 | Mean Difference (IV, Fixed, 95% CI) | ‐0.07 [‐0.11, ‐0.02] |
| 24.1 Children | 0 | 0 | Mean Difference (IV, Fixed, 95% CI) | 0.0 [0.0, 0.0] |
| 24.2 Adults | 2 | 280 | Mean Difference (IV, Fixed, 95% CI) | ‐0.07 [‐0.11, ‐0.02] |
| 25 Symptoms (absolute values) Show forest plot | 1 | Mean Difference (IV, Fixed, 95% CI) | Totals not selected | |
| 25.1 Children | 0 | Mean Difference (IV, Fixed, 95% CI) | 0.0 [0.0, 0.0] | |
| 25.2 Adults | 1 | Mean Difference (IV, Fixed, 95% CI) | 0.0 [0.0, 0.0] | |
| 26 Change in daily use of beta2 agonist compared to baseline (puffs/d) Show forest plot | 20 | 4899 | Mean Difference (IV, Fixed, 95% CI) | ‐1.20 [‐1.34, ‐1.05] |
| 26.1 Children | 3 | 509 | Mean Difference (IV, Fixed, 95% CI) | ‐1.04 [‐1.39, ‐0.70] |
| 26.2 Adults | 17 | 4390 | Mean Difference (IV, Fixed, 95% CI) | ‐1.23 [‐1.39, ‐1.07] |
| 27 Change in daily use of beta2 agonist compared to baseline (puffs/d ‐ imputed estimates) Show forest plot | 22 | 5111 | Mean Difference (IV, Fixed, 95% CI) | ‐1.01 [‐1.13, ‐0.88] |
| 27.1 Children | 3 | 509 | Mean Difference (IV, Fixed, 95% CI) | ‐1.04 [‐1.39, ‐0.70] |
| 27.2 Adults | 19 | 4602 | Mean Difference (IV, Fixed, 95% CI) | ‐1.00 [‐1.13, ‐0.87] |
| 28 Change from baseline in rescue medication free days (%) Show forest plot | 2 | 809 | Mean Difference (IV, Fixed, 95% CI) | 10.49 [5.48, 15.51] |
| 28.1 Children | 0 | 0 | Mean Difference (IV, Fixed, 95% CI) | 0.0 [0.0, 0.0] |
| 28.2 Adults | 2 | 809 | Mean Difference (IV, Fixed, 95% CI) | 10.49 [5.48, 15.51] |
| 29 Rescue medication (absolute scores) Show forest plot | 1 | Mean Difference (IV, Fixed, 95% CI) | Totals not selected | |
| 29.1 Children | 0 | Mean Difference (IV, Fixed, 95% CI) | 0.0 [0.0, 0.0] | |
| 29.2 Adults | 1 | Mean Difference (IV, Fixed, 95% CI) | 0.0 [0.0, 0.0] | |
| 30 HRQOL: AQLQ (absolute socres) Show forest plot | 3 | 513 | Mean Difference (IV, Fixed, 95% CI) | 0.68 [0.49, 0.87] |
| 30.1 Children | 0 | 0 | Mean Difference (IV, Fixed, 95% CI) | 0.0 [0.0, 0.0] |
| 30.2 Adults | 3 | 513 | Mean Difference (IV, Fixed, 95% CI) | 0.68 [0.49, 0.87] |
| 31 HRQOL: Functional Status IIR questionaire (short version) Show forest plot | 1 | Mean Difference (IV, Fixed, 95% CI) | Totals not selected | |
| 31.1 Children | 1 | Mean Difference (IV, Fixed, 95% CI) | 0.0 [0.0, 0.0] | |
| 31.2 Adults | 0 | Mean Difference (IV, Fixed, 95% CI) | 0.0 [0.0, 0.0] | |
| 32 HRQOL: Quality of Life of Parents of Asthmatic Children questionnaire, burden dimension Show forest plot | 1 | Mean Difference (IV, Fixed, 95% CI) | Totals not selected | |
| 32.1 Children | 1 | Mean Difference (IV, Fixed, 95% CI) | 0.0 [0.0, 0.0] | |
| 32.2 Adults | 0 | Mean Difference (IV, Fixed, 95% CI) | 0.0 [0.0, 0.0] | |
| 33 HRQOL: Quality of Life of Parents of Asthmatic Children questionnaire, subjective norms dimension Show forest plot | 1 | Mean Difference (IV, Fixed, 95% CI) | Totals not selected | |
| 33.1 Children | 1 | Mean Difference (IV, Fixed, 95% CI) | 0.0 [0.0, 0.0] | |
| 33.2 Adults | 0 | Mean Difference (IV, Fixed, 95% CI) | 0.0 [0.0, 0.0] | |
| 34 HRQOL: Quality of Life of Parents of Asthmatic Children questionnaire, social dimension Show forest plot | 1 | Mean Difference (IV, Fixed, 95% CI) | Totals not selected | |
| 34.1 Children | 1 | Mean Difference (IV, Fixed, 95% CI) | 0.0 [0.0, 0.0] | |
| 34.2 Adults | 0 | Mean Difference (IV, Fixed, 95% CI) | 0.0 [0.0, 0.0] | |
| 35 HRQOL: Sleep Scale Children questionnaire Show forest plot | 1 | Mean Difference (IV, Fixed, 95% CI) | Totals not selected | |
| 35.1 Children | 1 | Mean Difference (IV, Fixed, 95% CI) | 0.0 [0.0, 0.0] | |
| 35.2 Adults | 0 | Mean Difference (IV, Fixed, 95% CI) | 0.0 [0.0, 0.0] | |
| 36 Physician‐rated efficacy: effective or very effective (No. of patients) Show forest plot | 3 | 568 | Peto Odds Ratio (Peto, Fixed, 95% CI) | 5.83 [4.16, 8.16] |
| 36.1 Children | 0 | 0 | Peto Odds Ratio (Peto, Fixed, 95% CI) | 0.0 [0.0, 0.0] |
| 36.2 Adults | 3 | 568 | Peto Odds Ratio (Peto, Fixed, 95% CI) | 5.83 [4.16, 8.16] |
| 37 Exacerbations requiring OCS treatment Show forest plot | 1 | Peto Odds Ratio (Peto, Fixed, 95% CI) | Totals not selected | |
| 37.1 Children | 0 | Peto Odds Ratio (Peto, Fixed, 95% CI) | 0.0 [0.0, 0.0] | |
| 37.2 Adults | 1 | Peto Odds Ratio (Peto, Fixed, 95% CI) | 0.0 [0.0, 0.0] | |
| 38 Withdrawal due to clinical asthma exacerbation (No. of patients) Show forest plot | 4 | 702 | Peto Odds Ratio (Peto, Fixed, 95% CI) | 0.22 [0.12, 0.39] |
| 38.1 Children | 2 | 248 | Peto Odds Ratio (Peto, Fixed, 95% CI) | 0.18 [0.09, 0.38] |
| 38.2 Adults | 2 | 454 | Peto Odds Ratio (Peto, Fixed, 95% CI) | 0.29 [0.11, 0.79] |
| 39 Withdrawal due to lack of treatment efficacy (No. of patients) Show forest plot | 17 | 4071 | Peto Odds Ratio (Peto, Fixed, 95% CI) | 0.20 [0.17, 0.24] |
| 39.1 Children | 2 | 351 | Peto Odds Ratio (Peto, Fixed, 95% CI) | 0.20 [0.13, 0.31] |
| 39.2 Adults | 15 | 3720 | Peto Odds Ratio (Peto, Fixed, 95% CI) | 0.21 [0.17, 0.25] |
| 40 Withdrawals (any reason) Show forest plot | 8 | 2080 | Peto Odds Ratio (Peto, Fixed, 95% CI) | 0.40 [0.31, 0.51] |
| 40.1 Children | 1 | 158 | Peto Odds Ratio (Peto, Fixed, 95% CI) | 0.33 [0.18, 0.61] |
| 40.2 Adults | 7 | 1922 | Peto Odds Ratio (Peto, Fixed, 95% CI) | 0.42 [0.32, 0.54] |
| 41 Withdrawals due to adverse events Show forest plot | 13 | 3595 | Peto Odds Ratio (Peto, Fixed, 95% CI) | 1.31 [0.76, 2.27] |
| 41.1 Children | 0 | 0 | Peto Odds Ratio (Peto, Fixed, 95% CI) | 0.0 [0.0, 0.0] |
| 41.2 Adults | 13 | 3595 | Peto Odds Ratio (Peto, Fixed, 95% CI) | 1.31 [0.76, 2.27] |
| 42 Adverse events (any) Show forest plot | 4 | 884 | Odds Ratio (M‐H, Fixed, 95% CI) | 1.13 [0.84, 1.52] |
| 42.1 Children | 0 | 0 | Odds Ratio (M‐H, Fixed, 95% CI) | 0.0 [0.0, 0.0] |
| 42.2 Adults | 4 | 884 | Odds Ratio (M‐H, Fixed, 95% CI) | 1.13 [0.84, 1.52] |
| 43 Oral Candidiasis (No. of patients) Show forest plot | 13 | 1887 | Peto Odds Ratio (Peto, Fixed, 95% CI) | 2.55 [1.43, 4.56] |
| 43.1 Children | 3 | 395 | Peto Odds Ratio (Peto, Fixed, 95% CI) | 1.38 [0.54, 3.57] |
| 43.2 Adults | 10 | 1492 | Peto Odds Ratio (Peto, Fixed, 95% CI) | 3.68 [1.76, 7.67] |
| 44 Sore throat or pharyngitis (No. of patients) Show forest plot | 17 | 3480 | Peto Odds Ratio (Peto, Fixed, 95% CI) | 1.82 [1.27, 2.60] |
| 44.1 Children | 2 | 372 | Peto Odds Ratio (Peto, Fixed, 95% CI) | 1.38 [0.54, 3.54] |
| 44.2 Adults | 15 | 3108 | Peto Odds Ratio (Peto, Fixed, 95% CI) | 1.91 [1.29, 2.80] |
| 45 Headaches Show forest plot | 10 | 2602 | Peto Odds Ratio (Peto, Fixed, 95% CI) | 1.07 [0.83, 1.38] |
| 45.1 Children | 1 | 158 | Peto Odds Ratio (Peto, Fixed, 95% CI) | 1.39 [0.43, 4.50] |
| 45.2 Adults | 9 | 2444 | Peto Odds Ratio (Peto, Fixed, 95% CI) | 1.06 [0.81, 1.37] |
| 46 Hoarseness or dysphonia (No. of patients) Show forest plot | 10 | 1645 | Peto Odds Ratio (Peto, Fixed, 95% CI) | 6.34 [2.83, 14.21] |
| 46.1 Children | 2 | 394 | Peto Odds Ratio (Peto, Fixed, 95% CI) | 8.10 [0.83, 79.01] |
| 46.2 Adults | 8 | 1251 | Peto Odds Ratio (Peto, Fixed, 95% CI) | 6.12 [2.58, 14.51] |
| 47 Upper respiratory tract infection Show forest plot | 3 | 1623 | Odds Ratio (M‐H, Fixed, 95% CI) | 1.07 [0.76, 1.49] |
| 47.1 Children | 1 | 158 | Odds Ratio (M‐H, Fixed, 95% CI) | 0.97 [0.41, 2.31] |
| 47.2 Adults | 2 | 1465 | Odds Ratio (M‐H, Fixed, 95% CI) | 1.08 [0.75, 1.55] |
| 48 Sinusitis Show forest plot | 5 | 2030 | Peto Odds Ratio (Peto, Fixed, 95% CI) | 1.29 [0.84, 1.99] |
| 48.1 Children | 1 | 158 | Peto Odds Ratio (Peto, Fixed, 95% CI) | 1.69 [0.60, 4.74] |
| 48.2 Adults | 4 | 1872 | Peto Odds Ratio (Peto, Fixed, 95% CI) | 1.22 [0.76, 1.96] |
| 49 Total urinary free cortisol excretion (mcg/24 hours) Show forest plot | 1 | Mean Difference (IV, Fixed, 95% CI) | Totals not selected | |
| 49.1 Children | 1 | Mean Difference (IV, Fixed, 95% CI) | 0.0 [0.0, 0.0] | |
| 49.2 Adults | 0 | Mean Difference (IV, Fixed, 95% CI) | 0.0 [0.0, 0.0] | |
| 50 AUC serum cortisol (ng*h/mL) Show forest plot | 1 | Mean Difference (IV, Fixed, 95% CI) | Totals not selected | |
| 50.1 Children | 0 | Mean Difference (IV, Fixed, 95% CI) | 0.0 [0.0, 0.0] | |
| 50.2 Adults | 1 | Mean Difference (IV, Fixed, 95% CI) | 0.0 [0.0, 0.0] | |
| 51 Morning plasma cortisol (mcg/dL) Show forest plot | 2 | 194 | Mean Difference (IV, Fixed, 95% CI) | 0.00 [‐1.33, 1.33] |
| 51.1 Children | 1 | 154 | Mean Difference (IV, Fixed, 95% CI) | 0.30 [‐1.23, 1.83] |
| 51.2 Adults | 1 | 40 | Mean Difference (IV, Fixed, 95% CI) | ‐0.90 [‐3.57, 1.77] |
| 52 Change in morning plasma cortisol compared to baseline (mcg/dL) Show forest plot | 1 | Mean Difference (IV, Fixed, 95% CI) | Totals not selected | |
| 52.1 Children | 0 | Mean Difference (IV, Fixed, 95% CI) | 0.0 [0.0, 0.0] | |
| 52.2 Adults | 1 | Mean Difference (IV, Fixed, 95% CI) | 0.0 [0.0, 0.0] | |
| 53 Change in peak plasma cortisol expression (mcg/dL) Show forest plot | 2 | 117 | Mean Difference (IV, Fixed, 95% CI) | ‐0.60 [‐2.56, 1.36] |
| 53.1 Children | 0 | 0 | Mean Difference (IV, Fixed, 95% CI) | 0.0 [0.0, 0.0] |
| 53.2 Adults | 2 | 117 | Mean Difference (IV, Fixed, 95% CI) | ‐0.60 [‐2.56, 1.36] |
| Outcome or subgroup title | No. of studies | No. of participants | Statistical method | Effect size |
| 1 Change in FEV1 compared to baseline (litres) Show forest plot | 22 | 4936 | Litres (Fixed, 95% CI) | 0.24 [0.21, 0.26] |
| 1.1 1‐4 weeks | 1 | 46 | Litres (Fixed, 95% CI) | 0.27 [0.05, 0.49] |
| 1.2 1‐5 months | 20 | 3627 | Litres (Fixed, 95% CI) | 0.27 [0.24, 0.29] |
| 1.3 6 months or longer | 1 | 1263 | Litres (Fixed, 95% CI) | 0.1 [0.04, 0.16] |
| 2 Change in FEV1 (% predicted) Show forest plot | 5 | 674 | % (Fixed, 95% CI) | 9.95 [7.98, 11.91] |
| 2.1 1‐4 weeks | 0 | 0 | % (Fixed, 95% CI) | 0.0 [0.0, 0.0] |
| 2.2 1‐5 months | 5 | 674 | % (Fixed, 95% CI) | 9.95 [7.98, 11.91] |
| 2.3 6 months or longer | 0 | 0 | % (Fixed, 95% CI) | 0.0 [0.0, 0.0] |
| 3 Change in morning PEFR compared with baseline Show forest plot | 24 | 5117 | Litres/min (Fixed, 95% CI) | 26.96 [24.51, 29.40] |
| 3.1 1‐4 weeks | 1 | 46 | Litres/min (Fixed, 95% CI) | 11.0 [‐9.83, 31.83] |
| 3.2 1‐5 months | 22 | 3808 | Litres/min (Fixed, 95% CI) | 29.03 [26.27, 31.80] |
| 3.3 6 months or longer | 1 | 1263 | Litres/min (Fixed, 95% CI) | 20.1 [14.70, 25.50] |
| 4 Change in evening PEFR compared to baseline Show forest plot | 16 | 3283 | Litres/min (Fixed, 95% CI) | 21.59 [18.55, 24.62] |
| 4.1 1‐4 weeks | 0 | 0 | Litres/min (Fixed, 95% CI) | 0.0 [0.0, 0.0] |
| 4.2 1‐5 months | 16 | 3283 | Litres/min (Fixed, 95% CI) | 21.59 [18.55, 24.62] |
| 4.3 6 months or longer | 0 | 0 | Litres/min (Fixed, 95% CI) | 0.0 [0.0, 0.0] |
| 5 Change in daily use of beta2 agonist compared to baseline (puffs/d) Show forest plot | 22 | 5111 | Mean Difference (IV, Fixed, 95% CI) | ‐1.01 [‐1.13, ‐0.88] |
| 5.1 1‐4 weeks | 1 | 46 | Mean Difference (IV, Fixed, 95% CI) | ‐0.90 [‐1.73, ‐0.07] |
| 5.2 1‐5 months | 20 | 3802 | Mean Difference (IV, Fixed, 95% CI) | ‐1.25 [‐1.39, ‐1.11] |
| 5.3 6 months or longer | 1 | 1263 | Mean Difference (IV, Fixed, 95% CI) | ‐0.18 [‐0.44, 0.08] |
| 6 HRQOL: AQLQ Show forest plot | 3 | 513 | Mean Difference (IV, Fixed, 95% CI) | 0.68 [0.49, 0.87] |
| 6.1 1‐4 weeks | 0 | 0 | Mean Difference (IV, Fixed, 95% CI) | 0.0 [0.0, 0.0] |
| 6.2 1‐5 months | 3 | 513 | Mean Difference (IV, Fixed, 95% CI) | 0.68 [0.49, 0.87] |
| 6.3 6 months or longer | 0 | 0 | Mean Difference (IV, Fixed, 95% CI) | 0.0 [0.0, 0.0] |
| 7 Change in daily asthma symptom score compared to baseline Show forest plot | 20 | 3671 | Std. Mean Difference (IV, Fixed, 95% CI) | ‐0.49 [‐0.56, ‐0.43] |
| 7.1 1‐4 weeks | 1 | 46 | Std. Mean Difference (IV, Fixed, 95% CI) | 0.20 [‐0.37, 0.78] |
| 7.2 1‐5 months | 19 | 3625 | Std. Mean Difference (IV, Fixed, 95% CI) | ‐0.50 [‐0.57, ‐0.44] |
| 7.3 6 months or longer | 0 | 0 | Std. Mean Difference (IV, Fixed, 95% CI) | 0.0 [0.0, 0.0] |
| 8 Change from baseline in symptom free days (%) Show forest plot | 3 | 971 | Mean Difference (IV, Fixed, 95% CI) | 7.03 [3.31, 10.75] |
| 8.1 1‐4 weeks | 0 | 0 | Mean Difference (IV, Fixed, 95% CI) | 0.0 [0.0, 0.0] |
| 8.2 1‐5 months | 3 | 971 | Mean Difference (IV, Fixed, 95% CI) | 7.03 [3.31, 10.75] |
| 8.3 6 months or longer | 0 | 0 | Mean Difference (IV, Fixed, 95% CI) | 0.0 [0.0, 0.0] |
| 9 Change in night‐time wakening score Show forest plot | 6 | 884 | Std. Mean Difference (IV, Fixed, 95% CI) | ‐0.45 [‐0.59, ‐0.32] |
| 9.1 1‐4 weeks | 0 | 0 | Std. Mean Difference (IV, Fixed, 95% CI) | 0.0 [0.0, 0.0] |
| 9.2 1‐5 months | 6 | 884 | Std. Mean Difference (IV, Fixed, 95% CI) | ‐0.45 [‐0.59, ‐0.32] |
| 9.3 6 months or longer | 0 | 0 | Std. Mean Difference (IV, Fixed, 95% CI) | 0.0 [0.0, 0.0] |
| 10 Change from baseline in nighttime awakenings/night Show forest plot | 5 | 1359 | Mean Difference (IV, Fixed, 95% CI) | ‐0.12 [‐0.17, ‐0.08] |
| 10.1 1‐4 weeks | 1 | 158 | Mean Difference (IV, Fixed, 95% CI) | ‐0.1 [‐0.16, ‐0.04] |
| 10.2 1‐5 months | 4 | 1201 | Mean Difference (IV, Fixed, 95% CI) | ‐0.17 [‐0.24, ‐0.09] |
| 10.3 6 months or more | 0 | 0 | Mean Difference (IV, Fixed, 95% CI) | 0.0 [0.0, 0.0] |
| 11 Change in number night‐time wakenings per week Show forest plot | 4 | 641 | Mean Difference (IV, Fixed, 95% CI) | ‐0.17 [‐0.23, ‐0.12] |
| 11.1 1‐4 weeks | 0 | 0 | Mean Difference (IV, Fixed, 95% CI) | 0.0 [0.0, 0.0] |
| 11.2 1‐5 months | 4 | 641 | Mean Difference (IV, Fixed, 95% CI) | ‐0.17 [‐0.23, ‐0.12] |
| 11.3 6 months or longer | 0 | 0 | Mean Difference (IV, Fixed, 95% CI) | 0.0 [0.0, 0.0] |
| 12 Physician‐rated efficacy: effective or very effective (No. of patients) Show forest plot | 3 | 568 | Peto Odds Ratio (Peto, Fixed, 95% CI) | 5.83 [4.16, 8.16] |
| 12.3 1‐4 weeks | 0 | 0 | Peto Odds Ratio (Peto, Fixed, 95% CI) | 0.0 [0.0, 0.0] |
| 12.4 1‐5 months | 3 | 568 | Peto Odds Ratio (Peto, Fixed, 95% CI) | 5.83 [4.16, 8.16] |
| 12.5 6 months or longer | 0 | 0 | Peto Odds Ratio (Peto, Fixed, 95% CI) | 0.0 [0.0, 0.0] |
| 13 Withdrawal due to clinical asthma exacerbation (No. of patients) Show forest plot | 4 | 702 | Peto Odds Ratio (Peto, Fixed, 95% CI) | 0.22 [0.12, 0.39] |
| 13.1 1‐4 weeks | 1 | 46 | Peto Odds Ratio (Peto, Fixed, 95% CI) | 0.14 [0.00, 6.82] |
| 13.2 1‐5 months | 2 | 442 | Peto Odds Ratio (Peto, Fixed, 95% CI) | 0.26 [0.10, 0.66] |
| 13.3 6 months or longer | 1 | 214 | Peto Odds Ratio (Peto, Fixed, 95% CI) | 0.19 [0.09, 0.42] |
| 14 Withdrawal due to lack of treatment efficacy (No. of patients) Show forest plot | 17 | 4071 | Peto Odds Ratio (Peto, Fixed, 95% CI) | 0.20 [0.17, 0.24] |
| 14.1 1‐4 weeks | 0 | 0 | Peto Odds Ratio (Peto, Fixed, 95% CI) | 0.0 [0.0, 0.0] |
| 14.2 1‐5 months | 15 | 2667 | Peto Odds Ratio (Peto, Fixed, 95% CI) | 0.20 [0.17, 0.24] |
| 14.3 6 months or longer | 2 | 1404 | Peto Odds Ratio (Peto, Fixed, 95% CI) | 0.28 [0.08, 1.00] |
| 15 Withdrawals due to adverse events Show forest plot | 13 | 3595 | Peto Odds Ratio (Peto, Fixed, 95% CI) | 1.31 [0.76, 2.27] |
| 15.1 1‐4 weeks | 4 | 203 | Peto Odds Ratio (Peto, Fixed, 95% CI) | 7.20 [0.74, 69.96] |
| 15.2 1‐5 months | 7 | 1988 | Peto Odds Ratio (Peto, Fixed, 95% CI) | 1.13 [0.56, 2.27] |
| 15.3 6 months or longer | 2 | 1404 | Peto Odds Ratio (Peto, Fixed, 95% CI) | 1.30 [0.50, 3.33] |
| 16 Withdrawals (any reason) Show forest plot | 8 | 2080 | Peto Odds Ratio (Peto, Fixed, 95% CI) | 0.40 [0.31, 0.51] |
| 16.1 1‐4 weeks | 2 | 117 | Peto Odds Ratio (Peto, Fixed, 95% CI) | 3.78 [0.63, 22.68] |
| 16.2 1‐5 months | 5 | 664 | Peto Odds Ratio (Peto, Fixed, 95% CI) | 0.29 [0.21, 0.40] |
| 16.3 6 months or longer | 1 | 1299 | Peto Odds Ratio (Peto, Fixed, 95% CI) | 0.61 [0.41, 0.90] |
| 17 Sore throat or pharyngitis (No. of patients) Show forest plot | 17 | 3480 | Peto Odds Ratio (Peto, Fixed, 95% CI) | 1.82 [1.27, 2.60] |
| 17.1 1‐4 weeks | 4 | 203 | Peto Odds Ratio (Peto, Fixed, 95% CI) | 0.99 [0.24, 4.10] |
| 17.2 1‐5 months | 10 | 1669 | Peto Odds Ratio (Peto, Fixed, 95% CI) | 1.88 [1.15, 3.08] |
| 17.3 6 months or longer | 3 | 1608 | Peto Odds Ratio (Peto, Fixed, 95% CI) | 1.91 [1.09, 3.35] |
| 18 Hoarseness or dysphonia (No. of patients) Show forest plot | 10 | 1645 | Peto Odds Ratio (Peto, Fixed, 95% CI) | 6.34 [2.83, 14.21] |
| 18.1 1‐4 weeks | 0 | 0 | Peto Odds Ratio (Peto, Fixed, 95% CI) | 0.0 [0.0, 0.0] |
| 18.2 1‐5 months | 8 | 1322 | Peto Odds Ratio (Peto, Fixed, 95% CI) | 6.25 [2.69, 14.52] |
| 18.3 6 months or longer | 2 | 323 | Peto Odds Ratio (Peto, Fixed, 95% CI) | 7.39 [0.46, 119.72] |
| 19 Oral Candidiasis (No. of patients) Show forest plot | 13 | 1887 | Peto Odds Ratio (Peto, Fixed, 95% CI) | 2.55 [1.43, 4.56] |
| 19.1 1‐4 weeks | 1 | 60 | Peto Odds Ratio (Peto, Fixed, 95% CI) | 7.92 [0.16, 399.84] |
| 19.2 1‐5 months | 10 | 1504 | Peto Odds Ratio (Peto, Fixed, 95% CI) | 2.36 [1.30, 4.31] |
| 19.3 6 months or longer | 2 | 323 | Peto Odds Ratio (Peto, Fixed, 95% CI) | 7.25 [0.45, 116.00] |
| 20 Headaches Show forest plot | 10 | 2602 | Peto Odds Ratio (Peto, Fixed, 95% CI) | 1.07 [0.83, 1.38] |
| 20.1 1‐4 weeks | 3 | 157 | Peto Odds Ratio (Peto, Fixed, 95% CI) | 6.73 [0.90, 50.54] |
| 20.2 1‐5 months | 6 | 1160 | Peto Odds Ratio (Peto, Fixed, 95% CI) | 1.10 [0.75, 1.62] |
| 20.3 6 months or longer | 1 | 1285 | Peto Odds Ratio (Peto, Fixed, 95% CI) | 0.99 [0.70, 1.41] |
| 21 Sinusitis Show forest plot | 5 | 2030 | Peto Odds Ratio (Peto, Fixed, 95% CI) | 1.29 [0.84, 1.99] |
| 21.1 1‐4 weeks | 0 | 0 | Peto Odds Ratio (Peto, Fixed, 95% CI) | 0.0 [0.0, 0.0] |
| 21.2 1‐5 months | 4 | 745 | Peto Odds Ratio (Peto, Fixed, 95% CI) | 1.64 [0.95, 2.85] |
| 21.3 6 months or longer | 1 | 1285 | Peto Odds Ratio (Peto, Fixed, 95% CI) | 0.89 [0.44, 1.77] |
| Outcome or subgroup title | No. of studies | No. of participants | Statistical method | Effect size |
| 1 Change in FEV1 compared to baseline (litres) Show forest plot | 22 | 4936 | Litres (Fixed, 95% CI) | 0.24 [0.21, 0.26] |
| 1.1 MDI | 9 | 1337 | Litres (Fixed, 95% CI) | 0.38 [0.33, 0.43] |
| 1.2 DPI | 13 | 3599 | Litres (Fixed, 95% CI) | 0.19 [0.16, 0.22] |
| 2 Change in FEV1 (% predicted) Show forest plot | 5 | 674 | % (Fixed, 95% CI) | 9.95 [7.98, 11.91] |
| 2.1 MDI | 1 | 202 | % (Fixed, 95% CI) | 10.5 [7.19, 13.81] |
| 2.2 DPI | 4 | 472 | % (Fixed, 95% CI) | 9.65 [7.20, 12.09] |
| 3 Change in morning PEFR compared with baseline Show forest plot | 24 | 5117 | Litres/min (Fixed, 95% CI) | 26.96 [24.51, 29.40] |
| 3.1 MDI | 10 | 1452 | Litres/min (Fixed, 95% CI) | 29.45 [24.97, 33.93] |
| 3.2 DPI | 14 | 3665 | Litres/min (Fixed, 95% CI) | 25.90 [22.98, 28.82] |
| 4 Change in evening PEFR compared to baseline Show forest plot | 16 | 3283 | Litres/min (Fixed, 95% CI) | 21.59 [18.55, 24.62] |
| 4.1 MDI | 5 | 787 | Litres/min (Fixed, 95% CI) | 27.98 [22.34, 33.62] |
| 4.2 DPI | 11 | 2496 | Litres/min (Fixed, 95% CI) | 18.99 [15.40, 22.59] |
| 5 Change in daily asthma symptom score compared to baseline Show forest plot | 20 | 3671 | Std. Mean Difference (IV, Fixed, 95% CI) | ‐0.49 [‐0.56, ‐0.43] |
| 5.1 MDI | 7 | 1004 | Std. Mean Difference (IV, Fixed, 95% CI) | ‐0.44 [‐0.57, ‐0.32] |
| 5.2 DPI | 12 | 2635 | Std. Mean Difference (IV, Fixed, 95% CI) | ‐0.51 [‐0.59, ‐0.43] |
| 5.3 Unclear | 1 | 32 | Std. Mean Difference (IV, Fixed, 95% CI) | 0.0 [0.0, 0.0] |
| 6 Change from baseline in symptom free days (%) Show forest plot | 3 | 971 | Mean Difference (IV, Fixed, 95% CI) | 7.03 [3.31, 10.75] |
| 6.4 MDI | 0 | 0 | Mean Difference (IV, Fixed, 95% CI) | 0.0 [0.0, 0.0] |
| 6.5 DPI | 3 | 971 | Mean Difference (IV, Fixed, 95% CI) | 7.03 [3.31, 10.75] |
| 7 Change from baseline in nighttime awakenings/night Show forest plot | 5 | 1359 | Mean Difference (IV, Fixed, 95% CI) | ‐0.12 [‐0.17, ‐0.08] |
| 7.1 MDI | 1 | 227 | Mean Difference (IV, Fixed, 95% CI) | ‐0.15 [‐0.30, 0.00] |
| 7.2 DPI | 4 | 1132 | Mean Difference (IV, Fixed, 95% CI) | ‐0.12 [‐0.17, ‐0.07] |
| 8 Change in number night‐time wakenings per week Show forest plot | 4 | 641 | Mean Difference (IV, Fixed, 95% CI) | ‐0.17 [‐0.23, ‐0.12] |
| 8.1 MDI | 3 | 485 | Mean Difference (IV, Fixed, 95% CI) | ‐0.15 [‐0.21, ‐0.09] |
| 8.2 DPI | 1 | 156 | Mean Difference (IV, Fixed, 95% CI) | ‐0.24 [‐0.34, ‐0.14] |
| 9 Change in night‐time wakening score Show forest plot | 6 | 884 | Std. Mean Difference (IV, Fixed, 95% CI) | ‐0.45 [‐0.59, ‐0.32] |
| 9.1 MDI | 4 | 555 | Std. Mean Difference (IV, Fixed, 95% CI) | ‐0.39 [‐0.56, ‐0.22] |
| 9.2 DPI | 2 | 329 | Std. Mean Difference (IV, Fixed, 95% CI) | ‐0.56 [‐0.78, ‐0.34] |
| 10 Change in daily use of beta2 agonist compared to baseline (puffs/d) Show forest plot | 22 | 5111 | Mean Difference (IV, Fixed, 95% CI) | ‐1.01 [‐1.13, ‐0.88] |
| 10.1 MDI | 8 | 1184 | Mean Difference (IV, Fixed, 95% CI) | ‐1.35 [‐1.60, ‐1.10] |
| 10.2 DPI | 14 | 3927 | Mean Difference (IV, Fixed, 95% CI) | ‐0.90 [‐1.04, ‐0.76] |
| 11 HRQOL: AQLQ Show forest plot | 3 | 513 | Mean Difference (IV, Fixed, 95% CI) | 0.68 [0.49, 0.87] |
| 11.4 MDI | 3 | 513 | Mean Difference (IV, Fixed, 95% CI) | 0.68 [0.49, 0.87] |
| 11.5 DPI | 0 | 0 | Mean Difference (IV, Fixed, 95% CI) | 0.0 [0.0, 0.0] |
| 12 Physician‐rated efficacy: effective or very effective (No. of patients) Show forest plot | 3 | 568 | Peto Odds Ratio (Peto, Fixed, 95% CI) | 5.83 [4.16, 8.16] |
| 12.1 MDI | 3 | 568 | Peto Odds Ratio (Peto, Fixed, 95% CI) | 5.83 [4.16, 8.16] |
| 12.2 DPI | 0 | 0 | Peto Odds Ratio (Peto, Fixed, 95% CI) | 0.0 [0.0, 0.0] |
| 13 Withdrawal due to clinical asthma exacerbation (No. of patients) Show forest plot | 4 | 702 | Peto Odds Ratio (Peto, Fixed, 95% CI) | 0.22 [0.12, 0.39] |
| 13.1 MDI | 1 | 46 | Peto Odds Ratio (Peto, Fixed, 95% CI) | 0.14 [0.00, 6.82] |
| 13.2 DPI | 3 | 656 | Peto Odds Ratio (Peto, Fixed, 95% CI) | 0.22 [0.12, 0.40] |
| 14 Withdrawal due to lack of treatment efficacy (No. of patients) Show forest plot | 17 | 4071 | Peto Odds Ratio (Peto, Fixed, 95% CI) | 0.20 [0.17, 0.24] |
| 14.1 MDI | 7 | 1105 | Peto Odds Ratio (Peto, Fixed, 95% CI) | 0.19 [0.14, 0.24] |
| 14.2 DPI | 10 | 2966 | Peto Odds Ratio (Peto, Fixed, 95% CI) | 0.22 [0.17, 0.28] |
| 15 Withdrawals due to adverse events Show forest plot | 13 | 3595 | Peto Odds Ratio (Peto, Fixed, 95% CI) | 1.31 [0.76, 2.27] |
| 15.1 MDI | 6 | 778 | Peto Odds Ratio (Peto, Fixed, 95% CI) | 1.35 [0.43, 4.21] |
| 15.2 DPI | 7 | 2817 | Peto Odds Ratio (Peto, Fixed, 95% CI) | 1.30 [0.70, 2.42] |
| 16 Withdrawals (any reason) Show forest plot | 8 | 2080 | Peto Odds Ratio (Peto, Fixed, 95% CI) | 0.40 [0.31, 0.51] |
| 16.1 MDI | 2 | 226 | Peto Odds Ratio (Peto, Fixed, 95% CI) | 0.21 [0.12, 0.37] |
| 16.2 DPI | 6 | 1854 | Peto Odds Ratio (Peto, Fixed, 95% CI) | 0.46 [0.35, 0.61] |
| 17 Sore throat or pharyngitis (No. of patients) Show forest plot | 17 | 3480 | Peto Odds Ratio (Peto, Fixed, 95% CI) | 1.82 [1.27, 2.60] |
| 17.1 MDI | 8 | 1085 | Peto Odds Ratio (Peto, Fixed, 95% CI) | 2.21 [1.26, 3.89] |
| 17.2 DPI | 9 | 2395 | Peto Odds Ratio (Peto, Fixed, 95% CI) | 1.60 [1.01, 2.53] |
| 18 Hoarseness or dysphonia (No. of patients) Show forest plot | 10 | 1645 | Peto Odds Ratio (Peto, Fixed, 95% CI) | 6.34 [2.83, 14.21] |
| 18.1 MDI | 5 | 757 | Peto Odds Ratio (Peto, Fixed, 95% CI) | 5.74 [2.13, 15.45] |
| 18.2 DPI | 5 | 888 | Peto Odds Ratio (Peto, Fixed, 95% CI) | 7.72 [1.92, 31.07] |
| 19 Oral Candidiasis (No. of patients) Show forest plot | 13 | 1887 | Peto Odds Ratio (Peto, Fixed, 95% CI) | 2.55 [1.43, 4.56] |
| 19.1 MDI | 6 | 834 | Peto Odds Ratio (Peto, Fixed, 95% CI) | 3.26 [1.17, 9.06] |
| 19.2 DPI | 7 | 1053 | Peto Odds Ratio (Peto, Fixed, 95% CI) | 2.27 [1.12, 4.59] |
| 20 Headaches Show forest plot | 10 | 2602 | Peto Odds Ratio (Peto, Fixed, 95% CI) | 1.07 [0.83, 1.38] |
| 20.1 MDI | 4 | 446 | Peto Odds Ratio (Peto, Fixed, 95% CI) | 1.07 [0.61, 1.87] |
| 20.2 DPI | 6 | 2156 | Peto Odds Ratio (Peto, Fixed, 95% CI) | 1.07 [0.80, 1.43] |
| 21 Sinusitis Show forest plot | 5 | 2030 | Peto Odds Ratio (Peto, Fixed, 95% CI) | 1.29 [0.84, 1.99] |
| 21.1 MDI | 3 | 587 | Peto Odds Ratio (Peto, Fixed, 95% CI) | 1.63 [0.85, 3.11] |
| 21.2 DPI | 2 | 1443 | Peto Odds Ratio (Peto, Fixed, 95% CI) | 1.08 [0.61, 1.92] |
| Outcome or subgroup title | No. of studies | No. of participants | Statistical method | Effect size |
| 1 Change in FEV1 compared to baseline (litres) Show forest plot | 22 | 4936 | Litres (Fixed, 95% CI) | 0.24 [0.21, 0.26] |
| 1.1 Mild | 1 | 1263 | Litres (Fixed, 95% CI) | 0.1 [0.04, 0.16] |
| 1.2 Mild to moderate | 8 | 1320 | Litres (Fixed, 95% CI) | 0.26 [0.22, 0.31] |
| 1.3 Moderate | 13 | 2353 | Litres (Fixed, 95% CI) | 0.27 [0.23, 0.30] |
| 2 Change in FEV1 (% predicted) Show forest plot | 5 | 674 | % (Fixed, 95% CI) | 9.95 [7.98, 11.91] |
| 2.1 Mild | 0 | 0 | % (Fixed, 95% CI) | 0.0 [0.0, 0.0] |
| 2.2 Mild to moderate | 2 | 304 | % (Fixed, 95% CI) | 10.08 [6.69, 13.48] |
| 2.3 Moderate | 3 | 370 | % (Fixed, 95% CI) | 9.88 [7.47, 12.29] |
| 3 Change in morning PEFR compared with baseline Show forest plot | 24 | 5117 | Litres/min (Fixed, 95% CI) | 26.96 [24.51, 29.40] |
| 3.1 Mild | 2 | 1331 | Litres/min (Fixed, 95% CI) | 19.35 [14.47, 24.24] |
| 3.2 Mild to moderate | 6 | 1094 | Litres/min (Fixed, 95% CI) | 24.48 [19.32, 29.64] |
| 3.3 Moderate | 16 | 2692 | Litres/min (Fixed, 95% CI) | 31.64 [28.27, 35.01] |
| 4 Change in evening PEFR compared to baseline Show forest plot | 16 | 3283 | Litres/min (Fixed, 95% CI) | 21.59 [18.55, 24.62] |
| 4.1 Mild | 0 | 0 | Litres/min (Fixed, 95% CI) | 0.0 [0.0, 0.0] |
| 4.2 Mild to moderate | 5 | 1305 | Litres/min (Fixed, 95% CI) | 18.22 [13.35, 23.09] |
| 4.3 Moderate | 11 | 1978 | Litres/min (Fixed, 95% CI) | 23.72 [19.84, 27.59] |
| 5 Change in daily asthma symptom score compared to baseline Show forest plot | 20 | 3671 | Std. Mean Difference (IV, Fixed, 95% CI) | ‐0.49 [‐0.56, ‐0.43] |
| 5.1 Mild | 0 | 0 | Std. Mean Difference (IV, Fixed, 95% CI) | 0.0 [0.0, 0.0] |
| 5.2 Mild to moderate | 7 | 1518 | Std. Mean Difference (IV, Fixed, 95% CI) | ‐0.43 [‐0.53, ‐0.33] |
| 5.3 Moderate | 13 | 2153 | Std. Mean Difference (IV, Fixed, 95% CI) | ‐0.54 [‐0.63, ‐0.45] |
| 6 Change from baseline in symptom free days (%) Show forest plot | 3 | 971 | Mean Difference (IV, Fixed, 95% CI) | 7.03 [3.31, 10.75] |
| 6.1 Mild | 0 | 0 | Mean Difference (IV, Fixed, 95% CI) | 0.0 [0.0, 0.0] |
| 6.2 Mild to moderate | 1 | 408 | Mean Difference (IV, Fixed, 95% CI) | 4.0 [‐1.02, 9.02] |
| 6.3 Moderate | 2 | 563 | Mean Difference (IV, Fixed, 95% CI) | 10.72 [5.18, 16.27] |
| 7 Change in number night‐time wakenings per week Show forest plot | 4 | 641 | Mean Difference (IV, Fixed, 95% CI) | ‐0.17 [‐0.23, ‐0.12] |
| 7.1 Mild | 0 | 0 | Mean Difference (IV, Fixed, 95% CI) | 0.0 [0.0, 0.0] |
| 7.2 Mild to moderate | 1 | 160 | Mean Difference (IV, Fixed, 95% CI) | ‐0.17 [‐0.27, ‐0.07] |
| 7.3 Moderate | 3 | 481 | Mean Difference (IV, Fixed, 95% CI) | ‐0.17 [‐0.24, ‐0.11] |
| 8 Change from baseline in nighttime awakenings/night Show forest plot | 5 | 1359 | Mean Difference (IV, Fixed, 95% CI) | ‐0.12 [‐0.17, ‐0.08] |
| 8.1 MDI | 1 | 227 | Mean Difference (IV, Fixed, 95% CI) | ‐0.15 [‐0.30, 0.00] |
| 8.2 DPI | 4 | 1132 | Mean Difference (IV, Fixed, 95% CI) | ‐0.12 [‐0.17, ‐0.07] |
| 9 Change in night‐time wakening score Show forest plot | 6 | 884 | Std. Mean Difference (IV, Fixed, 95% CI) | ‐0.45 [‐0.59, ‐0.32] |
| 9.1 Mild | 0 | 0 | Std. Mean Difference (IV, Fixed, 95% CI) | 0.0 [0.0, 0.0] |
| 9.2 Mild to moderate | 1 | 160 | Std. Mean Difference (IV, Fixed, 95% CI) | ‐0.53 [‐0.84, ‐0.21] |
| 9.3 Moderate | 5 | 724 | Std. Mean Difference (IV, Fixed, 95% CI) | ‐0.44 [‐0.59, ‐0.29] |
| 10 Change in daily use of beta2 agonist compared to baseline (puffs/d) Show forest plot | 22 | 5111 | Mean Difference (IV, Fixed, 95% CI) | ‐1.01 [‐1.13, ‐0.88] |
| 10.1 Mild | 1 | 1263 | Mean Difference (IV, Fixed, 95% CI) | ‐0.18 [‐0.44, 0.08] |
| 10.2 Mild to moderate | 7 | 1518 | Mean Difference (IV, Fixed, 95% CI) | ‐0.89 [‐1.10, ‐0.68] |
| 10.3 Moderate | 14 | 2330 | Mean Difference (IV, Fixed, 95% CI) | ‐1.50 [‐1.68, ‐1.31] |
| 11 HRQOL: AQLQ Show forest plot | 3 | 513 | Mean Difference (IV, Fixed, 95% CI) | 0.68 [0.49, 0.87] |
| 11.1 Mild | 0 | 0 | Mean Difference (IV, Fixed, 95% CI) | 0.0 [0.0, 0.0] |
| 11.2 Mild to moderate | 1 | 168 | Mean Difference (IV, Fixed, 95% CI) | 0.49 [0.17, 0.81] |
| 11.3 Moderate | 1 | 175 | Mean Difference (IV, Fixed, 95% CI) | 0.83 [0.48, 1.18] |
| 11.4 Unclear | 1 | 170 | Mean Difference (IV, Fixed, 95% CI) | 0.75 [0.43, 1.07] |
| 12 Physician‐rated efficacy: effective or very effective (No. of patients) Show forest plot | 3 | 568 | Peto Odds Ratio (Peto, Fixed, 95% CI) | 5.83 [4.16, 8.16] |
| 12.1 Mild | 0 | 0 | Peto Odds Ratio (Peto, Fixed, 95% CI) | 0.0 [0.0, 0.0] |
| 12.2 Mild to moderate | 1 | 168 | Peto Odds Ratio (Peto, Fixed, 95% CI) | 10.01 [5.46, 18.37] |
| 12.3 Moderate | 2 | 400 | Peto Odds Ratio (Peto, Fixed, 95% CI) | 4.58 [3.05, 6.86] |
| 13 Withdrawal due to clinical asthma exacerbation (No. of patients) Show forest plot | 4 | 702 | Peto Odds Ratio (Peto, Fixed, 95% CI) | 0.22 [0.12, 0.39] |
| 13.1 Mild | 0 | 0 | Peto Odds Ratio (Peto, Fixed, 95% CI) | 0.0 [0.0, 0.0] |
| 13.2 Mild to moderate | 3 | 668 | Peto Odds Ratio (Peto, Fixed, 95% CI) | 0.22 [0.12, 0.42] |
| 13.3 Moderate | 1 | 34 | Peto Odds Ratio (Peto, Fixed, 95% CI) | 0.14 [0.02, 1.11] |
| 14 Withdrawal due to lack of treatment efficacy (No. of patients) Show forest plot | 17 | 4071 | Peto Odds Ratio (Peto, Fixed, 95% CI) | 0.20 [0.17, 0.24] |
| 14.1 Mild | 2 | 1404 | Peto Odds Ratio (Peto, Fixed, 95% CI) | 0.28 [0.08, 1.00] |
| 14.2 Mild to moderate | 4 | 906 | Peto Odds Ratio (Peto, Fixed, 95% CI) | 0.21 [0.14, 0.30] |
| 14.3 Moderate | 11 | 1761 | Peto Odds Ratio (Peto, Fixed, 95% CI) | 0.20 [0.17, 0.25] |
| 15 Withdrawals due to adverse events Show forest plot | 13 | 3595 | Peto Odds Ratio (Peto, Fixed, 95% CI) | 1.31 [0.76, 2.27] |
| 15.1 Mild | 3 | 1444 | Peto Odds Ratio (Peto, Fixed, 95% CI) | 1.40 [0.56, 3.51] |
| 15.2 Mild to moderate | 6 | 1171 | Peto Odds Ratio (Peto, Fixed, 95% CI) | 1.34 [0.50, 3.58] |
| 15.3 Moderate | 4 | 980 | Peto Odds Ratio (Peto, Fixed, 95% CI) | 1.21 [0.48, 3.07] |
| 16 Withdrawals (any reason) Show forest plot | 8 | 2080 | Peto Odds Ratio (Peto, Fixed, 95% CI) | 0.40 [0.31, 0.51] |
| 16.1 Mild | 1 | 1299 | Peto Odds Ratio (Peto, Fixed, 95% CI) | 0.61 [0.41, 0.90] |
| 16.2 Mild to moderate | 5 | 467 | Peto Odds Ratio (Peto, Fixed, 95% CI) | 0.39 [0.25, 0.60] |
| 16.3 Moderate | 2 | 314 | Peto Odds Ratio (Peto, Fixed, 95% CI) | 0.25 [0.16, 0.39] |
| 17 Sore throat or pharyngitis (No. of patients) Show forest plot | 17 | 3480 | Peto Odds Ratio (Peto, Fixed, 95% CI) | 1.82 [1.27, 2.60] |
| 17.1 Mild | 2 | 1394 | Peto Odds Ratio (Peto, Fixed, 95% CI) | 1.97 [1.11, 3.49] |
| 17.2 Mild to moderate | 7 | 751 | Peto Odds Ratio (Peto, Fixed, 95% CI) | 1.37 [0.75, 2.53] |
| 17.3 Moderate | 8 | 1335 | Peto Odds Ratio (Peto, Fixed, 95% CI) | 2.32 [1.16, 4.64] |
| 18 Hoarseness or dysphonia (No. of patients) Show forest plot | 10 | 1645 | Peto Odds Ratio (Peto, Fixed, 95% CI) | 6.34 [2.83, 14.21] |
| 18.1 Mild | 1 | 109 | Peto Odds Ratio (Peto, Fixed, 95% CI) | 7.39 [0.46, 119.72] |
| 18.2 Mild to moderate | 2 | 382 | Peto Odds Ratio (Peto, Fixed, 95% CI) | 7.22 [0.14, 363.83] |
| 18.3 Moderate | 7 | 1154 | Peto Odds Ratio (Peto, Fixed, 95% CI) | 6.21 [2.62, 14.72] |
| 19 Oral Candidiasis (No. of patients) Show forest plot | 13 | 1887 | Peto Odds Ratio (Peto, Fixed, 95% CI) | 2.55 [1.43, 4.56] |
| 19.1 Mild | 1 | 109 | Peto Odds Ratio (Peto, Fixed, 95% CI) | 7.26 [0.14, 365.74] |
| 19.2 Mild to moderate | 4 | 600 | Peto Odds Ratio (Peto, Fixed, 95% CI) | 1.65 [0.67, 4.06] |
| 19.3 Moderate | 7 | 1155 | Peto Odds Ratio (Peto, Fixed, 95% CI) | 3.39 [1.56, 7.36] |
| 19.4 Unclear | 1 | 23 | Peto Odds Ratio (Peto, Fixed, 95% CI) | 0.0 [0.0, 0.0] |
| 20 Headaches Show forest plot | 10 | 2602 | Peto Odds Ratio (Peto, Fixed, 95% CI) | 1.07 [0.83, 1.38] |
| 20.1 Mild | 1 | 1285 | Peto Odds Ratio (Peto, Fixed, 95% CI) | 0.99 [0.70, 1.41] |
| 20.2 Mild to moderate | 7 | 965 | Peto Odds Ratio (Peto, Fixed, 95% CI) | 1.12 [0.73, 1.72] |
| 20.3 Moderate | 2 | 352 | Peto Odds Ratio (Peto, Fixed, 95% CI) | 1.39 [0.61, 3.19] |
| 21 Sinusitis Show forest plot | 5 | 2030 | Peto Odds Ratio (Peto, Fixed, 95% CI) | 1.29 [0.84, 1.99] |
| 21.1 Mild | 1 | 1285 | Peto Odds Ratio (Peto, Fixed, 95% CI) | 0.89 [0.44, 1.77] |
| 21.2 Mild to moderate | 2 | 338 | Peto Odds Ratio (Peto, Fixed, 95% CI) | 1.36 [0.61, 3.03] |
| 21.3 Moderate | 2 | 407 | Peto Odds Ratio (Peto, Fixed, 95% CI) | 1.94 [0.91, 4.14] |
| Outcome or subgroup title | No. of studies | No. of participants | Statistical method | Effect size |
| 1 Change in FEV1 compared to baseline (litres) Show forest plot | 6 | 872 | Mean Difference (IV, Fixed, 95% CI) | 0.44 [0.39, 0.50] |
| 1.1 Children | 0 | 0 | Mean Difference (IV, Fixed, 95% CI) | 0.0 [0.0, 0.0] |
| 1.2 Adults | 6 | 872 | Mean Difference (IV, Fixed, 95% CI) | 0.44 [0.39, 0.50] |
| 2 FEV1 (% predicted ‐ absolute scores) Show forest plot | 2 | 50 | Mean Difference (IV, Fixed, 95% CI) | 24.43 [15.90, 32.95] |
| 2.1 Children | 1 | 26 | Mean Difference (IV, Fixed, 95% CI) | 4.30 [‐25.66, 34.26] |
| 2.2 Adults | 1 | 24 | Mean Difference (IV, Fixed, 95% CI) | 26.20 [17.31, 35.09] |
| 3 Change in morning PEF Show forest plot | 8 | 1116 | Litres/min (Fixed, 95% CI) | 40.44 [35.43, 45.45] |
| 3.1 Children | 0 | 0 | Litres/min (Fixed, 95% CI) | 0.0 [0.0, 0.0] |
| 3.2 Adults | 8 | 1116 | Litres/min (Fixed, 95% CI) | 40.44 [35.43, 45.45] |
| 4 Change in morning PEFR compared to baseline (L/min) Show forest plot | 7 | 1076 | Mean Difference (IV, Fixed, 95% CI) | 40.12 [35.06, 45.17] |
| 4.1 Children | 0 | 0 | Mean Difference (IV, Fixed, 95% CI) | 0.0 [0.0, 0.0] |
| 4.2 Adults | 7 | 1076 | Mean Difference (IV, Fixed, 95% CI) | 40.12 [35.06, 45.17] |
| 5 Change in am PEF (% predicted) Show forest plot | 1 | Mean Difference (IV, Fixed, 95% CI) | Totals not selected | |
| 5.1 Children | 0 | Mean Difference (IV, Fixed, 95% CI) | 0.0 [0.0, 0.0] | |
| 5.2 Adults | 1 | Mean Difference (IV, Fixed, 95% CI) | 0.0 [0.0, 0.0] | |
| 6 Change in evening PEF compared with baseline Show forest plot | 4 | 515 | Litres/min (Fixed, 95% CI) | 30.20 [22.52, 37.87] |
| 6.1 Children | 0 | 0 | Litres/min (Fixed, 95% CI) | 0.0 [0.0, 0.0] |
| 6.2 Adults | 4 | 515 | Litres/min (Fixed, 95% CI) | 30.20 [22.52, 37.87] |
| 7 Change in evening PEF compared with baseline (L/min) Show forest plot | 3 | 354 | Mean Difference (IV, Fixed, 95% CI) | 28.96 [20.86, 37.06] |
| 7.1 Children | 0 | 0 | Mean Difference (IV, Fixed, 95% CI) | 0.0 [0.0, 0.0] |
| 7.2 Adults | 3 | 354 | Mean Difference (IV, Fixed, 95% CI) | 28.96 [20.86, 37.06] |
| 8 Change in daily asthma symptom score compared to baseline Show forest plot | 4 | 685 | Std. Mean Difference (IV, Fixed, 95% CI) | ‐0.85 [‐1.01, ‐0.70] |
| 8.1 Children | 0 | 0 | Std. Mean Difference (IV, Fixed, 95% CI) | 0.0 [0.0, 0.0] |
| 8.2 Adults | 4 | 685 | Std. Mean Difference (IV, Fixed, 95% CI) | ‐0.85 [‐1.01, ‐0.70] |
| 9 Change in number night‐time wakenings per week Show forest plot | 1 | Mean Difference (IV, Fixed, 95% CI) | Totals not selected | |
| 9.1 Children | 0 | Mean Difference (IV, Fixed, 95% CI) | 0.0 [0.0, 0.0] | |
| 9.2 Adults | 1 | Mean Difference (IV, Fixed, 95% CI) | 0.0 [0.0, 0.0] | |
| 10 Change in number of night‐time awakenings per night Show forest plot | 1 | Mean Difference (IV, Fixed, 95% CI) | Totals not selected | |
| 10.1 Children | 0 | Mean Difference (IV, Fixed, 95% CI) | 0.0 [0.0, 0.0] | |
| 10.2 Adults | 1 | Mean Difference (IV, Fixed, 95% CI) | 0.0 [0.0, 0.0] | |
| 11 Change in % nights with no awakenings Show forest plot | 1 | Mean Difference (IV, Fixed, 95% CI) | Totals not selected | |
| 11.1 Children | 0 | Mean Difference (IV, Fixed, 95% CI) | 0.0 [0.0, 0.0] | |
| 11.2 Adults | 1 | Mean Difference (IV, Fixed, 95% CI) | 0.0 [0.0, 0.0] | |
| 12 Change in night‐time wakening score Show forest plot | 2 | 351 | Std. Mean Difference (IV, Fixed, 95% CI) | ‐0.74 [‐0.96, ‐0.52] |
| 12.1 Children | 0 | 0 | Std. Mean Difference (IV, Fixed, 95% CI) | 0.0 [0.0, 0.0] |
| 12.2 Adults | 2 | 351 | Std. Mean Difference (IV, Fixed, 95% CI) | ‐0.74 [‐0.96, ‐0.52] |
| 13 Change in daily use of beta2 agonist compared to baseline (puffs/d) Show forest plot | 4 | 682 | Mean Difference (IV, Fixed, 95% CI) | ‐2.22 [‐2.59, ‐1.84] |
| 13.1 Children | 0 | 0 | Mean Difference (IV, Fixed, 95% CI) | 0.0 [0.0, 0.0] |
| 13.2 Adults | 4 | 682 | Mean Difference (IV, Fixed, 95% CI) | ‐2.22 [‐2.59, ‐1.84] |
| 14 Change in percentage of symptom free days compared to baseline Show forest plot | 2 | 361 | Mean Difference (IV, Fixed, 95% CI) | 21.32 [13.54, 29.09] |
| 14.1 Children | 0 | 0 | Mean Difference (IV, Fixed, 95% CI) | 0.0 [0.0, 0.0] |
| 14.2 Adults | 2 | 361 | Mean Difference (IV, Fixed, 95% CI) | 21.32 [13.54, 29.09] |
| 15 Change in percentage of rescue beta2 agonist free days compared to baseline Show forest plot | 1 | Mean Difference (IV, Fixed, 95% CI) | Totals not selected | |
| 15.1 Children | 0 | Mean Difference (IV, Fixed, 95% CI) | 0.0 [0.0, 0.0] | |
| 15.2 Adults | 1 | Mean Difference (IV, Fixed, 95% CI) | 0.0 [0.0, 0.0] | |
| 16 HRQOL: AQLQ Show forest plot | 1 | Mean Difference (IV, Fixed, 95% CI) | Totals not selected | |
| 16.1 Children | 0 | Mean Difference (IV, Fixed, 95% CI) | 0.0 [0.0, 0.0] | |
| 16.2 Adults | 1 | Mean Difference (IV, Fixed, 95% CI) | 0.0 [0.0, 0.0] | |
| 17 Physician rated global efficacy: effective or very effective (No. of patients) Show forest plot | 3 | 480 | Peto Odds Ratio (Peto, Fixed, 95% CI) | 5.86 [4.09, 8.39] |
| 17.1 Children | 0 | 0 | Peto Odds Ratio (Peto, Fixed, 95% CI) | 0.0 [0.0, 0.0] |
| 17.2 Adults | 3 | 480 | Peto Odds Ratio (Peto, Fixed, 95% CI) | 5.86 [4.09, 8.39] |
| 18 Withdrawal due to clinical asthma exacerbation (No. of patients) Show forest plot | 2 | 191 | Peto Odds Ratio (Peto, Fixed, 95% CI) | 0.40 [0.17, 0.98] |
| 18.1 Children | 0 | 0 | Peto Odds Ratio (Peto, Fixed, 95% CI) | 0.0 [0.0, 0.0] |
| 18.2 Adults | 2 | 191 | Peto Odds Ratio (Peto, Fixed, 95% CI) | 0.40 [0.17, 0.98] |
| 19 Withdrawal due to lack of treatment efficacy (No. of patients) Show forest plot | 5 | 847 | Peto Odds Ratio (Peto, Fixed, 95% CI) | 0.14 [0.10, 0.18] |
| 19.1 Children | 0 | 0 | Peto Odds Ratio (Peto, Fixed, 95% CI) | 0.0 [0.0, 0.0] |
| 19.2 Adults | 5 | 847 | Peto Odds Ratio (Peto, Fixed, 95% CI) | 0.14 [0.10, 0.18] |
| 20 Withdrawals (total) Show forest plot | 1 | Peto Odds Ratio (Peto, Fixed, 95% CI) | Totals not selected | |
| 20.1 Children | 0 | Peto Odds Ratio (Peto, Fixed, 95% CI) | 0.0 [0.0, 0.0] | |
| 20.2 Adults | 1 | Peto Odds Ratio (Peto, Fixed, 95% CI) | 0.0 [0.0, 0.0] | |
| 21 Sore throat or pharyngitis (No. of patients) Show forest plot | 4 | 670 | Peto Odds Ratio (Peto, Fixed, 95% CI) | 4.49 [1.11, 18.13] |
| 21.1 Children | 0 | 0 | Peto Odds Ratio (Peto, Fixed, 95% CI) | 0.0 [0.0, 0.0] |
| 21.2 Adults | 4 | 670 | Peto Odds Ratio (Peto, Fixed, 95% CI) | 4.49 [1.11, 18.13] |
| 22 Hoarseness or dysphonia (No. of patients) Show forest plot | 4 | 670 | Peto Odds Ratio (Peto, Fixed, 95% CI) | 7.36 [2.65, 20.46] |
| 22.1 Children | 0 | 0 | Peto Odds Ratio (Peto, Fixed, 95% CI) | 0.0 [0.0, 0.0] |
| 22.2 Adults | 4 | 670 | Peto Odds Ratio (Peto, Fixed, 95% CI) | 7.36 [2.65, 20.46] |
| 23 Oral Candidiasis (No. of patients) Show forest plot | 5 | 841 | Peto Odds Ratio (Peto, Fixed, 95% CI) | 6.37 [2.62, 15.48] |
| 23.1 Children | 0 | 0 | Peto Odds Ratio (Peto, Fixed, 95% CI) | 0.0 [0.0, 0.0] |
| 23.2 Adults | 5 | 841 | Peto Odds Ratio (Peto, Fixed, 95% CI) | 6.37 [2.62, 15.48] |
| 25 No. patients with </=18 mcg/dL poststimulation cortisol Show forest plot | 1 | Peto Odds Ratio (Peto, Fixed, 95% CI) | Totals not selected | |
| 25.1 Children | 0 | Peto Odds Ratio (Peto, Fixed, 95% CI) | 0.0 [0.0, 0.0] | |
| 25.2 Adults | 1 | Peto Odds Ratio (Peto, Fixed, 95% CI) | 0.0 [0.0, 0.0] | |
| 26 Plasma cortisol (AUC) Show forest plot | 1 | Mean Difference (IV, Fixed, 95% CI) | Totals not selected | |
| 26.1 Children | 0 | Mean Difference (IV, Fixed, 95% CI) | 0.0 [0.0, 0.0] | |
| 26.2 Adults | 1 | Mean Difference (IV, Fixed, 95% CI) | 0.0 [0.0, 0.0] | |
| Outcome or subgroup title | No. of studies | No. of participants | Statistical method | Effect size |
| 1 Change in FEV1 compared to baseline (litres) Show forest plot | 6 | 872 | Mean Difference (IV, Fixed, 95% CI) | 0.44 [0.39, 0.50] |
| 1.1 1‐4 weeks | 0 | 0 | Mean Difference (IV, Fixed, 95% CI) | 0.0 [0.0, 0.0] |
| 1.2 1‐5 months | 6 | 872 | Mean Difference (IV, Fixed, 95% CI) | 0.44 [0.39, 0.50] |
| 1.3 6 months or longer | 0 | 0 | Mean Difference (IV, Fixed, 95% CI) | 0.0 [0.0, 0.0] |
| 2 Change in morning PEFR compared to baseline Show forest plot | 8 | 1116 | Litres/min (Fixed, 95% CI) | 40.44 [35.43, 45.45] |
| 2.1 1‐4 weeks | 0 | 0 | Litres/min (Fixed, 95% CI) | 0.0 [0.0, 0.0] |
| 2.2 1‐5 months | 8 | 1116 | Litres/min (Fixed, 95% CI) | 40.44 [35.43, 45.45] |
| 2.3 6 months or longer | 0 | 0 | Litres/min (Fixed, 95% CI) | 0.0 [0.0, 0.0] |
| 3 Change in evening PEF compared with baseline (L/min) Show forest plot | 3 | 354 | Mean Difference (IV, Fixed, 95% CI) | 28.96 [20.86, 37.06] |
| 3.1 1‐4 weeks | 0 | 0 | Mean Difference (IV, Fixed, 95% CI) | 0.0 [0.0, 0.0] |
| 3.2 1‐5 months | 3 | 354 | Mean Difference (IV, Fixed, 95% CI) | 28.96 [20.86, 37.06] |
| 3.3 6 months or longer | 0 | 0 | Mean Difference (IV, Fixed, 95% CI) | 0.0 [0.0, 0.0] |
| 4 Change in daily asthma symptom score compared to baseline Show forest plot | 4 | 685 | Std. Mean Difference (IV, Fixed, 95% CI) | ‐0.85 [‐1.01, ‐0.70] |
| 4.1 1‐4 weeks | 0 | 0 | Std. Mean Difference (IV, Fixed, 95% CI) | 0.0 [0.0, 0.0] |
| 4.2 1‐5 months | 4 | 685 | Std. Mean Difference (IV, Fixed, 95% CI) | ‐0.85 [‐1.01, ‐0.70] |
| 4.3 6 months or longer | 0 | 0 | Std. Mean Difference (IV, Fixed, 95% CI) | 0.0 [0.0, 0.0] |
| 5 Change in night‐time wakening score Show forest plot | 2 | 351 | Std. Mean Difference (IV, Fixed, 95% CI) | ‐0.74 [‐0.96, ‐0.52] |
| 5.1 1‐4 weeks | 0 | 0 | Std. Mean Difference (IV, Fixed, 95% CI) | 0.0 [0.0, 0.0] |
| 5.2 1‐5 months | 2 | 351 | Std. Mean Difference (IV, Fixed, 95% CI) | ‐0.74 [‐0.96, ‐0.52] |
| 5.3 6 months or longer | 0 | 0 | Std. Mean Difference (IV, Fixed, 95% CI) | 0.0 [0.0, 0.0] |
| 6 Change in daily use of beta2 agonist compared to baseline (puffs/d) Show forest plot | 4 | 682 | Mean Difference (IV, Fixed, 95% CI) | ‐2.22 [‐2.59, ‐1.84] |
| 6.1 1‐4 weeks | 0 | 0 | Mean Difference (IV, Fixed, 95% CI) | 0.0 [0.0, 0.0] |
| 6.2 1‐5 months | 4 | 682 | Mean Difference (IV, Fixed, 95% CI) | ‐2.22 [‐2.59, ‐1.84] |
| 6.3 6 months or longer | 0 | 0 | Mean Difference (IV, Fixed, 95% CI) | 0.0 [0.0, 0.0] |
| 9 Physician rated global efficacy: effective or very effective (No. of patients) Show forest plot | 3 | 480 | Peto Odds Ratio (Peto, Fixed, 95% CI) | 5.86 [4.09, 8.39] |
| 9.1 1‐4 weeks | 0 | 0 | Peto Odds Ratio (Peto, Fixed, 95% CI) | 0.0 [0.0, 0.0] |
| 9.2 1‐5 months | 3 | 480 | Peto Odds Ratio (Peto, Fixed, 95% CI) | 5.86 [4.09, 8.39] |
| 9.3 6 months or longer | 0 | 0 | Peto Odds Ratio (Peto, Fixed, 95% CI) | 0.0 [0.0, 0.0] |
| 11 Withdrawal due to lack of treatment efficacy (No. of patients) Show forest plot | 4 | 676 | Peto Odds Ratio (Peto, Fixed, 95% CI) | 0.12 [0.09, 0.17] |
| 11.1 1‐4 weeks | 0 | 0 | Peto Odds Ratio (Peto, Fixed, 95% CI) | 0.0 [0.0, 0.0] |
| 11.2 1‐5 months | 4 | 676 | Peto Odds Ratio (Peto, Fixed, 95% CI) | 0.12 [0.09, 0.17] |
| 11.3 6 months or longer | 0 | 0 | Peto Odds Ratio (Peto, Fixed, 95% CI) | 0.0 [0.0, 0.0] |
| 12 Sore throat or pharyngitis (No. of patients) Show forest plot | 4 | 670 | Peto Odds Ratio (Peto, Fixed, 95% CI) | 4.49 [1.11, 18.13] |
| 12.1 1‐4 weeks | 0 | 0 | Peto Odds Ratio (Peto, Fixed, 95% CI) | 0.0 [0.0, 0.0] |
| 12.2 1‐5 months | 4 | 670 | Peto Odds Ratio (Peto, Fixed, 95% CI) | 4.49 [1.11, 18.13] |
| 12.3 6 months or longer | 0 | 0 | Peto Odds Ratio (Peto, Fixed, 95% CI) | 0.0 [0.0, 0.0] |
| 13 Hoarseness or dysphonia (No. of patients) Show forest plot | 4 | 670 | Peto Odds Ratio (Peto, Fixed, 95% CI) | 7.36 [2.65, 20.46] |
| 13.1 1‐4 weeks | 0 | 0 | Peto Odds Ratio (Peto, Fixed, 95% CI) | 0.0 [0.0, 0.0] |
| 13.2 1‐5 months | 4 | 670 | Peto Odds Ratio (Peto, Fixed, 95% CI) | 7.36 [2.65, 20.46] |
| 13.3 6 months or longer | 0 | 0 | Peto Odds Ratio (Peto, Fixed, 95% CI) | 0.0 [0.0, 0.0] |
| 14 Oral Candidiasis (No. of patients) Show forest plot | 5 | 841 | Peto Odds Ratio (Peto, Fixed, 95% CI) | 6.37 [2.62, 15.48] |
| 14.1 1‐4 weeks | 0 | 0 | Peto Odds Ratio (Peto, Fixed, 95% CI) | 0.0 [0.0, 0.0] |
| 14.2 1‐5 months | 5 | 841 | Peto Odds Ratio (Peto, Fixed, 95% CI) | 6.37 [2.62, 15.48] |
| 14.3 6 months or longer | 0 | 0 | Peto Odds Ratio (Peto, Fixed, 95% CI) | 0.0 [0.0, 0.0] |
| Outcome or subgroup title | No. of studies | No. of participants | Statistical method | Effect size |
| 1 Change in FEV1 compared to baseline (litres) Show forest plot | 6 | 872 | Mean Difference (IV, Fixed, 95% CI) | 0.44 [0.39, 0.50] |
| 1.1 MDI | 1 | 26 | Mean Difference (IV, Fixed, 95% CI) | 0.46 [0.29, 0.63] |
| 1.2 DPI | 5 | 846 | Mean Difference (IV, Fixed, 95% CI) | 0.44 [0.38, 0.50] |
| 2 Change in morning PEFR compared with baseline Show forest plot | 8 | 1116 | Litres/min (Fixed, 95% CI) | 40.44 [35.43, 45.45] |
| 2.1 MDI | 2 | 230 | Litres/min (Fixed, 95% CI) | 34.84 [23.10, 46.58] |
| 2.2 DPI | 6 | 886 | Litres/min (Fixed, 95% CI) | 41.69 [36.15, 47.23] |
| 3 Change in evening PEF compared with baseline (L/min) Show forest plot | 3 | 354 | Mean Difference (IV, Fixed, 95% CI) | 28.96 [20.86, 37.06] |
| 3.1 MDI | 1 | 23 | Mean Difference (IV, Fixed, 95% CI) | 8.3 [‐12.40, 29.00] |
| 3.2 1DPI | 2 | 331 | Mean Difference (IV, Fixed, 95% CI) | 32.69 [23.90, 41.49] |
| 4 Change in daily asthma symptom score compared to baseline Show forest plot | 4 | 685 | Std. Mean Difference (IV, Fixed, 95% CI) | ‐0.85 [‐1.01, ‐0.70] |
| 4.1 MDI | 0 | 0 | Std. Mean Difference (IV, Fixed, 95% CI) | 0.0 [0.0, 0.0] |
| 4.2 DPI | 4 | 685 | Std. Mean Difference (IV, Fixed, 95% CI) | ‐0.85 [‐1.01, ‐0.70] |
| 5 Change in night‐time wakening score Show forest plot | 2 | 351 | Std. Mean Difference (IV, Fixed, 95% CI) | ‐0.74 [‐0.96, ‐0.52] |
| 5.1 MDI | 0 | 0 | Std. Mean Difference (IV, Fixed, 95% CI) | 0.0 [0.0, 0.0] |
| 5.2 DPI | 2 | 351 | Std. Mean Difference (IV, Fixed, 95% CI) | ‐0.74 [‐0.96, ‐0.52] |
| 6 Change in daily use of beta2 agonist compared to baseline (puffs/d) Show forest plot | 4 | 682 | Mean Difference (IV, Fixed, 95% CI) | ‐2.22 [‐2.59, ‐1.84] |
| 6.1 MDI | 0 | 0 | Mean Difference (IV, Fixed, 95% CI) | 0.0 [0.0, 0.0] |
| 6.2 DPI | 4 | 682 | Mean Difference (IV, Fixed, 95% CI) | ‐2.22 [‐2.59, ‐1.84] |
| 9 Physician rated global efficacy: effective or very effective (No. of patients) Show forest plot | 3 | 480 | Peto Odds Ratio (Peto, Fixed, 95% CI) | 5.86 [4.09, 8.39] |
| 9.1 MDI | 1 | 147 | Peto Odds Ratio (Peto, Fixed, 95% CI) | 5.23 [2.74, 10.00] |
| 9.2 DPI | 2 | 333 | Peto Odds Ratio (Peto, Fixed, 95% CI) | 6.16 [4.00, 9.49] |
| 10 Withdrawal due to lack of treatment efficacy (No. of patients) Show forest plot | 4 | 676 | Peto Odds Ratio (Peto, Fixed, 95% CI) | 0.12 [0.09, 0.17] |
| 10.1 MDI | 1 | 147 | Peto Odds Ratio (Peto, Fixed, 95% CI) | 0.11 [0.06, 0.21] |
| 10.2 DPI | 3 | 529 | Peto Odds Ratio (Peto, Fixed, 95% CI) | 0.13 [0.09, 0.18] |
| 11 Sore throat or pharyngitis (No. of patients) Show forest plot | 4 | 670 | Peto Odds Ratio (Peto, Fixed, 95% CI) | 4.49 [1.11, 18.13] |
| 11.1 MDI | 1 | 147 | Peto Odds Ratio (Peto, Fixed, 95% CI) | 0.0 [0.0, 0.0] |
| 11.2 DPI | 3 | 523 | Peto Odds Ratio (Peto, Fixed, 95% CI) | 4.49 [1.11, 18.13] |
| 12 Hoarseness or dysphonia (No. of patients) Show forest plot | 4 | 670 | Peto Odds Ratio (Peto, Fixed, 95% CI) | 7.36 [2.65, 20.46] |
| 12.1 MDI | 1 | 147 | Peto Odds Ratio (Peto, Fixed, 95% CI) | 7.93 [0.81, 77.43] |
| 12.2 DPI | 3 | 523 | Peto Odds Ratio (Peto, Fixed, 95% CI) | 7.23 [2.30, 22.68] |
| 13 Oral Candidiasis (No. of patients) Show forest plot | 5 | 841 | Peto Odds Ratio (Peto, Fixed, 95% CI) | 6.37 [2.62, 15.48] |
| 13.1 MDI | 1 | 147 | Peto Odds Ratio (Peto, Fixed, 95% CI) | 7.93 [0.81, 77.43] |
| 13.2 DPI | 4 | 694 | Peto Odds Ratio (Peto, Fixed, 95% CI) | 6.12 [2.33, 16.07] |
| Outcome or subgroup title | No. of studies | No. of participants | Statistical method | Effect size |
| 1 Change in FEV1 compared to baseline (litres) Show forest plot | 6 | 872 | Mean Difference (IV, Fixed, 95% CI) | 0.44 [0.39, 0.50] |
| 1.1 Mild | 1 | 26 | Mean Difference (IV, Fixed, 95% CI) | 0.46 [0.29, 0.63] |
| 1.2 Mild to moderate | 0 | 0 | Mean Difference (IV, Fixed, 95% CI) | 0.0 [0.0, 0.0] |
| 1.3 Moderate | 5 | 846 | Mean Difference (IV, Fixed, 95% CI) | 0.44 [0.38, 0.50] |
| 2 Change in morning PEFR compared with baseline Show forest plot | 8 | 1116 | Litres/min (Fixed, 95% CI) | 40.44 [35.43, 45.45] |
| 2.1 Mild | 2 | 63 | Litres/min (Fixed, 95% CI) | 32.91 [12.00, 53.81] |
| 2.2 Mild to moderate | 0 | 0 | Litres/min (Fixed, 95% CI) | 0.0 [0.0, 0.0] |
| 2.3 Moderate | 6 | 1053 | Litres/min (Fixed, 95% CI) | 40.90 [35.74, 46.06] |
| 3 Change in evening PEF compared with baseline (L/min) Show forest plot | 3 | 354 | Mean Difference (IV, Fixed, 95% CI) | 28.96 [20.86, 37.06] |
| 3.1 Mild | 1 | 23 | Mean Difference (IV, Fixed, 95% CI) | 8.3 [‐12.40, 29.00] |
| 3.2 Mild to moderate | 0 | 0 | Mean Difference (IV, Fixed, 95% CI) | 0.0 [0.0, 0.0] |
| 3.3 Moderate | 2 | 331 | Mean Difference (IV, Fixed, 95% CI) | 32.69 [23.90, 41.49] |
| 4 Change in daily use of beta2 agonist compared to baseline (puffs/d) Show forest plot | 4 | 682 | Mean Difference (IV, Fixed, 95% CI) | ‐2.22 [‐2.59, ‐1.84] |
| 4.1 Mild | 0 | 0 | Mean Difference (IV, Fixed, 95% CI) | 0.0 [0.0, 0.0] |
| 4.2 Mild to moderate | 0 | 0 | Mean Difference (IV, Fixed, 95% CI) | 0.0 [0.0, 0.0] |
| 4.3 Moderate | 4 | 682 | Mean Difference (IV, Fixed, 95% CI) | ‐2.22 [‐2.59, ‐1.84] |
| 5 Change in night‐time wakening score Show forest plot | 2 | 351 | Std. Mean Difference (IV, Fixed, 95% CI) | ‐0.74 [‐0.96, ‐0.52] |
| 5.1 Mild | 0 | 0 | Std. Mean Difference (IV, Fixed, 95% CI) | 0.0 [0.0, 0.0] |
| 5.2 Mild to moderate | 0 | 0 | Std. Mean Difference (IV, Fixed, 95% CI) | 0.0 [0.0, 0.0] |
| 5.3 Moderate | 2 | 351 | Std. Mean Difference (IV, Fixed, 95% CI) | ‐0.74 [‐0.96, ‐0.52] |
| 6 Change in daily asthma symptom score compared to baseline Show forest plot | 4 | 685 | Std. Mean Difference (IV, Fixed, 95% CI) | ‐0.85 [‐1.01, ‐0.70] |
| 6.1 Mild | 0 | 0 | Std. Mean Difference (IV, Fixed, 95% CI) | 0.0 [0.0, 0.0] |
| 6.2 Mild to moderate | 0 | 0 | Std. Mean Difference (IV, Fixed, 95% CI) | 0.0 [0.0, 0.0] |
| 6.3 Moderate | 4 | 685 | Std. Mean Difference (IV, Fixed, 95% CI) | ‐0.85 [‐1.01, ‐0.70] |
| 7 Physician rated global efficacy: effective or very effective (No. of patients) Show forest plot | 3 | 480 | Peto Odds Ratio (Peto, Fixed, 95% CI) | 5.86 [4.09, 8.39] |
| 7.1 Mild | 0 | 0 | Peto Odds Ratio (Peto, Fixed, 95% CI) | 0.0 [0.0, 0.0] |
| 7.2 Mild to moderate | 0 | 0 | Peto Odds Ratio (Peto, Fixed, 95% CI) | 0.0 [0.0, 0.0] |
| 7.3 Moderate | 3 | 480 | Peto Odds Ratio (Peto, Fixed, 95% CI) | 5.86 [4.09, 8.39] |
| 8 Withdrawal due to lack of treatment efficacy (No. of patients) Show forest plot | 3 | 506 | Peto Odds Ratio (Peto, Fixed, 95% CI) | 0.12 [0.09, 0.18] |
| 8.1 Mild | 0 | 0 | Peto Odds Ratio (Peto, Fixed, 95% CI) | 0.0 [0.0, 0.0] |
| 8.2 Mild to moderate | 0 | 0 | Peto Odds Ratio (Peto, Fixed, 95% CI) | 0.0 [0.0, 0.0] |
| 8.3 Moderate | 3 | 506 | Peto Odds Ratio (Peto, Fixed, 95% CI) | 0.12 [0.09, 0.18] |
| 9 Sore throat or pharyngitis (No. of patients) Show forest plot | 4 | 670 | Peto Odds Ratio (Peto, Fixed, 95% CI) | 4.49 [1.11, 18.13] |
| 9.1 Mild | 0 | 0 | Peto Odds Ratio (Peto, Fixed, 95% CI) | 0.0 [0.0, 0.0] |
| 9.2 Mild to moderate | 0 | 0 | Peto Odds Ratio (Peto, Fixed, 95% CI) | 0.0 [0.0, 0.0] |
| 9.3 Moderate | 4 | 670 | Peto Odds Ratio (Peto, Fixed, 95% CI) | 4.49 [1.11, 18.13] |
| 10 Hoarseness or dysphonia (No. of patients) Show forest plot | 4 | 670 | Peto Odds Ratio (Peto, Fixed, 95% CI) | 7.36 [2.65, 20.46] |
| 10.1 Mild | 0 | 0 | Peto Odds Ratio (Peto, Fixed, 95% CI) | 0.0 [0.0, 0.0] |
| 10.2 Mild to moderate | 0 | 0 | Peto Odds Ratio (Peto, Fixed, 95% CI) | 0.0 [0.0, 0.0] |
| 10.3 Moderate | 4 | 670 | Peto Odds Ratio (Peto, Fixed, 95% CI) | 7.36 [2.65, 20.46] |
| 11 Oral Candidiasis (No. of patients) Show forest plot | 5 | 841 | Peto Odds Ratio (Peto, Fixed, 95% CI) | 6.37 [2.62, 15.48] |
| 11.1 Mild | 0 | 0 | Peto Odds Ratio (Peto, Fixed, 95% CI) | 0.0 [0.0, 0.0] |
| 11.2 Mild to moderate | 0 | 0 | Peto Odds Ratio (Peto, Fixed, 95% CI) | 0.0 [0.0, 0.0] |
| 11.3 Moderate | 5 | 841 | Peto Odds Ratio (Peto, Fixed, 95% CI) | 6.37 [2.62, 15.48] |
| Outcome or subgroup title | No. of studies | No. of participants | Statistical method | Effect size |
| 1 FEV1 (litres) Show forest plot | 3 | 73 | Mean Difference (IV, Fixed, 95% CI) | 0.13 [‐0.22, 0.48] |
| 1.1 Children | 0 | 0 | Mean Difference (IV, Fixed, 95% CI) | 0.0 [0.0, 0.0] |
| 1.2 Adults | 3 | 73 | Mean Difference (IV, Fixed, 95% CI) | 0.13 [‐0.22, 0.48] |
| 2 Change in FEV1 compared to baseline (litres) Show forest plot | 3 | 414 | Mean Difference (IV, Fixed, 95% CI) | 0.53 [0.43, 0.63] |
| 2.1 Children | 0 | 0 | Mean Difference (IV, Fixed, 95% CI) | 0.0 [0.0, 0.0] |
| 2.2 Adults | 3 | 414 | Mean Difference (IV, Fixed, 95% CI) | 0.53 [0.43, 0.63] |
| 3 Change in FVC compared to baseline (litres) Show forest plot | 1 | Mean Difference (IV, Fixed, 95% CI) | Totals not selected | |
| 3.1 Children | 0 | Mean Difference (IV, Fixed, 95% CI) | 0.0 [0.0, 0.0] | |
| 3.2 Adults | 1 | Mean Difference (IV, Fixed, 95% CI) | 0.0 [0.0, 0.0] | |
| 4 Change in FEF25‐75 compared to baseline (L/second) Show forest plot | 1 | Mean Difference (IV, Fixed, 95% CI) | Totals not selected | |
| 4.1 Children | 0 | Mean Difference (IV, Fixed, 95% CI) | 0.0 [0.0, 0.0] | |
| 4.2 Adults | 1 | Mean Difference (IV, Fixed, 95% CI) | 0.0 [0.0, 0.0] | |
| 5 Change in morning PEFR compared to baseline (L/min) Show forest plot | 4 | 624 | Mean Difference (IV, Fixed, 95% CI) | 46.85 [39.64, 54.07] |
| 5.1 Children | 0 | 0 | Mean Difference (IV, Fixed, 95% CI) | 0.0 [0.0, 0.0] |
| 5.2 Adults | 4 | 624 | Mean Difference (IV, Fixed, 95% CI) | 46.85 [39.64, 54.07] |
| 6 Change in evening PEFR compared to baseline (L/min) Show forest plot | 2 | 278 | Mean Difference (IV, Fixed, 95% CI) | 41.12 [31.36, 50.87] |
| 6.1 Children | 0 | 0 | Mean Difference (IV, Fixed, 95% CI) | 0.0 [0.0, 0.0] |
| 6.2 Adults | 2 | 278 | Mean Difference (IV, Fixed, 95% CI) | 41.12 [31.36, 50.87] |
| 7 Change in daily asthma symptom score compared to baseline Show forest plot | 3 | 412 | Std. Mean Difference (IV, Fixed, 95% CI) | ‐0.65 [‐0.85, ‐0.46] |
| 7.1 Children | 0 | 0 | Std. Mean Difference (IV, Fixed, 95% CI) | 0.0 [0.0, 0.0] |
| 7.2 Adults | 3 | 412 | Std. Mean Difference (IV, Fixed, 95% CI) | ‐0.65 [‐0.85, ‐0.46] |
| 8 Change in number of night‐time awakenings per week compared to baseline Show forest plot | 2 | 277 | Mean Difference (IV, Fixed, 95% CI) | ‐0.18 [‐0.25, ‐0.11] |
| 8.1 Children | 0 | 0 | Mean Difference (IV, Fixed, 95% CI) | 0.0 [0.0, 0.0] |
| 8.2 Adults | 2 | 277 | Mean Difference (IV, Fixed, 95% CI) | ‐0.18 [‐0.25, ‐0.11] |
| 9 Change in daily use of beta2 agonist compared to baseline (puffs/d) Show forest plot | 3 | 409 | Mean Difference (IV, Fixed, 95% CI) | ‐1.37 [‐1.79, ‐0.96] |
| 9.1 Children | 0 | 0 | Mean Difference (IV, Fixed, 95% CI) | 0.0 [0.0, 0.0] |
| 9.2 Adults | 3 | 409 | Mean Difference (IV, Fixed, 95% CI) | ‐1.37 [‐1.79, ‐0.96] |
| 10 Methacholine BHR (log base 2 PC20 FEV1 mg/ml) Show forest plot | 1 | Mean Difference (IV, Fixed, 95% CI) | Totals not selected | |
| 10.1 Children | 0 | Mean Difference (IV, Fixed, 95% CI) | 0.0 [0.0, 0.0] | |
| 10.2 Adults | 1 | Mean Difference (IV, Fixed, 95% CI) | 0.0 [0.0, 0.0] | |
| 11 Physician‐rated efficacy: effective or very effective (No. of patients) Show forest plot | 2 | 311 | Peto Odds Ratio (Peto, Fixed, 95% CI) | 9.62 [6.18, 14.99] |
| 11.1 Children | 0 | 0 | Peto Odds Ratio (Peto, Fixed, 95% CI) | 0.0 [0.0, 0.0] |
| 11.2 Adults | 2 | 311 | Peto Odds Ratio (Peto, Fixed, 95% CI) | 9.62 [6.18, 14.99] |
| 12 Morning plasma cortisol (mcg/dL) Show forest plot | 1 | Mean Difference (IV, Fixed, 95% CI) | Totals not selected | |
| 12.1 Children | 0 | Mean Difference (IV, Fixed, 95% CI) | 0.0 [0.0, 0.0] | |
| 12.2 Adults | 1 | Mean Difference (IV, Fixed, 95% CI) | 0.0 [0.0, 0.0] | |
| 13 Change in morning plasma cortisol compared to baseline (mcg/dL) Show forest plot | 1 | Mean Difference (IV, Fixed, 95% CI) | Totals not selected | |
| 13.1 Children | 0 | Mean Difference (IV, Fixed, 95% CI) | 0.0 [0.0, 0.0] | |
| 13.2 Adults | 1 | Mean Difference (IV, Fixed, 95% CI) | 0.0 [0.0, 0.0] | |
| 14 8 hour area under curve (AUC) plasma cortisol during 6 hour 250 mcg co‐syntropin infusion (mcg hour/dL) Show forest plot | 1 | Mean Difference (IV, Fixed, 95% CI) | Totals not selected | |
| 14.1 Children | 0 | Mean Difference (IV, Fixed, 95% CI) | 0.0 [0.0, 0.0] | |
| 14.2 Adults | 1 | Mean Difference (IV, Fixed, 95% CI) | 0.0 [0.0, 0.0] | |
| 15 Peak plasma cortisol during during 6 hour 250 mcg co‐syntropin infusion (mcg/dL) Show forest plot | 1 | Mean Difference (IV, Fixed, 95% CI) | Totals not selected | |
| 15.1 Children | 0 | Mean Difference (IV, Fixed, 95% CI) | 0.0 [0.0, 0.0] | |
| 15.2 Adults | 1 | Mean Difference (IV, Fixed, 95% CI) | 0.0 [0.0, 0.0] | |
| 16 Withdrawal due to clinical asthma exacerbation (No. of patients) Show forest plot | 1 | Peto Odds Ratio (Peto, Fixed, 95% CI) | Totals not selected | |
| 16.1 Children | 0 | Peto Odds Ratio (Peto, Fixed, 95% CI) | 0.0 [0.0, 0.0] | |
| 16.2 Adults | 1 | Peto Odds Ratio (Peto, Fixed, 95% CI) | 0.0 [0.0, 0.0] | |
| 17 Withdrawal due to lack of treatment efficacy (No. of patients) Show forest plot | 5 | 671 | Peto Odds Ratio (Peto, Fixed, 95% CI) | 0.11 [0.08, 0.15] |
| 17.1 Children | 0 | 0 | Peto Odds Ratio (Peto, Fixed, 95% CI) | 0.0 [0.0, 0.0] |
| 17.2 Adults | 5 | 671 | Peto Odds Ratio (Peto, Fixed, 95% CI) | 0.11 [0.08, 0.15] |
| 18 Sore throat or pharyngitis (No. of patients) Show forest plot | 4 | 524 | Peto Odds Ratio (Peto, Fixed, 95% CI) | 4.95 [1.83, 13.43] |
| 18.1 Children | 0 | 0 | Peto Odds Ratio (Peto, Fixed, 95% CI) | 0.0 [0.0, 0.0] |
| 18.2 Adults | 4 | 524 | Peto Odds Ratio (Peto, Fixed, 95% CI) | 4.95 [1.83, 13.43] |
| 19 Hoarseness or dysphonia (No. of patients) Show forest plot | 6 | 770 | Peto Odds Ratio (Peto, Fixed, 95% CI) | 7.99 [3.54, 18.01] |
| 19.1 Children | 0 | 0 | Peto Odds Ratio (Peto, Fixed, 95% CI) | 0.0 [0.0, 0.0] |
| 19.2 Adults | 6 | 770 | Peto Odds Ratio (Peto, Fixed, 95% CI) | 7.99 [3.54, 18.01] |
| 20 Oral Candidiasis (No. of patients) Show forest plot | 6 | 770 | Peto Odds Ratio (Peto, Fixed, 95% CI) | 4.77 [2.32, 9.80] |
| 20.1 Children | 0 | 0 | Peto Odds Ratio (Peto, Fixed, 95% CI) | 0.0 [0.0, 0.0] |
| 20.2 Adults | 6 | 770 | Peto Odds Ratio (Peto, Fixed, 95% CI) | 4.77 [2.32, 9.80] |
| 21 HRQOL: AQLQ Show forest plot | 1 | Mean Difference (IV, Fixed, 95% CI) | Totals not selected | |
| 21.1 Children | 0 | Mean Difference (IV, Fixed, 95% CI) | 0.0 [0.0, 0.0] | |
| 21.2 Adults | 1 | Mean Difference (IV, Fixed, 95% CI) | 0.0 [0.0, 0.0] | |
| 22 Log PD20 mg Show forest plot | 1 | Mean Difference (IV, Fixed, 95% CI) | Totals not selected | |
| 22.1 Children | 0 | Mean Difference (IV, Fixed, 95% CI) | 0.0 [0.0, 0.0] | |
| 22.2 Adults | 1 | Mean Difference (IV, Fixed, 95% CI) | 0.0 [0.0, 0.0] | |
| 23 FVC (absolute values ‐ Litres) Show forest plot | 1 | Mean Difference (IV, Fixed, 95% CI) | Totals not selected | |
| 23.1 Children | 0 | Mean Difference (IV, Fixed, 95% CI) | 0.0 [0.0, 0.0] | |
| 23.2 Adults | 1 | Mean Difference (IV, Fixed, 95% CI) | 0.0 [0.0, 0.0] | |
| 24 Withdrawals (any reason) Show forest plot | 2 | 130 | Odds Ratio (M‐H, Fixed, 95% CI) | 1.91 [0.91, 4.00] |
| 24.1 Children | 0 | 0 | Odds Ratio (M‐H, Fixed, 95% CI) | 0.0 [0.0, 0.0] |
| 24.2 Adults | 2 | 130 | Odds Ratio (M‐H, Fixed, 95% CI) | 1.91 [0.91, 4.00] |
| Outcome or subgroup title | No. of studies | No. of participants | Statistical method | Effect size |
| 1 FEV1 (litres) Show forest plot | 3 | 73 | Mean Difference (IV, Fixed, 95% CI) | 0.13 [‐0.22, 0.48] |
| 1.1 1‐4 weeks | 2 | 42 | Mean Difference (IV, Fixed, 95% CI) | ‐0.12 [‐0.54, 0.30] |
| 1.2 1‐5 months | 1 | 31 | Mean Difference (IV, Fixed, 95% CI) | 0.66 [0.04, 1.28] |
| 1.3 6 months or longer | 0 | 0 | Mean Difference (IV, Fixed, 95% CI) | 0.0 [0.0, 0.0] |
| 2 Change in FEV1 compared to baseline (litres) Show forest plot | 3 | 414 | Mean Difference (IV, Fixed, 95% CI) | 0.53 [0.43, 0.63] |
| 2.1 1‐4 weeks | 0 | 0 | Mean Difference (IV, Fixed, 95% CI) | 0.0 [0.0, 0.0] |
| 2.2 1‐5 months | 3 | 414 | Mean Difference (IV, Fixed, 95% CI) | 0.53 [0.43, 0.63] |
| 2.3 6 months or longer | 0 | 0 | Mean Difference (IV, Fixed, 95% CI) | 0.0 [0.0, 0.0] |
| 5 Change in morning PEFR compared to baseline (L/min) Show forest plot | 4 | 624 | Mean Difference (IV, Fixed, 95% CI) | 46.85 [39.64, 54.07] |
| 5.1 1‐4 weeks | 0 | 0 | Mean Difference (IV, Fixed, 95% CI) | 0.0 [0.0, 0.0] |
| 5.2 1‐5 months | 4 | 624 | Mean Difference (IV, Fixed, 95% CI) | 46.85 [39.64, 54.07] |
| 5.3 6 months or longer | 0 | 0 | Mean Difference (IV, Fixed, 95% CI) | 0.0 [0.0, 0.0] |
| 6 Change in evening PEFR compared to baseline (L/min) Show forest plot | 2 | 278 | Mean Difference (IV, Fixed, 95% CI) | 41.12 [31.36, 50.87] |
| 6.1 1‐4 weeks | 0 | 0 | Mean Difference (IV, Fixed, 95% CI) | 0.0 [0.0, 0.0] |
| 6.2 1‐5 months | 2 | 278 | Mean Difference (IV, Fixed, 95% CI) | 41.12 [31.36, 50.87] |
| 6.3 6 months or longer | 0 | 0 | Mean Difference (IV, Fixed, 95% CI) | 0.0 [0.0, 0.0] |
| 7 Change in daily asthma symptom score compared to baseline Show forest plot | 3 | 412 | Std. Mean Difference (IV, Fixed, 95% CI) | ‐0.65 [‐0.85, ‐0.46] |
| 7.1 1‐4 weeks | 0 | 0 | Std. Mean Difference (IV, Fixed, 95% CI) | 0.0 [0.0, 0.0] |
| 7.2 1‐5 months | 3 | 412 | Std. Mean Difference (IV, Fixed, 95% CI) | ‐0.65 [‐0.85, ‐0.46] |
| 7.3 6 months or longer | 0 | 0 | Std. Mean Difference (IV, Fixed, 95% CI) | 0.0 [0.0, 0.0] |
| 8 Change in number of night‐time awakening per week compared to baseline score Show forest plot | 2 | 277 | Std. Mean Difference (IV, Fixed, 95% CI) | ‐0.60 [‐0.85, ‐0.36] |
| 8.1 1‐4 weeks | 0 | 0 | Std. Mean Difference (IV, Fixed, 95% CI) | 0.0 [0.0, 0.0] |
| 8.2 1‐5 months | 2 | 277 | Std. Mean Difference (IV, Fixed, 95% CI) | ‐0.60 [‐0.85, ‐0.36] |
| 8.3 6 months or longer | 0 | 0 | Std. Mean Difference (IV, Fixed, 95% CI) | 0.0 [0.0, 0.0] |
| 9 Change in daily use of beta2 agonist compared to baseline (puffs/d) Show forest plot | 3 | 409 | Mean Difference (IV, Fixed, 95% CI) | ‐1.37 [‐1.79, ‐0.96] |
| 9.1 1‐4 weeks | 0 | 0 | Mean Difference (IV, Fixed, 95% CI) | 0.0 [0.0, 0.0] |
| 9.2 1‐5 months | 3 | 409 | Mean Difference (IV, Fixed, 95% CI) | ‐1.37 [‐1.79, ‐0.96] |
| 9.3 6 months or longer | 0 | 0 | Mean Difference (IV, Fixed, 95% CI) | 0.0 [0.0, 0.0] |
| 11 Physician‐rated efficacy: effective or very effective (No. of patients) Show forest plot | 2 | 311 | Peto Odds Ratio (Peto, Fixed, 95% CI) | 9.62 [6.18, 14.99] |
| 11.1 1‐4 weeks | 0 | 0 | Peto Odds Ratio (Peto, Fixed, 95% CI) | 0.0 [0.0, 0.0] |
| 11.2 1‐5 months | 2 | 311 | Peto Odds Ratio (Peto, Fixed, 95% CI) | 9.62 [6.18, 14.99] |
| 11.3 6 months or longer | 0 | 0 | Peto Odds Ratio (Peto, Fixed, 95% CI) | 0.0 [0.0, 0.0] |
| 17 Withdrawal due to lack of treatment efficacy (No.of patients) Show forest plot | 4 | 566 | Peto Odds Ratio (Peto, Fixed, 95% CI) | 0.11 [0.07, 0.15] |
| 17.1 1‐4 weeks | 0 | 0 | Peto Odds Ratio (Peto, Fixed, 95% CI) | 0.0 [0.0, 0.0] |
| 17.2 1‐5 months | 4 | 566 | Peto Odds Ratio (Peto, Fixed, 95% CI) | 0.11 [0.07, 0.15] |
| 17.3 6 months or longer | 0 | 0 | Peto Odds Ratio (Peto, Fixed, 95% CI) | 0.0 [0.0, 0.0] |
| 18 Sore throat or pharyngitis (No. of patients) Show forest plot | 3 | 419 | Peto Odds Ratio (Peto, Fixed, 95% CI) | 5.65 [1.70, 18.79] |
| 18.1 1‐4 weeks | 0 | 0 | Peto Odds Ratio (Peto, Fixed, 95% CI) | 0.0 [0.0, 0.0] |
| 18.2 1‐5 months | 3 | 419 | Peto Odds Ratio (Peto, Fixed, 95% CI) | 5.65 [1.70, 18.79] |
| 18.3 6 months or longer | 0 | 0 | Peto Odds Ratio (Peto, Fixed, 95% CI) | 0.0 [0.0, 0.0] |
| 19 Hoarseness or dysphonia (No. of patients) Show forest plot | 5 | 665 | Peto Odds Ratio (Peto, Fixed, 95% CI) | 7.92 [3.25, 19.30] |
| 19.1 1‐4 weeks | 0 | 0 | Peto Odds Ratio (Peto, Fixed, 95% CI) | 0.0 [0.0, 0.0] |
| 19.2 1‐5 months | 5 | 665 | Peto Odds Ratio (Peto, Fixed, 95% CI) | 7.92 [3.25, 19.30] |
| 19.3 6 months or longer | 0 | 0 | Peto Odds Ratio (Peto, Fixed, 95% CI) | 0.0 [0.0, 0.0] |
| 20 Oral Candidiasis (No. of patients) Show forest plot | 6 | 770 | Peto Odds Ratio (Peto, Fixed, 95% CI) | 4.77 [2.32, 9.80] |
| 20.1 1‐4 weeks | 0 | 0 | Peto Odds Ratio (Peto, Fixed, 95% CI) | 0.0 [0.0, 0.0] |
| 20.2 1‐5 months | 5 | 665 | Peto Odds Ratio (Peto, Fixed, 95% CI) | 3.99 [1.76, 9.03] |
| 20.3 6 months or longer | 1 | 105 | Peto Odds Ratio (Peto, Fixed, 95% CI) | 8.89 [1.93, 40.93] |
| Outcome or subgroup title | No. of studies | No. of participants | Statistical method | Effect size |
| 1 FEV1 (litres) Show forest plot | 3 | 73 | Mean Difference (IV, Fixed, 95% CI) | 0.13 [‐0.22, 0.48] |
| 1.1 1‐4 weeks | 2 | 42 | Mean Difference (IV, Fixed, 95% CI) | ‐0.12 [‐0.54, 0.30] |
| 1.3 MDI | 0 | 0 | Mean Difference (IV, Fixed, 95% CI) | 0.0 [0.0, 0.0] |
| 1.4 DPI | 1 | 31 | Mean Difference (IV, Fixed, 95% CI) | 0.66 [0.04, 1.28] |
| 2 Change in FEV1 compared to baseline (litres) Show forest plot | 3 | 414 | Mean Difference (IV, Fixed, 95% CI) | 0.53 [0.43, 0.63] |
| 2.1 MDI | 1 | 159 | Mean Difference (IV, Fixed, 95% CI) | 0.52 [0.38, 0.66] |
| 2.2 DPI | 2 | 255 | Mean Difference (IV, Fixed, 95% CI) | 0.53 [0.40, 0.67] |
| 5 Change in morning PEFR compared to baseline (L/min) Show forest plot | 3 | 422 | Mean Difference (IV, Fixed, 95% CI) | 49.38 [40.83, 57.93] |
| 5.1 MDI | 1 | 169 | Mean Difference (IV, Fixed, 95% CI) | 58.0 [43.82, 72.18] |
| 5.2 DPI | 2 | 253 | Mean Difference (IV, Fixed, 95% CI) | 44.46 [33.75, 55.17] |
| 6 Change in evening PEFR compared to baseline (L/min) Show forest plot | 2 | 278 | Mean Difference (IV, Fixed, 95% CI) | 41.12 [31.36, 50.87] |
| 6.1 MDI | 1 | 159 | Mean Difference (IV, Fixed, 95% CI) | 48.0 [35.35, 60.65] |
| 6.2 DPI | 1 | 119 | Mean Difference (IV, Fixed, 95% CI) | 31.0 [15.67, 46.33] |
| 7 Change in daily asthma symptom score compared to baseline Show forest plot | 3 | 412 | Std. Mean Difference (IV, Fixed, 95% CI) | ‐0.65 [‐0.85, ‐0.46] |
| 7.1 MDI | 1 | 159 | Std. Mean Difference (IV, Fixed, 95% CI) | ‐0.76 [‐1.08, ‐0.44] |
| 7.2 DPI | 2 | 253 | Std. Mean Difference (IV, Fixed, 95% CI) | ‐0.59 [‐0.84, ‐0.34] |
| 8 Change in night‐time awakening per week compared to baseline Show forest plot | 2 | 277 | Std. Mean Difference (IV, Fixed, 95% CI) | ‐0.60 [‐0.85, ‐0.36] |
| 8.1 MDI | 1 | 159 | Std. Mean Difference (IV, Fixed, 95% CI) | ‐0.73 [‐1.06, ‐0.41] |
| 8.2 DPI | 1 | 118 | Std. Mean Difference (IV, Fixed, 95% CI) | ‐0.43 [‐0.80, ‐0.07] |
| 9 Change in daily use of beta2 agonist compared to baseline (puffs/d) Show forest plot | 3 | 409 | Mean Difference (IV, Fixed, 95% CI) | ‐1.37 [‐1.79, ‐0.96] |
| 9.1 MDI | 1 | 159 | Mean Difference (IV, Fixed, 95% CI) | ‐0.96 [‐1.48, ‐0.44] |
| 9.2 DPI | 2 | 250 | Mean Difference (IV, Fixed, 95% CI) | ‐2.06 [‐2.74, ‐1.39] |
| 11 Physician‐rated efficacy: effective or very effective (No. of patients) Show forest plot | 2 | 311 | Peto Odds Ratio (Peto, Fixed, 95% CI) | 9.62 [6.18, 14.99] |
| 11.1 MDI | 2 | 311 | Peto Odds Ratio (Peto, Fixed, 95% CI) | 9.62 [6.18, 14.99] |
| 11.2 DPI | 0 | 0 | Peto Odds Ratio (Peto, Fixed, 95% CI) | 0.0 [0.0, 0.0] |
| 17 Withdrawal due to lack of treatment efficacy (No. of patients) Show forest plot | 4 | 566 | Peto Odds Ratio (Peto, Fixed, 95% CI) | 0.11 [0.07, 0.15] |
| 17.1 MDI | 2 | 311 | Peto Odds Ratio (Peto, Fixed, 95% CI) | 0.08 [0.05, 0.13] |
| 17.2 DPI | 2 | 255 | Peto Odds Ratio (Peto, Fixed, 95% CI) | 0.16 [0.09, 0.28] |
| 18 Sore throat or pharyngitis (No. of patients) Show forest plot | 3 | 419 | Peto Odds Ratio (Peto, Fixed, 95% CI) | 5.65 [1.70, 18.79] |
| 18.1 MDI | 1 | 152 | Peto Odds Ratio (Peto, Fixed, 95% CI) | 7.29 [0.45, 117.74] |
| 18.2 DPI | 2 | 267 | Peto Odds Ratio (Peto, Fixed, 95% CI) | 5.33 [1.41, 20.20] |
| 19 Hoarseness or dysphonia (No. of patients) Show forest plot | 5 | 665 | Peto Odds Ratio (Peto, Fixed, 95% CI) | 7.92 [3.25, 19.30] |
| 19.1 MDI | 3 | 398 | Peto Odds Ratio (Peto, Fixed, 95% CI) | 8.06 [2.87, 22.61] |
| 19.2 DPI | 2 | 267 | Peto Odds Ratio (Peto, Fixed, 95% CI) | 7.53 [1.29, 43.98] |
| 20 Oral Candidiasis (No. of patients) Show forest plot | 6 | 770 | Peto Odds Ratio (Peto, Fixed, 95% CI) | 4.77 [2.32, 9.80] |
| 20.1 MDI | 4 | 503 | Peto Odds Ratio (Peto, Fixed, 95% CI) | 8.28 [3.14, 21.84] |
| 20.2 DPI | 2 | 267 | Peto Odds Ratio (Peto, Fixed, 95% CI) | 2.41 [0.82, 7.08] |
| Outcome or subgroup title | No. of studies | No. of participants | Statistical method | Effect size |
| 1 FEV1 (litres) Show forest plot | 3 | 73 | Mean Difference (IV, Fixed, 95% CI) | 0.13 [‐0.22, 0.48] |
| 1.1 Mild | 3 | 73 | Mean Difference (IV, Fixed, 95% CI) | 0.13 [‐0.22, 0.48] |
| 1.2 Mild to moderate | 0 | 0 | Mean Difference (IV, Fixed, 95% CI) | 0.0 [0.0, 0.0] |
| 1.3 Moderate | 0 | 0 | Mean Difference (IV, Fixed, 95% CI) | 0.0 [0.0, 0.0] |
| 2 Change in FEV1 compared to baseline (litres) Show forest plot | 3 | 414 | Mean Difference (IV, Fixed, 95% CI) | 0.53 [0.43, 0.63] |
| 2.1 Mild | 0 | 0 | Mean Difference (IV, Fixed, 95% CI) | 0.0 [0.0, 0.0] |
| 2.2 Mild to moderate | 2 | 281 | Mean Difference (IV, Fixed, 95% CI) | 0.50 [0.39, 0.61] |
| 2.3 Moderate | 1 | 133 | Mean Difference (IV, Fixed, 95% CI) | 0.61 [0.41, 0.81] |
| 5 Change in morning PEFR compared to baseline (L/min) Show forest plot | 3 | 422 | Mean Difference (IV, Fixed, 95% CI) | 49.38 [40.83, 57.93] |
| 5.1 Mild | 0 | 0 | Mean Difference (IV, Fixed, 95% CI) | 0.0 [0.0, 0.0] |
| 5.2 Mild to moderate | 2 | 289 | Mean Difference (IV, Fixed, 95% CI) | 59.25 [48.43, 70.07] |
| 5.3 Moderate | 1 | 133 | Mean Difference (IV, Fixed, 95% CI) | 33.0 [19.06, 46.94] |
| 6 Change in evening PEFR compared to baseline (L/min) Show forest plot | 2 | 278 | Mean Difference (IV, Fixed, 95% CI) | 41.12 [31.36, 50.87] |
| 6.1 Mild | 0 | 0 | Mean Difference (IV, Fixed, 95% CI) | 0.0 [0.0, 0.0] |
| 6.2 Mild to moderate | 2 | 278 | Mean Difference (IV, Fixed, 95% CI) | 41.12 [31.36, 50.87] |
| 6.3 Moderate | 0 | 0 | Mean Difference (IV, Fixed, 95% CI) | 0.0 [0.0, 0.0] |
| 7 Change in daily asthma symptom score compared to baseline Show forest plot | 3 | 412 | Std. Mean Difference (IV, Fixed, 95% CI) | ‐0.65 [‐0.85, ‐0.46] |
| 7.1 Mild | 0 | 0 | Std. Mean Difference (IV, Fixed, 95% CI) | 0.0 [0.0, 0.0] |
| 7.2 Mild to moderate | 2 | 279 | Std. Mean Difference (IV, Fixed, 95% CI) | ‐0.70 [‐0.94, ‐0.46] |
| 7.3 Moderate | 1 | 133 | Std. Mean Difference (IV, Fixed, 95% CI) | ‐0.57 [‐0.91, ‐0.22] |
| 8 Change in night‐time wakening score Show forest plot | 2 | 277 | Std. Mean Difference (IV, Fixed, 95% CI) | ‐0.60 [‐0.85, ‐0.36] |
| 8.1 Mild | 0 | 0 | Std. Mean Difference (IV, Fixed, 95% CI) | 0.0 [0.0, 0.0] |
| 8.2 Mild to moderate | 2 | 277 | Std. Mean Difference (IV, Fixed, 95% CI) | ‐0.60 [‐0.85, ‐0.36] |
| 8.3 Moderate | 0 | 0 | Std. Mean Difference (IV, Fixed, 95% CI) | 0.0 [0.0, 0.0] |
| 9 Change in daily use of beta2 agonist compared to baseline (puffs/d) Show forest plot | 3 | 409 | Mean Difference (IV, Fixed, 95% CI) | ‐1.37 [‐1.79, ‐0.96] |
| 9.1 Mild | 0 | 0 | Mean Difference (IV, Fixed, 95% CI) | 0.0 [0.0, 0.0] |
| 9.2 Mild to moderate | 2 | 276 | Mean Difference (IV, Fixed, 95% CI) | ‐1.28 [‐1.74, ‐0.83] |
| 9.3 Moderate | 1 | 133 | Mean Difference (IV, Fixed, 95% CI) | ‐1.8 [‐2.78, ‐0.82] |
| 11 Physician‐rated efficacy: effective or very effective (No. of patients) Show forest plot | 2 | 311 | Peto Odds Ratio (Peto, Fixed, 95% CI) | 9.62 [6.18, 14.99] |
| 11.1 Mild | 0 | 0 | Peto Odds Ratio (Peto, Fixed, 95% CI) | 0.0 [0.0, 0.0] |
| 11.2 Mild to moderate | 1 | 159 | Peto Odds Ratio (Peto, Fixed, 95% CI) | 14.53 [7.82, 27.01] |
| 11.3 Moderate | 1 | 152 | Peto Odds Ratio (Peto, Fixed, 95% CI) | 6.25 [3.32, 11.79] |
| 17 Withdrawal due to lack of treatment efficacy (No.of patients) Show forest plot | 4 | 566 | Peto Odds Ratio (Peto, Fixed, 95% CI) | 0.11 [0.07, 0.15] |
| 17.1 Mild | 0 | 0 | Peto Odds Ratio (Peto, Fixed, 95% CI) | 0.0 [0.0, 0.0] |
| 17.2 Mild to moderate | 2 | 281 | Peto Odds Ratio (Peto, Fixed, 95% CI) | 0.10 [0.06, 0.16] |
| 17.3 Moderate | 2 | 285 | Peto Odds Ratio (Peto, Fixed, 95% CI) | 0.11 [0.07, 0.19] |
| 18 Sore throat or pharyngitis (No. of patients) Show forest plot | 3 | 419 | Peto Odds Ratio (Peto, Fixed, 95% CI) | 5.65 [1.70, 18.79] |
| 18.1 Mild | 0 | 0 | Peto Odds Ratio (Peto, Fixed, 95% CI) | 0.0 [0.0, 0.0] |
| 18.2 Mild to moderate | 1 | 134 | Peto Odds Ratio (Peto, Fixed, 95% CI) | 4.92 [1.08, 22.44] |
| 18.3 Moderate | 2 | 285 | Peto Odds Ratio (Peto, Fixed, 95% CI) | 7.13 [1.00, 51.03] |
| 19 Hoarseness or dysphonia (No. of patients) Show forest plot | 5 | 665 | Peto Odds Ratio (Peto, Fixed, 95% CI) | 7.92 [3.25, 19.30] |
| 19.1 Mild | 1 | 82 | Peto Odds Ratio (Peto, Fixed, 95% CI) | 7.77 [0.79, 76.88] |
| 19.2 Mild to moderate | 2 | 298 | Peto Odds Ratio (Peto, Fixed, 95% CI) | 8.38 [2.50, 28.02] |
| 19.3 Moderate | 2 | 285 | Peto Odds Ratio (Peto, Fixed, 95% CI) | 7.23 [1.44, 36.28] |
| 20 Oral Candidiasis (No. of patients) Show forest plot | 6 | 770 | Peto Odds Ratio (Peto, Fixed, 95% CI) | 4.77 [2.32, 9.80] |
| 20.1 Mild | 2 | 187 | Peto Odds Ratio (Peto, Fixed, 95% CI) | 8.53 [2.39, 30.39] |
| 20.2 Mild to moderate | 2 | 298 | Peto Odds Ratio (Peto, Fixed, 95% CI) | 3.62 [1.03, 12.74] |
| 20.3 Moderate | 2 | 285 | Peto Odds Ratio (Peto, Fixed, 95% CI) | 3.61 [1.06, 12.23] |
| Outcome or subgroup title | No. of studies | No. of participants | Statistical method | Effect size |
| 1 PD20 ‐ change from baseline Show forest plot | 1 | Mean Difference (IV, Fixed, 95% CI) | Totals not selected | |
| 1.1 Children | 0 | Mean Difference (IV, Fixed, 95% CI) | 0.0 [0.0, 0.0] | |
| 1.2 Adults | 1 | Mean Difference (IV, Fixed, 95% CI) | 0.0 [0.0, 0.0] | |
| Outcome or subgroup title | No. of studies | No. of participants | Statistical method | Effect size |
| 1 FEV1 (% predicted ‐ absolute values) Show forest plot | 1 | % (Fixed, 95% CI) | Totals not selected | |
| 1.1 Children | 0 | % (Fixed, 95% CI) | 0.0 [0.0, 0.0] | |
| 1.2 Adults | 1 | % (Fixed, 95% CI) | 0.0 [0.0, 0.0] | |
| 2 PEF (% predicted ‐ absolute values) Show forest plot | 1 | % (Fixed, 95% CI) | Totals not selected | |
| 2.1 Children | 0 | % (Fixed, 95% CI) | 0.0 [0.0, 0.0] | |
| 2.2 Adults | 1 | % (Fixed, 95% CI) | 0.0 [0.0, 0.0] | |
| 3 Quality of life (absolute scores ‐ AQLQ) Show forest plot | 1 | QoL (Fixed, 95% CI) | Totals not selected | |
| 3.1 Children | 0 | QoL (Fixed, 95% CI) | 0.0 [0.0, 0.0] | |
| 3.2 Adults | 1 | QoL (Fixed, 95% CI) | 0.0 [0.0, 0.0] | |
| 4 Symptoms Show forest plot | 1 | Symptom score (Fixed, 95% CI) | Totals not selected | |
| 4.1 Children | 0 | Symptom score (Fixed, 95% CI) | 0.0 [0.0, 0.0] | |
| 4.2 Adults | 1 | Symptom score (Fixed, 95% CI) | 0.0 [0.0, 0.0] | |
| 6 Rescue medication usage (unclear time frame ‐ absolute values) Show forest plot | 1 | Puffs (Fixed, 95% CI) | Totals not selected | |
| 6.1 Children | 0 | Puffs (Fixed, 95% CI) | 0.0 [0.0, 0.0] | |
| 6.2 Adults | 1 | Puffs (Fixed, 95% CI) | 0.0 [0.0, 0.0] | |
| Outcome or subgroup title | No. of studies | No. of participants | Statistical method | Effect size |
| 1 FEV1 Show forest plot | 1 | Litres (Fixed, 95% CI) | Totals not selected | |
| 1.1 Children | 0 | Litres (Fixed, 95% CI) | 0.0 [0.0, 0.0] | |
| 1.2 Adults | 1 | Litres (Fixed, 95% CI) | 0.0 [0.0, 0.0] | |
| 2 Throat irritation Show forest plot | 1 | Odds Ratio (M‐H, Fixed, 95% CI) | Totals not selected | |
| 2.1 Children | 0 | Odds Ratio (M‐H, Fixed, 95% CI) | 0.0 [0.0, 0.0] | |
| 2.2 Adults | 1 | Odds Ratio (M‐H, Fixed, 95% CI) | 0.0 [0.0, 0.0] | |
| 3 Upper respiratory tract infections Show forest plot | 1 | Odds Ratio (M‐H, Fixed, 95% CI) | Totals not selected | |
| 3.1 Children | 0 | Odds Ratio (M‐H, Fixed, 95% CI) | 0.0 [0.0, 0.0] | |
| 3.2 Adults | 1 | Odds Ratio (M‐H, Fixed, 95% CI) | 0.0 [0.0, 0.0] | |
| 4 Lower respiratory tract infection Show forest plot | 1 | Odds Ratio (M‐H, Fixed, 95% CI) | Totals not selected | |
| 4.1 Children | 0 | Odds Ratio (M‐H, Fixed, 95% CI) | 0.0 [0.0, 0.0] | |
| 4.2 Adults | 1 | Odds Ratio (M‐H, Fixed, 95% CI) | 0.0 [0.0, 0.0] | |
| Outcome or subgroup title | No. of studies | No. of participants | Statistical method | Effect size |
| 1 FEV1 (absolute values) Show forest plot | 1 | Litres (Fixed, 95% CI) | Totals not selected | |
| 1.1 Children | 0 | Litres (Fixed, 95% CI) | 0.0 [0.0, 0.0] | |
| 1.2 Adults | 1 | Litres (Fixed, 95% CI) | 0.0 [0.0, 0.0] | |
| 2 PC 20 Show forest plot | 2 | 70 | Doses (n) (Fixed, 95% CI) | 2.45 [1.63, 3.27] |
| 2.1 Children | 0 | 0 | Doses (n) (Fixed, 95% CI) | 0.0 [0.0, 0.0] |
| 2.2 Adults | 2 | 70 | Doses (n) (Fixed, 95% CI) | 2.45 [1.63, 3.27] |
| 3 Cortisol suppression Show forest plot | 1 | % (Fixed, 95% CI) | Totals not selected | |
| 3.1 Children | 0 | % (Fixed, 95% CI) | 0.0 [0.0, 0.0] | |
| 3.2 Adults | 1 | % (Fixed, 95% CI) | 0.0 [0.0, 0.0] | |
| Outcome or subgroup title | No. of studies | No. of participants | Statistical method | Effect size |
| 1 Cortisol suppression Show forest plot | 1 | % (Fixed, 95% CI) | Totals not selected | |
| 1.1 Children | 0 | % (Fixed, 95% CI) | 0.0 [0.0, 0.0] | |
| 1.2 Adults | 1 | % (Fixed, 95% CI) | 0.0 [0.0, 0.0] | |
| 2 PC 20 Show forest plot | 2 | 100 | Doses (n) (Fixed, 95% CI) | 2.82 [2.13, 3.51] |
| 2.1 Children | 0 | 0 | Doses (n) (Fixed, 95% CI) | 0.0 [0.0, 0.0] |
| 2.2 Adults | 2 | 100 | Doses (n) (Fixed, 95% CI) | 2.82 [2.13, 3.51] |
| Outcome or subgroup title | No. of studies | No. of participants | Statistical method | Effect size |
| 1 Number of patients able to discontinue OCS completely Show forest plot | 2 | 139 | Peto Odds Ratio (Peto, Fixed, 95% CI) | 14.07 [7.17, 27.57] |
| 2 Change in daily dose of oral prednisolone compared to baseline (mg) Show forest plot | 2 | 139 | Mean Difference (IV, Fixed, 95% CI) | ‐7.59 [‐9.92, ‐5.25] |
| 3 Change in FEV1 compared to baseline (litres) Show forest plot | 2 | 139 | Mean Difference (IV, Fixed, 95% CI) | 0.26 [0.09, 0.43] |
| 4 Change in morning PEFR compared to baseline (L/min) Show forest plot | 2 | 139 | Mean Difference (IV, Fixed, 95% CI) | 50.85 [30.96, 70.73] |
| 5 Change in evening PEFR compared to baseline (L/min) Show forest plot | 2 | 139 | Mean Difference (IV, Fixed, 95% CI) | 26.52 [6.40, 46.65] |
| 6 Change in daily asthma symptom score compared to baseline Show forest plot | 2 | 139 | Std. Mean Difference (IV, Fixed, 95% CI) | ‐0.76 [‐1.10, ‐0.41] |
| 7 Change in daily use of rescue beta2 agonist compared to baseline (puffs/d) Show forest plot | 2 | 139 | Mean Difference (IV, Fixed, 95% CI) | ‐3.60 [‐5.04, ‐2.16] |
| 8 Asthma Quality of Life Questionnaire: change in overall score compared to baseline Show forest plot | 1 | Mean Difference (IV, Fixed, 95% CI) | Totals not selected | |
| 9 Asthma Quality of Life Questionnaire: change in activity limitation domain compared to baseline Show forest plot | 1 | Mean Difference (IV, Fixed, 95% CI) | Totals not selected | |
| 10 Asthma Quality of Life Questionnaire: change in asthma symptoms domain compared to baseline Show forest plot | 1 | Mean Difference (IV, Fixed, 95% CI) | Totals not selected | |
| 11 Asthma Quality of Life Questionnaire: change in emotional function domain compared to baseline Show forest plot | 1 | Mean Difference (IV, Fixed, 95% CI) | Totals not selected | |
| 12 Asthma Quality of Life Questionnaire: change in enviromental exposure domain compared to baseline Show forest plot | 1 | Mean Difference (IV, Fixed, 95% CI) | Totals not selected | |
| 14 Sore throat (No. of patients) Show forest plot | 2 | 139 | Peto Odds Ratio (Peto, Fixed, 95% CI) | 2.42 [0.33, 17.64] |
| 15 Hoarseness or dysphonia (No. of patients) Show forest plot | 2 | 139 | Peto Odds Ratio (Peto, Fixed, 95% CI) | 7.19 [1.41, 36.63] |
| 17 Oral Candidiasis (No. of patients) Show forest plot | 2 | 139 | Peto Odds Ratio (Peto, Fixed, 95% CI) | 5.71 [1.98, 16.47] |
| Outcome or subgroup title | No. of studies | No. of participants | Statistical method | Effect size |
| 1 Number of patients able to discontinue OCS completely Show forest plot | 2 | 134 | Peto Odds Ratio (Peto, Fixed, 95% CI) | 0.04 [0.02, 0.08] |
| 2 Change in daily dose of oral prednisolone compared to baseline (mg) Show forest plot | 2 | 134 | Mean Difference (IV, Fixed, 95% CI) | ‐9.72 [‐12.10, ‐7.35] |
| 3 Change in FEV1 compared to baseline (litres) Show forest plot | 2 | 134 | Mean Difference (IV, Fixed, 95% CI) | 0.58 [0.40, 0.76] |
| 4 Change in morning PEFR compared to baseline (L/min) Show forest plot | 2 | 134 | Mean Difference (IV, Fixed, 95% CI) | 94.35 [72.51, 116.19] |
| 5 Change in evening PEFR compared to baseline (L/min) Show forest plot | 2 | 134 | Mean Difference (IV, Fixed, 95% CI) | 66.14 [43.04, 89.24] |
| 6 Change in daily asthma symptom score compared to baseline Show forest plot | 2 | 134 | Std. Mean Difference (IV, Fixed, 95% CI) | ‐1.03 [‐1.39, ‐0.67] |
| 7 Change in daily use of rescue beta2 agonist compared to baseline (puffs/d) Show forest plot | 2 | 134 | Mean Difference (IV, Fixed, 95% CI) | ‐4.63 [‐6.10, ‐3.15] |
| 8 Asthma Quality of Life Questionnaire: change in overall score compared to baseline Show forest plot | 1 | Mean Difference (IV, Fixed, 95% CI) | Totals not selected | |
| 9 Asthma Quality of Life Questionnaire: change in activity limitation domain compared to baseline Show forest plot | 1 | Mean Difference (IV, Fixed, 95% CI) | Totals not selected | |
| 10 Asthma Quality of Life Questionnaire: change in asthma symptoms domain compared to baseline Show forest plot | 1 | Mean Difference (IV, Fixed, 95% CI) | Totals not selected | |
| 11 Asthma Quality of Life Questionnaire: change in emotional function domain compared to baseline Show forest plot | 1 | Mean Difference (IV, Fixed, 95% CI) | Totals not selected | |
| 12 Asthma Quality of Life Questionnaire: change in enviromental exposure domain compared to baseline Show forest plot | 1 | Mean Difference (IV, Fixed, 95% CI) | Totals not selected | |
| 14 Sore throat (No. of patients) Show forest plot | 2 | Peto Odds Ratio (Peto, Fixed, 95% CI) | Totals not selected | |
| 15 Hoarseness or dysphonia (No. of patients) Show forest plot | 2 | 134 | Peto Odds Ratio (Peto, Fixed, 95% CI) | 7.63 [1.50, 38.92] |
| 16 Oral Candidiasis (No. of patients) Show forest plot | 2 | 134 | Peto Odds Ratio (Peto, Fixed, 95% CI) | 4.62 [1.70, 12.51] |