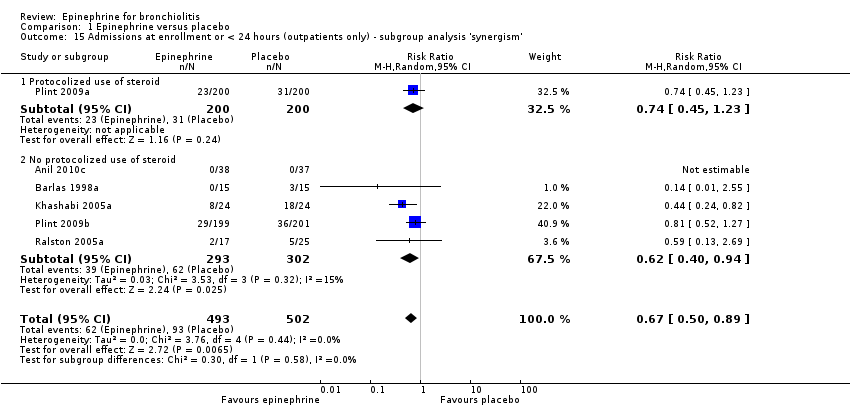
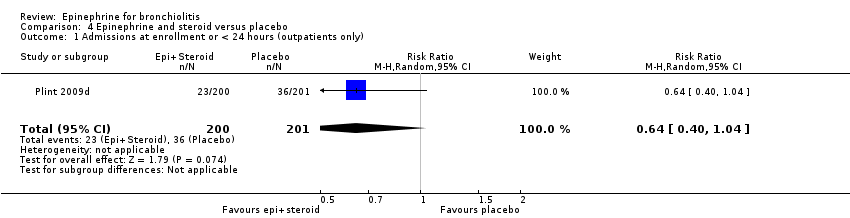
| 1 Admissions at enrollment or < 24 hours (outpatients only) Show forest plot | 9 | 444 | Risk Ratio (M‐H, Random, 95% CI) | 0.67 [0.41, 1.09] |
|
| 2 Admissions overall up to 7 days (outpatients only) Show forest plot | 3 | 212 | Risk Ratio (M‐H, Random, 95% CI) | 1.05 [0.71, 1.54] |
|
| 3 Length of stay (inpatients only) Show forest plot | 4 | 261 | Mean Difference (IV, Random, 95% CI) | ‐0.28 [‐0.46, ‐0.09] |
|
| 4 Length of stay (outpatients only) Show forest plot | 1 | 42 | Mean Difference (IV, Random, 95% CI) | 0.46 [‐0.27, 1.20] |
|
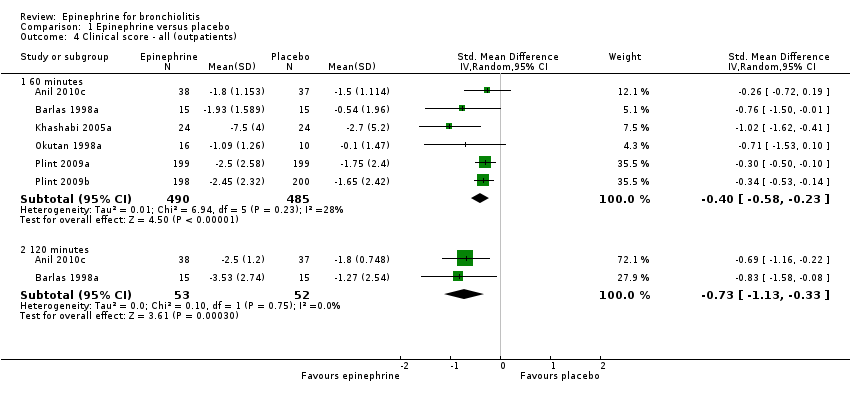
| 5 Clinical score ‐ all (outpatients) Show forest plot | 10 | | Std. Mean Difference (IV, Random, 95% CI) | Subtotals only |
|
| 5.1 60 minutes | 8 | 397 | Std. Mean Difference (IV, Random, 95% CI) | ‐0.12 [‐0.32, 0.08] |
| 5.2 120 minutes | 7 | 356 | Std. Mean Difference (IV, Random, 95% CI) | ‐0.10 [‐0.31, 0.11] |
| 5.3 12 to 24 hours | 2 | 69 | Std. Mean Difference (IV, Random, 95% CI) | ‐0.21 [‐0.86, 0.44] |
| 5.4 3 to 10 days | 2 | 69 | Std. Mean Difference (IV, Random, 95% CI) | ‐0.50 [‐0.98, ‐0.02] |
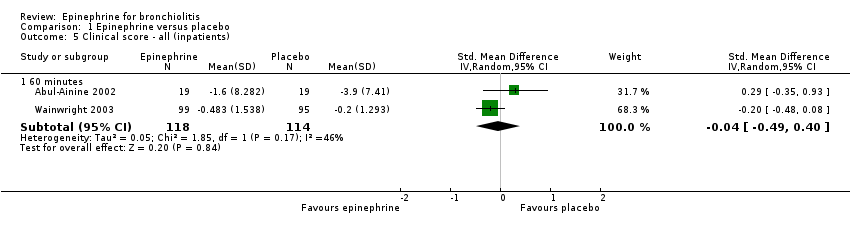
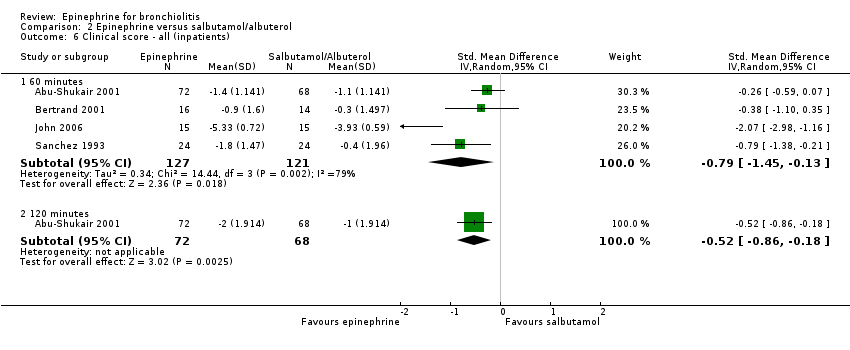
| 6 Clinical score ‐ all (inpatients) Show forest plot | 4 | | Std. Mean Difference (IV, Random, 95% CI) | Subtotals only |
|
| 6.1 60 minutes | 4 | 248 | Std. Mean Difference (IV, Random, 95% CI) | ‐0.79 [‐1.45, ‐0.13] |
| 6.2 120 minutes | 1 | 140 | Std. Mean Difference (IV, Random, 95% CI) | ‐0.52 [‐0.86, ‐0.18] |
| 7 Oxygen saturation ‐ all (outpatients) Show forest plot | 6 | | Mean Difference (IV, Random, 95% CI) | Subtotals only |
|
| 7.1 60 minutes | 6 | 335 | Mean Difference (IV, Random, 95% CI) | ‐0.37 [‐1.18, 0.43] |
| 7.2 120 minutes | 5 | 287 | Mean Difference (IV, Random, 95% CI) | ‐0.14 [‐0.63, 0.34] |
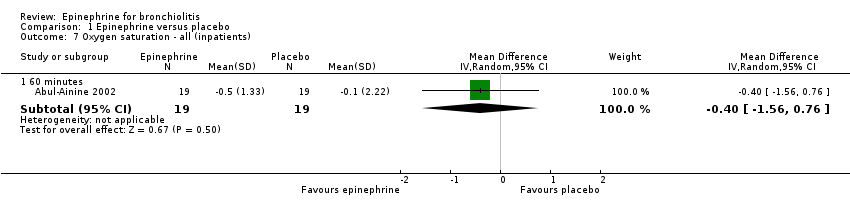
| 8 Oxygen saturation ‐ all (inpatients) Show forest plot | 3 | | Mean Difference (IV, Random, 95% CI) | Subtotals only |
|
| 8.1 60 minutes | 3 | 218 | Mean Difference (IV, Random, 95% CI) | 1.32 [0.51, 2.12] |
| 8.2 120 minutes | 1 | 140 | Mean Difference (IV, Random, 95% CI) | 1.5 [‐0.22, 3.22] |
| 9 Respiratory rate ‐ all (outpatients) Show forest plot | 6 | | Mean Difference (IV, Random, 95% CI) | Subtotals only |
|
| 9.1 60 minutes | 4 | 183 | Mean Difference (IV, Random, 95% CI) | ‐3.75 [‐7.43, ‐0.08] |
| 9.2 120 minutes | 4 | 177 | Mean Difference (IV, Random, 95% CI) | ‐2.59 [‐6.08, 0.89] |
| 9.3 12 to 24 hours | 2 | 69 | Mean Difference (IV, Random, 95% CI) | ‐3.44 [‐10.64, 3.76] |
| 9.4 > 24 hours | 2 | 69 | Mean Difference (IV, Random, 95% CI) | ‐6.88 [‐11.05, ‐2.71] |
| 10 Respiratory rate ‐ all (inpatients) Show forest plot | 3 | | Mean Difference (IV, Random, 95% CI) | Subtotals only |
|
| 10.1 60 minutes | 3 | 218 | Mean Difference (IV, Random, 95% CI) | ‐5.20 [‐8.33, ‐2.07] |
| 10.2 120 minutes | 1 | 140 | Mean Difference (IV, Random, 95% CI) | 1.0 [‐4.30, 6.30] |
| 11 Heart rate ‐ all (outpatients) Show forest plot | 7 | | Mean Difference (IV, Random, 95% CI) | Subtotals only |
|
| 11.1 60 minutes | 5 | 248 | Mean Difference (IV, Random, 95% CI) | 0.30 [‐3.67, 4.27] |
| 11.2 120 minutes | 6 | 290 | Mean Difference (IV, Random, 95% CI) | 1.35 [‐4.76, 7.45] |
| 11.3 12 to 24 hours | 2 | 69 | Mean Difference (IV, Random, 95% CI) | ‐3.56 [‐16.58, 9.47] |
| 11.4 3 to 10 days | 2 | 69 | Mean Difference (IV, Random, 95% CI) | ‐3.97 [‐13.85, 5.91] |
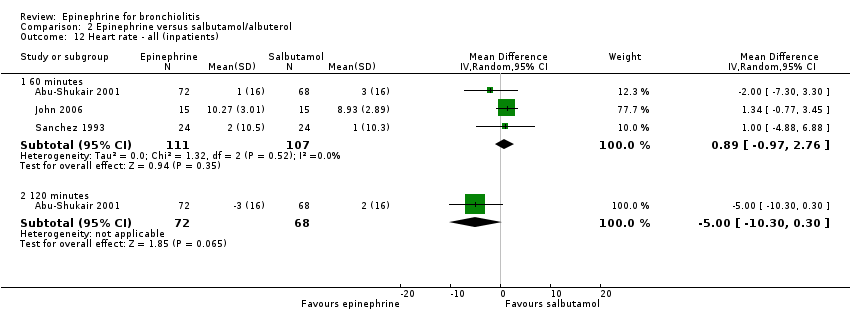
| 12 Heart rate ‐ all (inpatients) Show forest plot | 3 | | Mean Difference (IV, Random, 95% CI) | Subtotals only |
|
| 12.1 60 minutes | 3 | 218 | Mean Difference (IV, Random, 95% CI) | 0.89 [‐0.97, 2.76] |
| 12.2 120 minutes | 1 | 140 | Mean Difference (IV, Random, 95% CI) | ‐5.0 [‐10.30, 0.30] |
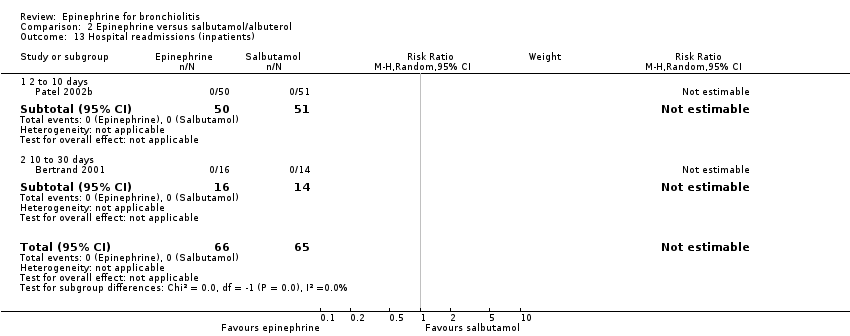
| 13 Hospital readmissions (inpatients) Show forest plot | 2 | 131 | Risk Ratio (M‐H, Random, 95% CI) | 0.0 [0.0, 0.0] |
|
| 13.1 2 to 10 days | 1 | 101 | Risk Ratio (M‐H, Random, 95% CI) | 0.0 [0.0, 0.0] |
| 13.2 10 to 30 days | 1 | 30 | Risk Ratio (M‐H, Random, 95% CI) | 0.0 [0.0, 0.0] |
| 14 Return visits (ED or any healthcare provider) ‐ (outpatients) Show forest plot | 2 | 76 | Risk Ratio (M‐H, Random, 95% CI) | 0.82 [0.28, 2.42] |
|
| 14.1 2 to 10 days | 1 | 41 | Risk Ratio (M‐H, Random, 95% CI) | 1.05 [0.30, 3.64] |
| 14.2 10 to 30 days | 1 | 35 | Risk Ratio (M‐H, Random, 95% CI) | 0.40 [0.05, 3.44] |
| 15 Return visits (ED or any healthcare provider) ‐ (inpatients) Show forest plot | 1 | 101 | Risk Ratio (M‐H, Random, 95% CI) | 1.17 [0.84, 1.61] |
|
| 15.1 10 to 30 days | 1 | 101 | Risk Ratio (M‐H, Random, 95% CI) | 1.17 [0.84, 1.61] |
| 16 Length of stay (inpatients only) only low RoB overall Show forest plot | 1 | 101 | Mean Difference (IV, Random, 95% CI) | ‐0.07 [‐1.01, 0.88] |
|
| 17 Admissions at enrollment or < 24 hours (outpatients only) only low RoB overall Show forest plot | 3 | 148 | Risk Ratio (M‐H, Random, 95% CI) | 0.66 [0.28, 1.56] |
|
| 18 Clinical score ‐ all (outpatients) only low RoB Show forest plot | 3 | | Std. Mean Difference (IV, Random, 95% CI) | Subtotals only |
|
| 18.1 60 minutes | 3 | 135 | Std. Mean Difference (IV, Random, 95% CI) | ‐0.23 [‐0.57, 0.11] |
| 18.2 120 minutes | 2 | 108 | Std. Mean Difference (IV, Random, 95% CI) | ‐0.11 [‐0.64, 0.42] |