Epinefrina para la bronquiolitis
Referencias
Referencias de los estudios incluidos en esta revisión
Referencias de los estudios excluidos de esta revisión
Referencias adicionales
Referencias de otras versiones publicadas de esta revisión
Characteristics of studies
Characteristics of included studies [ordered by study ID]
Ir a:
| Methods | Randomized, controlled trial. No withdrawals reported | |
| Participants | Conducted in Jordan, inpatients Group 1 Group 2 | |
| Interventions | Group 1: salbutamol (0.03 ml/kg of 5 mg/ml solution diluted with 0.9% saline to total 3 ml) Group 2: 3 ml of 1:1000 epinephrine. Administered at 0 and 30 min via nebulizer with continuous flow of oxygen at 6 L/min | |
| Outcomes | Primary outcome Secondary outcome* *Outcomes measured at baseline, 30, 60, 120 minutes | |
| Notes | Funding: not mentioned | |
| Risk of bias | ||
| Bias | Authors' judgement | Support for judgement |
| Random sequence generation (selection bias) | Low risk | |
| Allocation concealment (selection bias) | Low risk | |
| Blinding (performance bias and detection bias) | Unclear risk | RDAI; oxygen saturation; respiratory rate; heart rate |
| Blinding (performance bias and detection bias) | Unclear risk | Adverse events |
| Incomplete outcome data (attrition bias) | Unclear risk | RDAI; oxygen saturation; respiratory rate; heart rate |
| Incomplete outcome data (attrition bias) | Unclear risk | Adverse events |
| Selective reporting (reporting bias) | Low risk | |
| Other bias | Low risk | |
| Methods | Randomized, double‐blind, placebo‐controlled trial. No withdrawals reported | |
| Participants | Conducted in England, inpatients Group 1 Group 2 | |
| Interventions | Group 1: single dose (3 ml) of levo‐adrenaline (3 mg) Group 2: 0.9% saline placebo Treatments nebulized in 100% oxygen at 6 L/min | |
| Outcomes | Primary outcome Secondary outcome Outcomes measured at 20 minutes pre‐treatment, baseline, and 20, 40, 60 minutes post‐treatment | |
| Notes | Funding: PARI Medical Ltd provided nebulizer | |
| Risk of bias | ||
| Bias | Authors' judgement | Support for judgement |
| Random sequence generation (selection bias) | Low risk | |
| Allocation concealment (selection bias) | Unclear risk | NS |
| Blinding (performance bias and detection bias) | Unclear risk | RDAI; oxygen saturation; respiratory rate; heart rate |
| Blinding (performance bias and detection bias) | Unclear risk | Adverse events; activity status |
| Incomplete outcome data (attrition bias) | Low risk | RDAI; oxygen saturation; respiratory rate; heart rate |
| Incomplete outcome data (attrition bias) | Low risk | Adverse events; activity status |
| Selective reporting (reporting bias) | Low risk | |
| Methods | Randomized, double‐blind, placebo‐controlled trial. No withdrawals reported | |
| Participants | Conducted in Turkey, outpatients Group 1 Group 2 Group 3 Group 4 Group 5 | |
| Interventions | Group 1: inhalation of epinephrine, 1.5 mg, diluted to 4 ml with 0.9% saline Group 2: inhalation of epinephrine, 1.5 mg, diluted to 4 ml with 3% saline Group 3: inhalation of salbutamol, 2.5 mg, diluted to 4 ml with 0.9% saline Group 4: inhalation of salbutamol, 2.5 mg, diluted to 4 ml with 3% saline Group 5: inhalation of 4 ml 0.9% saline Treatments nebulized in 100% oxygen at 6 L/min, 2 doses administered at 0 and 30 minutes | |
| Outcomes | Primary outcome Secondary outcome Outcomes measured prior to each drug administration (0 and 30 minutes), 60 and 120 minutes post‐treatment | |
| Notes | Funding: not specified | |
| Risk of bias | ||
| Bias | Authors' judgement | Support for judgement |
| Random sequence generation (selection bias) | Low risk | |
| Allocation concealment (selection bias) | Low risk | |
| Blinding (performance bias and detection bias) | Low risk | Admissions from ED, number of readmissions of those discharged from ED |
| Blinding (performance bias and detection bias) | Low risk | Clinical severity score, SaO2, HR |
| Blinding (performance bias and detection bias) | Low risk | Tremor, study withdrawal due to worsening symptoms, discontinuation of any study drug due to side effects |
| Incomplete outcome data (attrition bias) | Low risk | Admissions from ED, number of readmissions of those discharged from ED |
| Incomplete outcome data (attrition bias) | Low risk | Clinical severity score, SaO2, HR |
| Incomplete outcome data (attrition bias) | Low risk | Tremor, study withdrawal due to worsening symptoms, discontinuation of any study drug due to side effects |
| Selective reporting (reporting bias) | Low risk | |
| Other bias | Unclear risk | NS |
| Methods | See Anil 2010a | |
| Participants | See Anil 2010a | |
| Interventions | See Anil 2010a | |
| Outcomes | See Anil 2010a | |
| Notes | This study contributed to the following comparisons: epinephrine (Group 2) versus salbutamol (Group 4) | |
| Risk of bias | ||
| Bias | Authors' judgement | Support for judgement |
| Random sequence generation (selection bias) | Low risk | |
| Allocation concealment (selection bias) | Low risk | |
| Blinding (performance bias and detection bias) | Low risk | Admissions from ED, number of readmissions of those discharged from ED |
| Blinding (performance bias and detection bias) | Low risk | Clinical severity score, SaO2, HR |
| Blinding (performance bias and detection bias) | Low risk | Tremor, study withdrawal due to worsening symptoms, discontinuation of any study drug due to side effects |
| Incomplete outcome data (attrition bias) | Low risk | Admissions from ED, number of readmissions of those discharged from ED |
| Incomplete outcome data (attrition bias) | Low risk | Clinical severity score, SaO2, HR |
| Incomplete outcome data (attrition bias) | Low risk | Tremor, study withdrawal due to worsening symptoms, discontinuation of any study drug due to side effects |
| Selective reporting (reporting bias) | Low risk | |
| Other bias | Unclear risk | NS |
| Methods | See Anil 2010a | |
| Participants | See Anil 2010a | |
| Interventions | See Anil 2010a | |
| Outcomes | See Anil 2010a | |
| Notes | This study contributed to the following comparisons: epinephrine (Group 1) versus placebo (Group 5) | |
| Risk of bias | ||
| Bias | Authors' judgement | Support for judgement |
| Random sequence generation (selection bias) | Low risk | |
| Allocation concealment (selection bias) | Low risk | |
| Blinding (performance bias and detection bias) | Low risk | Admissions from ED, number of readmissions of those discharged from ED |
| Blinding (performance bias and detection bias) | Low risk | Clinical severity score, SaO2, HR |
| Blinding (performance bias and detection bias) | Low risk | Tremor, study withdrawal due to worsening symptoms, discontinuation of any study drug due to side effects |
| Incomplete outcome data (attrition bias) | Low risk | Admissions from ED, number of readmissions of those discharged from ED |
| Incomplete outcome data (attrition bias) | Low risk | Clinical severity score, SaO2, HR |
| Incomplete outcome data (attrition bias) | Low risk | Tremor, study withdrawal due to worsening symptoms, discontinuation of any study drug due to side effects |
| Selective reporting (reporting bias) | Low risk | |
| Other bias | Unclear risk | NS |
| Methods | Randomized trial. No withdrawals reported | |
| Participants | Conducted in Turkey, outpatients Group 1 to 6 (all participants) | |
| Interventions | Group 1: placebo ‐ mist tent (nebulized) Group 2: albuterol (nebulized); 0.15 mg/kg; every hour during the first 4 h Group 3: prednisolone (IV); 2 mg/kg; single dose Group 4: albuterol + prednisolone (nebulized + I); 0.15 mg/kg (alb) + 2 mg/kg (pre); single dose for both interventions Group 5: racemic adrenaline (epinephrine) (nebulized); 0.1 ml/kg; every 2 h during the first 4 h Group 6: budesonide (nebulized); 0.5 mg; single dose | |
| Outcomes | Primary outcome Secondary outcome *Outcomes measured at baseline, 60, 120 minutes and 4 hours | |
| Notes | Funding: not mentioned | |
| Risk of bias | ||
| Bias | Authors' judgement | Support for judgement |
| Random sequence generation (selection bias) | Unclear risk | NS |
| Allocation concealment (selection bias) | Unclear risk | NS |
| Blinding (performance bias and detection bias) | High risk | Hospital admission, observation period |
| Blinding (performance bias and detection bias) | High risk | SaO2, HR, clinical score, no. improved with initial tx, additional tx |
| Incomplete outcome data (attrition bias) | Low risk | Hospital admission, observation period |
| Incomplete outcome data (attrition bias) | Low risk | SaO2, HR, clinical score, no. improved with initial tx, additional tx |
| Selective reporting (reporting bias) | Low risk | |
| Other bias | Unclear risk | NS |
| Methods | See Barlas 1998a | |
| Participants | See Barlas 1998a | |
| Interventions | See Barlas 1998a | |
| Outcomes | See Barlas 1998a | |
| Notes | This study contributed to the following comparison: epinephrine versus placebo (Barlas 1998a); epinephrine versus salbutamol (Barlas 1998b); and epinephrine versus steroid (prednisolone + budesonide) (Barlas 1998c) | |
| Risk of bias | ||
| Bias | Authors' judgement | Support for judgement |
| Random sequence generation (selection bias) | Unclear risk | NS |
| Allocation concealment (selection bias) | Unclear risk | NS |
| Blinding (performance bias and detection bias) | High risk | Hospital admission, observation period |
| Blinding (performance bias and detection bias) | High risk | SaO2, HR, clinical score, no. improved with initial tx, additional tx |
| Incomplete outcome data (attrition bias) | Low risk | Hospital admission, observation period |
| Incomplete outcome data (attrition bias) | Low risk | SaO2, HR, clinical score, no. improved with initial tx, additional tx |
| Selective reporting (reporting bias) | Low risk | |
| Other bias | Unclear risk | NS |
| Methods | Randomized, double‐blind, controlled trial. No withdrawals reported | |
| Participants | Conducted in Israel, outpatients (emergency department) Group 1 Group 2 | |
| Interventions | Group 1: epinephrine (1 mg diluted in 2 ml 0.9% saline) Group 2: albuterol (2.5 mg diluted in 2.5 ml 0.9% saline) Via nebulizer at 0.4 ml/min in 5L/min O2 flow. Single treatment of interventions | |
| Outcomes | Primary outcome Secondary outcome *Outcomes measured at baseline, 10, 30 minutes | |
| Notes | Funding: government | |
| Risk of bias | ||
| Bias | Authors' judgement | Support for judgement |
| Random sequence generation (selection bias) | Low risk | |
| Allocation concealment (selection bias) | Low risk | |
| Blinding (performance bias and detection bias) | Low risk | RR, HR, clinical score |
| Blinding (performance bias and detection bias) | Low risk | Acoustic breath sounds |
| Blinding (performance bias and detection bias) | Low risk | Computerized wheeze rate, computerized crackle count |
| Incomplete outcome data (attrition bias) | Low risk | RR, HR, clinical score |
| Incomplete outcome data (attrition bias) | Low risk | Acoustic breath sounds |
| Incomplete outcome data (attrition bias) | Low risk | Computerized wheeze rate, computerized crackle count |
| Selective reporting (reporting bias) | Low risk | |
| Other bias | Low risk | |
| Methods | Randomized, double‐blind, controlled trial | |
| Participants | Conducted in Chile, inpatients Group 1 Group 2 | |
| Interventions | Group 1: salbutamol (0.5 ml (2.5 mg) + 3.5 ml 0.9% saline) Group 2: epinephrine (0.5 ml (0.5 mg) + 3.5 ml saline) Via nebulizer. Interventions administered every 2 to 4 h during hospitalization; measurements done at baseline, 24 and 36 hours | |
| Outcomes | Primary outcome Secondary outcome *Outcomes measured at baseline, 24 and 36 hours | |
| Notes | Funding: not mentioned | |
| Risk of bias | ||
| Bias | Authors' judgement | Support for judgement |
| Random sequence generation (selection bias) | Unclear risk | NS |
| Allocation concealment (selection bias) | Unclear risk | NS |
| Blinding (performance bias and detection bias) | Unclear risk | LOS, hospital re‐admission |
| Blinding (performance bias and detection bias) | Unclear risk | SaO2, RR, HR, BP, clinical score |
| Blinding (performance bias and detection bias) | Unclear risk | AE, duration O2 therapy |
| Incomplete outcome data (attrition bias) | Low risk | LOS, hospital re‐admission |
| Incomplete outcome data (attrition bias) | Low risk | SaO2, RR, HR, BP, clinical score |
| Incomplete outcome data (attrition bias) | Unclear risk | AE, duration O2 therapy |
| Incomplete outcome data (attrition bias) | Low risk | |
| Selective reporting (reporting bias) | High risk | |
| Other bias | Low risk | |
| Methods | Randomized trial. No withdrawals reported | |
| Participants | Conducted in Iran, inpatients Group 1 Group 2 | |
| Interventions | Group 1: salbutamol (2 puffs via spacer every 4 hours) Group 2: epinephrine (1/1000 0.2 mg/kg with 3.5 cc saline via spray) Interventions administered every 4 hours | |
| Outcomes | Primary outcome Secondary outcome | |
| Notes | Funding: not mentioned | |
| Risk of bias | ||
| Bias | Authors' judgement | Support for judgement |
| Random sequence generation (selection bias) | Unclear risk | NS |
| Allocation concealment (selection bias) | Unclear risk | NS |
| Blinding (performance bias and detection bias) | Unclear risk | LOS, hospital re‐admission (2 weeks after d/c) |
| Blinding (performance bias and detection bias) | Unclear risk | SaO2, RR, HR, BP, clinical score |
| Blinding (performance bias and detection bias) | Unclear risk | AE, duration O2 therapy |
| Incomplete outcome data (attrition bias) | Low risk | LOS, hospital re‐admission (2 weeks after d/c) |
| Incomplete outcome data (attrition bias) | Unclear risk | SaO2, RR, HR, BP, clinical score |
| Incomplete outcome data (attrition bias) | Low risk | AE, duration O2 therapy |
| Selective reporting (reporting bias) | Low risk | |
| Other bias | Low risk | |
| Methods | Randomized trial. No withdrawals reported | |
| Participants | Conducted in India, inpatients Group 1 Group 2 | |
| Interventions | Group 1: epinephrine (0.5 ml/kg; maximum of 2.5 ml with 3 ml saline via nebulizer) Group 2: salbutamol (0.15 mg/kg with 3 ml saline via nebulizer) Interventions administered at 0, 30, 60 minutes and then 4‐hourly until child was stable | |
| Outcomes | Primary outcome Secondary outcome *Outcomes measured at baseline, 10, 40 and 70 minutes | |
| Notes | Funding: not mentioned | |
| Risk of bias | ||
| Bias | Authors' judgement | Support for judgement |
| Random sequence generation (selection bias) | Low risk | Lottery method |
| Allocation concealment (selection bias) | Unclear risk | NS |
| Blinding (performance bias and detection bias) | Unclear risk | LOS |
| Blinding (performance bias and detection bias) | Unclear risk | SaO2, RR, HR, RDAI |
| Blinding (performance bias and detection bias) | Unclear risk | Adverse events |
| Incomplete outcome data (attrition bias) | Unclear risk | LOS |
| Incomplete outcome data (attrition bias) | Unclear risk | SaO2, RR, HR, RDAI |
| Incomplete outcome data (attrition bias) | Unclear risk | Adverse events |
| Methods | Randomized trial. No withdrawals reported | |
| Participants | Conducted in Bangladesh, inpatients Group 1 Group 2 | |
| Interventions | Group 1: combined salbutamol (0.15 mg/kg) and ipratropium bromide (250 μg in 1 ml) Group 2: L‐adrenaline (0.01 ml/kg of 1:1000 dilutions) Interventions nebulized and administered at 0 and 6 hours | |
| Outcomes | Primary outcome Secondary outcome Outcomes measured at baseline and 30 min after each tx | |
| Notes | Funding: not mentioned | |
| Risk of bias | ||
| Bias | Authors' judgement | Support for judgement |
| Random sequence generation (selection bias) | Low risk | |
| Allocation concealment (selection bias) | Unclear risk | NS |
| Blinding (performance bias and detection bias) | High risk | MRDAI, SaO2, respiratory rate |
| Incomplete outcome data (attrition bias) | Unclear risk | MRDAI, SaO2, respiratory rate |
| Selective reporting (reporting bias) | Unclear risk | NS |
| Other bias | Unclear risk | NS |
| Methods | Randomized, double‐blind trial. No withdrawals reported | |
| Participants | Conducted in Iran, outpatients (emergency department) Group 1 Group 2 Group 3 | |
| Interventions | Group 1: epinephrine (0.1 ml/kg of 1:10000 solution + saline to 5 ml) Group 2: salbutamol (0.15 mg/kg + saline to 5 ml) Group 3: placebo (5 ml saline) Administered via nebulizer in 8 L/min O2 flow, 3 doses at 20‐minute intervals | |
| Outcomes | Primary outcome Secondary outcome *Outcomes measured at baseline, 10, 20, 30 and 40 minutes | |
| Notes | Funding: not mentioned | |
| Risk of bias | ||
| Bias | Authors' judgement | Support for judgement |
| Random sequence generation (selection bias) | Unclear risk | NS |
| Allocation concealment (selection bias) | Unclear risk | NS |
| Blinding (performance bias and detection bias) | Low risk | SaO2, RR, RDAI |
| Blinding (performance bias and detection bias) | Low risk | Number ready to go home at end of tx |
| Incomplete outcome data (attrition bias) | Low risk | SaO2, RR, RDAI |
| Incomplete outcome data (attrition bias) | Low risk | Number ready to go home at end of tx |
| Other bias | Low risk | |
| Methods | See Khashabi 2005a | |
| Participants | See Khashabi 2005a | |
| Interventions | See Khashabi 2005a | |
| Outcomes | See Khashabi 2005a | |
| Notes | This study contributed to the following comparisons: epinephrine versus placebo (Khashabi 2005a) and epinephrine versus salbutamol (Khashabi 2005b) | |
| Risk of bias | ||
| Bias | Authors' judgement | Support for judgement |
| Random sequence generation (selection bias) | Unclear risk | NS |
| Allocation concealment (selection bias) | Unclear risk | NS |
| Blinding (performance bias and detection bias) | Low risk | SaO2, RR, RDAI |
| Blinding (performance bias and detection bias) | Low risk | Number ready to go home at end of tx |
| Incomplete outcome data (attrition bias) | Low risk | SaO2, RR, RDAI |
| Incomplete outcome data (attrition bias) | Low risk | Number ready to go home at end of tx |
| Other bias | Low risk | |
| Methods | Randomized, double‐blind controlled study; not ITT for follow‐up outcomes (21 patients did not attend follow‐up visits at 24 hours or Day 5 and were not included in analysis) | |
| Participants | Conducted in Turkey, outpatients Group 1 Group 2 Group 3 Group 4 | |
| Interventions | Group 1: epinephrine + dexamethasone (3 ml (3 mg) of 1:1000 L‐epinephrine + 0.6 mg/kg of dexamethasone) Group 2: salbutamol + dexamethasone (0.15 mg/kg of 1 mg/ml solution of salbutamol added to 0.9% saline to total 3 ml + 0.6 mg/kg of dexamethasone) Group 3: epinephrine + placebo (3 ml (3 mg) of 1:1000 L‐epinephrine) Group 4: salbutamol + placebo (0.15 mg/kg of 1 mg/ml solution of salbutamol added to 0.9% saline solution to make a total of 3 ml) 3 doses administered to each participant | |
| Outcomes | Primary outcome Secondary outcome *Outcomes measured at baseline, 120 minutes, 24 hours, 5 days | |
| Notes | Funding: not mentioned | |
| Risk of bias | ||
| Bias | Authors' judgement | Support for judgement |
| Random sequence generation (selection bias) | Unclear risk | NS |
| Allocation concealment (selection bias) | Unclear risk | NS |
| Blinding (performance bias and detection bias) | Unclear risk | RR, HR, RDAI |
| Blinding (performance bias and detection bias) | Unclear risk | Additional medication, follow‐up rate, AE |
| Incomplete outcome data (attrition bias) | Unclear risk | RR, HR, RDAI |
| Incomplete outcome data (attrition bias) | High risk | Additional medication, follow‐up rate, AE |
| Selective reporting (reporting bias) | Low risk | |
| Other bias | Unclear risk | NS |
| Methods | See Kuyucu 2004a | |
| Participants | See Kuyucu 2004a | |
| Interventions | This study contributed to the following comparisons: epinephrine versus salbutamol (Kuyucu 2004a and Kuyucu 2004b); epinephrine + steroid versus salbutamol (Kuyucu 2004c) | |
| Outcomes | See Kuyucu 2004a | |
| Notes | See Kuyucu 2004a | |
| Risk of bias | ||
| Bias | Authors' judgement | Support for judgement |
| Random sequence generation (selection bias) | Unclear risk | NS |
| Allocation concealment (selection bias) | Unclear risk | NS |
| Blinding (performance bias and detection bias) | Unclear risk | RR, HR, RDAI |
| Blinding (performance bias and detection bias) | Unclear risk | Additional medication, follow‐up rate, AE |
| Incomplete outcome data (attrition bias) | Unclear risk | RR, HR, RDAI |
| Incomplete outcome data (attrition bias) | High risk | Additional medication, follow‐up rate, AE |
| Selective reporting (reporting bias) | Low risk | |
| Other bias | Unclear risk | NS |
| Methods | Randomized centrally by pharmacy using table of random numbers; controlled trial; double‐blind. One participant excluded after randomization (did not meet inclusion criteria); no withdrawals reported | |
| Participants | Conducted in Canada, outpatients Group 1 Group 2 | |
| Interventions | Group 1: salbutamol (0.3 ml of 5 mg/ml solution + 2.7 ml of 0.9% saline) Group 2: L‐epinephrine (3 ml of 1:1000) Via nebulizer. One inhalation | |
| Outcomes | Primary outcome Secondary outcome *Outcomes measured at baseline, 30, 60, 90 minutes | |
| Notes | Funding: other | |
| Risk of bias | ||
| Bias | Authors' judgement | Support for judgement |
| Random sequence generation (selection bias) | Low risk | |
| Allocation concealment (selection bias) | Low risk | |
| Blinding (performance bias and detection bias) | Low risk | Hospital admission, LOS, return to healthcare facility (24 h after d/c) |
| Blinding (performance bias and detection bias) | Low risk | SaO2, RR, HR, RDAI |
| Blinding (performance bias and detection bias) | Low risk | AE |
| Incomplete outcome data (attrition bias) | Low risk | Hospital admission, LOS, return to healthcare facility (24 h after d/c) |
| Incomplete outcome data (attrition bias) | Low risk | SaO2, RR, HR, RDAI |
| Incomplete outcome data (attrition bias) | Low risk | AE |
| Selective reporting (reporting bias) | Low risk | |
| Other bias | Low risk | |
| Methods | Randomized, double‐blind, controlled trial. Seven participants excluded after enrolment; no withdrawals or losses to follow up | |
| Participants | Conducted in USA, outpatients Group 1 Group 2 | |
| Interventions | Group 1: nebulized 2.25% racemic epinephrine (0.9 mg/kg) Group 2: nebulized 0.5% albuterol (0.15 mg/kg) (n = 32) with 2 ml of 0.9% isotonic sodium chloride solution Delivered via face mask with continuous flow of 100% oxygen at 6 L/min in 3 doses at 0, 30 and 60 minutes | |
| Outcomes | Primary outcome Secondary outcome *Outcomes measured at baseline, 30, 60, 90, 120, 150 minutes | |
| Notes | Funded in part by Nephron Pharmaceuticals Company | |
| Risk of bias | ||
| Bias | Authors' judgement | Support for judgement |
| Random sequence generation (selection bias) | Low risk | |
| Allocation concealment (selection bias) | Low risk | |
| Blinding (performance bias and detection bias) | Low risk | Hospital admission, time to d/c, re‐admission to hospital, relapse rate |
| Blinding (performance bias and detection bias) | Low risk | RR, SaO2, RDAI |
| Blinding (performance bias and detection bias) | Low risk | Return to physician |
| Blinding (performance bias and detection bias) | Low risk | AE |
| Incomplete outcome data (attrition bias) | Low risk | Hospital admission, time to d/c, re‐admission to hospital, relapse rate |
| Incomplete outcome data (attrition bias) | Low risk | RR, SaO2, RDAI |
| Incomplete outcome data (attrition bias) | Low risk | Return to physician |
| Incomplete outcome data (attrition bias) | Low risk | AE |
| Selective reporting (reporting bias) | Low risk | |
| Other bias | Low risk | |
| Methods | Randomized trial. Participants were sedated with oral chloral hydrate (80 mg/kg) and kept in supine position. After 1 hour (or after the child was asleep) pulse oximeter was fitted and clinical scoring made. Extent of follow up or whether ITT analysis done unknown | |
| Participants | Conducted in Turkey, outpatients Group 1 Group 2 Group 3 Males, % (total): 28 | |
| Interventions | Group 1: epinephrine (0.2 mg/kg; 1 mg/ml; 3 ml) Group 2: salbutamol (0.15 mg/kg; 2.5 mg/2.5 ml; 3 ml) Group 3: placebo (0.9% NaCl; 3 ml) Number and timing of doses unclear | |
| Outcomes | Primary outcome Secondary outcome Outcomes measured at 15, 30, 45, 60 and 120 minutes | |
| Notes | Funding: not mentioned | |
| Risk of bias | ||
| Bias | Authors' judgement | Support for judgement |
| Random sequence generation (selection bias) | Unclear risk | NS |
| Allocation concealment (selection bias) | Unclear risk | NS |
| Blinding (performance bias and detection bias) | Low risk | |
| Blinding (performance bias and detection bias) | Low risk | SaO2, RR, HR, BP, RDAI |
| Incomplete outcome data (attrition bias) | Low risk | |
| Incomplete outcome data (attrition bias) | Low risk | SaO2, RR, HR, BP, RDAI |
| Selective reporting (reporting bias) | Low risk | |
| Other bias | Unclear risk | NS |
| Methods | See Okutan 1998a | |
| Participants | See Okutan 1998a | |
| Interventions | This study contributed to the following comparisons: epinephrine versus placebo (Okutan 1998a); epinephrine versus salbutamol (Okutan 1998b) | |
| Outcomes | See Okutan 1998a | |
| Notes | See Okutan 1998a | |
| Risk of bias | ||
| Bias | Authors' judgement | Support for judgement |
| Random sequence generation (selection bias) | Unclear risk | NS |
| Allocation concealment (selection bias) | Unclear risk | NS |
| Blinding (performance bias and detection bias) | Low risk | |
| Blinding (performance bias and detection bias) | Low risk | SaO2, RR, HR, BP, RDAI |
| Incomplete outcome data (attrition bias) | Low risk | |
| Incomplete outcome data (attrition bias) | Low risk | SaO2, RR, HR, BP, RDAI |
| Selective reporting (reporting bias) | Low risk | |
| Other bias | Unclear risk | NS |
| Methods | Randomized, double‐blind study. Intention‐to‐treat analysis performed; 10 participants withdrew (epi = 1, sal = 4, pla = 5) | |
| Participants | Conducted in Canada, inpatients Group 1 Group 2 Group 3 | |
| Interventions | Group 1: racemic epinephrine (0.03 ml/kg/dose of a 2.25% solution) Group 2: saline placebo (0.03 ml/kg/dose of 0.9% sodium chloride) Group 3: salbutamol (0.03 ml/kg/dose of a 5 mg/ml solution) Treatment administered every 1 to 6 h for 10 to 15 min via nebulizer with continuous flow 100% oxygen at 6 to 7 L/min, frequency changes at the discretion of medical team | |
| Outcomes | Primary outcome Secondary outcome * Outcomes measured 2 times per day | |
| Notes | Funding: other | |
| Risk of bias | ||
| Bias | Authors' judgement | Support for judgement |
| Random sequence generation (selection bias) | Low risk | |
| Allocation concealment (selection bias) | Low risk | |
| Blinding (performance bias and detection bias) | Low risk | Hospital or ICU readmission, return to healthcare facility |
| Blinding (performance bias and detection bias) | Low risk | SaO2, RDAI |
| Blinding (performance bias and detection bias) | Low risk | Medication requirements |
| Blinding (performance bias and detection bias) | Low risk | Adequate fluid intake |
| Incomplete outcome data (attrition bias) | Low risk | Hospital or ICU readmission, return to healthcare facility |
| Incomplete outcome data (attrition bias) | Low risk | SaO2, RDAI |
| Incomplete outcome data (attrition bias) | Low risk | Medication requirements |
| Incomplete outcome data (attrition bias) | Low risk | Adequate fluid intake |
| Selective reporting (reporting bias) | Low risk | |
| Other bias | Low risk | |
| Methods | See Patel 2002a | |
| Participants | ||
| Interventions | 50 infants received epinephrine (0.03 ml/kg/dose of a 2.25% solution) and 51 were given salbutamol (0.03 ml/kg/dose of a 5 mg/ml solution) | |
| Outcomes | ||
| Notes | ||
| Risk of bias | ||
| Bias | Authors' judgement | Support for judgement |
| Random sequence generation (selection bias) | Low risk | |
| Allocation concealment (selection bias) | Low risk | |
| Blinding (performance bias and detection bias) | Low risk | Hospital or ICU readmission, return to healthcare facility |
| Blinding (performance bias and detection bias) | Low risk | SaO2, RDAI |
| Blinding (performance bias and detection bias) | Low risk | Medication requirements |
| Blinding (performance bias and detection bias) | Low risk | Adequate fluid intake |
| Incomplete outcome data (attrition bias) | Low risk | Hospital or ICU readmission, return to healthcare facility |
| Incomplete outcome data (attrition bias) | Low risk | SaO2, RDAI |
| Incomplete outcome data (attrition bias) | Low risk | Medication requirements |
| Incomplete outcome data (attrition bias) | Low risk | Adequate fluid intake |
| Selective reporting (reporting bias) | Low risk | |
| Other bias | Low risk | |
| Methods | Randomized, double‐blind, controlled trial | |
| Participants | Conducted in Canada, outpatients (emergency department) Group 1 Group 2 Group 3 Group 4 | |
| Interventions | Group 1: epinephrine + dexamethasone Group 2: epinephrine + placebo Group 3: dexamethasone + placebo Group 4: placebo + placebo Dosages as follows: epi: 3 ml in 1:1000 saline; dex: 1.0 mg/kg weight (max 10 mg) then 0.6 mg/kg (max 10 mg) after ED. Mode of administration for epinephrine was nebulized in O2 flow 8 L/min, and dexamethasone was oral. Two doses of treatment administered at 30 minutes apart; oral dexamethasone after first nebulization of epinephrine in ED, followed by 5 once daily doses of oral dexamethasone after leaving ED | |
| Outcomes | Primary outcome Secondary outcome * Outcomes measured at baseline, 30 and 60 minutes | |
| Notes | Funding: government | |
| Risk of bias | ||
| Bias | Authors' judgement | Support for judgement |
| Random sequence generation (selection bias) | Low risk | |
| Allocation concealment (selection bias) | Low risk | |
| Blinding (performance bias and detection bias) | Low risk | Hospital admission, LOS, return to healthcare facility |
| Blinding (performance bias and detection bias) | Low risk | SaO2, RR, HR, temperature, RDAI |
| Blinding (performance bias and detection bias) | Low risk | Duration of symptoms |
| Blinding (performance bias and detection bias) | Low risk | AE |
| Incomplete outcome data (attrition bias) | Low risk | Hospital admission, LOS, return to healthcare facility |
| Incomplete outcome data (attrition bias) | Low risk | SaO2, RR, HR, temperature, RDAI |
| Incomplete outcome data (attrition bias) | Low risk | Duration of symptoms |
| Incomplete outcome data (attrition bias) | Low risk | AE |
| Selective reporting (reporting bias) | Low risk | |
| Other bias | Low risk | |
| Methods | See Plint 2009a | |
| Participants | See Plint 2009a | |
| Interventions | This study contributed to the following comparisons: epinephrine versus placebo (Plint 2009a and Plint 2009b); epinephrine versus dexamethasone (Plint 2009c); epinephrine + dexamethasone versus placebo (Plint 2009d) | |
| Outcomes | See Plint 2009a | |
| Notes | See Plint 2009a | |
| Risk of bias | ||
| Bias | Authors' judgement | Support for judgement |
| Random sequence generation (selection bias) | Low risk | |
| Allocation concealment (selection bias) | Low risk | |
| Blinding (performance bias and detection bias) | Low risk | Hospital admission, LOS, return to healthcare facility |
| Blinding (performance bias and detection bias) | Low risk | SaO2, RR, HR, temperature, RDAI |
| Blinding (performance bias and detection bias) | Low risk | Duration of symptoms |
| Blinding (performance bias and detection bias) | Low risk | AE |
| Incomplete outcome data (attrition bias) | Low risk | |
| Incomplete outcome data (attrition bias) | Low risk | |
| Incomplete outcome data (attrition bias) | Low risk | |
| Incomplete outcome data (attrition bias) | Low risk | |
| Selective reporting (reporting bias) | Low risk | |
| Other bias | Low risk | |
| Methods | Randomized, double‐blind, controlled trial. No withdrawals reported | |
| Participants | Conducted in USA, outpatients (emergency department) Group 1 Group 2 Group 3 | |
| Interventions | Group 1: 0.9% saline placebo Group 2: racemic albuterol (salbutamol) sulfate (5 mg) Group 3: racemic epinephrine (5 mg) All drugs given in 3 ml nebulized doses via mask with continuous flow of oxygen at 6 L/min. Study drug given at 0 and 30 min. Third dose given at 60 min if RDAI score > 8 or room air oxygen saturation < 90% | |
| Outcomes | Primary outcome Secondary outcome | |
| Notes | Funding: Dept HHS/NIH/NCRR/GCRC (USA); American Academy of Pediatrics | |
| Risk of bias | ||
| Bias | Authors' judgement | Support for judgement |
| Random sequence generation (selection bias) | Low risk | |
| Allocation concealment (selection bias) | Low risk | |
| Blinding (performance bias and detection bias) | Low risk | Hospital admission |
| Blinding (performance bias and detection bias) | Low risk | RDAI |
| Blinding (performance bias and detection bias) | Low risk | AE; home oxygen management |
| Incomplete outcome data (attrition bias) | Low risk | Hospital admission |
| Incomplete outcome data (attrition bias) | Low risk | RDAI |
| Incomplete outcome data (attrition bias) | Low risk | AE; home oxygen management |
| Selective reporting (reporting bias) | Low risk | |
| Other bias | Low risk | |
| Methods | See Ralston 2005a | |
| Participants | See Ralston 2005a | |
| Interventions | This study contributed to the following comparisons: epinephrine versus placebo (Ralston 2005a); epinephrine versus salbutamol (Ralston 2005b) | |
| Outcomes | See Ralston 2005a | |
| Notes | See Ralston 2005a | |
| Risk of bias | ||
| Bias | Authors' judgement | Support for judgement |
| Random sequence generation (selection bias) | Low risk | |
| Allocation concealment (selection bias) | Low risk | |
| Blinding (performance bias and detection bias) | Low risk | Hospital admission |
| Blinding (performance bias and detection bias) | Low risk | RDAI |
| Blinding (performance bias and detection bias) | Low risk | AE; home oxygen management |
| Incomplete outcome data (attrition bias) | Low risk | Hospital admission |
| Incomplete outcome data (attrition bias) | Low risk | RDAI |
| Incomplete outcome data (attrition bias) | Low risk | AE; home oxygen management |
| Selective reporting (reporting bias) | Low risk | |
| Other bias | Low risk | |
| Methods | Randomized, controlled trial, double‐blind, cross‐over study. Results from cross‐over arms not differentiated in the analysis. 8 participants did not complete study because of inadequate sedation or technical problems; they were excluded from the analysis | |
| Participants | Conducted in Canada, inpatients Group 1 and 2 | |
| Interventions | Group 1: albuterol (0.03 ml/kg of 5 mg/ml solution diluted to total of 2 ml in 0.9% NaCl) Group 2: racemic epinephrine (0.1 ml/kg of 2.25% solution diluted to total 2 ml in 0.9% NaCl) Via nebulizer. One inhalation | |
| Outcomes | Primary outcome Secondary outcome *Outcomes measured at baseline and 20 to 30 minutes post‐treatment | |
| Notes | Funding: pharmaceutical and other | |
| Risk of bias | ||
| Bias | Authors' judgement | Support for judgement |
| Random sequence generation (selection bias) | Unclear risk | NS |
| Allocation concealment (selection bias) | Unclear risk | NS |
| Blinding (performance bias and detection bias) | Unclear risk | LOS, hospital re‐admission |
| Blinding (performance bias and detection bias) | Unclear risk | SaO2, RR, HR, clinical score |
| Blinding (performance bias and detection bias) | Unclear risk | Pulmonary tests |
| Incomplete outcome data (attrition bias) | Unclear risk | LOS, hospital re‐admission |
| Incomplete outcome data (attrition bias) | Unclear risk | SaO2, RR, HR, clinical score |
| Incomplete outcome data (attrition bias) | Unclear risk | Pulmonary tests |
| Other bias | High risk | |
| Methods | Randomized, placebo‐controlled, double‐blind study. No withdrawals reported. Data analyzed on an intention‐to‐treat basis | |
| Participants | Conducted in Australia, inpatients Group 1 Group 2 | |
| Interventions | Group 1: adrenaline (isomer epinephrine) (4 ml 1%) Group 2: placebo (4 ml normal saline) Three doses administered at 4‐hour intervals within 24 hours after admission to hospital. Treatment nebulized with oxygen flow at 6 L/min | |
| Outcomes | Primary outcome Secondary outcome *Outcomes measured at 30 and 60 minutes after each dose | |
| Notes | Funding: none | |
| Risk of bias | ||
| Bias | Authors' judgement | Support for judgement |
| Random sequence generation (selection bias) | Low risk | |
| Allocation concealment (selection bias) | Low risk | |
| Blinding (performance bias and detection bias) | Low risk | LOS, time ready for discharge, hospital readmission |
| Blinding (performance bias and detection bias) | Low risk | RR, HR, BP, respiratory effort score |
| Blinding (performance bias and detection bias) | Low risk | Supplemental O2 |
| Incomplete outcome data (attrition bias) | Low risk | LOS, time ready for discharge, hospital readmission |
| Incomplete outcome data (attrition bias) | Low risk | RR, HR, BP, respiratory effort score |
| Incomplete outcome data (attrition bias) | Low risk | Supplemental O2 |
| Selective reporting (reporting bias) | High risk | |
| Other bias | Low risk | |
AE: adverse events
BP: blood pressure
d/c: discharge
ED: emergency department
epi: epinephrine
h: hour
HR: heart rate
ICU: Intensive Care Unit
ITT: intention‐to‐treat
IV: intravenous
LOS: length of stay
min: minute
NaCl: sodium chloride
O2: oxygen
PICU: Pediatric Intensive Care Unit
pla: placebo
RDAI: Respiratory Distress Assessment Index
RR: respiratory rate
RSV: respiratory syncytial virus
NS: not specified
sal: salbutamol
SaO2: oxygen saturation
SD: standard deviation
SEM: standard error of the mean
tx: treatment
Characteristics of excluded studies [ordered by study ID]
Ir a:
| Study | Reason for exclusion |
| Unclear if first episode of wheezing | |
| Unclear if first episode of wheezing | |
| Letter | |
| Study is not randomized | |
| Commentary | |
| Used saline as intervention not epinephrine | |
| Letter | |
| Unclear if first episode of wheezing | |
| Recurrent wheezing | |
| Comment | |
| Commentary | |
| Not first episode of wheezing | |
| Unclear if first episode of wheezing | |
| Letter | |
| Not first episode of wheezing | |
| Review | |
| Review | |
| Protocolized use of epinephrine | |
| Review | |
| Letter | |
| Unclear if first episode of wheezing | |
| First or second episode of wheezing | |
| Not first episode of wheezing | |
| Letter | |
| Review | |
| Commentary | |
| Unclear if first episode of wheezing | |
| Used saline as intervention not epinephrine | |
| Letter | |
| Commentary | |
| Unclear if first episode of wheezing | |
| Editorial | |
| Review |
Data and analyses
| Outcome or subgroup title | No. of studies | No. of participants | Statistical method | Effect size |
| 1 Admissions at enrollment or < 24 hours (outpatients only) Show forest plot | 6 | 995 | Risk Ratio (M‐H, Random, 95% CI) | 0.67 [0.50, 0.89] |
| Analysis 1.1  Comparison 1 Epinephrine versus placebo, Outcome 1 Admissions at enrollment or < 24 hours (outpatients only). | ||||
| 2 Admissions overall up to 7 days (outpatients only) Show forest plot | 3 | 875 | Risk Ratio (M‐H, Random, 95% CI) | 0.81 [0.63, 1.03] |
| Analysis 1.2  Comparison 1 Epinephrine versus placebo, Outcome 2 Admissions overall up to 7 days (outpatients only). | ||||
| 3 Length of stay (inpatients only) Show forest plot | 2 | 292 | Mean Difference (IV, Random, 95% CI) | ‐0.35 [‐0.87, 0.17] |
| Analysis 1.3  Comparison 1 Epinephrine versus placebo, Outcome 3 Length of stay (inpatients only). | ||||
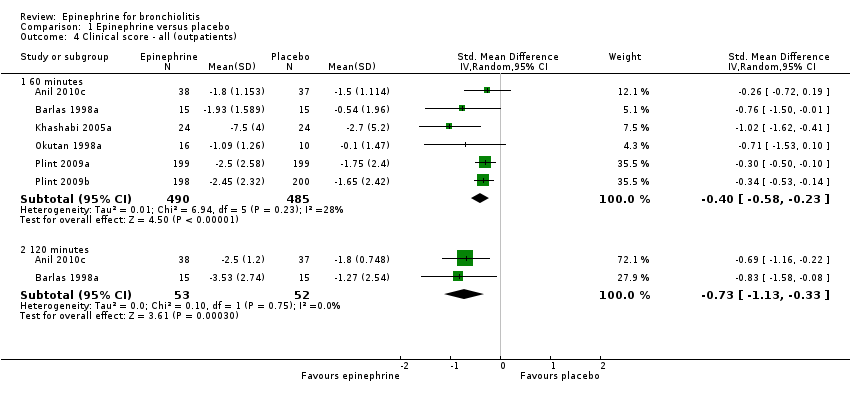
| 4 Clinical score ‐ all (outpatients) Show forest plot | 6 | Std. Mean Difference (IV, Random, 95% CI) | Subtotals only | |
| Analysis 1.4  Comparison 1 Epinephrine versus placebo, Outcome 4 Clinical score ‐ all (outpatients). | ||||
| 4.1 60 minutes | 6 | 975 | Std. Mean Difference (IV, Random, 95% CI) | ‐0.40 [‐0.58, ‐0.23] |
| 4.2 120 minutes | 2 | 105 | Std. Mean Difference (IV, Random, 95% CI) | ‐0.73 [‐1.13, ‐0.33] |
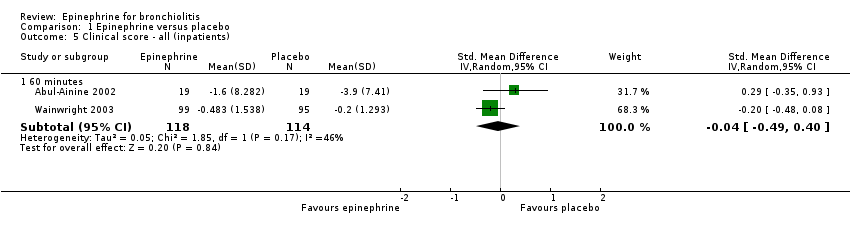
| 5 Clinical score ‐ all (inpatients) Show forest plot | 2 | Std. Mean Difference (IV, Random, 95% CI) | Subtotals only | |
| Analysis 1.5  Comparison 1 Epinephrine versus placebo, Outcome 5 Clinical score ‐ all (inpatients). | ||||
| 5.1 60 minutes | 2 | 232 | Std. Mean Difference (IV, Random, 95% CI) | ‐0.04 [‐0.49, 0.40] |
| 6 Oxygen saturation ‐ all (outpatients) Show forest plot | 5 | Mean Difference (IV, Random, 95% CI) | Subtotals only | |
| Analysis 1.6  Comparison 1 Epinephrine versus placebo, Outcome 6 Oxygen saturation ‐ all (outpatients). | ||||
| 6.1 60 minutes | 5 | 949 | Mean Difference (IV, Random, 95% CI) | 0.61 [‐0.14, 1.36] |
| 6.2 120 minutes | 2 | 105 | Mean Difference (IV, Random, 95% CI) | ‐0.05 [‐1.22, 1.13] |
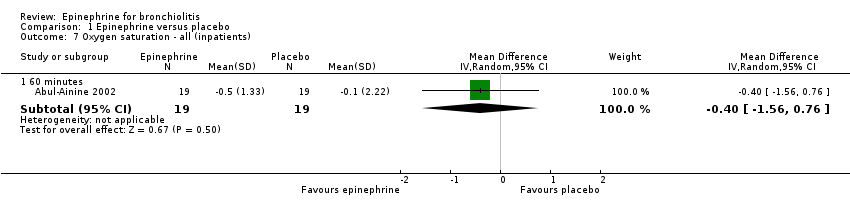
| 7 Oxygen saturation ‐ all (inpatients) Show forest plot | 1 | Mean Difference (IV, Random, 95% CI) | Subtotals only | |
| Analysis 1.7  Comparison 1 Epinephrine versus placebo, Outcome 7 Oxygen saturation ‐ all (inpatients). | ||||
| 7.1 60 minutes | 1 | 38 | Mean Difference (IV, Random, 95% CI) | ‐0.4 [‐1.56, 0.76] |
| 8 Respiratory rate ‐ all (outpatients) Show forest plot | 3 | Mean Difference (IV, Random, 95% CI) | Subtotals only | |
| Analysis 1.8  Comparison 1 Epinephrine versus placebo, Outcome 8 Respiratory rate ‐ all (outpatients). | ||||
| 8.1 60 minutes | 3 | 844 | Mean Difference (IV, Random, 95% CI) | ‐3.22 [‐7.10, 0.65] |
| 9 Respiratory rate ‐ all (inpatients) Show forest plot | 1 | Mean Difference (IV, Random, 95% CI) | Subtotals only | |
| Analysis 1.9  Comparison 1 Epinephrine versus placebo, Outcome 9 Respiratory rate ‐ all (inpatients). | ||||
| 9.1 60 minutes | 1 | 38 | Mean Difference (IV, Random, 95% CI) | 2.80 [‐2.97, 8.57] |
| 10 Heart rate ‐ all (outpatients) Show forest plot | 4 | Mean Difference (IV, Random, 95% CI) | Subtotals only | |
| Analysis 1.10  Comparison 1 Epinephrine versus placebo, Outcome 10 Heart rate ‐ all (outpatients). | ||||
| 10.1 60 minutes | 4 | 901 | Mean Difference (IV, Random, 95% CI) | 7.85 [5.63, 10.06] |
| 10.2 120 minutes | 2 | 105 | Mean Difference (IV, Random, 95% CI) | 1.76 [‐5.96, 9.47] |
| 11 Heart rate ‐ all (inpatients) Show forest plot | 2 | Mean Difference (IV, Random, 95% CI) | Subtotals only | |
| Analysis 1.11  Comparison 1 Epinephrine versus placebo, Outcome 11 Heart rate ‐ all (inpatients). | ||||
| 11.1 60 minutes | 2 | 225 | Mean Difference (IV, Random, 95% CI) | 13.06 [1.19, 24.92] |
| 12 Hospital readmissions (inpatients) Show forest plot | 2 | 292 | Risk Ratio (M‐H, Random, 95% CI) | 0.29 [0.05, 1.86] |
| Analysis 1.12  Comparison 1 Epinephrine versus placebo, Outcome 12 Hospital readmissions (inpatients). | ||||
| 12.1 2 to 10 days | 1 | 98 | Risk Ratio (M‐H, Random, 95% CI) | 0.14 [0.01, 2.59] |
| 12.2 10 to 30 days | 1 | 194 | Risk Ratio (M‐H, Random, 95% CI) | 0.48 [0.04, 5.20] |
| 13 Return visits (ED or any healthcare provider) ‐ (outpatients) Show forest plot | 2 | 800 | Risk Ratio (M‐H, Random, 95% CI) | 0.98 [0.81, 1.19] |
| Analysis 1.13  Comparison 1 Epinephrine versus placebo, Outcome 13 Return visits (ED or any healthcare provider) ‐ (outpatients). | ||||
| 13.1 10 to 30 days | 2 | 800 | Risk Ratio (M‐H, Random, 95% CI) | 0.98 [0.81, 1.19] |
| 14 Return visits (ED or any healthcare provider) ‐ (inpatients) Show forest plot | 1 | 98 | Risk Ratio (M‐H, Random, 95% CI) | 1.02 [0.76, 1.39] |
| Analysis 1.14  Comparison 1 Epinephrine versus placebo, Outcome 14 Return visits (ED or any healthcare provider) ‐ (inpatients). | ||||
| 14.1 2 to 10 days | 1 | 98 | Risk Ratio (M‐H, Random, 95% CI) | 1.02 [0.76, 1.39] |
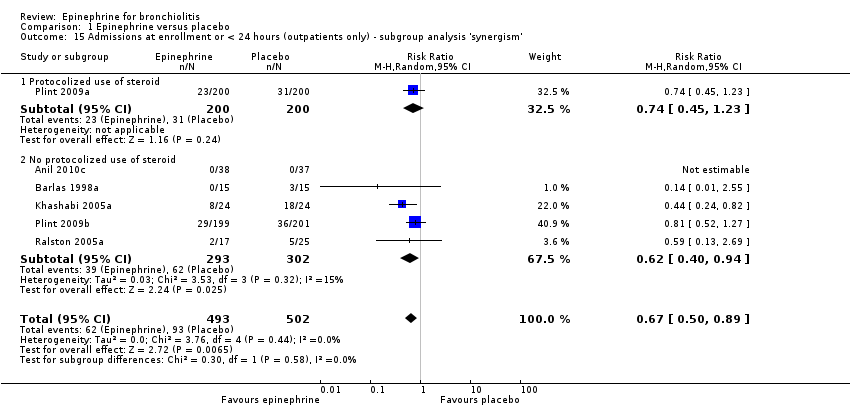
| 15 Admissions at enrollment or < 24 hours (outpatients only) ‐ subgroup analysis 'synergism' Show forest plot | 6 | 995 | Risk Ratio (M‐H, Random, 95% CI) | 0.67 [0.50, 0.89] |
| Analysis 1.15  Comparison 1 Epinephrine versus placebo, Outcome 15 Admissions at enrollment or < 24 hours (outpatients only) ‐ subgroup analysis 'synergism'. | ||||
| 15.1 Protocolized use of steroid | 1 | 400 | Risk Ratio (M‐H, Random, 95% CI) | 0.74 [0.45, 1.23] |
| 15.2 No protocolized use of steroid | 5 | 595 | Risk Ratio (M‐H, Random, 95% CI) | 0.62 [0.40, 0.94] |
| 16 Admissions at enrollment or < 24 hours (outpatients only) only low overall RoB Show forest plot | 3 | 842 | Risk Ratio (M‐H, Random, 95% CI) | 0.77 [0.56, 1.07] |
| Analysis 1.16  Comparison 1 Epinephrine versus placebo, Outcome 16 Admissions at enrollment or < 24 hours (outpatients only) only low overall RoB. | ||||
| 17 Admissions overall up to 7 days (outpatients only) ‐ subgroup analysis 'synergism' Show forest plot | 2 | 800 | Risk Ratio (M‐H, Random, 95% CI) | 0.78 [0.59, 1.05] |
| Analysis 1.17  Comparison 1 Epinephrine versus placebo, Outcome 17 Admissions overall up to 7 days (outpatients only) ‐ subgroup analysis 'synergism'. | ||||
| 17.1 Protocolized use of steroid | 1 | 400 | Risk Ratio (M‐H, Random, 95% CI) | 0.67 [0.45, 0.98] |
| 17.2 No protocolized use of steroid | 1 | 400 | Risk Ratio (M‐H, Random, 95% CI) | 0.90 [0.64, 1.26] |
| 18 Length of stay (inpatients only) only low overall RoB Show forest plot | 1 | 98 | Mean Difference (IV, Random, 95% CI) | ‐0.15 [‐1.05, 0.76] |
| Analysis 1.18  Comparison 1 Epinephrine versus placebo, Outcome 18 Length of stay (inpatients only) only low overall RoB. | ||||
| 19 Clinical score ‐ all (outpatients) only low RoB Show forest plot | 2 | Std. Mean Difference (IV, Random, 95% CI) | Subtotals only | |
| Analysis 1.19  Comparison 1 Epinephrine versus placebo, Outcome 19 Clinical score ‐ all (outpatients) only low RoB. | ||||
| 19.1 60 minutes | 2 | 796 | Std. Mean Difference (IV, Random, 95% CI) | ‐0.32 [‐0.46, ‐0.18] |
| Outcome or subgroup title | No. of studies | No. of participants | Statistical method | Effect size |
| 1 Admissions at enrollment or < 24 hours (outpatients only) Show forest plot | 9 | 444 | Risk Ratio (M‐H, Random, 95% CI) | 0.67 [0.41, 1.09] |
| Analysis 2.1  Comparison 2 Epinephrine versus salbutamol/albuterol, Outcome 1 Admissions at enrollment or < 24 hours (outpatients only). | ||||
| 2 Admissions overall up to 7 days (outpatients only) Show forest plot | 3 | 212 | Risk Ratio (M‐H, Random, 95% CI) | 1.05 [0.71, 1.54] |
| Analysis 2.2  Comparison 2 Epinephrine versus salbutamol/albuterol, Outcome 2 Admissions overall up to 7 days (outpatients only). | ||||
| 3 Length of stay (inpatients only) Show forest plot | 4 | 261 | Mean Difference (IV, Random, 95% CI) | ‐0.28 [‐0.46, ‐0.09] |
| Analysis 2.3  Comparison 2 Epinephrine versus salbutamol/albuterol, Outcome 3 Length of stay (inpatients only). | ||||
| 4 Length of stay (outpatients only) Show forest plot | 1 | 42 | Mean Difference (IV, Random, 95% CI) | 0.46 [‐0.27, 1.20] |
| Analysis 2.4  Comparison 2 Epinephrine versus salbutamol/albuterol, Outcome 4 Length of stay (outpatients only). | ||||
| 5 Clinical score ‐ all (outpatients) Show forest plot | 10 | Std. Mean Difference (IV, Random, 95% CI) | Subtotals only | |
| Analysis 2.5  Comparison 2 Epinephrine versus salbutamol/albuterol, Outcome 5 Clinical score ‐ all (outpatients). | ||||
| 5.1 60 minutes | 8 | 397 | Std. Mean Difference (IV, Random, 95% CI) | ‐0.12 [‐0.32, 0.08] |
| 5.2 120 minutes | 7 | 356 | Std. Mean Difference (IV, Random, 95% CI) | ‐0.10 [‐0.31, 0.11] |
| 5.3 12 to 24 hours | 2 | 69 | Std. Mean Difference (IV, Random, 95% CI) | ‐0.21 [‐0.86, 0.44] |
| 5.4 3 to 10 days | 2 | 69 | Std. Mean Difference (IV, Random, 95% CI) | ‐0.50 [‐0.98, ‐0.02] |
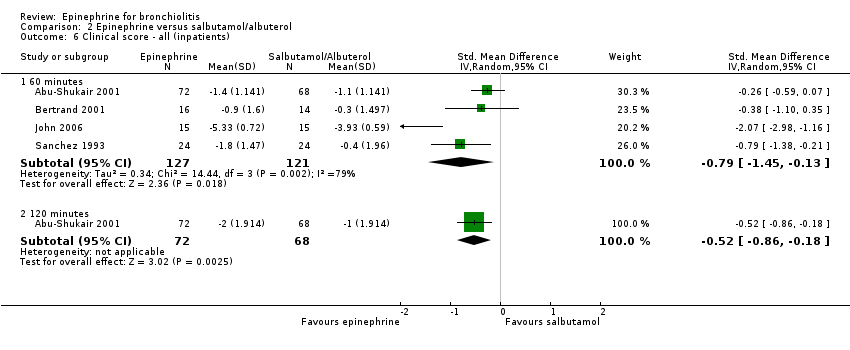
| 6 Clinical score ‐ all (inpatients) Show forest plot | 4 | Std. Mean Difference (IV, Random, 95% CI) | Subtotals only | |
| Analysis 2.6  Comparison 2 Epinephrine versus salbutamol/albuterol, Outcome 6 Clinical score ‐ all (inpatients). | ||||
| 6.1 60 minutes | 4 | 248 | Std. Mean Difference (IV, Random, 95% CI) | ‐0.79 [‐1.45, ‐0.13] |
| 6.2 120 minutes | 1 | 140 | Std. Mean Difference (IV, Random, 95% CI) | ‐0.52 [‐0.86, ‐0.18] |
| 7 Oxygen saturation ‐ all (outpatients) Show forest plot | 6 | Mean Difference (IV, Random, 95% CI) | Subtotals only | |
| Analysis 2.7  Comparison 2 Epinephrine versus salbutamol/albuterol, Outcome 7 Oxygen saturation ‐ all (outpatients). | ||||
| 7.1 60 minutes | 6 | 335 | Mean Difference (IV, Random, 95% CI) | ‐0.37 [‐1.18, 0.43] |
| 7.2 120 minutes | 5 | 287 | Mean Difference (IV, Random, 95% CI) | ‐0.14 [‐0.63, 0.34] |
| 8 Oxygen saturation ‐ all (inpatients) Show forest plot | 3 | Mean Difference (IV, Random, 95% CI) | Subtotals only | |
| Analysis 2.8  Comparison 2 Epinephrine versus salbutamol/albuterol, Outcome 8 Oxygen saturation ‐ all (inpatients). | ||||
| 8.1 60 minutes | 3 | 218 | Mean Difference (IV, Random, 95% CI) | 1.32 [0.51, 2.12] |
| 8.2 120 minutes | 1 | 140 | Mean Difference (IV, Random, 95% CI) | 1.5 [‐0.22, 3.22] |
| 9 Respiratory rate ‐ all (outpatients) Show forest plot | 6 | Mean Difference (IV, Random, 95% CI) | Subtotals only | |
| Analysis 2.9  Comparison 2 Epinephrine versus salbutamol/albuterol, Outcome 9 Respiratory rate ‐ all (outpatients). | ||||
| 9.1 60 minutes | 4 | 183 | Mean Difference (IV, Random, 95% CI) | ‐3.75 [‐7.43, ‐0.08] |
| 9.2 120 minutes | 4 | 177 | Mean Difference (IV, Random, 95% CI) | ‐2.59 [‐6.08, 0.89] |
| 9.3 12 to 24 hours | 2 | 69 | Mean Difference (IV, Random, 95% CI) | ‐3.44 [‐10.64, 3.76] |
| 9.4 > 24 hours | 2 | 69 | Mean Difference (IV, Random, 95% CI) | ‐6.88 [‐11.05, ‐2.71] |
| 10 Respiratory rate ‐ all (inpatients) Show forest plot | 3 | Mean Difference (IV, Random, 95% CI) | Subtotals only | |
| Analysis 2.10  Comparison 2 Epinephrine versus salbutamol/albuterol, Outcome 10 Respiratory rate ‐ all (inpatients). | ||||
| 10.1 60 minutes | 3 | 218 | Mean Difference (IV, Random, 95% CI) | ‐5.20 [‐8.33, ‐2.07] |
| 10.2 120 minutes | 1 | 140 | Mean Difference (IV, Random, 95% CI) | 1.0 [‐4.30, 6.30] |
| 11 Heart rate ‐ all (outpatients) Show forest plot | 7 | Mean Difference (IV, Random, 95% CI) | Subtotals only | |
| Analysis 2.11  Comparison 2 Epinephrine versus salbutamol/albuterol, Outcome 11 Heart rate ‐ all (outpatients). | ||||
| 11.1 60 minutes | 5 | 248 | Mean Difference (IV, Random, 95% CI) | 0.30 [‐3.67, 4.27] |
| 11.2 120 minutes | 6 | 290 | Mean Difference (IV, Random, 95% CI) | 1.35 [‐4.76, 7.45] |
| 11.3 12 to 24 hours | 2 | 69 | Mean Difference (IV, Random, 95% CI) | ‐3.56 [‐16.58, 9.47] |
| 11.4 3 to 10 days | 2 | 69 | Mean Difference (IV, Random, 95% CI) | ‐3.97 [‐13.85, 5.91] |
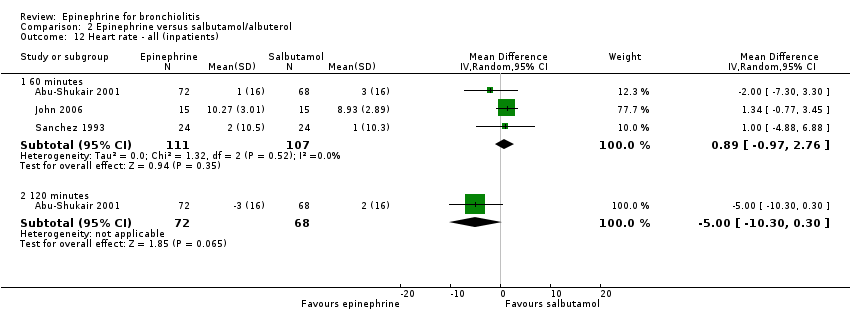
| 12 Heart rate ‐ all (inpatients) Show forest plot | 3 | Mean Difference (IV, Random, 95% CI) | Subtotals only | |
| Analysis 2.12  Comparison 2 Epinephrine versus salbutamol/albuterol, Outcome 12 Heart rate ‐ all (inpatients). | ||||
| 12.1 60 minutes | 3 | 218 | Mean Difference (IV, Random, 95% CI) | 0.89 [‐0.97, 2.76] |
| 12.2 120 minutes | 1 | 140 | Mean Difference (IV, Random, 95% CI) | ‐5.0 [‐10.30, 0.30] |
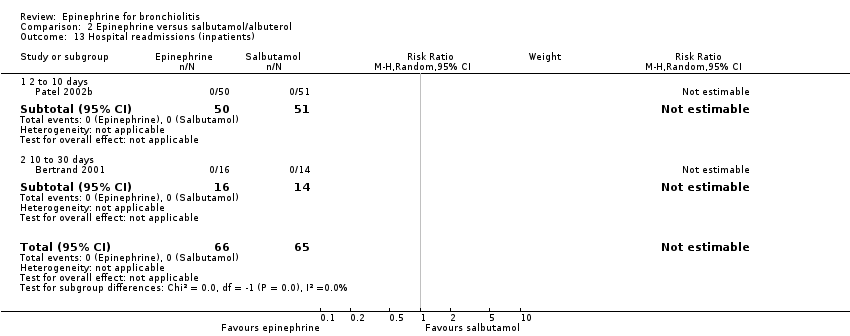
| 13 Hospital readmissions (inpatients) Show forest plot | 2 | 131 | Risk Ratio (M‐H, Random, 95% CI) | 0.0 [0.0, 0.0] |
| Analysis 2.13  Comparison 2 Epinephrine versus salbutamol/albuterol, Outcome 13 Hospital readmissions (inpatients). | ||||
| 13.1 2 to 10 days | 1 | 101 | Risk Ratio (M‐H, Random, 95% CI) | 0.0 [0.0, 0.0] |
| 13.2 10 to 30 days | 1 | 30 | Risk Ratio (M‐H, Random, 95% CI) | 0.0 [0.0, 0.0] |
| 14 Return visits (ED or any healthcare provider) ‐ (outpatients) Show forest plot | 2 | 76 | Risk Ratio (M‐H, Random, 95% CI) | 0.82 [0.28, 2.42] |
| Analysis 2.14  Comparison 2 Epinephrine versus salbutamol/albuterol, Outcome 14 Return visits (ED or any healthcare provider) ‐ (outpatients). | ||||
| 14.1 2 to 10 days | 1 | 41 | Risk Ratio (M‐H, Random, 95% CI) | 1.05 [0.30, 3.64] |
| 14.2 10 to 30 days | 1 | 35 | Risk Ratio (M‐H, Random, 95% CI) | 0.40 [0.05, 3.44] |
| 15 Return visits (ED or any healthcare provider) ‐ (inpatients) Show forest plot | 1 | 101 | Risk Ratio (M‐H, Random, 95% CI) | 1.17 [0.84, 1.61] |
| Analysis 2.15  Comparison 2 Epinephrine versus salbutamol/albuterol, Outcome 15 Return visits (ED or any healthcare provider) ‐ (inpatients). | ||||
| 15.1 10 to 30 days | 1 | 101 | Risk Ratio (M‐H, Random, 95% CI) | 1.17 [0.84, 1.61] |
| 16 Length of stay (inpatients only) only low RoB overall Show forest plot | 1 | 101 | Mean Difference (IV, Random, 95% CI) | ‐0.07 [‐1.01, 0.88] |
| Analysis 2.16  Comparison 2 Epinephrine versus salbutamol/albuterol, Outcome 16 Length of stay (inpatients only) only low RoB overall. | ||||
| 17 Admissions at enrollment or < 24 hours (outpatients only) only low RoB overall Show forest plot | 3 | 148 | Risk Ratio (M‐H, Random, 95% CI) | 0.66 [0.28, 1.56] |
| Analysis 2.17  Comparison 2 Epinephrine versus salbutamol/albuterol, Outcome 17 Admissions at enrollment or < 24 hours (outpatients only) only low RoB overall. | ||||
| 18 Clinical score ‐ all (outpatients) only low RoB Show forest plot | 3 | Std. Mean Difference (IV, Random, 95% CI) | Subtotals only | |
| Analysis 2.18  Comparison 2 Epinephrine versus salbutamol/albuterol, Outcome 18 Clinical score ‐ all (outpatients) only low RoB. | ||||
| 18.1 60 minutes | 3 | 135 | Std. Mean Difference (IV, Random, 95% CI) | ‐0.23 [‐0.57, 0.11] |
| 18.2 120 minutes | 2 | 108 | Std. Mean Difference (IV, Random, 95% CI) | ‐0.11 [‐0.64, 0.42] |
| Outcome or subgroup title | No. of studies | No. of participants | Statistical method | Effect size |
| 1 Admissions (outpatients only) Show forest plot | 2 | 444 | Risk Ratio (M‐H, Random, 95% CI) | 1.12 [0.66, 1.88] |
| Analysis 3.1  Comparison 3 Epinephrine versus steroid, Outcome 1 Admissions (outpatients only). | ||||
| 2 Admissions overall up to 7 days (outpatients only) Show forest plot | 1 | 399 | Risk Ratio (M‐H, Random, 95% CI) | 1.08 [0.77, 1.52] |
| Analysis 3.2  Comparison 3 Epinephrine versus steroid, Outcome 2 Admissions overall up to 7 days (outpatients only). | ||||
| 3 Clinical score ‐ all (outpatients) Show forest plot | 2 | Std. Mean Difference (IV, Random, 95% CI) | Subtotals only | |
| Analysis 3.3  Comparison 3 Epinephrine versus steroid, Outcome 3 Clinical score ‐ all (outpatients). | ||||
| 3.1 60 minutes | 2 | 442 | Std. Mean Difference (IV, Random, 95% CI) | 0.31 [0.12, 0.50] |
| 3.2 120 minutes | 1 | 45 | Std. Mean Difference (IV, Random, 95% CI) | 0.35 [‐0.27, 0.98] |
| 3.3 3 to 6 hours | 1 | 45 | Std. Mean Difference (IV, Random, 95% CI) | 0.42 [‐0.20, 1.05] |
| 4 Oxygen saturation ‐ all (outpatients) Show forest plot | 2 | Mean Difference (IV, Random, 95% CI) | Subtotals only | |
| Analysis 3.4  Comparison 3 Epinephrine versus steroid, Outcome 4 Oxygen saturation ‐ all (outpatients). | ||||
| 4.1 60 minutes | 2 | 442 | Mean Difference (IV, Random, 95% CI) | ‐0.99 [‐1.46, ‐0.52] |
| 4.2 120 minutes | 1 | 45 | Mean Difference (IV, Random, 95% CI) | ‐0.07 [‐1.07, 0.94] |
| 4.3 3 to 6 hours | 1 | 45 | Mean Difference (IV, Random, 95% CI) | ‐0.58 [‐1.74, 0.57] |
| 5 Respiratory rate ‐ all (outpatients) Show forest plot | 1 | Mean Difference (IV, Random, 95% CI) | Subtotals only | |
| Analysis 3.5  Comparison 3 Epinephrine versus steroid, Outcome 5 Respiratory rate ‐ all (outpatients). | ||||
| 5.1 60 minutes | 1 | 397 | Mean Difference (IV, Random, 95% CI) | 0.38 [‐1.44, 2.20] |
| 6 Heart rate ‐ all (outpatients) Show forest plot | 2 | Mean Difference (IV, Random, 95% CI) | Subtotals only | |
| Analysis 3.6  Comparison 3 Epinephrine versus steroid, Outcome 6 Heart rate ‐ all (outpatients). | ||||
| 6.1 60 minutes | 2 | 442 | Mean Difference (IV, Random, 95% CI) | ‐7.56 [‐11.34, ‐3.79] |
| 6.2 120 minutes | 1 | 45 | Mean Difference (IV, Random, 95% CI) | 0.44 [‐7.59, 8.47] |
| 6.3 3 to 6 hours | 1 | 45 | Mean Difference (IV, Random, 95% CI) | ‐0.20 [‐8.09, 7.69] |
| 7 Return visits (ED or any healthcare provider) (outpatients) Show forest plot | 1 | 399 | Risk Ratio (M‐H, Random, 95% CI) | 1.13 [0.93, 1.38] |
| Analysis 3.7  Comparison 3 Epinephrine versus steroid, Outcome 7 Return visits (ED or any healthcare provider) (outpatients). | ||||
| 7.1 10 to 30 days | 1 | 399 | Risk Ratio (M‐H, Random, 95% CI) | 1.13 [0.93, 1.38] |
| Outcome or subgroup title | No. of studies | No. of participants | Statistical method | Effect size |
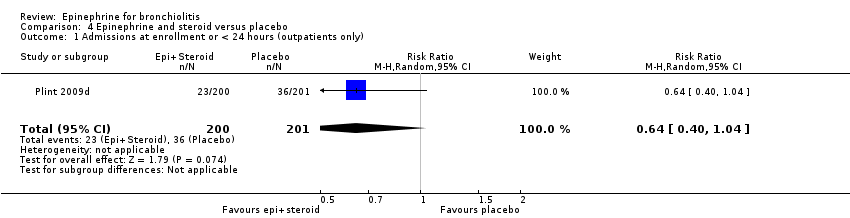
| 1 Admissions at enrollment or < 24 hours (outpatients only) Show forest plot | 1 | 401 | Risk Ratio (M‐H, Random, 95% CI) | 0.64 [0.40, 1.04] |
| Analysis 4.1  Comparison 4 Epinephrine and steroid versus placebo, Outcome 1 Admissions at enrollment or < 24 hours (outpatients only). | ||||
| 2 Admissions overall up to 7 days (outpatients only) Show forest plot | 1 | 400 | Risk Ratio (M‐H, Random, 95% CI) | 0.65 [0.44, 0.95] |
| Analysis 4.2  Comparison 4 Epinephrine and steroid versus placebo, Outcome 2 Admissions overall up to 7 days (outpatients only). | ||||
| 3 Clinical score (outpatients only) Show forest plot | 1 | Std. Mean Difference (IV, Random, 95% CI) | Subtotals only | |
| Analysis 4.3  Comparison 4 Epinephrine and steroid versus placebo, Outcome 3 Clinical score (outpatients only). | ||||
| 3.1 60 minutes | 1 | 399 | Std. Mean Difference (IV, Random, 95% CI) | ‐0.34 [‐0.54, ‐0.14] |
| 4 Oxygen saturation (outpatients only) Show forest plot | 1 | Mean Difference (IV, Random, 95% CI) | Subtotals only | |
| Analysis 4.4  Comparison 4 Epinephrine and steroid versus placebo, Outcome 4 Oxygen saturation (outpatients only). | ||||
| 4.1 60 minutes | 1 | 399 | Mean Difference (IV, Random, 95% CI) | 0.04 [‐0.53, 0.61] |
| 5 Respiratory rate (outpatients only) Show forest plot | 1 | Mean Difference (IV, Random, 95% CI) | Subtotals only | |
| Analysis 4.5  Comparison 4 Epinephrine and steroid versus placebo, Outcome 5 Respiratory rate (outpatients only). | ||||
| 5.1 60 minutes | 1 | 399 | Mean Difference (IV, Random, 95% CI) | ‐1.16 [‐3.06, 0.74] |
| 6 Heart rate (outpatients only) Show forest plot | 1 | Mean Difference (IV, Random, 95% CI) | Subtotals only | |
| Analysis 4.6  Comparison 4 Epinephrine and steroid versus placebo, Outcome 6 Heart rate (outpatients only). | ||||
| 6.1 60 minutes | 1 | 399 | Mean Difference (IV, Random, 95% CI) | 8.44 [4.85, 12.03] |
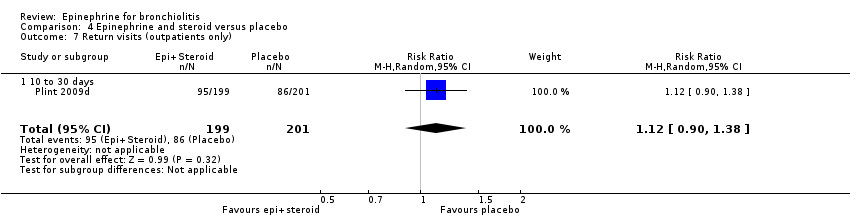
| 7 Return visits (outpatients only) Show forest plot | 1 | 400 | Risk Ratio (M‐H, Random, 95% CI) | 1.12 [0.90, 1.38] |
| Analysis 4.7  Comparison 4 Epinephrine and steroid versus placebo, Outcome 7 Return visits (outpatients only). | ||||
| 7.1 10 to 30 days | 1 | 400 | Risk Ratio (M‐H, Random, 95% CI) | 1.12 [0.90, 1.38] |
| Outcome or subgroup title | No. of studies | No. of participants | Statistical method | Effect size |
| 1 Clinical score ‐ all scores (inpatients) Show forest plot | 1 | Std. Mean Difference (IV, Random, 95% CI) | Subtotals only | |
| Analysis 5.1  Comparison 5 Epinephrine and steroid versus salbutamol, Outcome 1 Clinical score ‐ all scores (inpatients). | ||||
| 1.1 120 minutes | 1 | 35 | Std. Mean Difference (IV, Random, 95% CI) | ‐0.17 [‐0.87, 0.52] |
| 1.2 12 to 24 hours | 1 | 35 | Std. Mean Difference (IV, Random, 95% CI) | 0.0 [‐0.70, 0.70] |
| 1.3 3 to 10 days | 1 | 35 | Std. Mean Difference (IV, Random, 95% CI) | ‐1.22 [‐1.98, ‐0.46] |
| 2 Respiratory rate ‐ all (inpatients) Show forest plot | 1 | Mean Difference (IV, Random, 95% CI) | Subtotals only | |
| Analysis 5.2  Comparison 5 Epinephrine and steroid versus salbutamol, Outcome 2 Respiratory rate ‐ all (inpatients). | ||||
| 2.1 120 minutes | 1 | 35 | Mean Difference (IV, Random, 95% CI) | ‐3.10 [‐9.51, 3.31] |
| 2.2 12 to 24 hours | 1 | 35 | Mean Difference (IV, Random, 95% CI) | ‐2.80 [‐9.96, 4.36] |
| 2.3 > 24 hours | 1 | 35 | Mean Difference (IV, Random, 95% CI) | ‐13.70 [‐20.56, ‐6.84] |
| 3 Heart rate ‐ all (inpatients) Show forest plot | 1 | Mean Difference (IV, Random, 95% CI) | Subtotals only | |
| Analysis 5.3  Comparison 5 Epinephrine and steroid versus salbutamol, Outcome 3 Heart rate ‐ all (inpatients). | ||||
| 3.1 120 minutes | 1 | 35 | Mean Difference (IV, Random, 95% CI) | ‐3.20 [‐12.20, 5.80] |
| 3.2 24 to 72 hours | 1 | 35 | Mean Difference (IV, Random, 95% CI) | ‐1.40 [‐9.36, 6.56] |
| 3.3 3 to 10 days | 1 | 35 | Mean Difference (IV, Random, 95% CI) | ‐6.30 [‐14.21, 1.61] |
| Outcome or subgroup title | No. of studies | No. of participants | Statistical method | Effect size |
| 1 Clinical score (inpatients) Show forest plot | 1 | Std. Mean Difference (IV, Random, 95% CI) | Subtotals only | |
| Analysis 6.1  Comparison 6 Epinephrine versus salbutamol and ipratropium bromide, Outcome 1 Clinical score (inpatients). | ||||
| 1.1 6 to 12 hours | 1 | 60 | Std. Mean Difference (IV, Random, 95% CI) | ‐0.60 [‐1.12, ‐0.09] |
| 2 Oxygen saturation (inpatients) Show forest plot | 1 | Mean Difference (IV, Random, 95% CI) | Subtotals only | |
| Analysis 6.2  Comparison 6 Epinephrine versus salbutamol and ipratropium bromide, Outcome 2 Oxygen saturation (inpatients). | ||||
| 2.1 6 to 12 hours | 1 | 60 | Mean Difference (IV, Random, 95% CI) | 0.37 [‐0.82, 1.56] |

Flow of citations through the search and screening procedures, studies included in the review, and comparisons addressed

Risk of bias graph: review authors' judgements about each risk of bias item presented as percentages across all included studies.

Risk of bias summary: review authors' judgements about each risk of bias item for each included study.

Comparison 1 Epinephrine versus placebo, Outcome 1 Admissions at enrollment or < 24 hours (outpatients only).

Comparison 1 Epinephrine versus placebo, Outcome 2 Admissions overall up to 7 days (outpatients only).

Comparison 1 Epinephrine versus placebo, Outcome 3 Length of stay (inpatients only).
Comparison 1 Epinephrine versus placebo, Outcome 4 Clinical score ‐ all (outpatients).
Comparison 1 Epinephrine versus placebo, Outcome 5 Clinical score ‐ all (inpatients).

Comparison 1 Epinephrine versus placebo, Outcome 6 Oxygen saturation ‐ all (outpatients).
Comparison 1 Epinephrine versus placebo, Outcome 7 Oxygen saturation ‐ all (inpatients).

Comparison 1 Epinephrine versus placebo, Outcome 8 Respiratory rate ‐ all (outpatients).

Comparison 1 Epinephrine versus placebo, Outcome 9 Respiratory rate ‐ all (inpatients).

Comparison 1 Epinephrine versus placebo, Outcome 10 Heart rate ‐ all (outpatients).

Comparison 1 Epinephrine versus placebo, Outcome 11 Heart rate ‐ all (inpatients).

Comparison 1 Epinephrine versus placebo, Outcome 12 Hospital readmissions (inpatients).

Comparison 1 Epinephrine versus placebo, Outcome 13 Return visits (ED or any healthcare provider) ‐ (outpatients).

Comparison 1 Epinephrine versus placebo, Outcome 14 Return visits (ED or any healthcare provider) ‐ (inpatients).
Comparison 1 Epinephrine versus placebo, Outcome 15 Admissions at enrollment or < 24 hours (outpatients only) ‐ subgroup analysis 'synergism'.

Comparison 1 Epinephrine versus placebo, Outcome 16 Admissions at enrollment or < 24 hours (outpatients only) only low overall RoB.

Comparison 1 Epinephrine versus placebo, Outcome 17 Admissions overall up to 7 days (outpatients only) ‐ subgroup analysis 'synergism'.

Comparison 1 Epinephrine versus placebo, Outcome 18 Length of stay (inpatients only) only low overall RoB.

Comparison 1 Epinephrine versus placebo, Outcome 19 Clinical score ‐ all (outpatients) only low RoB.

Comparison 2 Epinephrine versus salbutamol/albuterol, Outcome 1 Admissions at enrollment or < 24 hours (outpatients only).

Comparison 2 Epinephrine versus salbutamol/albuterol, Outcome 2 Admissions overall up to 7 days (outpatients only).

Comparison 2 Epinephrine versus salbutamol/albuterol, Outcome 3 Length of stay (inpatients only).

Comparison 2 Epinephrine versus salbutamol/albuterol, Outcome 4 Length of stay (outpatients only).

Comparison 2 Epinephrine versus salbutamol/albuterol, Outcome 5 Clinical score ‐ all (outpatients).
Comparison 2 Epinephrine versus salbutamol/albuterol, Outcome 6 Clinical score ‐ all (inpatients).

Comparison 2 Epinephrine versus salbutamol/albuterol, Outcome 7 Oxygen saturation ‐ all (outpatients).

Comparison 2 Epinephrine versus salbutamol/albuterol, Outcome 8 Oxygen saturation ‐ all (inpatients).

Comparison 2 Epinephrine versus salbutamol/albuterol, Outcome 9 Respiratory rate ‐ all (outpatients).

Comparison 2 Epinephrine versus salbutamol/albuterol, Outcome 10 Respiratory rate ‐ all (inpatients).

Comparison 2 Epinephrine versus salbutamol/albuterol, Outcome 11 Heart rate ‐ all (outpatients).
Comparison 2 Epinephrine versus salbutamol/albuterol, Outcome 12 Heart rate ‐ all (inpatients).
Comparison 2 Epinephrine versus salbutamol/albuterol, Outcome 13 Hospital readmissions (inpatients).

Comparison 2 Epinephrine versus salbutamol/albuterol, Outcome 14 Return visits (ED or any healthcare provider) ‐ (outpatients).

Comparison 2 Epinephrine versus salbutamol/albuterol, Outcome 15 Return visits (ED or any healthcare provider) ‐ (inpatients).

Comparison 2 Epinephrine versus salbutamol/albuterol, Outcome 16 Length of stay (inpatients only) only low RoB overall.

Comparison 2 Epinephrine versus salbutamol/albuterol, Outcome 17 Admissions at enrollment or < 24 hours (outpatients only) only low RoB overall.

Comparison 2 Epinephrine versus salbutamol/albuterol, Outcome 18 Clinical score ‐ all (outpatients) only low RoB.

Comparison 3 Epinephrine versus steroid, Outcome 1 Admissions (outpatients only).

Comparison 3 Epinephrine versus steroid, Outcome 2 Admissions overall up to 7 days (outpatients only).

Comparison 3 Epinephrine versus steroid, Outcome 3 Clinical score ‐ all (outpatients).

Comparison 3 Epinephrine versus steroid, Outcome 4 Oxygen saturation ‐ all (outpatients).

Comparison 3 Epinephrine versus steroid, Outcome 5 Respiratory rate ‐ all (outpatients).

Comparison 3 Epinephrine versus steroid, Outcome 6 Heart rate ‐ all (outpatients).

Comparison 3 Epinephrine versus steroid, Outcome 7 Return visits (ED or any healthcare provider) (outpatients).
Comparison 4 Epinephrine and steroid versus placebo, Outcome 1 Admissions at enrollment or < 24 hours (outpatients only).

Comparison 4 Epinephrine and steroid versus placebo, Outcome 2 Admissions overall up to 7 days (outpatients only).

Comparison 4 Epinephrine and steroid versus placebo, Outcome 3 Clinical score (outpatients only).

Comparison 4 Epinephrine and steroid versus placebo, Outcome 4 Oxygen saturation (outpatients only).

Comparison 4 Epinephrine and steroid versus placebo, Outcome 5 Respiratory rate (outpatients only).

Comparison 4 Epinephrine and steroid versus placebo, Outcome 6 Heart rate (outpatients only).
Comparison 4 Epinephrine and steroid versus placebo, Outcome 7 Return visits (outpatients only).

Comparison 5 Epinephrine and steroid versus salbutamol, Outcome 1 Clinical score ‐ all scores (inpatients).

Comparison 5 Epinephrine and steroid versus salbutamol, Outcome 2 Respiratory rate ‐ all (inpatients).

Comparison 5 Epinephrine and steroid versus salbutamol, Outcome 3 Heart rate ‐ all (inpatients).

Comparison 6 Epinephrine versus salbutamol and ipratropium bromide, Outcome 1 Clinical score (inpatients).

Comparison 6 Epinephrine versus salbutamol and ipratropium bromide, Outcome 2 Oxygen saturation (inpatients).
| Epinephrine versus placebo for acute viral bronchiolitis | ||||||
| Patient or population: patients with acute viral bronchiolitis | ||||||
| Outcomes | Illustrative comparative risks* (95% CI) | Relative effect | No. of participants | Quality of the evidence | Comments | |
| Assumed risk | Corresponding risk | |||||
| Control | Epinephrine versus placebo | |||||
| Admissions at enrollment or < 24 hours (outpatients only) | Study population | RR 0.67 | 995 | ⊕⊕⊕⊝ | ||
| 185 per 1000 | 124 per 1000 | |||||
| Medium‐risk population | ||||||
| 190 per 1000 | 127 per 1000 | |||||
| Admissions overall up to 7 days (outpatients only) | Study population | RR 0.81 | 875 | ⊕⊕⊝⊝ | ||
| 251 per 1000 | 203 per 1000 | |||||
| Medium‐risk population | ||||||
| 255 per 1000 | 207 per 1000 | |||||
| Length of stay (inpatients only) | The mean length of stay (inpatients only) in the intervention groups was | 292 | ⊕⊕⊕⊝ | |||
| *The basis for the assumed risk (e.g. the median control group risk across studies) is provided in footnotes. The corresponding risk (and its 95% confidence interval) is based on the assumed risk in the comparison group and the relative effect of the intervention (and its 95% CI). | ||||||
| GRADE Working Group grades of evidence | ||||||
| Epinephrine versus salbutamol/albuterol for acute viral bronchiolitis | ||||||
| Patient or population: patients with acute viral bronchiolitis | ||||||
| Outcomes | Illustrative comparative risks* (95% CI) | Relative effect | No. of participants | Quality of the evidence | Comments | |
| Assumed risk | Corresponding risk | |||||
| Control | Epinephrine versus salbutamol/albuterol | |||||
| Admissions at enrollment or < 24 hours (outpatients only) | Study population | RR 0.67 | 444 | ⊕⊕⊕⊝ | ||
| 225 per 1000 | 151 per 1000 | |||||
| Medium‐risk population | ||||||
| 133 per 1000 | 89 per 1000 | |||||
| Admissions overall up to 7 days (outpatients only) | Study population | RR 1.05 | 212 | ⊕⊕⊕⊝ | ||
| 262 per 1000 | 275 per 1000 | |||||
| Medium‐risk population | ||||||
| 167 per 1000 | 175 per 1000 | |||||
| Length of stay (inpatients only) | The mean length of stay (inpatients only) in the intervention groups was | 261 | ⊕⊕⊕⊝ | |||
| *The basis for the assumed risk (e.g. the median control group risk across studies) is provided in footnotes. The corresponding risk (and its 95% confidence interval) is based on the assumed risk in the comparison group and the relative effect of the intervention (and its 95% CI). | ||||||
| GRADE Working Group grades of evidence | ||||||
| Epinephrine and steroid versus placebo for acute viral bronchiolitis | ||||||
| Patient or population: patients with acute viral bronchiolitis | ||||||
| Outcomes | Illustrative comparative risks* (95% CI) | Relative effect | No. of participants | Quality of the evidence | Comments | |
| Assumed risk | Corresponding risk | |||||
| Control | Epinephrine and steroid versus placebo | |||||
| Admissions at enrollment or < 24 hours (outpatients only) | Study population | RR 0.64 | 401 | ⊕⊕⊝⊝ | ||
| 179 per 1000 | 115 per 1000 | |||||
| Medium‐risk population | ||||||
| 179 per 1000 | 115 per 1000 | |||||
| Admissions overall up to 7 days (outpatients only) | Study population | RR 0.64 | 400 | ⊕⊕⊝⊝ | ||
| 264 per 1000 | 169 per 1000 | |||||
| Medium‐risk population | ||||||
| 264 per 1000 | 169 per 1000 | |||||
| *The basis for the assumed risk (e.g. the median control group risk across studies) is provided in footnotes. The corresponding risk (and its 95% confidence interval) is based on the assumed risk in the comparison group and the relative effect of the intervention (and its 95% CI). | ||||||
| GRADE Working Group grades of evidence | ||||||
| Epinephrine versus steroid for acute viral bronchiolitis | ||||||
| Patient or population: patients with acute viral bronchiolitis | ||||||
| Outcomes | Illustrative comparative risks* (95% CI) | Relative effect | No. of participants | Quality of the evidence | Comments | |
| Assumed risk | Corresponding risk | |||||
| Control | Epinephrine versus steroid | |||||
| Admissions (outpatients only) | Study population | RR 1.12 | 444 | ⊕⊕⊕⊝ | ||
| 136 per 1000 | 152 per 1000 | |||||
| Medium‐risk population | ||||||
| 73 per 1000 | 82 per 1000 | |||||
| Admissions overall up to 7 days (outpatients only) | Study population | RR 1.08 | 399 | ⊕⊕⊕⊝ | ||
| 236 per 1000 | 255 per 1000 | |||||
| Medium‐risk population | ||||||
| 236 per 1000 | 255 per 1000 | |||||
| *The basis for the assumed risk (e.g. the median control group risk across studies) is provided in footnotes. The corresponding risk (and its 95% confidence interval) is based on the assumed risk in the comparison group and the relative effect of the intervention (and its 95% CI). | ||||||
| GRADE Working Group grades of evidence | ||||||
| Population | Outcome | Number of studies | Number of participants | GRADE domains | Strength of evidence | Intervention favored | |||
| Risk of bias | Consistency | Directness | Precision | ||||||
| Epinephrine versus placebo | |||||||||
| Inpatient | Length of stay | 2 | 292 | medium | consistent | direct | imprecise | moderate | no difference |
| Clinical score (60 minutes) | 2 | 232 | medium | consistent | direct | imprecise | moderate | no difference | |
| Outpatient | Admissions (Day 1) | 4 | 920 | low | consistent | direct | imprecise | moderate | epinephrine |
| Admissions (up to Day 7) | 1 | 800 | low | unknown | direct | imprecise | low | no difference | |
| Clinical score (60 minutes) | 4 | 900 | low | consistent | direct | precise | high | epinephrine | |
| Clinical score (120 minutes) | 1 | 30 | medium | unknown | direct | imprecise | low | epinephrine | |
| Epinephrine versus salbutamol | |||||||||
| Inpatient | Length of stay | 4 | 261 | medium | consistent | direct | precise | moderate | epinephrine |
| Clinical score (60 minutes) | 4 | 148 | medium | inconsistent | direct | precise | low | epinephrine | |
| Clinical score (120 minutes) | 1 | 140 | medium | unknown | direct | imprecise | low | epinephrine | |
| Outpatient | Admissions (Day 1) | 7 | 444 | low | consistent | direct | imprecise | moderate | no difference |
| Admissions (up to Day 7) | 2 | 212 | low | consistent | direct | imprecise | moderate | no difference | |
| Clinical score (60 minutes) | 7 | 397 | low | consistent | direct | precise | moderate | no difference | |
| Clinical score (120 minutes) | 5 | 356 | low | consistent | direct | precise | moderate | no difference | |
| Clinical score (12 to 24 hours) | 1 | 69 | medium | unknown | direct | imprecise | low | no difference | |
| Clinical score (3 to 10 days) | 1 | 69 | medium | unknown | direct | imprecise | low | epinephrine | |
| Epinephrine + dexamethasone versus placebo | |||||||||
| Outpatient | Admissions (Day 1) | 1 | 401 | low | unknown | direct | imprecise | low | no difference |
| Admissions (up to Day 7) | 1 | 401 | low | unknown | direct | imprecise | low | epinephrine + dexamethasone | |
| Clinical score (60 minutes) | 1 | 399 | low | unknown | direct | precise | moderate | epinephrine + dexamethasone | |
| Epinephrine + dexamethasone versus salbutamol | |||||||||
| Outpatient | Clinical score (120 minutes) | 1 | 35 | medium | unknown | direct | imprecise | low | no difference |
| Clinical score (12 to 24 hours) | 1 | 35 | medium | unknown | direct | imprecise | low | no difference | |
| Clinical score (3 to 10 days) | 1 | 35 | medium | unknown | direct | imprecise | low | epinephrine + dexamethasone | |
| Comparison | Adverse event | Total (N) | Study | Results | Number of events/total (%) | Notes | |
| Epi versus placebo Epi versus salbutamol | Cardiovascular | Arrhythmias | 111 | Ralston 2005 | 1) saline placebo 2) racemic albuterol sulfate 3) racemic epi | 0/25 (0) 2/23 (9) 0/17 (0) | tachycardia |
| Bertrand 2001 | 1) salbutamol 2) epi | NR 0/16 (0) | tachycardia | ||||
| John 2006 | 1) epi 2) salbutamol | 0/15 (0) 0/15 (0) | tachyarrhythmia | ||||
| Hypertension / others | 54 | Bertrand 2001 | 1) salbutamol 2) epi | NR 0/16 (0) | hypertension | ||
| Abul‐Ainine 2002 | 1) levo‐adrenaline 2) saline placebo | 0/19 (0) 0/19 (0) | vomiting, pallor, tremor, arrhythmia | ||||
| General | Tremor | 981 | Anil 2010 | 1) epi + 0.9% saline 2) epi + 3% saline 3) salbutamol + 0.9% saline 4) salbutamol + 3% saline | 0/38 (0) 0/39 (0) 0/36 (0) 0/36 (0) | ||
| Kuyucu 2004 | 1) epi + dex 2) salbutamol + dex 3) epi + placebo 4) salbutamol + placebo | 0/23 (0) 0/23 (0) 0/11 (0) 0/12 (0) | |||||
| Plint 2009 | 1) epi + dex 2) epi + placebo 3) placebo + dex 4) placebo + placebo | 4/200 (2) 4/199 (2) 5/200 (2.5) 2/201 (1) | |||||
| Mull 2004 | 1) racemic epi 2) albuterol sulfate | 0/34 (0) 0/32 (0) | |||||
| Bertrand 2001 | 1) salbutamol 2) epi | NR 0/16 (0) | |||||
| John 2006 | 1) epi 2) salbutamol | 0/15 (0) 0/15 (0) | |||||
| Pallor / flushing | 965 | Kuyucu 2004 | 1) epi + dex 2) salbutamol + dex 3) epi + placebo 4) salbutamol + placebo | 0/23 (0) 0/23 (0) 0/11 (0) 0/12 (0) | |||
| Plint 2009 | 1) epi + dex 2) epi + placebo 3) placebo + dex 4) placebo + placebo | 23/200 (11.5) 22/199 (11.1) 15/200 (7.5) 16/201 (8) | |||||
| John 2006 | 1) epi 2) salbutamol | 0/15 (0) 0/15 (0) | |||||
| Mull 2004 | 1) racemic epi 2) albuterol sulfate | 1/34 (3) 0/32 (0) | |||||
| Vomiting | 935 | Mull 2004 | 1) racemic epi 2) albuterol sulfate | 1/34 (3) 5/32 (15.6) | |||
| Kuyucu 2004 | 1) epi + dex 2) salbutamol + dex 3) epi + placebo 4) salbutamol + placebo | 0/23 (0) 0/23 (0) 0/11 (0) 0/12 (0) | |||||
| Plint 2009 | 1) epi + dex 2) epi + placebo 3) placebo + dex 4) placebo + placebo | 2/200 (1) 4/199 (2) 5/200 (2.5) 3/201 (1.5) | |||||
| Agitation / others | 30 | John 2006 | 1) epi 2) salbutamol | 0/15 (0) 0/15 (0) | irritability | ||
| Dex: dexamethasone | |||||||
| Outcome or subgroup title | No. of studies | No. of participants | Statistical method | Effect size |
| 1 Admissions at enrollment or < 24 hours (outpatients only) Show forest plot | 6 | 995 | Risk Ratio (M‐H, Random, 95% CI) | 0.67 [0.50, 0.89] |
| 2 Admissions overall up to 7 days (outpatients only) Show forest plot | 3 | 875 | Risk Ratio (M‐H, Random, 95% CI) | 0.81 [0.63, 1.03] |
| 3 Length of stay (inpatients only) Show forest plot | 2 | 292 | Mean Difference (IV, Random, 95% CI) | ‐0.35 [‐0.87, 0.17] |
| 4 Clinical score ‐ all (outpatients) Show forest plot | 6 | Std. Mean Difference (IV, Random, 95% CI) | Subtotals only | |
| 4.1 60 minutes | 6 | 975 | Std. Mean Difference (IV, Random, 95% CI) | ‐0.40 [‐0.58, ‐0.23] |
| 4.2 120 minutes | 2 | 105 | Std. Mean Difference (IV, Random, 95% CI) | ‐0.73 [‐1.13, ‐0.33] |
| 5 Clinical score ‐ all (inpatients) Show forest plot | 2 | Std. Mean Difference (IV, Random, 95% CI) | Subtotals only | |
| 5.1 60 minutes | 2 | 232 | Std. Mean Difference (IV, Random, 95% CI) | ‐0.04 [‐0.49, 0.40] |
| 6 Oxygen saturation ‐ all (outpatients) Show forest plot | 5 | Mean Difference (IV, Random, 95% CI) | Subtotals only | |
| 6.1 60 minutes | 5 | 949 | Mean Difference (IV, Random, 95% CI) | 0.61 [‐0.14, 1.36] |
| 6.2 120 minutes | 2 | 105 | Mean Difference (IV, Random, 95% CI) | ‐0.05 [‐1.22, 1.13] |
| 7 Oxygen saturation ‐ all (inpatients) Show forest plot | 1 | Mean Difference (IV, Random, 95% CI) | Subtotals only | |
| 7.1 60 minutes | 1 | 38 | Mean Difference (IV, Random, 95% CI) | ‐0.4 [‐1.56, 0.76] |
| 8 Respiratory rate ‐ all (outpatients) Show forest plot | 3 | Mean Difference (IV, Random, 95% CI) | Subtotals only | |
| 8.1 60 minutes | 3 | 844 | Mean Difference (IV, Random, 95% CI) | ‐3.22 [‐7.10, 0.65] |
| 9 Respiratory rate ‐ all (inpatients) Show forest plot | 1 | Mean Difference (IV, Random, 95% CI) | Subtotals only | |
| 9.1 60 minutes | 1 | 38 | Mean Difference (IV, Random, 95% CI) | 2.80 [‐2.97, 8.57] |
| 10 Heart rate ‐ all (outpatients) Show forest plot | 4 | Mean Difference (IV, Random, 95% CI) | Subtotals only | |
| 10.1 60 minutes | 4 | 901 | Mean Difference (IV, Random, 95% CI) | 7.85 [5.63, 10.06] |
| 10.2 120 minutes | 2 | 105 | Mean Difference (IV, Random, 95% CI) | 1.76 [‐5.96, 9.47] |
| 11 Heart rate ‐ all (inpatients) Show forest plot | 2 | Mean Difference (IV, Random, 95% CI) | Subtotals only | |
| 11.1 60 minutes | 2 | 225 | Mean Difference (IV, Random, 95% CI) | 13.06 [1.19, 24.92] |
| 12 Hospital readmissions (inpatients) Show forest plot | 2 | 292 | Risk Ratio (M‐H, Random, 95% CI) | 0.29 [0.05, 1.86] |
| 12.1 2 to 10 days | 1 | 98 | Risk Ratio (M‐H, Random, 95% CI) | 0.14 [0.01, 2.59] |
| 12.2 10 to 30 days | 1 | 194 | Risk Ratio (M‐H, Random, 95% CI) | 0.48 [0.04, 5.20] |
| 13 Return visits (ED or any healthcare provider) ‐ (outpatients) Show forest plot | 2 | 800 | Risk Ratio (M‐H, Random, 95% CI) | 0.98 [0.81, 1.19] |
| 13.1 10 to 30 days | 2 | 800 | Risk Ratio (M‐H, Random, 95% CI) | 0.98 [0.81, 1.19] |
| 14 Return visits (ED or any healthcare provider) ‐ (inpatients) Show forest plot | 1 | 98 | Risk Ratio (M‐H, Random, 95% CI) | 1.02 [0.76, 1.39] |
| 14.1 2 to 10 days | 1 | 98 | Risk Ratio (M‐H, Random, 95% CI) | 1.02 [0.76, 1.39] |
| 15 Admissions at enrollment or < 24 hours (outpatients only) ‐ subgroup analysis 'synergism' Show forest plot | 6 | 995 | Risk Ratio (M‐H, Random, 95% CI) | 0.67 [0.50, 0.89] |
| 15.1 Protocolized use of steroid | 1 | 400 | Risk Ratio (M‐H, Random, 95% CI) | 0.74 [0.45, 1.23] |
| 15.2 No protocolized use of steroid | 5 | 595 | Risk Ratio (M‐H, Random, 95% CI) | 0.62 [0.40, 0.94] |
| 16 Admissions at enrollment or < 24 hours (outpatients only) only low overall RoB Show forest plot | 3 | 842 | Risk Ratio (M‐H, Random, 95% CI) | 0.77 [0.56, 1.07] |
| 17 Admissions overall up to 7 days (outpatients only) ‐ subgroup analysis 'synergism' Show forest plot | 2 | 800 | Risk Ratio (M‐H, Random, 95% CI) | 0.78 [0.59, 1.05] |
| 17.1 Protocolized use of steroid | 1 | 400 | Risk Ratio (M‐H, Random, 95% CI) | 0.67 [0.45, 0.98] |
| 17.2 No protocolized use of steroid | 1 | 400 | Risk Ratio (M‐H, Random, 95% CI) | 0.90 [0.64, 1.26] |
| 18 Length of stay (inpatients only) only low overall RoB Show forest plot | 1 | 98 | Mean Difference (IV, Random, 95% CI) | ‐0.15 [‐1.05, 0.76] |
| 19 Clinical score ‐ all (outpatients) only low RoB Show forest plot | 2 | Std. Mean Difference (IV, Random, 95% CI) | Subtotals only | |
| 19.1 60 minutes | 2 | 796 | Std. Mean Difference (IV, Random, 95% CI) | ‐0.32 [‐0.46, ‐0.18] |
| Outcome or subgroup title | No. of studies | No. of participants | Statistical method | Effect size |
| 1 Admissions at enrollment or < 24 hours (outpatients only) Show forest plot | 9 | 444 | Risk Ratio (M‐H, Random, 95% CI) | 0.67 [0.41, 1.09] |
| 2 Admissions overall up to 7 days (outpatients only) Show forest plot | 3 | 212 | Risk Ratio (M‐H, Random, 95% CI) | 1.05 [0.71, 1.54] |
| 3 Length of stay (inpatients only) Show forest plot | 4 | 261 | Mean Difference (IV, Random, 95% CI) | ‐0.28 [‐0.46, ‐0.09] |
| 4 Length of stay (outpatients only) Show forest plot | 1 | 42 | Mean Difference (IV, Random, 95% CI) | 0.46 [‐0.27, 1.20] |
| 5 Clinical score ‐ all (outpatients) Show forest plot | 10 | Std. Mean Difference (IV, Random, 95% CI) | Subtotals only | |
| 5.1 60 minutes | 8 | 397 | Std. Mean Difference (IV, Random, 95% CI) | ‐0.12 [‐0.32, 0.08] |
| 5.2 120 minutes | 7 | 356 | Std. Mean Difference (IV, Random, 95% CI) | ‐0.10 [‐0.31, 0.11] |
| 5.3 12 to 24 hours | 2 | 69 | Std. Mean Difference (IV, Random, 95% CI) | ‐0.21 [‐0.86, 0.44] |
| 5.4 3 to 10 days | 2 | 69 | Std. Mean Difference (IV, Random, 95% CI) | ‐0.50 [‐0.98, ‐0.02] |
| 6 Clinical score ‐ all (inpatients) Show forest plot | 4 | Std. Mean Difference (IV, Random, 95% CI) | Subtotals only | |
| 6.1 60 minutes | 4 | 248 | Std. Mean Difference (IV, Random, 95% CI) | ‐0.79 [‐1.45, ‐0.13] |
| 6.2 120 minutes | 1 | 140 | Std. Mean Difference (IV, Random, 95% CI) | ‐0.52 [‐0.86, ‐0.18] |
| 7 Oxygen saturation ‐ all (outpatients) Show forest plot | 6 | Mean Difference (IV, Random, 95% CI) | Subtotals only | |
| 7.1 60 minutes | 6 | 335 | Mean Difference (IV, Random, 95% CI) | ‐0.37 [‐1.18, 0.43] |
| 7.2 120 minutes | 5 | 287 | Mean Difference (IV, Random, 95% CI) | ‐0.14 [‐0.63, 0.34] |
| 8 Oxygen saturation ‐ all (inpatients) Show forest plot | 3 | Mean Difference (IV, Random, 95% CI) | Subtotals only | |
| 8.1 60 minutes | 3 | 218 | Mean Difference (IV, Random, 95% CI) | 1.32 [0.51, 2.12] |
| 8.2 120 minutes | 1 | 140 | Mean Difference (IV, Random, 95% CI) | 1.5 [‐0.22, 3.22] |
| 9 Respiratory rate ‐ all (outpatients) Show forest plot | 6 | Mean Difference (IV, Random, 95% CI) | Subtotals only | |
| 9.1 60 minutes | 4 | 183 | Mean Difference (IV, Random, 95% CI) | ‐3.75 [‐7.43, ‐0.08] |
| 9.2 120 minutes | 4 | 177 | Mean Difference (IV, Random, 95% CI) | ‐2.59 [‐6.08, 0.89] |
| 9.3 12 to 24 hours | 2 | 69 | Mean Difference (IV, Random, 95% CI) | ‐3.44 [‐10.64, 3.76] |
| 9.4 > 24 hours | 2 | 69 | Mean Difference (IV, Random, 95% CI) | ‐6.88 [‐11.05, ‐2.71] |
| 10 Respiratory rate ‐ all (inpatients) Show forest plot | 3 | Mean Difference (IV, Random, 95% CI) | Subtotals only | |
| 10.1 60 minutes | 3 | 218 | Mean Difference (IV, Random, 95% CI) | ‐5.20 [‐8.33, ‐2.07] |
| 10.2 120 minutes | 1 | 140 | Mean Difference (IV, Random, 95% CI) | 1.0 [‐4.30, 6.30] |
| 11 Heart rate ‐ all (outpatients) Show forest plot | 7 | Mean Difference (IV, Random, 95% CI) | Subtotals only | |
| 11.1 60 minutes | 5 | 248 | Mean Difference (IV, Random, 95% CI) | 0.30 [‐3.67, 4.27] |
| 11.2 120 minutes | 6 | 290 | Mean Difference (IV, Random, 95% CI) | 1.35 [‐4.76, 7.45] |
| 11.3 12 to 24 hours | 2 | 69 | Mean Difference (IV, Random, 95% CI) | ‐3.56 [‐16.58, 9.47] |
| 11.4 3 to 10 days | 2 | 69 | Mean Difference (IV, Random, 95% CI) | ‐3.97 [‐13.85, 5.91] |
| 12 Heart rate ‐ all (inpatients) Show forest plot | 3 | Mean Difference (IV, Random, 95% CI) | Subtotals only | |
| 12.1 60 minutes | 3 | 218 | Mean Difference (IV, Random, 95% CI) | 0.89 [‐0.97, 2.76] |
| 12.2 120 minutes | 1 | 140 | Mean Difference (IV, Random, 95% CI) | ‐5.0 [‐10.30, 0.30] |
| 13 Hospital readmissions (inpatients) Show forest plot | 2 | 131 | Risk Ratio (M‐H, Random, 95% CI) | 0.0 [0.0, 0.0] |
| 13.1 2 to 10 days | 1 | 101 | Risk Ratio (M‐H, Random, 95% CI) | 0.0 [0.0, 0.0] |
| 13.2 10 to 30 days | 1 | 30 | Risk Ratio (M‐H, Random, 95% CI) | 0.0 [0.0, 0.0] |
| 14 Return visits (ED or any healthcare provider) ‐ (outpatients) Show forest plot | 2 | 76 | Risk Ratio (M‐H, Random, 95% CI) | 0.82 [0.28, 2.42] |
| 14.1 2 to 10 days | 1 | 41 | Risk Ratio (M‐H, Random, 95% CI) | 1.05 [0.30, 3.64] |
| 14.2 10 to 30 days | 1 | 35 | Risk Ratio (M‐H, Random, 95% CI) | 0.40 [0.05, 3.44] |
| 15 Return visits (ED or any healthcare provider) ‐ (inpatients) Show forest plot | 1 | 101 | Risk Ratio (M‐H, Random, 95% CI) | 1.17 [0.84, 1.61] |
| 15.1 10 to 30 days | 1 | 101 | Risk Ratio (M‐H, Random, 95% CI) | 1.17 [0.84, 1.61] |
| 16 Length of stay (inpatients only) only low RoB overall Show forest plot | 1 | 101 | Mean Difference (IV, Random, 95% CI) | ‐0.07 [‐1.01, 0.88] |
| 17 Admissions at enrollment or < 24 hours (outpatients only) only low RoB overall Show forest plot | 3 | 148 | Risk Ratio (M‐H, Random, 95% CI) | 0.66 [0.28, 1.56] |
| 18 Clinical score ‐ all (outpatients) only low RoB Show forest plot | 3 | Std. Mean Difference (IV, Random, 95% CI) | Subtotals only | |
| 18.1 60 minutes | 3 | 135 | Std. Mean Difference (IV, Random, 95% CI) | ‐0.23 [‐0.57, 0.11] |
| 18.2 120 minutes | 2 | 108 | Std. Mean Difference (IV, Random, 95% CI) | ‐0.11 [‐0.64, 0.42] |
| Outcome or subgroup title | No. of studies | No. of participants | Statistical method | Effect size |
| 1 Admissions (outpatients only) Show forest plot | 2 | 444 | Risk Ratio (M‐H, Random, 95% CI) | 1.12 [0.66, 1.88] |
| 2 Admissions overall up to 7 days (outpatients only) Show forest plot | 1 | 399 | Risk Ratio (M‐H, Random, 95% CI) | 1.08 [0.77, 1.52] |
| 3 Clinical score ‐ all (outpatients) Show forest plot | 2 | Std. Mean Difference (IV, Random, 95% CI) | Subtotals only | |
| 3.1 60 minutes | 2 | 442 | Std. Mean Difference (IV, Random, 95% CI) | 0.31 [0.12, 0.50] |
| 3.2 120 minutes | 1 | 45 | Std. Mean Difference (IV, Random, 95% CI) | 0.35 [‐0.27, 0.98] |
| 3.3 3 to 6 hours | 1 | 45 | Std. Mean Difference (IV, Random, 95% CI) | 0.42 [‐0.20, 1.05] |
| 4 Oxygen saturation ‐ all (outpatients) Show forest plot | 2 | Mean Difference (IV, Random, 95% CI) | Subtotals only | |
| 4.1 60 minutes | 2 | 442 | Mean Difference (IV, Random, 95% CI) | ‐0.99 [‐1.46, ‐0.52] |
| 4.2 120 minutes | 1 | 45 | Mean Difference (IV, Random, 95% CI) | ‐0.07 [‐1.07, 0.94] |
| 4.3 3 to 6 hours | 1 | 45 | Mean Difference (IV, Random, 95% CI) | ‐0.58 [‐1.74, 0.57] |
| 5 Respiratory rate ‐ all (outpatients) Show forest plot | 1 | Mean Difference (IV, Random, 95% CI) | Subtotals only | |
| 5.1 60 minutes | 1 | 397 | Mean Difference (IV, Random, 95% CI) | 0.38 [‐1.44, 2.20] |
| 6 Heart rate ‐ all (outpatients) Show forest plot | 2 | Mean Difference (IV, Random, 95% CI) | Subtotals only | |
| 6.1 60 minutes | 2 | 442 | Mean Difference (IV, Random, 95% CI) | ‐7.56 [‐11.34, ‐3.79] |
| 6.2 120 minutes | 1 | 45 | Mean Difference (IV, Random, 95% CI) | 0.44 [‐7.59, 8.47] |
| 6.3 3 to 6 hours | 1 | 45 | Mean Difference (IV, Random, 95% CI) | ‐0.20 [‐8.09, 7.69] |
| 7 Return visits (ED or any healthcare provider) (outpatients) Show forest plot | 1 | 399 | Risk Ratio (M‐H, Random, 95% CI) | 1.13 [0.93, 1.38] |
| 7.1 10 to 30 days | 1 | 399 | Risk Ratio (M‐H, Random, 95% CI) | 1.13 [0.93, 1.38] |
| Outcome or subgroup title | No. of studies | No. of participants | Statistical method | Effect size |
| 1 Admissions at enrollment or < 24 hours (outpatients only) Show forest plot | 1 | 401 | Risk Ratio (M‐H, Random, 95% CI) | 0.64 [0.40, 1.04] |
| 2 Admissions overall up to 7 days (outpatients only) Show forest plot | 1 | 400 | Risk Ratio (M‐H, Random, 95% CI) | 0.65 [0.44, 0.95] |
| 3 Clinical score (outpatients only) Show forest plot | 1 | Std. Mean Difference (IV, Random, 95% CI) | Subtotals only | |
| 3.1 60 minutes | 1 | 399 | Std. Mean Difference (IV, Random, 95% CI) | ‐0.34 [‐0.54, ‐0.14] |
| 4 Oxygen saturation (outpatients only) Show forest plot | 1 | Mean Difference (IV, Random, 95% CI) | Subtotals only | |
| 4.1 60 minutes | 1 | 399 | Mean Difference (IV, Random, 95% CI) | 0.04 [‐0.53, 0.61] |
| 5 Respiratory rate (outpatients only) Show forest plot | 1 | Mean Difference (IV, Random, 95% CI) | Subtotals only | |
| 5.1 60 minutes | 1 | 399 | Mean Difference (IV, Random, 95% CI) | ‐1.16 [‐3.06, 0.74] |
| 6 Heart rate (outpatients only) Show forest plot | 1 | Mean Difference (IV, Random, 95% CI) | Subtotals only | |
| 6.1 60 minutes | 1 | 399 | Mean Difference (IV, Random, 95% CI) | 8.44 [4.85, 12.03] |
| 7 Return visits (outpatients only) Show forest plot | 1 | 400 | Risk Ratio (M‐H, Random, 95% CI) | 1.12 [0.90, 1.38] |
| 7.1 10 to 30 days | 1 | 400 | Risk Ratio (M‐H, Random, 95% CI) | 1.12 [0.90, 1.38] |
| Outcome or subgroup title | No. of studies | No. of participants | Statistical method | Effect size |
| 1 Clinical score ‐ all scores (inpatients) Show forest plot | 1 | Std. Mean Difference (IV, Random, 95% CI) | Subtotals only | |
| 1.1 120 minutes | 1 | 35 | Std. Mean Difference (IV, Random, 95% CI) | ‐0.17 [‐0.87, 0.52] |
| 1.2 12 to 24 hours | 1 | 35 | Std. Mean Difference (IV, Random, 95% CI) | 0.0 [‐0.70, 0.70] |
| 1.3 3 to 10 days | 1 | 35 | Std. Mean Difference (IV, Random, 95% CI) | ‐1.22 [‐1.98, ‐0.46] |
| 2 Respiratory rate ‐ all (inpatients) Show forest plot | 1 | Mean Difference (IV, Random, 95% CI) | Subtotals only | |
| 2.1 120 minutes | 1 | 35 | Mean Difference (IV, Random, 95% CI) | ‐3.10 [‐9.51, 3.31] |
| 2.2 12 to 24 hours | 1 | 35 | Mean Difference (IV, Random, 95% CI) | ‐2.80 [‐9.96, 4.36] |
| 2.3 > 24 hours | 1 | 35 | Mean Difference (IV, Random, 95% CI) | ‐13.70 [‐20.56, ‐6.84] |
| 3 Heart rate ‐ all (inpatients) Show forest plot | 1 | Mean Difference (IV, Random, 95% CI) | Subtotals only | |
| 3.1 120 minutes | 1 | 35 | Mean Difference (IV, Random, 95% CI) | ‐3.20 [‐12.20, 5.80] |
| 3.2 24 to 72 hours | 1 | 35 | Mean Difference (IV, Random, 95% CI) | ‐1.40 [‐9.36, 6.56] |
| 3.3 3 to 10 days | 1 | 35 | Mean Difference (IV, Random, 95% CI) | ‐6.30 [‐14.21, 1.61] |
| Outcome or subgroup title | No. of studies | No. of participants | Statistical method | Effect size |
| 1 Clinical score (inpatients) Show forest plot | 1 | Std. Mean Difference (IV, Random, 95% CI) | Subtotals only | |
| 1.1 6 to 12 hours | 1 | 60 | Std. Mean Difference (IV, Random, 95% CI) | ‐0.60 [‐1.12, ‐0.09] |
| 2 Oxygen saturation (inpatients) Show forest plot | 1 | Mean Difference (IV, Random, 95% CI) | Subtotals only | |
| 2.1 6 to 12 hours | 1 | 60 | Mean Difference (IV, Random, 95% CI) | 0.37 [‐0.82, 1.56] |