Opiáceos transdérmicos u orales para la artrosis de rodilla o cadera
Resumen
Antecedentes
La artrosis es la enfermedad articular más frecuente y la causa principal de dolor y discapacidad física en pacientes de edad avanzada. Los opiáceos pueden ser una opción viable de tratamiento si los pacientes sufren dolor intenso o si otros analgésicos están contraindicados. Sin embargo, la evidencia acerca de su efectividad y seguridad es contradictoria. Ésta es una actualización de una revisión Cochrane publicada por primera vez en 2009.
Objetivos
Determinar los efectos sobre el dolor, la función, la seguridad y la adicción de los opiáceos orales o transdérmicos en comparación con el placebo o ninguna intervención en pacientes con artrosis de la cadera o la rodilla.
Métodos de búsqueda
Se realizaron búsquedas en el Registro Cochrane Central de Ensayos Controlados (CENTRAL), MEDLINE, EMBASE y CINAHL (hasta el 28 de julio de 2008, con una actualización el 15 de agosto de 2012), se examinaron las actas de congresos, las listas de referencias y se estableció contacto con los autores.
Criterios de selección
Se incluyeron ensayos controlados aleatorizados o cuasialeatorizados que compararon los opiáceos orales o transdérmicos con el placebo o ningún tratamiento en pacientes con artrosis de rodilla o cadera. Se excluyeron los estudios de tramadol. No se aplicaron restricciones de idioma.
Obtención y análisis de los datos
Los datos se extrajeron por duplicado. Para el dolor y la función, se calcularon las diferencias de medias estandarizadas (DME) y los intervalos de confianza (IC) del 95%, y para los resultados de seguridad, el riesgo relativo. Los ensayos se combinaron mediante un metanálisis de efectos aleatorios de la varianza inversa.
Resultados principales
Se identificaron 12 ensayos adicionales y se incluyeron 22 ensayos con 8275 participantes en esta actualización. La oxicodona oral se estudió en 10 ensayos, la buprenorfina transdérmica y el tapentadol oral en cuatro, la codeína oral en tres, la morfina oral y la oximorfona oral en dos y el fentanilo transdérmico y la hidromorfona oral en un ensayo cada uno. Todos los ensayos se describieron como doble ciego, pero el riesgo de sesgo para otros dominios no estaba claro en varios ensayos debido a la información incompleta. Los opiáceos fueron más efectivos en la reducción del dolor que las intervenciones de control (DME ‐0,28; IC del 95%: ‐0,35 a ‐0,20), que corresponde a una diferencia en las puntuaciones del dolor de 0,7 cm en una escala visual analógica (EVA) de 10 cm entre los opiáceos y el placebo. Esto corresponde a una diferencia en la mejoría del 12% (IC del 95%: 9% a 15%) entre los opiáceos (41% de mejoría media desde el inicio) y el placebo (29% de mejoría media desde el inicio), lo que se traduce en un número necesario a tratar (NNTB) para causar una respuesta de tratamiento adicional en el dolor de 10 (IC del 95%: 8 a 14). La mejoría de la función fue mayor en participantes tratados con opiáceos comparados con los grupos de control (DME ‐0,26; IC del 95%: ‐0,35 a ‐0,17), lo que corresponde a una diferencia en las puntuaciones de la función de 0,6 unidades entre opiáceos y placebo en la escala de discapacidad estandarizada Western Ontario and McMaster Universities Arthritis Index (WOMAC) que va de 0 a 10. Esto corresponde a una diferencia en la mejoría del 11% (IC del 95%: 7% a 14%) entre los opiáceos (32% de mejoría media desde el inicio) y el placebo (21% de mejoría media desde el inicio), lo que se traduce en un NNTB para causar una respuesta de tratamiento adicional en la función de 11 (IC del 95%: 7 a 14). No se encontraron diferencias significativas en los efectos según el tipo opiáceo, la potencia analgésica, la vía de administración, la dosis diaria, la calidad metodológica de los ensayos y el tipo de financiación. Los ensayos con duraciones de tratamiento de cuatro semanas o menos mostraron un mayor alivio del dolor que los ensayos con una duración de tratamiento más prolongada (valor P para la interacción = 0,001) y hubo evidencia de asimetría en el gráfico de embudo (valor P = 0,054 para el dolor y valor P = 0,011 para la función). Los eventos adversos fueron más frecuentes en los pacientes que recibieron opiáceos en comparación con el control. El riesgo relativo agrupado fue de 1,49 (IC del 95%: 1,35 a 1,63) para cualquier evento adverso (9 ensayos; el 22% de los participantes en el tratamiento con opiáceos y el 15% de los participantes en el tratamiento de control experimentaron efectos secundarios), 3,76 (IC del 95%: 2,93 a 4,82) para los abandonos debidos a eventos adversos (19 ensayos; 6,4% de los participantes en el tratamiento con opiáceos y 1,7% de los participantes en el tratamiento de control abandonaron debido a eventos adversos), y 3,35 (IC del 95%: 0,83 a 13,56) para los eventos adversos graves (2 ensayos; 1,3% de los participantes en el tratamiento con opiáceos y 0,4% de los participantes en el tratamiento de control experimentaron eventos adversos graves). Los síntomas de abstinencia se produjeron con mayor frecuencia en los opiáceos en comparación con el tratamiento de control (odds ratio (OR) 2,76; IC del 95%: 2,02 a 3,77; 3 ensayos; el 2,4% de los participantes en el tratamiento con opiáceos y el 0,9% de los participantes en el tratamiento de control experimentaron síntomas de abstinencia).
Conclusiones de los autores
Los pocos efectos beneficiosos medios de los opiáceos (no tramadol) contrastan con los aumentos significativos del riesgo de eventos adversos. Para el resultado del dolor en concreto, los efectos observados fueron de relevancia clínica cuestionable, ya que el IC del 95% no incluyó la diferencia mínima clínicamente importante de 0,37 DME, que corresponde a 0,9 cm en una EVA de 10 cm.
PICO
Resumen en términos sencillos
Opiáceos para la artrosis
Este resumen de una revisión Cochrane de 22 estudios con 8275 participantes (actualización de la búsqueda: 15 de agosto de 2012) presenta lo que se sabe de las investigaciones acerca del efecto de los opiáceos para la artrosis. Se buscó en bases de datos científicas ensayos clínicos que abordaran el dolor, la función, la seguridad y la adicción de los opiáceos orales o transdérmicos en comparación con el placebo o ninguna intervención en pacientes con artrosis de la cadera o la rodilla.
La revisión muestra que en los pacientes con osteoartritis:
‐ Los opiáceos tienen un ligero efecto sobre el dolor o la función física.
‐ Los opiáceos probablemente causen efectos secundarios. Sin embargo, no se cuenta con información precisa acerca de los efectos secundarios poco frecuentes pero graves.
¿Qué es la osteoartritis y qué son los opiáceos?
La artrosis es una enfermedad de las articulaciones, como la rodilla o la cadera. Cuando la articulación pierde el cartílago, se produce el crecimiento del hueso para tratar de reparar el daño. Sin embargo, en vez de mejorar la situación, el hueso crece anormalmente y la empeora. Por ejemplo, el hueso puede deformarse y hacer que la articulación se vuelva dolorosa e inestable. Lo anterior puede afectar la función física o el uso de la rodilla.
Los opiáceos se conciben en general como sustancias potentes para aliviar el dolor que se utilizan para el dolor del cáncer o de la artrosis. Algunos ejemplos de opiáceos son el Tylenol® con codeína (1, 2, 3 y 4), la hidromorfona (Dilaudid), la oxicodona (Percocet, Percodan), la morfina y otros. Pueden tomarse en forma de píldora, de inyección o de parche que se coloca en el área de dolor.
La mejor estimación de lo que le sucede a los pacientes con osteoartritis que toman opiáceos
Dolor
‐ Los pacientes que tomaron opiáceos calificaron la mejoría del dolor después de un mes con cerca de 3 puntos en una escala del 0 (ningún dolor) al 10 (dolor extremo).
‐ Los pacientes que tomaron placebo sostienen que la mejoría del dolor después de un mes es de cerca de 2 en una escala del 0 (ningún dolor) al 10 (dolor extremo).
Otra manera de decir esto es:
‐ 41 de cada 100 pacientes que usaron opiáceos responden al tratamiento (41%).
‐ 31 de cada 100 pacientes que usaron placebo responden al tratamiento (31%).
‐ 10 pacientes más respondieron al tratamiento con opiáceos que con placebo (diferencia del 10%). (Evidencia de alta calidad)
Función física
‐ Los pacientes que tomaron opiáceos calificaron la mejoría de la función física en cerca de 2 puntos en una escala del 0 (ninguna discapacidad) al 10 (discapacidad extrema) después de un mes.
‐ Los pacientes que tomaron placebo calificaron la mejoría de la función física en cerca de 1 punto en una escala del 0 (ninguna discapacidad) al 10 (discapacidad extrema) después de un mes.
Otra manera de decir esto es:
‐ 34 de cada 100 pacientes que usaron opiáceos respondieron al tratamiento (34%).
‐ 26 de cada 100 pacientes que usaron placebo responden al tratamiento (26%).
‐ 8 pacientes más respondieron al tratamiento con opiáceos que con placebo (diferencia del 8%). (Evidencia de alta calidad)
Efectos secundarios
‐ 22 de cada 100 pacientes que utilizaron opiáceos presentaron efectos secundarios (22%).
‐ Quince pacientes de cada 100 que utilizaron placebo presentaron efectos secundarios (15%).
‐ siete pacientes más presentaron efectos secundarios con opiáceos que con placebo (diferencia de 7%). (Evidencia de calidad moderada)
Abandonos debido a los efectos secundarios
‐ 64 pacientes de cada 1000 que utilizaron un opiáceos abandonaron debido a los efectos secundarios (6,4%).
‐ 17 pacientes de cada 1000 que utilizaron un placebo abandonaron debido a los efectos secundarios (1,7%).
‐ 47 pacientes más abandonaron debido a efectos secundarios con opiáceos que con placebo (diferencia de 4,7%). (Evidencia de alta calidad)
Efectos secundarios que provocaron hospitalización, discapacidad persistente o muerte
‐13 pacientes de cada 1000 que utilizaron opiáceos presentaron efectos secundarios que provocaron hospitalización, discapacidad persistente o muerte (1,3%).
‐ 4 pacientes de cada 1000 que utilizaron un placebo presentaron efectos secundarios que provocaron hospitalización, discapacidad persistente o muerte (0,4%).
‐ 9 pacientes más presentaron efectos secundarios que provocaron hospitalización, discapacidad persistente o muerte con opiáceos que con placebo (diferencia del 0,9%). (Evidencia de baja calidad)
Síntomas de abstinencia
‐ 24 de cada 1000 pacientes que utilizaron opiáceos presentaron síntomas de abstinencia (2,4%).
‐ 9 de cada 1000 pacientes que utilizaron placebo presentaron síntomas de abstinencia (0,9%).
‐ 15 pacientes más presentaron síntomas de abstinencia con opiáceos que con placebo (diferencia de 1,5%). (Evidencia de calidad moderada)
Authors' conclusions
Summary of findings
| Oral or transdermal opioids compared with placebo for osteoarthritis of the knee or hip | ||||||
| Patient or population: participants with osteoarthritis of the knee or hip Settings: various orthopaedic or rheumatology clinics Intervention: oral or transdermal opioids Comparison: placebo | ||||||
| Outcomes | Illustrative comparative risks* (95% CI) | Relative effect | No of participants | Quality of the evidence | Comments | |
| Assumed risk | Corresponding risk | |||||
| Placebo | Opioids | |||||
| Pain intensity Various pain scales. (median follow‐up: 4 weeks) | ‐1.8 cm change 29% improvement | ‐2.5 cm change 41% improvement | SMD ‐0.28 (‐0.35 to ‐0.20) | 8275 | ++++ | NNTB 10 (95% CI 8 to 14)4 |
| Function Various validated function scales. (median follow‐up: 5 weeks) | ‐1.2 units 21% improvement | ‐1.8 units on WOMAC 32% improvement | SMD ‐0.26 (‐0.35 to ‐0.17) | 3553 | ++++ | NNTB 12 (95% CI 10 to 18)7 |
| Number of participants experiencing any adverse event (median follow‐up: 8 weeks) | 150 per 1000 participant‐years8 | 224 per 1000 participant‐years | RR 1.49 (1.35 to 1.63) | 4898 | +++O | NNTH 14 (95% CI 11 to 19) |
| Number of participants who withdrew because of adverse events (median follow‐up: 6 weeks) | 17 per 1000 participant‐years8 | 64 per 1000 participant‐years | RR 3.76 (2.93 to 4.82) | 7712 | ++++ | NNTH 21 (95% CI 15 to 30) |
| Number of participants experiencing any serious adverse event (median follow‐up: 8 weeks) | 4 per 1000 participant‐years8 | 13 per 1000 participant‐years | RR 3.35 (0.83 to 13.56) | 681 | ++OO | Little evidence of harmful effect (NNTH not statistically significant) |
| Withdrawal symptoms (median follow‐up: 16 weeks) | 9 per 1000 participant‐years11 | 24 per 100 | OR 2.67 (2.02 to 3.77) | 1151 | +++O | NNTH 65 (95% CI 42 to 110) |
| *The basis for the assumed risk (e.g. the median control group risk across studies) is provided in footnotes. The corresponding risk (and its 95% confidence interval) is based on the assumed risk in the comparison group and the relative effect of the intervention (and its 95% CI). | ||||||
| GRADE Working Group grades of evidence 1 Median reduction as observed across placebo groups in large osteoarthritis trials (see methods section, Nüesch 2009). | ||||||
Background
Description of the condition
Osteoarthritis is the most common form of joint disease and the leading cause of pain, functional limitations, and loss of independence in older adults (Altman 1986). It is a progressive disease of synovial joints resulting from biomechanical and systemic effects, and is characterised by a breakdown of the joint cartilage accompanied by subchondral bone changes, deterioration of tendons and ligaments, and various degrees of inflammation of the synovium (Hochberg 2012).
Description of the intervention
Pharmacological therapy for osteoarthritis, as an alternative or in addition to other therapeutic options, consists mainly of analgesics and non‐steroidal anti‐inflammatory drugs (NSAIDs). However, paracetamol may be inadequate to treat more severe, long‐term pain in osteoarthritis and chronic NSAID use may cause serious gastrointestinal and cardiovascular adverse events. Opioids could be a viable alternative if people have severe pain with insufficient response to conventional treatment or if other analgesics are contraindicated (Avouac 2007).
How the intervention might work
Opioids are potent analgesics that work by targeting mainly spinal and supraspinal opioid receptors. In addition, cellular studies suggest that there are peripheral opioid receptors in inflamed osteoarthritic synovial tissue, which may mediate analgesic effects (Stein 1996).
Why it is important to do this review
The American College of Rheumatology guidelines on management of osteoarthritis, updated in 2012, suggest that opioids can be used in people with osteoarthritis after having failed medical therapy who were not willing or had contraindications for total joint replacement (Hochberg 2012). British guidelines propose opioids as an alternative if inadequate pain relief is achieved with topical NSAIDs or paracetamol (Eccles 1998; NICE 2008). However, the use of strong opioids for the treatment of non‐cancer pain remains controversial. Concerns have been expressed about long‐term use of opioids for chronic non‐cancer pain mainly due to the risks of addiction (Von Korff 2004; Zhang 2008).
Objectives
To determine the effects on pain, function, safety, and addiction of oral or transdermal opioids compared with placebo or no intervention in people with knee or hip osteoarthritis.
Methods
Criteria for considering studies for this review
Types of studies
Randomised or quasi‐randomised controlled trials with a control group receiving placebo or no intervention.
Types of participants
At least 75% of participants with clinically or radiologically confirmed osteoarthritis of the knee or hip. We did not consider trials exclusively including people with inflammatory arthritis, such as rheumatoid arthritis.
Types of interventions
Any type of opioid except tramadol, which is covered in a separate Cochrane Review (Cepeda 2006).
Types of outcome measures
Primary outcomes
The main outcomes were pain and function, as currently recommended for osteoarthritis trials (Altman 1996; Pham 2004). If data on more than one pain scale were provided for a trial, we referred to a previously described hierarchy of pain‐related outcomes (Jüni 2006; Reichenbach 2007), and extracted data on the pain scale that was highest on this list:
-
global pain;
-
pain on walking;
-
Western Ontario and McMaster Universities Arthritis Index (WOMAC) osteoarthritis index pain subscore;
-
composite pain scores other than WOMAC;
-
pain on activities other than walking;
-
rest pain or pain during the night;
-
WOMAC global algofunctional score;
-
Lequesne osteoarthritis index global score;
-
other algofunctional scale;
-
participant's global assessment;
-
physician's global assessment.
If data on more than one function scale were provided for a trial, we extracted data according to the hierarchy:
-
global disability score;
-
walking disability;
-
WOMAC disability subscore;
-
composite disability scores other than WOMAC;
-
disability other than walking;
-
WOMAC global scale;
-
Lequesne osteoarthritis index global score;
-
other algofunctional scale;
-
participant's global assessment;
-
physician's global assessment.
If pain or function outcomes were reported at several time points, we extracted the measure at the end of the treatment period.
Secondary outcomes
Secondary outcomes were the number of participants who experienced any adverse event, withdrew because of adverse events, experienced any serious adverse events, and experienced symptoms of opioid dependence such as craving or physical withdrawal symptoms. We defined serious adverse events as events resulting in hospitalisation, prolongation of hospitalisation, persistent or significant disability, congenital abnormality or birth defect of offspring, life‐threatening events, or death.
Search methods for identification of studies
Electronic searches
We searched the electronic databases the Cochrane Central Register of Controlled Trials (CENTRAL) (mrw.interscience.wiley.com/cochrane/), MEDLINE and EMBASE through the Ovid platform (www.ovid.com), and CINAHL through EBSCOhost (all from implementation to July 28 2008) using truncated variations of preparation names including brand names combined with truncated variations of terms related to osteoarthritis, all as text words. We applied a validated methodological filter for controlled clinical trials (Dickersin 1994). The specific search algorithms are displayed in Appendix 1 and Appendix 2. We updated the search using CENTRAL, MEDLINE, and EMBASE up to 15 August 2012.
Searching other resources
We manually searched conference proceedings, used Science Citation Index to retrieve reports citing relevant articles, contacted content experts and trialists, and screened reference lists of all obtained articles. Finally, we searched several clinical trial registries (clinicaltrials.gov, metaRegister of Controlled Trials, Australian New Zealand Clinical Trials Registry, UMIN Clinical Trials Registry) to identify ongoing trials. We performed the last update of the search on 20 September 2012. We did not search OARSI conference proceedings for the update, as we no longer had access to this database.
Data collection and analysis
We used a generic protocol with instructions for data extraction, quality assessment, and statistical analyses, which was approved by the editorial board of the Cochrane Musculoskeletal Group. We applied the same protocol in our previous reviews (Rutjes 2009a; Rutjes 2009b; Reichenbach 2010; Rutjes 2010; da Costa 2012b).
Selection of studies
Two review authors independently evaluated all titles and abstracts for eligibility (originally EN and AR, BdC and RK for the update) (see Figure 1). We resolved disagreements by discussion. We applied no language restrictions. If multiple reports described the same trial, we considered all.

Study flow chart.
Data extraction and management
Two review authors (originally EN and AR, BdC and RK for the update) extracted trial information independently using a standardised, piloted extraction form accompanied by a codebook. We resolved disagreements by discussion. We extracted both the generic and trade name of the experimental intervention, the type of control used, dosage, frequency, route of administration, duration of treatment, participant characteristics (gender, mean age and duration of symptoms, types of joints affected), types of measures used and pain‐ and function‐related outcomes, trial design, trial size, duration of follow‐up, type and source of financial support, and publication status. When necessary, we approximated means and measures of dispersion from figures in the reports. For cross‐over trials, we extracted data from the first period only. Whenever possible, we used results from an intention‐to‐treat analysis. If effect sizes could not be calculated, we contacted the authors for additional data.
Assessment of risk of bias in included studies
Two review authors (originally EN and AR, BdC and RK for the update) independently assessed randomisation, blinding, and adequacy of analyses (Jüni 2001). We resolved disagreements by consensus. We assessed two components of randomisation: generation of allocation sequences and concealment of allocation. We considered generation of sequences to be adequate if it resulted in an unpredictable allocation schedule; mechanisms considered adequate included random‐number tables, computer‐generated random numbers, minimisation, coin tossing, shuffling cards, and drawing lots. We considered trials using an unpredictable allocation sequence to be randomised; we considered trials using potentially predictable allocation mechanisms, such as alternation or the allocation of participants according to date of birth, to be quasi‐randomised. We considered concealment of allocation to be adequate if participants and investigators responsible for participant selection were unable to suspect before allocation which treatment was next. Methods considered adequate include central randomisation; pharmacy‐controlled randomisation using identical pre‐numbered containers; and sequentially numbered, sealed, opaque envelopes. We considered blinding of participants to be adequate if experimental and control preparations were explicitly described as indistinguishable or if a double‐dummy technique was used. We considered analyses to be adequate if all randomised participants were included in the analysis according to the intention‐to‐treat principle. We further assessed the reporting of primary outcomes, sample size calculations, and funding source. Finally, we used GRADE to describe the quality of the overall body of evidence (Guyatt 2008; Higgins 2011), defined as the extent of confidence into the estimates of treatment benefits and harms.
Measures of treatment effect
We summarised continuous outcomes using standardised mean differences (SMD) with 95% confidence intervals (CI), with the differences in mean values at the end of treatment across treatment groups divided by the pooled standard deviation (SD). If differences in mean values at the end of the treatment were unavailable, we used differences in mean changes. If some of the required data were unavailable, we used approximations, as previously described (Reichenbach 2007). An SMD of ‐0.20 SD units can be considered a small difference between the experimental and control groups, an SMD of ‐0.50 a moderate difference, and ‐0.80 a large difference (Cohen 1988; Jüni 2006). SMDs can also be interpreted in terms of the per cent of overlap of the experimental group's scores with scores of the control group. An SMD of ‐0.20 indicates an overlap in the distribution of pain or function scores in about 85% of cases, an SMD of ‐0.50 in about 67%, and an SMD of ‐0.80 in about 53% of cases (Cohen 1988; Jüni 2006). On the basis of a median pooled SD of 2.5 cm, found in large‐scale osteoarthritis trials that assessed pain using a 10‐cm visual analogue scale (VAS) (Nüesch 2009), SMDs of ‐0.20 correspond to approximate differences in pain scores between experimental and control groups of 0.5 on a 10‐cm VAS, ‐0.50 of 1.25 on a 10‐cm VAS, and ‐0.80 of 2 on a 10‐cm VAS. We back transformed SMDs for function to a standardised WOMAC disability score (Bellamy 1995), ranging from 0 to 10 on the basis of a median pooled SD of 2.1 units observed in large‐scale osteoarthritis trials (Nüesch 2009). We expressed binary outcomes as risk ratios (RR) with 95% CI.
Data synthesis
We used a standard inverse‐variance random‐effects meta‐analysis to combine the trials (DerSimonian 1986). We quantified heterogeneity between trials using the I2 statistic (Higgins 2003), which describes the percentage of variation across trials that is attributable to heterogeneity rather than to chance. I2 values of 25% may be interpreted as low, 50% as moderate, and 75% as high between‐trial heterogeneity, although its interpretation depends on the size and number of trials included (Rücker 2008). The association between trial size and treatment effects was investigated in funnel plots, plotting effect sizes on the vertical axis against their standard errors on the horizontal axis (Sterne 2011). We assessed asymmetry by the asymmetry coefficient, the difference in effect size per unit increase in standard error (Sterne 2001), which is mainly a surrogate for sample size, and used univariable, meta‐regression analysis to predict treatment effects in trials as large as the largest trials included in the meta‐analysis using the standard error as the explanatory variable (Shang 2005). We then performed analyses of the primary outcomes, pain and function, stratified by the following trial characteristics: type of opioid, analgesic potency (strong versus weak), route of administration (oral versus transdermal), type of control (placebo versus no intervention), concealment of allocation (adequate versus inadequate or unclear), blinding of participants (adequate versus inadequate or unclear), analysis in accordance with the intention‐to‐treat principle (yes versus no or unclear), trial size, funding (funding by pharmaceutical industry or unclear versus no funding by pharmaceutical industry), duration of treatment, and type of osteoarthritis (hip only versus knee only versus mixed). We classified buprenorphine, fentanyl, morphine, oxycodone, oxymorphone, and tapentadol as strong opioids, and codeine and dextropropoxyphene as weak opioids. We used a cut‐off of 200 allocated participants to distinguish between small‐scale and large‐scale trials. A sample size of 2 x 100 participants will yield more than 80% power to detect a small‐to‐moderate SMD of ‐0.40 at a two‐sided P value of 0.05, which corresponds to a difference of 1 cm on a 10‐cm VAS between the experimental and control intervention (Nüesch 2010). We used a cut‐off of one month to distinguish between short‐term and long‐term trials. We used univariable, random‐effects meta‐regression models to determine whether treatment effects were affected by these factors (Thompson 1999). In addition, we included the following two continuous variables at trial level in univariable meta‐regression: daily morphine equivalence dosage and treatment duration. We calculated morphine equivalence doses as previously described: oral morphine 10 mg was considered equivalent to oral codeine 65 mg, oral hydromorphone 2 mg, oral oxycodone 7.5 mg, and oral oxymorphone 10 mg and oral tapentadol 25 mg (Loeser 2001; Schug 2006). Patches of fentanyl 25 μg/hour was considered equivalent to oral morphine 90 mg per day and patches of buprenorphine 5, 10, and 20 μg/hour equivalent to 10, 15, and 30 mg oral morphine per day (British Pain Society 2010).
We converted SMDs of pain intensity and function to odds ratios (OR) (Chinn 2000; da Costa 2012a) to derive numbers needed to treat to cause one additional treatment response on pain or function as compared with placebo (NNTB), and numbers needed to treat to cause one additional adverse outcome (NNTH). We defined treatment response as a 50% improvement in scores (Clegg 2006). With a median standardised pain intensity at baseline of 2.4 SD units, observed in large osteoarthritis trials (Nüesch 2009), this corresponds to a mean decrease in scores of 1.2 SD units. Based on the median standardised decrease in pain scores of 0.72 SD units (Nüesch 2009), we calculated that a median of 31% of participants in the placebo group would achieve an improvement of pain scores of 50% or more. This percentage was used as the control group response rate to calculate NNTBs for treatment response on pain. Based on the median standardised WOMAC function score at baseline of 2.7 SD units and the median standardised decrease in function scores of 0.58 SD units (Nüesch 2009), 26% of participants in the placebo group would achieve a reduction in function of 50% or more. Again, this percentage was used as the control group response rate to calculate NNTBs for treatment response on function. We used the median risks of 150 participants with adverse events per 1000 participant‐years, four participants with serious adverse events per 1000 participant‐years, and 17 drop‐outs due to adverse events per 1000 participant‐years as observed in placebo groups in large osteoarthritis trials (Nüesch 2009), to calculate NNTHs for safety outcomes. All P values were two‐sided. We performed analyses using Review Manager 5 (RevMan 2012), and STATA version 11.2 (StataCorp, College Station, Texas).
Results
Description of studies
We identified 5099 potentially relevant references through our electronic searches (Figure 1); we excluded 4984 references after screening titles and abstracts and retrieved 115 potentially relevant references for full‐text assessment. We included 22 randomised controlled trials in the review. Checking reference lists, trial registers, and handsearching of conference proceedings yielded five additional trials.
Three trials evaluated weak opioids. All three compared codeine with placebo (Kjaersgaard‐Andersen 1990; Quiding 1992; Peloso 2000), one of these with paracetamol 3000 mg daily as analgesic co‐intervention administered in both the experimental and control groups (Kjaersgaard‐Andersen 1990), and another with ibuprofen 1200 mg daily administered in both groups (Quiding 1992). Strong opioids were compared with placebo in 19 trials. Hydromorphone was used in one trial (NCT00980798), morphine in two trials (Caldwell 2002; Katz 2010), oxymorphone in two trials (Matsumoto 2005; Kivitz 2006), oxycodone in 10 trials (Chindalore 2005; Markenson 2005; Matsumoto 2005; Zautra 2005; Hartrick 2009; Afilalo 2010; Etropolski 2011; Fidelholtz 2011; Friedmann 2011; NCT00486811), and tapentadol in four trials (Hartrick 2009; Afilalo 2010; Etropolski 2011; NCT00486811). Transdermal opioids were studied in five trials: buprenorphine in four trials (Shannon 2005; Breivik 2010; Munera 2010; NCT00531427), and fentanyl in one trial (Langford 2006). Opioids were administered at a median daily dose of 59‐mg morphine equivalents (range 13 to 160 mg).
The median treatment duration was four weeks (range three days to six months). Trials randomised a median of 344 participants (range 27 to 10301 participants). Twenty trials (90%) were multicentre trials, 21 were parallel group, and one was a cross‐over trial (Quiding 1992). Two trials exclusively included participants with hip osteoarthritis (Kjaersgaard‐Andersen 1990; Quiding 1992), four trials included only participants with knee osteoarthritis (Zautra 2005; NCT0048681; Afilalo 20101; NCT00531427), and 16 trials included a mixed population of both knee and hip osteoarthritis (Peloso 2000; Caldwell 2002; Chindalore 2005; Markenson 2005; Matsumoto 2005; Shannon 2005; Kivitz 2006; Langford 2006; Hartrick 2009; Breivik 2010; Katz 2010; Munera 2010; Etropolski 2011; Fidelholtz 2011; Friedmann 2011; NCT00980798). In 17 studies, only participants with insufficient analgesic response to paracetamol, NSAIDs, or previous opioid treatment were included (NCT00980798; NCT00531427; Caldwell 2002; Chindalore 2005; Markenson 2005; Matsumoto 2005; Shannon 2005; Kivitz 2006; Langford 2006; Hartrick 2009; Afilalo 2010; Breivik 2010; Katz 2010; Munera 2010; Etropolski 2011; Friedmann 2011; NCT00486811). None of these trials provided detailed information about the dosage of the analgesic treatments before entering the trial. The three trials assessing codeine included participants with a need for analgesic treatment but without any requirement of previous insufficient treatment response (Kjaersgaard‐Andersen 1990; Quiding 1992; Peloso 2000); two trials did not provide information about eligibility criteria concerning the previous analgesic therapy (Zautra 2005; Fidelholtz 2011).
The Characteristics of excluded studies table displays the reasons why we did not consider trials in this systematic review. Typical reasons were more than 25% of participants with rheumatoid arthritis in the sample, the use of active control interventions, or the use of cross‐over designs without providing sufficient information on the first phase.
Risk of bias in included studies
Figure 2 summarises the methodological characteristics and sources of funding of included trials. Six trials (27%) reported both adequate sequence generation and adequate allocation concealment (Markenson 2005; Kivitz 2006; Langford 2006; Afilalo 2010; Breivik 2010; Etropolski 2011), two trials reported only adequate sequence generation (Matsumoto 2005; Hartrick 2009), and two trials reported adequate concealment but remained unclear about the generation of allocation sequence (Zautra 2005; Katz 2010). In the remaining 12 trials, low quality of reporting hampered any judgement regarding sequence generation and concealment of allocation. All 22 trials were described as double blind. Eleven trials reported the use of indistinguishable interventions to blind participants whereas another four trials used double‐dummy techniques (Quiding 1992; Caldwell 2002; Kivitz 2006; Afilalo 2010). Fourteen trials explicitly reported adequate blinding of physicians. Seventeen trials described their analysis to be according to the intention‐to‐treat principle, but only one trial was considered to have an intention‐to‐treat analysis of pain (NCT00531427), and one trial of function outcomes at end of treatment (Katz 2010), according to our criteria. Exclusion of participants from the analysis of pain outcomes ranged from 0.6% to 52% in the experimental groups and from 0% to 33% in the control groups. For eight trials, no information was available on the proportion of excluded participants (NCT00980798; Quiding 1992; Caldwell 2002; Markenson 2005; Langford 2006; Hartrick 2009; Fidelholtz 2011; NCT00486811). For the analysis of function outcomes, exclusion of participants ranged from 1% to 73% in the experimental groups and from 0.6% to 53% in the control groups; in four trials, no information was available on the proportion of excluded patients (Caldwell 2002; Markenson 2005; Langford 2006; NCT00486811).
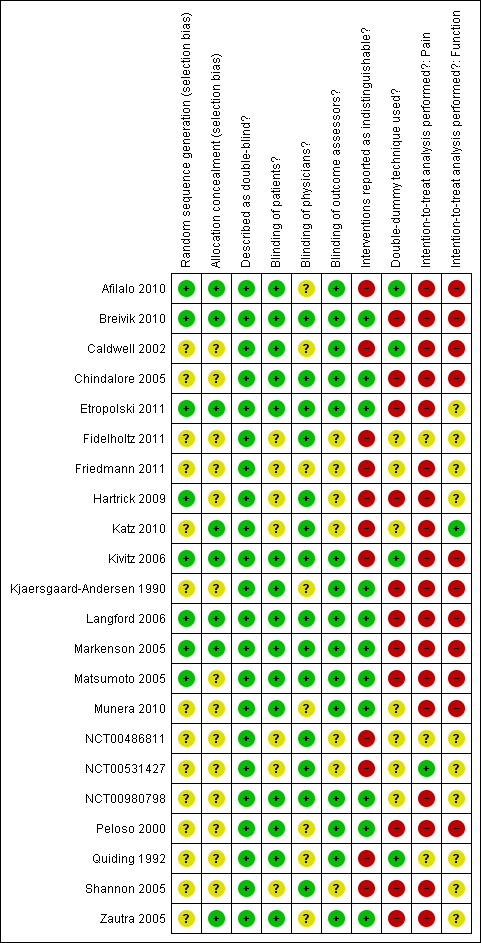
Methodological characteristics of included trials. (+) indicates low risk of bias, (?) unclear, and (‐) a high risk of bias on a specific item.
All trials (95%) except for one (Quiding 1992) reported a primary outcome of which eight explicitly reported it to be pre‐specified in the protocol (Peloso 2000; Caldwell 2002; Markenson 2005; Matsumoto 2005; Langford 2006; Katz 2010; NCT00486811; NCT00531427), and 13 trials reported a sample size calculation for this primary outcome. Twenty trials received financial support from a commercial organisation, two were unclear about their source of funding (Kjaersgaard‐Andersen 1990; Quiding 1992), whereas no trial was explicitly supported by a non‐profit organisation. For the effectiveness outcomes pain and function, the quality of the evidence (Guyatt 2008) was classified as high in view of the low risk of bias in the included trials and the low heterogeneity between trials (summary of findings Table for the main comparison). For adverse event and serious adverse event outcomes, the quality of the evidence (Guyatt 2008) was classified as moderate to low because of the small number of trials reporting the outcomes and the small number of serious adverse events, which resulted in imprecise estimates (summary of findings Table for the main comparison).
Effects of interventions
Primary outcomes
Knee or hip pain
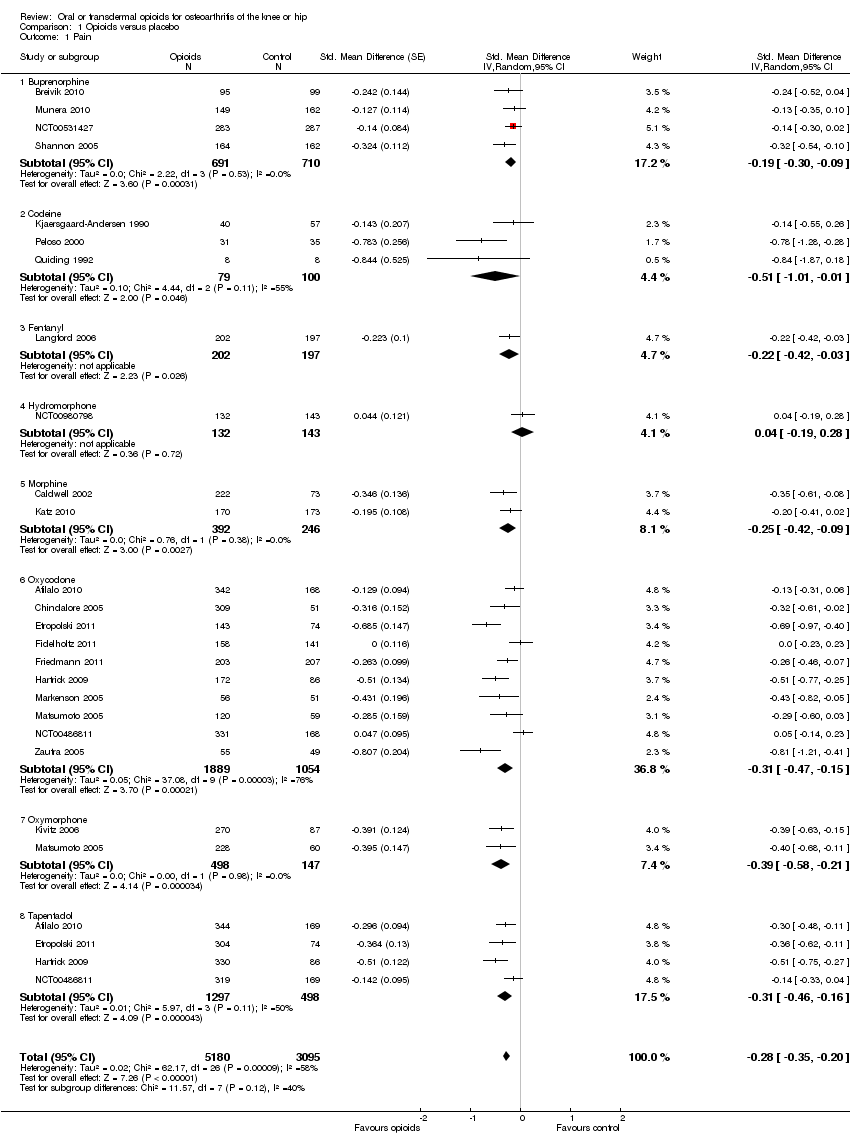
Twenty‐two trials including 5180 participants in experimental groups and 3095 participants in control groups contributed to the analyses of knee or hip pain. Figure 3 presents results of the analysis, overall and stratified according to type of opioid. In the overall analysis, combined oral and transdermal opioids were more effective in pain reduction than control interventions (SMD ‐0.28, 95% CI ‐0.35 to ‐0.20), which corresponds to a difference in pain scores of 0.7 cm on a 10‐cm VAS between opioids and placebo. This corresponds to a difference in improvement of 12% (95% CI 9% to 15%) between opioids and placebo (summary of findings Table for the main comparison), which translates into an NNTB to cause one additional treatment response on pain of 10 (95% CI 8 to 14) (summary of findings Table for the main comparison). An I2 statistic of 58% indicated a moderate degree of between‐trial heterogeneity (P for heterogeneity < 0.001). A visual inspection of the funnel plot suggested asymmetry (asymmetry coefficient ‐1.86, 95% CI ‐3.50 to ‐0.21) and the test for asymmetry indicated some evidence for asymmetry (P value = 0.054) (Figure 4). Benefits were moderate for codeine (SMD ‐0.51, 95% CI ‐1.01 to ‐0.01; 3 trials); small to moderate for oxycodone (SMD ‐0.31, 95% CI ‐0.47 to ‐0.15; 10 trials), oxymorphone (SMD ‐0.39, 95% CI ‐0.58 to ‐0.21; 2 trials), and tapentadol (SMD ‐0.31, 95% CI ‐0.46 to ‐0.16, 4 trials); and small for morphine (SMD ‐0.25, 95% CI ‐0.42 to ‐0.09; 2 trials) and transdermal opioids such as buprenorphine (SMD ‐0.19, 95% CI ‐0.30 to ‐0.09, 4 trials) and fentanyl (SMD ‐0.22, 95% CI ‐0.42 to ‐0.03; 1 trial). No benefit was observed for hydromorphone (SMD 0.04, 95% CI ‐0.19 to 0.28, 1 trial). The CIs were wide and a test for interaction between benefit and type of opioid was non‐significant (P value = 0.66). Table 1 presents the results of stratified analyses. We found little evidence for an association of SMDs with analgesic potency, route of administration, type of control intervention, use of analgesic co‐interventions, type of osteoarthritis, concealment of allocation, adequate blinding of participants, or intention‐to‐treat analysis. Effects were similar in studies including participants with only knee osteoarthritis (SMD ‐0.22, 95% CI ‐0.41 to ‐0.04, 4 trials), with only hip osteoarthritis (SMD ‐0.33, 95% CI ‐0.93 to 0.28, 2 trials), and with knee or hip osteoarthritis (SMD ‐0.29, 95% CI ‐0.38 to ‐0.20, 16 trials, P value for interaction = 0.77). We found larger benefits in trials with 200 or fewer randomised participants (difference in SMD ‐0.23, 95% CI ‐0.49 to 0.02, P for interaction = 0.08) and in trials with a short treatment duration of one month or less (difference in SMD ‐0.25, 95% CI ‐0.37 to ‐0.13, P value for interaction = 0.001). The effect of treatment duration on treatment benefits was similar, when we restricted the analyses to large trials only (P value for interaction 0.001). Thirty‐three comparisons from 22 trials contributed to the analysis of a linear association between equivalence dose and treatment benefit (Figure 5). We found little evidence for a linear association between daily equivalence doses and pain reduction (P value = 0.49).

Forest plot of 22 trials comparing the effects of any type of opioids and control (placebo or no intervention) on knee or hip pain. Values on x‐axis denote standardised mean differences. The plot is stratified according to type of opioids. Matsumoto 2005, Hartrick 2009, Afilalo 2010, Etropolski 2011, and NCT00486811 contributed with two comparisons and the standard error was inflated and the number of participants in the placebo group was halved to avoid duplicate counting of participants when including both comparisons in the overall meta‐analysis. Data relating to the 3, 3, 3, 2, 2, and 2 active intervention arms in Caldwell 2002, Chindalore 2005, Kivitz 2006, Matsumoto 2005, Hartrick 2009, and Etropolski 2011, respectively, were pooled.

Funnel plot for effects on knee or hip pain.
Numbers on x axis refer to standardised mean differences (SMDs), on y axis to standard errors of SMDs.

Standardised mean differences of knee or hip pain (y axis) are plotted against total daily dose of morphine equivalents (x axis). The size of the circles is proportional to the random‐effects weights that were used in the meta‐regression. The dotted line indicates predicted treatment effects (regression line) from univariable meta‐regression by using daily morphine equivalence doses the explanatory variable, and dashed lines represent the 95% confidence intervals.
| Variable | Number of | N of participants | N of participants | Pain intensity | Heterogeneity | P value* |
| All trials | 22 | 5180 | 3095 | ‐0.28 (‐0.35 to ‐0.20) | 58% | |
| Analgesic potency | 0.32 | |||||
| Weak | 3 | 79 | 100 | ‐0.51 (‐1.01 to ‐0.01) | 55% | |
| Strong | 19 | 5101 | 2995 | ‐0.26 (‐0.35 to ‐0.18) | 64% | |
| Route of administration | 0.36 | |||||
| Oral | 17 | 4287 | 2188 | ‐0.30 (‐0.41 to ‐0.20) | 70% | |
| Transdermal | 5 | 893 | 907 | ‐0.20 (‐0.29 to ‐0.11) | 0% | |
| Allocation concealment | 0.31 | |||||
| Adequate | 8 | 1981 | 1141 | ‐0.32 (‐0.44 to ‐0.21) | 48% | |
| Inadequate or unclear | 14 | 3199 | 1954 | ‐0.24 (‐0.35 to ‐0.13) | 67% | |
| Blinding of participants | 0.23 | |||||
| Adequate | 15 | 3050 | 1616 | ‐0.32 (‐0.42 to ‐0.22) | 53% | |
| Inadequate or unclear | 7 | 2130 | 1479 | ‐0.21 (‐0.34 to ‐0.08) | 73% | |
| Intention‐to‐treat analysis | 0.43 | |||||
| Yes | 1 | 283 | 287 | ‐0.14 (‐0.30 to 0.02) | N/A | |
| No or unclear | 21 | 4897 | 2808 | ‐0.29 (‐0.37 to ‐0.20) | 63% | |
| Type of control intervention | 0.97 | |||||
| Placebo | 20 | 5132 | 3030 | ‐0.28 (‐0.36 to ‐0.19) | 65% | |
| No intervention | 2 | 48 | 65 | ‐0.33 (‐0.93 to 0.28) | 35% | |
| Number of participants randomised | 0.08 | |||||
| > 200 | 16 | 4895 | 2796 | ‐0.24 (‐0.33 to ‐0.16) | 64% | |
| ≤ 200 | 6 | 285 | 299 | ‐0.47 (‐0.71 to ‐0.23) | 48% | |
| Duration of treatment | 0.001 | |||||
| > 1 month | 10 | 2635 | 1972 | ‐0.15 (‐0.22 to ‐0.08) | 25% | |
| ≤ 1 month | 12 | 2545 | 1123 | ‐0.40 (‐0.50 to ‐0.30) | 37% | |
| Use of analgesic co‐interventions | 0.59 | |||||
| Similar between groups | 6 | 1189 | 891 | ‐0.31 (‐0.46 to ‐0.16) | 60% | |
| Unclear | 16 | 3991 | 2204 | ‐0.26 (‐0.36 to ‐0.16) | 65% | |
| Type of osteoarthritis | 0.77 | |||||
| Hip only | 2 | 48 | 65 | ‐0.33 (‐0.93 to 0.28) | 35% | |
| Knee only | 4 | 1674 | 1010 | ‐0.22 (‐0.41 to ‐0.04) | 78% | |
| Knee and hip | 16 | 3458 | 2020 | ‐0.29 (‐0.38 to ‐0.20) | 56% | |
*P value for interaction. N/A: not available.
Function
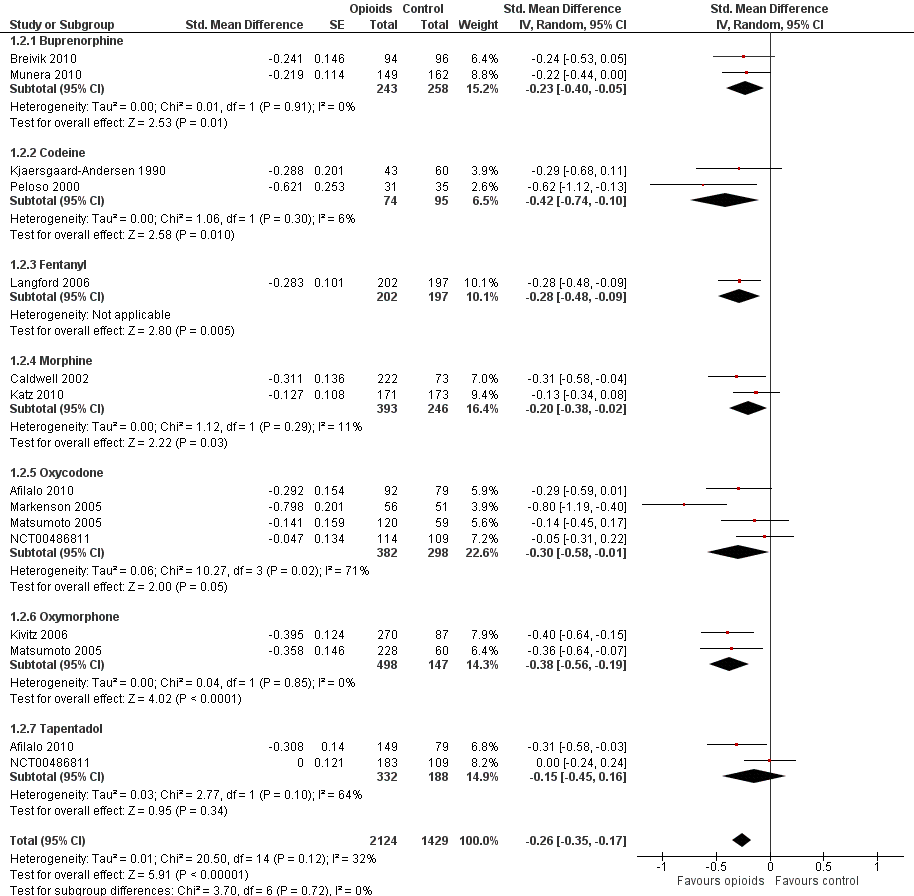
Twelve studies including 2124 participants in experimental groups and 1429 participants in control groups contributed to the analysis of function. Improvement of function was larger in opioid‐treated participants compared with control groups (SMD ‐0.26, 95% CI ‐0.35 to ‐0.17) (Figure 6), which corresponds to a difference in function scores of 0.6 units between opioids and placebo on a standardised WOMAC disability scale ranging from 0 to 10. This corresponds to a difference in improvement of 11% (95% CI 7% to 14%) between opioids and placebo (summary of findings Table for the main comparison), which translates into an NNTB to cause one additional treatment response on function of 11 (95% CI 7 to 14) (summary of findings Table for the main comparison). An I2 statistic of 32% indicated a low degree of between‐trial heterogeneity (P value for heterogeneity = 0.12). We found a moderate benefit for codeine (SMD ‐0.42, 95% CI ‐0.74 to ‐0.10; 2 trials) and oxymorphone (SMD ‐0.38, 95% CI ‐0.56 to ‐0.19, 2 trials) and small benefits for morphine (SMD ‐0.20, 95% CI ‐0.38 to ‐0.02, 2 trials), oxycodone (SMD ‐0.30, 95% CI ‐0.58 to ‐0.01, 4 trials), tapentadol (SMD ‐0.15, 95% CI ‐0.45 to 0.16, 2 trials), and for transdermal opioids such as buprenorphine (SMD ‐0.23, 95% CI ‐0.40 to ‐0.05, 2 trials) and fentanyl (SMD ‐0.28, 95% CI ‐0.48 to ‐0.09; 1 trial). As was the case for pain, CIs of estimates were wide and a test for interaction between benefit and type of opioid was non‐significant (P value = 0.87). Heterogeneity between trials was low with an I2 statistic estimate of 32% (P value for heterogeneity = 0.12). The funnel plot (Figure 7) appeared asymmetrical (asymmetry coefficient ‐3.33, 95% CI ‐5.76 to ‐0.89, P value for asymmetry = 0.011). Table 2 presents the results of the stratified analyses. We found little evidence for an association of SMDs with analgesic potency, route of administration, type of control intervention, treatment duration, use of analgesic co‐interventions, type of osteoarthritis, allocation concealment, and intention‐to‐treat analysis. Effects were similar in studies including participants with only knee osteoarthritis (SMD ‐0.16, 95% CI ‐0.43 to 0.11, 2 trials), only hip OA (SMD ‐0.29, 95% CI ‐0.68 to 0.11, 1 trial), and knee or hip OA (SMD ‐0.31, 95% CI ‐0.41 to ‐0.20, 9 trials, P value for interaction 0.45). Adequately powered trials with 200 or more randomised participants tended to show smaller improvements of function (difference in SMD 0.23, 95% CI ‐0.06 to 0.52, P value for interaction = 0.11) and trials with adequate participant blinding larger benefits of function (difference in SMD ‐0.25, 95% CI ‐0.41 to ‐0.09, P value for interaction = 0.008). Eighteen comparisons from 12 trials contributed to the analysis of a linear association between equivalence dose and treatment benefit for function (Figure 8). We found no evidence for an association between daily equivalence doses and improvement of function (P value = 0.48).

Forest plot of 12 trials comparing the effects of any type of opioids and control (placebo or no intervention) on function. Values on x axis denote standardised mean differences. The plot is stratified according to type of opioids. Matsumoto 2005 contributed with two comparisons and the standard error was inflated and the number of participants in the placebo group was halved to avoid duplicate counting of participants when including both comparisons in the overall meta‐analysis. Data relating to the 3, 3, and 2 active intervention arms in Caldwell 2002, Kivitz 2006, and Matsumoto 2005, respectively, were pooled.

Funnel plot for effects on functioning of the knee or hip.
Numbers on x axis refer to standardised mean differences (SMDs), on y axis to standard errors of SMDs

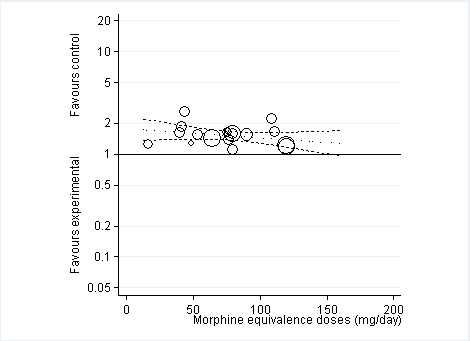
Standardised mean differences of function (y axis) are plotted against total daily dose of morphine equivalents (x axis). The size of the circles is proportional to the random‐effects weights that were used in the meta‐regression. The dotted line indicates predicted treatment effects (regression line) from univariable meta‐regression by using daily morphine equivalence doses the explanatory variable, and dashed lines represent the 95% confidence intervals.
| Variable | Number of | N of participants | N of participants | Function | Heterogeneity | P value* |
| All trials | 12 | 2124 | 1429 | ‐0.26 (‐0.35 to ‐0.17) | 32% | |
| Analgesic potency | 0.42 | |||||
| Weak | 2 | 74 | 95 | ‐0.42 (‐0.74 to ‐0.10) | 6% | |
| Strong | 10 | 2050 | 1334 | ‐0.26 (‐0.36 to ‐0.16) | 48% | |
| Route of administration | 0.76 | |||||
| Oral | 9 | 1679 | 974 | ‐0.30 (‐0.43 to ‐0.16) | 58% | |
| Transdermal | 3 | 445 | 455 | ‐0.25 (‐0.38 to ‐0.12) | 0% | |
| Allocation concealment | 0.43 | |||||
| Adequate | 6 | 1034 | 762 | ‐0.32 (‐0.45 to ‐0.18) | 47% | |
| Inadequate or unclear | 6 | 1090 | 667 | ‐0.23 (‐0.37 to ‐0.09) | 39% | |
| Blinding of participants | 0.008 | |||||
| Adequate | 10 | 1656 | 1038 | ‐0.32 (‐0.40 to ‐0.24) | 0% | |
| Inadequate or unclear | 2 | 468 | 391 | ‐0.07 (‐0.20 to 0.07) | 0% | |
| Intention‐to‐treat analysis | 0.34 | |||||
| Yes | 1 | 171 | 173 | ‐0.13 (‐0.34 to 0.08) | N/A | |
| No or unclear | 11 | 1953 | 1256 | ‐0.29 (‐0.40 to ‐0.19) | 44% | |
| Type of control intervention | 0.96 | |||||
| Placebo | 11 | 2081 | 1369 | ‐0.28 (‐0.38 to ‐0.18) | 49% | |
| No intervention | 1 | 43 | 60 | ‐0.29 (‐0.68 to 0.11) | N/A | |
| Number of participants randomised | 0.11 | |||||
| > 200 | 8 | 1900 | 1187 | ‐0.23 (‐0.32 to ‐0.14) | 26% | |
| ≤ 200 | 4 | 224 | 242 | ‐0.46 (‐0.73 to ‐0.19) | 51% | |
| Duration of treatment | 0.41 | |||||
| > 1 month | 6 | 1061 | 893 | ‐0.25 (‐0.41 to ‐0.09) | 66% | |
| ≤ 1 month | 6 | 1063 | 536 | ‐0.31 (‐0.42 to ‐0.20) | 0% | |
| Use of analgesic co‐interventions | 0.38 | |||||
| Similar between groups | 4 | 460 | 456 | ‐0.40 (‐0.67 to ‐0.13) | 71% | |
| Unclear | 8 | 1664 | 973 | ‐0.24 (‐0.33 to ‐0.15) | 16% | |
| Type of osteoarthritis | 0.45 | |||||
| Hip only | 1 | 43 | 60 | ‐0.29 (‐0.68 to 0.11) | N/A | |
| Knee only | 2 | 538 | 376 | ‐0.16 (‐0.43 to 0.11) | 76% | |
| Knee and hip | 9 | 1543 | 993 | ‐0.31 (‐0.41 to ‐0.20) | 31% | |
*P value for interaction. N/A: not available.
Secondary outcomes
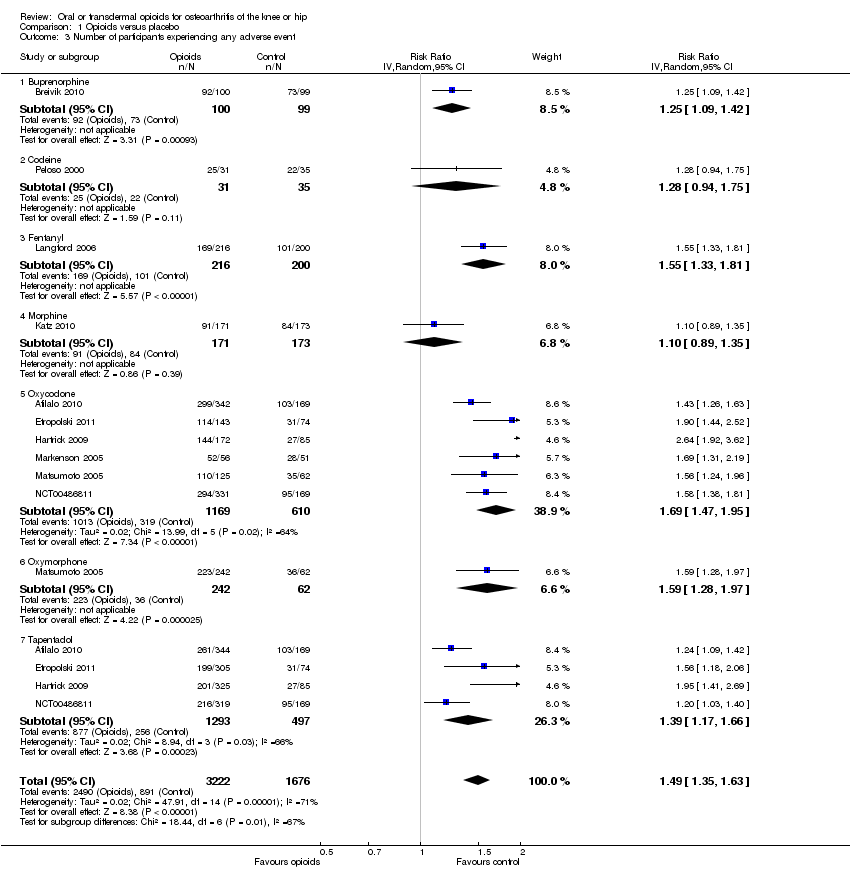
Ten trials reported the occurrence of any adverse event in 2490 out of 3222 participants in experimental groups and 891 of 1676 participants in control groups (Figure 9). Participants were 49% more likely to experience adverse events in experimental groups compared with placebo (RR 1.49, 95% CI 1.35 to 1.63). The NNTH to cause one additional participant to experience an adverse event, as compared to placebo, was 14 (95% CI 11 to 19) (summary of findings Table for the main comparison). We found high heterogeneity between different studies (I2 = 71%, P value for heterogeneity < 0.001), but no evidence that RRs differed between different types of opioids (P value for interaction = 0.47) or length of treatment duration (P value = 0.09). Eighteen comparisons in nine trials contributed to the analysis of the association between equivalence dose and log relative risk (Figure 10). We found little evidence for a relationship (P value = 0.24).
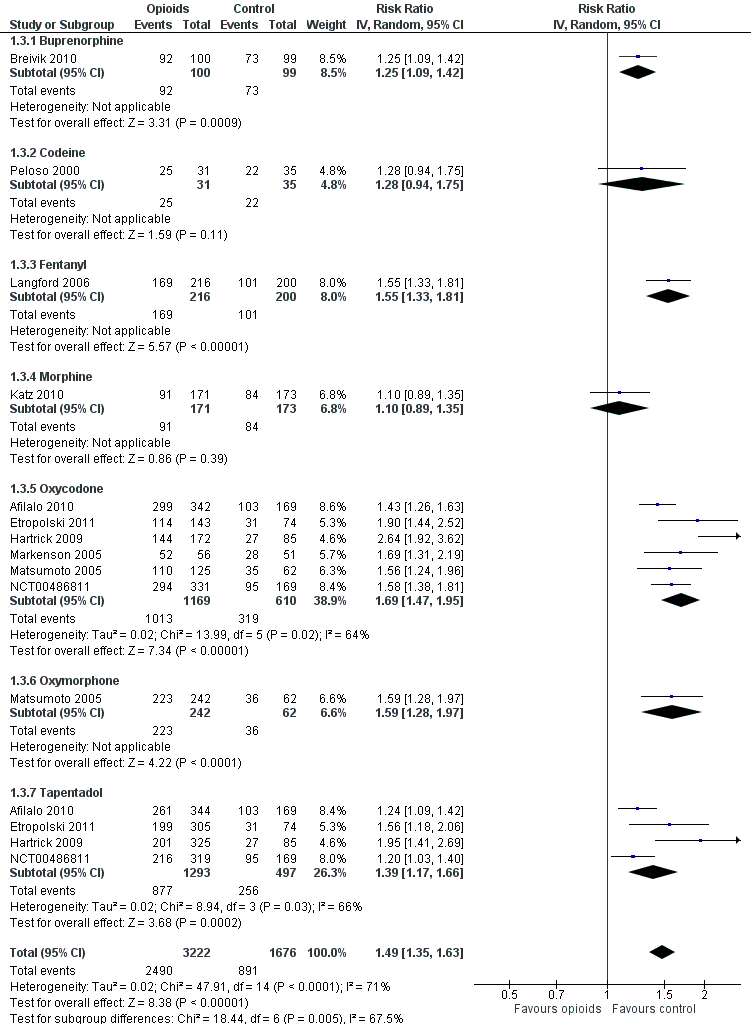
Forest plot of 10 trials comparing participants experiencing any adverse event between any opioid and control (placebo or no intervention). Values on x axis denote risks ratios. The plot is stratified according to type of opioid. Matsumoto 2005, Hartrick 2009, Afilalo 2010, Etropolski 2011, and NCT00486811 contributed with two comparisons and the number of participants in the placebo group was halved to avoid duplicate counting of participants when including both comparisons in the overall meta‐analysis.
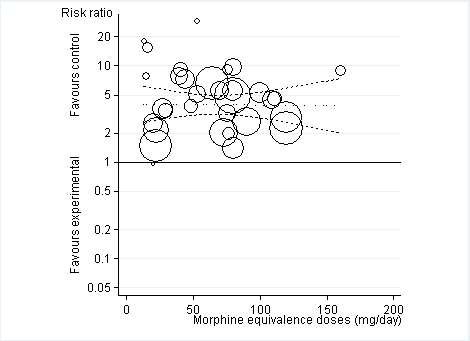
Risk ratios of participants experiencing any adverse event between opioids and control groups (y axis) are plotted against total daily dose of morphine equivalents (x axis). The size of the circles is proportional to the random‐effects weights that were used in the meta‐regression. The dotted line indicates predicted treatment effects (regression line) from univariable meta‐regression by using daily morphine equivalence doses the explanatory variable, and dashed lines represent the 95% confidence intervals.
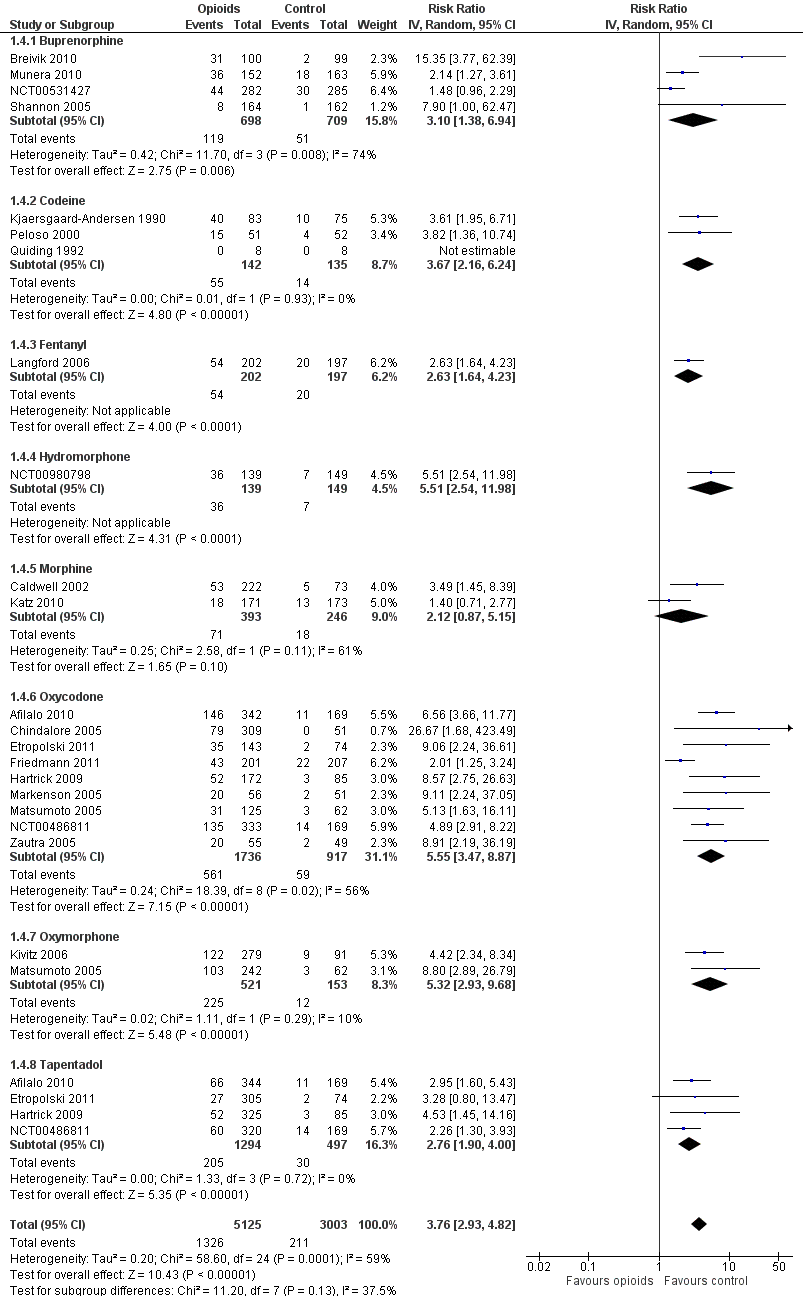
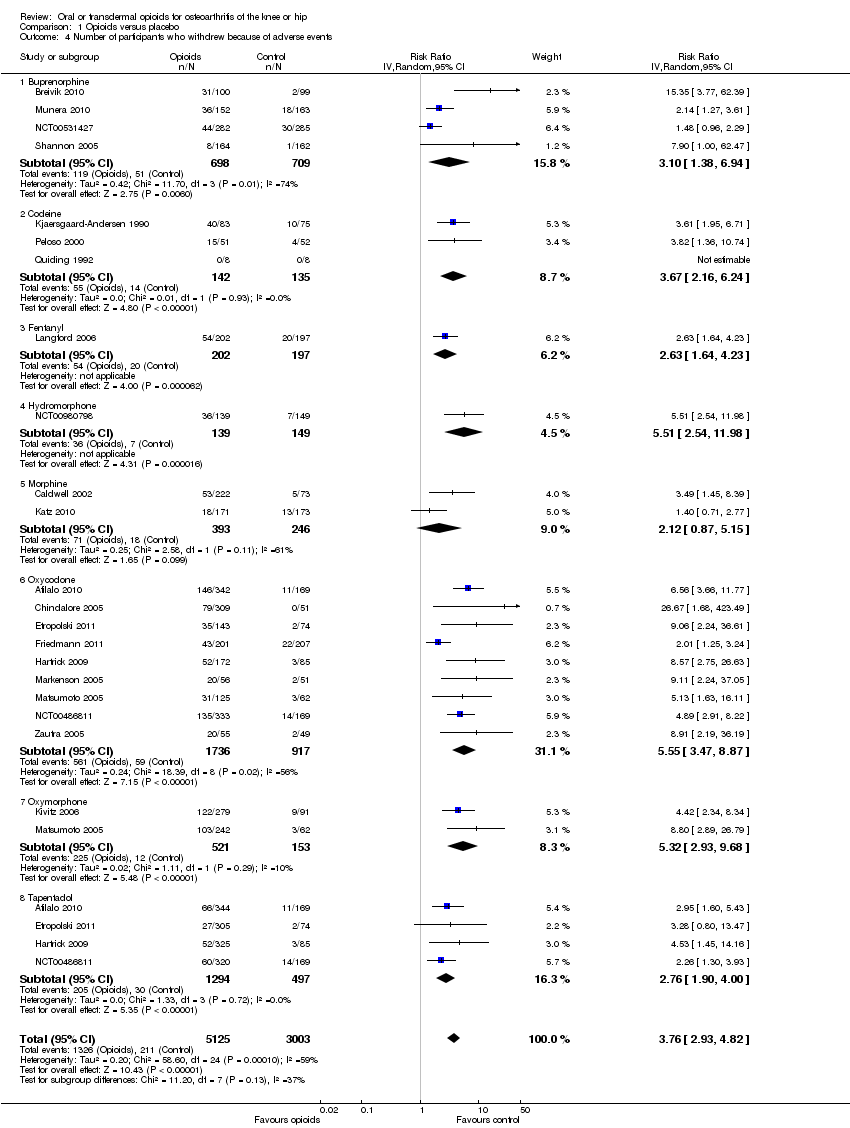
Twenty‐one trials with 8128 participants contributed to the meta‐analysis of participants withdrawn or dropped out because of adverse events (Figure 11). Participants receiving opioid therapy were 3.8 times as likely as participants receiving placebo to be withdrawn or drop‐out due to adverse events (RR 3.76, 95% CI 2.93 to 4.82), with moderate between‐trial heterogeneity (I2 = 59%, P value for heterogeneity < 0.001). The NNTH to cause one additional drop‐out or withdrawal due to adverse events compared with placebo was 21 (95% CI 15 to 30) (summary of findings Table for the main comparison). We found the highest pooled RR for oxycodone versus placebo (RR 5.55, 95% CI 3.47 to 8.87, 9 trials) and the lowest pooled RR for morphine versus placebo (RR 2.12, 95% CI 0.87 to 5.15, 2 trials) but CIs were wide and a test for interaction between type of opioids and relative risk of being withdrawn or dropping out because of adverse events negative gave a P value for interaction of 0.41. We found no evidence for an association between treatment duration and risk of withdrawals or drop‐outs due to adverse events (P value for interaction 0.78). Thirty‐two comparisons in 22 trials contributed to the analysis of the association between equivalence dose and log relative risk (Figure 12). We found little evidence for a relationship (P value = 0.94).

Forest plot of 21 trials comparing participants withdrawn or dropped out because of adverse events between any opioid and control (placebo or no intervention). Values on x axis denote risks ratios. The plot is stratified according to type of opioid. Matsumoto 2005, Hartrick 2009, Afilalo 2010, Etropolski 2011, and NCT00486811 contributed with two comparisons and the number of participants in the placebo group was halved to avoid duplicate counting of participants when including both comparisons in the overall meta‐analysis. The risk ratio in one trial could not be estimated because no withdrawals or drop‐outs because of adverse events occurred in either group.
Risk ratios of participants withdrawn or dropped out because of adverse events between opioids and control groups (y axis) are plotted against total daily dose of morphine equivalents (x axis). The size of the circles is proportional to the random‐effects weights that were used in the meta‐regression. The dotted line indicates predicted treatment effects (regression line) from univariable meta‐regression by using daily morphine equivalence doses the explanatory variable, and dashed lines represent the 95% confidence intervals.
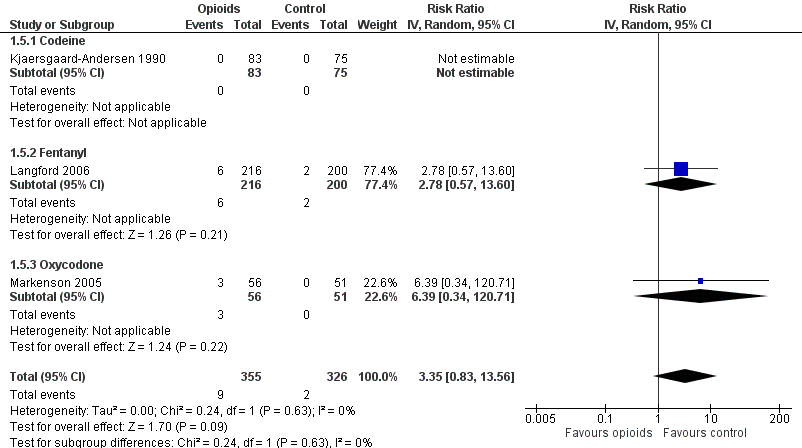
Three trials with 681 participants contributed to the analysis of participants experiencing any serious adverse event (Figure 13). One trial reported one death in the oxycodone group, but no other serious adverse events and was not included in the analysis (Afilalo 2010). Of the three trials included, one trial reported that no participant experienced a serious adverse event (Kjaersgaard‐Andersen 1990). Overall data from the remaining two trials indicated that participants receiving opioids tended be more likely to experience a serious adverse event (RR 3.35, 95% CI 0.83 to 13.56). Due to the low number of trials and events, we neither performed an analysis of the association between treatment duration or equivalence dose and log relative risk for this outcome, nor a calculation of NNTH to cause one additional participant to experience a serious adverse event compared with placebo.

Forest plot of three trials comparing participants experiencing any serious adverse event between any opioid and control (placebo or no intervention). Values on x axis denote risks ratios. The plot is stratified according to type of opioid. The risk ratio in one trial could not be estimated because no serious adverse event occurred in either group.
Three trials reported symptoms of opioid dependency (Langford 2006; Afilalo 2010; Katz 2010). Two studies reported 25 of 397 participants with withdrawal symptoms in oral opioids and five of 255 in control groups (Afilalo 2010; Katz 2010). One study assessed opiate withdrawal symptoms after eight weeks of transdermal fentanyl therapy, using the Short Opiate Withdrawal Scale questionnaire (Gossop 1990; Langford 2006). On average, participants in the opioids groups had a 2.8‐fold increased risk of withdrawal symptoms compared with control groups with a pooled OR of 2.76 (95% CI 2.02 to 3.77) (Figure 14). The NNTH to cause one additional participant to experience withdrawal symptoms, as compared with control, was 65 (95% CI 42 to 110).

Forest plot of 4 comparisons in three trials comparing participants experiencing withdrawal symptoms between any opioid and control (placebo or no intervention). Values on x axis denote odds ratios. The plot is stratified according to type of opioid. Afilalo 2010 contributed with two comparisons and the number of participants in the placebo group was halved to avoid duplicate counting of participants when including both comparisons in the overall meta‐analysis.
Discussion
Summary of main results
In this update of our systematic review and meta‐analysis, we found only small benefits of oral or transdermal opioids being more effective compared with placebo in terms of pain relief and improvement of function in people with osteoarthritis. If participants received opioids for more than four weeks, benefits on pain relief were even further reduced. The occurrence of adverse events often caused participants to stop taking the opioids, which is likely to limit the usefulness of opioids in the long term. The potentially higher risk of serious adverse events and substance addiction might further limit their use. The reporting of safety outcomes was incomplete and adverse events were reported in only about half of the trials, and serious adverse events in three trials only. Trials that did report safety outcomes consistently observed a significant increase in the risk of adverse events with opioid use.
Quality of the evidence
Most of the trials were funded by the pharmaceutical industry and we did not have enough data to explore whether the type of funding was associated with the estimated treatment effects. We found larger benefits on pain relief in studies with opioid use for less than four weeks compared with longer treatments, but not dependence of benefits on function or safety outcomes according to treatment duration. Thus, the effectiveness of opioids may drop during chronic use as the analgesic effects of opioids are mediated through opioids receptors, but safety concerns were not affected by this. The relatively low dose of morphine equivalents (median daily dose 67 mg) administered in the included trials might provide an explanation of the small benefits observed as compared with other studies (Maier 2002). Our ability to provide a reliable assessment of dose dependency might have been hampered by the generally low morphine equivalent doses used and the lack of individual participant data. The generally used distinction between weak and strong opioids can be misleading, because the analgesic potency depends also on the dosage. Thus, we calculated morphine equivalence doses to be able to compare different opioids, but found no evidence for dose‐dependent effects. We found little evidence that stronger opioid agents or higher doses of these agents will result in larger treatment effects. However, it is possible that type of opioids interacts with dosage. For instance, higher doses could have larger treatment effects for stronger but not for weaker opioids. The characteristics of the trials included in our review did not allow us to explore such interaction properly.
Data on risks of addiction due to opioid therapy is scarce, and currently available trials are not designed to evaluate these issues. There is a clear need for additional randomised trials and observational studies using longer follow‐up times to address the risks of substance dependence associated with different opioids. In this systematic review, only three out of 22 trials reported measures of withdrawal symptoms (Langford 2006; Afilalo 2010; Katz 2010). Similar to previous systematic reviews of randomised trials on opioids therapy for non‐cancer pain (Kalso 2004; Furlan 2006), we found that most of the trials included in our review had a treatment duration of several days or a few weeks only. Although some of the newer trials in the update had slightly longer treatment durations (Afilalo 2010; Breivik 2010; NCT00486811; NCT00980798), in none of the trials did participants receive opioids for longer than six months. This is still too short to address the impact of opioid treatment on routine clinical practice in the treatment of a chronic condition such as osteoarthritis. While no evidence of long‐term effects is available from randomised trials, observational studies indicate that long‐term treatment with opioids of chronic conditions such as osteoarthritis may have deleterious effects and do not seem to improve pain relief (Eriksen 2006).
Potential biases in the review process
We based our review on a broad literature search. Even though we cannot exclude potential publication bias, it seems rather unlikely that we missed relevant trials (Egger 2003). Two review authors independently performed selection of trials and data extraction to minimise bias and transcription errors (Egger 2001; Gøtzsche 2007). The most recent systematic review on opioids for osteoarthritis (Avouac 2007), updated in October 2006, considered 18 studies that compared opioids with placebo. We included data from six of these in our meta‐analysis and data from four additional trials (Kjaersgaard‐Andersen 1990; Quiding 1992; Matsumoto 2005; Kivitz 2006). We excluded six trials with tramadol as the experimental intervention and one trial that was likely to have included only a minority of people with osteoarthritis. In our update, we identified 12 additional trials, of which three are unpublished. In conclusion, we are likely to have included all relevant trials in our systematic review.
Agreements and disagreements with other studies or reviews
We excluded tramadol from our review to avoid overlap with another Cochrane review that focused on this specific opioid in osteoarthritis (Cepeda 2006). Extracted pain and function outcomes and follow‐up time in the previous systematic review about opioids for osteoarthritis (Avouac 2007) were similar to our systematic review. Comparing opioids with placebo controls, Avouac 2007 found a large pooled effect for pain intensity (SMD ‐0.79, 95% CI ‐0.98 to ‐0.59) and a moderate pooled effect for function (SMD ‐0.31, 95% CI ‐0.39 to ‐0.24). These effects are consistent with our results for function but are substantially larger for pain reduction. This discrepancy might be due to the exclusion of some trials in our systematic review and to inclusion of newer trials in our update in 2012. Avouac 2007 reported moderate‐to‐large effects of tramadol for pain, between ‐0.36 to ‐0.93 SD units, in several large trials and unrealistically large beneficial effects on pain intensity in an oxycodone trial that was excluded from our review due to the likely very low percentage of participants with knee or hip osteoarthritis (Roth 2000). These trials often did not report function outcomes and could not, therefore, contribute to the pooled analysis, or they reported considerably smaller effects for function than for pain (Avouac 2007). In line with other studies, we found that adverse events occurring in participants treated with opioids often caused withdrawals and drop‐outs (Kalso 2004; Furlan 2006; Avouac 2007; Gehling 2011). Tramadol may be similar to, or even more effective than, the opioids evaluated in our review in reducing pain and improving function, but safety concerns have to be addressed further (Cepeda 2006).

Study flow chart.

Methodological characteristics of included trials. (+) indicates low risk of bias, (?) unclear, and (‐) a high risk of bias on a specific item.

Forest plot of 22 trials comparing the effects of any type of opioids and control (placebo or no intervention) on knee or hip pain. Values on x‐axis denote standardised mean differences. The plot is stratified according to type of opioids. Matsumoto 2005, Hartrick 2009, Afilalo 2010, Etropolski 2011, and NCT00486811 contributed with two comparisons and the standard error was inflated and the number of participants in the placebo group was halved to avoid duplicate counting of participants when including both comparisons in the overall meta‐analysis. Data relating to the 3, 3, 3, 2, 2, and 2 active intervention arms in Caldwell 2002, Chindalore 2005, Kivitz 2006, Matsumoto 2005, Hartrick 2009, and Etropolski 2011, respectively, were pooled.

Funnel plot for effects on knee or hip pain.
Numbers on x axis refer to standardised mean differences (SMDs), on y axis to standard errors of SMDs.

Standardised mean differences of knee or hip pain (y axis) are plotted against total daily dose of morphine equivalents (x axis). The size of the circles is proportional to the random‐effects weights that were used in the meta‐regression. The dotted line indicates predicted treatment effects (regression line) from univariable meta‐regression by using daily morphine equivalence doses the explanatory variable, and dashed lines represent the 95% confidence intervals.
Forest plot of 12 trials comparing the effects of any type of opioids and control (placebo or no intervention) on function. Values on x axis denote standardised mean differences. The plot is stratified according to type of opioids. Matsumoto 2005 contributed with two comparisons and the standard error was inflated and the number of participants in the placebo group was halved to avoid duplicate counting of participants when including both comparisons in the overall meta‐analysis. Data relating to the 3, 3, and 2 active intervention arms in Caldwell 2002, Kivitz 2006, and Matsumoto 2005, respectively, were pooled.

Funnel plot for effects on functioning of the knee or hip.
Numbers on x axis refer to standardised mean differences (SMDs), on y axis to standard errors of SMDs

Standardised mean differences of function (y axis) are plotted against total daily dose of morphine equivalents (x axis). The size of the circles is proportional to the random‐effects weights that were used in the meta‐regression. The dotted line indicates predicted treatment effects (regression line) from univariable meta‐regression by using daily morphine equivalence doses the explanatory variable, and dashed lines represent the 95% confidence intervals.

Forest plot of 10 trials comparing participants experiencing any adverse event between any opioid and control (placebo or no intervention). Values on x axis denote risks ratios. The plot is stratified according to type of opioid. Matsumoto 2005, Hartrick 2009, Afilalo 2010, Etropolski 2011, and NCT00486811 contributed with two comparisons and the number of participants in the placebo group was halved to avoid duplicate counting of participants when including both comparisons in the overall meta‐analysis.

Risk ratios of participants experiencing any adverse event between opioids and control groups (y axis) are plotted against total daily dose of morphine equivalents (x axis). The size of the circles is proportional to the random‐effects weights that were used in the meta‐regression. The dotted line indicates predicted treatment effects (regression line) from univariable meta‐regression by using daily morphine equivalence doses the explanatory variable, and dashed lines represent the 95% confidence intervals.
Forest plot of 21 trials comparing participants withdrawn or dropped out because of adverse events between any opioid and control (placebo or no intervention). Values on x axis denote risks ratios. The plot is stratified according to type of opioid. Matsumoto 2005, Hartrick 2009, Afilalo 2010, Etropolski 2011, and NCT00486811 contributed with two comparisons and the number of participants in the placebo group was halved to avoid duplicate counting of participants when including both comparisons in the overall meta‐analysis. The risk ratio in one trial could not be estimated because no withdrawals or drop‐outs because of adverse events occurred in either group.

Risk ratios of participants withdrawn or dropped out because of adverse events between opioids and control groups (y axis) are plotted against total daily dose of morphine equivalents (x axis). The size of the circles is proportional to the random‐effects weights that were used in the meta‐regression. The dotted line indicates predicted treatment effects (regression line) from univariable meta‐regression by using daily morphine equivalence doses the explanatory variable, and dashed lines represent the 95% confidence intervals.
Forest plot of three trials comparing participants experiencing any serious adverse event between any opioid and control (placebo or no intervention). Values on x axis denote risks ratios. The plot is stratified according to type of opioid. The risk ratio in one trial could not be estimated because no serious adverse event occurred in either group.

Forest plot of 4 comparisons in three trials comparing participants experiencing withdrawal symptoms between any opioid and control (placebo or no intervention). Values on x axis denote odds ratios. The plot is stratified according to type of opioid. Afilalo 2010 contributed with two comparisons and the number of participants in the placebo group was halved to avoid duplicate counting of participants when including both comparisons in the overall meta‐analysis.
Comparison 1 Opioids versus placebo, Outcome 1 Pain.

Comparison 1 Opioids versus placebo, Outcome 2 Function.
Comparison 1 Opioids versus placebo, Outcome 3 Number of participants experiencing any adverse event.
Comparison 1 Opioids versus placebo, Outcome 4 Number of participants who withdrew because of adverse events.

Comparison 1 Opioids versus placebo, Outcome 5 Number of participants experiencing any serious adverse event.

Comparison 1 Opioids versus placebo, Outcome 6 Withdrawal symptoms.
| Oral or transdermal opioids compared with placebo for osteoarthritis of the knee or hip | ||||||
| Patient or population: participants with osteoarthritis of the knee or hip Settings: various orthopaedic or rheumatology clinics Intervention: oral or transdermal opioids Comparison: placebo | ||||||
| Outcomes | Illustrative comparative risks* (95% CI) | Relative effect | No of participants | Quality of the evidence | Comments | |
| Assumed risk | Corresponding risk | |||||
| Placebo | Opioids | |||||
| Pain intensity Various pain scales. (median follow‐up: 4 weeks) | ‐1.8 cm change 29% improvement | ‐2.5 cm change 41% improvement | SMD ‐0.28 (‐0.35 to ‐0.20) | 8275 | ++++ | NNTB 10 (95% CI 8 to 14)4 |
| Function Various validated function scales. (median follow‐up: 5 weeks) | ‐1.2 units 21% improvement | ‐1.8 units on WOMAC 32% improvement | SMD ‐0.26 (‐0.35 to ‐0.17) | 3553 | ++++ | NNTB 12 (95% CI 10 to 18)7 |
| Number of participants experiencing any adverse event (median follow‐up: 8 weeks) | 150 per 1000 participant‐years8 | 224 per 1000 participant‐years | RR 1.49 (1.35 to 1.63) | 4898 | +++O | NNTH 14 (95% CI 11 to 19) |
| Number of participants who withdrew because of adverse events (median follow‐up: 6 weeks) | 17 per 1000 participant‐years8 | 64 per 1000 participant‐years | RR 3.76 (2.93 to 4.82) | 7712 | ++++ | NNTH 21 (95% CI 15 to 30) |
| Number of participants experiencing any serious adverse event (median follow‐up: 8 weeks) | 4 per 1000 participant‐years8 | 13 per 1000 participant‐years | RR 3.35 (0.83 to 13.56) | 681 | ++OO | Little evidence of harmful effect (NNTH not statistically significant) |
| Withdrawal symptoms (median follow‐up: 16 weeks) | 9 per 1000 participant‐years11 | 24 per 100 | OR 2.67 (2.02 to 3.77) | 1151 | +++O | NNTH 65 (95% CI 42 to 110) |
| *The basis for the assumed risk (e.g. the median control group risk across studies) is provided in footnotes. The corresponding risk (and its 95% confidence interval) is based on the assumed risk in the comparison group and the relative effect of the intervention (and its 95% CI). | ||||||
| GRADE Working Group grades of evidence 1 Median reduction as observed across placebo groups in large osteoarthritis trials (see methods section, Nüesch 2009). | ||||||
| Variable | Number of | N of participants | N of participants | Pain intensity | Heterogeneity | P value* |
| All trials | 22 | 5180 | 3095 | ‐0.28 (‐0.35 to ‐0.20) | 58% | |
| Analgesic potency | 0.32 | |||||
| Weak | 3 | 79 | 100 | ‐0.51 (‐1.01 to ‐0.01) | 55% | |
| Strong | 19 | 5101 | 2995 | ‐0.26 (‐0.35 to ‐0.18) | 64% | |
| Route of administration | 0.36 | |||||
| Oral | 17 | 4287 | 2188 | ‐0.30 (‐0.41 to ‐0.20) | 70% | |
| Transdermal | 5 | 893 | 907 | ‐0.20 (‐0.29 to ‐0.11) | 0% | |
| Allocation concealment | 0.31 | |||||
| Adequate | 8 | 1981 | 1141 | ‐0.32 (‐0.44 to ‐0.21) | 48% | |
| Inadequate or unclear | 14 | 3199 | 1954 | ‐0.24 (‐0.35 to ‐0.13) | 67% | |
| Blinding of participants | 0.23 | |||||
| Adequate | 15 | 3050 | 1616 | ‐0.32 (‐0.42 to ‐0.22) | 53% | |
| Inadequate or unclear | 7 | 2130 | 1479 | ‐0.21 (‐0.34 to ‐0.08) | 73% | |
| Intention‐to‐treat analysis | 0.43 | |||||
| Yes | 1 | 283 | 287 | ‐0.14 (‐0.30 to 0.02) | N/A | |
| No or unclear | 21 | 4897 | 2808 | ‐0.29 (‐0.37 to ‐0.20) | 63% | |
| Type of control intervention | 0.97 | |||||
| Placebo | 20 | 5132 | 3030 | ‐0.28 (‐0.36 to ‐0.19) | 65% | |
| No intervention | 2 | 48 | 65 | ‐0.33 (‐0.93 to 0.28) | 35% | |
| Number of participants randomised | 0.08 | |||||
| > 200 | 16 | 4895 | 2796 | ‐0.24 (‐0.33 to ‐0.16) | 64% | |
| ≤ 200 | 6 | 285 | 299 | ‐0.47 (‐0.71 to ‐0.23) | 48% | |
| Duration of treatment | 0.001 | |||||
| > 1 month | 10 | 2635 | 1972 | ‐0.15 (‐0.22 to ‐0.08) | 25% | |
| ≤ 1 month | 12 | 2545 | 1123 | ‐0.40 (‐0.50 to ‐0.30) | 37% | |
| Use of analgesic co‐interventions | 0.59 | |||||
| Similar between groups | 6 | 1189 | 891 | ‐0.31 (‐0.46 to ‐0.16) | 60% | |
| Unclear | 16 | 3991 | 2204 | ‐0.26 (‐0.36 to ‐0.16) | 65% | |
| Type of osteoarthritis | 0.77 | |||||
| Hip only | 2 | 48 | 65 | ‐0.33 (‐0.93 to 0.28) | 35% | |
| Knee only | 4 | 1674 | 1010 | ‐0.22 (‐0.41 to ‐0.04) | 78% | |
| Knee and hip | 16 | 3458 | 2020 | ‐0.29 (‐0.38 to ‐0.20) | 56% | |
| *P value for interaction. N/A: not available. | ||||||
| Variable | Number of | N of participants | N of participants | Function | Heterogeneity | P value* |
| All trials | 12 | 2124 | 1429 | ‐0.26 (‐0.35 to ‐0.17) | 32% | |
| Analgesic potency | 0.42 | |||||
| Weak | 2 | 74 | 95 | ‐0.42 (‐0.74 to ‐0.10) | 6% | |
| Strong | 10 | 2050 | 1334 | ‐0.26 (‐0.36 to ‐0.16) | 48% | |
| Route of administration | 0.76 | |||||
| Oral | 9 | 1679 | 974 | ‐0.30 (‐0.43 to ‐0.16) | 58% | |
| Transdermal | 3 | 445 | 455 | ‐0.25 (‐0.38 to ‐0.12) | 0% | |
| Allocation concealment | 0.43 | |||||
| Adequate | 6 | 1034 | 762 | ‐0.32 (‐0.45 to ‐0.18) | 47% | |
| Inadequate or unclear | 6 | 1090 | 667 | ‐0.23 (‐0.37 to ‐0.09) | 39% | |
| Blinding of participants | 0.008 | |||||
| Adequate | 10 | 1656 | 1038 | ‐0.32 (‐0.40 to ‐0.24) | 0% | |
| Inadequate or unclear | 2 | 468 | 391 | ‐0.07 (‐0.20 to 0.07) | 0% | |
| Intention‐to‐treat analysis | 0.34 | |||||
| Yes | 1 | 171 | 173 | ‐0.13 (‐0.34 to 0.08) | N/A | |
| No or unclear | 11 | 1953 | 1256 | ‐0.29 (‐0.40 to ‐0.19) | 44% | |
| Type of control intervention | 0.96 | |||||
| Placebo | 11 | 2081 | 1369 | ‐0.28 (‐0.38 to ‐0.18) | 49% | |
| No intervention | 1 | 43 | 60 | ‐0.29 (‐0.68 to 0.11) | N/A | |
| Number of participants randomised | 0.11 | |||||
| > 200 | 8 | 1900 | 1187 | ‐0.23 (‐0.32 to ‐0.14) | 26% | |
| ≤ 200 | 4 | 224 | 242 | ‐0.46 (‐0.73 to ‐0.19) | 51% | |
| Duration of treatment | 0.41 | |||||
| > 1 month | 6 | 1061 | 893 | ‐0.25 (‐0.41 to ‐0.09) | 66% | |
| ≤ 1 month | 6 | 1063 | 536 | ‐0.31 (‐0.42 to ‐0.20) | 0% | |
| Use of analgesic co‐interventions | 0.38 | |||||
| Similar between groups | 4 | 460 | 456 | ‐0.40 (‐0.67 to ‐0.13) | 71% | |
| Unclear | 8 | 1664 | 973 | ‐0.24 (‐0.33 to ‐0.15) | 16% | |
| Type of osteoarthritis | 0.45 | |||||
| Hip only | 1 | 43 | 60 | ‐0.29 (‐0.68 to 0.11) | N/A | |
| Knee only | 2 | 538 | 376 | ‐0.16 (‐0.43 to 0.11) | 76% | |
| Knee and hip | 9 | 1543 | 993 | ‐0.31 (‐0.41 to ‐0.20) | 31% | |
| *P value for interaction. N/A: not available. | ||||||
| Outcome or subgroup title | No. of studies | No. of participants | Statistical method | Effect size |
| 1 Pain Show forest plot | 22 | 8275 | Std. Mean Difference (Random, 95% CI) | ‐0.28 [‐0.35, ‐0.20] |
| 1.1 Buprenorphine | 4 | 1401 | Std. Mean Difference (Random, 95% CI) | ‐0.19 [‐0.30, ‐0.09] |
| 1.2 Codeine | 3 | 179 | Std. Mean Difference (Random, 95% CI) | ‐0.51 [‐1.01, ‐0.01] |
| 1.3 Fentanyl | 1 | 399 | Std. Mean Difference (Random, 95% CI) | ‐0.22 [‐0.42, ‐0.03] |
| 1.4 Hydromorphone | 1 | 275 | Std. Mean Difference (Random, 95% CI) | 0.04 [‐0.19, 0.28] |
| 1.5 Morphine | 2 | 638 | Std. Mean Difference (Random, 95% CI) | ‐0.25 [‐0.42, ‐0.09] |
| 1.6 Oxycodone | 10 | 2943 | Std. Mean Difference (Random, 95% CI) | ‐0.31 [‐0.47, ‐0.15] |
| 1.7 Oxymorphone | 2 | 645 | Std. Mean Difference (Random, 95% CI) | ‐0.39 [‐0.58, ‐0.21] |
| 1.8 Tapentadol | 4 | 1795 | Std. Mean Difference (Random, 95% CI) | ‐0.31 [‐0.46, ‐0.16] |
| 2 Function Show forest plot | 12 | 3553 | Std. Mean Difference (Random, 95% CI) | ‐0.26 [‐0.35, ‐0.17] |
| 2.1 Buprenorphine | 2 | 501 | Std. Mean Difference (Random, 95% CI) | ‐0.23 [‐0.40, ‐0.05] |
| 2.2 Codeine | 2 | 169 | Std. Mean Difference (Random, 95% CI) | ‐0.42 [‐0.74, ‐0.10] |
| 2.3 Fentanyl | 1 | 399 | Std. Mean Difference (Random, 95% CI) | ‐0.28 [‐0.48, ‐0.09] |
| 2.4 Morphine | 2 | 639 | Std. Mean Difference (Random, 95% CI) | ‐0.20 [‐0.38, ‐0.02] |
| 2.5 Oxycodone | 4 | 680 | Std. Mean Difference (Random, 95% CI) | ‐0.30 [‐0.58, ‐0.01] |
| 2.6 Oxymorphone | 2 | 645 | Std. Mean Difference (Random, 95% CI) | ‐0.38 [‐0.56, ‐0.19] |
| 2.7 Tapentadol | 2 | 520 | Std. Mean Difference (Random, 95% CI) | ‐0.15 [‐0.45, 0.16] |
| 3 Number of participants experiencing any adverse event Show forest plot | 10 | 4898 | Risk Ratio (IV, Random, 95% CI) | 1.49 [1.35, 1.63] |
| 3.1 Buprenorphine | 1 | 199 | Risk Ratio (IV, Random, 95% CI) | 1.25 [1.09, 1.42] |
| 3.2 Codeine | 1 | 66 | Risk Ratio (IV, Random, 95% CI) | 1.28 [0.94, 1.75] |
| 3.3 Fentanyl | 1 | 416 | Risk Ratio (IV, Random, 95% CI) | 1.55 [1.33, 1.81] |
| 3.4 Morphine | 1 | 344 | Risk Ratio (IV, Random, 95% CI) | 1.10 [0.89, 1.35] |
| 3.5 Oxycodone | 6 | 1779 | Risk Ratio (IV, Random, 95% CI) | 1.69 [1.47, 1.95] |
| 3.6 Oxymorphone | 1 | 304 | Risk Ratio (IV, Random, 95% CI) | 1.59 [1.28, 1.97] |
| 3.7 Tapentadol | 4 | 1790 | Risk Ratio (IV, Random, 95% CI) | 1.39 [1.17, 1.66] |
| 4 Number of participants who withdrew because of adverse events Show forest plot | 21 | 8128 | Risk Ratio (IV, Random, 95% CI) | 3.76 [2.93, 4.82] |
| 4.1 Buprenorphine | 4 | 1407 | Risk Ratio (IV, Random, 95% CI) | 3.10 [1.38, 6.94] |
| 4.2 Codeine | 3 | 277 | Risk Ratio (IV, Random, 95% CI) | 3.67 [2.16, 6.24] |
| 4.3 Fentanyl | 1 | 399 | Risk Ratio (IV, Random, 95% CI) | 2.63 [1.64, 4.23] |
| 4.4 Hydromorphone | 1 | 288 | Risk Ratio (IV, Random, 95% CI) | 5.51 [2.54, 11.98] |
| 4.5 Morphine | 2 | 639 | Risk Ratio (IV, Random, 95% CI) | 2.12 [0.87, 5.15] |
| 4.6 Oxycodone | 9 | 2653 | Risk Ratio (IV, Random, 95% CI) | 5.55 [3.47, 8.87] |
| 4.7 Oxymorphone | 2 | 674 | Risk Ratio (IV, Random, 95% CI) | 5.32 [2.93, 9.68] |
| 4.8 Tapentadol | 4 | 1791 | Risk Ratio (IV, Random, 95% CI) | 2.76 [1.90, 4.00] |
| 5 Number of participants experiencing any serious adverse event Show forest plot | 3 | 681 | Risk Ratio (IV, Random, 95% CI) | 3.35 [0.83, 13.56] |
| 5.1 Codeine | 1 | 158 | Risk Ratio (IV, Random, 95% CI) | 0.0 [0.0, 0.0] |
| 5.2 Fentanyl | 1 | 416 | Risk Ratio (IV, Random, 95% CI) | 2.78 [0.57, 13.60] |
| 5.3 Oxycodone | 1 | 107 | Risk Ratio (IV, Random, 95% CI) | 6.39 [0.34, 120.71] |
| 6 Withdrawal symptoms Show forest plot | 3 | Odds Ratio (Random, 95% CI) | 2.76 [2.02, 3.77] | |
| 6.1 Oxycodone | 1 | Odds Ratio (Random, 95% CI) | 2.18 [0.61, 7.81] | |
| 6.2 Morphine | 1 | Odds Ratio (Random, 95% CI) | 3.05 [0.12, 75.52] | |
| 6.3 Tapentadol | 1 | Odds Ratio (Random, 95% CI) | 0.99 [0.25, 3.97] | |
| 6.4 Fentanyl | 1 | Odds Ratio (Random, 95% CI) | 2.97 [2.13, 4.14] | |