Opiáceos transdérmicos u orales para la artrosis de rodilla o cadera
Appendices
Appendix 1. MEDLINE, EMBASE, and CINAHL search strategy
| Ovid MEDLINE | Ovid EMBASE | CINAHL through EBSCOhost |
| Search terms for design 1. randomized controlled trial.pt. | Search terms for design 1. randomized controlled trial.sh. | Search terms for design 1. (MH "Clinical Trials+") |
| Search terms for Osteoarthritis 20. exp osteoarthritis/ | Search terms for Osteoarthritis 17. exp osteoarthritis/ | Search terms for Osteoarthritis 22. osteoarthriti$ |
| Search terms for Opioids 31. exp Analgesics, Opioid/ | Search terms for Opioids 28. exp Analgesics, Opioid/ | Search terms for Opioids 44. MH " Analgesics, Opioid" |
| Combining terms 113. or/31‐112 | Combining terms 110. or/28‐109 | Combining terms 127. S21 and S43 and S126 |
Appendix 2. CENTRAL search strategy
| CENTRAL |
| Search terms for Osteoarthritis #1. MeSH descriptor Osteoarthritis explode all trees #2. (osteoarthritis* OR osteoarthro* OR gonarthriti* OR gonarthro* Search terms for Opioids #3. MeSH descriptor Analgesics, Opioid explode all trees #4. MeSH descriptor Narcotics explode all trees #5. (acetyldihydrocodeine OR alfentanil OR allylprodine OR Combining terms #6. (#1 OR #2) |

Study flow chart.

Methodological characteristics of included trials. (+) indicates low risk of bias, (?) unclear, and (‐) a high risk of bias on a specific item.

Forest plot of 22 trials comparing the effects of any type of opioids and control (placebo or no intervention) on knee or hip pain. Values on x‐axis denote standardised mean differences. The plot is stratified according to type of opioids. Matsumoto 2005, Hartrick 2009, Afilalo 2010, Etropolski 2011, and NCT00486811 contributed with two comparisons and the standard error was inflated and the number of participants in the placebo group was halved to avoid duplicate counting of participants when including both comparisons in the overall meta‐analysis. Data relating to the 3, 3, 3, 2, 2, and 2 active intervention arms in Caldwell 2002, Chindalore 2005, Kivitz 2006, Matsumoto 2005, Hartrick 2009, and Etropolski 2011, respectively, were pooled.

Funnel plot for effects on knee or hip pain.
Numbers on x axis refer to standardised mean differences (SMDs), on y axis to standard errors of SMDs.

Standardised mean differences of knee or hip pain (y axis) are plotted against total daily dose of morphine equivalents (x axis). The size of the circles is proportional to the random‐effects weights that were used in the meta‐regression. The dotted line indicates predicted treatment effects (regression line) from univariable meta‐regression by using daily morphine equivalence doses the explanatory variable, and dashed lines represent the 95% confidence intervals.
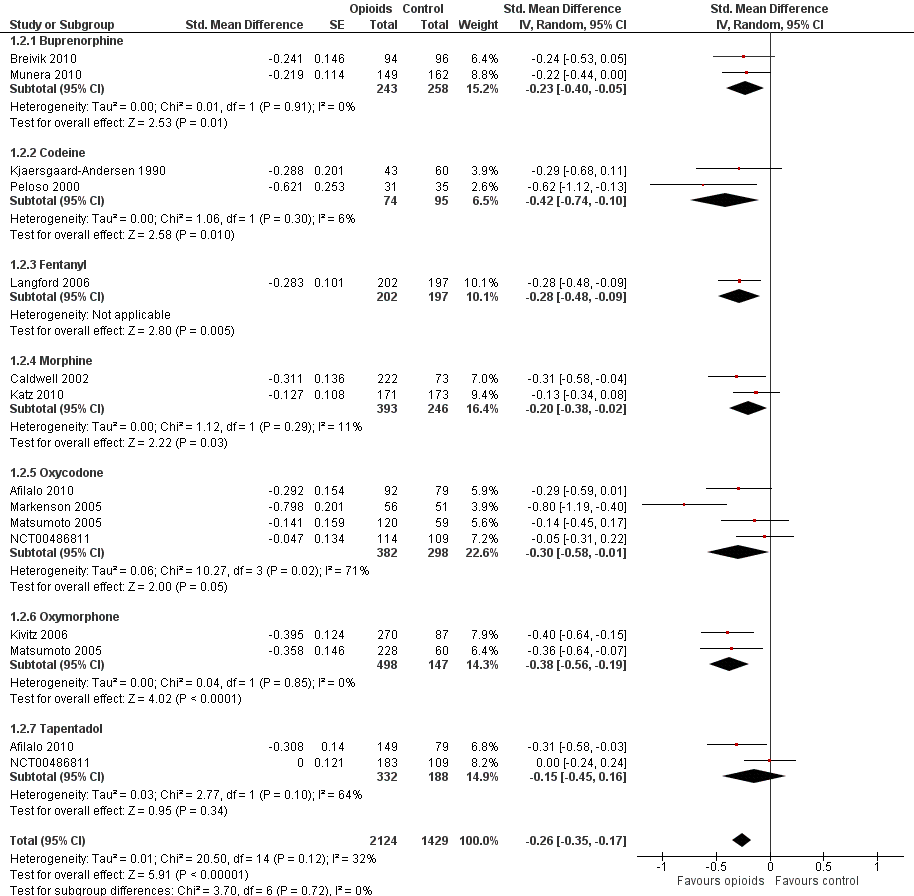
Forest plot of 12 trials comparing the effects of any type of opioids and control (placebo or no intervention) on function. Values on x axis denote standardised mean differences. The plot is stratified according to type of opioids. Matsumoto 2005 contributed with two comparisons and the standard error was inflated and the number of participants in the placebo group was halved to avoid duplicate counting of participants when including both comparisons in the overall meta‐analysis. Data relating to the 3, 3, and 2 active intervention arms in Caldwell 2002, Kivitz 2006, and Matsumoto 2005, respectively, were pooled.

Funnel plot for effects on functioning of the knee or hip.
Numbers on x axis refer to standardised mean differences (SMDs), on y axis to standard errors of SMDs

Standardised mean differences of function (y axis) are plotted against total daily dose of morphine equivalents (x axis). The size of the circles is proportional to the random‐effects weights that were used in the meta‐regression. The dotted line indicates predicted treatment effects (regression line) from univariable meta‐regression by using daily morphine equivalence doses the explanatory variable, and dashed lines represent the 95% confidence intervals.

Forest plot of 10 trials comparing participants experiencing any adverse event between any opioid and control (placebo or no intervention). Values on x axis denote risks ratios. The plot is stratified according to type of opioid. Matsumoto 2005, Hartrick 2009, Afilalo 2010, Etropolski 2011, and NCT00486811 contributed with two comparisons and the number of participants in the placebo group was halved to avoid duplicate counting of participants when including both comparisons in the overall meta‐analysis.

Risk ratios of participants experiencing any adverse event between opioids and control groups (y axis) are plotted against total daily dose of morphine equivalents (x axis). The size of the circles is proportional to the random‐effects weights that were used in the meta‐regression. The dotted line indicates predicted treatment effects (regression line) from univariable meta‐regression by using daily morphine equivalence doses the explanatory variable, and dashed lines represent the 95% confidence intervals.
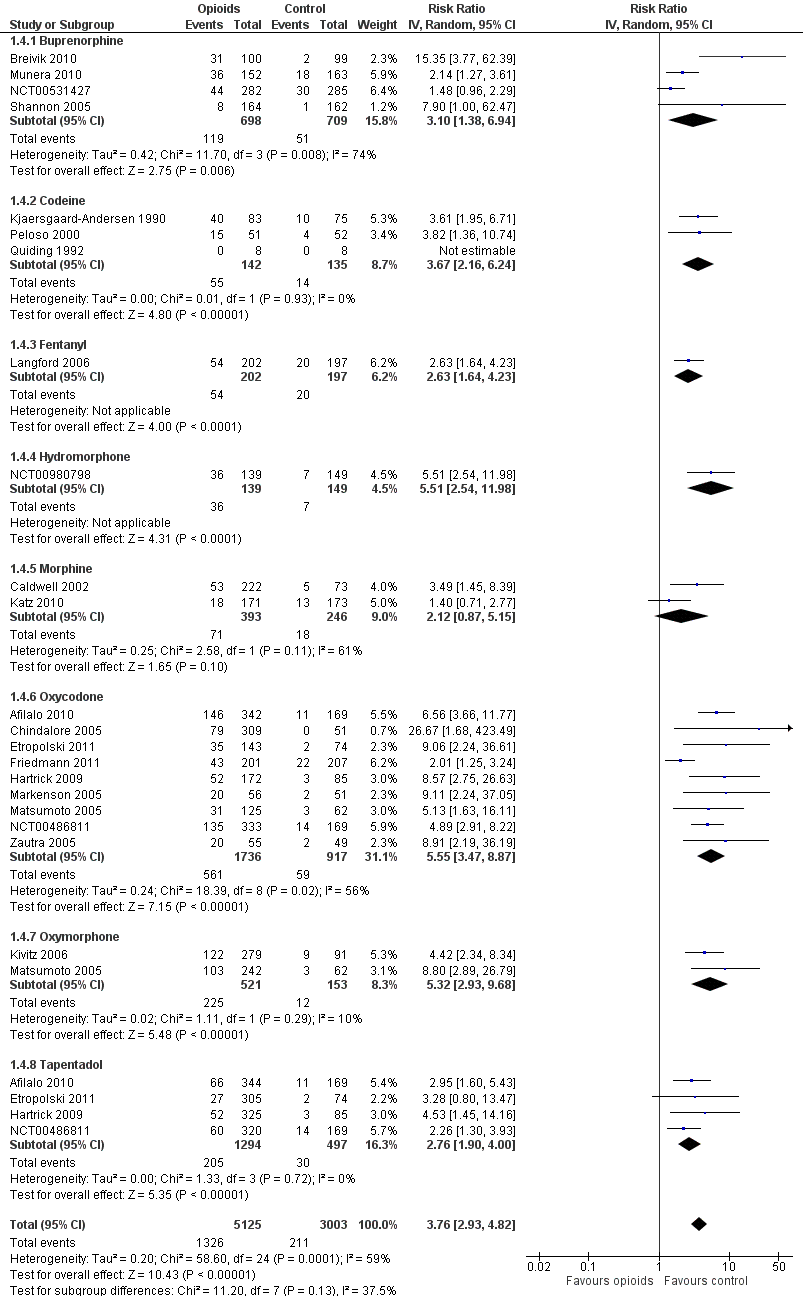
Forest plot of 21 trials comparing participants withdrawn or dropped out because of adverse events between any opioid and control (placebo or no intervention). Values on x axis denote risks ratios. The plot is stratified according to type of opioid. Matsumoto 2005, Hartrick 2009, Afilalo 2010, Etropolski 2011, and NCT00486811 contributed with two comparisons and the number of participants in the placebo group was halved to avoid duplicate counting of participants when including both comparisons in the overall meta‐analysis. The risk ratio in one trial could not be estimated because no withdrawals or drop‐outs because of adverse events occurred in either group.

Risk ratios of participants withdrawn or dropped out because of adverse events between opioids and control groups (y axis) are plotted against total daily dose of morphine equivalents (x axis). The size of the circles is proportional to the random‐effects weights that were used in the meta‐regression. The dotted line indicates predicted treatment effects (regression line) from univariable meta‐regression by using daily morphine equivalence doses the explanatory variable, and dashed lines represent the 95% confidence intervals.
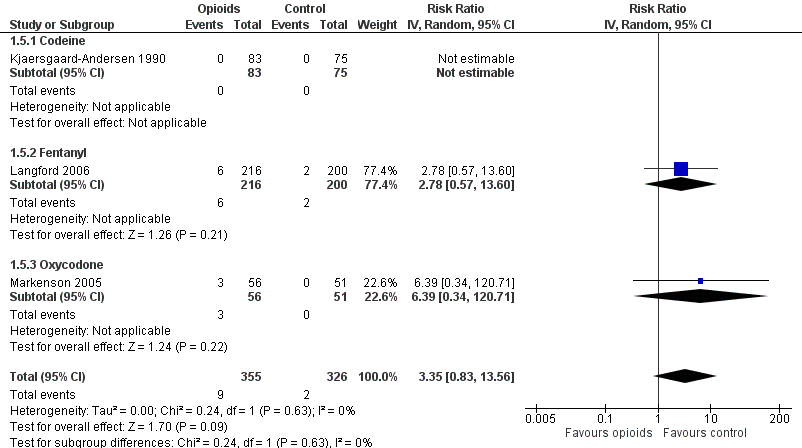
Forest plot of three trials comparing participants experiencing any serious adverse event between any opioid and control (placebo or no intervention). Values on x axis denote risks ratios. The plot is stratified according to type of opioid. The risk ratio in one trial could not be estimated because no serious adverse event occurred in either group.

Forest plot of 4 comparisons in three trials comparing participants experiencing withdrawal symptoms between any opioid and control (placebo or no intervention). Values on x axis denote odds ratios. The plot is stratified according to type of opioid. Afilalo 2010 contributed with two comparisons and the number of participants in the placebo group was halved to avoid duplicate counting of participants when including both comparisons in the overall meta‐analysis.
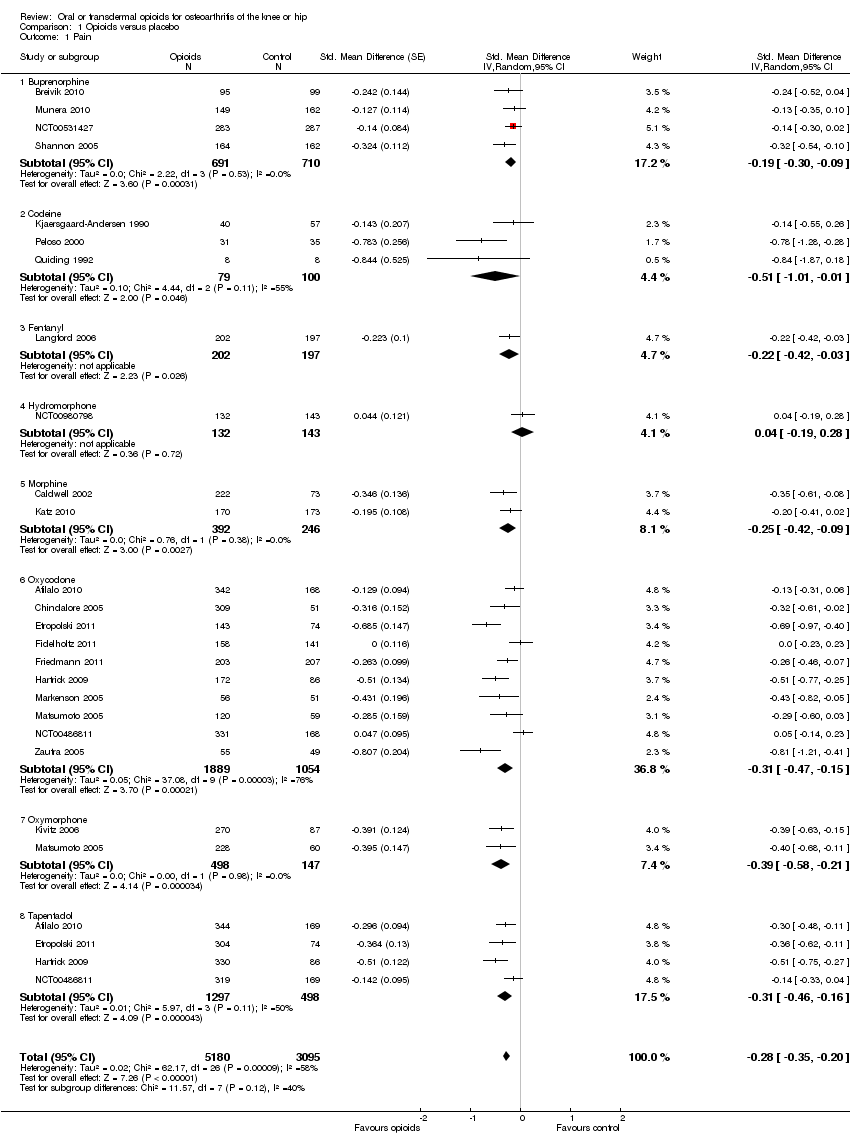
Comparison 1 Opioids versus placebo, Outcome 1 Pain.

Comparison 1 Opioids versus placebo, Outcome 2 Function.
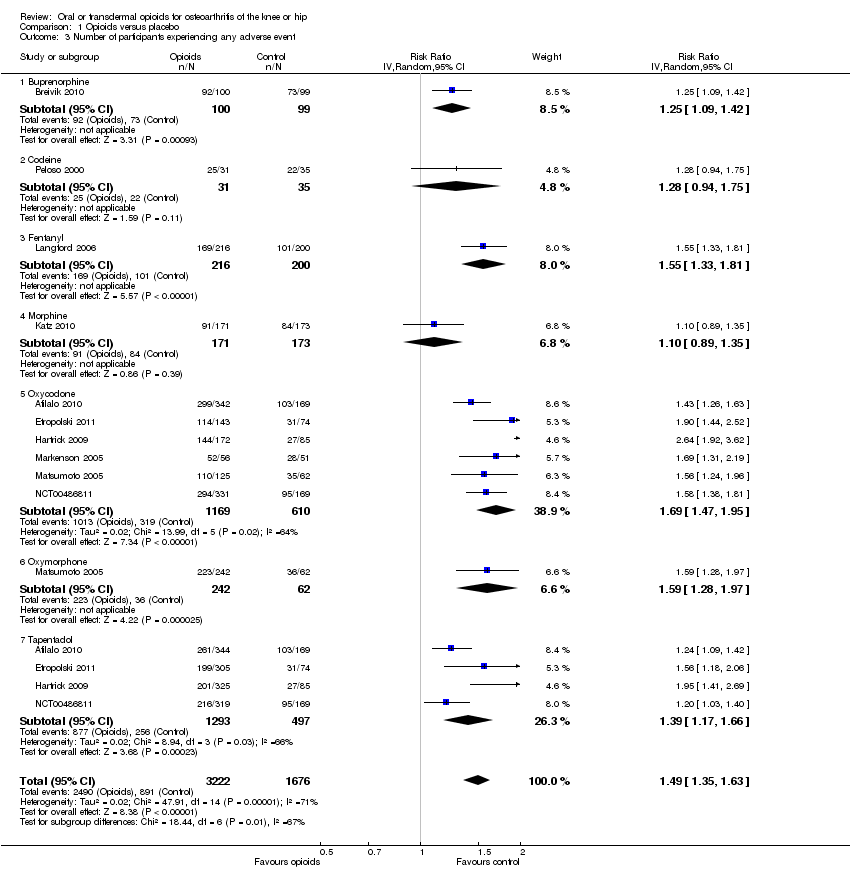
Comparison 1 Opioids versus placebo, Outcome 3 Number of participants experiencing any adverse event.
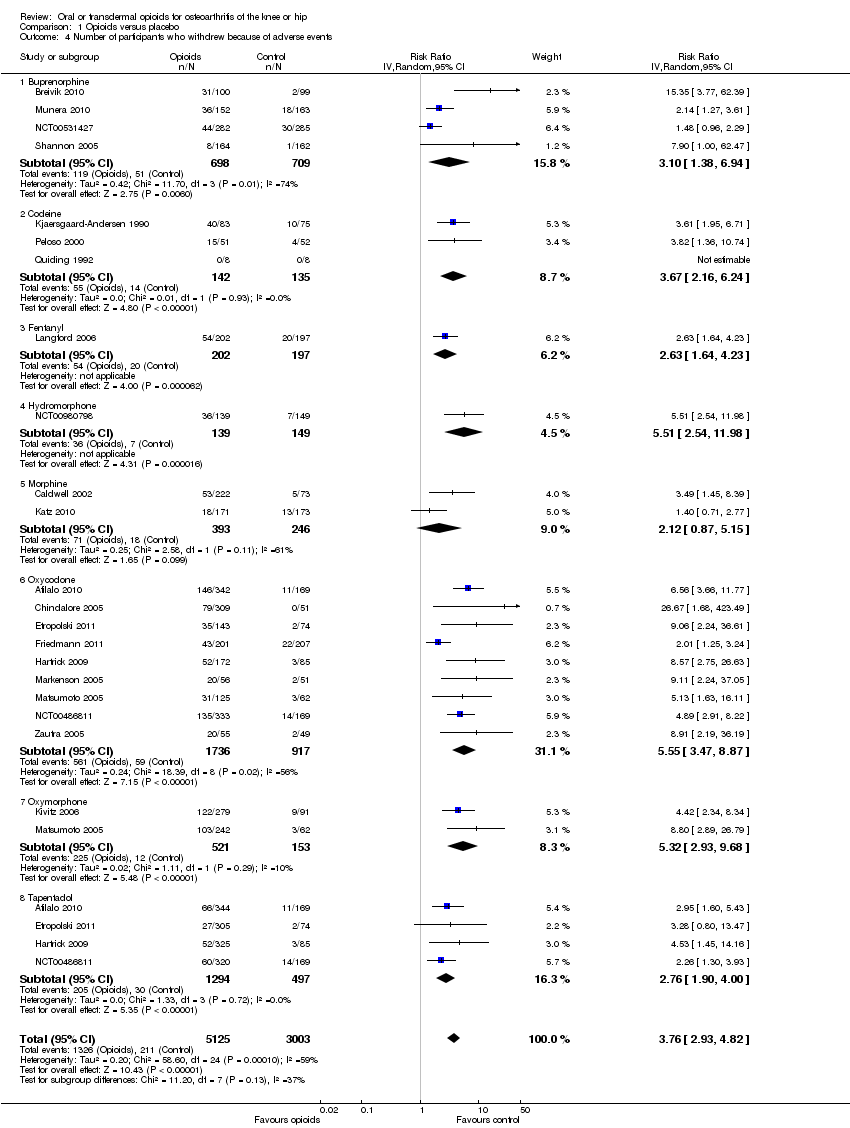
Comparison 1 Opioids versus placebo, Outcome 4 Number of participants who withdrew because of adverse events.

Comparison 1 Opioids versus placebo, Outcome 5 Number of participants experiencing any serious adverse event.

Comparison 1 Opioids versus placebo, Outcome 6 Withdrawal symptoms.
| Oral or transdermal opioids compared with placebo for osteoarthritis of the knee or hip | ||||||
| Patient or population: participants with osteoarthritis of the knee or hip Settings: various orthopaedic or rheumatology clinics Intervention: oral or transdermal opioids Comparison: placebo | ||||||
| Outcomes | Illustrative comparative risks* (95% CI) | Relative effect | No of participants | Quality of the evidence | Comments | |
| Assumed risk | Corresponding risk | |||||
| Placebo | Opioids | |||||
| Pain intensity Various pain scales. (median follow‐up: 4 weeks) | ‐1.8 cm change 29% improvement | ‐2.5 cm change 41% improvement | SMD ‐0.28 (‐0.35 to ‐0.20) | 8275 | ++++ | NNTB 10 (95% CI 8 to 14)4 |
| Function Various validated function scales. (median follow‐up: 5 weeks) | ‐1.2 units 21% improvement | ‐1.8 units on WOMAC 32% improvement | SMD ‐0.26 (‐0.35 to ‐0.17) | 3553 | ++++ | NNTB 12 (95% CI 10 to 18)7 |
| Number of participants experiencing any adverse event (median follow‐up: 8 weeks) | 150 per 1000 participant‐years8 | 224 per 1000 participant‐years | RR 1.49 (1.35 to 1.63) | 4898 | +++O | NNTH 14 (95% CI 11 to 19) |
| Number of participants who withdrew because of adverse events (median follow‐up: 6 weeks) | 17 per 1000 participant‐years8 | 64 per 1000 participant‐years | RR 3.76 (2.93 to 4.82) | 7712 | ++++ | NNTH 21 (95% CI 15 to 30) |
| Number of participants experiencing any serious adverse event (median follow‐up: 8 weeks) | 4 per 1000 participant‐years8 | 13 per 1000 participant‐years | RR 3.35 (0.83 to 13.56) | 681 | ++OO | Little evidence of harmful effect (NNTH not statistically significant) |
| Withdrawal symptoms (median follow‐up: 16 weeks) | 9 per 1000 participant‐years11 | 24 per 100 | OR 2.67 (2.02 to 3.77) | 1151 | +++O | NNTH 65 (95% CI 42 to 110) |
| *The basis for the assumed risk (e.g. the median control group risk across studies) is provided in footnotes. The corresponding risk (and its 95% confidence interval) is based on the assumed risk in the comparison group and the relative effect of the intervention (and its 95% CI). | ||||||
| GRADE Working Group grades of evidence 1 Median reduction as observed across placebo groups in large osteoarthritis trials (see methods section, Nüesch 2009). | ||||||
| Variable | Number of | N of participants | N of participants | Pain intensity | Heterogeneity | P value* |
| All trials | 22 | 5180 | 3095 | ‐0.28 (‐0.35 to ‐0.20) | 58% | |
| Analgesic potency | 0.32 | |||||
| Weak | 3 | 79 | 100 | ‐0.51 (‐1.01 to ‐0.01) | 55% | |
| Strong | 19 | 5101 | 2995 | ‐0.26 (‐0.35 to ‐0.18) | 64% | |
| Route of administration | 0.36 | |||||
| Oral | 17 | 4287 | 2188 | ‐0.30 (‐0.41 to ‐0.20) | 70% | |
| Transdermal | 5 | 893 | 907 | ‐0.20 (‐0.29 to ‐0.11) | 0% | |
| Allocation concealment | 0.31 | |||||
| Adequate | 8 | 1981 | 1141 | ‐0.32 (‐0.44 to ‐0.21) | 48% | |
| Inadequate or unclear | 14 | 3199 | 1954 | ‐0.24 (‐0.35 to ‐0.13) | 67% | |
| Blinding of participants | 0.23 | |||||
| Adequate | 15 | 3050 | 1616 | ‐0.32 (‐0.42 to ‐0.22) | 53% | |
| Inadequate or unclear | 7 | 2130 | 1479 | ‐0.21 (‐0.34 to ‐0.08) | 73% | |
| Intention‐to‐treat analysis | 0.43 | |||||
| Yes | 1 | 283 | 287 | ‐0.14 (‐0.30 to 0.02) | N/A | |
| No or unclear | 21 | 4897 | 2808 | ‐0.29 (‐0.37 to ‐0.20) | 63% | |
| Type of control intervention | 0.97 | |||||
| Placebo | 20 | 5132 | 3030 | ‐0.28 (‐0.36 to ‐0.19) | 65% | |
| No intervention | 2 | 48 | 65 | ‐0.33 (‐0.93 to 0.28) | 35% | |
| Number of participants randomised | 0.08 | |||||
| > 200 | 16 | 4895 | 2796 | ‐0.24 (‐0.33 to ‐0.16) | 64% | |
| ≤ 200 | 6 | 285 | 299 | ‐0.47 (‐0.71 to ‐0.23) | 48% | |
| Duration of treatment | 0.001 | |||||
| > 1 month | 10 | 2635 | 1972 | ‐0.15 (‐0.22 to ‐0.08) | 25% | |
| ≤ 1 month | 12 | 2545 | 1123 | ‐0.40 (‐0.50 to ‐0.30) | 37% | |
| Use of analgesic co‐interventions | 0.59 | |||||
| Similar between groups | 6 | 1189 | 891 | ‐0.31 (‐0.46 to ‐0.16) | 60% | |
| Unclear | 16 | 3991 | 2204 | ‐0.26 (‐0.36 to ‐0.16) | 65% | |
| Type of osteoarthritis | 0.77 | |||||
| Hip only | 2 | 48 | 65 | ‐0.33 (‐0.93 to 0.28) | 35% | |
| Knee only | 4 | 1674 | 1010 | ‐0.22 (‐0.41 to ‐0.04) | 78% | |
| Knee and hip | 16 | 3458 | 2020 | ‐0.29 (‐0.38 to ‐0.20) | 56% | |
| *P value for interaction. N/A: not available. | ||||||
| Variable | Number of | N of participants | N of participants | Function | Heterogeneity | P value* |
| All trials | 12 | 2124 | 1429 | ‐0.26 (‐0.35 to ‐0.17) | 32% | |
| Analgesic potency | 0.42 | |||||
| Weak | 2 | 74 | 95 | ‐0.42 (‐0.74 to ‐0.10) | 6% | |
| Strong | 10 | 2050 | 1334 | ‐0.26 (‐0.36 to ‐0.16) | 48% | |
| Route of administration | 0.76 | |||||
| Oral | 9 | 1679 | 974 | ‐0.30 (‐0.43 to ‐0.16) | 58% | |
| Transdermal | 3 | 445 | 455 | ‐0.25 (‐0.38 to ‐0.12) | 0% | |
| Allocation concealment | 0.43 | |||||
| Adequate | 6 | 1034 | 762 | ‐0.32 (‐0.45 to ‐0.18) | 47% | |
| Inadequate or unclear | 6 | 1090 | 667 | ‐0.23 (‐0.37 to ‐0.09) | 39% | |
| Blinding of participants | 0.008 | |||||
| Adequate | 10 | 1656 | 1038 | ‐0.32 (‐0.40 to ‐0.24) | 0% | |
| Inadequate or unclear | 2 | 468 | 391 | ‐0.07 (‐0.20 to 0.07) | 0% | |
| Intention‐to‐treat analysis | 0.34 | |||||
| Yes | 1 | 171 | 173 | ‐0.13 (‐0.34 to 0.08) | N/A | |
| No or unclear | 11 | 1953 | 1256 | ‐0.29 (‐0.40 to ‐0.19) | 44% | |
| Type of control intervention | 0.96 | |||||
| Placebo | 11 | 2081 | 1369 | ‐0.28 (‐0.38 to ‐0.18) | 49% | |
| No intervention | 1 | 43 | 60 | ‐0.29 (‐0.68 to 0.11) | N/A | |
| Number of participants randomised | 0.11 | |||||
| > 200 | 8 | 1900 | 1187 | ‐0.23 (‐0.32 to ‐0.14) | 26% | |
| ≤ 200 | 4 | 224 | 242 | ‐0.46 (‐0.73 to ‐0.19) | 51% | |
| Duration of treatment | 0.41 | |||||
| > 1 month | 6 | 1061 | 893 | ‐0.25 (‐0.41 to ‐0.09) | 66% | |
| ≤ 1 month | 6 | 1063 | 536 | ‐0.31 (‐0.42 to ‐0.20) | 0% | |
| Use of analgesic co‐interventions | 0.38 | |||||
| Similar between groups | 4 | 460 | 456 | ‐0.40 (‐0.67 to ‐0.13) | 71% | |
| Unclear | 8 | 1664 | 973 | ‐0.24 (‐0.33 to ‐0.15) | 16% | |
| Type of osteoarthritis | 0.45 | |||||
| Hip only | 1 | 43 | 60 | ‐0.29 (‐0.68 to 0.11) | N/A | |
| Knee only | 2 | 538 | 376 | ‐0.16 (‐0.43 to 0.11) | 76% | |
| Knee and hip | 9 | 1543 | 993 | ‐0.31 (‐0.41 to ‐0.20) | 31% | |
| *P value for interaction. N/A: not available. | ||||||
| Outcome or subgroup title | No. of studies | No. of participants | Statistical method | Effect size |
| 1 Pain Show forest plot | 22 | 8275 | Std. Mean Difference (Random, 95% CI) | ‐0.28 [‐0.35, ‐0.20] |
| 1.1 Buprenorphine | 4 | 1401 | Std. Mean Difference (Random, 95% CI) | ‐0.19 [‐0.30, ‐0.09] |
| 1.2 Codeine | 3 | 179 | Std. Mean Difference (Random, 95% CI) | ‐0.51 [‐1.01, ‐0.01] |
| 1.3 Fentanyl | 1 | 399 | Std. Mean Difference (Random, 95% CI) | ‐0.22 [‐0.42, ‐0.03] |
| 1.4 Hydromorphone | 1 | 275 | Std. Mean Difference (Random, 95% CI) | 0.04 [‐0.19, 0.28] |
| 1.5 Morphine | 2 | 638 | Std. Mean Difference (Random, 95% CI) | ‐0.25 [‐0.42, ‐0.09] |
| 1.6 Oxycodone | 10 | 2943 | Std. Mean Difference (Random, 95% CI) | ‐0.31 [‐0.47, ‐0.15] |
| 1.7 Oxymorphone | 2 | 645 | Std. Mean Difference (Random, 95% CI) | ‐0.39 [‐0.58, ‐0.21] |
| 1.8 Tapentadol | 4 | 1795 | Std. Mean Difference (Random, 95% CI) | ‐0.31 [‐0.46, ‐0.16] |
| 2 Function Show forest plot | 12 | 3553 | Std. Mean Difference (Random, 95% CI) | ‐0.26 [‐0.35, ‐0.17] |
| 2.1 Buprenorphine | 2 | 501 | Std. Mean Difference (Random, 95% CI) | ‐0.23 [‐0.40, ‐0.05] |
| 2.2 Codeine | 2 | 169 | Std. Mean Difference (Random, 95% CI) | ‐0.42 [‐0.74, ‐0.10] |
| 2.3 Fentanyl | 1 | 399 | Std. Mean Difference (Random, 95% CI) | ‐0.28 [‐0.48, ‐0.09] |
| 2.4 Morphine | 2 | 639 | Std. Mean Difference (Random, 95% CI) | ‐0.20 [‐0.38, ‐0.02] |
| 2.5 Oxycodone | 4 | 680 | Std. Mean Difference (Random, 95% CI) | ‐0.30 [‐0.58, ‐0.01] |
| 2.6 Oxymorphone | 2 | 645 | Std. Mean Difference (Random, 95% CI) | ‐0.38 [‐0.56, ‐0.19] |
| 2.7 Tapentadol | 2 | 520 | Std. Mean Difference (Random, 95% CI) | ‐0.15 [‐0.45, 0.16] |
| 3 Number of participants experiencing any adverse event Show forest plot | 10 | 4898 | Risk Ratio (IV, Random, 95% CI) | 1.49 [1.35, 1.63] |
| 3.1 Buprenorphine | 1 | 199 | Risk Ratio (IV, Random, 95% CI) | 1.25 [1.09, 1.42] |
| 3.2 Codeine | 1 | 66 | Risk Ratio (IV, Random, 95% CI) | 1.28 [0.94, 1.75] |
| 3.3 Fentanyl | 1 | 416 | Risk Ratio (IV, Random, 95% CI) | 1.55 [1.33, 1.81] |
| 3.4 Morphine | 1 | 344 | Risk Ratio (IV, Random, 95% CI) | 1.10 [0.89, 1.35] |
| 3.5 Oxycodone | 6 | 1779 | Risk Ratio (IV, Random, 95% CI) | 1.69 [1.47, 1.95] |
| 3.6 Oxymorphone | 1 | 304 | Risk Ratio (IV, Random, 95% CI) | 1.59 [1.28, 1.97] |
| 3.7 Tapentadol | 4 | 1790 | Risk Ratio (IV, Random, 95% CI) | 1.39 [1.17, 1.66] |
| 4 Number of participants who withdrew because of adverse events Show forest plot | 21 | 8128 | Risk Ratio (IV, Random, 95% CI) | 3.76 [2.93, 4.82] |
| 4.1 Buprenorphine | 4 | 1407 | Risk Ratio (IV, Random, 95% CI) | 3.10 [1.38, 6.94] |
| 4.2 Codeine | 3 | 277 | Risk Ratio (IV, Random, 95% CI) | 3.67 [2.16, 6.24] |
| 4.3 Fentanyl | 1 | 399 | Risk Ratio (IV, Random, 95% CI) | 2.63 [1.64, 4.23] |
| 4.4 Hydromorphone | 1 | 288 | Risk Ratio (IV, Random, 95% CI) | 5.51 [2.54, 11.98] |
| 4.5 Morphine | 2 | 639 | Risk Ratio (IV, Random, 95% CI) | 2.12 [0.87, 5.15] |
| 4.6 Oxycodone | 9 | 2653 | Risk Ratio (IV, Random, 95% CI) | 5.55 [3.47, 8.87] |
| 4.7 Oxymorphone | 2 | 674 | Risk Ratio (IV, Random, 95% CI) | 5.32 [2.93, 9.68] |
| 4.8 Tapentadol | 4 | 1791 | Risk Ratio (IV, Random, 95% CI) | 2.76 [1.90, 4.00] |
| 5 Number of participants experiencing any serious adverse event Show forest plot | 3 | 681 | Risk Ratio (IV, Random, 95% CI) | 3.35 [0.83, 13.56] |
| 5.1 Codeine | 1 | 158 | Risk Ratio (IV, Random, 95% CI) | 0.0 [0.0, 0.0] |
| 5.2 Fentanyl | 1 | 416 | Risk Ratio (IV, Random, 95% CI) | 2.78 [0.57, 13.60] |
| 5.3 Oxycodone | 1 | 107 | Risk Ratio (IV, Random, 95% CI) | 6.39 [0.34, 120.71] |
| 6 Withdrawal symptoms Show forest plot | 3 | Odds Ratio (Random, 95% CI) | 2.76 [2.02, 3.77] | |
| 6.1 Oxycodone | 1 | Odds Ratio (Random, 95% CI) | 2.18 [0.61, 7.81] | |
| 6.2 Morphine | 1 | Odds Ratio (Random, 95% CI) | 3.05 [0.12, 75.52] | |
| 6.3 Tapentadol | 1 | Odds Ratio (Random, 95% CI) | 0.99 [0.25, 3.97] | |
| 6.4 Fentanyl | 1 | Odds Ratio (Random, 95% CI) | 2.97 [2.13, 4.14] | |