Oral or transdermal opioids for osteoarthritis of the knee or hip
Referencias
References to studies included in this review
References to studies excluded from this review
References to studies awaiting assessment
Additional references
Characteristics of studies
Characteristics of included studies [ordered by study ID]
| Methods | Randomised controlled trial | |
| Participants | Patients with prior suboptimal analgesic response to NSAIDs/paracetamol or previous intermittent opioid therapy were eligible | |
| Interventions | Experimental interventions Control intervention Treatment duration: 4 weeks | |
| Outcomes | Extracted pain outcome: global pain after 4 weeks | |
| Notes | ||
| Risk of bias | ||
| Bias | Authors' judgement | Support for judgement |
| Adequate sequence generation? | Unclear risk | No information provided. |
| Allocation concealment? | Unclear risk | No information provided. |
| Described as double‐blind? | Low risk | |
| Blinding of patients? | Low risk | |
| Blinding of physicians? | Unclear risk | No information provided. |
| Blinding of outcome assessors? | Low risk | |
| Interventions reported as indistinguishable? | High risk | |
| Double‐dummy technique used? | Low risk | |
| Intention‐to‐treat analysis performed? | High risk | No information on exclusions available. |
| Intention‐to‐treat analysis performed? | High risk | No information on exclusions available. |
| No funding by commercial organisation? | High risk | Sponsor: Elan |
| Methods | Randomised controlled trial | |
| Participants | Patients with moderate to severe hip or knee pain while taking ≥1 oral analgesic medication were eligible | |
| Interventions | Experimental interventions Control intervention Treatment duration: 3 weeks | |
| Outcomes | Extracted pain outcome: global pain after 4 weeks | |
| Notes | For WOMAC disability, insufficient data were reported to calculate standardised mean differences and it was therefore not included in the meta‐analysis | |
| Risk of bias | ||
| Bias | Authors' judgement | Support for judgement |
| Adequate sequence generation? | Unclear risk | No information provided. |
| Allocation concealment? | Unclear risk | No information provided. |
| Described as double‐blind? | Low risk | |
| Blinding of patients? | Low risk | |
| Blinding of physicians? | Low risk | |
| Blinding of outcome assessors? | Low risk | |
| Interventions reported as indistinguishable? | Low risk | |
| Double‐dummy technique used? | High risk | |
| Intention‐to‐treat analysis performed? | High risk | 1 of 310 patients (0.3%) excluded in experimental groups, 1 of 52 patients (1.9%) excluded in control group. |
| Intention‐to‐treat analysis performed? | High risk | 1 of 310 patients (0.3%) excluded in experimental groups, 1 of 52 (1.9%) patients excluded in control group. |
| No funding by commercial organisation? | High risk | Sponsor: Pain Therapeutics |
| Methods | Randomised controlled trial | |
| Participants | Patients with suboptimal analgesic response to NSAIDs/paracetamol or previous opioid therapy were eligible | |
| Interventions | Experimental interventions Control intervention Treatment duration: 2 weeks | |
| Outcomes | Extracted pain outcome: global pain after 2 weeks. | |
| Notes | ||
| Risk of bias | ||
| Bias | Authors' judgement | Support for judgement |
| Adequate sequence generation? | Low risk | |
| Allocation concealment? | Low risk | |
| Described as double‐blind? | Low risk | |
| Blinding of patients? | Low risk | |
| Blinding of physicians? | Low risk | |
| Blinding of outcome assessors? | Low risk | |
| Interventions reported as indistinguishable? | High risk | |
| Double‐dummy technique used? | Low risk | |
| Intention‐to‐treat analysis performed? | High risk | 9 of 279 patients (0.7%) excluded in experimental groups, 4 of 91 patients (4.4%) excluded in control group. |
| Intention‐to‐treat analysis performed? | High risk | 9 of 279 patients (0.7%) excluded in experimental groups, 4 of 91 patients (4.4%) excluded in control group. |
| No funding by commercial organisation? | High risk | Sponsor: Endo Pharmaceuticals Inc, Penwest Pharmaceuticals Co. |
| Methods | Randomised controlled trial | |
| Participants | Patients with chronic pain requiring analgesic treatment were eligible | |
| Interventions | Experimental intervention Control intervention Treatment duration: 4 weeks | |
| Outcomes | Extracted pain outcome: global pain after 4 weeks | |
| Notes | ||
| Risk of bias | ||
| Bias | Authors' judgement | Support for judgement |
| Adequate sequence generation? | Unclear risk | No information provided. |
| Allocation concealment? | Unclear risk | No information provided. |
| Described as double‐blind? | Low risk | |
| Blinding of patients? | Low risk | |
| Blinding of physicians? | Unclear risk | No information provided. |
| Blinding of outcome assessors? | Low risk | |
| Interventions reported as indistinguishable? | Low risk | |
| Double‐dummy technique used? | High risk | |
| Intention‐to‐treat analysis performed? | High risk | 43 of 83 patients (52%) excluded in experimental group, 18 of 75 patients (24%) excluded in control group. |
| Intention‐to‐treat analysis performed? | High risk | 40 of 83 patients (48%) excluded in experimental group, 15 of 75 patients (20%) excluded in control group. |
| No funding by commercial organisation? | Unclear risk | No information provided. |
| Methods | Randomised controlled trial | |
| Participants | Patients without adequate pain control under weak opioid treatment (with and without paracetamol) were eligible | |
| Interventions | Experimental intervention Control intervention Treatment duration: 6 weeks | |
| Outcomes | Extracted pain outcome: global pain after 8 weeks | |
| Notes | ||
| Risk of bias | ||
| Bias | Authors' judgement | Support for judgement |
| Adequate sequence generation? | Low risk | |
| Allocation concealment? | Low risk | |
| Described as double‐blind? | Low risk | |
| Blinding of patients? | Low risk | |
| Blinding of physicians? | Low risk | |
| Blinding of outcome assessors? | Unclear risk | No information provided. |
| Interventions reported as indistinguishable? | Low risk | |
| Double‐dummy technique used? | High risk | |
| Intention‐to‐treat analysis performed? | High risk | No information on exclusions available. |
| Intention‐to‐treat analysis performed? | High risk | No information on exclusions available. |
| No funding by commercial organisation? | High risk | Sponsor: Janssen‐Cilag |
| Methods | Randomised controlled trial | |
| Participants | Patients with moderate to severe pain while taking NSAIDs/paracetamol, with contraindications to NSAID therapy or with previous oral opioid therapy were eligible | |
| Interventions | Experimental intervention Control intervention Treatment duration: 13 weeks | |
| Outcomes | Extracted pain outcome: global pain after 13 weeks | |
| Notes | ||
| Risk of bias | ||
| Bias | Authors' judgement | Support for judgement |
| Adequate sequence generation? | Low risk | |
| Allocation concealment? | Low risk | |
| Described as double‐blind? | Low risk | |
| Blinding of patients? | Low risk | |
| Blinding of physicians? | Low risk | |
| Blinding of outcome assessors? | Low risk | |
| Interventions reported as indistinguishable? | Low risk | |
| Double‐dummy technique used? | High risk | |
| Intention‐to‐treat analysis performed? | High risk | No information on exclusions available. |
| Intention‐to‐treat analysis performed? | High risk | No information on exclusions available. |
| No funding by commercial organisation? | High risk | Sponsor: Purdue Pharma |
| Methods | Randomised controlled trial | |
| Participants | Patients with suboptimal analgesic response to NSAIDs, paracetamol, or opioids were eligible | |
| Interventions | Experimental interventions Control intervention Treatment duration: 4 weeks | |
| Outcomes | Extracted pain outcome: WOMAC pain subscore after 4 weeks | |
| Notes | ||
| Risk of bias | ||
| Bias | Authors' judgement | Support for judgement |
| Adequate sequence generation? | Low risk | |
| Allocation concealment? | Unclear risk | No information provided. |
| Described as double‐blind? | Low risk | |
| Blinding of patients? | Low risk | |
| Blinding of physicians? | Low risk | |
| Blinding of outcome assessors? | Low risk | |
| Interventions reported as indistinguishable? | Low risk | |
| Double‐dummy technique used? | High risk | |
| Intention‐to‐treat analysis performed? | High risk | 19 of 367 patients (5.2%) excluded in experimental groups, 5 of 124 (4.0%) patients excluded in control group. |
| Intention‐to‐treat analysis performed? | High risk | 19 of 367 patients (5.2%) excluded in experimental groups, 5 of 124 (4.0%) patients excluded in control group. |
| No funding by commercial organisation? | High risk | Sponsors: TheraQuest Biosciences, Endo Pharmaceuticals, Penwest Pharmaceuticals Co. |
| Methods | Randomised controlled trial | |
| Participants | Patients with osteoarthritis symptoms requiring therapy with paracetamol, anti‐inflammatory agents or opioids were eligible. | |
| Interventions | Experimental intervention Control intervention Treatment duration: 4 weeks | |
| Outcomes | Extracted pain outcome: global pain after 4 weeks | |
| Notes | ||
| Risk of bias | ||
| Bias | Authors' judgement | Support for judgement |
| Adequate sequence generation? | Unclear risk | No information provided. |
| Allocation concealment? | Unclear risk | No information provided. |
| Described as double‐blind? | Low risk | |
| Blinding of patients? | Low risk | |
| Blinding of physicians? | Unclear risk | No information provided. |
| Blinding of outcome assessors? | Unclear risk | No information provided. |
| Interventions reported as indistinguishable? | Low risk | |
| Double‐dummy technique used? | High risk | |
| Intention‐to‐treat analysis performed? | High risk | 20 of 51 patients (39%) excluded in experimental group, 17 of 52 patients (33%) excluded in control group. |
| Intention‐to‐treat analysis performed? | High risk | 20 of 51 patients (39%) excluded in experimental group, 17 of 52 patients (33%) excluded in control group. |
| No funding by commercial organisation? | High risk | Sponsor: Purdue Frederick |
| Methods | Randomised controlled trial | |
| Participants | Patients in need of analgesic medication for hip osteoarthritis were eligible | |
| Interventions | Experimental intervention Control intervention Treatment duration: 32 hours | |
| Outcomes | Extracted pain outcome: global pain after 1 week | |
| Notes | 1 trial arm excluded from review | |
| Risk of bias | ||
| Bias | Authors' judgement | Support for judgement |
| Adequate sequence generation? | Unclear risk | No information provided. |
| Allocation concealment? | Unclear risk | No information provided. |
| Described as double‐blind? | Low risk | |
| Blinding of patients? | Low risk | |
| Blinding of physicians? | Unclear risk | No information provided. |
| Blinding of outcome assessors? | Low risk | |
| Interventions reported as indistinguishable? | High risk | |
| Double‐dummy technique used? | Low risk | |
| Intention‐to‐treat analysis performed? | Unclear risk | No information on exclusions available. |
| Intention‐to‐treat analysis performed? | Unclear risk | Not applicable, no function outcome reported. |
| No funding by commercial organisation? | Unclear risk | No information provided. |
| Methods | Randomised controlled trial | |
| Participants | 107 patients were randomised | |
| Interventions | Experimental intervention Control intervention Treatment duration: 13 weeks | |
| Outcomes | Extracted pain outcome: global pain after 13 weeks | |
| Notes | ||
| Risk of bias | ||
| Bias | Authors' judgement | Support for judgement |
| Adequate sequence generation? | Unclear risk | No information provided. |
| Allocation concealment? | Low risk | |
| Described as double‐blind? | Low risk | |
| Blinding of patients? | Low risk | |
| Blinding of physicians? | Low risk | |
| Blinding of outcome assessors? | Low risk | |
| Interventions reported as indistinguishable? | Low risk | |
| Double‐dummy technique used? | High risk | |
| Intention‐to‐treat analysis performed? | High risk | 1 of 56 patients (1.8%) excluded in experimental group, 2 of 51 patients (3.9%) excluded in control group. |
| Intention‐to‐treat analysis performed? | Unclear risk | Not applicable, no function outcome reported. |
| No funding by commercial organisation? | High risk | Sponsor: Purdue Pharma |
Characteristics of excluded studies [ordered by study ID]
| Study | Reason for exclusion |
| Only active control interventions. | |
| Percentage of patients with knee or hip osteoarthritis 17% (5/30). | |
| Only active control interventions. | |
| Percentage of patients with osteoarthritis 50%, no information about joints involved. | |
| No randomised controlled trial. | |
| Percentage of patients with knee or hip osteoarthritis likely to be below 50%. | |
| No randomised controlled trial. | |
| Crossover trial providing pooled results only. | |
| Mixed population of rheumatoid arthritis and osteoarthritis, no information about number of patients with osteoarthritis. | |
| Only active control interventions. | |
| Only active control interventions. | |
| Not randomised controlled trial. | |
| Not randomised controlled trial. | |
| Mixed population of rheumatoid arthritis and osteoarthritis, no information about number of patients with osteoarthritis. | |
| Percentage of patients with osteoarthritis 15% (5/33). | |
| Not randomised controlled trial. | |
| Percentage of patients with knee or hip osteoarthritis likely to be below 50%. | |
| Only active control interventions. | |
| Percentage of patients with osteoarthritis 7% (2/28). | |
| Not randomised controlled trial. | |
| Comparison of combination of dextropropoxyphene, acetaminophen, and caffeine with placebo. | |
| Crossover trial providing pooled results only. | |
| Crossover trial providing pooled results only. | |
| Percentage of patients with osteoarthritis 6% (2/34). |
Characteristics of studies awaiting assessment [ordered by study ID]
| Methods | Randomised controlled trial |
| Participants | 131 patients with hip osteoarthritis were reported at baseline |
| Interventions | Experimental intervention Control intervention Treatment duration: 3 weeks |
| Outcomes | Assessed efficacy outcomes: pain intensity, pain relief, patient's evaluation of the effect of treatment |
| Notes | Insufficient data provided in published abstract, no full‐text article available. Awaiting author response. |
Data and analyses
| Outcome or subgroup title | No. of studies | No. of participants | Statistical method | Effect size |
| 1 Pain Show forest plot | 10 | 2268 | Std. Mean Difference (Random, 95% CI) | ‐0.36 [‐0.47, ‐0.26] |
| Analysis 1.1  Comparison 1 Opioids versus placebo, Outcome 1 Pain. | ||||
| 1.1 Codeine | 3 | 179 | Std. Mean Difference (Random, 95% CI) | ‐0.51 [‐1.01, ‐0.01] |
| 1.2 Fentanyl | 1 | 399 | Std. Mean Difference (Random, 95% CI) | ‐0.22 [‐0.42, ‐0.03] |
| 1.3 Morphine | 1 | 295 | Std. Mean Difference (Random, 95% CI) | ‐0.32 [‐0.59, ‐0.06] |
| 1.4 Oxycodone | 4 | 750 | Std. Mean Difference (Random, 95% CI) | ‐0.42 [‐0.65, ‐0.20] |
| 1.5 Oxymorphone | 2 | 645 | Std. Mean Difference (Random, 95% CI) | ‐0.39 [‐0.58, ‐0.21] |
| 2 Function Show forest plot | 7 | 1794 | Std. Mean Difference (Random, 95% CI) | ‐0.33 [‐0.45, ‐0.21] |
| Analysis 1.2  Comparison 1 Opioids versus placebo, Outcome 2 Function. | ||||
| 2.1 Codeine | 2 | 169 | Std. Mean Difference (Random, 95% CI) | ‐0.42 [‐0.74, ‐0.10] |
| 2.2 Fentanyl | 1 | 399 | Std. Mean Difference (Random, 95% CI) | ‐0.28 [‐0.48, ‐0.09] |
| 2.3 Morphine | 1 | 295 | Std. Mean Difference (Random, 95% CI) | ‐0.29 [‐0.56, ‐0.03] |
| 2.4 Oxycodone | 2 | 286 | Std. Mean Difference (Random, 95% CI) | ‐0.44 [‐1.12, 0.24] |
| 2.5 Oxymorphone | 2 | 645 | Std. Mean Difference (Random, 95% CI) | ‐0.32 [‐0.50, ‐0.13] |
| 3 Number of patients experiencing any adverse event Show forest plot | 4 | 1080 | Risk Ratio (IV, Random, 95% CI) | 1.55 [1.41, 1.70] |
| Analysis 1.3  Comparison 1 Opioids versus placebo, Outcome 3 Number of patients experiencing any adverse event. | ||||
| 3.1 Codeine | 1 | 66 | Risk Ratio (IV, Random, 95% CI) | 1.28 [0.94, 1.75] |
| 3.2 Fentanyl | 1 | 416 | Risk Ratio (IV, Random, 95% CI) | 1.55 [1.33, 1.81] |
| 3.3 Oxycodone | 2 | 294 | Risk Ratio (IV, Random, 95% CI) | 1.62 [1.36, 1.92] |
| 3.4 Oxymorphone | 1 | 304 | Risk Ratio (IV, Random, 95% CI) | 1.59 [1.28, 1.97] |
| 4 Number of patients who withdrew because of adverse events Show forest plot | 10 | 2403 | Risk Ratio (IV, Random, 95% CI) | 4.05 [3.06, 5.38] |
| Analysis 1.4  Comparison 1 Opioids versus placebo, Outcome 4 Number of patients who withdrew because of adverse events. | ||||
| 4.1 Codeine | 3 | 277 | Risk Ratio (IV, Random, 95% CI) | 3.67 [2.16, 6.24] |
| 4.2 Fentanyl | 1 | 399 | Risk Ratio (IV, Random, 95% CI) | 2.63 [1.64, 4.23] |
| 4.3 Morphine | 1 | 295 | Risk Ratio (IV, Random, 95% CI) | 3.49 [1.45, 8.39] |
| 4.4 Oxycodone | 4 | 758 | Risk Ratio (IV, Random, 95% CI) | 7.75 [3.76, 15.97] |
| 4.5 Oxymorphone | 2 | 674 | Risk Ratio (IV, Random, 95% CI) | 5.32 [2.93, 9.68] |
| 5 Number of patients experiencing any serious adverse event Show forest plot | 3 | 681 | Risk Ratio (IV, Random, 95% CI) | 3.35 [0.83, 13.56] |
| Analysis 1.5  Comparison 1 Opioids versus placebo, Outcome 5 Number of patients experiencing any serious adverse event. | ||||
| 5.1 Codeine | 1 | 158 | Risk Ratio (IV, Random, 95% CI) | 0.0 [0.0, 0.0] |
| 5.2 Fentanyl | 1 | 416 | Risk Ratio (IV, Random, 95% CI) | 2.78 [0.57, 13.60] |
| 5.3 Oxycodone | 1 | 107 | Risk Ratio (IV, Random, 95% CI) | 6.39 [0.34, 120.71] |
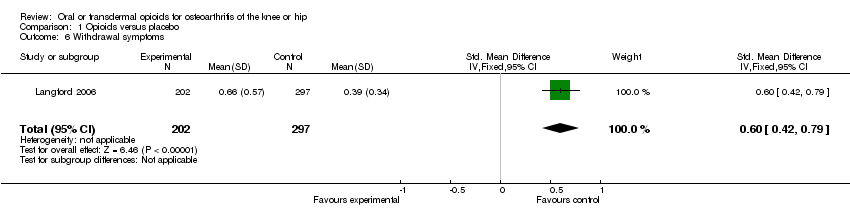
| 6 Withdrawal symptoms Show forest plot | 1 | 499 | Std. Mean Difference (IV, Fixed, 95% CI) | 0.60 [0.42, 0.79] |
| Analysis 1.6  Comparison 1 Opioids versus placebo, Outcome 6 Withdrawal symptoms. | ||||
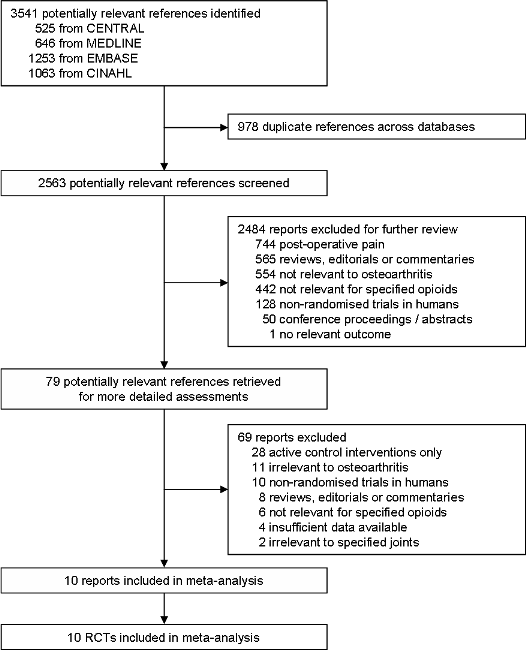
Study flow chart
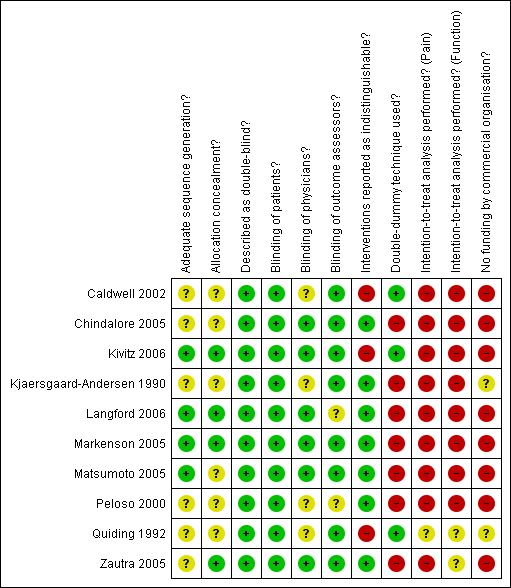
Methodological characteristics and source of funding of included trials. (+) indicates low risk of bias, (?) unclear and (‐) a high risk of bias on a specific item.
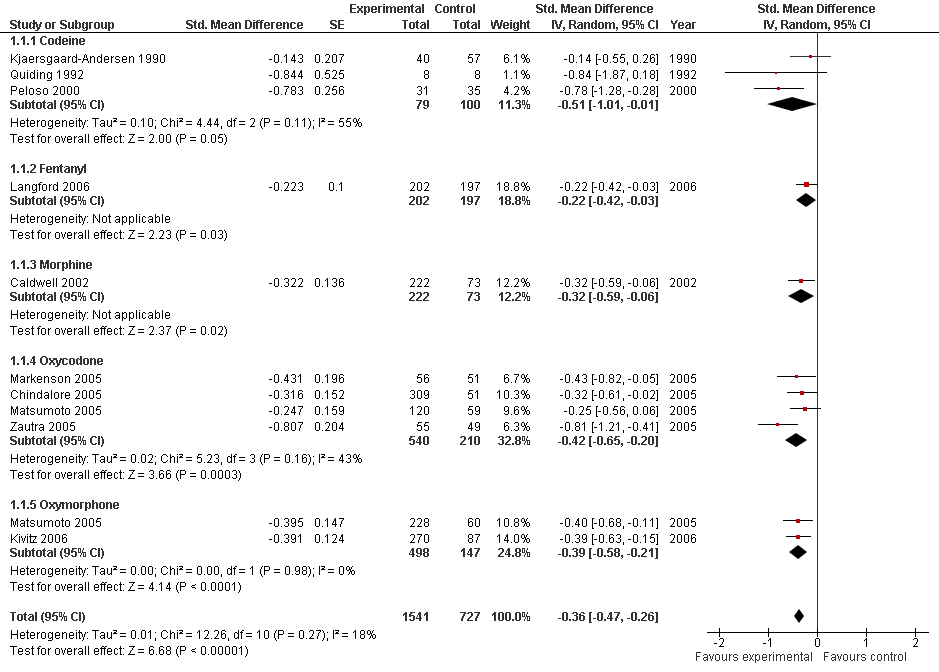
Forest plot of 10 trials comparing the effects of any type of opioids and control (placebo or no intervention) on knee or hip pain. Values on x‐axis denote standardised mean differences. The plot is stratified according to type of opioids. Matsumoto 2005 contributed with two comparisons and the standard error was inflated and the number of patients in the placebo group was halfed to avoid duplicate counting of patients when including both comparisons in the overall meta‐analysis. Data relating to the 3, 3, 3, and 2 active intervention arms in Caldwell 2002, Chindalore 2005, Kivitz 2006, and Matsumoto 2005, respectively, were pooled.
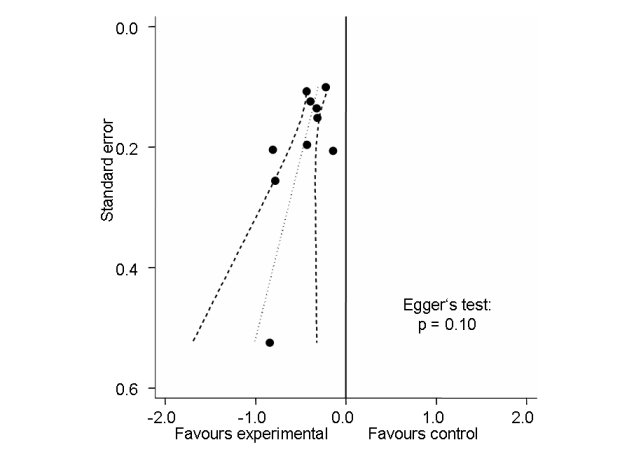
Funnel plot for effects on knee or hip pain.
Numbers on x‐axis refer to standardised mean differences (SMDs), on y‐axis to standard errors of SMDs.

Standardised mean differences of knee or hip pain (y‐axis) are plotted against total daily dose of morphine equivalents (x‐axis). The size of the circles is proportional to the random‐effects weights that were used in the meta‐regression. The dotted line indicates predicted treatment effects (regression line) from uni‐variable meta‐regression by using daily morphine equivalence doses the explanatory variable, and dashed lines represent the 95% CIs.

Forest plot of 7 trials comparing the effects of any type of opioids and control (placebo or no intervention) on function. Values on x‐axis denote standardised mean differences. The plot is stratified according to type of opioids. Matsumoto 2005 contributed with two comparisons and the standard error was inflated and the number of patients in the placebo group was halved to avoid duplicate counting of patients when including both comparisons in the overall meta‐analysis. Data relating to the 3, 3, and 2 active intervention arms in Caldwell 2002, Kivitz 2006, and Matsumoto 2005, respectively, were pooled.

Funnel plot for effects on functioning of the knee or hip.
Numbers on x‐axis refer to standardised mean differences (SMDs), on y‐axis to standard errors of SMDs
Standardised mean differences of function (y‐axis) are plotted against total daily dose of morphine equivalents (x‐axis). The size of the circles is proportional to the random‐effects weights that were used in the meta‐regression. The dotted line indicates predicted treatment effects (regression line) from uni‐variable meta‐regression by using daily morphine equivalence doses the explanatory variable, and dashed lines represent the 95% CIs.
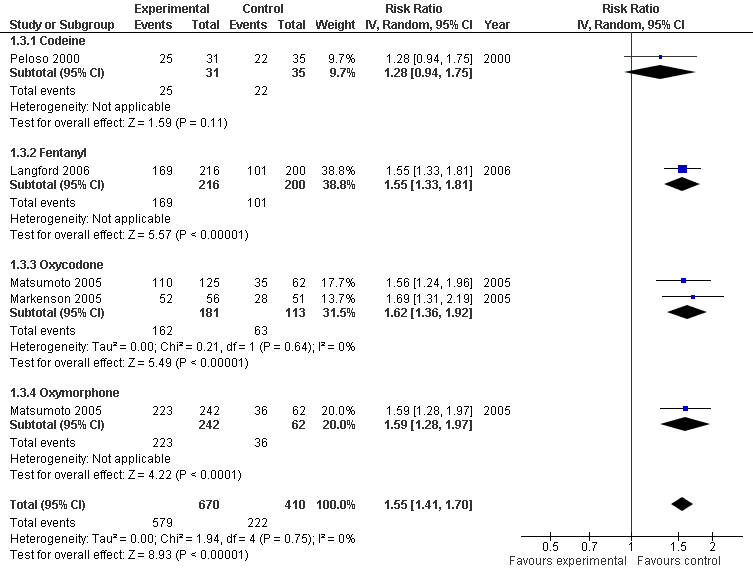
Forest plot of 4 trials comparing patients experiencing any adverse event between any opioid and control (placebo or no intervention). Values on x‐axis denote risks ratios. The plot is stratified according to type of opioid. Matsumoto 2005 contributed with two comparisons and the number of patients in the placebo group was halved to avoid duplicate counting of patients when including both comparisons in the overall meta‐analysis.

Forest plot of 10 trials comparing patients withdrawn or dropped out because of adverse events between any opioid and control (placebo or no intervention). Values on x‐axis denote risks ratios. The plot is stratified according to type of opioid. Matsumoto 2005 contributed with two comparisons and the number of patients in the placebo group was halved to avoid duplicate counting of patients when including both comparisons in the overall meta‐analysis. The risk ratio in one trial could not be estimated because no withdrawals or dropouts because of adverse events occurred in either group.

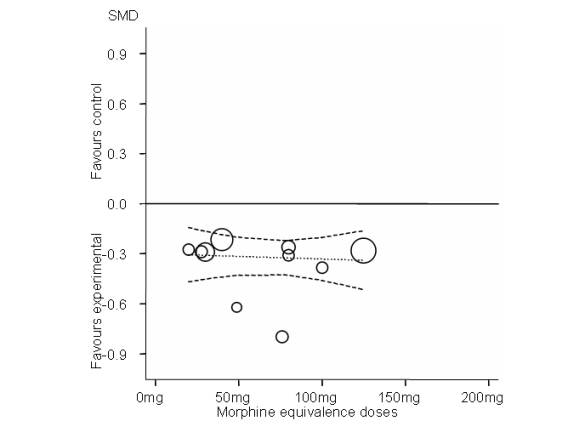
Risk ratios of patients withdrawn or dropped out because of adverse events between opioids and control groups (y‐axis) are plotted against total daily dose of morphine equivalents (x‐axis). The size of the circles is proportional to the random‐effects weights that were used in the meta‐regression. The dotted line indicates predicted treatment effects (regression line) from uni‐variable meta‐regression by using daily morphine equivalence doses the explanatory variable, and dashed lines represent the 95% CIs.

Forest plot of 3 trials comparing patients experiencing any serious adverse event between any opioid and control (placebo or no intervention). Values on x‐axis denote risks ratios. The plot is stratified according to type of opioid. The risk ratio in one trial could not be estimated because no serious adverse event occurred in either group.

Comparison 1 Opioids versus placebo, Outcome 1 Pain.

Comparison 1 Opioids versus placebo, Outcome 2 Function.
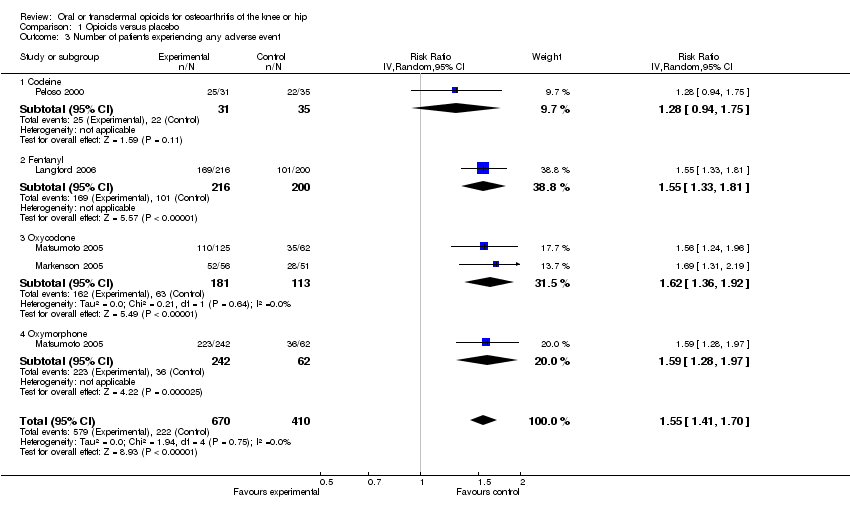
Comparison 1 Opioids versus placebo, Outcome 3 Number of patients experiencing any adverse event.

Comparison 1 Opioids versus placebo, Outcome 4 Number of patients who withdrew because of adverse events.
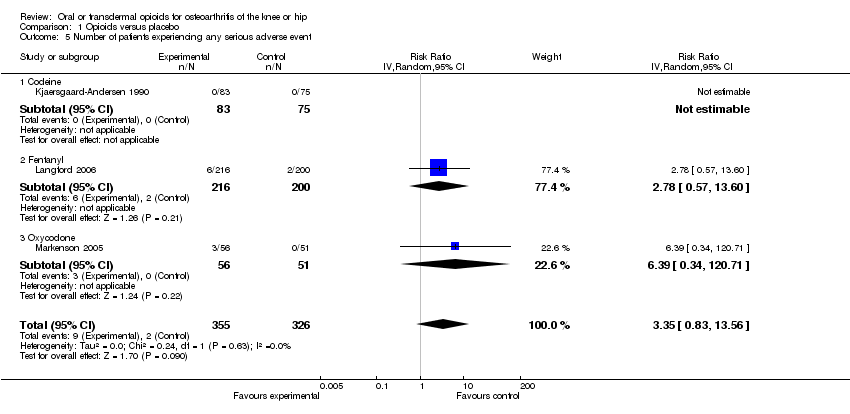
Comparison 1 Opioids versus placebo, Outcome 5 Number of patients experiencing any serious adverse event.
Comparison 1 Opioids versus placebo, Outcome 6 Withdrawal symptoms.
| Oral or transdermal opioids compared with placebo for osteoarthritis of the knee or hip | ||||||
| Patient or population: Patients with osteoarthritis of the knee or hip Settings: Various orthopedic or rheumatology clinics Intervention: Oral or transdermal opioids Comparison: Placebo | ||||||
| Outcomes | Illustrative comparative risks* (95% CI) | Relative effect | No of Participants | Quality of the evidence | Comments | |
| Assumed risk | Corresponding risk | |||||
| Placebo | Opioids | |||||
| Pain intensity Various pain scales. (median follow‐up: 4 weeks) | ‐1.8 cm change 29% improvement | ‐2.7 cm change 44% improvement | SMD ‐0.36 (‐0.47 to ‐0.26) | 2268 | ++++ | NNT: 8 (95% CI 7 to 11)4 |
| Function Various validated function scales. (median follow‐up: 4 weeks) | ‐1.2 units 21% improvement | ‐1.9 units on WOMAC 34% improvement | SMD ‐0.33 (‐0.45 to ‐0.21) | 1794 | ++++ | NNT: 10 (95% CI 8 to 15)7 |
| Number of patients experiencing any adverse event (median follow‐up: 4 weeks) | 150 per 1000 patient‐years8 | 233 per 1000 patient‐years | RR 1.55 (1.41 to 1.70) | 1080 | +++O | NNH: 12 (95% CI 10 to 16) |
| Number of patients who withdrew because of adverse events (median follow‐up: 4 weeks) | 17 per 1000 patient‐years8 | 69 per 1000 patient‐years | RR 4.05 (3.06 to 5.38) | 2403 | ++++ | NNH: 19 (95% CI 13 to 29) |
| Number of patients experiencing any serious adverse event (median follow‐up: 4 weeks) | 4 per 1000 patient‐years8 | 13 per 1000 patient‐years | RR 3.35 (0.83 to 13.56) | 681 | ++OO | Little evidence of harmful effect [NNH: not statistically significant]. |
| Withdrawal symptoms Short Opiate Withdrawal Scale. (follow‐up: 8 weeks) | 0.9 units | 0.7 units 69% increase | SMD 0.60 (0.42 to 0.79) | 499 | ++OO | No evidence‐based assumption could be made for the calculation of NNH. |
| *The basis for the assumed risk (e.g. the median control group risk across studies) is provided in footnotes. The corresponding risk (and its 95% confidence interval) is based on the assumed risk in the comparison group and the relative effect of the intervention (and its 95% CI). | ||||||
| GRADE Working Group grades of evidence 1 Median reduction as observed across placebo groups in large osteoarthritis trials (see methods section, Nüesch 2009). | ||||||
| Variable | Number of | N of patients | N of patients | Pain intensity | Hetero‐ | P‐value* |
| All trials | 10 | 1541 | 727 | ‐0.36 (‐0.47 to ‐0.26) | 18% | |
| Analgesic potency | 0.74 | |||||
| Weak | 3 | 79 | 100 | ‐0.51 (‐1.01 to ‐0.01) | 55% | |
| Strong | 7 | 1462 | 627 | ‐0.38 (‐0.49 to ‐0.26) | 19% | |
| Route of administration |
|
|
|
|
| 0.14 |
| Oral | 9 | 1339 | 530 | ‐0.42 (‐0.54 to ‐0.31) | 12% |
|
| Transdermal | 1 | 202 | 197 | ‐0.22 (‐0.42 to ‐0.03) | N/A |
|
| Allocation concealment |
|
|
|
|
| 0.96 |
| Adequate | 4 | 583 | 384 | ‐0.42 (‐0.64 to ‐0.20) | 56% |
|
| Inadequate or unclear | 6 | 958 | 343 | ‐0.38 (‐0.52 to ‐0.25) | 3% |
|
| Type of control intervention |
|
|
|
|
| 0.53 |
| Placebo | 8 | 1493 | 662 | ‐0.40 (‐0.52 to ‐0.28) | 30% |
|
| No intervention | 2 | 48 | 65 | ‐0.33 (‐0.93 to 0.28) | 35% |
|
| Number of patients randomised |
|
|
|
|
| 0.15 |
| > 200 | 5 | 1351 | 527 | ‐0.33 (‐0.44 to ‐0.23) | 0% |
|
| ≤ 200 | 5 | 190 | 200 | ‐0.55 (‐0.83 to ‐0.27) | 42% |
|
| Duration of treatment |
|
|
|
|
| 0.23 |
| > 1 month | 2 | 258 | 248 | ‐0.27 (‐0.44 to ‐0.09) | 0% |
|
| ≤ 1 month | 8 | 1283 | 479 | ‐0.43 (‐0.56 to ‐0.29) | 23% |
|
| Use of analgesic co‐interventions | 0.66 | |||||
| Similar between groups | 3 | 289 | 283 | ‐0.41 (‐0.71 to ‐0.11) | 56% | |
| Unclear | 7 | 1252 | 444 | ‐0.40 (‐0.53 to ‐0.28) | 14% | |
| *P‐value for interaction | ||||||
| Variable | Number of | N of patients | N of patients | Function | Hetero‐ | P‐value* |
| All trials | 7 | 1172 | 622 | ‐0.33 (‐0.45 to ‐0.21) | 24% | |
| Analgesic potency |
|
|
|
|
| 0.68 |
| Weak | 2 | 74 | 95 | ‐0.42 (‐0.74 to ‐0.10) | 6% |
|
| Strong | 5 | 1098 | 527 | ‐0.35 (‐0.48 to ‐0.21) | 34% |
|
| Route of administration |
|
|
|
|
| 0.58 |
| Oral | 6 | 970 | 425 | ‐0.38 (‐0.53 to ‐0.23) | 28% |
|
| Transdermal | 1 | 202 | 197 | ‐0.28 (‐0.48 to ‐0.09) | N/A |
|
| Allocation concealment |
|
|
|
|
| 0.60 |
| Adequate | 3 | 528 | 335 | ‐0.43 (‐0.68 to ‐0.18) | 62% |
|
| Inadequate or unclear | 4 | 644 | 287 | ‐0.31 (‐0.45 to ‐0.16) | 0% |
|
| Type of control intervention |
|
|
|
|
| 0.83 |
| Placebo | 6 | 1129 | 562 | ‐0.36 (‐0.50 to ‐0.23) | 32% |
|
| No intervention | 1 | 43 | 60 | ‐0.29 (‐0.68 to 0.11) | N/A |
|
| Number of patients randomised |
|
|
|
|
| 0.09 |
| > 200 | 4 | 1042 | 476 | ‐0.29 (‐0.41 to ‐0.18) | 0% |
|
| ≤ 200 | 3 | 130 | 146 | ‐0.56 (‐0.88 to ‐0.25) | 39% |
|
| Duration of treatment |
|
|
|
|
| 0.55 |
| > 1 month | 2 | 258 | 248 | ‐0.51 (‐1.01 to ‐0.01) | 81% |
|
| ≤ 1 month | 5 | 914 | 374 | ‐0.32 (‐0.44 to ‐0.19) | 0% |
|
| Use of analgesic co‐interventions | 0.29 | |||||
| Similar between groups | 3 | 289 | 283 | ‐0.53 (‐0.88 to ‐0.18) | 67% | |
| Unclear | 4 | 883 | 339 | ‐0.30 (‐0.43 to ‐0.17) | 0% | |
| *P‐value for interaction | ||||||
| Outcome or subgroup title | No. of studies | No. of participants | Statistical method | Effect size |
| 1 Pain Show forest plot | 10 | 2268 | Std. Mean Difference (Random, 95% CI) | ‐0.36 [‐0.47, ‐0.26] |
| 1.1 Codeine | 3 | 179 | Std. Mean Difference (Random, 95% CI) | ‐0.51 [‐1.01, ‐0.01] |
| 1.2 Fentanyl | 1 | 399 | Std. Mean Difference (Random, 95% CI) | ‐0.22 [‐0.42, ‐0.03] |
| 1.3 Morphine | 1 | 295 | Std. Mean Difference (Random, 95% CI) | ‐0.32 [‐0.59, ‐0.06] |
| 1.4 Oxycodone | 4 | 750 | Std. Mean Difference (Random, 95% CI) | ‐0.42 [‐0.65, ‐0.20] |
| 1.5 Oxymorphone | 2 | 645 | Std. Mean Difference (Random, 95% CI) | ‐0.39 [‐0.58, ‐0.21] |
| 2 Function Show forest plot | 7 | 1794 | Std. Mean Difference (Random, 95% CI) | ‐0.33 [‐0.45, ‐0.21] |
| 2.1 Codeine | 2 | 169 | Std. Mean Difference (Random, 95% CI) | ‐0.42 [‐0.74, ‐0.10] |
| 2.2 Fentanyl | 1 | 399 | Std. Mean Difference (Random, 95% CI) | ‐0.28 [‐0.48, ‐0.09] |
| 2.3 Morphine | 1 | 295 | Std. Mean Difference (Random, 95% CI) | ‐0.29 [‐0.56, ‐0.03] |
| 2.4 Oxycodone | 2 | 286 | Std. Mean Difference (Random, 95% CI) | ‐0.44 [‐1.12, 0.24] |
| 2.5 Oxymorphone | 2 | 645 | Std. Mean Difference (Random, 95% CI) | ‐0.32 [‐0.50, ‐0.13] |
| 3 Number of patients experiencing any adverse event Show forest plot | 4 | 1080 | Risk Ratio (IV, Random, 95% CI) | 1.55 [1.41, 1.70] |
| 3.1 Codeine | 1 | 66 | Risk Ratio (IV, Random, 95% CI) | 1.28 [0.94, 1.75] |
| 3.2 Fentanyl | 1 | 416 | Risk Ratio (IV, Random, 95% CI) | 1.55 [1.33, 1.81] |
| 3.3 Oxycodone | 2 | 294 | Risk Ratio (IV, Random, 95% CI) | 1.62 [1.36, 1.92] |
| 3.4 Oxymorphone | 1 | 304 | Risk Ratio (IV, Random, 95% CI) | 1.59 [1.28, 1.97] |
| 4 Number of patients who withdrew because of adverse events Show forest plot | 10 | 2403 | Risk Ratio (IV, Random, 95% CI) | 4.05 [3.06, 5.38] |
| 4.1 Codeine | 3 | 277 | Risk Ratio (IV, Random, 95% CI) | 3.67 [2.16, 6.24] |
| 4.2 Fentanyl | 1 | 399 | Risk Ratio (IV, Random, 95% CI) | 2.63 [1.64, 4.23] |
| 4.3 Morphine | 1 | 295 | Risk Ratio (IV, Random, 95% CI) | 3.49 [1.45, 8.39] |
| 4.4 Oxycodone | 4 | 758 | Risk Ratio (IV, Random, 95% CI) | 7.75 [3.76, 15.97] |
| 4.5 Oxymorphone | 2 | 674 | Risk Ratio (IV, Random, 95% CI) | 5.32 [2.93, 9.68] |
| 5 Number of patients experiencing any serious adverse event Show forest plot | 3 | 681 | Risk Ratio (IV, Random, 95% CI) | 3.35 [0.83, 13.56] |
| 5.1 Codeine | 1 | 158 | Risk Ratio (IV, Random, 95% CI) | 0.0 [0.0, 0.0] |
| 5.2 Fentanyl | 1 | 416 | Risk Ratio (IV, Random, 95% CI) | 2.78 [0.57, 13.60] |
| 5.3 Oxycodone | 1 | 107 | Risk Ratio (IV, Random, 95% CI) | 6.39 [0.34, 120.71] |
| 6 Withdrawal symptoms Show forest plot | 1 | 499 | Std. Mean Difference (IV, Fixed, 95% CI) | 0.60 [0.42, 0.79] |