| 1 Pain VAS Show forest plot | 2 | | Mean Difference (IV, Random, 95% CI) | Totals not selected |
|
| 1.1 Morphine, measured at 2 weeks | 1 | | Mean Difference (IV, Random, 95% CI) | 0.0 [0.0, 0.0] |
| 1.2 Morphine, measured at 4 weeks | 1 | | Mean Difference (IV, Random, 95% CI) | 0.0 [0.0, 0.0] |
| 1.3 Tilidine/naloxone, measured at 6 weeks | 1 | | Mean Difference (IV, Random, 95% CI) | 0.0 [0.0, 0.0] |
| 2 Mean daily pain intensity Show forest plot | 1 | | Mean Difference (IV, Random, 95% CI) | Totals not selected |
|
| 2.1 Tramadol/paracetamol | 1 | | Mean Difference (IV, Random, 95% CI) | 0.0 [0.0, 0.0] |
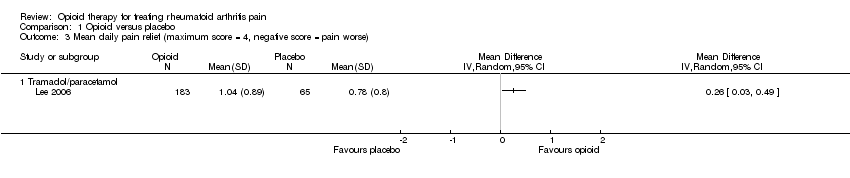
| 3 Mean daily pain relief (maximum score = 4, negative score = pain worse) Show forest plot | 1 | | Mean Difference (IV, Random, 95% CI) | Totals not selected |
|
| 3.1 Tramadol/paracetamol | 1 | | Mean Difference (IV, Random, 95% CI) | 0.0 [0.0, 0.0] |
| 4 Pain relief of 50% or better Show forest plot | 1 | | Risk Ratio (M‐H, Random, 95% CI) | Totals not selected |
|
| 4.1 Codeine/paracetamol | 1 | | Risk Ratio (M‐H, Random, 95% CI) | 0.0 [0.0, 0.0] |
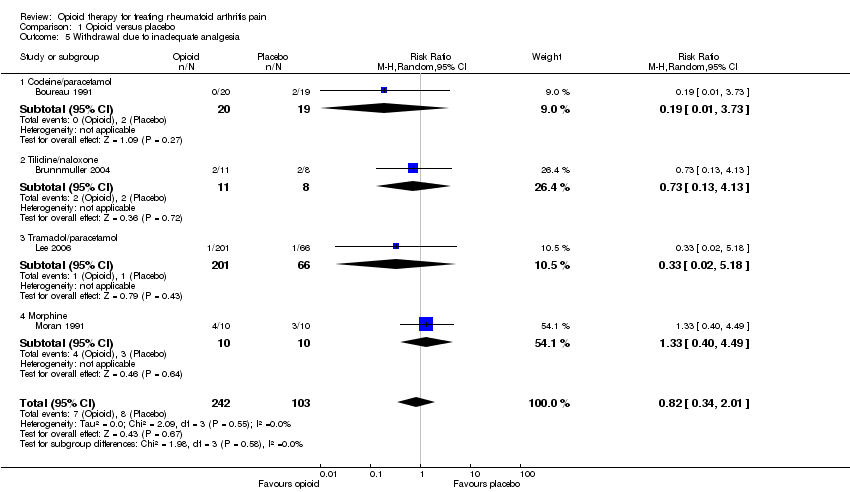
| 5 Withdrawal due to inadequate analgesia Show forest plot | 4 | 345 | Risk Ratio (M‐H, Random, 95% CI) | 0.82 [0.34, 2.01] |
|
| 5.1 Codeine/paracetamol | 1 | 39 | Risk Ratio (M‐H, Random, 95% CI) | 0.19 [0.01, 3.73] |
| 5.2 Tilidine/naloxone | 1 | 19 | Risk Ratio (M‐H, Random, 95% CI) | 0.73 [0.13, 4.13] |
| 5.3 Tramadol/paracetamol | 1 | 267 | Risk Ratio (M‐H, Random, 95% CI) | 0.33 [0.02, 5.18] |
| 5.4 Morphine | 1 | 20 | Risk Ratio (M‐H, Random, 95% CI) | 1.33 [0.40, 4.49] |
| 6 Patient reported global impression of clinical change (PGIC) 'good' or 'very good' Show forest plot | 3 | 324 | Risk Ratio (M‐H, Random, 95% CI) | 1.44 [1.03, 2.03] |
|
| 6.1 Tilidine/naloxone | 1 | 19 | Risk Ratio (M‐H, Random, 95% CI) | 1.09 [0.45, 2.63] |
| 6.2 Tramadol/paracetamol | 1 | 267 | Risk Ratio (M‐H, Random, 95% CI) | 1.33 [0.97, 1.82] |
| 6.3 Codeine/paracetamol | 1 | 38 | Risk Ratio (M‐H, Random, 95% CI) | 2.33 [1.14, 4.77] |
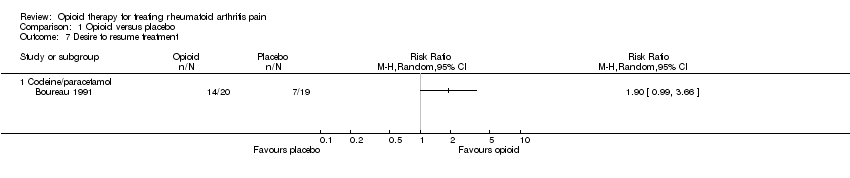
| 7 Desire to resume treatment Show forest plot | 1 | | Risk Ratio (M‐H, Random, 95% CI) | Totals not selected |
|
| 7.1 Codeine/paracetamol | 1 | | Risk Ratio (M‐H, Random, 95% CI) | 0.0 [0.0, 0.0] |
| 8 Functional status (HAQ) Show forest plot | 2 | 243 | Mean Difference (IV, Random, 95% CI) | ‐0.10 [‐0.33, 0.13] |
|
| 8.1 Tramadol/paracetamol | 1 | 223 | Mean Difference (IV, Random, 95% CI) | ‐0.07 [‐0.32, 0.18] |
| 8.2 Morphine | 1 | 20 | Mean Difference (IV, Random, 95% CI) | ‐0.30 [‐0.94, 0.34] |
| 9 Participants reporting adverse events Show forest plot | 4 | | Odds Ratio (Random, 95% CI) | 3.90 [2.31, 6.56] |
|
| 9.1 Codeine/paracetamol | 1 | | Odds Ratio (Random, 95% CI) | 2.33 [0.64, 8.55] |
| 9.2 Tilidine/naloxone | 1 | | Odds Ratio (Random, 95% CI) | 2.00 [0.31, 12.85] |
| 9.3 Tramadol/paracetamol | 1 | | Odds Ratio (Random, 95% CI) | 4.70 [2.48, 8.91] |
| 9.4 Pentazocine | 1 | | Odds Ratio (Random, 95% CI) | 4.33 [0.79, 23.70] |
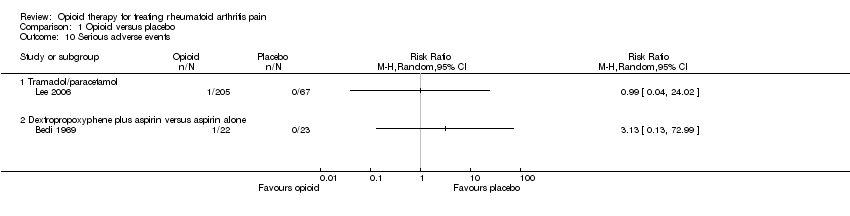
| 10 Serious adverse events Show forest plot | 2 | | Risk Ratio (M‐H, Random, 95% CI) | Totals not selected |
|
| 10.1 Tramadol/paracetamol | 1 | | Risk Ratio (M‐H, Random, 95% CI) | 0.0 [0.0, 0.0] |
| 10.2 Dextropropoxyphene plus aspirin versus aspirin alone | 1 | | Risk Ratio (M‐H, Random, 95% CI) | 0.0 [0.0, 0.0] |
| 11 Withdrawal due to adverse events Show forest plot | 3 | 331 | Risk Ratio (M‐H, Random, 95% CI) | 2.67 [0.52, 13.75] |
|
| 11.1 Codeine/paracetamol | 1 | 40 | Risk Ratio (M‐H, Random, 95% CI) | 0.67 [0.12, 3.57] |
| 11.2 Tilidine/naloxone | 1 | 19 | Risk Ratio (M‐H, Random, 95% CI) | 5.25 [0.31, 89.35] |
| 11.3 Tramadol/paracetamol | 1 | 272 | Risk Ratio (M‐H, Random, 95% CI) | 6.37 [1.58, 25.69] |
| 12 Withdrawal due to adverse event or inefficacy Show forest plot | 1 | | Risk Ratio (M‐H, Random, 95% CI) | Totals not selected |
|