Prostaglandina vaginal (PGE2 y PGF2a) para la inducción del trabajo de parto a término
Referencias
Referencias de los estudios incluidos en esta revisión
Referencias de los estudios excluidos de esta revisión
Referencias de los estudios en espera de evaluación
Referencias adicionales
Characteristics of studies
Characteristics of included studies [ordered by study ID]
Ir a:
| Methods | 'Randomised double‐blind manner'. | |
| Participants | 103 women with indications for labour induction. Inclusion criteria: singleton pregnancy and Bishops score < 5. | |
| Interventions | 3 mg PGE2 vaginal gel (n = 49) or placebo gel(n = 54). Both 12 hours prior to induction. BSs obtained on admission, prior to oxytocin and 10 hours after oxytocin. Patients with BS < 8 10 hours after oxytocin had protocol repeated on D2. If BS < 8 after repeat protocol patients released and managed as clinically indicated. | |
| Outcomes | Primary outcome: change in Bishop scores, caesarean section, total deliveries and failed induction. | |
| Notes | Data extracted from abstract. | |
| Risk of bias | ||
| Bias | Authors' judgement | Support for judgement |
| Allocation concealment? | Unclear risk | B ‐ Unclear |
| Methods | 'Allocated at random' | |
| Participants | 73 primigravid women. Inclusion criteria: singleton, cephalic, primiparous and >36 weeks gestation with a BS <4. intact membranes. | |
| Interventions | 2 mg PGE2 vaginal gel (n = 37) or 3 mg PGE2 vaginal tablet (n = 35). Review at 6 hours after first dose and repeat dose if BS < 7. 2 doses maximum. | |
| Outcomes | Vaginal delivery not achieved in 24 hours, caesarean section and oxytocin augmentation. | |
| Notes | Staincliffe Maternity Hospital, West Yorkshire, UK. | |
| Risk of bias | ||
| Bias | Authors' judgement | Support for judgement |
| Allocation concealment? | Unclear risk | B ‐ Unclear |
| Methods | 'Randomised'. Case controlled for parity and indication for labour induction. | |
| Participants | 77 women. Inclusion criteria: singleton pregnancy, cephalic presentation, afebrile with a reactive non‐stress test. medical or obstetric indications for induction of labour and Bishop score < 4. Exclusion criteria: previous uterine scar, placenta praevia, history of asthma or sickle cell disease, evidence of IUGR, fetal distress or spontaneous uterine contractions. | |
| Interventions | 3 mg PGE2 vaginal suppository (n = 38) or identical looking glycerin suppository (n = 39). Both suppositories placed the evening prior to induction following a baseline Bishop score. Reassessed the next morning and Bishop score reassessed. Oxytocin then commenced, (started at 0.4 mU/min doubled every 20 to 40 minutes). Failed induction was defined as no change in cervical effacement or dilatation after 8 hours of adequate uterine activity, or after 1 hour of oxytocin at 24 mu/min, these patients underwent caesarean section. | |
| Outcomes | Primary outcome: percentage requiring oxytocin for induction, caesarean section, instrumental delivery rates, uterine hyperstimulation with and without FHR changes. neonatal Apgar scores, maternal complications, PPH rates. | |
| Notes | 4 protocol violations in placebo group. Reincluded in analysis (3 had LSCS and 1 had NVD). Women's Hospital, Los Angeles County/University of Southern California Medical Center, Los Angeles. November 1981 to December 1982. | |
| Risk of bias | ||
| Bias | Authors' judgement | Support for judgement |
| Allocation concealment? | Unclear risk | B ‐ Unclear |
| Methods | Alternation in blocks of 6. | |
| Participants | 199 women with cephalic presentations attending for induction of labour. Exclusion criteria: malpresentations or if inclusion in placebo trial might involve delay and so increase risk to mother or fetus. Indications for induction: post dates (126), hypertension (57), miscellaneous (16). | |
| Interventions | 3 mg PGE2 vaginal pessaries (n = 95) or placebo pessaries (n = 104). Prepared in batches of 6 pairs. Pessaries were placed on morning of admission, following assignment of baseline Bishop's score. Following mean interval of 8 hours if labour had not ensued, patients were reassessed and a further pessary inserted. If no labour by 24 hours after 1st pessary then trial ended and other methods of induction used. | |
| Outcomes | Spontaneous labour, change in Bishop score, length of labour, mode of delivery, neonatal Apgar scores, uterine hypertonus. | |
| Notes | 4 post randomisation exclusions for late diagnosed breech presentation. Bangor General Hospital, UK. | |
| Risk of bias | ||
| Bias | Authors' judgement | Support for judgement |
| Allocation concealment? | High risk | C ‐ Inadequate |
| Methods | Allocation on last digit of hospital number. | |
| Participants | 402 women at 40 weeks plus 10 days of pregnancy. Gestation calculated from LMP or by ultrasound at 20 weeks if dates uncertain or greater than 7 days difference between estimates by ultrasound and LMP. | |
| Interventions | Active group (even numbers) (n = 195) induced by 3 mg PGE2 pessary followed by amniotomy 3 hours later +/‐ oxytocin where necessary. induction between 40 weeks +12 days and 40 weeks+ 14 days. Conservative group (odd numbers) (n = 207) had fetal assessment by ultrasound, daily kick charts and alternate date CTGs. | |
| Outcomes | Mean gestation at delivery, analgesia used, mode of delivery, Apgar scores, neonatal intensive care unit admission, umbilical cord blood acidosis, patient satisfaction. | |
| Notes | Multiple ITT violations. 19 patients in active group and 20 in conservative group not accounted for in analysis of maternal outcomes. Method of induction in conservative group not specified. non‐randomised re‐analysis performed to account for women who went into spontaneous labour in active group. Kings College Hospital, London. | |
| Risk of bias | ||
| Bias | Authors' judgement | Support for judgement |
| Allocation concealment? | High risk | C ‐ Inadequate |
| Methods | Randomisation by card shuffling, concealment unclear. | |
| Participants | 38 high‐risk women requiring induction of labour. Indications for induction: diabetes (10), post dates (7), pre‐eclampsia (13), IUGR (4), chronic hypertension (2), rhesus disease (1), others (1). | |
| Interventions | 2 mg PGE2 vaginal gel (n = 15) or placebo gel (n = 18). Bishops score assigned prior to application and 12 hours after application. Oxytocin started at this point (strated at 1mU/min to maximum of 64 mU/min, or until satisfactory contractions observed). If undelivered, patients re‐randomised. If third application needed active gel could be requested. 5 women required multiple applications. | |
| Outcomes | Mode of delivery, mean Apgar score at 1 and 5 minutes, change in Bishop score. | |
| Notes | Only data from single gel application patients included. University Hospital, New Jersey Medical School. July 1983 to April 1984. | |
| Risk of bias | ||
| Bias | Authors' judgement | Support for judgement |
| Allocation concealment? | Unclear risk | B ‐ Unclear |
| Methods | Computer generated lists. Centralised preparation of drugs in dark bottles. Master list not available to investigators until end of study. | |
| Participants | 155 Nulliparous with ruptured membranes of greater than 2 hours duration and unfavourable cervical scores (mean Bishop's score 3). Exclusion criteria: intact membranes, multiple pregnancy, malpresentations, meconium stained amniotic fluid or evidence of intrauterine infection. | |
| Interventions | 3 mg PGE2 vaginal pessary (n = 79) or identical placebo pessary (n = 76). Pessary placed in vagina, reviewed and induced with oxytocin at 14 hours or sooner if signs of infection evident. | |
| Outcomes | Oxytocin augmentation, admission to study‐onset of labour interval, maternal pyrexia, signs and symptoms of infection, NICU admission rates, Apgar scores at 1 and 5 minutes, mode of delivery, uterine hyperstimulation rates. | |
| Notes | National University Hospital, Singapore. January 1992 to December 1994. | |
| Risk of bias | ||
| Bias | Authors' judgement | Support for judgement |
| Allocation concealment? | Low risk | A ‐ Adequate |
| Methods | Computer generated random number list, allocation known only to trial co‐ordinator, drugs in coded boxes. | |
| Participants | 59 Women admitted with pre‐labour rupture of membranes. Inclusion criteria: singleton pregnancy, cephalic presentation, confirmed SROM, Bishop score < 4, no uterine contractions, no signs of maternal infection, clear liquor, absence of medical or obstetric complications. | |
| Interventions | 3 mg PGE2 vaginal gel (n = 30) or identical placebo gel (n = 29). Instillation of gel post randomisation. Conservative management for subsequent 24 hours. Oxytocin used for augmentation or induction as per departmental protocol. | |
| Outcomes | Interval between SROM and onset of labour and delivery. duration of labour, mode of delivery, need for oxytocin, hyperstimulation rates, febrile episodes, other maternal side‐effects, Apgar scores at 1 and 5 minutes, NICU admission. | |
| Notes | Prince of Wales Hospital, Hong Kong. August 1988 to July 1990 | |
| Risk of bias | ||
| Bias | Authors' judgement | Support for judgement |
| Allocation concealment? | Low risk | A ‐ Adequate |
| Methods | Computerised random number tables, allocation unknown to patient or physician. Drugs in coded boxes. | |
| Participants | 54 women undergoing induction of labour. Inclusion criteria: singleton pregnancy, intact membranes and normal placental function. Indications for induction: toxaemia (29), diabetes (9), post term (12), elective (5), oligohydramnios (3), IUGR (3), chronic hypertension (2). | |
| Interventions | 3 mg PGE2 vaginal gel (n = 28), identical placebo gel (n = 26). Baseline Bishop score assigned, if < 5 patients randomised. oxytocin given if required, but details of time interval not clear. | |
| Outcomes | Change in Bishop score, incidence of spontaneous labour, mode of delivery, hyperstimulation rates. | |
| Notes | University of Wisconsin Perinatal Cancer at Meriter/Madison General Hospital, USA. | |
| Risk of bias | ||
| Bias | Authors' judgement | Support for judgement |
| Allocation concealment? | Low risk | A ‐ Adequate |
| Methods | Random number tables, allocation concealment unclear. | |
| Participants | 150 women undergoing induction of labour. Inclusion criteria: singleton pregnancy, cephalic presentation, reactive NST, AFI between 5 and 25, fetal weight between 2500 and 4500 g, uterine contractions less frequent than 5 minutes. Exclusion criteria: no prenatal care, previous uterine surgery, acute or chronic medical or psychiatric illness or drug use. | |
| Interventions | 2 mg PGE2 vaginal gel (n = 37) or identical placebo gel (n = 28). Reassessed 7 days afterwards, then every 2‐4 days after that to a maximum of 307 days. | |
| Outcomes | Number of fetal surveillance visits, onset of spontaneous labour, incidence of SROM, use of oxytocin, admission to delivery time, total length of labour, mode of delivery, meconium staned liquor, 5 minute Apgar scores, PPH, and amnionitis. | |
| Notes | Only two arms of trial analysed here (groups I and II). Additional two arms with membrane stripping +/‐ vaginal prostaglandins (groups III and IV) included in review focusing on membrane stripping. UCLA Medical centre, University of California, USA. | |
| Risk of bias | ||
| Bias | Authors' judgement | Support for judgement |
| Allocation concealment? | Unclear risk | B ‐ Unclear |
| Methods | 'Randomised'. | |
| Participants | 74 women with medical indication for induction. | |
| Interventions | 3 mg PGE2 vaginal gel (n = 24) every 4 to 6 hours, or PGE2 10 mg vaginal insert (slow release) (n = 27) or PGE2 0.5 mg intracervical gel every 6 hours. Subsequent management not specified. | |
| Outcomes | Change in Bishop score, , spontaneous labour, need for oxytocin, hyperstimulation. | |
| Notes | Limited data as extracted from abstract. Pennsylvania Hospital, USA. | |
| Risk of bias | ||
| Bias | Authors' judgement | Support for judgement |
| Allocation concealment? | Unclear risk | B ‐ Unclear |
| Methods | 'Blindly randomised'. | |
| Participants | 53 women undergoing induction of labour. Inclusion criteria: intact membranes, no prior uterine surgery, reactive NST, Bishop score < 6. | |
| Interventions | 10 mg slow release pessary (1 mg/hr) (n = 39) or placebo pessary (n = 14). Those patients with BS < 4 were randomised. Those with BS > 5 were given active drug. Vaginal examinations repeated at 6 and 12 hours. | |
| Outcomes | Hyperstimulation rates, change in Bishop score, neonatal outcomes. | |
| Notes | Only randomised patients included in analysis. outcomes calculated on overall event rate in active arm. Limited data, as extracted from abstract. Medical College of Thomas Jefferson University Hospital, Philadelphia, USA. | |
| Risk of bias | ||
| Bias | Authors' judgement | Support for judgement |
| Allocation concealment? | Unclear risk | B ‐ Unclear |
| Methods | Not stated. | |
| Participants | 345 women undergoing induction of labour. Inclusion criteria: singleton pregnancies, cephalic presentation, intact membranes, Bishop score > 4. Exclusion criteria: any pregnancy carrying fetal or maternal risk factors. | |
| Interventions | 3 mg PGE2 vaginal tablet (n = 180) with a repeat at 6 hours. If not given birth at 24 hours and cervix > 3 cm dilated, a repeat course was given. if < 3 cm dilated no further induction was undertaken. In control group spontaneous labour was awaited until 42 weeks amenorrhea. | |
| Outcomes | Spontaneous onset of labour, mode of delivery, use of oxytocin. Sub group data by parity available on mode of delivery. | |
| Notes | 8 women in active group refused induction and 3 in control group requested induction. Excluded from analysis. First Department of Obstetrics & Gynaecology, Vienna, Austria. | |
| Risk of bias | ||
| Bias | Authors' judgement | Support for judgement |
| Allocation concealment? | Unclear risk | B ‐ Unclear |
| Methods | 'Randomly allocated'. | |
| Participants | 200 patients with medical indications for induction. Inclusion criteria: singleton pregnancy, cephalic presentation, unfavourable cervix (Bishops score < 5). Indications for induction: post‐dates (76), high blood pressure (67), impaired glucose tolerance (19), others (38). | |
| Interventions | 3 mg PGE2 vaginal pessary (4 x 0.75 mg) (n = 100) or 3 mg PGE2 vaginal tablet (n = 100). Single dose prior to amniotomy at 4 cm, oxytocin as required. | |
| Outcomes | Successful induction, mode of delivery, delivery intervals, use of oxytocin, Apgar scores, hyperstimulation or maternal side‐effects. | |
| Notes | Maternity Hospital, Safat, Kuwait. | |
| Risk of bias | ||
| Bias | Authors' judgement | Support for judgement |
| Allocation concealment? | Unclear risk | B ‐ Unclear |
| Methods | Randomised into groups of 20. | |
| Participants | 80 women requiring induction of labour. Inclusion criteria: singleton pregnancy, Bishops score < 4, para 0‐3. Exclusion criteria: contraindication to vaginal delivery, asthma or prior hypersensitivity to prostaglandins, prior attempt at ripening or induction in index pregnancy, malpresentation or multiple pregnancy, intrauterine death, polyhydramnios, antepartum haemorrhage, SROM, uterine scar. Indications for induction: pre‐eclampsia (35), chronic hypertension (15), prolonged pregnancy (14), diabetes mellitus (6), IUGR (6), other (3). | |
| Interventions | 1 mg (n = 20), 2 mg (n = 20) or 3 mg (n = 20) PGE2 vaginal gel or identical placebo (n = 20), inserted the evening prior to induction. re‐examined after 12‐16 hours, followed by oxytocin and amniotomy when 3‐4 cm dilated. induction failure is LSCS prior to 5 cm or not in labour after 8 hours of oxytocin. | |
| Outcomes | Change in Bishop score, Oxytocin requirement, mode of delivery, hyperstimulation, gastrointestinal side effects, Apgar scores at 1 and 5 minutes. | |
| Notes | 4 arm trial. 3 PGE2 arms compared to placebo arm. Different dosages not compared as all three doses fell into low dose category. Dalhousie University and Grace Maternity Hospital, USA. | |
| Risk of bias | ||
| Bias | Authors' judgement | Support for judgement |
| Allocation concealment? | Unclear risk | B ‐ Unclear |
| Methods | 'Randomised'. | |
| Participants | 107 women with uncomplicated pregnancies, requiring induction of labour. Inclusion criteria: singleton pregnancy, Bishop score < 6. | |
| Interventions | 10mg PGE2 vaginal pessary (slow release, Propess) (n = 53) or 1 mg PGE2 vaginal gel (n = 54) which could be repeated after 6 hours. Baseline Bishop score then reassessed after 12 hours. Subsequent management not specified. | |
| Outcomes | Change in Bishops score, induction to delivery interval, mode of delivery. | |
| Notes | Limited data as extracted from abstract. Leeds General Infirmary, UK | |
| Risk of bias | ||
| Bias | Authors' judgement | Support for judgement |
| Allocation concealment? | Unclear risk | B ‐ Unclear |
| Methods | Randomised by random selection of envelopes. | |
| Participants | 42 women requiring induction of labour. Inclusion criteria: favourable cervix, no previous prostaglandin administration. Indications for induction: post‐term (20), hypertension (4) | |
| Interventions | 3 mg PGE2 vaginal tablet (n = 12) or 1 mg PGE2 vaginal gel. Baseline Bishop score prior to instillations with repeat examination 4 hours later. Forewater amniotomy performed at 4 hours and were augmented with escalating doses of oxytocin. | |
| Outcomes | Endogenous prostaglandin levels, change in Bishops score, delivery intervals, mode of delivery, mean Apgar scores, use of oxytocin. | |
| Notes | University of Edinburgh, UK. | |
| Risk of bias | ||
| Bias | Authors' judgement | Support for judgement |
| Allocation concealment? | Unclear risk | B ‐ Unclear |
| Methods | 'Double blind randomised trial'. | |
| Participants | 36 women with inducible cervices. Inclusion criteria: nulliparous women and Bishop score < 9. | |
| Interventions | 2.5 mg PGE2 vaginal gel (n = 18) or placebo (n = 18) with repeat at 24 hours (outpatient administration). | |
| Outcomes | Change in Bishop score, length of first stage of labour, mode of delivery, hyperstimulation. | |
| Notes | Limited data available as extracted from abstract. Lutheran Medical Centre, USA. | |
| Risk of bias | ||
| Bias | Authors' judgement | Support for judgement |
| Allocation concealment? | Unclear risk | B ‐ Unclear |
| Methods | Computer randomization program, Allocation concealment by touch‐tone telephone access | |
| Participants | PROM, GA > 37 wks, singleton, cephalic, no recent attempt at induction of labour | |
| Interventions | IV Oxytocin, immediatevsVaginal PGE2 q6h x 2, then IV oxytocin if still not in labourvsExpectant management x 96 hrs, IV oxytocin if still not in labourvsExpectant management x 96 hrs, vaginal PGE2 as above if still not in labour | |
| Outcomes | C/S, perinatal death, uterine hyperstimulation, uterine rupture, epidural analgesia, instrumental vaginal delivery, meconium stained liquor, Apgar < 7 at 5 minutes, admission to NICU, maternal vomiting, maternal diarrhea, post partum hemorrhage, women not satisfied, chorioamnionitis, maternal antibiotics, endometritis, neonatal infection, fetal distress | |
| Notes | Effective four arm trial. Only data relating to use of Vaginal PGE2 versus expectant management presented. | |
| Risk of bias | ||
| Bias | Authors' judgement | Support for judgement |
| Allocation concealment? | Low risk | A ‐ Adequate |
| Methods | 'Assigned in random order'. | |
| Participants | 60 women requiring induction of labour. Indications for induction: depression (2), diabetes mellitus (13), oestradiol decrease (1), fetal abnormality (1), IUGR (1), hypertension (10), hypothyroidism (1), post maturity (31), pre‐eclampsia (20), other (1). | |
| Interventions | 0.5 mg PGE2 (n = 15), or 1.0 mg PGE2 (n = 15) or 1.5 mg PGE2 (n = 15) vaginal gel or placebo gel (n = 15). Single dose administered following Bishop score, then re‐examined 12 hours later. Subsequent management not specified. | |
| Outcomes | Change in Bishop score, delivery intervals, maternal side effects, mode of delivery, hyperstimulation, Apgar scores, meconium stained liquor. | |
| Notes | Unpublished trial. Intra‐prostaglandin comparison not presented as all three arms fall into 'low dose' category. | |
| Risk of bias | ||
| Bias | Authors' judgement | Support for judgement |
| Allocation concealment? | Unclear risk | B ‐ Unclear |
| Methods | Coded drug boxes in batches of 15, randomisation schedule from random number tables. | |
| Participants | 84 women requiring induction of labour for major or minor complications of pregnancy. Tendency towards those considered unfavourable for surgical induction (high presenting part, low Bishop score, previous failed induction of labour) | |
| Interventions | 0.2 mg (n = 26) or 0.4 mg (n = 26) PGE2 vaginal suppositories or identical placebo (n = 32) placed at 0900 then self administered repeat suppositories at 2 hourly intervals. Rested overnight and continued until 15 suppositories used or labour ensued. If not in labour after 48 hours patients underwent induction by amniotomy and oxytocin. | |
| Outcomes | Time to onset of labour, mode of delivery, change in Bishop score, hyperstimulation, maternal side effects, meconium stained liquor, perinatal mortality. | |
| Notes | 3 arm trial. Both PG arms compared to placebo. Inter‐prostaglandin arms not compared as both doses in low dose category. University of Auckland, NZ | |
| Risk of bias | ||
| Bias | Authors' judgement | Support for judgement |
| Allocation concealment? | Low risk | A ‐ Adequate |
| Methods | 'Randomly allocated'. | |
| Participants | 48 women requiring induction of labour. Inclusion criteria: unfavourable cervix (Bishop score < 3), singleton pregnancy, cephalic presentation. | |
| Interventions | 5 mg PGE2 vaginal gel (n = 16) or 25 mg PGF2a gel (n = 16) or placebo gel (n = 16). Bishop score assigned prior to instillation, re‐examined 12‐16 hours later. If not in labour induction with amniotomy and oxytocin. | |
| Outcomes | Change in Bishop score, length of labour, oxytocin use, epidural anaethesia, Apgar scores, mode of delivery. | |
| Notes | 3 arm trial. John Radcliffe Hospital, UK. | |
| Risk of bias | ||
| Bias | Authors' judgement | Support for judgement |
| Allocation concealment? | Unclear risk | B ‐ Unclear |
| Methods | 'Double blind'. | |
| Participants | 42 women requiring induction of labour. Inclusion criteria: multigravid, singleton pregnancy, cephalic presentation, favourable cervix (Bishop score > 5). | |
| Interventions | 2.5 mg PGE2 vaginal suppository (n = 21) or identical placebo (n = 21). Baseline Bishop score prior to instillation at 0600 then amniotomy at 090 and oxytocin administered at 14.00. | |
| Outcomes | Delivery intervals, oxytocin use, Apgar score at 1 minute. | |
| Notes | 2 trials reported second study non‐randomised hence not reported. John Radcliffe Hospital, UK. | |
| Risk of bias | ||
| Bias | Authors' judgement | Support for judgement |
| Allocation concealment? | Unclear risk | B ‐ Unclear |
| Methods | Open randomised parallel group design. Computer‐generated random numbers in blocks of 10. allocation in opaque sealed envelopes. | |
| Participants | 955 women requiring induction of labour. Inclusion criteria: Bishop score < 8, singleton pregnancy, cephalic presentation. Exclusion criteria: previous caesarean section. Indication for induction: post term (653), hypertensive states (148), fetal concerns (53), maternal health concerns (8), maternal request (78), past obstetric history (15). | |
| Interventions | 2 mg PGE2 vaginal gel once only (n = 483) or repeated dose (n = 472). | |
| Outcomes | Need for amniotomy prior to labour, oxytocin use, epidural analgesia, fetal blood sampling rates, meconium stained liquor, mode of delivery, delivery interval, post partum haemorrhage, Apgar scores, NICU admission. | |
| Notes | John Radcliffe Hospital, UK | |
| Risk of bias | ||
| Bias | Authors' judgement | Support for judgement |
| Allocation concealment? | Low risk | A ‐ Adequate |
| Methods | Randomly number tables and allocated by sealed envelopes. | |
| Participants | 90 women requiring induction of labour. Inclusion criteria: singleton pregnancy, cephalic presentation, unscarred uterus, maternal height over 150 cm, no history of asthma. | |
| Interventions | 50 mg PGF2a vaginal gel (n = 30), 25 mg PGF2a vaginal gel (n = 30), or placebo gel (n = 30). Instillation following cervical assessment (modified Bishops score). Reassessed the next morning, subsequent management at obstetrician's discretion. | |
| Outcomes | Delivery intervals, oxytocin use, mode of delivery, epidural anaesthesia, Apgar scores at 1 and 5 minutes, maternal side effects, change in Bishop score. | |
| Notes | 3 arm trial both active arms combined in analysis and compared to placebo. University of Adelaide, Australia | |
| Risk of bias | ||
| Bias | Authors' judgement | Support for judgement |
| Allocation concealment? | Low risk | A ‐ Adequate |
| Methods | Allocation by sealed opaque randomised envelopes. | |
| Participants | 80 women requiring induction of labour. Inclusion criteria: primigravidae, singleton pregnancy, cephalic presentation, unfavourable cervix (Bishop score < 5). Indications for induction: post‐dates (49), moderate‐severe pre‐eclampsia (26), others (5) | |
| Interventions | 2 mg PGE2 vaginal gel (n = 40) or 3 mg PGE2 vaginal tablet (n = 40). Baseline Bishop score prior to instillation at 17.00, then reassessed at 09.00. If cervical score > 5 then amniotomy performed. If < 5 repeat instillation. Further reassessment at 17.00 if BS still < 5 then no action for 24 hours. Last assessment at 48 hours since first instillation if cervical score still < 5 then final application made. In total 4 possible applications. Oxytocin started 2 hours after amniotomy in cases where needed. | |
| Outcomes | Number of applications, change in Bishop score, delivery intervals, oxytocin use, mode of delivery, Apgar scores, post partum haemorrhage. | |
| Notes | Raigmore Hospital, Scotland, UK. October 1986‐July 1987. | |
| Risk of bias | ||
| Bias | Authors' judgement | Support for judgement |
| Allocation concealment? | Low risk | A ‐ Adequate |
| Methods | Randomised by numbered, sealed envelope. | |
| Participants | 220 women with SROM. Inclusion criteria: primigravidae, singleton pregnancies, cephalic presentation, no Exclusion criteria: no significant antepartum haemorrhage, IUGR, diabetes mellitus, rhesus disease, moderate pre‐eclampsia, history of venereal disease, temperature of > 37.5C, ruptured membranes > 12 hours or meconium stained amniotic fluid on admission. | |
| Interventions | 2 mg PGE2 vaginal gel (n = 110) with a repeat treatment of 1 mg PGE2 gel at 6 hours if no uterine activity. Oxytocin administered 24 hours after admission if labour had not begun. Conservative group (n = 110) received oxytocin at 24 hours after admission if labour did not ensue. | |
| Outcomes | Time from admission to onset of labour or delivery, mode of delivery, oxytocin augmentation, epidural anaesthesia, maternal side effects, maternal and neonatal infection rates, Apgar scores at 1 and 5 minutes, NICU admission rates. | |
| Notes | Aberdeen Maternity Hospital, Scotland, UK . January 1988 to May 1990. | |
| Risk of bias | ||
| Bias | Authors' judgement | Support for judgement |
| Allocation concealment? | Low risk | A ‐ Adequate |
| Methods | Computer generated random‐number tables, with centralised pharmacy allocation. | |
| Participants | 91 women requiring induction of labour. Inclusion criteria: ruptured membranes of less than 24 hours duration, cervix less than 3 cm dilated, < 75% effaced, cephalic presentation, singleton pregnancy, aged 16 to 35 years of age. Exclusion criteria: clinical evidence of chorioamnionitis, antibiotic therapy, regular uterine contractions, meconium stained liquor, fetal anomalies, uterine scar, glucocorticoid therapy, active genital herpes, hypertension, Diabetes mellitus or placental abruption. | |
| Interventions | 2 mg PGE2 vaginal gel (n = 35) placed 4 hours after SROM. After 4 additional hours a further 2 mg dose was placed with 2 subsequent doses 6 hours apart, unless in active labour or the cervix > 4 cm dilated. Oxytocin was started 22 hours after the start of therapy. Expectant management group (n = 31), daily NST. Evidence of fetal compromise or chorioamnionitis resulted in induction +/‐ antibiotic therapy. | |
| Outcomes | Length of 1st and 2nd stages of labour, mode of delivery, blood loss, maternal fever, 5 minute Apgar, neonatal stay, birth weight. | |
| Notes | 3 arm trial with additional arm managed with IV oxytocin (n = 25) 4 hours after SROM. These data are analysed in the review focusing on oxytocin alone. 5 patients excluded from analysis (placebo arm) who refused expectant management. University of Mississippi Medical Centre, Jackson, USA. | |
| Risk of bias | ||
| Bias | Authors' judgement | Support for judgement |
| Allocation concealment? | Low risk | A ‐ Adequate |
| Methods | 'Randomised'. | |
| Participants | 24 women requiring induction of labour. Indications for induction: prolonged pregnancy (19), pre‐eclampsia (2), IUGR (1), other (2). | |
| Interventions | 3 mg PGE2 vaginal tablet (n = 12) or 5 mg PGE2 pessary (n = 12). Baseline cervical assessment prior to instillation then re‐assessment at 4 hours followed by amniotomy and oxytocin if required. | |
| Outcomes | PGE2 plasma levels, oxytocin use, mode of delivery, analgesic use. | |
| Notes | Glasgow Royal Infirmary, UK. | |
| Risk of bias | ||
| Bias | Authors' judgement | Support for judgement |
| Allocation concealment? | Unclear risk | B ‐ Unclear |
| Methods | 'Randomised'. | |
| Participants | 40 women requiring induction of labour. Inclusion criteria: singleton pregnancies, Bishop score < 4, uterine activity less than 1 contraction per 10 minutes. Indications for induction: postdates, hypertension, diabetes and suspected IUGR. | |
| Interventions | 10 mg PGE2 vaginal pessary (slow release) (n = 20) or 2.5 mg PGE2 vaginal gel (n = 20). Subsequent management unclear. | |
| Outcomes | Uterine activity, change in Bishop score, delivery intervals, oxytocin use, mode of delivery, hyperstimulation, neonatal outcomes. | |
| Notes | University of Nebraska College of Medicine, USA. | |
| Risk of bias | ||
| Bias | Authors' judgement | Support for judgement |
| Allocation concealment? | Unclear risk | B ‐ Unclear |
| Methods | 'Randomised basis' | |
| Participants | 95 primiprous women requiring induction of labour Inclusions criteria: Singleton, cephalic, primiparous and Bishops score of less than 6. | |
| Interventions | 2 mg PGE2 vaginal gel (n = 50) or 10 mg PGE2 vaginal insert (n = 45). Both repeated at 12 hours as necessary. | |
| Outcomes | Uterine hyperstimulation, epidural analgesia | |
| Notes | Jessop Hospital for Women, UK | |
| Risk of bias | ||
| Bias | Authors' judgement | Support for judgement |
| Allocation concealment? | Unclear risk | D ‐ Not used |
| Methods | 'Double blind trial'. | |
| Participants | 265 women requiring induction of labour. | |
| Interventions | 1.5 mg (n = 55) or 3.0 mg (n = 55) or 10 mg (n = 55) PGF2a vaginal gel or placebo gel (n = 100). Gel instilled following Bishops score, re‐examined the following morning prior to amniotomy. | |
| Outcomes | Change in Bishop score, mode of delivery, epidural anaesthesia, Apgar at 1 minute, spontaneous labour, post partum haemorrhage. | |
| Notes | All three active arms compared to placebo. Royal Women's Hospital, Melbourne, Australia. | |
| Risk of bias | ||
| Bias | Authors' judgement | Support for judgement |
| Allocation concealment? | Unclear risk | B ‐ Unclear |
| Methods | Allocation by randomly mixed sealed envelopes. | |
| Participants | 200 women requiring induction of labour. Inclusion criteria: nulliparity, singleton pregnancy, cephalic presentation, Bishop score < 7, intact membranes, no evidence of labour, no previous induction attempt, normal NST, need for delivery within 48 hours. Indications for induction: proteinuric hypertension (68), post‐dates and oligohydramnios (66), gestational hypertension (26), IUGR (19), maternal disease (21). | |
| Interventions | 2 mg PGE2 vaginal gel (n = 101) or 3 mg PGE2 vaginal tablet (n = 99). Instillation following baseline Bishop score at 09.00. Reassessed 6‐8 hours later; if amniotomy not possible, second dose of PG given. Final review at 09.00 on D2; if amniotomy still not possible then 3rd dose of PG given. Following amniotomy, if no evidence of spontaneous labour within 4 hours escalating doses of oxytocin used. | |
| Outcomes | Delivery intervals, total dose of PG used, analgesic use, mode of delivery, neonatal welfare, hyperstimulation. | |
| Notes | 1 patient excluded post randomisation for hypersensitivity reaction. Wellington Women's Hospital, New Zealand. 1991 to 1994. | |
| Risk of bias | ||
| Bias | Authors' judgement | Support for judgement |
| Allocation concealment? | Low risk | A ‐ Adequate |
| Methods | Central pharmacy randomisation with coded drug syringes. | |
| Participants | 75 women requiring induction of labour. Inclusion criteria: unfavourable cervix. | |
| Interventions | 5 mg PGE2 vaginal gel (n = 38) or 40 mg PGF2a vaginal gel (n = 37). Baseline Bishop score prior to instillation. Re‐examined the following morning prior to amniotomy. | |
| Outcomes | Change in Bishop score, mode of delivery, Apgar score at 5 minutes, maternal side effects. | |
| Notes | Women's Clinic and Emanuel Hospital, Oregon, USA. | |
| Risk of bias | ||
| Bias | Authors' judgement | Support for judgement |
| Allocation concealment? | Low risk | A ‐ Adequate |
| Methods | 'Prospectively randomised'. | |
| Participants | 58 women requiring induction for post‐dates pregnancy, or gestational diabetes. Inclusion criteria: unfavourable cervix (Bishop score < 7) | |
| Interventions | 2 mg PGE2 vaginally (n = 28) followed by repeat doses at 24 and 48 hours. Control group managed expectantly (n = 30) until 44 weeks or if non‐reassuring NST or favourable cervix (Bishop score > 7). | |
| Outcomes | Rate of spontaneous labour, delivery intervals, mode of delivery, hyperstimulation, neonatal outcomes. | |
| Notes | Limited data available as extracted from abstract. Medical University of South Carolina, USA. | |
| Risk of bias | ||
| Bias | Authors' judgement | Support for judgement |
| Allocation concealment? | Unclear risk | B ‐ Unclear |
| Methods | Randomisation by sealed opaque envelopes. | |
| Participants | 71 women requiring induction of labour. Inclusion criteria: high risk pregnancy, unfavourable cervix (Bishop score < 5), singleton pregnancies, vertex presentation, intact membranes. Exclusion criteria: haemorrhage, asthma, glaucoma, hypersensitivity to prostaglandins. Indications for induction: pre‐eclampsia (23), post‐dates (19), oligohydramnios (7), diabetes mellitus (9), IUGR (5), macrosomia (2), obstetric cholestasis (2), rhesus disease (1), maternal exhaustion (3) | |
| Interventions | 1 mg PGE2 vaginal gel (n = 35), or 2 mgPGE2 gel (n = 36) or 0.5 mg PGE2 intracervical gel. Baseline Bishop score prior to application. Gels reapplied maximally twice at 6 hourly intervals with repeat Bishop scoring. If Bishop score > 5 but no regular contractions, amniotomy +/‐ oxytocin started. If Bishop score < 5 after 18 hours/3 gels then LSCS performed for failed induction. | |
| Outcomes | Number of gel applications, delivery intervals, mode of delivery, hyperstimulation, maternal side effects, neonatal outcomes. | |
| Notes | Three arm trial, intracervical arm reported in review concentrating on intracervical prostaglandins. Helsinki University Hospital, Finland. | |
| Risk of bias | ||
| Bias | Authors' judgement | Support for judgement |
| Allocation concealment? | Low risk | A ‐ Adequate |
| Methods | Randomisation using random number tables using permuted blocks of varying length. Central pharmacy allocation. | |
| Participants | 100 women requiring induction of labour. Inclusion criteria: Bishop score < 6, absence of medical indication for induction, no more than 1 previous caesarean section. Exclusion criteria: non‐ressuring NST, macrosomia, IUGR, oligohydramnios (AFI < 5). | |
| Interventions | 2 mg PGE2 vaginally (n = 50) or identical placebo (n = 50) every day for 5 consecutive days (outpatient administration). | |
| Outcomes | Hyperstimulation, time interval to spontaneous labour and delivery, mode of delivery, meconium staining of liquor, epidural anaesthesia, NICU admission and 5 minute Apgar < 7. | |
| Notes | University of Tennessee, USA. June 1993 to June 1994. | |
| Risk of bias | ||
| Bias | Authors' judgement | Support for judgement |
| Allocation concealment? | Low risk | A ‐ Adequate |
| Methods | Allocation on case number. Concealment unclear. | |
| Participants | 200 women with post dates pregnancies requiring induction of labour. Inclusion criteria: singleton pregnancies. | |
| Interventions | 3 mg PGE2 vaginal tablet (n = 70) followed by repeat treatment within 3 to 4 days. Expectant group (n = 104) seen twice weekly until induction at 42 weeks. (outpatient administration). | |
| Outcomes | Delivery intervals, mode of delivery, Apgar score at 5 minutes, meconium stained liquor. | |
| Notes | 26 women randomised to treatment arm wished expectant management but are excluded from analysis. University of Tel Aviv, Israel. | |
| Risk of bias | ||
| Bias | Authors' judgement | Support for judgement |
| Allocation concealment? | High risk | C ‐ Inadequate |
| Methods | Monthly alternation between two regimens. | |
| Participants | 200 women requiring induction of labour. Inclusion criteria: singleton pregnancy, cephalic presentation. Exclusion criteria: multiple pregnancy, history of sensitivity to prostaglandins, history of asthma, history of glaucoma, ruptured membranes, previous uterine surgery, grand multiparae, history of precipitate labour, any induction for social reasons. | |
| Interventions | 3 mg PGE2 vaginal tablets (n = 106) plus a further 3 mg if needed 4 hours later. Or 1 mg PGE2 vaginal gel (n = 94) followed by 2 mg 4 hours later if needed. If no labour after further 4 hours amniotomy undertaken and oxytocin commenced where required. | |
| Outcomes | Delivery intervals, analgesia used, mode of delivery, post partum haemorrhage, patient acceptability,. | |
| Notes | Coventry Maternity Hospital and Dudley Road Hospital Birmingham, UK. | |
| Risk of bias | ||
| Bias | Authors' judgement | Support for judgement |
| Allocation concealment? | High risk | C ‐ Inadequate |
| Methods | Central pharmacy randomisation using random number tables. | |
| Participants | 90 women admitted for induction of labour. Inclusion criteria: intact membranes, reactive NST, Bishop score < 5, fewer than 8 contractions per hour. Indications for induction: post‐dates (23), hypertension (35), diabetes mellitus (8), IUGR (10), macrosomia (6), Rh sensitisation (2), non‐reassuring surveillance (6) | |
| Interventions | 5 mg PGE2 vaginal gel (n = 45) or 5 mg PGE2 vaginal suppository (n = 45). Instillation following baseline Bishop score, repeat treatment if still met inclusion criteria at 6 hours. If no labour by the following morning oxytocin started. | |
| Outcomes | Change in Bishop score, number of treatments required, delivery intervals, spontaneous labour, mode of delivery, hyperstimulation. | |
| Notes | Original trial planned for 120 patients, but trial stopped after 90 recruited due to high rates of hyperstimulation in suppository group. St Luke's Perinatal Centre, Missouri, USA. | |
| Risk of bias | ||
| Bias | Authors' judgement | Support for judgement |
| Allocation concealment? | Low risk | A ‐ Adequate |
| Methods | 'Random allocation'. | |
| Participants | 69 women requiring induction of labour. Inclusion criteria: primaparous, cephalic presentation, Bishop score < 5. | |
| Interventions | PGE2 vaginal film (8.5 mg in 24 hours) (n = 33) or identical placebo (n = 36). baseline Bishop score and repeat at 12 and 24 hours. | |
| Outcomes | Change in Bishops score, mode of delivery, NICU admission rates and Apgar scores. | |
| Notes | National University Hospital, Singapore. | |
| Risk of bias | ||
| Bias | Authors' judgement | Support for judgement |
| Allocation concealment? | Unclear risk | B ‐ Unclear |
| Methods | Central randomisation by pharmacy with coded syringes. | |
| Participants | 30 patients requiring induction labour. Inclusion criteria: Bishop score < 4. Indications for induction: Post dates (20), infant large for gestational age (10), pre‐eclampsia (5), diabetes (1), anencephaly (1). | |
| Interventions | 2.5 mg PGE2 vaginal gel (n = 15) or identical placebo (n = 15). Bishop score assigned at instillation and the following morning prior to commencement of oxytocin. | |
| Outcomes | Spontaneous labour, change in Bishops score, mode of delivery, 5 minute Apgar < 6, maternal morbidity and perinatal death. | |
| Notes | One perinatal death in experimental group in anencephalic pregnancy excluded from analysis. Report included data on two further trials neither of which included a control arm hence data not included. Oregon Health Sciences University, USA. | |
| Risk of bias | ||
| Bias | Authors' judgement | Support for judgement |
| Allocation concealment? | Low risk | A ‐ Adequate |
| Methods | 'Randomised observational study' | |
| Participants | 200 women requiring induction of labour Inclusions criteria: Singleton, cephalic and > 36 weeks gestation. some patients had had previous caesarean sections. | |
| Interventions | 3 mg PGE2 vaginal tablet (n = 100) or 10 mg PGE2 vaginal slow release pessary. Tablets repeated at 6 hourly interval, maximum of two doses. | |
| Outcomes | Vaginal delivery not achieved in 24 hours, uterine hyperstimulation, caesarean section, oxytocin augmentation, uterine rupture, instrumental vaginal delivery, Apgar score < 7 at 5 minutes. | |
| Notes | University of Vienna, Austria | |
| Risk of bias | ||
| Bias | Authors' judgement | Support for judgement |
| Allocation concealment? | Unclear risk | B ‐ Unclear |
| Methods | Random drawing of cards kept in pharmacy. | |
| Participants | 118 women requiring induction of labour. Inclusion criteria: singleton pregnancies, unfavourable cervix (Bishop score < 5). | |
| Interventions | 2.5 mg PGE2 vaginal gel (n = 55) or identical placebo (n = 63). Baseline Bishop score prior to instilation. Repeat BS prior to induction with oxytocin 12 hours after instillation. | |
| Outcomes | Change in Bishop score, oxytocin use, duration of labour, mode of delivery, Apgar scores and meconium staining of the liquor. | |
| Notes | University of Nebraska Medical Centre, USA. December 1985 to February 1987. | |
| Risk of bias | ||
| Bias | Authors' judgement | Support for judgement |
| Allocation concealment? | Unclear risk | B ‐ Unclear |
| Methods | Centralised computerised randomisation and allocation. Stratified by parity. | |
| Participants | 215 women requiring induction of labour. Inclusion criteria: Bishop score < 4, singleton pregnancies, cephalic presentation. Exclusion criteria: previous uterine scar, vaginal bleeding, ruptured membranes, asthma or glaucoma, grand multiparity, nonreassuring FHR test. | |
| Interventions | 10 mg PGE2 vaginal pessary (0.8 mg/hr) (n = 114) or identical placebo (n = 101). Baseline Bishop score at insertion followed by repeat examinations at 6 and 12 hours. Pessary removed at 12 hours. | |
| Outcomes | Change in Bishop score, hyperstimulation, adverse reactions, need for oxytocin, mode of delivery, post partum haemorrhage and 5 minute Apgar score < 7. | |
| Notes | 81 patients in placebo arm crossed over into active treatment arm after initial period. Data for all outcomes reported separately for first 12 hour period. Multicentre trial, USA. October 1989 to July 1990. | |
| Risk of bias | ||
| Bias | Authors' judgement | Support for judgement |
| Allocation concealment? | Low risk | A ‐ Adequate |
| Methods | Randomised by opening sealed numbered envelope | |
| Participants | 201 women undelivered at 41 weeks. Exclusion criteria: pre‐eclampsia, gestational diabetes, contraindication to vaginal delivery, placenta praevia, non‐cephalic presentation, evidence of maternal or fetal compromise. | |
| Interventions | 3 mg PGE2 vaginal pessary (n = 96) 6 hourly as necessary or expectant management (n = 105) with twice weekly assessments. | |
| Outcomes | Spontaneous labour, mode of delivery, Apgar scores, cord blood pH, NICU admission, perinatal mortality. | |
| Notes | Prince of Wales Hospital, Hong Kong. | |
| Risk of bias | ||
| Bias | Authors' judgement | Support for judgement |
| Allocation concealment? | Low risk | A ‐ Adequate |
| Methods | Randomised by drawing of envelopes. | |
| Participants | 50 women requiring induction of labour. Inclusion criteria: unfavourable cervix (Bishop score < 9). Exclusion criteria: diabetes, hypertension, previous uterine surgery, abnormal FHR tracings, vaginal bleeding, SROM, regular uterine contractions, non vertex presentation, macrosomia, IUGR, oligohydramnios or multiple gestations. | |
| Interventions | 2 mg PGE2 vaginal gel (n = 24) or identical placebo (n = 26). Instillation following assignment of Bishop score, repeat treatments and assessments twice weekly (outpatient administration). Induction with oxytocin at 44 weeks if needed. | |
| Outcomes | Number of gel applications, change in Bishop score, mode of delivery, oxytocin use, hyperstimulation, meconium staining, Apgar scores, cord pH, NICU admission. | |
| Notes | University of South Florida College of Medicine, USA. | |
| Risk of bias | ||
| Bias | Authors' judgement | Support for judgement |
| Allocation concealment? | Unclear risk | B ‐ Unclear |
| Methods | Randomised by computer‐generated lists. Concealment unclear. | |
| Participants | 91 women requiring induction of labour. Inclusion criteria: Bishop score < 9. Exclusion criteria: maternal medical problems, previous uterine surgery, previous stillbirth, abnormal fetal heart rate, vaginal bleeding, SROM, regular uterine contractions, abnormal ultrasound findings, fetal weight > 4500 g, non reactive NST. | |
| Interventions | 2 mg PGE2 vaginal suppositories (n = 38) or identical placebo (n = 42) daily (outpatient administration). Twice weekly assessments until 44 weeks. | |
| Outcomes | Spontaneous labour, SROM, number of suppositories used, oxytocin use, mode of delivery, Apgar scores, umbilical artery pH, presence of meconium, NICU admission. | |
| Notes | University of South Florida College of Medicine, USA. | |
| Risk of bias | ||
| Bias | Authors' judgement | Support for judgement |
| Allocation concealment? | Unclear risk | B ‐ Unclear |
| Methods | 'Allocated at random selection' | |
| Participants | 200 primigravid women. inclusion criteria: primigravid, singleton, ruptured membranes and BS < 4. Exclusion criteria: meconium stained liquor. | |
| Interventions | Conservative management (n = 100) or active management with 3 mg PGE2 vaginal tablets. PGE2 tablets every 6 hours to a maximum of 3. no details given of conservative management. | |
| Outcomes | Caesarean section, epidural analgesia, instrumental vaginal delivery, meconium stained liquor, perinatal death, post partum haemorrhage. | |
| Notes | Allama Iqbal Medical School, Lahore, Pakistan | |
| Risk of bias | ||
| Bias | Authors' judgement | Support for judgement |
| Allocation concealment? | Unclear risk | B ‐ Unclear |
| Methods | Central pharmacy allocation using random number tables. | |
| Participants | 69 women requiring induction of labour. Inclusion criteria: unfavourable cervix (Bishop score < 4), intact membranes, cephalic presentation, reactive NST and normal AFI. | |
| Interventions | 2.5 mg PGE2 vaginal gel (n = 34) with placebo 'chip' pr 3‐3.5 mg PGE2 vaginal chips (n = 35) with placebo gel. Re‐examined after 12 hours and oxytocin started if not in labour, amniotomy performed in labour. | |
| Outcomes | Change in Bishop score, spontaneous labour, oxytocin use, hyperstimulation, mode of delivery, maternal side effects, | |
| Notes | University of Nebraska Medical School, USA. | |
| Risk of bias | ||
| Bias | Authors' judgement | Support for judgement |
| Allocation concealment? | Low risk | A ‐ Adequate |
| Methods | Computer generated random number tables, central pharmacy preparation. | |
| Participants | 121 women with medical or obstetric indications for induction. Inclusion criteria: intact membranes, unfavourable cervix (Bishop score < 4), cephalic presentation, no spontaneous contractions, reactive NST. | |
| Interventions | 10 mg PGE2 vaginal pessary (slow release) (n = 66) or 2.5 mg PGE2 vaginal gel (n = 55). Baseline Bishop score, vaginal gel given up to 2 times during 12 hour study period. Oxytocin commenced at end of 12 hours if not in labour. | |
| Outcomes | Change in Bishop score, spontaneous labour rates, oxytocin use, hyperstimulation, mode of delivery, Apgar scores and umbilical artery pH measurements. | |
| Notes | University of Nebraska Medical Centre, USA. August 1990 to July 1991. | |
| Risk of bias | ||
| Bias | Authors' judgement | Support for judgement |
| Allocation concealment? | Low risk | A ‐ Adequate |
| Methods | 'Randomly allocated' | |
| Participants | 267 women requiring induction of labour. Exclusion criteria: breech presentation, haemorrhage, fetal distress, glaucoma. Indications for induction: placental insufficiency (78), pre‐eclampsia (59), pregnancy discomfort (54), prolonged pregnancy (24), rhesus disease (18), others (34). | |
| Interventions | 3 mg PGE2 vaginal tablet (n = 135) or 3 mg PGE2 vaginal pessary (n = 132). Following baseline Bishop score tablet group received a tablet and a repeat if needed at 6 hours. In pessary group no repeat given. Amniotomy performed at 3 cm with oxytocin as needed. | |
| Outcomes | Successful induction, oxytocin use, delivery intervals, mode of delivery, post partum haemorrhage, Apgar scores. | |
| Notes | Multi‐centre trial, Denmark. October 1987 to January 1989. | |
| Risk of bias | ||
| Bias | Authors' judgement | Support for judgement |
| Allocation concealment? | Unclear risk | B ‐ Unclear |
| Methods | 'Random assignment'. | |
| Participants | 121 women requiring induction of labour. Inclusion criteria: singleton pregnancy, cephalic presentation, intact uterus, no contraindications for labour induction or vaginal delivery, not in labour, intact membranes, Bishop score < 5, no contraindications for treatment with prostaglandins. | |
| Interventions | 3 mg PGE2 vaginal tablet with placebo gel (n = 41) or both placebo treatments (n = 40). Instillation following baseline Bishop score assessment, then reassessed 12 hours later, prior to amniotomy and oxytocin if Bishop score > 6. If Bishop score still < 5 after initial 12 hour period induced with extra‐amniotic prostaglandin. | |
| Outcomes | Change in Bishop score, mode of delivery, maternal side‐effects, post partum haemorrhage, Apgar scores, hyperstimulation. | |
| Notes | Three arm trial. Intracervical prostaglandin gel arm presented in reviews focusing on intracervical prostaglandins. University of Gent, Belgium. September 1981 to July 1982. | |
| Risk of bias | ||
| Bias | Authors' judgement | Support for judgement |
| Allocation concealment? | Unclear risk | B ‐ Unclear |
| Methods | 'Randomised non‐blinded controlled trial' | |
| Participants | 69 women requiring induction of labour. Inclusion criteria: Intact membranes. Exclusion criteria: Ruptured membranes, previous caesarean section. | |
| Interventions | 1 or 2 mg PGE2 vaginal gel (n = 34) or 10 mg slow release vaginal insert (n‐35) | |
| Outcomes | Caesarean section, epidural analgesia, instrumental vaginal delivery. Patient satisfaction (measured on 6 point Likert scale). | |
| Notes | Additional information regarding patient satisfaction requested from authors. raw data awaited. Pinderfields Hospital, Wakefield, UK | |
| Risk of bias | ||
| Bias | Authors' judgement | Support for judgement |
| Allocation concealment? | Unclear risk | B ‐ Unclear |
| Methods | 'Randomly allocated'. | |
| Participants | 58 women requiring induction of labour. Inclusion criteria: unfavourable cervix (Bishop score < 5). | |
| Interventions | 2 mg PGE2 vaginal suppository and placebo gel (n = 19) or placebo gel and suppository (n = 20). Baseline Bishops score prior to treatment followed by review at 24 hours. If not in labour induced with oxytocin (started at 2 mU/minute increased to a maximum of 24 mU/minute. | |
| Outcomes | Change in Bishops score, spontaneous labour, use of oxytocin, hyperstimulation, mode of delivery, maternal side‐effects, Apgar scores. | |
| Notes | Three arm trial. Intracervical prostaglandin gel arm presented in reviews focusing on intracervical prostaglandins. 2 centre trial, Sweden. | |
| Risk of bias | ||
| Bias | Authors' judgement | Support for judgement |
| Allocation concealment? | Unclear risk | B ‐ Unclear |
| Methods | 'Randomly assigned'. | |
| Participants | 81 patients requiring induction of labour. Inclusion criteria: singleton pregnancy, cephalic presentation, parity < 3, Bishop score < 4, reactive NST, no previous uterine scars, no vaginal bleeding, intact membranes or SROM < 4 hours duration, no fever, no allergy to prostaglandins, no history of asthma or glaucoma, no fetal distress, not in spontaneous labour, no evidence of clinical hydramnios, no underlying maternal cardiac lesion. | |
| Interventions | 10 mg PGE2 vaginal pessary (1 mg/hr) (n = 42) or placebo (n = 39). Instillation following baseline Bishop score. repeat examinations at 6 and 12 hours. Pessary removed at 12 hours. If not in labour after 12 hours, induction with oxytocin, with amniotomy at physicians discretion. | |
| Outcomes | Change in Bishop score, spontaneous labour, mode of delivery, epidural analgesia, hyperstimulation, oxytocin use. | |
| Notes | 2 active treatment and 9 placebo patients not evaluated with regard to labour parameters. John Hopkins University School of Medicine, USA. | |
| Risk of bias | ||
| Bias | Authors' judgement | Support for judgement |
| Allocation concealment? | Unclear risk | B ‐ Unclear |
| Methods | Computer generated random number lists with centrally produced coded drug boxes. | |
| Participants | 206 women requiring induction of labour. Inclusion criteria: singleton pregnancy, cephalic presentation, parity < 3, Bishop score < 4, reactive NST, no previous uterine scars, no vaginal bleeding, intact membranes or SROM < 4 hours duration, no fever, no allergy to prostaglandins, no history of asthma or glaucoma, no fetal distress, not in spontaneous labour, no evidence of clinical hydramnios, no underlying maternal cardiac lesion. | |
| Interventions | 10 mg PGE2 vaginal pessary (1 mg/hr) (n = 102) or identical placebo (n = 104). Instillation following baseline Bishop score, repeat examinations at 6 and 12 hours. Pessary removed after 12 hours. If not in labour after 12 hours, induction with oxytocin with amniotomy at physicians discretion. | |
| Outcomes | Change in Bishop score, mode of delivery, hyperstimulation, time to delivery. | |
| Notes | 13 patients disqualified for early removal of pessary (some related to hyperstimulation, unclear if these included in analysis or not) 5 for protocol violations. Multicentre trial (10 centres), USA. | |
| Risk of bias | ||
| Bias | Authors' judgement | Support for judgement |
| Allocation concealment? | Low risk | A ‐ Adequate |
AFI = amniotic Fluid Index
BS = Bishop score
C/S = caesarean section
CTG = cardiotocograph
FHR = fetal Heart Rate
ITT = intention To Treat Analysis
IUGR = intrauterine Growth Restiction
IV = intravenous
LMP = last Menstrual Period
LSCS = lower Segment Caesarean Section
min = minute(s)
NICU = neonatal Intensive Care Unit
NST = non‐Stress Test
NVD = normal Vaginal Delivery
PG = prostaglandin
PPH = post partum haemorrhage
SROM = spontaneous rupture of the membranes
Characteristics of excluded studies [ordered by study ID]
Ir a:
| Study | Reason for exclusion |
| Comparison of PGE2 gel vs pessary. Unpublished trial, no outcome data available. Recruitment finished 1992. | |
| Comparison of sustained release prostalandin pessary to vaginal PGE2 tablets. No primary outcomes reported. | |
| Comparison of 2.5.mg PGE2 vaginal gel 1 or 6 hourly. Does not fit into dose comparison as both arms in 'high dose' category. | |
| Study assessing absorbtion profiles of PG pessaries. No primary outcomes reported. | |
| Preinduction cervical ripening with PGE2 gel. No primary outcomes reported. | |
| Absorbtion profiles of PGE2 gel. No primary outcomes reported. | |
| Intrarectal PGE2 suppositories. No primary outcome data. | |
| Three arm trial comparing PGE2 gel and tablets. No denominator data reported. Limited outcome reporting. | |
| Comparison of PGE2 vaginal gel versus suppository. One case of IUD included, cannot separate out data. | |
| PGE2 vaginally for induction of labour. No primary outcomes reported. | |
| Comparison of 3 mg PGE2 gel at 12 or 24 hours post SROM. Does not fit into any comparison groups as treatment effectively the same in both arms. | |
| Slow release PGE2 pessaries. No primary outcome data reported. | |
| Plasma levels of PG metabolites. No primary outcomes reported. | |
| Comparison 3 mg PGE2 6 hourly (maximum 6mg) or PGE2 varied according to Bishops score. Not possible to accurately compare due to variation in varying arm. Does not fit into dose comparison as both arms in 'high dose' category. | |
| Management of IUDs with PG induction. | |
| Comparison of 3 doses of PGE2 gel at three different dose intervals. 3mg 8 hours apart (max 6mg), 2mg 4 hours apart (max 6mg), 0.5mg 3 hours apart (max 10mg). Does not fit into dose comparison as both arms in 'high dose' category. | |
| Comparison of 3 mg PGE2 x2 or 0.5mg PGE2 3 hourly (max 4mg) in 48 hours. Does not fit into dose comparison as both arms in 'high dose' category. | |
| Comparison of PGE2 tablets to Propess (10mg slow release pessary). 50% of Propess arm had additional PGE2 tablets. Not possible to dissect out data. | |
| Comparison of vaginal PGE2 tablet and gel. No primary outcomes reported. | |
| Outpatient administrated of PGE2 +/‐ oestrogen vs placebo. No primary outcomes reported. | |
| Variable decelerations during pre‐induction phase, prior to PG induction. No primary outcomes reported. | |
| Fetal and maternal circulation changes during PGE2 induction. No primary outcomes reported. | |
| 44 patients in randomised double‐blind placebo controlled trial comparing 2mg PGE2 vaginal gel to placebo. Excluded due to 25% of participants being < 20 weeks' gestation and also 1 patient with an IUD was included. Not possible to separate out relevant data. | |
| Evaluation of PGE2 induction, only in pre‐term patients. | |
| Two trials: one small randomised comparison of PGE2 to placebo. No primary outcomes reported. Second non‐randomised cohort not reported. | |
| Comparison of two slow release vaginal pessaires. No primary outcome data presented. | |
| Economic analysis of PGE2 induction of labour (see Mackenzie 1997 in included studies) | |
| Comparison of 2.0 mg PGE2 gel (max total dose 4.0mg) vs 3.0 mg PGE2 gel (max total dose 6.0 mg). Does not fit into dose comparison as both arms in 'high dose' category. | |
| Induction with PGE2. Some patients with IUDs included. Not possible to separate these data out. | |
| Comparison of PGE2 gel to tablet. Unpublished trial. Recruitment started 1990. | |
| Comparison of PGE2 gel. 1 mg followed by 2 mg 6 hourly (maximum 5 mg) vs 2 mg followed by 2 mg 12 hourly (maximum 6 mg). Does not fit into dose comparison as both arms in 'high dose' category. | |
| Prostaglandin plasma levels in 2nd trimester abortions. No primary outcomes reported. | |
| Trial comparing 2.5 mg PGE2 gel to 5.0 mg PGE2 gel maximum of two doses. Does not fit into dose comparison as both arms in 'high dose' category. | |
| Effect of PG induction on fetal breathing movements. No primary outcomes reported. | |
| Controlled release PGE2 for cervical ripening. Cross‐over trial and no primary outcomes reported. | |
| PGE2 gel vs pessary. No primary outcomes reported. | |
| Comparison of 3 mg PGE2 24 hourly (6 mg max) or 3 mg PGE2 4 hourly (max 9 mg). Does not fit into dose comparison as both arms in 'high dose' category. | |
| Comparison of three doses of PGF2a (0.1, 0.125 and 0.2 mg). doses comparison of PGF2a not in prespecified intervention comparisons. | |
| Comparison of 3 mg PGE2 vaginal pessary to 3 mg PGE2 vaginal paste or 3 mg PGE2 extraamniotic paste. Not possible to compare dose as same in both vaginal arms. Does not fall into category for comparison of vehicle. Extraamniotic paste comparison reported in extraamniotic prostaglandin review. | |
| Effect of vaginal PGE2 on cervial tissues. No primary outcomes reported. | |
| Dose ranging study of PGE2. Allocation not mentioned. Non‐blinded study. | |
| Comparison of 4 mg PGE2 gel at 12 or 24 hours. Small trial with limited outcome reporting. Does not fit into dose comparison, due to similarity of both arms. | |
| Comparison of 2 mg PGE2 (4 mg max) or 3 mg PGE2 (6 mg max) vaginal gel every 12 hours. Does not fit into dose comparison as both arms in 'high dose' category. |
max = maximum
PG = prostaglandin
IUD = intrauterine death
vs = versus
Data and analyses
| Outcome or subgroup title | No. of studies | No. of participants | Statistical method | Effect size |
| 1 Vaginal delivery not achieved within 24 hours Show forest plot | 2 | 384 | Risk Ratio (M‐H, Fixed, 95% CI) | 0.19 [0.14, 0.25] |
| Analysis 1.1  Comparison 1 (1.1) PGE2 (all regimens) vs placebo/no treatment (all women), Outcome 1 Vaginal delivery not achieved within 24 hours. | ||||
| 1.1 PGE2 (once only) vs placebo/no treatment | 1 | 39 | Risk Ratio (M‐H, Fixed, 95% CI) | 0.88 [0.67, 1.15] |
| 1.2 PGE2 (repeated doses) vs placebo/no treatment | 1 | 345 | Risk Ratio (M‐H, Fixed, 95% CI) | 0.12 [0.08, 0.18] |
| 2 Uterine hyperstimulation with FHR changes Show forest plot | 13 | 1203 | Risk Ratio (M‐H, Fixed, 95% CI) | 4.14 [1.93, 8.90] |
| Analysis 1.2  Comparison 1 (1.1) PGE2 (all regimens) vs placebo/no treatment (all women), Outcome 2 Uterine hyperstimulation with FHR changes. | ||||
| 2.1 PGE2 (once only) vs placebo/no treatment | 6 | 459 | Risk Ratio (M‐H, Fixed, 95% CI) | 1.38 [0.46, 4.15] |
| 2.2 PGE2 (repeated doses) vs placebo/no treatment | 3 | 208 | Risk Ratio (M‐H, Fixed, 95% CI) | 5.34 [0.27, 106.70] |
| 2.3 PGE2 (sustained release) vs placebo/no treatment | 4 | 536 | Risk Ratio (M‐H, Fixed, 95% CI) | 10.87 [2.69, 43.92] |
| 3 Caesarean section Show forest plot | 32 | 6243 | Risk Ratio (M‐H, Fixed, 95% CI) | 0.89 [0.79, 1.00] |
| Analysis 1.3  Comparison 1 (1.1) PGE2 (all regimens) vs placebo/no treatment (all women), Outcome 3 Caesarean section. | ||||
| 3.1 PGE2 (once only) vs placebo/no treatment | 15 | 1349 | Risk Ratio (M‐H, Fixed, 95% CI) | 1.01 [0.82, 1.24] |
| 3.2 PGE2 (repeated doses) vs placebo/no treatment | 13 | 4323 | Risk Ratio (M‐H, Fixed, 95% CI) | 0.84 [0.71, 1.00] |
| 3.3 PGE2 (sustained release) vs placebo/no treatment | 4 | 571 | Risk Ratio (M‐H, Fixed, 95% CI) | 0.84 [0.64, 1.10] |
| 4 Serious neonatal morbidity or perinatal death Show forest plot | 7 | 3482 | Risk Ratio (M‐H, Fixed, 95% CI) | 0.46 [0.09, 2.31] |
| Analysis 1.4  Comparison 1 (1.1) PGE2 (all regimens) vs placebo/no treatment (all women), Outcome 4 Serious neonatal morbidity or perinatal death. | ||||
| 4.1 PGE2 (once only) vs placebo/no treatment | 1 | 29 | Risk Ratio (M‐H, Fixed, 95% CI) | 0.0 [0.0, 0.0] |
| 4.2 PGE2 (repeated doses) vs placebo/no treatment | 4 | 3169 | Risk Ratio (M‐H, Fixed, 95% CI) | 0.46 [0.09, 2.31] |
| 4.3 PGE2 (sustained release) vs placebo/no treatment | 2 | 284 | Risk Ratio (M‐H, Fixed, 95% CI) | 0.0 [0.0, 0.0] |
| 5 Serious maternal morbidity or death Show forest plot | 3 | 530 | Risk Ratio (M‐H, Fixed, 95% CI) | 2.23 [0.34, 14.76] |
| Analysis 1.5  Comparison 1 (1.1) PGE2 (all regimens) vs placebo/no treatment (all women), Outcome 5 Serious maternal morbidity or death. | ||||
| 5.1 PGE2 (once only) vs placebo | 2 | 461 | Risk Ratio (M‐H, Fixed, 95% CI) | 2.23 [0.34, 14.76] |
| 5.3 PGE2 (sustained release) vs placebo/no treatment | 1 | 69 | Risk Ratio (M‐H, Fixed, 95% CI) | 0.0 [0.0, 0.0] |
| 6 Cervix unfavourable/unchanged after 12 to 24 hours Show forest plot | 5 | 467 | Risk Ratio (M‐H, Fixed, 95% CI) | 0.46 [0.35, 0.62] |
| Analysis 1.6  Comparison 1 (1.1) PGE2 (all regimens) vs placebo/no treatment (all women), Outcome 6 Cervix unfavourable/unchanged after 12 to 24 hours. | ||||
| 6.1 PGE2 (once only) vs placebo/no treatment | 3 | 232 | Risk Ratio (M‐H, Fixed, 95% CI) | 0.55 [0.40, 0.75] |
| 6.2 PGE2 (repeated doses) vs placebo/no treatment | 2 | 235 | Risk Ratio (M‐H, Fixed, 95% CI) | 0.34 [0.19, 0.61] |
| 7 Oxytocin augmentation Show forest plot | 11 | 1265 | Risk Ratio (M‐H, Fixed, 95% CI) | 0.80 [0.69, 0.91] |
| Analysis 1.7  Comparison 1 (1.1) PGE2 (all regimens) vs placebo/no treatment (all women), Outcome 7 Oxytocin augmentation. | ||||
| 7.1 PGE2 (once only) vs placebo/no treatment | 6 | 489 | Risk Ratio (M‐H, Fixed, 95% CI) | 0.83 [0.67, 1.05] |
| 7.2 PGE2 (repeated doses) vs placebo/no treatment | 4 | 695 | Risk Ratio (M‐H, Fixed, 95% CI) | 0.85 [0.71, 1.02] |
| 7.3 PGE2 (sustained release) vs placebo/no treatment | 1 | 81 | Risk Ratio (M‐H, Fixed, 95% CI) | 0.36 [0.20, 0.64] |
| 8 Uterine hyperstimulation without FHR changes Show forest plot | 12 | 3580 | Risk Ratio (M‐H, Fixed, 95% CI) | 2.48 [1.17, 5.26] |
| Analysis 1.8  Comparison 1 (1.1) PGE2 (all regimens) vs placebo/no treatment (all women), Outcome 8 Uterine hyperstimulation without FHR changes. | ||||
| 8.1 PGE2 (once only) vs placebo/no treatment | 5 | 387 | Risk Ratio (M‐H, Fixed, 95% CI) | 1.26 [0.33, 4.84] |
| 8.2 PGE2 (repeated doses) vs placebo/no treatment | 5 | 2953 | Risk Ratio (M‐H, Fixed, 95% CI) | 2.34 [0.78, 7.03] |
| 8.3 PGE2 (sustained release) vs placebo/no treatment | 2 | 240 | Risk Ratio (M‐H, Fixed, 95% CI) | 7.85 [1.05, 58.82] |
| 9 Uterine rupture Show forest plot | 2 | 2579 | Risk Ratio (M‐H, Fixed, 95% CI) | 2.90 [0.12, 68.50] |
| Analysis 1.9  Comparison 1 (1.1) PGE2 (all regimens) vs placebo/no treatment (all women), Outcome 9 Uterine rupture. | ||||
| 9.1 PGE2 (once only) vs placebo/no treatment | 1 | 59 | Risk Ratio (M‐H, Fixed, 95% CI) | 2.90 [0.12, 68.50] |
| 9.2 PGE2 (repeated doses) vs placebo/no treatment | 1 | 2520 | Risk Ratio (M‐H, Fixed, 95% CI) | 0.0 [0.0, 0.0] |
| 10 Epidural analgesia Show forest plot | 7 | 3555 | Risk Ratio (M‐H, Fixed, 95% CI) | 1.09 [1.01, 1.16] |
| Analysis 1.10  Comparison 1 (1.1) PGE2 (all regimens) vs placebo/no treatment (all women), Outcome 10 Epidural analgesia. | ||||
| 10.1 PGE2 (once only) vs placebo/no treatment | 2 | 434 | Risk Ratio (M‐H, Fixed, 95% CI) | 0.98 [0.76, 1.25] |
| 10.2 PGE2 (repeated doses) vs placebo/no treatment | 4 | 3040 | Risk Ratio (M‐H, Fixed, 95% CI) | 1.10 [1.02, 1.18] |
| 10.3 PGE2 (sustained release) vs placebo/no treatment | 1 | 81 | Risk Ratio (M‐H, Fixed, 95% CI) | 1.18 [0.83, 1.68] |
| 11 Instrumental vaginal delivery Show forest plot | 13 | 4219 | Risk Ratio (M‐H, Fixed, 95% CI) | 0.95 [0.82, 1.10] |
| Analysis 1.11  Comparison 1 (1.1) PGE2 (all regimens) vs placebo/no treatment (all women), Outcome 11 Instrumental vaginal delivery. | ||||
| 11.1 PGE2 (once only) vs placebo/no treatment | 6 | 721 | Risk Ratio (M‐H, Fixed, 95% CI) | 0.84 [0.55, 1.28] |
| 11.2 PGE2 (repeated doses) vs placebo/no treatment | 5 | 3348 | Risk Ratio (M‐H, Fixed, 95% CI) | 0.97 [0.83, 1.13] |
| 11.3 PGE2 (sustained release) vs placebo/no treatment | 2 | 150 | Risk Ratio (M‐H, Fixed, 95% CI) | 1.01 [0.55, 1.86] |
| 12 Meconium stained liquor Show forest plot | 11 | 4145 | Risk Ratio (M‐H, Fixed, 95% CI) | 0.82 [0.68, 0.98] |
| Analysis 1.12  Comparison 1 (1.1) PGE2 (all regimens) vs placebo/no treatment (all women), Outcome 12 Meconium stained liquor. | ||||
| 12.1 PGE2 (once only) vs placebo/no treatment | 5 | 704 | Risk Ratio (M‐H, Fixed, 95% CI) | 0.95 [0.65, 1.40] |
| 12.2 PGE2 (repeated doses) vs placebo/no treatment | 6 | 3441 | Risk Ratio (M‐H, Fixed, 95% CI) | 0.78 [0.64, 0.97] |
| 13 Apgar score <7 at 5 minutes Show forest plot | 15 | 4381 | Risk Ratio (M‐H, Fixed, 95% CI) | 1.30 [0.86, 1.96] |
| Analysis 1.13  Comparison 1 (1.1) PGE2 (all regimens) vs placebo/no treatment (all women), Outcome 13 Apgar score <7 at 5 minutes. | ||||
| 13.1 PGE2 (once only) vs placebo/no treatment | 9 | 1046 | Risk Ratio (M‐H, Fixed, 95% CI) | 0.56 [0.24, 1.30] |
| 13.2 PGE2 (repeated doses) vs placebo/no treatment | 5 | 3120 | Risk Ratio (M‐H, Fixed, 95% CI) | 1.38 [0.80, 2.37] |
| 13.3 PGE2 (sustained release) vs placebo/no treatment | 1 | 215 | Risk Ratio (M‐H, Fixed, 95% CI) | 6.21 [1.41, 27.34] |
| 14 Neonatal intensive care unit admission Show forest plot | 11 | 3922 | Risk Ratio (M‐H, Fixed, 95% CI) | 0.95 [0.78, 1.15] |
| Analysis 1.14  Comparison 1 (1.1) PGE2 (all regimens) vs placebo/no treatment (all women), Outcome 14 Neonatal intensive care unit admission. | ||||
| 14.1 PGE2 (once only) vs placebo/no treatment | 4 | 681 | Risk Ratio (M‐H, Fixed, 95% CI) | 1.23 [0.70, 2.15] |
| 14.2 PGE2 (repeated doses) vs placebo/no treatment | 6 | 3172 | Risk Ratio (M‐H, Fixed, 95% CI) | 0.90 [0.73, 1.11] |
| 14.3 PGE2 (sustained release) vs placebo/no treatment | 1 | 69 | Risk Ratio (M‐H, Fixed, 95% CI) | 3.27 [0.36, 29.93] |
| 16 Perinatal death Show forest plot | 7 | 3648 | Risk Ratio (M‐H, Fixed, 95% CI) | 0.56 [0.14, 2.22] |
| Analysis 1.16  Comparison 1 (1.1) PGE2 (all regimens) vs placebo/no treatment (all women), Outcome 16 Perinatal death. | ||||
| 16.1 PGE2 (once only) vs placebo/no treatment | 2 | 431 | Risk Ratio (M‐H, Fixed, 95% CI) | 1.06 [0.07, 16.85] |
| 16.2 PGE2 (repeated doses) vs placebo/no treatment | 4 | 3148 | Risk Ratio (M‐H, Fixed, 95% CI) | 0.46 [0.09, 2.31] |
| 16.3 PGE2 (sustained release) vs placebo/no treatment | 1 | 69 | Risk Ratio (M‐H, Fixed, 95% CI) | 0.0 [0.0, 0.0] |
| 18 Maternal side‐effects (all) Show forest plot | 12 | 6780 | Risk Ratio (M‐H, Fixed, 95% CI) | 1.15 [0.80, 1.67] |
| Analysis 1.18  Comparison 1 (1.1) PGE2 (all regimens) vs placebo/no treatment (all women), Outcome 18 Maternal side‐effects (all). | ||||
| 18.1 PGE2 (once only) vs placebo/no treatment | 6 | 577 | Risk Ratio (M‐H, Fixed, 95% CI) | 1.95 [1.02, 3.74] |
| 18.2 PGE2 (repeated doses) vs placebo/no treatment | 5 | 5558 | Risk Ratio (M‐H, Fixed, 95% CI) | 0.84 [0.53, 1.34] |
| 18.3 PGE2 (sustained release) vs placebo/no treatment | 1 | 645 | Risk Ratio (M‐H, Fixed, 95% CI) | 0.0 [0.0, 0.0] |
| 19 Nausea (maternal) Show forest plot | 1 | 84 | Risk Ratio (M‐H, Fixed, 95% CI) | 0.0 [0.0, 0.0] |
| Analysis 1.19  Comparison 1 (1.1) PGE2 (all regimens) vs placebo/no treatment (all women), Outcome 19 Nausea (maternal). | ||||
| 19.2 PGE2 (repeated doses) vs placebo/no treatment | 1 | 84 | Risk Ratio (M‐H, Fixed, 95% CI) | 0.0 [0.0, 0.0] |
| 20 Vomitting (maternal) Show forest plot | 3 | 2794 | Risk Ratio (M‐H, Fixed, 95% CI) | 1.16 [0.39, 3.39] |
| Analysis 1.20  Comparison 1 (1.1) PGE2 (all regimens) vs placebo/no treatment (all women), Outcome 20 Vomitting (maternal). | ||||
| 20.1 PGE2 (once only) vs placebo/no treatment | 1 | 59 | Risk Ratio (M‐H, Fixed, 95% CI) | 0.97 [0.15, 6.41] |
| 20.2 PGE2 (repeated doses) vs placebo/no treatment | 1 | 2520 | Risk Ratio (M‐H, Fixed, 95% CI) | 1.25 [0.34, 4.65] |
| 20.3 PGE2 (sustained release) vs placebo/no treatment | 1 | 215 | Risk Ratio (M‐H, Fixed, 95% CI) | 0.0 [0.0, 0.0] |
| 21 Diarrhoea (maternal) Show forest plot | 3 | 2819 | Risk Ratio (M‐H, Fixed, 95% CI) | 7.01 [0.36, 135.59] |
| Analysis 1.21  Comparison 1 (1.1) PGE2 (all regimens) vs placebo/no treatment (all women), Outcome 21 Diarrhoea (maternal). | ||||
| 21.2 PGE2 (repeated doses) vs placebo/no treatment | 2 | 2604 | Risk Ratio (M‐H, Fixed, 95% CI) | 7.01 [0.36, 135.59] |
| 21.3 PGE2 (sustained release) vs placebo/no treatment | 1 | 215 | Risk Ratio (M‐H, Fixed, 95% CI) | 0.0 [0.0, 0.0] |
| 22 Other maternal side effects Show forest plot | 7 | 871 | Risk Ratio (M‐H, Fixed, 95% CI) | 0.97 [0.62, 1.51] |
| Analysis 1.22  Comparison 1 (1.1) PGE2 (all regimens) vs placebo/no treatment (all women), Outcome 22 Other maternal side effects. | ||||
| 22.1 PGE2 (once only) vs placebo/no treatment | 4 | 356 | Risk Ratio (M‐H, Fixed, 95% CI) | 2.78 [0.97, 8.02] |
| 22.2 PGE2 (repeated doses) vs placebo/no treatment | 2 | 300 | Risk Ratio (M‐H, Fixed, 95% CI) | 0.69 [0.42, 1.15] |
| 22.3 PGE2 (sustained release) vs placebo/no treatment | 1 | 215 | Risk Ratio (M‐H, Fixed, 95% CI) | 0.0 [0.0, 0.0] |
| 23 Postpartum haemorrhage Show forest plot | 8 | 3437 | Risk Ratio (M‐H, Fixed, 95% CI) | 1.44 [1.01, 2.05] |
| Analysis 1.23  Comparison 1 (1.1) PGE2 (all regimens) vs placebo/no treatment (all women), Outcome 23 Postpartum haemorrhage. | ||||
| 23.1 PGE2 (once only) vs placebo/no treatment | 4 | 282 | Risk Ratio (M‐H, Fixed, 95% CI) | 1.14 [0.33, 3.97] |
| 23.2 PGE2 (repeated doses) vs placebo/no treatment | 3 | 2940 | Risk Ratio (M‐H, Fixed, 95% CI) | 1.42 [0.98, 2.07] |
| 23.3 PGE2 (sustained release) vs placebo/no treatment | 1 | 215 | Risk Ratio (M‐H, Fixed, 95% CI) | 5.64 [0.27, 116.05] |
| 24 Serious maternal complication Show forest plot | 1 | 59 | Risk Ratio (M‐H, Fixed, 95% CI) | 2.90 [0.12, 68.50] |
| Analysis 1.24  Comparison 1 (1.1) PGE2 (all regimens) vs placebo/no treatment (all women), Outcome 24 Serious maternal complication. | ||||
| 24.1 PGE2 (once only) vs placebo/no treatment | 1 | 59 | Risk Ratio (M‐H, Fixed, 95% CI) | 2.90 [0.12, 68.50] |
| 26 Woman not satisfied Show forest plot | 2 | 2922 | Risk Ratio (M‐H, Fixed, 95% CI) | 0.56 [0.44, 0.71] |
| Analysis 1.26  Comparison 1 (1.1) PGE2 (all regimens) vs placebo/no treatment (all women), Outcome 26 Woman not satisfied. | ||||
| 26.1 PGE2 (once only) vs placebo/no treatment | 1 | 402 | Risk Ratio (M‐H, Fixed, 95% CI) | 1.40 [0.83, 2.35] |
| 26.2 PGE2 (repeated doses) vs placebo/no treatment | 1 | 2520 | Risk Ratio (M‐H, Fixed, 95% CI) | 0.44 [0.33, 0.58] |
| Outcome or subgroup title | No. of studies | No. of participants | Statistical method | Effect size |
| 1 Vaginal delivery not achieved within 24 hours Show forest plot | 1 | 39 | Risk Ratio (M‐H, Fixed, 95% CI) | 0.88 [0.67, 1.15] |
| Analysis 2.1  Comparison 2 (1.2) PGE2 (all regimens) vs placebo/no treatment (all women, unfavourable cervix), Outcome 1 Vaginal delivery not achieved within 24 hours. | ||||
| 1.1 PGE2 (once only) vs placebo/no treatment | 1 | 39 | Risk Ratio (M‐H, Fixed, 95% CI) | 0.88 [0.67, 1.15] |
| 2 Uterine hyperstimulation with FHR changes Show forest plot | 12 | 1143 | Risk Ratio (M‐H, Fixed, 95% CI) | 4.47 [2.01, 9.93] |
| Analysis 2.2  Comparison 2 (1.2) PGE2 (all regimens) vs placebo/no treatment (all women, unfavourable cervix), Outcome 2 Uterine hyperstimulation with FHR changes. | ||||
| 2.1 PGE2 (once only) vs placebo/no treatment | 5 | 399 | Risk Ratio (M‐H, Fixed, 95% CI) | 1.44 [0.44, 4.65] |
| 2.2 PGE2 (repeated doses) vs placebo/no treatment | 3 | 208 | Risk Ratio (M‐H, Fixed, 95% CI) | 5.34 [0.27, 106.70] |
| 2.3 PGE2 (sustained release) vs placebo/no treatment | 4 | 536 | Risk Ratio (M‐H, Fixed, 95% CI) | 10.87 [2.69, 43.92] |
| 3 Caesarean section Show forest plot | 22 | 2173 | Risk Ratio (M‐H, Fixed, 95% CI) | 0.87 [0.75, 1.02] |
| Analysis 2.3  Comparison 2 (1.2) PGE2 (all regimens) vs placebo/no treatment (all women, unfavourable cervix), Outcome 3 Caesarean section. | ||||
| 3.1 PGE2 (once only) vs placebo/no treatment | 11 | 828 | Risk Ratio (M‐H, Fixed, 95% CI) | 0.92 [0.73, 1.17] |
| 3.2 PGE2 (repeated doses) vs placebo/no treatment | 7 | 774 | Risk Ratio (M‐H, Fixed, 95% CI) | 0.84 [0.61, 1.15] |
| 3.3 PGE2 (sustained release) vs placebo/no treatment | 4 | 571 | Risk Ratio (M‐H, Fixed, 95% CI) | 0.84 [0.64, 1.10] |
| 4 Serious neonatal morbidity or perinatal death Show forest plot | 4 | 533 | Risk Ratio (M‐H, Fixed, 95% CI) | 0.0 [0.0, 0.0] |
| Analysis 2.4  Comparison 2 (1.2) PGE2 (all regimens) vs placebo/no treatment (all women, unfavourable cervix), Outcome 4 Serious neonatal morbidity or perinatal death. | ||||
| 4.1 PGE2 (once only) vs placebo/no treatment | 1 | 29 | Risk Ratio (M‐H, Fixed, 95% CI) | 0.0 [0.0, 0.0] |
| 4.2 PGE2 (repeated doses) vs placebo/no treatment | 1 | 220 | Risk Ratio (M‐H, Fixed, 95% CI) | 0.0 [0.0, 0.0] |
| 4.3 PGE2 (sustained release) vs placebo/no treatment | 2 | 284 | Risk Ratio (M‐H, Fixed, 95% CI) | 0.0 [0.0, 0.0] |
| 5 Serious maternal morbidity or death Show forest plot | 2 | 128 | Risk Ratio (M‐H, Fixed, 95% CI) | 4.84 [0.24, 96.66] |
| Analysis 2.5  Comparison 2 (1.2) PGE2 (all regimens) vs placebo/no treatment (all women, unfavourable cervix), Outcome 5 Serious maternal morbidity or death. | ||||
| 5.1 PGE2 (once only) vs placebo | 1 | 59 | Risk Ratio (M‐H, Fixed, 95% CI) | 4.84 [0.24, 96.66] |
| 5.3 PGE2 (sustained release) vs placebo/no treatment | 1 | 69 | Risk Ratio (M‐H, Fixed, 95% CI) | 0.0 [0.0, 0.0] |
| 6 Cervix unfavourable/unchanged after 12 to 24 hours Show forest plot | 2 | 172 | Risk Ratio (M‐H, Fixed, 95% CI) | 0.53 [0.35, 0.79] |
| Analysis 2.6  Comparison 2 (1.2) PGE2 (all regimens) vs placebo/no treatment (all women, unfavourable cervix), Outcome 6 Cervix unfavourable/unchanged after 12 to 24 hours. | ||||
| 6.1 PGE2 (once only) vs placebo/no treatment | 2 | 172 | Risk Ratio (M‐H, Fixed, 95% CI) | 0.53 [0.35, 0.79] |
| 7 Oxytocin augmentation Show forest plot | 8 | 813 | Risk Ratio (M‐H, Fixed, 95% CI) | 0.72 [0.61, 0.85] |
| Analysis 2.7  Comparison 2 (1.2) PGE2 (all regimens) vs placebo/no treatment (all women, unfavourable cervix), Outcome 7 Oxytocin augmentation. | ||||
| 7.1 PGE2 (once only) vs placebo/no treatment | 4 | 382 | Risk Ratio (M‐H, Fixed, 95% CI) | 0.87 [0.67, 1.13] |
| 7.2 PGE2 (repeated doses) vs placebo/no treatment | 3 | 350 | Risk Ratio (M‐H, Fixed, 95% CI) | 0.70 [0.55, 0.89] |
| 7.3 PGE2 (sustained release) vs placebo/no treatment | 1 | 81 | Risk Ratio (M‐H, Fixed, 95% CI) | 0.36 [0.20, 0.64] |
| 8 Uterine hyperstimulation without FHR changes Show forest plot | 9 | 777 | Risk Ratio (M‐H, Fixed, 95% CI) | 2.63 [0.99, 7.01] |
| Analysis 2.8  Comparison 2 (1.2) PGE2 (all regimens) vs placebo/no treatment (all women, unfavourable cervix), Outcome 8 Uterine hyperstimulation without FHR changes. | ||||
| 8.1 PGE2 (once only) vs placebo/no treatment | 5 | 387 | Risk Ratio (M‐H, Fixed, 95% CI) | 1.26 [0.33, 4.84] |
| 8.2 PGE2 (repeated doses) vs placebo/no treatment | 2 | 150 | Risk Ratio (M‐H, Fixed, 95% CI) | 3.0 [0.13, 71.92] |
| 8.3 PGE2 (sustained release) vs placebo/no treatment | 2 | 240 | Risk Ratio (M‐H, Fixed, 95% CI) | 7.85 [1.05, 58.82] |
| 9 Uterine rupture Show forest plot | 1 | 59 | Risk Ratio (M‐H, Fixed, 95% CI) | 2.90 [0.12, 68.50] |
| Analysis 2.9  Comparison 2 (1.2) PGE2 (all regimens) vs placebo/no treatment (all women, unfavourable cervix), Outcome 9 Uterine rupture. | ||||
| 9.1 PGE2 (once only) vs placebo/no treatment | 1 | 59 | Risk Ratio (M‐H, Fixed, 95% CI) | 2.90 [0.12, 68.50] |
| 10 Epidural analgesia Show forest plot | 5 | 633 | Risk Ratio (M‐H, Fixed, 95% CI) | 1.46 [1.22, 1.75] |
| Analysis 2.10  Comparison 2 (1.2) PGE2 (all regimens) vs placebo/no treatment (all women, unfavourable cervix), Outcome 10 Epidural analgesia. | ||||
| 10.1 PGE2 (once only) vs placebo/no treatment | 1 | 32 | Risk Ratio (M‐H, Fixed, 95% CI) | 0.54 [0.29, 0.98] |
| 10.2 PGE2 (repeated doses) vs placebo/no treatment | 3 | 520 | Risk Ratio (M‐H, Fixed, 95% CI) | 1.69 [1.36, 2.10] |
| 10.3 PGE2 (sustained release) vs placebo/no treatment | 1 | 81 | Risk Ratio (M‐H, Fixed, 95% CI) | 1.18 [0.83, 1.68] |
| 11 Instrumental vaginal delivery Show forest plot | 7 | 643 | Risk Ratio (M‐H, Fixed, 95% CI) | 0.88 [0.61, 1.27] |
| Analysis 2.11  Comparison 2 (1.2) PGE2 (all regimens) vs placebo/no treatment (all women, unfavourable cervix), Outcome 11 Instrumental vaginal delivery. | ||||
| 11.1 PGE2 (once only) vs placebo/no treatment | 4 | 293 | Risk Ratio (M‐H, Fixed, 95% CI) | 0.87 [0.45, 1.69] |
| 11.2 PGE2 (repeated doses) vs placebo/no treatment | 1 | 200 | Risk Ratio (M‐H, Fixed, 95% CI) | 0.79 [0.43, 1.46] |
| 11.3 PGE2 (sustained release) vs placebo/no treatment | 2 | 150 | Risk Ratio (M‐H, Fixed, 95% CI) | 1.01 [0.55, 1.86] |
| 12 Meconium stained liquor Show forest plot | 5 | 697 | Risk Ratio (M‐H, Fixed, 95% CI) | 0.65 [0.47, 0.89] |
| Analysis 2.12  Comparison 2 (1.2) PGE2 (all regimens) vs placebo/no treatment (all women, unfavourable cervix), Outcome 12 Meconium stained liquor. | ||||
| 12.1 PGE2 (once only) vs placebo/no treatment | 2 | 177 | Risk Ratio (M‐H, Fixed, 95% CI) | 0.90 [0.51, 1.57] |
| 12.2 PGE2 (repeated doses) vs placebo/no treatment | 3 | 520 | Risk Ratio (M‐H, Fixed, 95% CI) | 0.55 [0.37, 0.81] |
| 13 Apgar score <7 at 5 minutes Show forest plot | 11 | 1194 | Risk Ratio (M‐H, Fixed, 95% CI) | 1.08 [0.59, 1.99] |
| Analysis 2.13  Comparison 2 (1.2) PGE2 (all regimens) vs placebo/no treatment (all women, unfavourable cervix), Outcome 13 Apgar score <7 at 5 minutes. | ||||
| 13.1 PGE2 (once only) vs placebo/no treatment | 7 | 579 | Risk Ratio (M‐H, Fixed, 95% CI) | 0.48 [0.17, 1.36] |
| 13.2 PGE2 (repeated doses) vs placebo/no treatment | 3 | 400 | Risk Ratio (M‐H, Fixed, 95% CI) | 0.55 [0.15, 1.98] |
| 13.3 PGE2 (sustained release) vs placebo/no treatment | 1 | 215 | Risk Ratio (M‐H, Fixed, 95% CI) | 6.21 [1.41, 27.34] |
| 14 Neonatal intensive care unit admission Show forest plot | 7 | 735 | Risk Ratio (M‐H, Fixed, 95% CI) | 0.80 [0.51, 1.27] |
| Analysis 2.14  Comparison 2 (1.2) PGE2 (all regimens) vs placebo/no treatment (all women, unfavourable cervix), Outcome 14 Neonatal intensive care unit admission. | ||||
| 14.1 PGE2 (once only) vs placebo/no treatment | 2 | 214 | Risk Ratio (M‐H, Fixed, 95% CI) | 0.96 [0.51, 1.82] |
| 14.2 PGE2 (repeated doses) vs placebo/no treatment | 4 | 452 | Risk Ratio (M‐H, Fixed, 95% CI) | 0.55 [0.27, 1.14] |
| 14.3 PGE2 (sustained release) vs placebo/no treatment | 1 | 69 | Risk Ratio (M‐H, Fixed, 95% CI) | 3.27 [0.36, 29.93] |
| 16 Perinatal death Show forest plot | 3 | 298 | Risk Ratio (M‐H, Fixed, 95% CI) | 0.0 [0.0, 0.0] |
| Analysis 2.16  Comparison 2 (1.2) PGE2 (all regimens) vs placebo/no treatment (all women, unfavourable cervix), Outcome 16 Perinatal death. | ||||
| 16.1 PGE2 (once only) vs placebo/no treatment | 1 | 29 | Risk Ratio (M‐H, Fixed, 95% CI) | 0.0 [0.0, 0.0] |
| 16.2 PGE2 (repeated doses) vs placebo/no treatment | 1 | 200 | Risk Ratio (M‐H, Fixed, 95% CI) | 0.0 [0.0, 0.0] |
| 16.3 PGE2 (sustained release) vs placebo/no treatment | 1 | 69 | Risk Ratio (M‐H, Fixed, 95% CI) | 0.0 [0.0, 0.0] |
| 18 Maternal side‐effects (all) Show forest plot | 10 | 1572 | Risk Ratio (M‐H, Fixed, 95% CI) | 1.08 [0.73, 1.59] |
| Analysis 2.18  Comparison 2 (1.2) PGE2 (all regimens) vs placebo/no treatment (all women, unfavourable cervix), Outcome 18 Maternal side‐effects (all). | ||||
| 18.1 PGE2 (once only) vs placebo/no treatment | 6 | 577 | Risk Ratio (M‐H, Fixed, 95% CI) | 1.95 [1.02, 3.74] |
| 18.2 PGE2 (repeated doses) vs placebo/no treatment | 3 | 350 | Risk Ratio (M‐H, Fixed, 95% CI) | 0.69 [0.42, 1.15] |
| 18.3 PGE2 (sustained release) vs placebo/no treatment | 1 | 645 | Risk Ratio (M‐H, Fixed, 95% CI) | 0.0 [0.0, 0.0] |
| 19 Nausea (maternal) Show forest plot | 1 | 116 | Risk Ratio (M‐H, Fixed, 95% CI) | 0.0 [0.0, 0.0] |
| Analysis 2.19  Comparison 2 (1.2) PGE2 (all regimens) vs placebo/no treatment (all women, unfavourable cervix), Outcome 19 Nausea (maternal). | ||||
| 19.2 PGE2 (repeated doses) vs placebo/no treatment | 1 | 116 | Risk Ratio (M‐H, Fixed, 95% CI) | 0.0 [0.0, 0.0] |
| 20 Vomitting (maternal) Show forest plot | 2 | 274 | Risk Ratio (M‐H, Fixed, 95% CI) | 0.97 [0.15, 6.41] |
| Analysis 2.20  Comparison 2 (1.2) PGE2 (all regimens) vs placebo/no treatment (all women, unfavourable cervix), Outcome 20 Vomitting (maternal). | ||||
| 20.1 PGE2 (once only) vs placebo/no treatment | 1 | 59 | Risk Ratio (M‐H, Fixed, 95% CI) | 0.97 [0.15, 6.41] |
| 20.3 PGE2 (sustained release) vs placebo/no treatment | 1 | 215 | Risk Ratio (M‐H, Fixed, 95% CI) | 0.0 [0.0, 0.0] |
| 21 Diarrhoea (maternal) Show forest plot | 2 | 331 | Risk Ratio (M‐H, Fixed, 95% CI) | 0.0 [0.0, 0.0] |
| Analysis 2.21  Comparison 2 (1.2) PGE2 (all regimens) vs placebo/no treatment (all women, unfavourable cervix), Outcome 21 Diarrhoea (maternal). | ||||
| 21.2 PGE2 (repeated doses) vs placebo/no treatment | 1 | 116 | Risk Ratio (M‐H, Fixed, 95% CI) | 0.0 [0.0, 0.0] |
| 21.3 PGE2 (sustained release) vs placebo/no treatment | 1 | 215 | Risk Ratio (M‐H, Fixed, 95% CI) | 0.0 [0.0, 0.0] |
| 22 Other maternal side effects Show forest plot | 7 | 871 | Risk Ratio (M‐H, Fixed, 95% CI) | 0.97 [0.62, 1.51] |
| Analysis 2.22  Comparison 2 (1.2) PGE2 (all regimens) vs placebo/no treatment (all women, unfavourable cervix), Outcome 22 Other maternal side effects. | ||||
| 22.1 PGE2 (once only) vs placebo/no treatment | 4 | 356 | Risk Ratio (M‐H, Fixed, 95% CI) | 2.78 [0.97, 8.02] |
| 22.2 PGE2 (repeated doses) vs placebo/no treatment | 2 | 300 | Risk Ratio (M‐H, Fixed, 95% CI) | 0.69 [0.42, 1.15] |
| 22.3 PGE2 (sustained release) vs placebo/no treatment | 1 | 215 | Risk Ratio (M‐H, Fixed, 95% CI) | 0.0 [0.0, 0.0] |
| 23 Postpartum haemorrhage Show forest plot | 7 | 917 | Risk Ratio (M‐H, Fixed, 95% CI) | 0.99 [0.47, 2.05] |
| Analysis 2.23  Comparison 2 (1.2) PGE2 (all regimens) vs placebo/no treatment (all women, unfavourable cervix), Outcome 23 Postpartum haemorrhage. | ||||
| 23.1 PGE2 (once only) vs placebo/no treatment | 4 | 282 | Risk Ratio (M‐H, Fixed, 95% CI) | 1.14 [0.33, 3.97] |
| 23.2 PGE2 (repeated doses) vs placebo/no treatment | 2 | 420 | Risk Ratio (M‐H, Fixed, 95% CI) | 0.67 [0.24, 1.84] |
| 23.3 PGE2 (sustained release) vs placebo/no treatment | 1 | 215 | Risk Ratio (M‐H, Fixed, 95% CI) | 5.64 [0.27, 116.05] |
| 24 Serious maternal complication Show forest plot | 1 | 59 | Risk Ratio (M‐H, Fixed, 95% CI) | 2.90 [0.12, 68.50] |
| Analysis 2.24  Comparison 2 (1.2) PGE2 (all regimens) vs placebo/no treatment (all women, unfavourable cervix), Outcome 24 Serious maternal complication. | ||||
| 24.1 PGE2 (once only) vs placebo/no treatment | 1 | 59 | Risk Ratio (M‐H, Fixed, 95% CI) | 2.90 [0.12, 68.50] |
| Outcome or subgroup title | No. of studies | No. of participants | Statistical method | Effect size |
| 1 Vaginal delivery not achieved within 24 hours Show forest plot | 1 | 345 | Risk Ratio (M‐H, Fixed, 95% CI) | 0.12 [0.08, 0.18] |
| Analysis 3.1  Comparison 3 (1.3) PGE2 (all regimens) vs placebo/no treatment (all women, favourable cervix), Outcome 1 Vaginal delivery not achieved within 24 hours. | ||||
| 1.2 PGE2 (repeated doses) vs placebo/no treatment | 1 | 345 | Risk Ratio (M‐H, Fixed, 95% CI) | 0.12 [0.08, 0.18] |
| 3 Caesarean section Show forest plot | 1 | 345 | Risk Ratio (M‐H, Fixed, 95% CI) | 0.61 [0.10, 3.61] |
| Analysis 3.3  Comparison 3 (1.3) PGE2 (all regimens) vs placebo/no treatment (all women, favourable cervix), Outcome 3 Caesarean section. | ||||
| 3.2 PGE2 (repeated doses) vs placebo/no treatment | 1 | 345 | Risk Ratio (M‐H, Fixed, 95% CI) | 0.61 [0.10, 3.61] |
| 4 Serious neonatal morbidity or perinatal death Show forest plot | 1 | 345 | Risk Ratio (M‐H, Fixed, 95% CI) | 0.31 [0.01, 7.45] |
| Analysis 3.4  Comparison 3 (1.3) PGE2 (all regimens) vs placebo/no treatment (all women, favourable cervix), Outcome 4 Serious neonatal morbidity or perinatal death. | ||||
| 4.2 PGE2 (repeated doses) vs placebo/no treatment | 1 | 345 | Risk Ratio (M‐H, Fixed, 95% CI) | 0.31 [0.01, 7.45] |
| 7 Oxytocin augmentation Show forest plot | 2 | 387 | Risk Ratio (M‐H, Fixed, 95% CI) | 0.97 [0.74, 1.26] |
| Analysis 3.7  Comparison 3 (1.3) PGE2 (all regimens) vs placebo/no treatment (all women, favourable cervix), Outcome 7 Oxytocin augmentation. | ||||
| 7.1 PGE2 (once only) vs placebo/no treatment | 1 | 42 | Risk Ratio (M‐H, Fixed, 95% CI) | 0.42 [0.18, 0.97] |
| 7.2 PGE2 (repeated doses) vs placebo/no treatment | 1 | 345 | Risk Ratio (M‐H, Fixed, 95% CI) | 1.07 [0.81, 1.42] |
| 11 Instrumental vaginal delivery Show forest plot | 1 | 345 | Risk Ratio (M‐H, Fixed, 95% CI) | 1.22 [0.28, 5.38] |
| Analysis 3.11  Comparison 3 (1.3) PGE2 (all regimens) vs placebo/no treatment (all women, favourable cervix), Outcome 11 Instrumental vaginal delivery. | ||||
| 11.2 PGE2 (repeated doses) vs placebo/no treatment | 1 | 345 | Risk Ratio (M‐H, Fixed, 95% CI) | 1.22 [0.28, 5.38] |
| 16 Perinatal death Show forest plot | 1 | 345 | Risk Ratio (M‐H, Fixed, 95% CI) | 0.31 [0.01, 7.45] |
| Analysis 3.16  Comparison 3 (1.3) PGE2 (all regimens) vs placebo/no treatment (all women, favourable cervix), Outcome 16 Perinatal death. | ||||
| 16.2 PGE2 (repeated doses) vs placebo/no treatment | 1 | 345 | Risk Ratio (M‐H, Fixed, 95% CI) | 0.31 [0.01, 7.45] |
| Outcome or subgroup title | No. of studies | No. of participants | Statistical method | Effect size |
| 2 Uterine hyperstimulation with FHR changes Show forest plot | 5 | 425 | Risk Ratio (M‐H, Fixed, 95% CI) | 2.16 [0.57, 8.21] |
| Analysis 4.2  Comparison 4 (1.5) PGE2 (all regimens) vs placebo/no treatment (all women, intact membranes, unfavourable cervix), Outcome 2 Uterine hyperstimulation with FHR changes. | ||||
| 2.1 PGE2 (once only) vs placebo/no treatment | 2 | 135 | Risk Ratio (M‐H, Fixed, 95% CI) | 0.95 [0.14, 6.69] |
| 2.2 PGE2 (repeated doses) vs placebo/no treatment | 1 | 50 | Risk Ratio (M‐H, Fixed, 95% CI) | 0.0 [0.0, 0.0] |
| 2.3 PGE2 (sustained release) vs placebo/no treatment | 2 | 240 | Risk Ratio (M‐H, Fixed, 95% CI) | 4.44 [0.55, 35.61] |
| 3 Caesarean section Show forest plot | 5 | 471 | Risk Ratio (M‐H, Fixed, 95% CI) | 1.17 [0.84, 1.63] |
| Analysis 4.3  Comparison 4 (1.5) PGE2 (all regimens) vs placebo/no treatment (all women, intact membranes, unfavourable cervix), Outcome 3 Caesarean section. | ||||
| 3.1 PGE2 (once only) vs placebo/no treatment | 3 | 215 | Risk Ratio (M‐H, Fixed, 95% CI) | 1.28 [0.77, 2.11] |
| 3.2 PGE2 (repeated doses) vs placebo/no treatment | 1 | 50 | Risk Ratio (M‐H, Fixed, 95% CI) | 1.63 [0.52, 5.07] |
| 3.3 PGE2 (sustained release) vs placebo/no treatment | 1 | 206 | Risk Ratio (M‐H, Fixed, 95% CI) | 1.02 [0.63, 1.65] |
| 6 Cervix unfavourable/unchanged after 12 to 24 hours Show forest plot | 1 | 54 | Risk Ratio (M‐H, Fixed, 95% CI) | 0.40 [0.24, 0.68] |
| Analysis 4.6  Comparison 4 (1.5) PGE2 (all regimens) vs placebo/no treatment (all women, intact membranes, unfavourable cervix), Outcome 6 Cervix unfavourable/unchanged after 12 to 24 hours. | ||||
| 6.1 PGE2 (once only) vs placebo/no treatment | 1 | 54 | Risk Ratio (M‐H, Fixed, 95% CI) | 0.40 [0.24, 0.68] |
| 7 Oxytocin augmentation Show forest plot | 1 | 50 | Risk Ratio (M‐H, Fixed, 95% CI) | 1.01 [0.60, 1.68] |
| Analysis 4.7  Comparison 4 (1.5) PGE2 (all regimens) vs placebo/no treatment (all women, intact membranes, unfavourable cervix), Outcome 7 Oxytocin augmentation. | ||||
| 7.2 PGE2 (repeated doses) vs placebo/no treatment | 1 | 50 | Risk Ratio (M‐H, Fixed, 95% CI) | 1.01 [0.60, 1.68] |
| 8 Uterine hyperstimulation without FHR changes Show forest plot | 5 | 424 | Risk Ratio (M‐H, Fixed, 95% CI) | 6.76 [1.32, 34.54] |
| Analysis 4.8  Comparison 4 (1.5) PGE2 (all regimens) vs placebo/no treatment (all women, intact membranes, unfavourable cervix), Outcome 8 Uterine hyperstimulation without FHR changes. | ||||
| 8.1 PGE2 (once only) vs placebo/no treatment | 2 | 134 | Risk Ratio (M‐H, Fixed, 95% CI) | 5.16 [0.31, 86.59] |
| 8.2 PGE2 (repeated doses) vs placebo/no treatment | 1 | 50 | Risk Ratio (M‐H, Fixed, 95% CI) | 0.0 [0.0, 0.0] |
| 8.3 PGE2 (sustained release) vs placebo/no treatment | 2 | 240 | Risk Ratio (M‐H, Fixed, 95% CI) | 7.85 [1.05, 58.82] |
| 13 Apgar score <7 at 5 minutes Show forest plot | 2 | 161 | Risk Ratio (M‐H, Fixed, 95% CI) | 0.54 [0.14, 2.05] |
| Analysis 4.13  Comparison 4 (1.5) PGE2 (all regimens) vs placebo/no treatment (all women, intact membranes, unfavourable cervix), Outcome 13 Apgar score <7 at 5 minutes. | ||||
| 13.1 PGE2 (once only) vs placebo/no treatment | 2 | 161 | Risk Ratio (M‐H, Fixed, 95% CI) | 0.54 [0.14, 2.05] |
| 14 Neonatal intensive care unit admission Show forest plot | 1 | 50 | Risk Ratio (M‐H, Fixed, 95% CI) | 0.22 [0.01, 4.28] |
| Analysis 4.14  Comparison 4 (1.5) PGE2 (all regimens) vs placebo/no treatment (all women, intact membranes, unfavourable cervix), Outcome 14 Neonatal intensive care unit admission. | ||||
| 14.2 PGE2 (repeated doses) vs placebo/no treatment | 1 | 50 | Risk Ratio (M‐H, Fixed, 95% CI) | 0.22 [0.01, 4.28] |
| 18 Maternal side‐effects (all) Show forest plot | 3 | 212 | Risk Ratio (M‐H, Fixed, 95% CI) | 1.68 [0.66, 4.31] |
| Analysis 4.18  Comparison 4 (1.5) PGE2 (all regimens) vs placebo/no treatment (all women, intact membranes, unfavourable cervix), Outcome 18 Maternal side‐effects (all). | ||||
| 18.1 PGE2 (once only) vs placebo/no treatment | 2 | 162 | Risk Ratio (M‐H, Fixed, 95% CI) | 1.68 [0.66, 4.31] |
| 18.2 PGE2 (repeated doses) vs placebo/no treatment | 1 | 50 | Risk Ratio (M‐H, Fixed, 95% CI) | 0.0 [0.0, 0.0] |
| 23 Postpartum haemorrhage Show forest plot | 1 | 81 | Risk Ratio (M‐H, Fixed, 95% CI) | 0.0 [0.0, 0.0] |
| Analysis 4.23  Comparison 4 (1.5) PGE2 (all regimens) vs placebo/no treatment (all women, intact membranes, unfavourable cervix), Outcome 23 Postpartum haemorrhage. | ||||
| 23.1 PGE2 (once only) vs placebo/no treatment | 1 | 81 | Risk Ratio (M‐H, Fixed, 95% CI) | 0.0 [0.0, 0.0] |
| Outcome or subgroup title | No. of studies | No. of participants | Statistical method | Effect size |
| 1 Vaginal delivery not achieved within 24 hours Show forest plot | 1 | 345 | Risk Ratio (M‐H, Fixed, 95% CI) | 0.12 [0.08, 0.18] |
| Analysis 5.1  Comparison 5 (1.6) PGE2 (all regimens) vs placebo/no treatment (all women, intact membranes, favourable cervix), Outcome 1 Vaginal delivery not achieved within 24 hours. | ||||
| 1.2 PGE2 (repeated doses) vs placebo/no treatment | 1 | 345 | Risk Ratio (M‐H, Fixed, 95% CI) | 0.12 [0.08, 0.18] |
| 3 Caesarean section Show forest plot | 1 | 345 | Risk Ratio (M‐H, Fixed, 95% CI) | 0.61 [0.10, 3.61] |
| Analysis 5.3  Comparison 5 (1.6) PGE2 (all regimens) vs placebo/no treatment (all women, intact membranes, favourable cervix), Outcome 3 Caesarean section. | ||||
| 3.2 PGE2 (repeated doses) vs placebo/no treatment | 1 | 345 | Risk Ratio (M‐H, Fixed, 95% CI) | 0.61 [0.10, 3.61] |
| 4 Serious neonatal morbidity or perinatal death Show forest plot | 1 | 345 | Risk Ratio (M‐H, Fixed, 95% CI) | 0.31 [0.01, 7.45] |
| Analysis 5.4  Comparison 5 (1.6) PGE2 (all regimens) vs placebo/no treatment (all women, intact membranes, favourable cervix), Outcome 4 Serious neonatal morbidity or perinatal death. | ||||
| 4.2 PGE2 (repeated doses) vs placebo/no treatment | 1 | 345 | Risk Ratio (M‐H, Fixed, 95% CI) | 0.31 [0.01, 7.45] |
| 7 Oxytocin augmentation Show forest plot | 1 | 345 | Risk Ratio (M‐H, Fixed, 95% CI) | 1.07 [0.81, 1.42] |
| Analysis 5.7  Comparison 5 (1.6) PGE2 (all regimens) vs placebo/no treatment (all women, intact membranes, favourable cervix), Outcome 7 Oxytocin augmentation. | ||||
| 7.2 PGE2 (repeated doses) vs placebo/no treatment | 1 | 345 | Risk Ratio (M‐H, Fixed, 95% CI) | 1.07 [0.81, 1.42] |
| 11 Instrumental vaginal delivery Show forest plot | 1 | 345 | Risk Ratio (M‐H, Fixed, 95% CI) | 1.22 [0.28, 5.38] |
| Analysis 5.11  Comparison 5 (1.6) PGE2 (all regimens) vs placebo/no treatment (all women, intact membranes, favourable cervix), Outcome 11 Instrumental vaginal delivery. | ||||
| 11.2 PGE2 (repeated doses) vs placebo/no treatment | 1 | 345 | Risk Ratio (M‐H, Fixed, 95% CI) | 1.22 [0.28, 5.38] |
| 16 Perinatal death Show forest plot | 1 | 345 | Risk Ratio (M‐H, Fixed, 95% CI) | 0.31 [0.01, 7.45] |
| Analysis 5.16  Comparison 5 (1.6) PGE2 (all regimens) vs placebo/no treatment (all women, intact membranes, favourable cervix), Outcome 16 Perinatal death. | ||||
| 16.2 PGE2 (repeated doses) vs placebo/no treatment | 1 | 345 | Risk Ratio (M‐H, Fixed, 95% CI) | 0.31 [0.01, 7.45] |
| Outcome or subgroup title | No. of studies | No. of participants | Statistical method | Effect size |
| 3 Caesarean section Show forest plot | 1 | 2520 | Risk Ratio (M‐H, Fixed, 95% CI) | 0.88 [0.70, 1.11] |
| Analysis 6.3  Comparison 6 (1.7) PGE2 (all regimens) vs placebo/no treatment (all women, ruptured membranes, variable/undefined cervix), Outcome 3 Caesarean section. | ||||
| 3.2 PGE2 (repeated doses) vs placebo/no treatment | 1 | 2520 | Risk Ratio (M‐H, Fixed, 95% CI) | 0.88 [0.70, 1.11] |
| 4 Serious neonatal morbidity or perinatal death Show forest plot | 1 | 2520 | Risk Ratio (M‐H, Fixed, 95% CI) | 0.20 [0.01, 4.17] |
| Analysis 6.4  Comparison 6 (1.7) PGE2 (all regimens) vs placebo/no treatment (all women, ruptured membranes, variable/undefined cervix), Outcome 4 Serious neonatal morbidity or perinatal death. | ||||
| 4.2 PGE2 (repeated doses) vs placebo/no treatment | 1 | 2520 | Risk Ratio (M‐H, Fixed, 95% CI) | 0.20 [0.01, 4.17] |
| 8 Uterine hyperstimulation without FHR changes Show forest plot | 1 | 2520 | Risk Ratio (M‐H, Fixed, 95% CI) | 2.25 [0.70, 7.30] |
| Analysis 6.8  Comparison 6 (1.7) PGE2 (all regimens) vs placebo/no treatment (all women, ruptured membranes, variable/undefined cervix), Outcome 8 Uterine hyperstimulation without FHR changes. | ||||
| 8.2 PGE2 (repeated doses) vs placebo/no treatment | 1 | 2520 | Risk Ratio (M‐H, Fixed, 95% CI) | 2.25 [0.70, 7.30] |
| 9 Uterine rupture Show forest plot | 1 | 2520 | Risk Ratio (M‐H, Fixed, 95% CI) | 0.0 [0.0, 0.0] |
| Analysis 6.9  Comparison 6 (1.7) PGE2 (all regimens) vs placebo/no treatment (all women, ruptured membranes, variable/undefined cervix), Outcome 9 Uterine rupture. | ||||
| 9.2 PGE2 (repeated doses) vs placebo/no treatment | 1 | 2520 | Risk Ratio (M‐H, Fixed, 95% CI) | 0.0 [0.0, 0.0] |
| 10 Epidural analgesia Show forest plot | 1 | 2520 | Risk Ratio (M‐H, Fixed, 95% CI) | 1.02 [0.94, 1.10] |
| Analysis 6.10  Comparison 6 (1.7) PGE2 (all regimens) vs placebo/no treatment (all women, ruptured membranes, variable/undefined cervix), Outcome 10 Epidural analgesia. | ||||
| 10.2 PGE2 (repeated doses) vs placebo/no treatment | 1 | 2520 | Risk Ratio (M‐H, Fixed, 95% CI) | 1.02 [0.94, 1.10] |
| 11 Instrumental vaginal delivery Show forest plot | 1 | 2520 | Risk Ratio (M‐H, Fixed, 95% CI) | 0.96 [0.80, 1.14] |
| Analysis 6.11  Comparison 6 (1.7) PGE2 (all regimens) vs placebo/no treatment (all women, ruptured membranes, variable/undefined cervix), Outcome 11 Instrumental vaginal delivery. | ||||
| 11.2 PGE2 (repeated doses) vs placebo/no treatment | 1 | 2520 | Risk Ratio (M‐H, Fixed, 95% CI) | 0.96 [0.80, 1.14] |
| 12 Meconium stained liquor Show forest plot | 1 | 2520 | Risk Ratio (M‐H, Fixed, 95% CI) | 1.04 [0.80, 1.36] |
| Analysis 6.12  Comparison 6 (1.7) PGE2 (all regimens) vs placebo/no treatment (all women, ruptured membranes, variable/undefined cervix), Outcome 12 Meconium stained liquor. | ||||
| 12.2 PGE2 (repeated doses) vs placebo/no treatment | 1 | 2520 | Risk Ratio (M‐H, Fixed, 95% CI) | 1.04 [0.80, 1.36] |
| 13 Apgar score <7 at 5 minutes Show forest plot | 1 | 2519 | Risk Ratio (M‐H, Fixed, 95% CI) | 1.67 [0.89, 3.15] |
| Analysis 6.13  Comparison 6 (1.7) PGE2 (all regimens) vs placebo/no treatment (all women, ruptured membranes, variable/undefined cervix), Outcome 13 Apgar score <7 at 5 minutes. | ||||
| 13.2 PGE2 (repeated doses) vs placebo/no treatment | 1 | 2519 | Risk Ratio (M‐H, Fixed, 95% CI) | 1.67 [0.89, 3.15] |
| 14 Neonatal intensive care unit admission Show forest plot | 1 | 2519 | Risk Ratio (M‐H, Fixed, 95% CI) | 0.91 [0.72, 1.15] |
| Analysis 6.14  Comparison 6 (1.7) PGE2 (all regimens) vs placebo/no treatment (all women, ruptured membranes, variable/undefined cervix), Outcome 14 Neonatal intensive care unit admission. | ||||
| 14.2 PGE2 (repeated doses) vs placebo/no treatment | 1 | 2519 | Risk Ratio (M‐H, Fixed, 95% CI) | 0.91 [0.72, 1.15] |
| 16 Perinatal death Show forest plot | 1 | 2519 | Risk Ratio (M‐H, Fixed, 95% CI) | 0.20 [0.01, 4.17] |
| Analysis 6.16  Comparison 6 (1.7) PGE2 (all regimens) vs placebo/no treatment (all women, ruptured membranes, variable/undefined cervix), Outcome 16 Perinatal death. | ||||
| 16.2 PGE2 (repeated doses) vs placebo/no treatment | 1 | 2519 | Risk Ratio (M‐H, Fixed, 95% CI) | 0.20 [0.01, 4.17] |
| 18 Maternal side‐effects (all) Show forest plot | 1 | 5040 | Risk Ratio (M‐H, Fixed, 95% CI) | 2.00 [0.60, 6.64] |
| Analysis 6.18  Comparison 6 (1.7) PGE2 (all regimens) vs placebo/no treatment (all women, ruptured membranes, variable/undefined cervix), Outcome 18 Maternal side‐effects (all). | ||||
| 18.2 PGE2 (repeated doses) vs placebo/no treatment | 1 | 5040 | Risk Ratio (M‐H, Fixed, 95% CI) | 2.00 [0.60, 6.64] |
| 20 Vomitting (maternal) Show forest plot | 1 | 2520 | Risk Ratio (M‐H, Fixed, 95% CI) | 1.25 [0.34, 4.65] |
| Analysis 6.20  Comparison 6 (1.7) PGE2 (all regimens) vs placebo/no treatment (all women, ruptured membranes, variable/undefined cervix), Outcome 20 Vomitting (maternal). | ||||
| 20.2 PGE2 (repeated doses) vs placebo/no treatment | 1 | 2520 | Risk Ratio (M‐H, Fixed, 95% CI) | 1.25 [0.34, 4.65] |
| 21 Diarrhoea (maternal) Show forest plot | 1 | 2520 | Risk Ratio (M‐H, Fixed, 95% CI) | 7.01 [0.36, 135.59] |
| Analysis 6.21  Comparison 6 (1.7) PGE2 (all regimens) vs placebo/no treatment (all women, ruptured membranes, variable/undefined cervix), Outcome 21 Diarrhoea (maternal). | ||||
| 21.2 PGE2 (repeated doses) vs placebo/no treatment | 1 | 2520 | Risk Ratio (M‐H, Fixed, 95% CI) | 7.01 [0.36, 135.59] |
| 23 Postpartum haemorrhage Show forest plot | 1 | 2520 | Risk Ratio (M‐H, Fixed, 95% CI) | 1.61 [1.07, 2.43] |
| Analysis 6.23  Comparison 6 (1.7) PGE2 (all regimens) vs placebo/no treatment (all women, ruptured membranes, variable/undefined cervix), Outcome 23 Postpartum haemorrhage. | ||||
| 23.2 PGE2 (repeated doses) vs placebo/no treatment | 1 | 2520 | Risk Ratio (M‐H, Fixed, 95% CI) | 1.61 [1.07, 2.43] |
| 26 Woman not satisfied Show forest plot | 1 | 2520 | Risk Ratio (M‐H, Fixed, 95% CI) | 0.44 [0.33, 0.58] |
| Analysis 6.26  Comparison 6 (1.7) PGE2 (all regimens) vs placebo/no treatment (all women, ruptured membranes, variable/undefined cervix), Outcome 26 Woman not satisfied. | ||||
| 26.2 PGE2 (repeated doses) vs placebo/no treatment | 1 | 2520 | Risk Ratio (M‐H, Fixed, 95% CI) | 0.44 [0.33, 0.58] |
| Outcome or subgroup title | No. of studies | No. of participants | Statistical method | Effect size |
| 2 Uterine hyperstimulation with FHR changes Show forest plot | 1 | 155 | Risk Ratio (M‐H, Fixed, 95% CI) | 0.0 [0.0, 0.0] |
| Analysis 7.2  Comparison 7 (1.8) PGE2 (all regimens) vs placebo/no treatment (all women, ruptured membranes, unfavourable cervix), Outcome 2 Uterine hyperstimulation with FHR changes. | ||||
| 2.1 PGE2 (once only) vs placebo/no treatment | 1 | 155 | Risk Ratio (M‐H, Fixed, 95% CI) | 0.0 [0.0, 0.0] |
| 3 Caesarean section Show forest plot | 5 | 700 | Risk Ratio (M‐H, Fixed, 95% CI) | 0.96 [0.66, 1.40] |
| Analysis 7.3  Comparison 7 (1.8) PGE2 (all regimens) vs placebo/no treatment (all women, ruptured membranes, unfavourable cervix), Outcome 3 Caesarean section. | ||||
| 3.1 PGE2 (once only) vs placebo/no treatment | 2 | 214 | Risk Ratio (M‐H, Fixed, 95% CI) | 1.02 [0.57, 1.82] |
| 3.2 PGE2 (repeated doses) vs placebo/no treatment | 3 | 486 | Risk Ratio (M‐H, Fixed, 95% CI) | 0.92 [0.56, 1.51] |
| 4 Serious neonatal morbidity or perinatal death Show forest plot | 1 | 220 | Risk Ratio (M‐H, Fixed, 95% CI) | 0.0 [0.0, 0.0] |
| Analysis 7.4  Comparison 7 (1.8) PGE2 (all regimens) vs placebo/no treatment (all women, ruptured membranes, unfavourable cervix), Outcome 4 Serious neonatal morbidity or perinatal death. | ||||
| 4.2 PGE2 (repeated doses) vs placebo/no treatment | 1 | 220 | Risk Ratio (M‐H, Fixed, 95% CI) | 0.0 [0.0, 0.0] |
| 5 Serious maternal morbidity or death Show forest plot | 1 | 59 | Risk Ratio (M‐H, Fixed, 95% CI) | 4.84 [0.24, 96.66] |
| Analysis 7.5  Comparison 7 (1.8) PGE2 (all regimens) vs placebo/no treatment (all women, ruptured membranes, unfavourable cervix), Outcome 5 Serious maternal morbidity or death. | ||||
| 5.1 PGE2 (once only) vs placebo | 1 | 59 | Risk Ratio (M‐H, Fixed, 95% CI) | 4.84 [0.24, 96.66] |
| 7 Oxytocin augmentation Show forest plot | 2 | 375 | Risk Ratio (M‐H, Fixed, 95% CI) | 0.62 [0.49, 0.79] |
| Analysis 7.7  Comparison 7 (1.8) PGE2 (all regimens) vs placebo/no treatment (all women, ruptured membranes, unfavourable cervix), Outcome 7 Oxytocin augmentation. | ||||
| 7.1 PGE2 (once only) vs placebo/no treatment | 1 | 155 | Risk Ratio (M‐H, Fixed, 95% CI) | 0.63 [0.45, 0.90] |
| 7.2 PGE2 (repeated doses) vs placebo/no treatment | 1 | 220 | Risk Ratio (M‐H, Fixed, 95% CI) | 0.61 [0.43, 0.85] |
| 8 Uterine hyperstimulation without FHR changes Show forest plot | 2 | 214 | Risk Ratio (M‐H, Fixed, 95% CI) | 0.48 [0.05, 5.05] |
| Analysis 7.8  Comparison 7 (1.8) PGE2 (all regimens) vs placebo/no treatment (all women, ruptured membranes, unfavourable cervix), Outcome 8 Uterine hyperstimulation without FHR changes. | ||||
| 8.1 PGE2 (once only) vs placebo/no treatment | 2 | 214 | Risk Ratio (M‐H, Fixed, 95% CI) | 0.48 [0.05, 5.05] |
| 9 Uterine rupture Show forest plot | 1 | 59 | Risk Ratio (M‐H, Fixed, 95% CI) | 2.90 [0.12, 68.50] |
| Analysis 7.9  Comparison 7 (1.8) PGE2 (all regimens) vs placebo/no treatment (all women, ruptured membranes, unfavourable cervix), Outcome 9 Uterine rupture. | ||||
| 9.1 PGE2 (once only) vs placebo/no treatment | 1 | 59 | Risk Ratio (M‐H, Fixed, 95% CI) | 2.90 [0.12, 68.50] |
| 10 Epidural analgesia Show forest plot | 2 | 420 | Risk Ratio (M‐H, Fixed, 95% CI) | 2.35 [1.75, 3.16] |
| Analysis 7.10  Comparison 7 (1.8) PGE2 (all regimens) vs placebo/no treatment (all women, ruptured membranes, unfavourable cervix), Outcome 10 Epidural analgesia. | ||||
| 10.2 PGE2 (repeated doses) vs placebo/no treatment | 2 | 420 | Risk Ratio (M‐H, Fixed, 95% CI) | 2.35 [1.75, 3.16] |
| 11 Instrumental vaginal delivery Show forest plot | 2 | 259 | Risk Ratio (M‐H, Fixed, 95% CI) | 0.99 [0.57, 1.73] |
| Analysis 7.11  Comparison 7 (1.8) PGE2 (all regimens) vs placebo/no treatment (all women, ruptured membranes, unfavourable cervix), Outcome 11 Instrumental vaginal delivery. | ||||
| 11.1 PGE2 (once only) vs placebo/no treatment | 1 | 59 | Risk Ratio (M‐H, Fixed, 95% CI) | 2.9 [0.64, 13.22] |
| 11.2 PGE2 (repeated doses) vs placebo/no treatment | 1 | 200 | Risk Ratio (M‐H, Fixed, 95% CI) | 0.79 [0.43, 1.46] |
| 12 Meconium stained liquor Show forest plot | 3 | 479 | Risk Ratio (M‐H, Fixed, 95% CI) | 0.60 [0.32, 1.10] |
| Analysis 7.12  Comparison 7 (1.8) PGE2 (all regimens) vs placebo/no treatment (all women, ruptured membranes, unfavourable cervix), Outcome 12 Meconium stained liquor. | ||||
| 12.1 PGE2 (once only) vs placebo/no treatment | 1 | 59 | Risk Ratio (M‐H, Fixed, 95% CI) | 0.73 [0.18, 2.96] |
| 12.2 PGE2 (repeated doses) vs placebo/no treatment | 2 | 420 | Risk Ratio (M‐H, Fixed, 95% CI) | 0.57 [0.29, 1.13] |
| 13 Apgar score <7 at 5 minutes Show forest plot | 2 | 375 | Risk Ratio (M‐H, Fixed, 95% CI) | 0.74 [0.17, 3.27] |
| Analysis 7.13  Comparison 7 (1.8) PGE2 (all regimens) vs placebo/no treatment (all women, ruptured membranes, unfavourable cervix), Outcome 13 Apgar score <7 at 5 minutes. | ||||
| 13.1 PGE2 (once only) vs placebo/no treatment | 1 | 155 | Risk Ratio (M‐H, Fixed, 95% CI) | 0.96 [0.06, 15.11] |
| 13.2 PGE2 (repeated doses) vs placebo/no treatment | 1 | 220 | Risk Ratio (M‐H, Fixed, 95% CI) | 0.67 [0.11, 3.91] |
| 14 Neonatal intensive care unit admission Show forest plot | 3 | 434 | Risk Ratio (M‐H, Fixed, 95% CI) | 0.93 [0.55, 1.59] |
| Analysis 7.14  Comparison 7 (1.8) PGE2 (all regimens) vs placebo/no treatment (all women, ruptured membranes, unfavourable cervix), Outcome 14 Neonatal intensive care unit admission. | ||||
| 14.1 PGE2 (once only) vs placebo/no treatment | 2 | 214 | Risk Ratio (M‐H, Fixed, 95% CI) | 0.96 [0.51, 1.82] |
| 14.2 PGE2 (repeated doses) vs placebo/no treatment | 1 | 220 | Risk Ratio (M‐H, Fixed, 95% CI) | 0.88 [0.33, 2.33] |
| 16 Perinatal death Show forest plot | 1 | 200 | Risk Ratio (M‐H, Fixed, 95% CI) | 0.0 [0.0, 0.0] |
| Analysis 7.16  Comparison 7 (1.8) PGE2 (all regimens) vs placebo/no treatment (all women, ruptured membranes, unfavourable cervix), Outcome 16 Perinatal death. | ||||
| 16.2 PGE2 (repeated doses) vs placebo/no treatment | 1 | 200 | Risk Ratio (M‐H, Fixed, 95% CI) | 0.0 [0.0, 0.0] |
| 18 Maternal side‐effects (all) Show forest plot | 3 | 493 | Risk Ratio (M‐H, Fixed, 95% CI) | 1.03 [0.63, 1.69] |
| Analysis 7.18  Comparison 7 (1.8) PGE2 (all regimens) vs placebo/no treatment (all women, ruptured membranes, unfavourable cervix), Outcome 18 Maternal side‐effects (all). | ||||
| 18.1 PGE2 (once only) vs placebo/no treatment | 2 | 273 | Risk Ratio (M‐H, Fixed, 95% CI) | 1.54 [0.52, 4.57] |
| 18.2 PGE2 (repeated doses) vs placebo/no treatment | 1 | 220 | Risk Ratio (M‐H, Fixed, 95% CI) | 0.90 [0.52, 1.59] |
| 20 Vomitting (maternal) Show forest plot | 1 | 59 | Risk Ratio (M‐H, Fixed, 95% CI) | 0.97 [0.15, 6.41] |
| Analysis 7.20  Comparison 7 (1.8) PGE2 (all regimens) vs placebo/no treatment (all women, ruptured membranes, unfavourable cervix), Outcome 20 Vomitting (maternal). | ||||
| 20.1 PGE2 (once only) vs placebo/no treatment | 1 | 59 | Risk Ratio (M‐H, Fixed, 95% CI) | 0.97 [0.15, 6.41] |
| 22 Other maternal side effects Show forest plot | 1 | 155 | Risk Ratio (M‐H, Fixed, 95% CI) | 0.48 [0.04, 5.20] |
| Analysis 7.22  Comparison 7 (1.8) PGE2 (all regimens) vs placebo/no treatment (all women, ruptured membranes, unfavourable cervix), Outcome 22 Other maternal side effects. | ||||
| 22.1 PGE2 (once only) vs placebo/no treatment | 1 | 155 | Risk Ratio (M‐H, Fixed, 95% CI) | 0.48 [0.04, 5.20] |
| 23 Postpartum haemorrhage Show forest plot | 3 | 479 | Risk Ratio (M‐H, Fixed, 95% CI) | 0.79 [0.31, 2.02] |
| Analysis 7.23  Comparison 7 (1.8) PGE2 (all regimens) vs placebo/no treatment (all women, ruptured membranes, unfavourable cervix), Outcome 23 Postpartum haemorrhage. | ||||
| 23.1 PGE2 (once only) vs placebo/no treatment | 1 | 59 | Risk Ratio (M‐H, Fixed, 95% CI) | 2.90 [0.12, 68.50] |
| 23.2 PGE2 (repeated doses) vs placebo/no treatment | 2 | 420 | Risk Ratio (M‐H, Fixed, 95% CI) | 0.67 [0.24, 1.84] |
| 24 Serious maternal complication Show forest plot | 1 | 59 | Risk Ratio (M‐H, Fixed, 95% CI) | 2.90 [0.12, 68.50] |
| Analysis 7.24  Comparison 7 (1.8) PGE2 (all regimens) vs placebo/no treatment (all women, ruptured membranes, unfavourable cervix), Outcome 24 Serious maternal complication. | ||||
| 24.1 PGE2 (once only) vs placebo/no treatment | 1 | 59 | Risk Ratio (M‐H, Fixed, 95% CI) | 2.90 [0.12, 68.50] |
| Outcome or subgroup title | No. of studies | No. of participants | Statistical method | Effect size |
| 1 Vaginal delivery not achieved within 24 hours Show forest plot | 2 | 226 | Risk Ratio (M‐H, Fixed, 95% CI) | 0.30 [0.23, 0.40] |
| Analysis 8.1  Comparison 8 (1.10) PGE2 (all regimens) vs placebo/no treatment (all primiparae), Outcome 1 Vaginal delivery not achieved within 24 hours. | ||||
| 1.1 PGE2 (once only) vs placebo/no treatment | 1 | 39 | Risk Ratio (M‐H, Fixed, 95% CI) | 0.88 [0.67, 1.15] |
| 1.2 PGE2 (repeated doses) vs placebo/no treatment | 1 | 187 | Risk Ratio (M‐H, Fixed, 95% CI) | 0.20 [0.13, 0.29] |
| 2 Uterine hyperstimulation with FHR changes Show forest plot | 3 | 217 | Risk Ratio (M‐H, Fixed, 95% CI) | 3.0 [0.13, 68.57] |
| Analysis 8.2  Comparison 8 (1.10) PGE2 (all regimens) vs placebo/no treatment (all primiparae), Outcome 2 Uterine hyperstimulation with FHR changes. | ||||
| 2.1 PGE2 (once only) vs placebo/no treatment | 2 | 187 | Risk Ratio (M‐H, Fixed, 95% CI) | 3.0 [0.13, 68.57] |
| 2.2 PGE2 (repeated doses) vs placebo/no treatment | 1 | 30 | Risk Ratio (M‐H, Fixed, 95% CI) | 0.0 [0.0, 0.0] |
| 3 Caesarean section Show forest plot | 10 | 2486 | Risk Ratio (M‐H, Fixed, 95% CI) | 0.93 [0.77, 1.12] |
| Analysis 8.3  Comparison 8 (1.10) PGE2 (all regimens) vs placebo/no treatment (all primiparae), Outcome 3 Caesarean section. | ||||
| 3.1 PGE2 (once only) vs placebo/no treatment | 4 | 273 | Risk Ratio (M‐H, Fixed, 95% CI) | 0.98 [0.66, 1.46] |
| 3.2 PGE2 (repeated doses) vs placebo/no treatment | 5 | 2144 | Risk Ratio (M‐H, Fixed, 95% CI) | 0.93 [0.75, 1.16] |
| 3.3 PGE2 (sustained release) vs placebo/no treatment | 1 | 69 | Risk Ratio (M‐H, Fixed, 95% CI) | 0.79 [0.36, 1.73] |
| 4 Serious neonatal morbidity or perinatal death Show forest plot | 3 | 1796 | Risk Ratio (M‐H, Fixed, 95% CI) | 0.34 [0.01, 8.22] |
| Analysis 8.4  Comparison 8 (1.10) PGE2 (all regimens) vs placebo/no treatment (all primiparae), Outcome 4 Serious neonatal morbidity or perinatal death. | ||||
| 4.2 PGE2 (repeated doses) vs placebo/no treatment | 2 | 1727 | Risk Ratio (M‐H, Fixed, 95% CI) | 0.34 [0.01, 8.22] |
| 4.3 PGE2 (sustained release) vs placebo/no treatment | 1 | 69 | Risk Ratio (M‐H, Fixed, 95% CI) | 0.0 [0.0, 0.0] |
| 5 Serious maternal morbidity or death Show forest plot | 1 | 69 | Risk Ratio (M‐H, Fixed, 95% CI) | 0.0 [0.0, 0.0] |
| Analysis 8.5  Comparison 8 (1.10) PGE2 (all regimens) vs placebo/no treatment (all primiparae), Outcome 5 Serious maternal morbidity or death. | ||||
| 5.3 PGE2 (sustained release) vs placebo/no treatment | 1 | 69 | Risk Ratio (M‐H, Fixed, 95% CI) | 0.0 [0.0, 0.0] |
| 6 Cervix unfavourable/unchanged after 12 to 24 hours Show forest plot | 1 | 36 | Risk Ratio (M‐H, Fixed, 95% CI) | 0.13 [0.03, 0.47] |
| Analysis 8.6  Comparison 8 (1.10) PGE2 (all regimens) vs placebo/no treatment (all primiparae), Outcome 6 Cervix unfavourable/unchanged after 12 to 24 hours. | ||||
| 6.2 PGE2 (repeated doses) vs placebo/no treatment | 1 | 36 | Risk Ratio (M‐H, Fixed, 95% CI) | 0.13 [0.03, 0.47] |
| 7 Oxytocin augmentation Show forest plot | 3 | 407 | Risk Ratio (M‐H, Fixed, 95% CI) | 0.59 [0.47, 0.74] |
| Analysis 8.7  Comparison 8 (1.10) PGE2 (all regimens) vs placebo/no treatment (all primiparae), Outcome 7 Oxytocin augmentation. | ||||
| 7.1 PGE2 (once only) vs placebo/no treatment | 2 | 187 | Risk Ratio (M‐H, Fixed, 95% CI) | 0.57 [0.42, 0.77] |
| 7.2 PGE2 (repeated doses) vs placebo/no treatment | 1 | 220 | Risk Ratio (M‐H, Fixed, 95% CI) | 0.61 [0.43, 0.85] |
| 8 Uterine hyperstimulation without FHR changes Show forest plot | 3 | 1701 | Risk Ratio (M‐H, Fixed, 95% CI) | 0.35 [0.02, 8.10] |
| Analysis 8.8  Comparison 8 (1.10) PGE2 (all regimens) vs placebo/no treatment (all primiparae), Outcome 8 Uterine hyperstimulation without FHR changes. | ||||
| 8.1 PGE2 (once only) vs placebo/no treatment | 2 | 194 | Risk Ratio (M‐H, Fixed, 95% CI) | 0.35 [0.02, 8.10] |
| 8.2 PGE2 (repeated doses) vs placebo/no treatment | 1 | 1507 | Risk Ratio (M‐H, Fixed, 95% CI) | 0.0 [0.0, 0.0] |
| 9 Uterine rupture Show forest plot | 1 | 1507 | Risk Ratio (M‐H, Fixed, 95% CI) | 0.0 [0.0, 0.0] |
| Analysis 8.9  Comparison 8 (1.10) PGE2 (all regimens) vs placebo/no treatment (all primiparae), Outcome 9 Uterine rupture. | ||||
| 9.2 PGE2 (repeated doses) vs placebo/no treatment | 1 | 1507 | Risk Ratio (M‐H, Fixed, 95% CI) | 0.0 [0.0, 0.0] |
| 10 Epidural analgesia Show forest plot | 4 | 1959 | Risk Ratio (M‐H, Fixed, 95% CI) | 1.12 [1.03, 1.21] |
| Analysis 8.10  Comparison 8 (1.10) PGE2 (all regimens) vs placebo/no treatment (all primiparae), Outcome 10 Epidural analgesia. | ||||
| 10.1 PGE2 (once only) vs placebo/no treatment | 1 | 32 | Risk Ratio (M‐H, Fixed, 95% CI) | 0.54 [0.29, 0.98] |
| 10.2 PGE2 (repeated doses) vs placebo/no treatment | 3 | 1927 | Risk Ratio (M‐H, Fixed, 95% CI) | 1.13 [1.05, 1.23] |
| 11 Instrumental vaginal delivery Show forest plot | 4 | 1815 | Risk Ratio (M‐H, Fixed, 95% CI) | 0.97 [0.83, 1.14] |
| Analysis 8.11  Comparison 8 (1.10) PGE2 (all regimens) vs placebo/no treatment (all primiparae), Outcome 11 Instrumental vaginal delivery. | ||||
| 11.1 PGE2 (once only) vs placebo/no treatment | 1 | 39 | Risk Ratio (M‐H, Fixed, 95% CI) | 0.70 [0.23, 2.10] |
| 11.2 PGE2 (repeated doses) vs placebo/no treatment | 2 | 1707 | Risk Ratio (M‐H, Fixed, 95% CI) | 0.96 [0.82, 1.14] |
| 11.3 PGE2 (sustained release) vs placebo/no treatment | 1 | 69 | Risk Ratio (M‐H, Fixed, 95% CI) | 1.56 [0.67, 3.62] |
| 12 Meconium stained liquor Show forest plot | 2 | 420 | Risk Ratio (M‐H, Fixed, 95% CI) | 0.57 [0.29, 1.13] |
| Analysis 8.12  Comparison 8 (1.10) PGE2 (all regimens) vs placebo/no treatment (all primiparae), Outcome 12 Meconium stained liquor. | ||||
| 12.2 PGE2 (repeated doses) vs placebo/no treatment | 2 | 420 | Risk Ratio (M‐H, Fixed, 95% CI) | 0.57 [0.29, 1.13] |
| 13 Apgar score <7 at 5 minutes Show forest plot | 3 | 414 | Risk Ratio (M‐H, Fixed, 95% CI) | 0.74 [0.17, 3.27] |
| Analysis 8.13  Comparison 8 (1.10) PGE2 (all regimens) vs placebo/no treatment (all primiparae), Outcome 13 Apgar score <7 at 5 minutes. | ||||
| 13.1 PGE2 (once only) vs placebo/no treatment | 2 | 194 | Risk Ratio (M‐H, Fixed, 95% CI) | 0.96 [0.06, 15.11] |
| 13.2 PGE2 (repeated doses) vs placebo/no treatment | 1 | 220 | Risk Ratio (M‐H, Fixed, 95% CI) | 0.67 [0.11, 3.91] |
| 14 Neonatal intensive care unit admission Show forest plot | 3 | 444 | Risk Ratio (M‐H, Fixed, 95% CI) | 1.06 [0.54, 2.09] |
| Analysis 8.14  Comparison 8 (1.10) PGE2 (all regimens) vs placebo/no treatment (all primiparae), Outcome 14 Neonatal intensive care unit admission. | ||||
| 14.1 PGE2 (once only) vs placebo/no treatment | 1 | 155 | Risk Ratio (M‐H, Fixed, 95% CI) | 0.96 [0.32, 2.85] |
| 14.2 PGE2 (repeated doses) vs placebo/no treatment | 1 | 220 | Risk Ratio (M‐H, Fixed, 95% CI) | 0.88 [0.33, 2.33] |
| 14.3 PGE2 (sustained release) vs placebo/no treatment | 1 | 69 | Risk Ratio (M‐H, Fixed, 95% CI) | 3.27 [0.36, 29.93] |
| 16 Perinatal death Show forest plot | 3 | 1776 | Risk Ratio (M‐H, Fixed, 95% CI) | 0.34 [0.01, 8.22] |
| Analysis 8.16  Comparison 8 (1.10) PGE2 (all regimens) vs placebo/no treatment (all primiparae), Outcome 16 Perinatal death. | ||||
| 16.1 PGE2 (repeated doses) vs placebo/no treatment | 2 | 1707 | Risk Ratio (M‐H, Fixed, 95% CI) | 0.34 [0.01, 8.22] |
| 16.3 PGE2 (sustained release) vs placebo/no treatment | 1 | 69 | Risk Ratio (M‐H, Fixed, 95% CI) | 0.0 [0.0, 0.0] |
| 18 Maternal side‐effects (all) Show forest plot | 3 | 1882 | Risk Ratio (M‐H, Fixed, 95% CI) | 1.04 [0.63, 1.71] |
| Analysis 8.18  Comparison 8 (1.10) PGE2 (all regimens) vs placebo/no treatment (all primiparae), Outcome 18 Maternal side‐effects (all). | ||||
| 18.1 PGE2 (once only) vs placebo/no treatment | 1 | 155 | Risk Ratio (M‐H, Fixed, 95% CI) | 0.48 [0.04, 5.20] |
| 18.2 PGE2 (repeated doses) vs placebo/no treatment | 2 | 1727 | Risk Ratio (M‐H, Fixed, 95% CI) | 1.08 [0.65, 1.81] |
| 20 Vomitting (maternal) Show forest plot | 1 | 1507 | Risk Ratio (M‐H, Fixed, 95% CI) | 1.68 [0.40, 7.00] |
| Analysis 8.20  Comparison 8 (1.10) PGE2 (all regimens) vs placebo/no treatment (all primiparae), Outcome 20 Vomitting (maternal). | ||||
| 20.2 PGE2 (repeated doses) vs placebo/no treatment | 1 | 1507 | Risk Ratio (M‐H, Fixed, 95% CI) | 1.68 [0.40, 7.00] |
| 21 Diarrhoea (maternal) Show forest plot | 1 | 1507 | Risk Ratio (M‐H, Fixed, 95% CI) | 5.03 [0.24, 104.66] |
| Analysis 8.21  Comparison 8 (1.10) PGE2 (all regimens) vs placebo/no treatment (all primiparae), Outcome 21 Diarrhoea (maternal). | ||||
| 21.2 PGE2 (repeated doses) vs placebo/no treatment | 1 | 1507 | Risk Ratio (M‐H, Fixed, 95% CI) | 5.03 [0.24, 104.66] |
| 22 Other maternal side effects Show forest plot | 2 | 375 | Risk Ratio (M‐H, Fixed, 95% CI) | 0.87 [0.50, 1.50] |
| Analysis 8.22  Comparison 8 (1.10) PGE2 (all regimens) vs placebo/no treatment (all primiparae), Outcome 22 Other maternal side effects. | ||||
| 22.1 PGE2 (once only) vs placebo/no treatment | 1 | 155 | Risk Ratio (M‐H, Fixed, 95% CI) | 0.48 [0.04, 5.20] |
| 22.2 PGE2 (repeated doses) vs placebo/no treatment | 1 | 220 | Risk Ratio (M‐H, Fixed, 95% CI) | 0.90 [0.52, 1.59] |
| 23 Postpartum haemorrhage Show forest plot | 3 | 1927 | Risk Ratio (M‐H, Fixed, 95% CI) | 1.51 [0.97, 2.34] |
| Analysis 8.23  Comparison 8 (1.10) PGE2 (all regimens) vs placebo/no treatment (all primiparae), Outcome 23 Postpartum haemorrhage. | ||||
| 23.2 PGE2 (repeated doses) vs placebo/no treatment | 3 | 1927 | Risk Ratio (M‐H, Fixed, 95% CI) | 1.51 [0.97, 2.34] |
| Outcome or subgroup title | No. of studies | No. of participants | Statistical method | Effect size |
| 1 Vaginal delivery not achieved within 24 hours Show forest plot | 1 | 39 | Risk Ratio (M‐H, Fixed, 95% CI) | 0.88 [0.67, 1.15] |
| Analysis 9.1  Comparison 9 (1.11) PGE2 (all regimens) vs placebo/no treatment (all primiparae, unfavourable cervix), Outcome 1 Vaginal delivery not achieved within 24 hours. | ||||
| 1.1 PGE2 (once only) vs placebo/no treatment | 1 | 39 | Risk Ratio (M‐H, Fixed, 95% CI) | 0.88 [0.67, 1.15] |
| 2 Uterine hyperstimulation with FHR changes Show forest plot | 3 | 217 | Risk Ratio (M‐H, Fixed, 95% CI) | 3.0 [0.13, 68.57] |
| Analysis 9.2  Comparison 9 (1.11) PGE2 (all regimens) vs placebo/no treatment (all primiparae, unfavourable cervix), Outcome 2 Uterine hyperstimulation with FHR changes. | ||||
| 2.1 PGE2 (once only) vs placebo/no treatment | 2 | 187 | Risk Ratio (M‐H, Fixed, 95% CI) | 3.0 [0.13, 68.57] |
| 2.2 PGE2 (repeated doses) vs placebo/no treatment | 1 | 30 | Risk Ratio (M‐H, Fixed, 95% CI) | 0.0 [0.0, 0.0] |
| 3 Caesarean section Show forest plot | 8 | 792 | Risk Ratio (M‐H, Fixed, 95% CI) | 0.88 [0.66, 1.17] |
| Analysis 9.3  Comparison 9 (1.11) PGE2 (all regimens) vs placebo/no treatment (all primiparae, unfavourable cervix), Outcome 3 Caesarean section. | ||||
| 3.1 PGE2 (once only) vs placebo/no treatment | 4 | 273 | Risk Ratio (M‐H, Fixed, 95% CI) | 0.98 [0.66, 1.46] |
| 3.2 PGE2 (repeated doses) vs placebo/no treatment | 3 | 450 | Risk Ratio (M‐H, Fixed, 95% CI) | 0.81 [0.51, 1.29] |
| 3.3 PGE2 (sustained release) vs placebo/no treatment | 1 | 69 | Risk Ratio (M‐H, Fixed, 95% CI) | 0.79 [0.36, 1.73] |
| 4 Serious neonatal morbidity or perinatal death Show forest plot | 2 | 289 | Risk Ratio (M‐H, Fixed, 95% CI) | 0.0 [0.0, 0.0] |
| Analysis 9.4  Comparison 9 (1.11) PGE2 (all regimens) vs placebo/no treatment (all primiparae, unfavourable cervix), Outcome 4 Serious neonatal morbidity or perinatal death. | ||||
| 4.2 PGE2 (repeated doses) vs placebo/no treatment | 1 | 220 | Risk Ratio (M‐H, Fixed, 95% CI) | 0.0 [0.0, 0.0] |
| 4.3 PGE2 (sustained release) vs placebo/no treatment | 1 | 69 | Risk Ratio (M‐H, Fixed, 95% CI) | 0.0 [0.0, 0.0] |
| 5 Serious maternal morbidity or death Show forest plot | 1 | 69 | Risk Ratio (M‐H, Fixed, 95% CI) | 0.0 [0.0, 0.0] |
| Analysis 9.5  Comparison 9 (1.11) PGE2 (all regimens) vs placebo/no treatment (all primiparae, unfavourable cervix), Outcome 5 Serious maternal morbidity or death. | ||||
| 5.3 PGE2 (sustained release) vs placebo/no treatment | 1 | 69 | Risk Ratio (M‐H, Fixed, 95% CI) | 0.0 [0.0, 0.0] |
| 7 Oxytocin augmentation Show forest plot | 3 | 407 | Risk Ratio (M‐H, Fixed, 95% CI) | 0.59 [0.47, 0.74] |
| Analysis 9.7  Comparison 9 (1.11) PGE2 (all regimens) vs placebo/no treatment (all primiparae, unfavourable cervix), Outcome 7 Oxytocin augmentation. | ||||
| 7.1 PGE2 (once only) vs placebo/no treatment | 2 | 187 | Risk Ratio (M‐H, Fixed, 95% CI) | 0.57 [0.42, 0.77] |
| 7.2 PGE2 (repeated doses) vs placebo/no treatment | 1 | 220 | Risk Ratio (M‐H, Fixed, 95% CI) | 0.61 [0.43, 0.85] |
| 8 Uterine hyperstimulation without FHR changes Show forest plot | 2 | 194 | Risk Ratio (M‐H, Fixed, 95% CI) | 0.35 [0.02, 8.10] |
| Analysis 9.8  Comparison 9 (1.11) PGE2 (all regimens) vs placebo/no treatment (all primiparae, unfavourable cervix), Outcome 8 Uterine hyperstimulation without FHR changes. | ||||
| 8.1 PGE2 (once only) vs placebo/no treatment | 2 | 194 | Risk Ratio (M‐H, Fixed, 95% CI) | 0.35 [0.02, 8.10] |
| 10 Epidural analgesia Show forest plot | 3 | 452 | Risk Ratio (M‐H, Fixed, 95% CI) | 1.95 [1.50, 2.54] |
| Analysis 9.10  Comparison 9 (1.11) PGE2 (all regimens) vs placebo/no treatment (all primiparae, unfavourable cervix), Outcome 10 Epidural analgesia. | ||||
| 10.1 PGE2 (once only) vs placebo/no treatment | 1 | 32 | Risk Ratio (M‐H, Fixed, 95% CI) | 0.54 [0.29, 0.98] |
| 10.2 PGE2 (repeated doses) vs placebo/no treatment | 2 | 420 | Risk Ratio (M‐H, Fixed, 95% CI) | 2.35 [1.75, 3.16] |
| 11 Instrumental vaginal delivery Show forest plot | 3 | 308 | Risk Ratio (M‐H, Fixed, 95% CI) | 0.94 [0.60, 1.47] |
| Analysis 9.11  Comparison 9 (1.11) PGE2 (all regimens) vs placebo/no treatment (all primiparae, unfavourable cervix), Outcome 11 Instrumental vaginal delivery. | ||||
| 11.1 PGE2 (once only) vs placebo/no treatment | 1 | 39 | Risk Ratio (M‐H, Fixed, 95% CI) | 0.70 [0.23, 2.10] |
| 11.2 PGE2 (repeated doses) vs placebo/no treatment | 1 | 200 | Risk Ratio (M‐H, Fixed, 95% CI) | 0.79 [0.43, 1.46] |
| 11.3 PGE2 (sustained release) vs placebo/no treatment | 1 | 69 | Risk Ratio (M‐H, Fixed, 95% CI) | 1.56 [0.67, 3.62] |
| 12 Meconium stained liquor Show forest plot | 2 | 420 | Risk Ratio (M‐H, Fixed, 95% CI) | 0.57 [0.29, 1.13] |
| Analysis 9.12  Comparison 9 (1.11) PGE2 (all regimens) vs placebo/no treatment (all primiparae, unfavourable cervix), Outcome 12 Meconium stained liquor. | ||||
| 12.2 PGE2 (repeated doses) vs placebo/no treatment | 2 | 420 | Risk Ratio (M‐H, Fixed, 95% CI) | 0.57 [0.29, 1.13] |
| 13 Apgar score <7 at 5 minutes Show forest plot | 3 | 414 | Risk Ratio (M‐H, Fixed, 95% CI) | 0.74 [0.17, 3.27] |
| Analysis 9.13  Comparison 9 (1.11) PGE2 (all regimens) vs placebo/no treatment (all primiparae, unfavourable cervix), Outcome 13 Apgar score <7 at 5 minutes. | ||||
| 13.1 PGE2 (once only) vs placebo/no treatment | 2 | 194 | Risk Ratio (M‐H, Fixed, 95% CI) | 0.96 [0.06, 15.11] |
| 13.2 PGE2 (repeated doses) vs placebo/no treatment | 1 | 220 | Risk Ratio (M‐H, Fixed, 95% CI) | 0.67 [0.11, 3.91] |
| 14 Neonatal intensive care unit admission Show forest plot | 3 | 444 | Risk Ratio (M‐H, Fixed, 95% CI) | 1.06 [0.54, 2.09] |
| Analysis 9.14  Comparison 9 (1.11) PGE2 (all regimens) vs placebo/no treatment (all primiparae, unfavourable cervix), Outcome 14 Neonatal intensive care unit admission. | ||||
| 14.1 PGE2 (once only) vs placebo/no treatment | 1 | 155 | Risk Ratio (M‐H, Fixed, 95% CI) | 0.96 [0.32, 2.85] |
| 14.2 PGE2 (repeated doses) vs placebo/no treatment | 1 | 220 | Risk Ratio (M‐H, Fixed, 95% CI) | 0.88 [0.33, 2.33] |
| 14.3 PGE2 (sustained release) vs placebo/no treatment | 1 | 69 | Risk Ratio (M‐H, Fixed, 95% CI) | 3.27 [0.36, 29.93] |
| 16 Perinatal death Show forest plot | 1 | 200 | Risk Ratio (M‐H, Fixed, 95% CI) | 0.0 [0.0, 0.0] |
| Analysis 9.16  Comparison 9 (1.11) PGE2 (all regimens) vs placebo/no treatment (all primiparae, unfavourable cervix), Outcome 16 Perinatal death. | ||||
| 16.1 PGE2 (repeated doses) vs placebo/no treatment | 1 | 200 | Risk Ratio (M‐H, Fixed, 95% CI) | 0.0 [0.0, 0.0] |
| 18 Maternal side‐effects (all) Show forest plot | 2 | 375 | Risk Ratio (M‐H, Fixed, 95% CI) | 0.87 [0.50, 1.50] |
| Analysis 9.18  Comparison 9 (1.11) PGE2 (all regimens) vs placebo/no treatment (all primiparae, unfavourable cervix), Outcome 18 Maternal side‐effects (all). | ||||
| 18.1 PGE2 (once only) vs placebo/no treatment | 1 | 155 | Risk Ratio (M‐H, Fixed, 95% CI) | 0.48 [0.04, 5.20] |
| 18.2 PGE2 (repeated doses) vs placebo/no treatment | 1 | 220 | Risk Ratio (M‐H, Fixed, 95% CI) | 0.90 [0.52, 1.59] |
| 22 Other maternal side effects Show forest plot | 2 | 375 | Risk Ratio (M‐H, Fixed, 95% CI) | 0.87 [0.50, 1.50] |
| Analysis 9.22  Comparison 9 (1.11) PGE2 (all regimens) vs placebo/no treatment (all primiparae, unfavourable cervix), Outcome 22 Other maternal side effects. | ||||
| 22.1 PGE2 (once only) vs placebo/no treatment | 1 | 155 | Risk Ratio (M‐H, Fixed, 95% CI) | 0.48 [0.04, 5.20] |
| 22.2 PGE2 (repeated doses) vs placebo/no treatment | 1 | 220 | Risk Ratio (M‐H, Fixed, 95% CI) | 0.90 [0.52, 1.59] |
| 23 Postpartum haemorrhage Show forest plot | 2 | 420 | Risk Ratio (M‐H, Fixed, 95% CI) | 0.67 [0.24, 1.84] |
| Analysis 9.23  Comparison 9 (1.11) PGE2 (all regimens) vs placebo/no treatment (all primiparae, unfavourable cervix), Outcome 23 Postpartum haemorrhage. | ||||
| 23.2 PGE2 (repeated doses) vs placebo/no treatment | 2 | 420 | Risk Ratio (M‐H, Fixed, 95% CI) | 0.67 [0.24, 1.84] |
| Outcome or subgroup title | No. of studies | No. of participants | Statistical method | Effect size |
| 1 Vaginal delivery not achieved within 24 hours Show forest plot | 1 | 187 | Risk Ratio (M‐H, Fixed, 95% CI) | 0.20 [0.13, 0.29] |
| Analysis 10.1  Comparison 10 (1.12) PGE2 (all regimens) vs placebo/no treatment (all primiparae, favourable cervix), Outcome 1 Vaginal delivery not achieved within 24 hours. | ||||
| 1.2 PGE2 (repeated doses) vs placebo/no treatment | 1 | 187 | Risk Ratio (M‐H, Fixed, 95% CI) | 0.20 [0.13, 0.29] |
| 3 Caesarean section Show forest plot | 1 | 187 | Risk Ratio (M‐H, Fixed, 95% CI) | 0.30 [0.03, 2.80] |
| Analysis 10.3  Comparison 10 (1.12) PGE2 (all regimens) vs placebo/no treatment (all primiparae, favourable cervix), Outcome 3 Caesarean section. | ||||
| 3.2 PGE2 (repeated doses) vs placebo/no treatment | 1 | 187 | Risk Ratio (M‐H, Fixed, 95% CI) | 0.30 [0.03, 2.80] |
| Outcome or subgroup title | No. of studies | No. of participants | Statistical method | Effect size |
| 2 Uterine hyperstimulation with FHR changes Show forest plot | 1 | 30 | Risk Ratio (M‐H, Fixed, 95% CI) | 0.0 [0.0, 0.0] |
| Analysis 11.2  Comparison 11 (1.14) PGE2 (all regimens) vs placebo/no treatment (all primiparae, intact membranes, unfavourable cervix), Outcome 2 Uterine hyperstimulation with FHR changes. | ||||
| 2.2 PGE2 (repeated doses) vs placebo/no treatment | 1 | 30 | Risk Ratio (M‐H, Fixed, 95% CI) | 0.0 [0.0, 0.0] |
| 3 Caesarean section Show forest plot | 2 | 77 | Risk Ratio (M‐H, Fixed, 95% CI) | 0.84 [0.51, 1.38] |
| Analysis 11.3  Comparison 11 (1.14) PGE2 (all regimens) vs placebo/no treatment (all primiparae, intact membranes, unfavourable cervix), Outcome 3 Caesarean section. | ||||
| 3.1 PGE2 (once only) vs placebo/no treatment | 1 | 47 | Risk Ratio (M‐H, Fixed, 95% CI) | 0.95 [0.56, 1.63] |
| 3.2 PGE2 (repeated doses) vs placebo/no treatment | 1 | 30 | Risk Ratio (M‐H, Fixed, 95% CI) | 0.57 [0.17, 1.87] |
| Outcome or subgroup title | No. of studies | No. of participants | Statistical method | Effect size |
| 1 Vaginal delivery not achieved within 24 hours Show forest plot | 1 | 187 | Risk Ratio (M‐H, Fixed, 95% CI) | 0.20 [0.13, 0.29] |
| Analysis 12.1  Comparison 12 (1.15) PGE2 (all regimens) vs placebo/no treatment (all primiparae, intact membranes, favourable cervix), Outcome 1 Vaginal delivery not achieved within 24 hours. | ||||
| 1.2 PGE2 (repeated doses) vs placebo/no treatment | 1 | 187 | Risk Ratio (M‐H, Fixed, 95% CI) | 0.20 [0.13, 0.29] |
| 3 Caesarean section Show forest plot | 1 | 187 | Risk Ratio (M‐H, Fixed, 95% CI) | 0.30 [0.03, 2.80] |
| Analysis 12.3  Comparison 12 (1.15) PGE2 (all regimens) vs placebo/no treatment (all primiparae, intact membranes, favourable cervix), Outcome 3 Caesarean section. | ||||
| 3.2 PGE2 (repeated doses) vs placebo/no treatment | 1 | 187 | Risk Ratio (M‐H, Fixed, 95% CI) | 0.30 [0.03, 2.80] |
| Outcome or subgroup title | No. of studies | No. of participants | Statistical method | Effect size |
| 3 Caesarean section Show forest plot | 1 | 1507 | Risk Ratio (M‐H, Fixed, 95% CI) | 0.99 [0.77, 1.27] |
| Analysis 13.3  Comparison 13 (1.16) PGE2 (all regimens) vs placebo/no treatment (all primiparae, ruptured memb., variable/undefined cervix), Outcome 3 Caesarean section. | ||||
| 3.2 PGE2 (repeated doses) vs placebo/no treatment | 1 | 1507 | Risk Ratio (M‐H, Fixed, 95% CI) | 0.99 [0.77, 1.27] |
| 4 Serious neonatal morbidity or perinatal death Show forest plot | 1 | 1507 | Risk Ratio (M‐H, Fixed, 95% CI) | 0.34 [0.01, 8.22] |
| Analysis 13.4  Comparison 13 (1.16) PGE2 (all regimens) vs placebo/no treatment (all primiparae, ruptured memb., variable/undefined cervix), Outcome 4 Serious neonatal morbidity or perinatal death. | ||||
| 4.2 PGE2 (repeated doses) vs placebo/no treatment | 1 | 1507 | Risk Ratio (M‐H, Fixed, 95% CI) | 0.34 [0.01, 8.22] |
| 8 Uterine hyperstimulation without FHR changes Show forest plot | 1 | 1507 | Risk Ratio (M‐H, Fixed, 95% CI) | 1.01 [0.25, 4.01] |
| Analysis 13.8  Comparison 13 (1.16) PGE2 (all regimens) vs placebo/no treatment (all primiparae, ruptured memb., variable/undefined cervix), Outcome 8 Uterine hyperstimulation without FHR changes. | ||||
| 8.2 PGE2 (repeated doses) vs placebo/no treatment | 1 | 1507 | Risk Ratio (M‐H, Fixed, 95% CI) | 1.01 [0.25, 4.01] |
| 9 Uterine rupture Show forest plot | 1 | 1507 | Risk Ratio (M‐H, Fixed, 95% CI) | 0.0 [0.0, 0.0] |
| Analysis 13.9  Comparison 13 (1.16) PGE2 (all regimens) vs placebo/no treatment (all primiparae, ruptured memb., variable/undefined cervix), Outcome 9 Uterine rupture. | ||||
| 9.2 PGE2 (repeated doses) vs placebo/no treatment | 1 | 1507 | Risk Ratio (M‐H, Fixed, 95% CI) | 0.0 [0.0, 0.0] |
| 10 Epidural analgesia Show forest plot | 1 | 1507 | Risk Ratio (M‐H, Fixed, 95% CI) | 1.01 [0.93, 1.10] |
| Analysis 13.10  Comparison 13 (1.16) PGE2 (all regimens) vs placebo/no treatment (all primiparae, ruptured memb., variable/undefined cervix), Outcome 10 Epidural analgesia. | ||||
| 10.2 PGE2 (repeated doses) vs placebo/no treatment | 1 | 1507 | Risk Ratio (M‐H, Fixed, 95% CI) | 1.01 [0.93, 1.10] |
| 11 Instrumental vaginal delivery Show forest plot | 1 | 1507 | Risk Ratio (M‐H, Fixed, 95% CI) | 0.98 [0.83, 1.16] |
| Analysis 13.11  Comparison 13 (1.16) PGE2 (all regimens) vs placebo/no treatment (all primiparae, ruptured memb., variable/undefined cervix), Outcome 11 Instrumental vaginal delivery. | ||||
| 11.2 PGE2 (repeated doses) vs placebo/no treatment | 1 | 1507 | Risk Ratio (M‐H, Fixed, 95% CI) | 0.98 [0.83, 1.16] |
| 16 Perinatal death Show forest plot | 1 | 1507 | Risk Ratio (M‐H, Fixed, 95% CI) | 0.34 [0.01, 8.22] |
| Analysis 13.16  Comparison 13 (1.16) PGE2 (all regimens) vs placebo/no treatment (all primiparae, ruptured memb., variable/undefined cervix), Outcome 16 Perinatal death. | ||||
| 16.2 PGE2 (repeated doses) vs placebo/no treatment | 1 | 1507 | Risk Ratio (M‐H, Fixed, 95% CI) | 0.34 [0.01, 8.22] |
| 18 Maternal side‐effects (all) Show forest plot | 1 | 1507 | Risk Ratio (M‐H, Fixed, 95% CI) | 2.35 [0.61, 9.05] |
| Analysis 13.18  Comparison 13 (1.16) PGE2 (all regimens) vs placebo/no treatment (all primiparae, ruptured memb., variable/undefined cervix), Outcome 18 Maternal side‐effects (all). | ||||
| 18.2 PGE2 (repeated doses) vs placebo/no treatment | 1 | 1507 | Risk Ratio (M‐H, Fixed, 95% CI) | 2.35 [0.61, 9.05] |
| 20 Vomitting (maternal) Show forest plot | 1 | 1507 | Risk Ratio (M‐H, Fixed, 95% CI) | 1.68 [0.40, 7.00] |
| Analysis 13.20  Comparison 13 (1.16) PGE2 (all regimens) vs placebo/no treatment (all primiparae, ruptured memb., variable/undefined cervix), Outcome 20 Vomitting (maternal). | ||||
| 20.2 PGE2 (repeated doses) vs placebo/no treatment | 1 | 1507 | Risk Ratio (M‐H, Fixed, 95% CI) | 1.68 [0.40, 7.00] |
| 21 Diarrhoea (maternal) Show forest plot | 1 | 1507 | Risk Ratio (M‐H, Fixed, 95% CI) | 5.03 [0.24, 104.66] |
| Analysis 13.21  Comparison 13 (1.16) PGE2 (all regimens) vs placebo/no treatment (all primiparae, ruptured memb., variable/undefined cervix), Outcome 21 Diarrhoea (maternal). | ||||
| 21.2 PGE2 (repeated doses) vs placebo/no treatment | 1 | 1507 | Risk Ratio (M‐H, Fixed, 95% CI) | 5.03 [0.24, 104.66] |
| 23 Postpartum haemorrhage Show forest plot | 1 | 1507 | Risk Ratio (M‐H, Fixed, 95% CI) | 1.84 [1.12, 3.03] |
| Analysis 13.23  Comparison 13 (1.16) PGE2 (all regimens) vs placebo/no treatment (all primiparae, ruptured memb., variable/undefined cervix), Outcome 23 Postpartum haemorrhage. | ||||
| 23.2 PGE2 (repeated doses) vs placebo/no treatment | 1 | 1507 | Risk Ratio (M‐H, Fixed, 95% CI) | 1.84 [1.12, 3.03] |
| Outcome or subgroup title | No. of studies | No. of participants | Statistical method | Effect size |
| 2 Uterine hyperstimulation with FHR changes Show forest plot | 1 | 155 | Risk Ratio (M‐H, Fixed, 95% CI) | 0.0 [0.0, 0.0] |
| Analysis 14.2  Comparison 14 (1.17) PGE2 (all regimens) vs placebo/no treatment (all primiparae, ruptured membranes, unfavourable cervix), Outcome 2 Uterine hyperstimulation with FHR changes. | ||||
| 2.1 PGE2 (once only) vs placebo/no treatment | 1 | 155 | Risk Ratio (M‐H, Fixed, 95% CI) | 0.0 [0.0, 0.0] |
| 3 Caesarean section Show forest plot | 3 | 575 | Risk Ratio (M‐H, Fixed, 95% CI) | 0.91 [0.60, 1.39] |
| Analysis 14.3  Comparison 14 (1.17) PGE2 (all regimens) vs placebo/no treatment (all primiparae, ruptured membranes, unfavourable cervix), Outcome 3 Caesarean section. | ||||
| 3.1 PGE2 (once only) vs placebo/no treatment | 1 | 155 | Risk Ratio (M‐H, Fixed, 95% CI) | 1.05 [0.49, 2.23] |
| 3.2 PGE2 (repeated doses) vs placebo/no treatment | 2 | 420 | Risk Ratio (M‐H, Fixed, 95% CI) | 0.86 [0.51, 1.43] |
| 4 Serious neonatal morbidity or perinatal death Show forest plot | 1 | 220 | Risk Ratio (M‐H, Fixed, 95% CI) | 0.0 [0.0, 0.0] |
| Analysis 14.4  Comparison 14 (1.17) PGE2 (all regimens) vs placebo/no treatment (all primiparae, ruptured membranes, unfavourable cervix), Outcome 4 Serious neonatal morbidity or perinatal death. | ||||
| 4.2 PGE2 (repeated doses) vs placebo/no treatment | 1 | 220 | Risk Ratio (M‐H, Fixed, 95% CI) | 0.0 [0.0, 0.0] |
| 7 Oxytocin augmentation Show forest plot | 2 | 375 | Risk Ratio (M‐H, Fixed, 95% CI) | 0.62 [0.49, 0.79] |
| Analysis 14.7  Comparison 14 (1.17) PGE2 (all regimens) vs placebo/no treatment (all primiparae, ruptured membranes, unfavourable cervix), Outcome 7 Oxytocin augmentation. | ||||
| 7.1 PGE2 (once only) vs placebo/no treatment | 1 | 155 | Risk Ratio (M‐H, Fixed, 95% CI) | 0.63 [0.45, 0.90] |
| 7.2 PGE2 (repeated doses) vs placebo/no treatment | 1 | 220 | Risk Ratio (M‐H, Fixed, 95% CI) | 0.61 [0.43, 0.85] |
| 8 Uterine hyperstimulation without FHR changes Show forest plot | 1 | 155 | Risk Ratio (M‐H, Fixed, 95% CI) | 0.0 [0.0, 0.0] |
| Analysis 14.8  Comparison 14 (1.17) PGE2 (all regimens) vs placebo/no treatment (all primiparae, ruptured membranes, unfavourable cervix), Outcome 8 Uterine hyperstimulation without FHR changes. | ||||
| 8.1 PGE2 (once only) vs placebo/no treatment | 1 | 155 | Risk Ratio (M‐H, Fixed, 95% CI) | 0.0 [0.0, 0.0] |
| 10 Epidural analgesia Show forest plot | 2 | 420 | Risk Ratio (M‐H, Fixed, 95% CI) | 2.35 [1.75, 3.16] |
| Analysis 14.10  Comparison 14 (1.17) PGE2 (all regimens) vs placebo/no treatment (all primiparae, ruptured membranes, unfavourable cervix), Outcome 10 Epidural analgesia. | ||||
| 10.2 PGE2 (repeated doses) vs placebo/no treatment | 2 | 420 | Risk Ratio (M‐H, Fixed, 95% CI) | 2.35 [1.75, 3.16] |
| 11 Instrumental vaginal delivery Show forest plot | 1 | 200 | Risk Ratio (M‐H, Fixed, 95% CI) | 0.79 [0.43, 1.46] |
| Analysis 14.11  Comparison 14 (1.17) PGE2 (all regimens) vs placebo/no treatment (all primiparae, ruptured membranes, unfavourable cervix), Outcome 11 Instrumental vaginal delivery. | ||||
| 11.2 PGE2 (repeated doses) vs placebo/no treatment | 1 | 200 | Risk Ratio (M‐H, Fixed, 95% CI) | 0.79 [0.43, 1.46] |
| 12 Meconium stained liquor Show forest plot | 2 | 420 | Risk Ratio (M‐H, Fixed, 95% CI) | 0.57 [0.29, 1.13] |
| Analysis 14.12  Comparison 14 (1.17) PGE2 (all regimens) vs placebo/no treatment (all primiparae, ruptured membranes, unfavourable cervix), Outcome 12 Meconium stained liquor. | ||||
| 12.2 PGE2 (repeated doses) vs placebo/no treatment | 2 | 420 | Risk Ratio (M‐H, Fixed, 95% CI) | 0.57 [0.29, 1.13] |
| 13 Apgar score <7 at 5 minutes Show forest plot | 2 | 375 | Risk Ratio (M‐H, Fixed, 95% CI) | 0.74 [0.17, 3.27] |
| Analysis 14.13  Comparison 14 (1.17) PGE2 (all regimens) vs placebo/no treatment (all primiparae, ruptured membranes, unfavourable cervix), Outcome 13 Apgar score <7 at 5 minutes. | ||||
| 13.1 PGE2 (once only) vs placebo/no treatment | 1 | 155 | Risk Ratio (M‐H, Fixed, 95% CI) | 0.96 [0.06, 15.11] |
| 13.2 PGE2 (repeated doses) vs placebo/no treatment | 1 | 220 | Risk Ratio (M‐H, Fixed, 95% CI) | 0.67 [0.11, 3.91] |
| 14 Neonatal intensive care unit admission Show forest plot | 2 | 375 | Risk Ratio (M‐H, Fixed, 95% CI) | 0.91 [0.44, 1.89] |
| Analysis 14.14  Comparison 14 (1.17) PGE2 (all regimens) vs placebo/no treatment (all primiparae, ruptured membranes, unfavourable cervix), Outcome 14 Neonatal intensive care unit admission. | ||||
| 14.1 PGE2 (once only) vs placebo/no treatment | 1 | 155 | Risk Ratio (M‐H, Fixed, 95% CI) | 0.96 [0.32, 2.85] |
| 14.2 PGE2 (repeated doses) vs placebo/no treatment | 1 | 220 | Risk Ratio (M‐H, Fixed, 95% CI) | 0.88 [0.33, 2.33] |
| 16 Perinatal death Show forest plot | 1 | 200 | Risk Ratio (M‐H, Fixed, 95% CI) | 0.0 [0.0, 0.0] |
| Analysis 14.16  Comparison 14 (1.17) PGE2 (all regimens) vs placebo/no treatment (all primiparae, ruptured membranes, unfavourable cervix), Outcome 16 Perinatal death. | ||||
| 16.1 PGE2 (repeated doses) vs placebo/no treatment | 1 | 200 | Risk Ratio (M‐H, Fixed, 95% CI) | 0.0 [0.0, 0.0] |
| 18 Maternal side‐effects (all) Show forest plot | 2 | 375 | Risk Ratio (M‐H, Fixed, 95% CI) | 0.87 [0.50, 1.50] |
| Analysis 14.18  Comparison 14 (1.17) PGE2 (all regimens) vs placebo/no treatment (all primiparae, ruptured membranes, unfavourable cervix), Outcome 18 Maternal side‐effects (all). | ||||
| 18.1 PGE2 (once only) vs placebo/no treatment | 1 | 155 | Risk Ratio (M‐H, Fixed, 95% CI) | 0.48 [0.04, 5.20] |
| 18.2 PGE2 (repeated doses) vs placebo/no treatment | 1 | 220 | Risk Ratio (M‐H, Fixed, 95% CI) | 0.90 [0.52, 1.59] |
| 22 Other maternal side effects Show forest plot | 2 | 375 | Risk Ratio (M‐H, Fixed, 95% CI) | 0.87 [0.50, 1.50] |
| Analysis 14.22  Comparison 14 (1.17) PGE2 (all regimens) vs placebo/no treatment (all primiparae, ruptured membranes, unfavourable cervix), Outcome 22 Other maternal side effects. | ||||
| 22.1 PGE2 (once only) vs placebo/no treatment | 1 | 155 | Risk Ratio (M‐H, Fixed, 95% CI) | 0.48 [0.04, 5.20] |
| 22.2 PGE2 (repeated doses) vs placebo/no treatment | 1 | 220 | Risk Ratio (M‐H, Fixed, 95% CI) | 0.90 [0.52, 1.59] |
| 23 Postpartum haemorrhage Show forest plot | 2 | 420 | Risk Ratio (M‐H, Fixed, 95% CI) | 0.67 [0.24, 1.84] |
| Analysis 14.23  Comparison 14 (1.17) PGE2 (all regimens) vs placebo/no treatment (all primiparae, ruptured membranes, unfavourable cervix), Outcome 23 Postpartum haemorrhage. | ||||
| 23.2 PGE2 (repeated doses) vs placebo/no treatment | 2 | 420 | Risk Ratio (M‐H, Fixed, 95% CI) | 0.67 [0.24, 1.84] |
| Outcome or subgroup title | No. of studies | No. of participants | Statistical method | Effect size |
| 1 Vaginal delivery not achieved within 24 hours Show forest plot | 1 | 158 | Risk Ratio (M‐H, Fixed, 95% CI) | 0.04 [0.02, 0.12] |
| Analysis 15.1  Comparison 15 (1.19) PGE2 (all regimens) vs placebo/no treatment (all multiparae, without previous caesarean section), Outcome 1 Vaginal delivery not achieved within 24 hours. | ||||
| 1.2 PGE2 (repeated doses) vs placebo/no treatment | 1 | 158 | Risk Ratio (M‐H, Fixed, 95% CI) | 0.04 [0.02, 0.12] |
| 2 Uterine hyperstimulation with FHR changes Show forest plot | 1 | 20 | Risk Ratio (M‐H, Fixed, 95% CI) | 0.0 [0.0, 0.0] |
| Analysis 15.2  Comparison 15 (1.19) PGE2 (all regimens) vs placebo/no treatment (all multiparae, without previous caesarean section), Outcome 2 Uterine hyperstimulation with FHR changes. | ||||
| 2.2 PGE2 (repeated doses) vs placebo/no treatment | 1 | 20 | Risk Ratio (M‐H, Fixed, 95% CI) | 0.0 [0.0, 0.0] |
| 3 Caesarean section Show forest plot | 4 | 1198 | Risk Ratio (M‐H, Fixed, 95% CI) | 0.88 [0.51, 1.55] |
| Analysis 15.3  Comparison 15 (1.19) PGE2 (all regimens) vs placebo/no treatment (all multiparae, without previous caesarean section), Outcome 3 Caesarean section. | ||||
| 3.1 PGE2 (once only) vs placebo/no treatment | 1 | 7 | Risk Ratio (M‐H, Fixed, 95% CI) | 1.33 [0.13, 13.74] |
| 3.2 PGE2 (repeated doses) vs placebo/no treatment | 3 | 1191 | Risk Ratio (M‐H, Fixed, 95% CI) | 0.87 [0.49, 1.54] |
| 4 Serious neonatal morbidity or perinatal death Show forest plot | 1 | 1013 | Risk Ratio (M‐H, Fixed, 95% CI) | 0.33 [0.01, 8.12] |
| Analysis 15.4  Comparison 15 (1.19) PGE2 (all regimens) vs placebo/no treatment (all multiparae, without previous caesarean section), Outcome 4 Serious neonatal morbidity or perinatal death. | ||||
| 4.2 PGE2 (repeated doses) vs placebo/no treatment | 1 | 1013 | Risk Ratio (M‐H, Fixed, 95% CI) | 0.33 [0.01, 8.12] |
| 5 Uterine rupture Show forest plot | 1 | 1013 | Risk Ratio (M‐H, Fixed, 95% CI) | 0.0 [0.0, 0.0] |
| Analysis 15.5  Comparison 15 (1.19) PGE2 (all regimens) vs placebo/no treatment (all multiparae, without previous caesarean section), Outcome 5 Uterine rupture. | ||||
| 5.2 PGE2 (repeated doses) vs placebo/no treatment | 1 | 1013 | Risk Ratio (M‐H, Fixed, 95% CI) | 0.0 [0.0, 0.0] |
| 6 Epidural analgesia Show forest plot | 1 | 1013 | Risk Ratio (M‐H, Fixed, 95% CI) | 1.05 [0.88, 1.24] |
| Analysis 15.6  Comparison 15 (1.19) PGE2 (all regimens) vs placebo/no treatment (all multiparae, without previous caesarean section), Outcome 6 Epidural analgesia. | ||||
| 6.2 PGE2 (repeated doses) vs placebo/no treatment | 1 | 1013 | Risk Ratio (M‐H, Fixed, 95% CI) | 1.05 [0.88, 1.24] |
| 7 Oxytocin augmentation Show forest plot | 1 | 42 | Risk Ratio (M‐H, Fixed, 95% CI) | 0.42 [0.18, 0.97] |
| Analysis 15.7  Comparison 15 (1.19) PGE2 (all regimens) vs placebo/no treatment (all multiparae, without previous caesarean section), Outcome 7 Oxytocin augmentation. | ||||
| 7.1 PGE2 (once only) vs placebo/no treatment | 1 | 42 | Risk Ratio (M‐H, Fixed, 95% CI) | 0.42 [0.18, 0.97] |
| 8 Uterine hyperstimulation without FHR changes Show forest plot | 1 | 1013 | Risk Ratio (M‐H, Fixed, 95% CI) | 10.94 [0.61, 197.24] |
| Analysis 15.8  Comparison 15 (1.19) PGE2 (all regimens) vs placebo/no treatment (all multiparae, without previous caesarean section), Outcome 8 Uterine hyperstimulation without FHR changes. | ||||
| 8.2 PGE2 (repeated doses) vs placebo/no treatment | 1 | 1013 | Risk Ratio (M‐H, Fixed, 95% CI) | 10.94 [0.61, 197.24] |
| 11 Instrumental vaginal delivery Show forest plot | 1 | 1013 | Risk Ratio (M‐H, Fixed, 95% CI) | 1.23 [0.77, 1.95] |
| Analysis 15.11  Comparison 15 (1.19) PGE2 (all regimens) vs placebo/no treatment (all multiparae, without previous caesarean section), Outcome 11 Instrumental vaginal delivery. | ||||
| 11.2 PGE2 (repeated doses) vs placebo/no treatment | 1 | 1013 | Risk Ratio (M‐H, Fixed, 95% CI) | 1.23 [0.77, 1.95] |
| 16 Perinatal death Show forest plot | 1 | 1013 | Risk Ratio (M‐H, Fixed, 95% CI) | 0.33 [0.01, 8.12] |
| Analysis 15.16  Comparison 15 (1.19) PGE2 (all regimens) vs placebo/no treatment (all multiparae, without previous caesarean section), Outcome 16 Perinatal death. | ||||
| 16.2 PGE2 (repeated doses) vs placebo/no treatment | 1 | 1013 | Risk Ratio (M‐H, Fixed, 95% CI) | 0.33 [0.01, 8.12] |
| 18 Maternal side‐effects (all) Show forest plot | 1 | 2026 | Risk Ratio (M‐H, Fixed, 95% CI) | 0.99 [0.06, 15.87] |
| Analysis 15.18  Comparison 15 (1.19) PGE2 (all regimens) vs placebo/no treatment (all multiparae, without previous caesarean section), Outcome 18 Maternal side‐effects (all). | ||||
| 18.2 PGE2 (repeated doses) vs placebo/no treatment | 1 | 2026 | Risk Ratio (M‐H, Fixed, 95% CI) | 0.99 [0.06, 15.87] |
| 20 Vomitting (maternal) Show forest plot | 1 | 1013 | Risk Ratio (M‐H, Fixed, 95% CI) | 0.33 [0.01, 8.12] |
| Analysis 15.20  Comparison 15 (1.19) PGE2 (all regimens) vs placebo/no treatment (all multiparae, without previous caesarean section), Outcome 20 Vomitting (maternal). | ||||
| 20.2 PGE2 (repeated doses) vs placebo/no treatment | 1 | 1013 | Risk Ratio (M‐H, Fixed, 95% CI) | 0.33 [0.01, 8.12] |
| 21 Diarrhoea (maternal) Show forest plot | 1 | 1013 | Risk Ratio (M‐H, Fixed, 95% CI) | 2.98 [0.12, 73.04] |
| Analysis 15.21  Comparison 15 (1.19) PGE2 (all regimens) vs placebo/no treatment (all multiparae, without previous caesarean section), Outcome 21 Diarrhoea (maternal). | ||||
| 21.2 PGE2 (repeated doses) vs placebo/no treatment | 1 | 1013 | Risk Ratio (M‐H, Fixed, 95% CI) | 2.98 [0.12, 73.04] |
| 23 Postpartum haemorrhage Show forest plot | 1 | 1013 | Risk Ratio (M‐H, Fixed, 95% CI) | 1.22 [0.59, 2.52] |
| Analysis 15.23  Comparison 15 (1.19) PGE2 (all regimens) vs placebo/no treatment (all multiparae, without previous caesarean section), Outcome 23 Postpartum haemorrhage. | ||||
| 23.2 PGE2 (repeated doses) vs placebo/no treatment | 1 | 1013 | Risk Ratio (M‐H, Fixed, 95% CI) | 1.22 [0.59, 2.52] |
| Outcome or subgroup title | No. of studies | No. of participants | Statistical method | Effect size |
| 2 Uterine hyperstimulation with FHR changes Show forest plot | 1 | 20 | Risk Ratio (M‐H, Fixed, 95% CI) | 0.0 [0.0, 0.0] |
| Analysis 16.2  Comparison 16 (1.20) PGE2 (all regimens) vs placebo/no treatment (all multiparae, unfavourable cervix), Outcome 2 Uterine hyperstimulation with FHR changes. | ||||
| 2.2 PGE2 (repeated doses) vs placebo/no treatment | 1 | 20 | Risk Ratio (M‐H, Fixed, 95% CI) | 0.0 [0.0, 0.0] |
| 3 Caesarean section Show forest plot | 2 | 27 | Risk Ratio (M‐H, Fixed, 95% CI) | 1.95 [0.30, 12.59] |
| Analysis 16.3  Comparison 16 (1.20) PGE2 (all regimens) vs placebo/no treatment (all multiparae, unfavourable cervix), Outcome 3 Caesarean section. | ||||
| 3.1 PGE2 (once only) vs placebo/no treatment | 1 | 7 | Risk Ratio (M‐H, Fixed, 95% CI) | 1.33 [0.13, 13.74] |
| 3.2 PGE2 (repeated doses) vs placebo/no treatment | 1 | 20 | Risk Ratio (M‐H, Fixed, 95% CI) | 3.0 [0.14, 65.90] |
| Outcome or subgroup title | No. of studies | No. of participants | Statistical method | Effect size |
| 1 Vaginal delivery not achieved within 24 hours Show forest plot | 1 | 158 | Risk Ratio (M‐H, Fixed, 95% CI) | 0.04 [0.02, 0.12] |
| Analysis 17.1  Comparison 17 (1.21) PGE2 (all regimens) vs placebo/no treatment (all multiparae, favourable cervix), Outcome 1 Vaginal delivery not achieved within 24 hours. | ||||
| 1.2 PGE2 (repeated doses) vs placebo/no treatment | 1 | 158 | Risk Ratio (M‐H, Fixed, 95% CI) | 0.04 [0.02, 0.12] |
| 3 Caesarean section Show forest plot | 1 | 158 | Risk Ratio (M‐H, Fixed, 95% CI) | 2.85 [0.12, 69.00] |
| Analysis 17.3  Comparison 17 (1.21) PGE2 (all regimens) vs placebo/no treatment (all multiparae, favourable cervix), Outcome 3 Caesarean section. | ||||
| 3.2 PGE2 (repeated doses) vs placebo/no treatment | 1 | 158 | Risk Ratio (M‐H, Fixed, 95% CI) | 2.85 [0.12, 69.00] |
| 7 Oxytocin augmentation Show forest plot | 1 | 42 | Risk Ratio (M‐H, Fixed, 95% CI) | 0.42 [0.18, 0.97] |
| Analysis 17.7  Comparison 17 (1.21) PGE2 (all regimens) vs placebo/no treatment (all multiparae, favourable cervix), Outcome 7 Oxytocin augmentation. | ||||
| 7.1 PGE2 (once only) vs placebo/no treatment | 1 | 42 | Risk Ratio (M‐H, Fixed, 95% CI) | 0.42 [0.18, 0.97] |
| Outcome or subgroup title | No. of studies | No. of participants | Statistical method | Effect size |
| 2 Uterine hyperstimulation with FHR changes Show forest plot | 1 | 20 | Risk Ratio (M‐H, Fixed, 95% CI) | 0.0 [0.0, 0.0] |
| Analysis 18.2  Comparison 18 (1.23) PGE2 (all regimens) vs placebo/no treatment (all multiparae, intact membranes, unfavourable cervix), Outcome 2 Uterine hyperstimulation with FHR changes. | ||||
| 2.2 PGE2 (repeated doses) vs placebo/no treatment | 1 | 20 | Risk Ratio (M‐H, Fixed, 95% CI) | 0.0 [0.0, 0.0] |
| 3 Caesarean section Show forest plot | 2 | 27 | Risk Ratio (M‐H, Fixed, 95% CI) | 1.95 [0.30, 12.59] |
| Analysis 18.3  Comparison 18 (1.23) PGE2 (all regimens) vs placebo/no treatment (all multiparae, intact membranes, unfavourable cervix), Outcome 3 Caesarean section. | ||||
| 3.1 PGE2 (once only) vs placebo/no treatment | 1 | 7 | Risk Ratio (M‐H, Fixed, 95% CI) | 1.33 [0.13, 13.74] |
| 3.2 PGE2 (repeated doses) vs placebo/no treatment | 1 | 20 | Risk Ratio (M‐H, Fixed, 95% CI) | 3.0 [0.14, 65.90] |
| Outcome or subgroup title | No. of studies | No. of participants | Statistical method | Effect size |
| 1 Vaginal delivery not achieved within 24 hours Show forest plot | 1 | 158 | Risk Ratio (M‐H, Fixed, 95% CI) | 0.04 [0.02, 0.12] |
| Analysis 19.1  Comparison 19 (1.24) PGE2 (all regimens) vs placebo/no treatment (all multiparae, intact membranes, favourable cervix), Outcome 1 Vaginal delivery not achieved within 24 hours. | ||||
| 1.2 PGE2 (repeated doses) vs placebo/no treatment | 1 | 158 | Risk Ratio (M‐H, Fixed, 95% CI) | 0.04 [0.02, 0.12] |
| 3 Caesarean section Show forest plot | 1 | 158 | Risk Ratio (M‐H, Fixed, 95% CI) | 2.85 [0.12, 69.00] |
| Analysis 19.3  Comparison 19 (1.24) PGE2 (all regimens) vs placebo/no treatment (all multiparae, intact membranes, favourable cervix), Outcome 3 Caesarean section. | ||||
| 3.2 PGE2 (repeated doses) vs placebo/no treatment | 1 | 158 | Risk Ratio (M‐H, Fixed, 95% CI) | 2.85 [0.12, 69.00] |
| Outcome or subgroup title | No. of studies | No. of participants | Statistical method | Effect size |
| 3 Caesarean section Show forest plot | 1 | 1013 | Risk Ratio (M‐H, Fixed, 95% CI) | 0.78 [0.43, 1.42] |
| Analysis 20.3  Comparison 20 (1.25) PGE2 (all regimens) vs placebo/no treatment (all multi., ruptured membranes, variable/undefined cervix), Outcome 3 Caesarean section. | ||||
| 3.2 PGE2 (repeated doses) vs placebo/no treatment | 1 | 1013 | Risk Ratio (M‐H, Fixed, 95% CI) | 0.78 [0.43, 1.42] |
| 4 Serious neonatal morbidity or perinatal death Show forest plot | 1 | 1013 | Risk Ratio (M‐H, Fixed, 95% CI) | 0.33 [0.01, 8.12] |
| Analysis 20.4  Comparison 20 (1.25) PGE2 (all regimens) vs placebo/no treatment (all multi., ruptured membranes, variable/undefined cervix), Outcome 4 Serious neonatal morbidity or perinatal death. | ||||
| 4.2 PGE2 (repeated doses) vs placebo/no treatment | 1 | 1013 | Risk Ratio (M‐H, Fixed, 95% CI) | 0.33 [0.01, 8.12] |
| 8 Uterine hyperstimulation without FHR changes Show forest plot | 1 | 1013 | Risk Ratio (M‐H, Fixed, 95% CI) | 10.94 [0.61, 197.24] |
| Analysis 20.8  Comparison 20 (1.25) PGE2 (all regimens) vs placebo/no treatment (all multi., ruptured membranes, variable/undefined cervix), Outcome 8 Uterine hyperstimulation without FHR changes. | ||||
| 8.2 PGE2 (repeated doses) vs placebo/no treatment | 1 | 1013 | Risk Ratio (M‐H, Fixed, 95% CI) | 10.94 [0.61, 197.24] |
| 9 Uterine rupture Show forest plot | 1 | 1013 | Risk Ratio (M‐H, Fixed, 95% CI) | 0.0 [0.0, 0.0] |
| Analysis 20.9  Comparison 20 (1.25) PGE2 (all regimens) vs placebo/no treatment (all multi., ruptured membranes, variable/undefined cervix), Outcome 9 Uterine rupture. | ||||
| 9.2 PGE2 (repeated doses) vs placebo/no treatment | 1 | 1013 | Risk Ratio (M‐H, Fixed, 95% CI) | 0.0 [0.0, 0.0] |
| 10 Epidural analgesia Show forest plot | 1 | 1013 | Risk Ratio (M‐H, Fixed, 95% CI) | 1.05 [0.88, 1.24] |
| Analysis 20.10  Comparison 20 (1.25) PGE2 (all regimens) vs placebo/no treatment (all multi., ruptured membranes, variable/undefined cervix), Outcome 10 Epidural analgesia. | ||||
| 10.2 PGE2 (repeated doses) vs placebo/no treatment | 1 | 1013 | Risk Ratio (M‐H, Fixed, 95% CI) | 1.05 [0.88, 1.24] |
| 11 Instrumental vaginal delivery Show forest plot | 1 | 1013 | Risk Ratio (M‐H, Fixed, 95% CI) | 1.23 [0.77, 1.95] |
| Analysis 20.11  Comparison 20 (1.25) PGE2 (all regimens) vs placebo/no treatment (all multi., ruptured membranes, variable/undefined cervix), Outcome 11 Instrumental vaginal delivery. | ||||
| 11.2 PGE2 (repeated doses) vs placebo/no treatment | 1 | 1013 | Risk Ratio (M‐H, Fixed, 95% CI) | 1.23 [0.77, 1.95] |
| 16 Perinatal death Show forest plot | 1 | 1013 | Risk Ratio (M‐H, Fixed, 95% CI) | 0.33 [0.01, 8.12] |
| Analysis 20.16  Comparison 20 (1.25) PGE2 (all regimens) vs placebo/no treatment (all multi., ruptured membranes, variable/undefined cervix), Outcome 16 Perinatal death. | ||||
| 16.2 PGE2 (repeated doses) vs placebo/no treatment | 1 | 1013 | Risk Ratio (M‐H, Fixed, 95% CI) | 0.33 [0.01, 8.12] |
| 18 Maternal side‐effects (all) Show forest plot | 1 | 2026 | Risk Ratio (M‐H, Fixed, 95% CI) | 0.99 [0.06, 15.87] |
| Analysis 20.18  Comparison 20 (1.25) PGE2 (all regimens) vs placebo/no treatment (all multi., ruptured membranes, variable/undefined cervix), Outcome 18 Maternal side‐effects (all). | ||||
| 18.2 PGE2 (repeated doses) vs placebo/no treatment | 1 | 2026 | Risk Ratio (M‐H, Fixed, 95% CI) | 0.99 [0.06, 15.87] |
| 20 Vomitting (maternal) Show forest plot | 1 | 1013 | Risk Ratio (M‐H, Fixed, 95% CI) | 0.33 [0.01, 8.12] |
| Analysis 20.20  Comparison 20 (1.25) PGE2 (all regimens) vs placebo/no treatment (all multi., ruptured membranes, variable/undefined cervix), Outcome 20 Vomitting (maternal). | ||||
| 20.2 PGE2 (repeated doses) vs placebo/no treatment | 1 | 1013 | Risk Ratio (M‐H, Fixed, 95% CI) | 0.33 [0.01, 8.12] |
| 21 Diarrhoea (maternal) Show forest plot | 1 | 1013 | Risk Ratio (M‐H, Fixed, 95% CI) | 2.98 [0.12, 73.04] |
| Analysis 20.21  Comparison 20 (1.25) PGE2 (all regimens) vs placebo/no treatment (all multi., ruptured membranes, variable/undefined cervix), Outcome 21 Diarrhoea (maternal). | ||||
| 21.2 PGE2 (repeated doses) vs placebo/no treatment | 1 | 1013 | Risk Ratio (M‐H, Fixed, 95% CI) | 2.98 [0.12, 73.04] |
| 23 Postpartum haemorrhage Show forest plot | 1 | 1013 | Risk Ratio (M‐H, Fixed, 95% CI) | 1.22 [0.59, 2.52] |
| Analysis 20.23  Comparison 20 (1.25) PGE2 (all regimens) vs placebo/no treatment (all multi., ruptured membranes, variable/undefined cervix), Outcome 23 Postpartum haemorrhage. | ||||
| 23.2 PGE2 (repeated doses) vs placebo/no treatment | 1 | 1013 | Risk Ratio (M‐H, Fixed, 95% CI) | 1.22 [0.59, 2.52] |
| Outcome or subgroup title | No. of studies | No. of participants | Statistical method | Effect size |
| 2 Uterine hyperstimulation with FHR changes Show forest plot | 1 | 32 | Risk Ratio (M‐H, Fixed, 95% CI) | 3.0 [0.13, 68.57] |
| Analysis 22.2  Comparison 22 (2.1) PGF2a vs placebo (all women), Outcome 2 Uterine hyperstimulation with FHR changes. | ||||
| 3 Caesarean section Show forest plot | 3 | 387 | Risk Ratio (M‐H, Fixed, 95% CI) | 0.58 [0.29, 1.18] |
| Analysis 22.3  Comparison 22 (2.1) PGF2a vs placebo (all women), Outcome 3 Caesarean section. | ||||
| 6 Cervix unfavourable/unchanged after 12 to 24 hours Show forest plot | 1 | 90 | Risk Ratio (M‐H, Fixed, 95% CI) | 0.25 [0.13, 0.49] |
| Analysis 22.6  Comparison 22 (2.1) PGF2a vs placebo (all women), Outcome 6 Cervix unfavourable/unchanged after 12 to 24 hours. | ||||
| 7 Oxytocin augmentation Show forest plot | 2 | 122 | Risk Ratio (M‐H, Fixed, 95% CI) | 0.65 [0.53, 0.81] |
| Analysis 22.7  Comparison 22 (2.1) PGF2a vs placebo (all women), Outcome 7 Oxytocin augmentation. | ||||
| 10 Epidural analgesia Show forest plot | 3 | 387 | Risk Ratio (M‐H, Fixed, 95% CI) | 0.72 [0.53, 0.98] |
| Analysis 22.10  Comparison 22 (2.1) PGF2a vs placebo (all women), Outcome 10 Epidural analgesia. | ||||
| 11 Instrumental vaginal delivery Show forest plot | 2 | 355 | Risk Ratio (M‐H, Fixed, 95% CI) | 0.60 [0.43, 0.84] |
| Analysis 22.11  Comparison 22 (2.1) PGF2a vs placebo (all women), Outcome 11 Instrumental vaginal delivery. | ||||
| Outcome or subgroup title | No. of studies | No. of participants | Statistical method | Effect size |
| 2 Uterine hyperstimulation with FHR changes Show forest plot | 1 | 32 | Risk Ratio (M‐H, Fixed, 95% CI) | 3.0 [0.13, 68.57] |
| Analysis 23.2  Comparison 23 (2.2) PGF2a vs placebo (all women, unfavourable cervix), Outcome 2 Uterine hyperstimulation with FHR changes. | ||||
| 3 Caesarean section Show forest plot | 1 | 32 | Risk Ratio (M‐H, Fixed, 95% CI) | 0.33 [0.04, 2.87] |
| Analysis 23.3  Comparison 23 (2.2) PGF2a vs placebo (all women, unfavourable cervix), Outcome 3 Caesarean section. | ||||
| 7 Oxytocin augmentation Show forest plot | 1 | 32 | Risk Ratio (M‐H, Fixed, 95% CI) | 0.88 [0.71, 1.09] |
| Analysis 23.7  Comparison 23 (2.2) PGF2a vs placebo (all women, unfavourable cervix), Outcome 7 Oxytocin augmentation. | ||||
| 10 Epidural analgesia Show forest plot | 1 | 32 | Risk Ratio (M‐H, Fixed, 95% CI) | 0.85 [0.56, 1.27] |
| Analysis 23.10  Comparison 23 (2.2) PGF2a vs placebo (all women, unfavourable cervix), Outcome 10 Epidural analgesia. | ||||
| Outcome or subgroup title | No. of studies | No. of participants | Statistical method | Effect size |
| 2 Uterine hyperstimulation with FHR changes Show forest plot | 1 | 32 | Risk Ratio (M‐H, Fixed, 95% CI) | 3.0 [0.13, 68.57] |
| Analysis 24.2  Comparison 24 (2.10) PGF2a vs placebo (all primiparae), Outcome 2 Uterine hyperstimulation with FHR changes. | ||||
| 3 Caesarean section Show forest plot | 1 | 32 | Risk Ratio (M‐H, Fixed, 95% CI) | 0.33 [0.04, 2.87] |
| Analysis 24.3  Comparison 24 (2.10) PGF2a vs placebo (all primiparae), Outcome 3 Caesarean section. | ||||
| 7 Oxytocin augmentation Show forest plot | 1 | 32 | Risk Ratio (M‐H, Fixed, 95% CI) | 0.88 [0.71, 1.09] |
| Analysis 24.7  Comparison 24 (2.10) PGF2a vs placebo (all primiparae), Outcome 7 Oxytocin augmentation. | ||||
| 10 Epidural analgesia Show forest plot | 1 | 32 | Risk Ratio (M‐H, Fixed, 95% CI) | 0.85 [0.56, 1.27] |
| Analysis 24.10  Comparison 24 (2.10) PGF2a vs placebo (all primiparae), Outcome 10 Epidural analgesia. | ||||
| Outcome or subgroup title | No. of studies | No. of participants | Statistical method | Effect size |
| 2 Uterine hyperstimulation with FHR changes Show forest plot | 1 | 32 | Risk Ratio (M‐H, Fixed, 95% CI) | 3.0 [0.13, 68.57] |
| Analysis 25.2  Comparison 25 (2.11) PGF2a vs placebo (all primiparae, unfavourable cervix), Outcome 2 Uterine hyperstimulation with FHR changes. | ||||
| 3 Caesarean section Show forest plot | 1 | 32 | Risk Ratio (M‐H, Fixed, 95% CI) | 0.33 [0.04, 2.87] |
| Analysis 25.3  Comparison 25 (2.11) PGF2a vs placebo (all primiparae, unfavourable cervix), Outcome 3 Caesarean section. | ||||
| 7 Oxytocin augmentation Show forest plot | 1 | 32 | Risk Ratio (M‐H, Fixed, 95% CI) | 0.88 [0.71, 1.09] |
| Analysis 25.7  Comparison 25 (2.11) PGF2a vs placebo (all primiparae, unfavourable cervix), Outcome 7 Oxytocin augmentation. | ||||
| 10 Epidural analgesia Show forest plot | 1 | 32 | Risk Ratio (M‐H, Fixed, 95% CI) | 0.85 [0.56, 1.27] |
| Analysis 25.10  Comparison 25 (2.11) PGF2a vs placebo (all primiparae, unfavourable cervix), Outcome 10 Epidural analgesia. | ||||
| Outcome or subgroup title | No. of studies | No. of participants | Statistical method | Effect size |
| 1 Vaginal delivery not achieved within 24 hours Show forest plot | 1 | 75 | Risk Ratio (M‐H, Fixed, 95% CI) | 0.51 [0.05, 5.42] |
| Analysis 26.1  Comparison 26 (3.1) PGF2a vs PGE2 (all women), Outcome 1 Vaginal delivery not achieved within 24 hours. | ||||
| 2 Uterine hyperstimulation with FHR changes Show forest plot | 2 | 106 | Risk Ratio (M‐H, Fixed, 95% CI) | 1.0 [0.07, 14.64] |
| Analysis 26.2  Comparison 26 (3.1) PGF2a vs PGE2 (all women), Outcome 2 Uterine hyperstimulation with FHR changes. | ||||
| 3 Caesarean section Show forest plot | 2 | 107 | Risk Ratio (M‐H, Fixed, 95% CI) | 1.02 [0.47, 2.22] |
| Analysis 26.3  Comparison 26 (3.1) PGF2a vs PGE2 (all women), Outcome 3 Caesarean section. | ||||
| 7 Oxytocin augmentation Show forest plot | 1 | 32 | Risk Ratio (M‐H, Fixed, 95% CI) | 2.33 [1.21, 4.51] |
| Analysis 26.7  Comparison 26 (3.1) PGF2a vs PGE2 (all women), Outcome 7 Oxytocin augmentation. | ||||
| 10 Epidural analgesia Show forest plot | 1 | 32 | Risk Ratio (M‐H, Fixed, 95% CI) | 1.57 [0.82, 3.00] |
| Analysis 26.10  Comparison 26 (3.1) PGF2a vs PGE2 (all women), Outcome 10 Epidural analgesia. | ||||
| 13 Apgar score <7 at 5 minutes Show forest plot | 1 | 75 | Risk Ratio (M‐H, Fixed, 95% CI) | 0.21 [0.01, 4.14] |
| Analysis 26.13  Comparison 26 (3.1) PGF2a vs PGE2 (all women), Outcome 13 Apgar score <7 at 5 minutes. | ||||
| Outcome or subgroup title | No. of studies | No. of participants | Statistical method | Effect size |
| 1 Vaginal delivery not achieved within 24 hours Show forest plot | 1 | 75 | Risk Ratio (M‐H, Fixed, 95% CI) | 0.51 [0.05, 5.42] |
| Analysis 27.1  Comparison 27 (3.2) PGF2a vs PGE2 (all women, unfavourable cervix), Outcome 1 Vaginal delivery not achieved within 24 hours. | ||||
| 2 Uterine hyperstimulation with FHR changes Show forest plot | 2 | 106 | Risk Ratio (M‐H, Fixed, 95% CI) | 1.0 [0.07, 14.64] |
| Analysis 27.2  Comparison 27 (3.2) PGF2a vs PGE2 (all women, unfavourable cervix), Outcome 2 Uterine hyperstimulation with FHR changes. | ||||
| 3 Caesarean section Show forest plot | 2 | 107 | Risk Ratio (M‐H, Fixed, 95% CI) | 1.02 [0.47, 2.22] |
| Analysis 27.3  Comparison 27 (3.2) PGF2a vs PGE2 (all women, unfavourable cervix), Outcome 3 Caesarean section. | ||||
| 7 Oxytocin augmentation Show forest plot | 1 | 32 | Risk Ratio (M‐H, Fixed, 95% CI) | 2.33 [1.21, 4.51] |
| Analysis 27.7  Comparison 27 (3.2) PGF2a vs PGE2 (all women, unfavourable cervix), Outcome 7 Oxytocin augmentation. | ||||
| 10 Epidural analgesia Show forest plot | 1 | 32 | Risk Ratio (M‐H, Fixed, 95% CI) | 1.57 [0.82, 3.00] |
| Analysis 27.10  Comparison 27 (3.2) PGF2a vs PGE2 (all women, unfavourable cervix), Outcome 10 Epidural analgesia. | ||||
| 13 Apgar score <7 at 5 minutes Show forest plot | 1 | 75 | Risk Ratio (M‐H, Fixed, 95% CI) | 0.21 [0.01, 4.14] |
| Analysis 27.13  Comparison 27 (3.2) PGF2a vs PGE2 (all women, unfavourable cervix), Outcome 13 Apgar score <7 at 5 minutes. | ||||
| Outcome or subgroup title | No. of studies | No. of participants | Statistical method | Effect size |
| 2 Uterine hyperstimulation with FHR changes Show forest plot | 1 | 32 | Risk Ratio (M‐H, Fixed, 95% CI) | 1.0 [0.07, 14.64] |
| Analysis 28.2  Comparison 28 (3.10) PGF2a vs PGE2 (all primiparae), Outcome 2 Uterine hyperstimulation with FHR changes. | ||||
| 3 Caesarean section Show forest plot | 1 | 32 | Risk Ratio (M‐H, Fixed, 95% CI) | 1.0 [0.07, 14.64] |
| Analysis 28.3  Comparison 28 (3.10) PGF2a vs PGE2 (all primiparae), Outcome 3 Caesarean section. | ||||
| 7 Oxytocin augmentation Show forest plot | 1 | 32 | Risk Ratio (M‐H, Fixed, 95% CI) | 2.33 [1.21, 4.51] |
| Analysis 28.7  Comparison 28 (3.10) PGF2a vs PGE2 (all primiparae), Outcome 7 Oxytocin augmentation. | ||||
| 10 Epidural analgesia Show forest plot | 1 | 32 | Risk Ratio (M‐H, Fixed, 95% CI) | 1.57 [0.82, 3.00] |
| Analysis 28.10  Comparison 28 (3.10) PGF2a vs PGE2 (all primiparae), Outcome 10 Epidural analgesia. | ||||
| Outcome or subgroup title | No. of studies | No. of participants | Statistical method | Effect size |
| 2 Uterine hyperstimulation with FHR changes Show forest plot | 1 | 32 | Risk Ratio (M‐H, Fixed, 95% CI) | 1.0 [0.07, 14.64] |
| Analysis 29.2  Comparison 29 (3.11) PGF2a vs PGE2 (all primiparae, unfavourable cervix), Outcome 2 Uterine hyperstimulation with FHR changes. | ||||
| 3 Caesarean section Show forest plot | 1 | 32 | Risk Ratio (M‐H, Fixed, 95% CI) | 1.0 [0.07, 14.64] |
| Analysis 29.3  Comparison 29 (3.11) PGF2a vs PGE2 (all primiparae, unfavourable cervix), Outcome 3 Caesarean section. | ||||
| 7 Oxytocin augmentation Show forest plot | 1 | 32 | Risk Ratio (M‐H, Fixed, 95% CI) | 2.33 [1.21, 4.51] |
| Analysis 29.7  Comparison 29 (3.11) PGF2a vs PGE2 (all primiparae, unfavourable cervix), Outcome 7 Oxytocin augmentation. | ||||
| 10 Epidural analgesia Show forest plot | 1 | 32 | Risk Ratio (M‐H, Fixed, 95% CI) | 1.57 [0.82, 3.00] |
| Analysis 29.10  Comparison 29 (3.11) PGF2a vs PGE2 (all primiparae, unfavourable cervix), Outcome 10 Epidural analgesia. | ||||
| Outcome or subgroup title | No. of studies | No. of participants | Statistical method | Effect size |
| 1 Vaginal delivery not achieved within 24 hours Show forest plot | 1 | 73 | Risk Ratio (M‐H, Fixed, 95% CI) | 1.28 [0.87, 1.87] |
| Analysis 31.1  Comparison 31 (4.1) PGE2 gel vs PGE2 tablet (all women), Outcome 1 Vaginal delivery not achieved within 24 hours. | ||||
| 2 Uterine hyperstimulation with FHR changes Show forest plot | 1 | 200 | Risk Ratio (M‐H, Fixed, 95% CI) | 2.0 [0.18, 21.71] |
| Analysis 31.2  Comparison 31 (4.1) PGE2 gel vs PGE2 tablet (all women), Outcome 2 Uterine hyperstimulation with FHR changes. | ||||
| 3 Caesarean section Show forest plot | 4 | 553 | Risk Ratio (M‐H, Fixed, 95% CI) | 0.91 [0.64, 1.28] |
| Analysis 31.3  Comparison 31 (4.1) PGE2 gel vs PGE2 tablet (all women), Outcome 3 Caesarean section. | ||||
| 5 Serious maternal morbidity or death Show forest plot | 1 | 200 | Risk Ratio (M‐H, Fixed, 95% CI) | 0.33 [0.01, 8.09] |
| Analysis 31.5  Comparison 31 (4.1) PGE2 gel vs PGE2 tablet (all women), Outcome 5 Serious maternal morbidity or death. | ||||
| 6 Cervix unfavourable/unchanged after 12 to 24 hours Show forest plot | 1 | 200 | Risk Ratio (M‐H, Fixed, 95% CI) | 0.77 [0.56, 1.07] |
| Analysis 31.6  Comparison 31 (4.1) PGE2 gel vs PGE2 tablet (all women), Outcome 6 Cervix unfavourable/unchanged after 12 to 24 hours. | ||||
| 7 Oxytocin augmentation Show forest plot | 5 | 577 | Risk Ratio (M‐H, Fixed, 95% CI) | 0.84 [0.72, 0.97] |
| Analysis 31.7  Comparison 31 (4.1) PGE2 gel vs PGE2 tablet (all women), Outcome 7 Oxytocin augmentation. | ||||
| 10 Epidural analgesia Show forest plot | 2 | 400 | Risk Ratio (M‐H, Fixed, 95% CI) | 1.02 [0.89, 1.19] |
| Analysis 31.10  Comparison 31 (4.1) PGE2 gel vs PGE2 tablet (all women), Outcome 10 Epidural analgesia. | ||||
| 11 Instrumental vaginal delivery Show forest plot | 2 | 400 | Risk Ratio (M‐H, Fixed, 95% CI) | 0.81 [0.59, 1.10] |
| Analysis 31.11  Comparison 31 (4.1) PGE2 gel vs PGE2 tablet (all women), Outcome 11 Instrumental vaginal delivery. | ||||
| 13 Apgar score <7 at 5 minutes Show forest plot | 2 | 104 | Risk Ratio (M‐H, Fixed, 95% CI) | 0.33 [0.01, 7.95] |
| Analysis 31.13  Comparison 31 (4.1) PGE2 gel vs PGE2 tablet (all women), Outcome 13 Apgar score <7 at 5 minutes. | ||||
| 23 Postpartum haemorrhage Show forest plot | 2 | 280 | Risk Ratio (M‐H, Fixed, 95% CI) | 0.65 [0.16, 2.65] |
| Analysis 31.23  Comparison 31 (4.1) PGE2 gel vs PGE2 tablet (all women), Outcome 23 Postpartum haemorrhage. | ||||
| Outcome or subgroup title | No. of studies | No. of participants | Statistical method | Effect size |
| 1 Vaginal delivery not achieved within 24 hours Show forest plot | 1 | 73 | Risk Ratio (M‐H, Fixed, 95% CI) | 1.28 [0.87, 1.87] |
| Analysis 33.1  Comparison 33 (4.2) PGE2 gel vs PGE2 tablet (all women, unfavourable cervix), Outcome 1 Vaginal delivery not achieved within 24 hours. | ||||
| 2 Uterine hyperstimulation with FHR changes Show forest plot | 1 | 200 | Risk Ratio (M‐H, Fixed, 95% CI) | 2.0 [0.18, 21.71] |
| Analysis 33.2  Comparison 33 (4.2) PGE2 gel vs PGE2 tablet (all women, unfavourable cervix), Outcome 2 Uterine hyperstimulation with FHR changes. | ||||
| 3 Caesarean section Show forest plot | 3 | 353 | Risk Ratio (M‐H, Fixed, 95% CI) | 0.93 [0.63, 1.38] |
| Analysis 33.3  Comparison 33 (4.2) PGE2 gel vs PGE2 tablet (all women, unfavourable cervix), Outcome 3 Caesarean section. | ||||
| 5 Serious maternal morbidity or death Show forest plot | 1 | 200 | Risk Ratio (M‐H, Fixed, 95% CI) | 0.33 [0.01, 8.09] |
| Analysis 33.5  Comparison 33 (4.2) PGE2 gel vs PGE2 tablet (all women, unfavourable cervix), Outcome 5 Serious maternal morbidity or death. | ||||
| 6 Cervix unfavourable/unchanged after 12 to 24 hours Show forest plot | 1 | 200 | Risk Ratio (M‐H, Fixed, 95% CI) | 0.77 [0.56, 1.07] |
| Analysis 33.6  Comparison 33 (4.2) PGE2 gel vs PGE2 tablet (all women, unfavourable cervix), Outcome 6 Cervix unfavourable/unchanged after 12 to 24 hours. | ||||
| 7 Oxytocin augmentation Show forest plot | 4 | 377 | Risk Ratio (M‐H, Fixed, 95% CI) | 0.85 [0.71, 1.02] |
| Analysis 33.7  Comparison 33 (4.2) PGE2 gel vs PGE2 tablet (all women, unfavourable cervix), Outcome 7 Oxytocin augmentation. | ||||
| 10 Epidural analgesia Show forest plot | 1 | 200 | Risk Ratio (M‐H, Fixed, 95% CI) | 0.96 [0.85, 1.10] |
| Analysis 33.10  Comparison 33 (4.2) PGE2 gel vs PGE2 tablet (all women, unfavourable cervix), Outcome 10 Epidural analgesia. | ||||
| 11 Instrumental vaginal delivery Show forest plot | 1 | 200 | Risk Ratio (M‐H, Fixed, 95% CI) | 0.88 [0.61, 1.25] |
| Analysis 33.11  Comparison 33 (4.2) PGE2 gel vs PGE2 tablet (all women, unfavourable cervix), Outcome 11 Instrumental vaginal delivery. | ||||
| 13 Apgar score <7 at 5 minutes Show forest plot | 2 | 104 | Risk Ratio (M‐H, Fixed, 95% CI) | 0.33 [0.01, 7.95] |
| Analysis 33.13  Comparison 33 (4.2) PGE2 gel vs PGE2 tablet (all women, unfavourable cervix), Outcome 13 Apgar score <7 at 5 minutes. | ||||
| 23 Postpartum haemorrhage Show forest plot | 1 | 80 | Risk Ratio (M‐H, Fixed, 95% CI) | 0.5 [0.05, 5.30] |
| Analysis 33.23  Comparison 33 (4.2) PGE2 gel vs PGE2 tablet (all women, unfavourable cervix), Outcome 23 Postpartum haemorrhage. | ||||
| Outcome or subgroup title | No. of studies | No. of participants | Statistical method | Effect size |
| 7 Oxytocin augmentation Show forest plot | 1 | 24 | Risk Ratio (M‐H, Fixed, 95% CI) | 1.0 [0.39, 2.58] |
| Analysis 34.7  Comparison 34 (4.3) PGE2 gel vs PGE2 tablet (all women, favourable cervix), Outcome 7 Oxytocin augmentation. | ||||
| 13 Apgar score <7 at 5 minutes Show forest plot | 1 | 24 | Risk Ratio (M‐H, Fixed, 95% CI) | 0.0 [0.0, 0.0] |
| Analysis 34.13  Comparison 34 (4.3) PGE2 gel vs PGE2 tablet (all women, favourable cervix), Outcome 13 Apgar score <7 at 5 minutes. | ||||
| Outcome or subgroup title | No. of studies | No. of participants | Statistical method | Effect size |
| 3 Caesarean section Show forest plot | 1 | 200 | Risk Ratio (M‐H, Fixed, 95% CI) | 0.85 [0.42, 1.69] |
| Analysis 35.3  Comparison 35 (4.4) PGE2 gel vs PGE2 tablet (all women, intact membranes, variable or undefined cervix), Outcome 3 Caesarean section. | ||||
| 7 Oxytocin augmentation Show forest plot | 1 | 200 | Risk Ratio (M‐H, Fixed, 95% CI) | 0.81 [0.63, 1.05] |
| Analysis 35.7  Comparison 35 (4.4) PGE2 gel vs PGE2 tablet (all women, intact membranes, variable or undefined cervix), Outcome 7 Oxytocin augmentation. | ||||
| 10 Epidural analgesia Show forest plot | 1 | 200 | Risk Ratio (M‐H, Fixed, 95% CI) | 1.20 [0.80, 1.82] |
| Analysis 35.10  Comparison 35 (4.4) PGE2 gel vs PGE2 tablet (all women, intact membranes, variable or undefined cervix), Outcome 10 Epidural analgesia. | ||||
| 11 Instrumental vaginal delivery Show forest plot | 1 | 200 | Risk Ratio (M‐H, Fixed, 95% CI) | 0.69 [0.38, 1.26] |
| Analysis 35.11  Comparison 35 (4.4) PGE2 gel vs PGE2 tablet (all women, intact membranes, variable or undefined cervix), Outcome 11 Instrumental vaginal delivery. | ||||
| 23 Postpartum haemorrhage Show forest plot | 1 | 200 | Risk Ratio (M‐H, Fixed, 95% CI) | 0.75 [0.13, 4.40] |
| Analysis 35.23  Comparison 35 (4.4) PGE2 gel vs PGE2 tablet (all women, intact membranes, variable or undefined cervix), Outcome 23 Postpartum haemorrhage. | ||||
| Outcome or subgroup title | No. of studies | No. of participants | Statistical method | Effect size |
| 1 Vaginal delivery not achieved within 24 hours Show forest plot | 1 | 73 | Risk Ratio (M‐H, Fixed, 95% CI) | 1.28 [0.87, 1.87] |
| Analysis 36.1  Comparison 36 (4.5) PGE2 gel vs PGE2 tablet (all women, intact membranes, unfavourable cervix), Outcome 1 Vaginal delivery not achieved within 24 hours. | ||||
| 2 Uterine hyperstimulation with FHR changes Show forest plot | 1 | 200 | Risk Ratio (M‐H, Fixed, 95% CI) | 2.0 [0.18, 21.71] |
| Analysis 36.2  Comparison 36 (4.5) PGE2 gel vs PGE2 tablet (all women, intact membranes, unfavourable cervix), Outcome 2 Uterine hyperstimulation with FHR changes. | ||||
| 3 Caesarean section Show forest plot | 2 | 273 | Risk Ratio (M‐H, Fixed, 95% CI) | 1.11 [0.71, 1.74] |
| Analysis 36.3  Comparison 36 (4.5) PGE2 gel vs PGE2 tablet (all women, intact membranes, unfavourable cervix), Outcome 3 Caesarean section. | ||||
| 5 Serious maternal morbidity or death Show forest plot | 1 | 200 | Risk Ratio (M‐H, Fixed, 95% CI) | 0.33 [0.01, 8.09] |
| Analysis 36.5  Comparison 36 (4.5) PGE2 gel vs PGE2 tablet (all women, intact membranes, unfavourable cervix), Outcome 5 Serious maternal morbidity or death. | ||||
| 6 Cervix unfavourable/unchanged after 12 to 24 hours Show forest plot | 1 | 200 | Risk Ratio (M‐H, Fixed, 95% CI) | 0.77 [0.56, 1.07] |
| Analysis 36.6  Comparison 36 (4.5) PGE2 gel vs PGE2 tablet (all women, intact membranes, unfavourable cervix), Outcome 6 Cervix unfavourable/unchanged after 12 to 24 hours. | ||||
| 7 Oxytocin augmentation Show forest plot | 2 | 273 | Risk Ratio (M‐H, Fixed, 95% CI) | 0.98 [0.82, 1.18] |
| Analysis 36.7  Comparison 36 (4.5) PGE2 gel vs PGE2 tablet (all women, intact membranes, unfavourable cervix), Outcome 7 Oxytocin augmentation. | ||||
| 10 Epidural analgesia Show forest plot | 1 | 200 | Risk Ratio (M‐H, Fixed, 95% CI) | 0.96 [0.85, 1.10] |
| Analysis 36.10  Comparison 36 (4.5) PGE2 gel vs PGE2 tablet (all women, intact membranes, unfavourable cervix), Outcome 10 Epidural analgesia. | ||||
| 11 Instrumental vaginal delivery Show forest plot | 1 | 200 | Risk Ratio (M‐H, Fixed, 95% CI) | 0.88 [0.61, 1.25] |
| Analysis 36.11  Comparison 36 (4.5) PGE2 gel vs PGE2 tablet (all women, intact membranes, unfavourable cervix), Outcome 11 Instrumental vaginal delivery. | ||||
| Outcome or subgroup title | No. of studies | No. of participants | Statistical method | Effect size |
| 1 Vaginal delivery not achieved within 24 hours Show forest plot | 1 | 73 | Risk Ratio (M‐H, Fixed, 95% CI) | 1.28 [0.87, 1.87] |
| Analysis 37.1  Comparison 37 (4.10) PGE2 gel vs PGE2 tablet (all primiparae), Outcome 1 Vaginal delivery not achieved within 24 hours. | ||||
| 2 Uterine hyperstimulation with FHR changes Show forest plot | 1 | 200 | Risk Ratio (M‐H, Fixed, 95% CI) | 2.0 [0.18, 21.71] |
| Analysis 37.2  Comparison 37 (4.10) PGE2 gel vs PGE2 tablet (all primiparae), Outcome 2 Uterine hyperstimulation with FHR changes. | ||||
| 3 Caesarean section Show forest plot | 3 | 353 | Risk Ratio (M‐H, Fixed, 95% CI) | 0.93 [0.63, 1.38] |
| Analysis 37.3  Comparison 37 (4.10) PGE2 gel vs PGE2 tablet (all primiparae), Outcome 3 Caesarean section. | ||||
| 5 Serious maternal morbidity or death Show forest plot | 1 | 200 | Risk Ratio (M‐H, Fixed, 95% CI) | 0.33 [0.01, 8.09] |
| Analysis 37.5  Comparison 37 (4.10) PGE2 gel vs PGE2 tablet (all primiparae), Outcome 5 Serious maternal morbidity or death. | ||||
| 6 Cervix unfavourable/unchanged after 12 to 24 hours Show forest plot | 1 | 200 | Risk Ratio (M‐H, Fixed, 95% CI) | 0.77 [0.56, 1.07] |
| Analysis 37.6  Comparison 37 (4.10) PGE2 gel vs PGE2 tablet (all primiparae), Outcome 6 Cervix unfavourable/unchanged after 12 to 24 hours. | ||||
| 7 Oxytocin augmentation Show forest plot | 3 | 353 | Risk Ratio (M‐H, Fixed, 95% CI) | 0.84 [0.70, 1.01] |
| Analysis 37.7  Comparison 37 (4.10) PGE2 gel vs PGE2 tablet (all primiparae), Outcome 7 Oxytocin augmentation. | ||||
| 10 Epidural analgesia Show forest plot | 1 | 200 | Risk Ratio (M‐H, Fixed, 95% CI) | 0.96 [0.85, 1.10] |
| Analysis 37.10  Comparison 37 (4.10) PGE2 gel vs PGE2 tablet (all primiparae), Outcome 10 Epidural analgesia. | ||||
| 11 Instrumental vaginal delivery Show forest plot | 1 | 200 | Risk Ratio (M‐H, Fixed, 95% CI) | 0.88 [0.61, 1.25] |
| Analysis 37.11  Comparison 37 (4.10) PGE2 gel vs PGE2 tablet (all primiparae), Outcome 11 Instrumental vaginal delivery. | ||||
| 13 Apgar score <7 at 5 minutes Show forest plot | 1 | 80 | Risk Ratio (M‐H, Fixed, 95% CI) | 0.33 [0.01, 7.95] |
| Analysis 37.13  Comparison 37 (4.10) PGE2 gel vs PGE2 tablet (all primiparae), Outcome 13 Apgar score <7 at 5 minutes. | ||||
| 23 Postpartum haemorrhage Show forest plot | 1 | 80 | Risk Ratio (M‐H, Fixed, 95% CI) | 0.5 [0.05, 5.30] |
| Analysis 37.23  Comparison 37 (4.10) PGE2 gel vs PGE2 tablet (all primiparae), Outcome 23 Postpartum haemorrhage. | ||||
| Outcome or subgroup title | No. of studies | No. of participants | Statistical method | Effect size |
| 1 Vaginal delivery not achieved within 24 hours Show forest plot | 1 | 73 | Risk Ratio (M‐H, Fixed, 95% CI) | 1.28 [0.87, 1.87] |
| Analysis 38.1  Comparison 38 (4.11) PGE2 gel vs PGE2 tablet (all primiparae, unfavourable cervix), Outcome 1 Vaginal delivery not achieved within 24 hours. | ||||
| 2 Uterine hyperstimulation with FHR changes Show forest plot | 1 | 200 | Risk Ratio (M‐H, Fixed, 95% CI) | 2.0 [0.18, 21.71] |
| Analysis 38.2  Comparison 38 (4.11) PGE2 gel vs PGE2 tablet (all primiparae, unfavourable cervix), Outcome 2 Uterine hyperstimulation with FHR changes. | ||||
| 3 Caesarean section Show forest plot | 3 | 353 | Risk Ratio (M‐H, Fixed, 95% CI) | 0.93 [0.63, 1.38] |
| Analysis 38.3  Comparison 38 (4.11) PGE2 gel vs PGE2 tablet (all primiparae, unfavourable cervix), Outcome 3 Caesarean section. | ||||
| 5 Serious maternal morbidity or death Show forest plot | 1 | 200 | Risk Ratio (M‐H, Fixed, 95% CI) | 0.33 [0.01, 8.09] |
| Analysis 38.5  Comparison 38 (4.11) PGE2 gel vs PGE2 tablet (all primiparae, unfavourable cervix), Outcome 5 Serious maternal morbidity or death. | ||||
| 6 Cervix unfavourable/unchanged after 12 to 24 hours Show forest plot | 1 | 200 | Risk Ratio (M‐H, Fixed, 95% CI) | 0.77 [0.56, 1.07] |
| Analysis 38.6  Comparison 38 (4.11) PGE2 gel vs PGE2 tablet (all primiparae, unfavourable cervix), Outcome 6 Cervix unfavourable/unchanged after 12 to 24 hours. | ||||
| 7 Oxytocin augmentation Show forest plot | 3 | 353 | Risk Ratio (M‐H, Fixed, 95% CI) | 0.84 [0.70, 1.01] |
| Analysis 38.7  Comparison 38 (4.11) PGE2 gel vs PGE2 tablet (all primiparae, unfavourable cervix), Outcome 7 Oxytocin augmentation. | ||||
| 10 Epidural analgesia Show forest plot | 1 | 200 | Risk Ratio (M‐H, Fixed, 95% CI) | 0.96 [0.85, 1.10] |
| Analysis 38.10  Comparison 38 (4.11) PGE2 gel vs PGE2 tablet (all primiparae, unfavourable cervix), Outcome 10 Epidural analgesia. | ||||
| 11 Instrumental vaginal delivery Show forest plot | 1 | 200 | Risk Ratio (M‐H, Fixed, 95% CI) | 0.88 [0.61, 1.25] |
| Analysis 38.11  Comparison 38 (4.11) PGE2 gel vs PGE2 tablet (all primiparae, unfavourable cervix), Outcome 11 Instrumental vaginal delivery. | ||||
| 13 Apgar score <7 at 5 minutes Show forest plot | 1 | 80 | Risk Ratio (M‐H, Fixed, 95% CI) | 0.33 [0.01, 7.95] |
| Analysis 38.13  Comparison 38 (4.11) PGE2 gel vs PGE2 tablet (all primiparae, unfavourable cervix), Outcome 13 Apgar score <7 at 5 minutes. | ||||
| 23 Postpartum haemorrhage Show forest plot | 1 | 80 | Risk Ratio (M‐H, Fixed, 95% CI) | 0.5 [0.05, 5.30] |
| Analysis 38.23  Comparison 38 (4.11) PGE2 gel vs PGE2 tablet (all primiparae, unfavourable cervix), Outcome 23 Postpartum haemorrhage. | ||||
| Outcome or subgroup title | No. of studies | No. of participants | Statistical method | Effect size |
| 1 Vaginal delivery not achieved within 24 hours Show forest plot | 1 | 73 | Risk Ratio (M‐H, Fixed, 95% CI) | 1.28 [0.87, 1.87] |
| Analysis 39.1  Comparison 39 (4.14) PGE2 gel vs PGE2 tablet (all primiparae, intact membranes, unfavourable cervix), Outcome 1 Vaginal delivery not achieved within 24 hours. | ||||
| 2 Uterine hyperstimulation with FHR changes Show forest plot | 1 | 200 | Risk Ratio (M‐H, Fixed, 95% CI) | 2.0 [0.18, 21.71] |
| Analysis 39.2  Comparison 39 (4.14) PGE2 gel vs PGE2 tablet (all primiparae, intact membranes, unfavourable cervix), Outcome 2 Uterine hyperstimulation with FHR changes. | ||||
| 3 Caesarean section Show forest plot | 2 | 273 | Risk Ratio (M‐H, Fixed, 95% CI) | 1.11 [0.71, 1.74] |
| Analysis 39.3  Comparison 39 (4.14) PGE2 gel vs PGE2 tablet (all primiparae, intact membranes, unfavourable cervix), Outcome 3 Caesarean section. | ||||
| 5 Serious maternal morbidity or death Show forest plot | 1 | 200 | Risk Ratio (M‐H, Fixed, 95% CI) | 0.33 [0.01, 8.09] |
| Analysis 39.5  Comparison 39 (4.14) PGE2 gel vs PGE2 tablet (all primiparae, intact membranes, unfavourable cervix), Outcome 5 Serious maternal morbidity or death. | ||||
| 6 Cervix unfavourable/unchanged after 12 to 24 hours Show forest plot | 1 | 200 | Risk Ratio (M‐H, Fixed, 95% CI) | 0.77 [0.56, 1.07] |
| Analysis 39.6  Comparison 39 (4.14) PGE2 gel vs PGE2 tablet (all primiparae, intact membranes, unfavourable cervix), Outcome 6 Cervix unfavourable/unchanged after 12 to 24 hours. | ||||
| 7 Oxytocin augmentation Show forest plot | 2 | 273 | Risk Ratio (M‐H, Fixed, 95% CI) | 0.98 [0.82, 1.18] |
| Analysis 39.7  Comparison 39 (4.14) PGE2 gel vs PGE2 tablet (all primiparae, intact membranes, unfavourable cervix), Outcome 7 Oxytocin augmentation. | ||||
| 10 Epidural analgesia Show forest plot | 1 | 200 | Risk Ratio (M‐H, Fixed, 95% CI) | 0.96 [0.85, 1.10] |
| Analysis 39.10  Comparison 39 (4.14) PGE2 gel vs PGE2 tablet (all primiparae, intact membranes, unfavourable cervix), Outcome 10 Epidural analgesia. | ||||
| 11 Instrumental vaginal delivery Show forest plot | 1 | 200 | Risk Ratio (M‐H, Fixed, 95% CI) | 0.88 [0.61, 1.25] |
| Analysis 39.11  Comparison 39 (4.14) PGE2 gel vs PGE2 tablet (all primiparae, intact membranes, unfavourable cervix), Outcome 11 Instrumental vaginal delivery. | ||||
| Outcome or subgroup title | No. of studies | No. of participants | Statistical method | Effect size |
| 2 Uterine hyperstimulation with FHR changes Show forest plot | 2 | 159 | Risk Ratio (M‐H, Fixed, 95% CI) | 0.16 [0.03, 0.87] |
| Analysis 40.2  Comparison 40 (5.1) PGE2 gel vs PGE2 suppository/pessary (all women), Outcome 2 Uterine hyperstimulation with FHR changes. | ||||
| 3 Caesarean section Show forest plot | 2 | 159 | Risk Ratio (M‐H, Fixed, 95% CI) | 0.65 [0.38, 1.11] |
| Analysis 40.3  Comparison 40 (5.1) PGE2 gel vs PGE2 suppository/pessary (all women), Outcome 3 Caesarean section. | ||||
| 8 Uterine hyperstimulation without FHR changes Show forest plot | 1 | 90 | Risk Ratio (M‐H, Fixed, 95% CI) | 0.2 [0.01, 4.05] |
| Analysis 40.8  Comparison 40 (5.1) PGE2 gel vs PGE2 suppository/pessary (all women), Outcome 8 Uterine hyperstimulation without FHR changes. | ||||
| 13 Apgar score <7 at 5 minutes Show forest plot | 1 | 69 | Risk Ratio (M‐H, Fixed, 95% CI) | 0.21 [0.01, 4.13] |
| Analysis 40.13  Comparison 40 (5.1) PGE2 gel vs PGE2 suppository/pessary (all women), Outcome 13 Apgar score <7 at 5 minutes. | ||||
| 18 Maternal side‐effects (all) Show forest plot | 2 | 460 | Risk Ratio (M‐H, Fixed, 95% CI) | 0.2 [0.02, 1.70] |
| Analysis 40.18  Comparison 40 (5.1) PGE2 gel vs PGE2 suppository/pessary (all women), Outcome 18 Maternal side‐effects (all). | ||||
| 19 Nausea (maternal) Show forest plot | 1 | 69 | Risk Ratio (M‐H, Fixed, 95% CI) | 0.34 [0.01, 8.13] |
| Analysis 40.19  Comparison 40 (5.1) PGE2 gel vs PGE2 suppository/pessary (all women), Outcome 19 Nausea (maternal). | ||||
| 20 Vomitting (maternal) Show forest plot | 1 | 69 | Risk Ratio (M‐H, Fixed, 95% CI) | 0.34 [0.01, 8.13] |
| Analysis 40.20  Comparison 40 (5.1) PGE2 gel vs PGE2 suppository/pessary (all women), Outcome 20 Vomitting (maternal). | ||||
| 21 Diarrhoea (maternal) Show forest plot | 2 | 159 | Risk Ratio (M‐H, Fixed, 95% CI) | 0.33 [0.01, 7.97] |
| Analysis 40.21  Comparison 40 (5.1) PGE2 gel vs PGE2 suppository/pessary (all women), Outcome 21 Diarrhoea (maternal). | ||||
| 22 Other maternal side effects Show forest plot | 2 | 159 | Risk Ratio (M‐H, Fixed, 95% CI) | 0.33 [0.01, 7.97] |
| Analysis 40.22  Comparison 40 (5.1) PGE2 gel vs PGE2 suppository/pessary (all women), Outcome 22 Other maternal side effects. | ||||
| Outcome or subgroup title | No. of studies | No. of participants | Statistical method | Effect size |
| 2 Uterine hyperstimulation with FHR changes Show forest plot | 2 | 159 | Risk Ratio (M‐H, Fixed, 95% CI) | 0.16 [0.03, 0.87] |
| Analysis 41.2  Comparison 41 (5.2) PGE2 gel vs PGE2 suppository/pessary (all women, unfavourable cervix), Outcome 2 Uterine hyperstimulation with FHR changes. | ||||
| 3 Caesarean section Show forest plot | 2 | 159 | Risk Ratio (M‐H, Fixed, 95% CI) | 0.65 [0.38, 1.11] |
| Analysis 41.3  Comparison 41 (5.2) PGE2 gel vs PGE2 suppository/pessary (all women, unfavourable cervix), Outcome 3 Caesarean section. | ||||
| 8 Uterine hyperstimulation without FHR changes Show forest plot | 1 | 90 | Risk Ratio (M‐H, Fixed, 95% CI) | 0.2 [0.01, 4.05] |
| Analysis 41.8  Comparison 41 (5.2) PGE2 gel vs PGE2 suppository/pessary (all women, unfavourable cervix), Outcome 8 Uterine hyperstimulation without FHR changes. | ||||
| 13 Apgar score <7 at 5 minutes Show forest plot | 1 | 69 | Risk Ratio (M‐H, Fixed, 95% CI) | 0.21 [0.01, 4.13] |
| Analysis 41.13  Comparison 41 (5.2) PGE2 gel vs PGE2 suppository/pessary (all women, unfavourable cervix), Outcome 13 Apgar score <7 at 5 minutes. | ||||
| 18 Maternal side‐effects (all) Show forest plot | 2 | 460 | Risk Ratio (M‐H, Fixed, 95% CI) | 0.2 [0.02, 1.70] |
| Analysis 41.18  Comparison 41 (5.2) PGE2 gel vs PGE2 suppository/pessary (all women, unfavourable cervix), Outcome 18 Maternal side‐effects (all). | ||||
| 19 Nausea (maternal) Show forest plot | 1 | 69 | Risk Ratio (M‐H, Fixed, 95% CI) | 0.34 [0.01, 8.13] |
| Analysis 41.19  Comparison 41 (5.2) PGE2 gel vs PGE2 suppository/pessary (all women, unfavourable cervix), Outcome 19 Nausea (maternal). | ||||
| 20 Vomitting (maternal) Show forest plot | 1 | 69 | Risk Ratio (M‐H, Fixed, 95% CI) | 0.34 [0.01, 8.13] |
| Analysis 41.20  Comparison 41 (5.2) PGE2 gel vs PGE2 suppository/pessary (all women, unfavourable cervix), Outcome 20 Vomitting (maternal). | ||||
| 21 Diarrhoea (maternal) Show forest plot | 2 | 159 | Risk Ratio (M‐H, Fixed, 95% CI) | 0.33 [0.01, 7.97] |
| Analysis 41.21  Comparison 41 (5.2) PGE2 gel vs PGE2 suppository/pessary (all women, unfavourable cervix), Outcome 21 Diarrhoea (maternal). | ||||
| 22 Other maternal side‐effects Show forest plot | 2 | 159 | Risk Ratio (M‐H, Fixed, 95% CI) | 0.33 [0.01, 7.97] |
| Analysis 41.22  Comparison 41 (5.2) PGE2 gel vs PGE2 suppository/pessary (all women, unfavourable cervix), Outcome 22 Other maternal side‐effects. | ||||
| Outcome or subgroup title | No. of studies | No. of participants | Statistical method | Effect size |
| 2 Uterine hyperstimulation with FHR changes Show forest plot | 2 | 159 | Risk Ratio (M‐H, Fixed, 95% CI) | 0.16 [0.03, 0.87] |
| Analysis 42.2  Comparison 42 (5.5) PGE2 gel vs PGE2 suppository/pessary (all women, intact membranes, unfavourable cervix), Outcome 2 Uterine hyperstimulation with FHR changes. | ||||
| 3 Caesarean section Show forest plot | 2 | 159 | Risk Ratio (M‐H, Fixed, 95% CI) | 0.65 [0.38, 1.11] |
| Analysis 42.3  Comparison 42 (5.5) PGE2 gel vs PGE2 suppository/pessary (all women, intact membranes, unfavourable cervix), Outcome 3 Caesarean section. | ||||
| 8 Uterine hyperstimulation without FHR changes Show forest plot | 1 | 90 | Risk Ratio (M‐H, Fixed, 95% CI) | 0.2 [0.01, 4.05] |
| Analysis 42.8  Comparison 42 (5.5) PGE2 gel vs PGE2 suppository/pessary (all women, intact membranes, unfavourable cervix), Outcome 8 Uterine hyperstimulation without FHR changes. | ||||
| 13 Apgar score <7 at 5 minutes Show forest plot | 1 | 69 | Risk Ratio (M‐H, Fixed, 95% CI) | 0.21 [0.01, 4.13] |
| Analysis 42.13  Comparison 42 (5.5) PGE2 gel vs PGE2 suppository/pessary (all women, intact membranes, unfavourable cervix), Outcome 13 Apgar score <7 at 5 minutes. | ||||
| 18 Maternal side‐effects (all) Show forest plot | 2 | 460 | Risk Ratio (M‐H, Fixed, 95% CI) | 0.2 [0.02, 1.70] |
| Analysis 42.18  Comparison 42 (5.5) PGE2 gel vs PGE2 suppository/pessary (all women, intact membranes, unfavourable cervix), Outcome 18 Maternal side‐effects (all). | ||||
| 19 Nausea (maternal) Show forest plot | 1 | 69 | Risk Ratio (M‐H, Fixed, 95% CI) | 0.34 [0.01, 8.13] |
| Analysis 42.19  Comparison 42 (5.5) PGE2 gel vs PGE2 suppository/pessary (all women, intact membranes, unfavourable cervix), Outcome 19 Nausea (maternal). | ||||
| 20 Vomitting (maternal) Show forest plot | 1 | 69 | Risk Ratio (M‐H, Fixed, 95% CI) | 0.34 [0.01, 8.13] |
| Analysis 42.20  Comparison 42 (5.5) PGE2 gel vs PGE2 suppository/pessary (all women, intact membranes, unfavourable cervix), Outcome 20 Vomitting (maternal). | ||||
| 21 Diarrhoea (maternal) Show forest plot | 2 | 159 | Risk Ratio (M‐H, Fixed, 95% CI) | 0.33 [0.01, 7.97] |
| Analysis 42.21  Comparison 42 (5.5) PGE2 gel vs PGE2 suppository/pessary (all women, intact membranes, unfavourable cervix), Outcome 21 Diarrhoea (maternal). | ||||
| 22 Other maternal side‐effects Show forest plot | 2 | 159 | Risk Ratio (M‐H, Fixed, 95% CI) | 0.33 [0.01, 7.97] |
| Analysis 42.22  Comparison 42 (5.5) PGE2 gel vs PGE2 suppository/pessary (all women, intact membranes, unfavourable cervix), Outcome 22 Other maternal side‐effects. | ||||
| Outcome or subgroup title | No. of studies | No. of participants | Statistical method | Effect size |
| 3 Caesarean section Show forest plot | 3 | 491 | Risk Ratio (M‐H, Fixed, 95% CI) | 1.13 [0.64, 1.99] |
| Analysis 43.3  Comparison 43 (6.1) PGE2 tablet vs PGE2 pessary/suppository (all women), Outcome 3 Caesarean section. | ||||
| 7 Oxytocin augmentation Show forest plot | 3 | 491 | Risk Ratio (M‐H, Fixed, 95% CI) | 0.73 [0.56, 0.96] |
| Analysis 43.7  Comparison 43 (6.1) PGE2 tablet vs PGE2 pessary/suppository (all women), Outcome 7 Oxytocin augmentation. | ||||
| 8 Uterine hyperstimulation without FHR changes Show forest plot | 1 | 200 | Risk Ratio (M‐H, Fixed, 95% CI) | 0.0 [0.0, 0.0] |
| Analysis 43.8  Comparison 43 (6.1) PGE2 tablet vs PGE2 pessary/suppository (all women), Outcome 8 Uterine hyperstimulation without FHR changes. | ||||
| 10 Epidural analgesia Show forest plot | 1 | 24 | Risk Ratio (M‐H, Fixed, 95% CI) | 0.67 [0.25, 1.78] |
| Analysis 43.10  Comparison 43 (6.1) PGE2 tablet vs PGE2 pessary/suppository (all women), Outcome 10 Epidural analgesia. | ||||
| 11 Instrumental vaginal delivery Show forest plot | 3 | 491 | Risk Ratio (M‐H, Fixed, 95% CI) | 1.72 [1.09, 2.70] |
| Analysis 43.11  Comparison 43 (6.1) PGE2 tablet vs PGE2 pessary/suppository (all women), Outcome 11 Instrumental vaginal delivery. | ||||
| 13 Apgar score <7 at 5 minutes Show forest plot | 2 | 467 | Risk Ratio (M‐H, Fixed, 95% CI) | 1.33 [0.58, 3.05] |
| Analysis 43.13  Comparison 43 (6.1) PGE2 tablet vs PGE2 pessary/suppository (all women), Outcome 13 Apgar score <7 at 5 minutes. | ||||
| 18 Maternal side‐effects (all) Show forest plot | 1 | 400 | Risk Ratio (M‐H, Fixed, 95% CI) | 0.0 [0.0, 0.0] |
| Analysis 43.18  Comparison 43 (6.1) PGE2 tablet vs PGE2 pessary/suppository (all women), Outcome 18 Maternal side‐effects (all). | ||||
| 20 Vomitting (maternal) Show forest plot | 1 | 200 | Risk Ratio (M‐H, Fixed, 95% CI) | 0.0 [0.0, 0.0] |
| Analysis 43.20  Comparison 43 (6.1) PGE2 tablet vs PGE2 pessary/suppository (all women), Outcome 20 Vomitting (maternal). | ||||
| 21 Diarrhoea (maternal) Show forest plot | 1 | 200 | Risk Ratio (M‐H, Fixed, 95% CI) | 0.0 [0.0, 0.0] |
| Analysis 43.21  Comparison 43 (6.1) PGE2 tablet vs PGE2 pessary/suppository (all women), Outcome 21 Diarrhoea (maternal). | ||||
| 23 Postpartum haemorrhage Show forest plot | 1 | 267 | Risk Ratio (M‐H, Fixed, 95% CI) | 1.12 [0.57, 2.20] |
| Analysis 43.23  Comparison 43 (6.1) PGE2 tablet vs PGE2 pessary/suppository (all women), Outcome 23 Postpartum haemorrhage. | ||||
| Outcome or subgroup title | No. of studies | No. of participants | Statistical method | Effect size |
| 3 Caesarean section Show forest plot | 1 | 200 | Risk Ratio (M‐H, Fixed, 95% CI) | 1.0 [0.26, 3.89] |
| Analysis 44.3  Comparison 44 (6.2) PGE2 tablet vs PGE2 pessary/suppository (all women, unfavourable cervix), Outcome 3 Caesarean section. | ||||
| 7 Oxytocin augmentation Show forest plot | 1 | 200 | Risk Ratio (M‐H, Fixed, 95% CI) | 0.35 [0.19, 0.64] |
| Analysis 44.7  Comparison 44 (6.2) PGE2 tablet vs PGE2 pessary/suppository (all women, unfavourable cervix), Outcome 7 Oxytocin augmentation. | ||||
| 8 Uterine hyperstimulation without FHR changes Show forest plot | 1 | 200 | Risk Ratio (M‐H, Fixed, 95% CI) | 0.0 [0.0, 0.0] |
| Analysis 44.8  Comparison 44 (6.2) PGE2 tablet vs PGE2 pessary/suppository (all women, unfavourable cervix), Outcome 8 Uterine hyperstimulation without FHR changes. | ||||
| 11 Instrumental vaginal delivery Show forest plot | 1 | 200 | Risk Ratio (M‐H, Fixed, 95% CI) | 1.11 [0.47, 2.62] |
| Analysis 44.11  Comparison 44 (6.2) PGE2 tablet vs PGE2 pessary/suppository (all women, unfavourable cervix), Outcome 11 Instrumental vaginal delivery. | ||||
| 13 Apgar score <7 at 5 minutes Show forest plot | 1 | 200 | Risk Ratio (M‐H, Fixed, 95% CI) | 1.25 [0.51, 3.04] |
| Analysis 44.13  Comparison 44 (6.2) PGE2 tablet vs PGE2 pessary/suppository (all women, unfavourable cervix), Outcome 13 Apgar score <7 at 5 minutes. | ||||
| 18 Maternal side‐effects (all) Show forest plot | 1 | 400 | Risk Ratio (M‐H, Fixed, 95% CI) | 0.0 [0.0, 0.0] |
| Analysis 44.18  Comparison 44 (6.2) PGE2 tablet vs PGE2 pessary/suppository (all women, unfavourable cervix), Outcome 18 Maternal side‐effects (all). | ||||
| 20 Vomitting (maternal) Show forest plot | 1 | 200 | Risk Ratio (M‐H, Fixed, 95% CI) | 0.0 [0.0, 0.0] |
| Analysis 44.20  Comparison 44 (6.2) PGE2 tablet vs PGE2 pessary/suppository (all women, unfavourable cervix), Outcome 20 Vomitting (maternal). | ||||
| 21 Diarrhoea (maternal) Show forest plot | 1 | 200 | Risk Ratio (M‐H, Fixed, 95% CI) | 0.0 [0.0, 0.0] |
| Analysis 44.21  Comparison 44 (6.2) PGE2 tablet vs PGE2 pessary/suppository (all women, unfavourable cervix), Outcome 21 Diarrhoea (maternal). | ||||
| Outcome or subgroup title | No. of studies | No. of participants | Statistical method | Effect size |
| 3 Caesarean section Show forest plot | 1 | 141 | Risk Ratio (M‐H, Fixed, 95% CI) | 1.21 [0.57, 2.58] |
| Analysis 45.3  Comparison 45 (6.10) PGE2 tablet vs PGE2 pessary/suppository (all primiparae), Outcome 3 Caesarean section. | ||||
| 7 Oxytocin augmentation Show forest plot | 1 | 141 | Risk Ratio (M‐H, Fixed, 95% CI) | 1.27 [0.85, 1.88] |
| Analysis 45.7  Comparison 45 (6.10) PGE2 tablet vs PGE2 pessary/suppository (all primiparae), Outcome 7 Oxytocin augmentation. | ||||
| Outcome or subgroup title | No. of studies | No. of participants | Statistical method | Effect size |
| 3 Caesarean section Show forest plot | 1 | 126 | Risk Ratio (M‐H, Fixed, 95% CI) | 0.83 [0.23, 2.93] |
| Analysis 46.3  Comparison 46 (6.19) PGE2 tablet vs PGE2 pessary/suppository (all multiparae), Outcome 3 Caesarean section. | ||||
| 7 Oxytocin augmentation Show forest plot | 1 | 126 | Risk Ratio (M‐H, Fixed, 95% CI) | 0.66 [0.37, 1.16] |
| Analysis 46.7  Comparison 46 (6.19) PGE2 tablet vs PGE2 pessary/suppository (all multiparae), Outcome 7 Oxytocin augmentation. | ||||
| Outcome or subgroup title | No. of studies | No. of participants | Statistical method | Effect size |
| 1 Vaginal delivery not achieved within 24 hours Show forest plot | 1 | 200 | Risk Ratio (M‐H, Fixed, 95% CI) | 0.92 [0.68, 1.23] |
| Analysis 47.1  Comparison 47 (7.1) PGE2 (controlled release) vs all PGE2 delivery systems (all women), Outcome 1 Vaginal delivery not achieved within 24 hours. | ||||
| 2 Uterine hyperstimulation with FHR changes Show forest plot | 2 | 321 | Risk Ratio (M‐H, Fixed, 95% CI) | 2.76 [0.89, 8.56] |
| Analysis 47.2  Comparison 47 (7.1) PGE2 (controlled release) vs all PGE2 delivery systems (all women), Outcome 2 Uterine hyperstimulation with FHR changes. | ||||
| 3 Caesarean section Show forest plot | 5 | 537 | Risk Ratio (M‐H, Fixed, 95% CI) | 0.92 [0.63, 1.36] |
| Analysis 47.3  Comparison 47 (7.1) PGE2 (controlled release) vs all PGE2 delivery systems (all women), Outcome 3 Caesarean section. | ||||
| 7 Oxytocin augmentation Show forest plot | 3 | 361 | Risk Ratio (M‐H, Fixed, 95% CI) | 0.83 [0.65, 1.06] |
| Analysis 47.7  Comparison 47 (7.1) PGE2 (controlled release) vs all PGE2 delivery systems (all women), Outcome 7 Oxytocin augmentation. | ||||
| 8 Uterine hyperstimulation without FHR changes Show forest plot | 4 | 386 | Risk Ratio (M‐H, Fixed, 95% CI) | 1.31 [0.63, 2.72] |
| Analysis 47.8  Comparison 47 (7.1) PGE2 (controlled release) vs all PGE2 delivery systems (all women), Outcome 8 Uterine hyperstimulation without FHR changes. | ||||
| 9 Uterine rupture Show forest plot | 1 | 200 | Risk Ratio (M‐H, Fixed, 95% CI) | 0.33 [0.01, 8.09] |
| Analysis 47.9  Comparison 47 (7.1) PGE2 (controlled release) vs all PGE2 delivery systems (all women), Outcome 9 Uterine rupture. | ||||
| 10 Epidural analgesia Show forest plot | 3 | 204 | Risk Ratio (M‐H, Fixed, 95% CI) | 1.01 [0.81, 1.27] |
| Analysis 47.10  Comparison 47 (7.1) PGE2 (controlled release) vs all PGE2 delivery systems (all women), Outcome 10 Epidural analgesia. | ||||
| 11 Instrumental vaginal delivery Show forest plot | 2 | 269 | Risk Ratio (M‐H, Fixed, 95% CI) | 0.68 [0.38, 1.19] |
| Analysis 47.11  Comparison 47 (7.1) PGE2 (controlled release) vs all PGE2 delivery systems (all women), Outcome 11 Instrumental vaginal delivery. | ||||
| 13 Apgar score <7 at 5 minutes Show forest plot | 2 | 240 | Risk Ratio (M‐H, Fixed, 95% CI) | 3.0 [0.12, 72.77] |
| Analysis 47.13  Comparison 47 (7.1) PGE2 (controlled release) vs all PGE2 delivery systems (all women), Outcome 13 Apgar score <7 at 5 minutes. | ||||
| Outcome or subgroup title | No. of studies | No. of participants | Statistical method | Effect size |
| 2 Uterine hyperstimulation with FHR changes Show forest plot | 1 | 121 | Risk Ratio (M‐H, Fixed, 95% CI) | 6.67 [0.86, 51.67] |
| Analysis 48.2  Comparison 48 (7.2) PGE2 (controlled release) vs all PGE2 delivery systems (all women, unfavourable cervix), Outcome 2 Uterine hyperstimulation with FHR changes. | ||||
| 3 Caesarean section Show forest plot | 3 | 268 | Risk Ratio (M‐H, Fixed, 95% CI) | 0.75 [0.40, 1.43] |
| Analysis 48.3  Comparison 48 (7.2) PGE2 (controlled release) vs all PGE2 delivery systems (all women, unfavourable cervix), Outcome 3 Caesarean section. | ||||
| 7 Oxytocin augmentation Show forest plot | 2 | 161 | Risk Ratio (M‐H, Fixed, 95% CI) | 0.55 [0.35, 0.88] |
| Analysis 48.7  Comparison 48 (7.2) PGE2 (controlled release) vs all PGE2 delivery systems (all women, unfavourable cervix), Outcome 7 Oxytocin augmentation. | ||||
| 8 Uterine hyperstimulation without FHR changes Show forest plot | 2 | 135 | Risk Ratio (M‐H, Fixed, 95% CI) | 5.0 [0.26, 98.00] |
| Analysis 48.8  Comparison 48 (7.2) PGE2 (controlled release) vs all PGE2 delivery systems (all women, unfavourable cervix), Outcome 8 Uterine hyperstimulation without FHR changes. | ||||
| 10 Epidural analgesia Show forest plot | 2 | 135 | Risk Ratio (M‐H, Fixed, 95% CI) | 1.05 [0.85, 1.30] |
| Analysis 48.10  Comparison 48 (7.2) PGE2 (controlled release) vs all PGE2 delivery systems (all women, unfavourable cervix), Outcome 10 Epidural analgesia. | ||||
| 13 Apgar score <7 at 5 minutes Show forest plot | 1 | 40 | Risk Ratio (M‐H, Fixed, 95% CI) | 0.0 [0.0, 0.0] |
| Analysis 48.13  Comparison 48 (7.2) PGE2 (controlled release) vs all PGE2 delivery systems (all women, unfavourable cervix), Outcome 13 Apgar score <7 at 5 minutes. | ||||
| Outcome or subgroup title | No. of studies | No. of participants | Statistical method | Effect size |
| 3 Caesarean section Show forest plot | 1 | 69 | Risk Ratio (M‐H, Fixed, 95% CI) | 1.54 [0.48, 4.99] |
| Analysis 49.3  Comparison 49 (7.1) PGE2 (controlled release) vs all PGE2 delivery systems (all women, intact, variable cervix), Outcome 3 Caesarean section. | ||||
| 10 Epidural analgesia Show forest plot | 1 | 69 | Risk Ratio (M‐H, Fixed, 95% CI) | 1.13 [0.55, 2.31] |
| Analysis 49.10  Comparison 49 (7.1) PGE2 (controlled release) vs all PGE2 delivery systems (all women, intact, variable cervix), Outcome 10 Epidural analgesia. | ||||
| 11 Instrumental vaginal delivery Show forest plot | 1 | 69 | Risk Ratio (M‐H, Fixed, 95% CI) | 0.94 [0.46, 1.91] |
| Analysis 49.11  Comparison 49 (7.1) PGE2 (controlled release) vs all PGE2 delivery systems (all women, intact, variable cervix), Outcome 11 Instrumental vaginal delivery. | ||||
| Outcome or subgroup title | No. of studies | No. of participants | Statistical method | Effect size |
| 2 Uterine hyperstimulation with FHR changes Show forest plot | 1 | 121 | Risk Ratio (M‐H, Fixed, 95% CI) | 6.67 [0.86, 51.67] |
| Analysis 50.2  Comparison 50 (7.5) PGE2 (controlled release) vs all PGE2 delivery systems (all women, intact membranes, unfav. cervix), Outcome 2 Uterine hyperstimulation with FHR changes. | ||||
| 3 Caesarean section Show forest plot | 1 | 121 | Risk Ratio (M‐H, Fixed, 95% CI) | 0.63 [0.15, 2.67] |
| Analysis 50.3  Comparison 50 (7.5) PGE2 (controlled release) vs all PGE2 delivery systems (all women, intact membranes, unfav. cervix), Outcome 3 Caesarean section. | ||||
| 7 Oxytocin augmentation Show forest plot | 1 | 121 | Risk Ratio (M‐H, Fixed, 95% CI) | 0.43 [0.26, 0.72] |
| Analysis 50.7  Comparison 50 (7.5) PGE2 (controlled release) vs all PGE2 delivery systems (all women, intact membranes, unfav. cervix), Outcome 7 Oxytocin augmentation. | ||||
| Outcome or subgroup title | No. of studies | No. of participants | Statistical method | Effect size |
| 2 Uterine hyperstimulation with FHR changes Show forest plot | 1 | 55 | Risk Ratio (M‐H, Fixed, 95% CI) | 7.44 [0.43, 128.16] |
| Analysis 51.2  Comparison 51 (7.10) PGE2 (controlled release) vs all PGE2 delivery systems (all primiparae), Outcome 2 Uterine hyperstimulation with FHR changes. | ||||
| 3 Caesarean section Show forest plot | 1 | 55 | Risk Ratio (M‐H, Fixed, 95% CI) | 0.67 [0.10, 4.39] |
| Analysis 51.3  Comparison 51 (7.10) PGE2 (controlled release) vs all PGE2 delivery systems (all primiparae), Outcome 3 Caesarean section. | ||||
| 7 Oxytocin augmentation Show forest plot | 1 | 55 | Risk Ratio (M‐H, Fixed, 95% CI) | 0.44 [0.22, 0.91] |
| Analysis 51.7  Comparison 51 (7.10) PGE2 (controlled release) vs all PGE2 delivery systems (all primiparae), Outcome 7 Oxytocin augmentation. | ||||
| 8 Uterine hyperstimulation without FHR changes Show forest plot | 1 | 95 | Risk Ratio (M‐H, Fixed, 95% CI) | 0.0 [0.0, 0.0] |
| Analysis 51.8  Comparison 51 (7.10) PGE2 (controlled release) vs all PGE2 delivery systems (all primiparae), Outcome 8 Uterine hyperstimulation without FHR changes. | ||||
| 10 Epidural analgesia Show forest plot | 1 | 95 | Risk Ratio (M‐H, Fixed, 95% CI) | 1.0 [0.82, 1.22] |
| Analysis 51.10  Comparison 51 (7.10) PGE2 (controlled release) vs all PGE2 delivery systems (all primiparae), Outcome 10 Epidural analgesia. | ||||
| Outcome or subgroup title | No. of studies | No. of participants | Statistical method | Effect size |
| 2 Uterine hyperstimulation with FHR changes Show forest plot | 1 | 55 | Risk Ratio (M‐H, Fixed, 95% CI) | 7.44 [0.43, 128.16] |
| Analysis 52.2  Comparison 52 (7.11) PGE2 (controlled release) vs all PGE2 delivery systems (all primiparae, unfavourable cervix), Outcome 2 Uterine hyperstimulation with FHR changes. | ||||
| 3 Caesarean section Show forest plot | 1 | 55 | Risk Ratio (M‐H, Fixed, 95% CI) | 0.67 [0.10, 4.39] |
| Analysis 52.3  Comparison 52 (7.11) PGE2 (controlled release) vs all PGE2 delivery systems (all primiparae, unfavourable cervix), Outcome 3 Caesarean section. | ||||
| 7 Oxytocin augmentation Show forest plot | 1 | 55 | Risk Ratio (M‐H, Fixed, 95% CI) | 0.44 [0.22, 0.91] |
| Analysis 52.7  Comparison 52 (7.11) PGE2 (controlled release) vs all PGE2 delivery systems (all primiparae, unfavourable cervix), Outcome 7 Oxytocin augmentation. | ||||
| 8 Uterine hyperstimulation without FHR changes Show forest plot | 1 | 95 | Risk Ratio (M‐H, Fixed, 95% CI) | 0.0 [0.0, 0.0] |
| Analysis 52.8  Comparison 52 (7.11) PGE2 (controlled release) vs all PGE2 delivery systems (all primiparae, unfavourable cervix), Outcome 8 Uterine hyperstimulation without FHR changes. | ||||
| 10 Epidural analgesia Show forest plot | 1 | 95 | Risk Ratio (M‐H, Fixed, 95% CI) | 1.0 [0.82, 1.22] |
| Analysis 52.10  Comparison 52 (7.11) PGE2 (controlled release) vs all PGE2 delivery systems (all primiparae, unfavourable cervix), Outcome 10 Epidural analgesia. | ||||
| Outcome or subgroup title | No. of studies | No. of participants | Statistical method | Effect size |
| 2 Uterine hyperstimulation with FHR changes Show forest plot | 1 | 55 | Risk Ratio (M‐H, Fixed, 95% CI) | 7.44 [0.43, 128.16] |
| Analysis 53.2  Comparison 53 (7.14) PGE2 (controlled release) vs all PGE2 delivery systems (all prim., intact membranes, unfav. cervix), Outcome 2 Uterine hyperstimulation with FHR changes. | ||||
| 3 Caesarean section Show forest plot | 1 | 55 | Risk Ratio (M‐H, Fixed, 95% CI) | 0.67 [0.10, 4.39] |
| Analysis 53.3  Comparison 53 (7.14) PGE2 (controlled release) vs all PGE2 delivery systems (all prim., intact membranes, unfav. cervix), Outcome 3 Caesarean section. | ||||
| 7 Oxytocin augmentation Show forest plot | 1 | 55 | Risk Ratio (M‐H, Fixed, 95% CI) | 0.44 [0.22, 0.91] |
| Analysis 53.7  Comparison 53 (7.14) PGE2 (controlled release) vs all PGE2 delivery systems (all prim., intact membranes, unfav. cervix), Outcome 7 Oxytocin augmentation. | ||||
| Outcome or subgroup title | No. of studies | No. of participants | Statistical method | Effect size |
| 2 Uterine hyperstimulation with FHR changes Show forest plot | 1 | 66 | Risk Ratio (M‐H, Fixed, 95% CI) | 3.0 [0.33, 27.38] |
| Analysis 54.2  Comparison 54 (7.19) PGE2 (controlled release) vs all PGE2 delivery systems (all multiparae), Outcome 2 Uterine hyperstimulation with FHR changes. | ||||
| 3 Caesarean section Show forest plot | 1 | 66 | Risk Ratio (M‐H, Fixed, 95% CI) | 0.5 [0.05, 5.25] |
| Analysis 54.3  Comparison 54 (7.19) PGE2 (controlled release) vs all PGE2 delivery systems (all multiparae), Outcome 3 Caesarean section. | ||||
| 7 Oxytocin augmentation Show forest plot | 1 | 66 | Risk Ratio (M‐H, Fixed, 95% CI) | 0.41 [0.20, 0.86] |
| Analysis 54.7  Comparison 54 (7.19) PGE2 (controlled release) vs all PGE2 delivery systems (all multiparae), Outcome 7 Oxytocin augmentation. | ||||
| Outcome or subgroup title | No. of studies | No. of participants | Statistical method | Effect size |
| 2 Uterine hyperstimulation with FHR changes Show forest plot | 1 | 66 | Risk Ratio (M‐H, Fixed, 95% CI) | 3.0 [0.33, 27.38] |
| Analysis 55.2  Comparison 55 (7.20) PGE2 (controlled release) vs all PGE2 delivery systems (all multiparae, unfavourable cervix), Outcome 2 Uterine hyperstimulation with FHR changes. | ||||
| 3 Caesarean section Show forest plot | 1 | 66 | Risk Ratio (M‐H, Fixed, 95% CI) | 0.5 [0.05, 5.25] |
| Analysis 55.3  Comparison 55 (7.20) PGE2 (controlled release) vs all PGE2 delivery systems (all multiparae, unfavourable cervix), Outcome 3 Caesarean section. | ||||
| 7 Oxytocin augmentation Show forest plot | 1 | 66 | Risk Ratio (M‐H, Fixed, 95% CI) | 0.41 [0.20, 0.86] |
| Analysis 55.7  Comparison 55 (7.20) PGE2 (controlled release) vs all PGE2 delivery systems (all multiparae, unfavourable cervix), Outcome 7 Oxytocin augmentation. | ||||
| Outcome or subgroup title | No. of studies | No. of participants | Statistical method | Effect size |
| 2 Uterine hyperstimulation with FHR changes Show forest plot | 1 | 66 | Risk Ratio (M‐H, Fixed, 95% CI) | 3.0 [0.33, 27.38] |
| Analysis 56.2  Comparison 56 (7.23) PGE2 (controlled release) vs all PGE2 delivery systems (all multi., intact membranes, unfav. cervix), Outcome 2 Uterine hyperstimulation with FHR changes. | ||||
| 3 Caesarean section Show forest plot | 1 | 66 | Risk Ratio (M‐H, Fixed, 95% CI) | 0.5 [0.05, 5.25] |
| Analysis 56.3  Comparison 56 (7.23) PGE2 (controlled release) vs all PGE2 delivery systems (all multi., intact membranes, unfav. cervix), Outcome 3 Caesarean section. | ||||
| 7 Oxytocin augmentation Show forest plot | 1 | 66 | Risk Ratio (M‐H, Fixed, 95% CI) | 0.41 [0.20, 0.86] |
| Analysis 56.7  Comparison 56 (7.23) PGE2 (controlled release) vs all PGE2 delivery systems (all multi., intact membranes, unfav. cervix), Outcome 7 Oxytocin augmentation. | ||||
| Outcome or subgroup title | No. of studies | No. of participants | Statistical method | Effect size |
| 2 Uterine hyperstimulation with FHR changes Show forest plot | 2 | 140 | Risk Ratio (M‐H, Fixed, 95% CI) | 0.18 [0.03, 0.99] |
| Analysis 57.2  Comparison 57 (8.1) PGE2 low dose vs PGE2 high dose (all women), Outcome 2 Uterine hyperstimulation with FHR changes. | ||||
| 3 Caesarean section Show forest plot | 7 | 1466 | Risk Ratio (M‐H, Fixed, 95% CI) | 1.07 [0.80, 1.42] |
| Analysis 57.3  Comparison 57 (8.1) PGE2 low dose vs PGE2 high dose (all women), Outcome 3 Caesarean section. | ||||
| 4 Serious neonatal morbidity or perinatal death Show forest plot | 1 | 955 | Risk Ratio (M‐H, Fixed, 95% CI) | 0.0 [0.0, 0.0] |
| Analysis 57.4  Comparison 57 (8.1) PGE2 low dose vs PGE2 high dose (all women), Outcome 4 Serious neonatal morbidity or perinatal death. | ||||
| 7 Oxytocin augmentation Show forest plot | 4 | 1219 | Risk Ratio (M‐H, Fixed, 95% CI) | 1.09 [0.95, 1.24] |
| Analysis 57.7  Comparison 57 (8.1) PGE2 low dose vs PGE2 high dose (all women), Outcome 7 Oxytocin augmentation. | ||||
| 8 Uterine hyperstimulation without FHR changes Show forest plot | 1 | 40 | Risk Ratio (M‐H, Fixed, 95% CI) | 0.2 [0.01, 3.92] |
| Analysis 57.8  Comparison 57 (8.1) PGE2 low dose vs PGE2 high dose (all women), Outcome 8 Uterine hyperstimulation without FHR changes. | ||||
| 10 Epidural analgesia Show forest plot | 3 | 1179 | Risk Ratio (M‐H, Fixed, 95% CI) | 1.11 [0.96, 1.29] |
| Analysis 57.10  Comparison 57 (8.1) PGE2 low dose vs PGE2 high dose (all women), Outcome 10 Epidural analgesia. | ||||
| 11 Instrumental vaginal delivery Show forest plot | 3 | 1179 | Risk Ratio (M‐H, Fixed, 95% CI) | 0.89 [0.70, 1.13] |
| Analysis 57.11  Comparison 57 (8.1) PGE2 low dose vs PGE2 high dose (all women), Outcome 11 Instrumental vaginal delivery. | ||||
| 12 Meconium stained liquor Show forest plot | 1 | 955 | Risk Ratio (M‐H, Fixed, 95% CI) | 0.86 [0.67, 1.10] |
| Analysis 57.12  Comparison 57 (8.1) PGE2 low dose vs PGE2 high dose (all women), Outcome 12 Meconium stained liquor. | ||||
| 13 Apgar score <7 at 5 minutes Show forest plot | 3 | 1064 | Risk Ratio (M‐H, Fixed, 95% CI) | 0.51 [0.20, 1.31] |
| Analysis 57.13  Comparison 57 (8.1) PGE2 low dose vs PGE2 high dose (all women), Outcome 13 Apgar score <7 at 5 minutes. | ||||
| 14 Neonatal intensive care unit admission Show forest plot | 1 | 955 | Risk Ratio (M‐H, Fixed, 95% CI) | 0.51 [0.24, 1.09] |
| Analysis 57.14  Comparison 57 (8.1) PGE2 low dose vs PGE2 high dose (all women), Outcome 14 Neonatal intensive care unit admission. | ||||
| 16 Perinatal death Show forest plot | 1 | 955 | Risk Ratio (M‐H, Fixed, 95% CI) | 0.0 [0.0, 0.0] |
| Analysis 57.16  Comparison 57 (8.1) PGE2 low dose vs PGE2 high dose (all women), Outcome 16 Perinatal death. | ||||
| 18 Maternal side‐effects (all) Show forest plot | 2 | 351 | Risk Ratio (M‐H, Fixed, 95% CI) | 0.34 [0.08, 1.36] |
| Analysis 57.18  Comparison 57 (8.1) PGE2 low dose vs PGE2 high dose (all women), Outcome 18 Maternal side‐effects (all). | ||||
| 19 Nausea (maternal) Show forest plot | 1 | 69 | Risk Ratio (M‐H, Fixed, 95% CI) | 0.34 [0.01, 8.13] |
| Analysis 57.19  Comparison 57 (8.1) PGE2 low dose vs PGE2 high dose (all women), Outcome 19 Nausea (maternal). | ||||
| 20 Vomitting (maternal) Show forest plot | 1 | 69 | Risk Ratio (M‐H, Fixed, 95% CI) | 0.34 [0.01, 8.13] |
| Analysis 57.20  Comparison 57 (8.1) PGE2 low dose vs PGE2 high dose (all women), Outcome 20 Vomitting (maternal). | ||||
| 21 Diarrhoea (maternal) Show forest plot | 1 | 69 | Risk Ratio (M‐H, Fixed, 95% CI) | 0.0 [0.0, 0.0] |
| Analysis 57.21  Comparison 57 (8.1) PGE2 low dose vs PGE2 high dose (all women), Outcome 21 Diarrhoea (maternal). | ||||
| 22 Other maternal side‐effects Show forest plot | 1 | 69 | Risk Ratio (M‐H, Fixed, 95% CI) | 0.0 [0.0, 0.0] |
| Analysis 57.22  Comparison 57 (8.1) PGE2 low dose vs PGE2 high dose (all women), Outcome 22 Other maternal side‐effects. | ||||
| 23 Postpartum haemorrhage Show forest plot | 2 | 1155 | Risk Ratio (M‐H, Fixed, 95% CI) | 1.28 [0.79, 2.09] |
| Analysis 57.23  Comparison 57 (8.1) PGE2 low dose vs PGE2 high dose (all women), Outcome 23 Postpartum haemorrhage. | ||||
| Outcome or subgroup title | No. of studies | No. of participants | Statistical method | Effect size |
| 2 Uterine hyperstimulation with FHR changes Show forest plot | 2 | 140 | Risk Ratio (M‐H, Fixed, 95% CI) | 0.18 [0.03, 0.99] |
| Analysis 58.2  Comparison 58 (8.2) PGE2 low dose vs PGE2 high dose (all women, unfavourable cervix), Outcome 2 Uterine hyperstimulation with FHR changes. | ||||
| 3 Caesarean section Show forest plot | 4 | 287 | Risk Ratio (M‐H, Fixed, 95% CI) | 1.13 [0.70, 1.81] |
| Analysis 58.3  Comparison 58 (8.2) PGE2 low dose vs PGE2 high dose (all women, unfavourable cervix), Outcome 3 Caesarean section. | ||||
| 7 Oxytocin augmentation Show forest plot | 1 | 40 | Risk Ratio (M‐H, Fixed, 95% CI) | 0.4 [0.09, 1.83] |
| Analysis 58.7  Comparison 58 (8.2) PGE2 low dose vs PGE2 high dose (all women, unfavourable cervix), Outcome 7 Oxytocin augmentation. | ||||
| 8 Uterine hyperstimulation without FHR changes Show forest plot | 1 | 40 | Risk Ratio (M‐H, Fixed, 95% CI) | 0.2 [0.01, 3.92] |
| Analysis 58.8  Comparison 58 (8.2) PGE2 low dose vs PGE2 high dose (all women, unfavourable cervix), Outcome 8 Uterine hyperstimulation without FHR changes. | ||||
| 13 Apgar score <7 at 5 minutes Show forest plot | 2 | 109 | Risk Ratio (M‐H, Fixed, 95% CI) | 0.21 [0.01, 4.13] |
| Analysis 58.13  Comparison 58 (8.2) PGE2 low dose vs PGE2 high dose (all women, unfavourable cervix), Outcome 13 Apgar score <7 at 5 minutes. | ||||
| 18 Maternal side‐effects (all) Show forest plot | 2 | 351 | Risk Ratio (M‐H, Fixed, 95% CI) | 0.34 [0.08, 1.36] |
| Analysis 58.18  Comparison 58 (8.2) PGE2 low dose vs PGE2 high dose (all women, unfavourable cervix), Outcome 18 Maternal side‐effects (all). | ||||
| 19 Nausea (maternal) Show forest plot | 1 | 69 | Risk Ratio (M‐H, Fixed, 95% CI) | 0.34 [0.01, 8.13] |
| Analysis 58.19  Comparison 58 (8.2) PGE2 low dose vs PGE2 high dose (all women, unfavourable cervix), Outcome 19 Nausea (maternal). | ||||
| 20 Vomitting (maternal) Show forest plot | 1 | 69 | Risk Ratio (M‐H, Fixed, 95% CI) | 0.34 [0.01, 8.13] |
| Analysis 58.20  Comparison 58 (8.2) PGE2 low dose vs PGE2 high dose (all women, unfavourable cervix), Outcome 20 Vomitting (maternal). | ||||
| 21 Diarrhoea (maternal) Show forest plot | 1 | 69 | Risk Ratio (M‐H, Fixed, 95% CI) | 0.0 [0.0, 0.0] |
| Analysis 58.21  Comparison 58 (8.2) PGE2 low dose vs PGE2 high dose (all women, unfavourable cervix), Outcome 21 Diarrhoea (maternal). | ||||
| 22 Other maternal side‐effects Show forest plot | 1 | 69 | Risk Ratio (M‐H, Fixed, 95% CI) | 0.0 [0.0, 0.0] |
| Analysis 58.22  Comparison 58 (8.2) PGE2 low dose vs PGE2 high dose (all women, unfavourable cervix), Outcome 22 Other maternal side‐effects. | ||||
| Outcome or subgroup title | No. of studies | No. of participants | Statistical method | Effect size |
| 3 Caesarean section Show forest plot | 1 | 200 | Risk Ratio (M‐H, Fixed, 95% CI) | 0.85 [0.42, 1.69] |
| Analysis 59.3  Comparison 59 (8.4) PGE2 low dose vs PGE2 high dose (all women, intact membranes, variable or undefined cervix), Outcome 3 Caesarean section. | ||||
| 7 Oxytocin augmentation Show forest plot | 1 | 200 | Risk Ratio (M‐H, Fixed, 95% CI) | 0.81 [0.63, 1.05] |
| Analysis 59.7  Comparison 59 (8.4) PGE2 low dose vs PGE2 high dose (all women, intact membranes, variable or undefined cervix), Outcome 7 Oxytocin augmentation. | ||||
| 10 Epidural analgesia Show forest plot | 1 | 200 | Risk Ratio (M‐H, Fixed, 95% CI) | 1.20 [0.80, 1.82] |
| Analysis 59.10  Comparison 59 (8.4) PGE2 low dose vs PGE2 high dose (all women, intact membranes, variable or undefined cervix), Outcome 10 Epidural analgesia. | ||||
| 11 Instrumental vaginal delivery Show forest plot | 1 | 200 | Risk Ratio (M‐H, Fixed, 95% CI) | 0.69 [0.38, 1.26] |
| Analysis 59.11  Comparison 59 (8.4) PGE2 low dose vs PGE2 high dose (all women, intact membranes, variable or undefined cervix), Outcome 11 Instrumental vaginal delivery. | ||||
| 23 Postpartum haemorrhage Show forest plot | 1 | 200 | Risk Ratio (M‐H, Fixed, 95% CI) | 0.75 [0.13, 4.40] |
| Analysis 59.23  Comparison 59 (8.4) PGE2 low dose vs PGE2 high dose (all women, intact membranes, variable or undefined cervix), Outcome 23 Postpartum haemorrhage. | ||||
| Outcome or subgroup title | No. of studies | No. of participants | Statistical method | Effect size |
| 2 Uterine hyperstimulation with FHR changes Show forest plot | 2 | 140 | Risk Ratio (M‐H, Fixed, 95% CI) | 0.18 [0.03, 0.99] |
| Analysis 60.2  Comparison 60 (8.5) PGE2 low dose vs PGE2 high dose (all women, intact membranes, unfavourable cervix), Outcome 2 Uterine hyperstimulation with FHR changes. | ||||
| 3 Caesarean section Show forest plot | 2 | 140 | Risk Ratio (M‐H, Fixed, 95% CI) | 1.03 [0.54, 1.94] |
| Analysis 60.3  Comparison 60 (8.5) PGE2 low dose vs PGE2 high dose (all women, intact membranes, unfavourable cervix), Outcome 3 Caesarean section. | ||||
| 13 Apgar score <7 at 5 minutes Show forest plot | 1 | 69 | Risk Ratio (M‐H, Fixed, 95% CI) | 0.21 [0.01, 4.13] |
| Analysis 60.13  Comparison 60 (8.5) PGE2 low dose vs PGE2 high dose (all women, intact membranes, unfavourable cervix), Outcome 13 Apgar score <7 at 5 minutes. | ||||
| 18 Maternal side‐effects (all) Show forest plot | 2 | 351 | Risk Ratio (M‐H, Fixed, 95% CI) | 0.34 [0.08, 1.36] |
| Analysis 60.18  Comparison 60 (8.5) PGE2 low dose vs PGE2 high dose (all women, intact membranes, unfavourable cervix), Outcome 18 Maternal side‐effects (all). | ||||
| 19 Nausea (maternal) Show forest plot | 1 | 69 | Risk Ratio (M‐H, Fixed, 95% CI) | 0.34 [0.01, 8.13] |
| Analysis 60.19  Comparison 60 (8.5) PGE2 low dose vs PGE2 high dose (all women, intact membranes, unfavourable cervix), Outcome 19 Nausea (maternal). | ||||
| 20 Vomitting (maternal) Show forest plot | 1 | 69 | Risk Ratio (M‐H, Fixed, 95% CI) | 0.34 [0.01, 8.13] |
| Analysis 60.20  Comparison 60 (8.5) PGE2 low dose vs PGE2 high dose (all women, intact membranes, unfavourable cervix), Outcome 20 Vomitting (maternal). | ||||
| 21 Diarrhoea (maternal) Show forest plot | 1 | 69 | Risk Ratio (M‐H, Fixed, 95% CI) | 0.0 [0.0, 0.0] |
| Analysis 60.21  Comparison 60 (8.5) PGE2 low dose vs PGE2 high dose (all women, intact membranes, unfavourable cervix), Outcome 21 Diarrhoea (maternal). | ||||
| 22 Other maternal side‐effects Show forest plot | 1 | 69 | Risk Ratio (M‐H, Fixed, 95% CI) | 0.0 [0.0, 0.0] |
| Analysis 60.22  Comparison 60 (8.5) PGE2 low dose vs PGE2 high dose (all women, intact membranes, unfavourable cervix), Outcome 22 Other maternal side‐effects. | ||||
| Outcome or subgroup title | No. of studies | No. of participants | Statistical method | Effect size |
| 3 Caesarean section Show forest plot | 1 | 499 | Risk Ratio (M‐H, Fixed, 95% CI) | 1.29 [0.82, 2.03] |
| Analysis 61.3  Comparison 61 (8.10) PGE2 low dose vs PGE2 high dose (all primiparae), Outcome 3 Caesarean section. | ||||
| 4 Serious neonatal morbidity or perinatal death Show forest plot | 1 | 499 | Risk Ratio (M‐H, Fixed, 95% CI) | 0.0 [0.0, 0.0] |
| Analysis 61.4  Comparison 61 (8.10) PGE2 low dose vs PGE2 high dose (all primiparae), Outcome 4 Serious neonatal morbidity or perinatal death. | ||||
| 7 Oxytocin augmentation Show forest plot | 1 | 499 | Risk Ratio (M‐H, Fixed, 95% CI) | 1.10 [0.94, 1.28] |
| Analysis 61.7  Comparison 61 (8.10) PGE2 low dose vs PGE2 high dose (all primiparae), Outcome 7 Oxytocin augmentation. | ||||
| 10 Epidural analgesia Show forest plot | 1 | 499 | Risk Ratio (M‐H, Fixed, 95% CI) | 1.19 [1.03, 1.39] |
| Analysis 61.10  Comparison 61 (8.10) PGE2 low dose vs PGE2 high dose (all primiparae), Outcome 10 Epidural analgesia. | ||||
| 11 Instrumental vaginal delivery Show forest plot | 1 | 499 | Risk Ratio (M‐H, Fixed, 95% CI) | 0.92 [0.71, 1.18] |
| Analysis 61.11  Comparison 61 (8.10) PGE2 low dose vs PGE2 high dose (all primiparae), Outcome 11 Instrumental vaginal delivery. | ||||
| 12 Meconium stained liquor Show forest plot | 1 | 499 | Risk Ratio (M‐H, Fixed, 95% CI) | 0.95 [0.72, 1.27] |
| Analysis 61.12  Comparison 61 (8.10) PGE2 low dose vs PGE2 high dose (all primiparae), Outcome 12 Meconium stained liquor. | ||||
| 13 Apgar score <7 at 5 minutes Show forest plot | 1 | 499 | Risk Ratio (M‐H, Fixed, 95% CI) | 0.16 [0.02, 1.27] |
| Analysis 61.13  Comparison 61 (8.10) PGE2 low dose vs PGE2 high dose (all primiparae), Outcome 13 Apgar score <7 at 5 minutes. | ||||
| 14 Neonatal intensive care unit admission Show forest plot | 1 | 499 | Risk Ratio (M‐H, Fixed, 95% CI) | 0.34 [0.11, 1.03] |
| Analysis 61.14  Comparison 61 (8.10) PGE2 low dose vs PGE2 high dose (all primiparae), Outcome 14 Neonatal intensive care unit admission. | ||||
| 16 Perinatal death Show forest plot | 1 | 499 | Risk Ratio (M‐H, Fixed, 95% CI) | 0.0 [0.0, 0.0] |
| Analysis 61.16  Comparison 61 (8.10) PGE2 low dose vs PGE2 high dose (all primiparae), Outcome 16 Perinatal death. | ||||
| 23 Postpartum haemorrhage Show forest plot | 1 | 499 | Risk Ratio (M‐H, Fixed, 95% CI) | 1.62 [0.86, 3.05] |
| Analysis 61.23  Comparison 61 (8.10) PGE2 low dose vs PGE2 high dose (all primiparae), Outcome 23 Postpartum haemorrhage. | ||||
| Outcome or subgroup title | No. of studies | No. of participants | Statistical method | Effect size |
| 3 Caesarean section Show forest plot | 1 | 456 | Risk Ratio (M‐H, Fixed, 95% CI) | 0.68 [0.19, 2.51] |
| Analysis 62.3  Comparison 62 (8.19) PGE2 low dose vs PGE2 high dose (all multiparae), Outcome 3 Caesarean section. | ||||
| 4 Serious neonatal morbidity or perinatal death Show forest plot | 1 | 456 | Risk Ratio (M‐H, Fixed, 95% CI) | 0.0 [0.0, 0.0] |
| Analysis 62.4  Comparison 62 (8.19) PGE2 low dose vs PGE2 high dose (all multiparae), Outcome 4 Serious neonatal morbidity or perinatal death. | ||||
| 7 Oxytocin augmentation Show forest plot | 1 | 456 | Risk Ratio (M‐H, Fixed, 95% CI) | 1.94 [1.35, 2.80] |
| Analysis 62.7  Comparison 62 (8.19) PGE2 low dose vs PGE2 high dose (all multiparae), Outcome 7 Oxytocin augmentation. | ||||
| 10 Epidural analgesia Show forest plot | 1 | 456 | Risk Ratio (M‐H, Fixed, 95% CI) | 1.15 [0.77, 1.70] |
| Analysis 62.10  Comparison 62 (8.19) PGE2 low dose vs PGE2 high dose (all multiparae), Outcome 10 Epidural analgesia. | ||||
| 11 Instrumental vaginal delivery Show forest plot | 1 | 456 | Risk Ratio (M‐H, Fixed, 95% CI) | 5.98 [1.37, 25.99] |
| Analysis 62.11  Comparison 62 (8.19) PGE2 low dose vs PGE2 high dose (all multiparae), Outcome 11 Instrumental vaginal delivery. | ||||
| 12 Meconium stained liquor Show forest plot | 1 | 456 | Risk Ratio (M‐H, Fixed, 95% CI) | 0.77 [0.48, 1.24] |
| Analysis 62.12  Comparison 62 (8.19) PGE2 low dose vs PGE2 high dose (all multiparae), Outcome 12 Meconium stained liquor. | ||||
| 13 Apgar score <7 at 5 minutes Show forest plot | 1 | 456 | Risk Ratio (M‐H, Fixed, 95% CI) | 1.42 [0.34, 5.88] |
| Analysis 62.13  Comparison 62 (8.19) PGE2 low dose vs PGE2 high dose (all multiparae), Outcome 13 Apgar score <7 at 5 minutes. | ||||
| 14 Neonatal intensive care unit admission Show forest plot | 1 | 492 | Risk Ratio (M‐H, Fixed, 95% CI) | 1.0 [0.33, 3.06] |
| Analysis 62.14  Comparison 62 (8.19) PGE2 low dose vs PGE2 high dose (all multiparae), Outcome 14 Neonatal intensive care unit admission. | ||||
| 16 Perinatal death Show forest plot | 1 | 465 | Risk Ratio (M‐H, Fixed, 95% CI) | 0.0 [0.0, 0.0] |
| Analysis 62.16  Comparison 62 (8.19) PGE2 low dose vs PGE2 high dose (all multiparae), Outcome 16 Perinatal death. | ||||
| 23 Postpartum haemorrhage Show forest plot | 1 | 456 | Risk Ratio (M‐H, Fixed, 95% CI) | 1.04 [0.44, 2.47] |
| Analysis 62.23  Comparison 62 (8.19) PGE2 low dose vs PGE2 high dose (all multiparae), Outcome 23 Postpartum haemorrhage. | ||||
| Outcome or subgroup title | No. of studies | No. of participants | Statistical method | Effect size |
| 2 Uterine hyperstimulation with FHR changes Show forest plot | 1 | 100 | Risk Ratio (M‐H, Fixed, 95% CI) | 0.0 [0.0, 0.0] |
| Analysis 63.2  Comparison 63 PGE2 (all regimens) vs placebo/no treatment (all women, outpatient ripening), Outcome 2 Uterine hyperstimulation with FHR changes. | ||||
| 2.2 PGE2 (repeated doses) vs placebo/no treatment | 1 | 100 | Risk Ratio (M‐H, Fixed, 95% CI) | 0.0 [0.0, 0.0] |
| 3 Caesarean section Show forest plot | 2 | 300 | Risk Ratio (M‐H, Fixed, 95% CI) | 0.70 [0.42, 1.18] |
| Analysis 63.3  Comparison 63 PGE2 (all regimens) vs placebo/no treatment (all women, outpatient ripening), Outcome 3 Caesarean section. | ||||
| 3.2 PGE2 (repeated doses) vs placebo/no treatment | 2 | 300 | Risk Ratio (M‐H, Fixed, 95% CI) | 0.70 [0.42, 1.18] |
| 6 Cervix unfavourable/unchanged after 12 to 24 hours Show forest plot | 1 | 36 | Risk Ratio (M‐H, Fixed, 95% CI) | 0.13 [0.03, 0.47] |
| Analysis 63.6  Comparison 63 PGE2 (all regimens) vs placebo/no treatment (all women, outpatient ripening), Outcome 6 Cervix unfavourable/unchanged after 12 to 24 hours. | ||||
| 6.2 PGE2 (repeated doses) vs placebo/no treatment | 1 | 36 | Risk Ratio (M‐H, Fixed, 95% CI) | 0.13 [0.03, 0.47] |
| 8 Uterine hyperstimulation without FHR changes Show forest plot | 1 | 100 | Risk Ratio (M‐H, Fixed, 95% CI) | 3.0 [0.13, 71.92] |
| Analysis 63.8  Comparison 63 PGE2 (all regimens) vs placebo/no treatment (all women, outpatient ripening), Outcome 8 Uterine hyperstimulation without FHR changes. | ||||
| 8.2 PGE2 (repeated doses) vs placebo/no treatment | 1 | 100 | Risk Ratio (M‐H, Fixed, 95% CI) | 3.0 [0.13, 71.92] |
| 10 Epidural analgesia Show forest plot | 1 | 100 | Risk Ratio (M‐H, Fixed, 95% CI) | 0.83 [0.62, 1.12] |
| Analysis 63.10  Comparison 63 PGE2 (all regimens) vs placebo/no treatment (all women, outpatient ripening), Outcome 10 Epidural analgesia. | ||||
| 10.2 PGE2 (repeated doses) vs placebo/no treatment | 1 | 100 | Risk Ratio (M‐H, Fixed, 95% CI) | 0.83 [0.62, 1.12] |
| 12 Meconium stained liquor Show forest plot | 2 | 300 | Risk Ratio (M‐H, Fixed, 95% CI) | 0.43 [0.28, 0.66] |
| Analysis 63.12  Comparison 63 PGE2 (all regimens) vs placebo/no treatment (all women, outpatient ripening), Outcome 12 Meconium stained liquor. | ||||
| 12.2 PGE2 (repeated doses) vs placebo/no treatment | 2 | 300 | Risk Ratio (M‐H, Fixed, 95% CI) | 0.43 [0.28, 0.66] |
| 13 Apgar score <7 at 5 minutes Show forest plot | 1 | 100 | Risk Ratio (M‐H, Fixed, 95% CI) | 0.2 [0.01, 4.06] |
| Analysis 63.13  Comparison 63 PGE2 (all regimens) vs placebo/no treatment (all women, outpatient ripening), Outcome 13 Apgar score <7 at 5 minutes. | ||||
| 13.2 PGE2 (repeated doses) vs placebo/no treatment | 1 | 100 | Risk Ratio (M‐H, Fixed, 95% CI) | 0.2 [0.01, 4.06] |
| 14 Neonatal intensive care unit admission Show forest plot | 1 | 100 | Risk Ratio (M‐H, Fixed, 95% CI) | 0.2 [0.02, 1.65] |
| Analysis 63.14  Comparison 63 PGE2 (all regimens) vs placebo/no treatment (all women, outpatient ripening), Outcome 14 Neonatal intensive care unit admission. | ||||
| 14.2 PGE2 (repeated doses) vs placebo/no treatment | 1 | 100 | Risk Ratio (M‐H, Fixed, 95% CI) | 0.2 [0.02, 1.65] |

Comparison 1 (1.1) PGE2 (all regimens) vs placebo/no treatment (all women), Outcome 1 Vaginal delivery not achieved within 24 hours.

Comparison 1 (1.1) PGE2 (all regimens) vs placebo/no treatment (all women), Outcome 2 Uterine hyperstimulation with FHR changes.
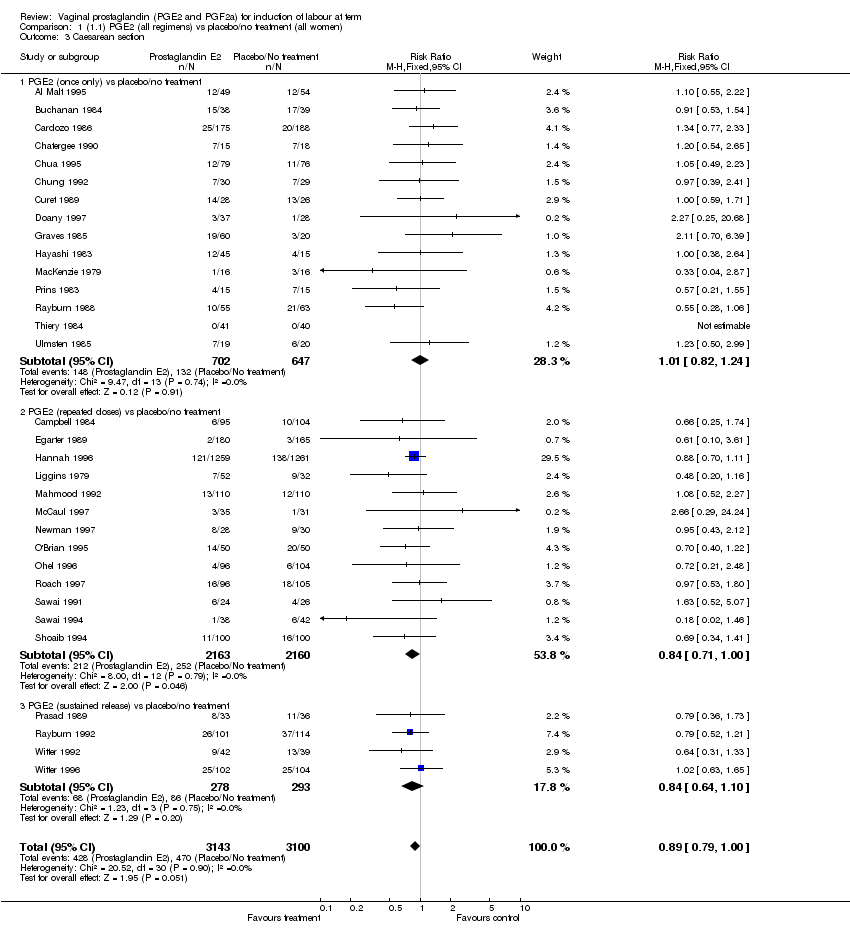
Comparison 1 (1.1) PGE2 (all regimens) vs placebo/no treatment (all women), Outcome 3 Caesarean section.
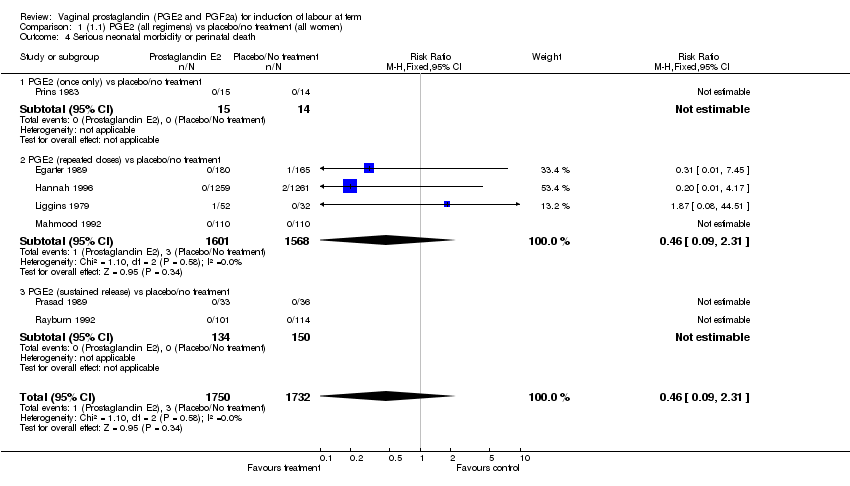
Comparison 1 (1.1) PGE2 (all regimens) vs placebo/no treatment (all women), Outcome 4 Serious neonatal morbidity or perinatal death.

Comparison 1 (1.1) PGE2 (all regimens) vs placebo/no treatment (all women), Outcome 5 Serious maternal morbidity or death.

Comparison 1 (1.1) PGE2 (all regimens) vs placebo/no treatment (all women), Outcome 6 Cervix unfavourable/unchanged after 12 to 24 hours.
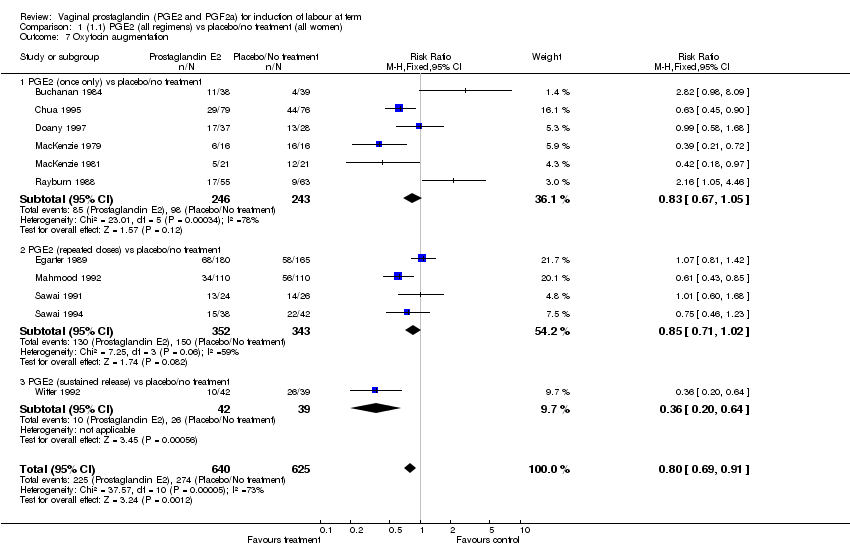
Comparison 1 (1.1) PGE2 (all regimens) vs placebo/no treatment (all women), Outcome 7 Oxytocin augmentation.

Comparison 1 (1.1) PGE2 (all regimens) vs placebo/no treatment (all women), Outcome 8 Uterine hyperstimulation without FHR changes.
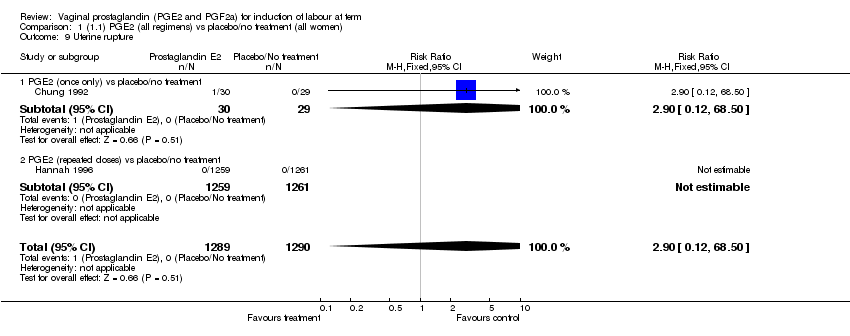
Comparison 1 (1.1) PGE2 (all regimens) vs placebo/no treatment (all women), Outcome 9 Uterine rupture.

Comparison 1 (1.1) PGE2 (all regimens) vs placebo/no treatment (all women), Outcome 10 Epidural analgesia.
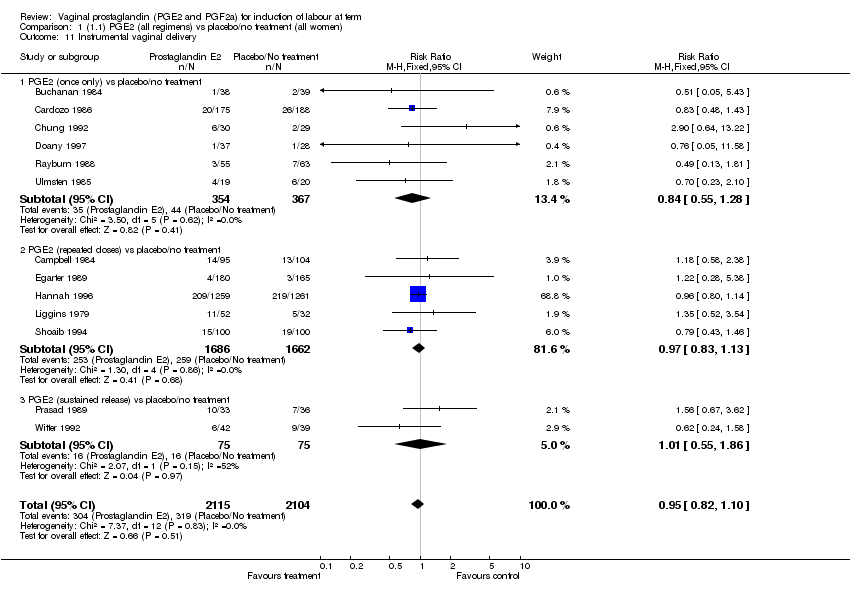
Comparison 1 (1.1) PGE2 (all regimens) vs placebo/no treatment (all women), Outcome 11 Instrumental vaginal delivery.

Comparison 1 (1.1) PGE2 (all regimens) vs placebo/no treatment (all women), Outcome 12 Meconium stained liquor.
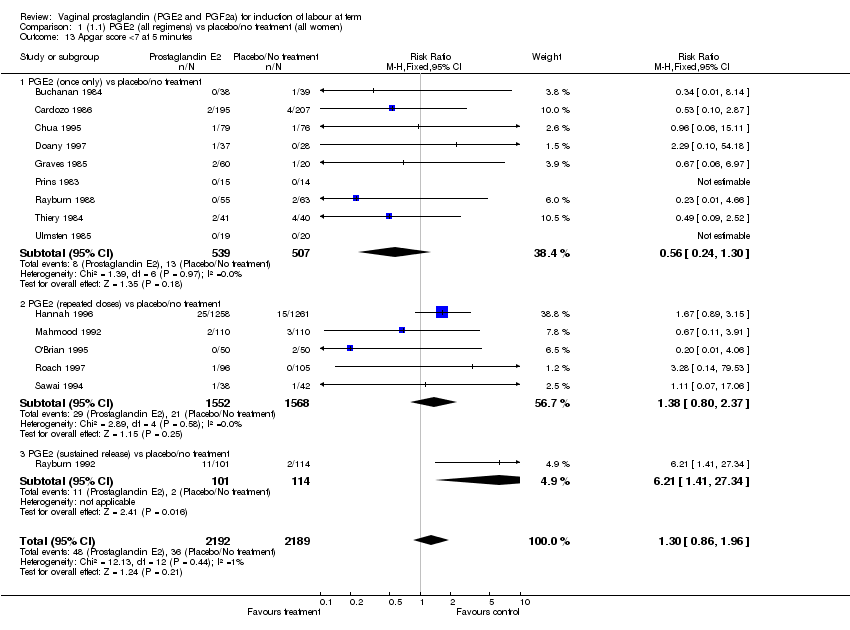
Comparison 1 (1.1) PGE2 (all regimens) vs placebo/no treatment (all women), Outcome 13 Apgar score <7 at 5 minutes.

Comparison 1 (1.1) PGE2 (all regimens) vs placebo/no treatment (all women), Outcome 14 Neonatal intensive care unit admission.

Comparison 1 (1.1) PGE2 (all regimens) vs placebo/no treatment (all women), Outcome 16 Perinatal death.

Comparison 1 (1.1) PGE2 (all regimens) vs placebo/no treatment (all women), Outcome 18 Maternal side‐effects (all).

Comparison 1 (1.1) PGE2 (all regimens) vs placebo/no treatment (all women), Outcome 19 Nausea (maternal).

Comparison 1 (1.1) PGE2 (all regimens) vs placebo/no treatment (all women), Outcome 20 Vomitting (maternal).

Comparison 1 (1.1) PGE2 (all regimens) vs placebo/no treatment (all women), Outcome 21 Diarrhoea (maternal).
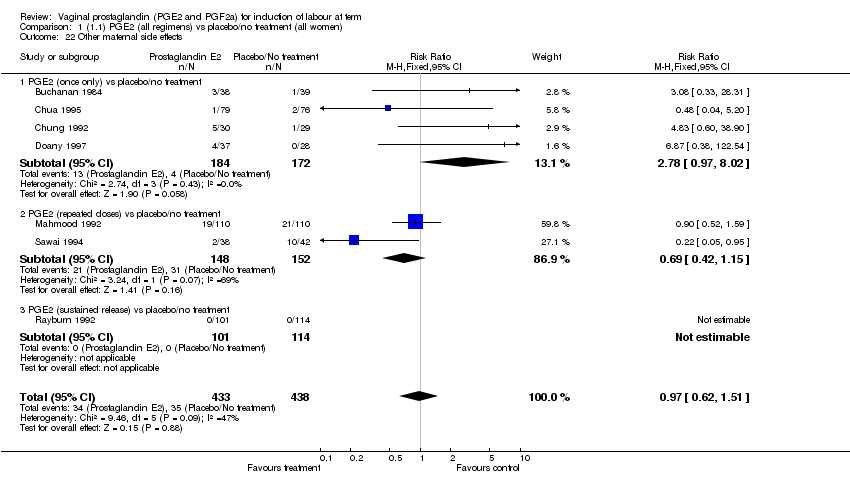
Comparison 1 (1.1) PGE2 (all regimens) vs placebo/no treatment (all women), Outcome 22 Other maternal side effects.
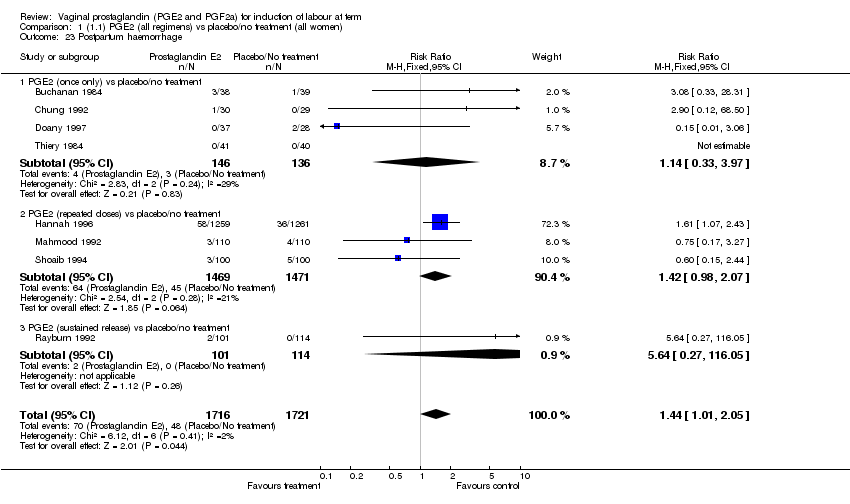
Comparison 1 (1.1) PGE2 (all regimens) vs placebo/no treatment (all women), Outcome 23 Postpartum haemorrhage.
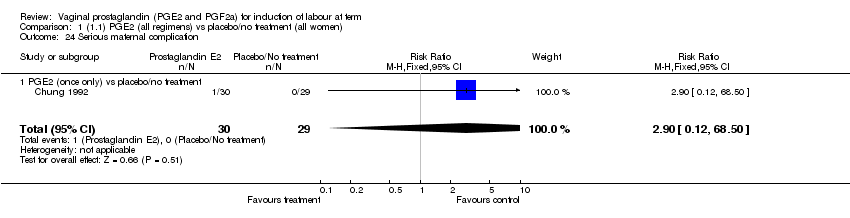
Comparison 1 (1.1) PGE2 (all regimens) vs placebo/no treatment (all women), Outcome 24 Serious maternal complication.
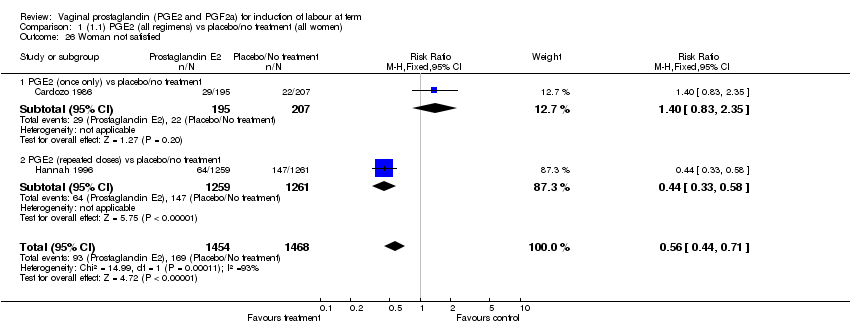
Comparison 1 (1.1) PGE2 (all regimens) vs placebo/no treatment (all women), Outcome 26 Woman not satisfied.

Comparison 2 (1.2) PGE2 (all regimens) vs placebo/no treatment (all women, unfavourable cervix), Outcome 1 Vaginal delivery not achieved within 24 hours.

Comparison 2 (1.2) PGE2 (all regimens) vs placebo/no treatment (all women, unfavourable cervix), Outcome 2 Uterine hyperstimulation with FHR changes.

Comparison 2 (1.2) PGE2 (all regimens) vs placebo/no treatment (all women, unfavourable cervix), Outcome 3 Caesarean section.
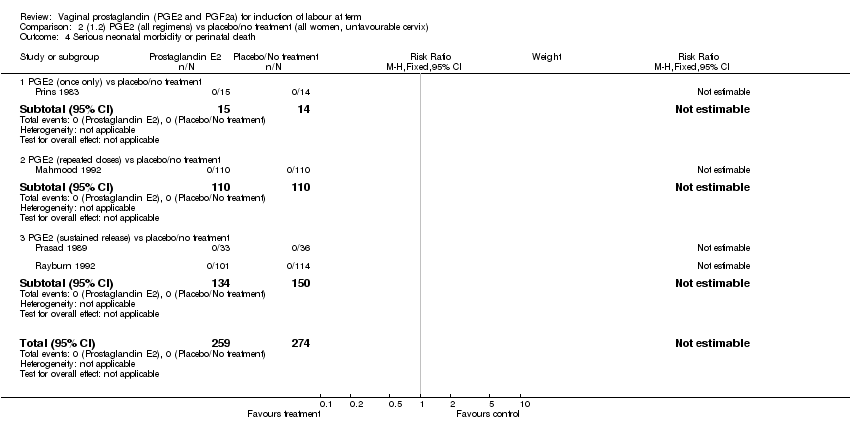
Comparison 2 (1.2) PGE2 (all regimens) vs placebo/no treatment (all women, unfavourable cervix), Outcome 4 Serious neonatal morbidity or perinatal death.
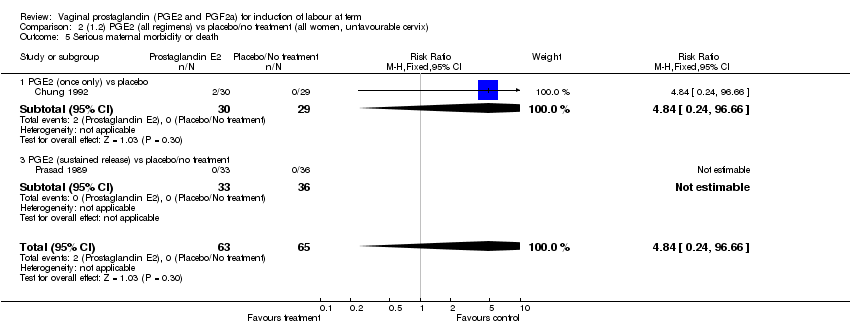
Comparison 2 (1.2) PGE2 (all regimens) vs placebo/no treatment (all women, unfavourable cervix), Outcome 5 Serious maternal morbidity or death.

Comparison 2 (1.2) PGE2 (all regimens) vs placebo/no treatment (all women, unfavourable cervix), Outcome 6 Cervix unfavourable/unchanged after 12 to 24 hours.

Comparison 2 (1.2) PGE2 (all regimens) vs placebo/no treatment (all women, unfavourable cervix), Outcome 7 Oxytocin augmentation.
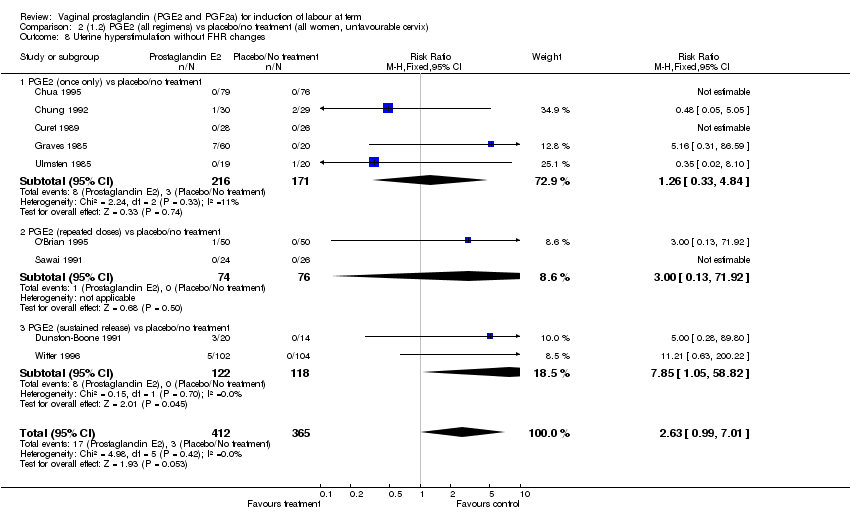
Comparison 2 (1.2) PGE2 (all regimens) vs placebo/no treatment (all women, unfavourable cervix), Outcome 8 Uterine hyperstimulation without FHR changes.

Comparison 2 (1.2) PGE2 (all regimens) vs placebo/no treatment (all women, unfavourable cervix), Outcome 9 Uterine rupture.

Comparison 2 (1.2) PGE2 (all regimens) vs placebo/no treatment (all women, unfavourable cervix), Outcome 10 Epidural analgesia.

Comparison 2 (1.2) PGE2 (all regimens) vs placebo/no treatment (all women, unfavourable cervix), Outcome 11 Instrumental vaginal delivery.

Comparison 2 (1.2) PGE2 (all regimens) vs placebo/no treatment (all women, unfavourable cervix), Outcome 12 Meconium stained liquor.

Comparison 2 (1.2) PGE2 (all regimens) vs placebo/no treatment (all women, unfavourable cervix), Outcome 13 Apgar score <7 at 5 minutes.
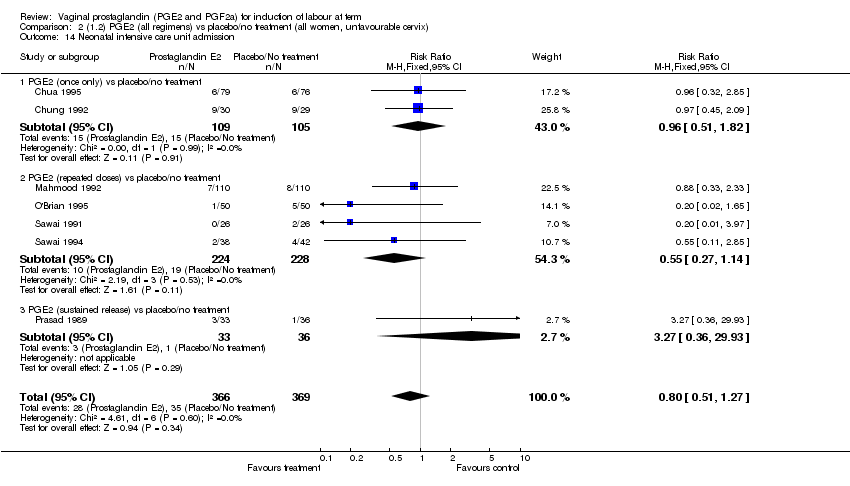
Comparison 2 (1.2) PGE2 (all regimens) vs placebo/no treatment (all women, unfavourable cervix), Outcome 14 Neonatal intensive care unit admission.

Comparison 2 (1.2) PGE2 (all regimens) vs placebo/no treatment (all women, unfavourable cervix), Outcome 16 Perinatal death.
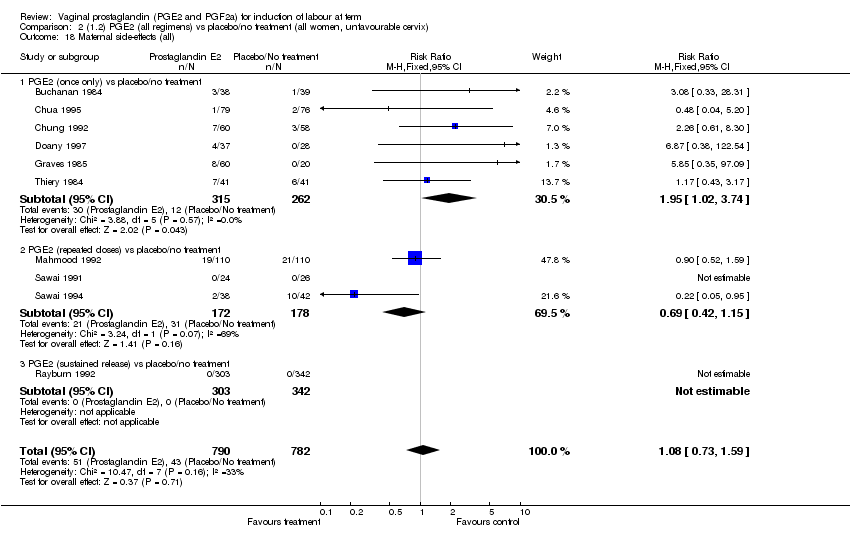
Comparison 2 (1.2) PGE2 (all regimens) vs placebo/no treatment (all women, unfavourable cervix), Outcome 18 Maternal side‐effects (all).
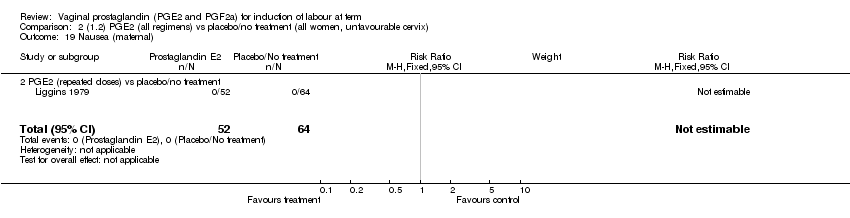
Comparison 2 (1.2) PGE2 (all regimens) vs placebo/no treatment (all women, unfavourable cervix), Outcome 19 Nausea (maternal).
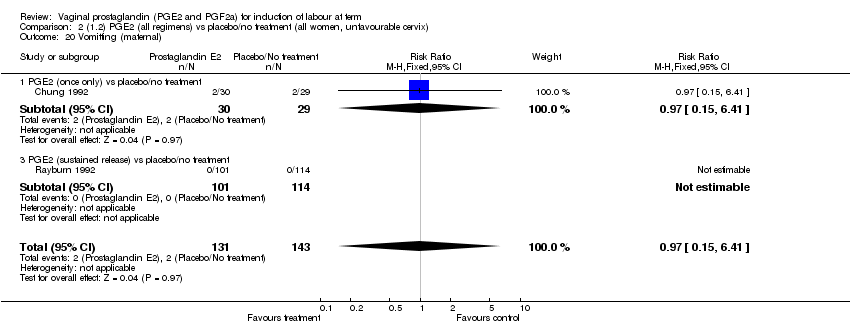
Comparison 2 (1.2) PGE2 (all regimens) vs placebo/no treatment (all women, unfavourable cervix), Outcome 20 Vomitting (maternal).
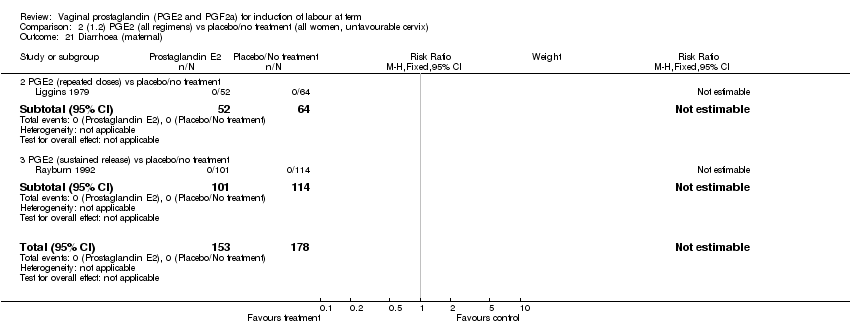
Comparison 2 (1.2) PGE2 (all regimens) vs placebo/no treatment (all women, unfavourable cervix), Outcome 21 Diarrhoea (maternal).

Comparison 2 (1.2) PGE2 (all regimens) vs placebo/no treatment (all women, unfavourable cervix), Outcome 22 Other maternal side effects.

Comparison 2 (1.2) PGE2 (all regimens) vs placebo/no treatment (all women, unfavourable cervix), Outcome 23 Postpartum haemorrhage.
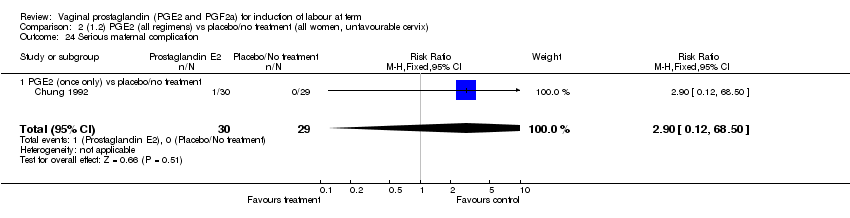
Comparison 2 (1.2) PGE2 (all regimens) vs placebo/no treatment (all women, unfavourable cervix), Outcome 24 Serious maternal complication.

Comparison 3 (1.3) PGE2 (all regimens) vs placebo/no treatment (all women, favourable cervix), Outcome 1 Vaginal delivery not achieved within 24 hours.

Comparison 3 (1.3) PGE2 (all regimens) vs placebo/no treatment (all women, favourable cervix), Outcome 3 Caesarean section.

Comparison 3 (1.3) PGE2 (all regimens) vs placebo/no treatment (all women, favourable cervix), Outcome 4 Serious neonatal morbidity or perinatal death.

Comparison 3 (1.3) PGE2 (all regimens) vs placebo/no treatment (all women, favourable cervix), Outcome 7 Oxytocin augmentation.

Comparison 3 (1.3) PGE2 (all regimens) vs placebo/no treatment (all women, favourable cervix), Outcome 11 Instrumental vaginal delivery.

Comparison 3 (1.3) PGE2 (all regimens) vs placebo/no treatment (all women, favourable cervix), Outcome 16 Perinatal death.
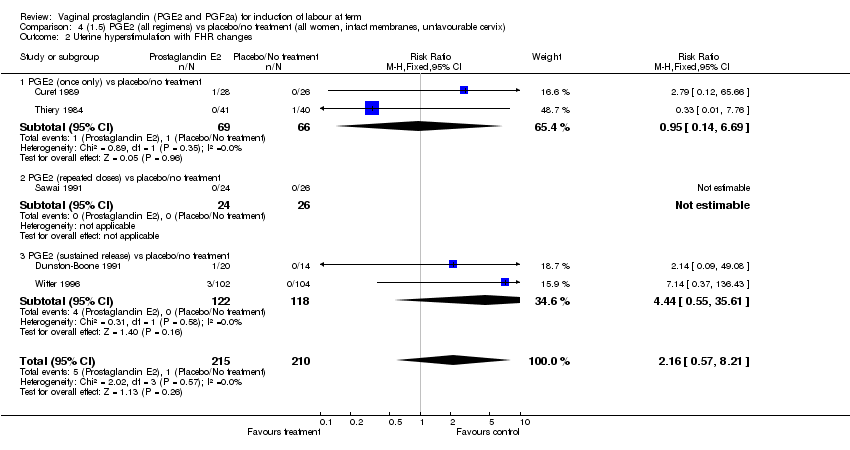
Comparison 4 (1.5) PGE2 (all regimens) vs placebo/no treatment (all women, intact membranes, unfavourable cervix), Outcome 2 Uterine hyperstimulation with FHR changes.
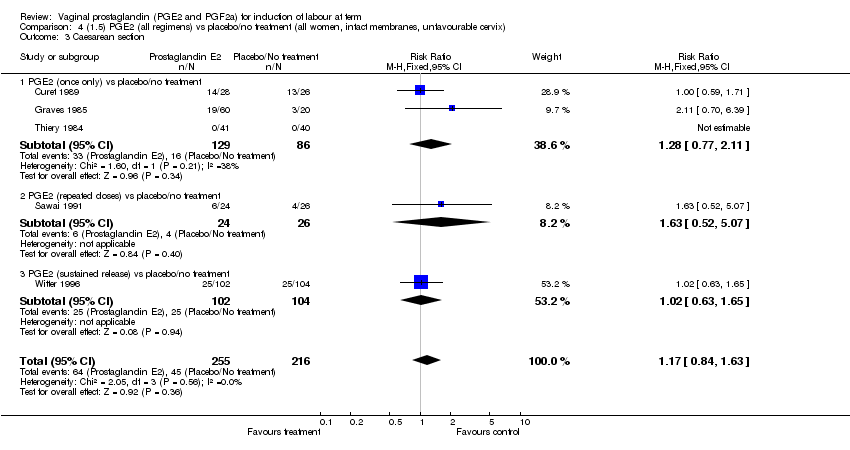
Comparison 4 (1.5) PGE2 (all regimens) vs placebo/no treatment (all women, intact membranes, unfavourable cervix), Outcome 3 Caesarean section.

Comparison 4 (1.5) PGE2 (all regimens) vs placebo/no treatment (all women, intact membranes, unfavourable cervix), Outcome 6 Cervix unfavourable/unchanged after 12 to 24 hours.
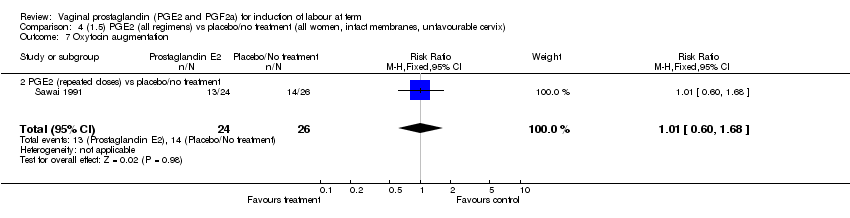
Comparison 4 (1.5) PGE2 (all regimens) vs placebo/no treatment (all women, intact membranes, unfavourable cervix), Outcome 7 Oxytocin augmentation.

Comparison 4 (1.5) PGE2 (all regimens) vs placebo/no treatment (all women, intact membranes, unfavourable cervix), Outcome 8 Uterine hyperstimulation without FHR changes.

Comparison 4 (1.5) PGE2 (all regimens) vs placebo/no treatment (all women, intact membranes, unfavourable cervix), Outcome 13 Apgar score <7 at 5 minutes.

Comparison 4 (1.5) PGE2 (all regimens) vs placebo/no treatment (all women, intact membranes, unfavourable cervix), Outcome 14 Neonatal intensive care unit admission.

Comparison 4 (1.5) PGE2 (all regimens) vs placebo/no treatment (all women, intact membranes, unfavourable cervix), Outcome 18 Maternal side‐effects (all).

Comparison 4 (1.5) PGE2 (all regimens) vs placebo/no treatment (all women, intact membranes, unfavourable cervix), Outcome 23 Postpartum haemorrhage.
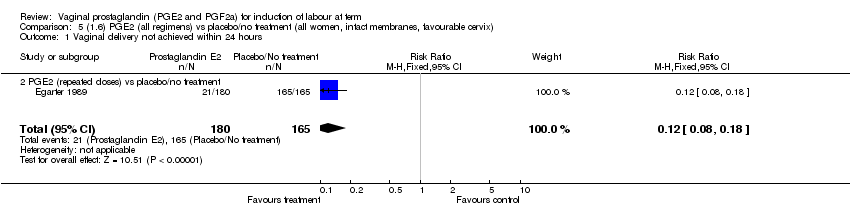
Comparison 5 (1.6) PGE2 (all regimens) vs placebo/no treatment (all women, intact membranes, favourable cervix), Outcome 1 Vaginal delivery not achieved within 24 hours.

Comparison 5 (1.6) PGE2 (all regimens) vs placebo/no treatment (all women, intact membranes, favourable cervix), Outcome 3 Caesarean section.

Comparison 5 (1.6) PGE2 (all regimens) vs placebo/no treatment (all women, intact membranes, favourable cervix), Outcome 4 Serious neonatal morbidity or perinatal death.

Comparison 5 (1.6) PGE2 (all regimens) vs placebo/no treatment (all women, intact membranes, favourable cervix), Outcome 7 Oxytocin augmentation.

Comparison 5 (1.6) PGE2 (all regimens) vs placebo/no treatment (all women, intact membranes, favourable cervix), Outcome 11 Instrumental vaginal delivery.
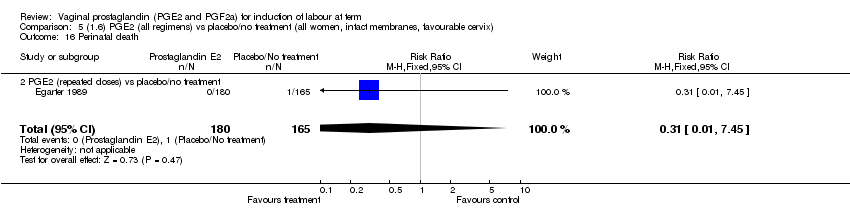
Comparison 5 (1.6) PGE2 (all regimens) vs placebo/no treatment (all women, intact membranes, favourable cervix), Outcome 16 Perinatal death.

Comparison 6 (1.7) PGE2 (all regimens) vs placebo/no treatment (all women, ruptured membranes, variable/undefined cervix), Outcome 3 Caesarean section.
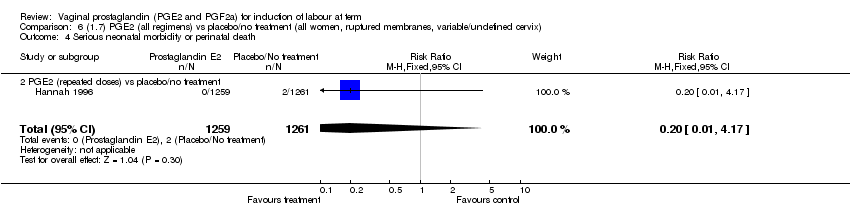
Comparison 6 (1.7) PGE2 (all regimens) vs placebo/no treatment (all women, ruptured membranes, variable/undefined cervix), Outcome 4 Serious neonatal morbidity or perinatal death.

Comparison 6 (1.7) PGE2 (all regimens) vs placebo/no treatment (all women, ruptured membranes, variable/undefined cervix), Outcome 8 Uterine hyperstimulation without FHR changes.

Comparison 6 (1.7) PGE2 (all regimens) vs placebo/no treatment (all women, ruptured membranes, variable/undefined cervix), Outcome 9 Uterine rupture.
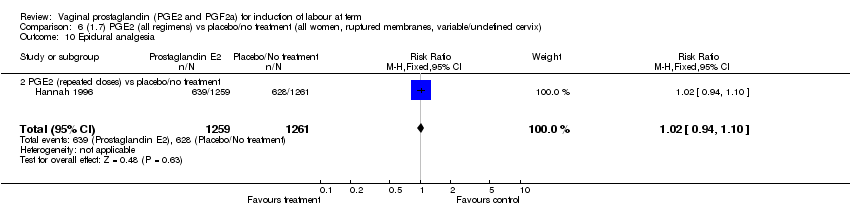
Comparison 6 (1.7) PGE2 (all regimens) vs placebo/no treatment (all women, ruptured membranes, variable/undefined cervix), Outcome 10 Epidural analgesia.

Comparison 6 (1.7) PGE2 (all regimens) vs placebo/no treatment (all women, ruptured membranes, variable/undefined cervix), Outcome 11 Instrumental vaginal delivery.

Comparison 6 (1.7) PGE2 (all regimens) vs placebo/no treatment (all women, ruptured membranes, variable/undefined cervix), Outcome 12 Meconium stained liquor.

Comparison 6 (1.7) PGE2 (all regimens) vs placebo/no treatment (all women, ruptured membranes, variable/undefined cervix), Outcome 13 Apgar score <7 at 5 minutes.

Comparison 6 (1.7) PGE2 (all regimens) vs placebo/no treatment (all women, ruptured membranes, variable/undefined cervix), Outcome 14 Neonatal intensive care unit admission.

Comparison 6 (1.7) PGE2 (all regimens) vs placebo/no treatment (all women, ruptured membranes, variable/undefined cervix), Outcome 16 Perinatal death.

Comparison 6 (1.7) PGE2 (all regimens) vs placebo/no treatment (all women, ruptured membranes, variable/undefined cervix), Outcome 18 Maternal side‐effects (all).
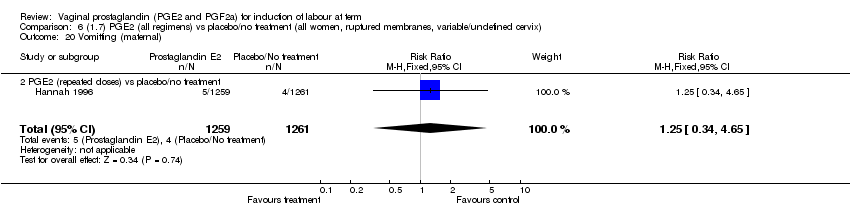
Comparison 6 (1.7) PGE2 (all regimens) vs placebo/no treatment (all women, ruptured membranes, variable/undefined cervix), Outcome 20 Vomitting (maternal).
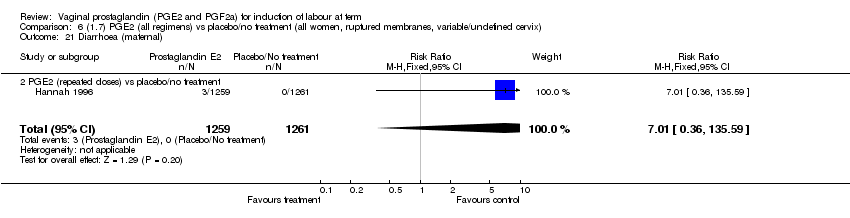
Comparison 6 (1.7) PGE2 (all regimens) vs placebo/no treatment (all women, ruptured membranes, variable/undefined cervix), Outcome 21 Diarrhoea (maternal).

Comparison 6 (1.7) PGE2 (all regimens) vs placebo/no treatment (all women, ruptured membranes, variable/undefined cervix), Outcome 23 Postpartum haemorrhage.

Comparison 6 (1.7) PGE2 (all regimens) vs placebo/no treatment (all women, ruptured membranes, variable/undefined cervix), Outcome 26 Woman not satisfied.

Comparison 7 (1.8) PGE2 (all regimens) vs placebo/no treatment (all women, ruptured membranes, unfavourable cervix), Outcome 2 Uterine hyperstimulation with FHR changes.
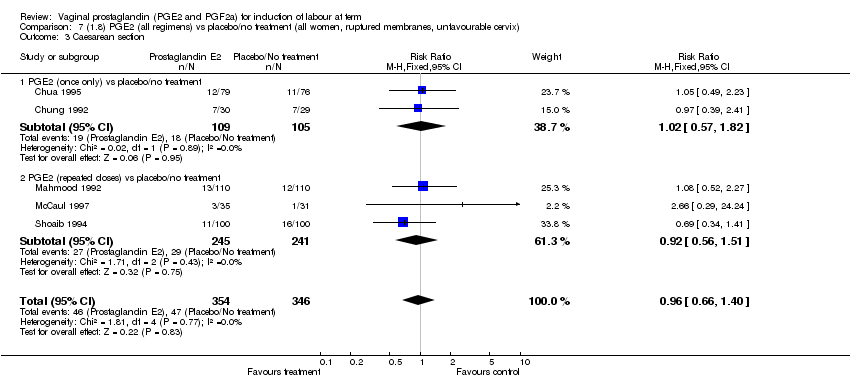
Comparison 7 (1.8) PGE2 (all regimens) vs placebo/no treatment (all women, ruptured membranes, unfavourable cervix), Outcome 3 Caesarean section.

Comparison 7 (1.8) PGE2 (all regimens) vs placebo/no treatment (all women, ruptured membranes, unfavourable cervix), Outcome 4 Serious neonatal morbidity or perinatal death.
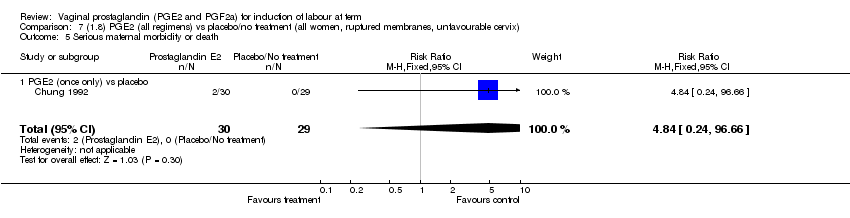
Comparison 7 (1.8) PGE2 (all regimens) vs placebo/no treatment (all women, ruptured membranes, unfavourable cervix), Outcome 5 Serious maternal morbidity or death.

Comparison 7 (1.8) PGE2 (all regimens) vs placebo/no treatment (all women, ruptured membranes, unfavourable cervix), Outcome 7 Oxytocin augmentation.

Comparison 7 (1.8) PGE2 (all regimens) vs placebo/no treatment (all women, ruptured membranes, unfavourable cervix), Outcome 8 Uterine hyperstimulation without FHR changes.

Comparison 7 (1.8) PGE2 (all regimens) vs placebo/no treatment (all women, ruptured membranes, unfavourable cervix), Outcome 9 Uterine rupture.

Comparison 7 (1.8) PGE2 (all regimens) vs placebo/no treatment (all women, ruptured membranes, unfavourable cervix), Outcome 10 Epidural analgesia.

Comparison 7 (1.8) PGE2 (all regimens) vs placebo/no treatment (all women, ruptured membranes, unfavourable cervix), Outcome 11 Instrumental vaginal delivery.

Comparison 7 (1.8) PGE2 (all regimens) vs placebo/no treatment (all women, ruptured membranes, unfavourable cervix), Outcome 12 Meconium stained liquor.

Comparison 7 (1.8) PGE2 (all regimens) vs placebo/no treatment (all women, ruptured membranes, unfavourable cervix), Outcome 13 Apgar score <7 at 5 minutes.
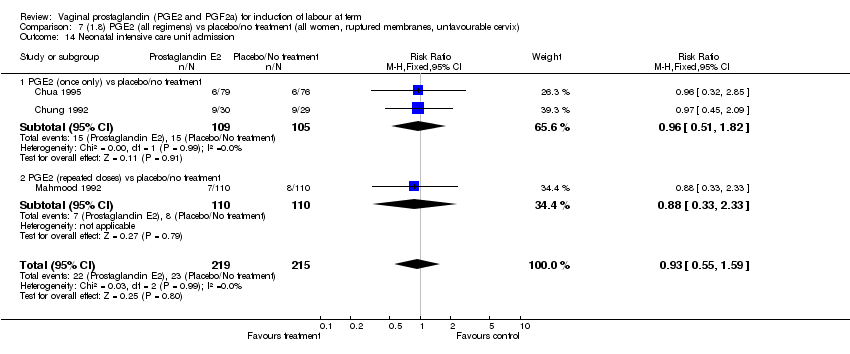
Comparison 7 (1.8) PGE2 (all regimens) vs placebo/no treatment (all women, ruptured membranes, unfavourable cervix), Outcome 14 Neonatal intensive care unit admission.

Comparison 7 (1.8) PGE2 (all regimens) vs placebo/no treatment (all women, ruptured membranes, unfavourable cervix), Outcome 16 Perinatal death.

Comparison 7 (1.8) PGE2 (all regimens) vs placebo/no treatment (all women, ruptured membranes, unfavourable cervix), Outcome 18 Maternal side‐effects (all).

Comparison 7 (1.8) PGE2 (all regimens) vs placebo/no treatment (all women, ruptured membranes, unfavourable cervix), Outcome 20 Vomitting (maternal).
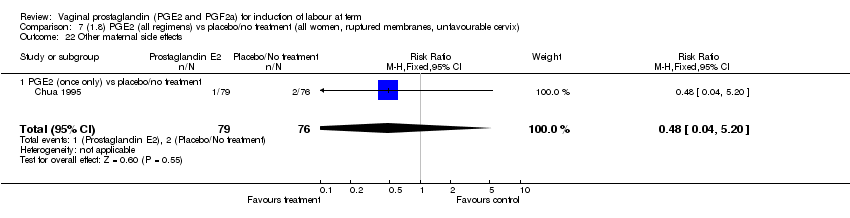
Comparison 7 (1.8) PGE2 (all regimens) vs placebo/no treatment (all women, ruptured membranes, unfavourable cervix), Outcome 22 Other maternal side effects.

Comparison 7 (1.8) PGE2 (all regimens) vs placebo/no treatment (all women, ruptured membranes, unfavourable cervix), Outcome 23 Postpartum haemorrhage.

Comparison 7 (1.8) PGE2 (all regimens) vs placebo/no treatment (all women, ruptured membranes, unfavourable cervix), Outcome 24 Serious maternal complication.

Comparison 8 (1.10) PGE2 (all regimens) vs placebo/no treatment (all primiparae), Outcome 1 Vaginal delivery not achieved within 24 hours.

Comparison 8 (1.10) PGE2 (all regimens) vs placebo/no treatment (all primiparae), Outcome 2 Uterine hyperstimulation with FHR changes.

Comparison 8 (1.10) PGE2 (all regimens) vs placebo/no treatment (all primiparae), Outcome 3 Caesarean section.

Comparison 8 (1.10) PGE2 (all regimens) vs placebo/no treatment (all primiparae), Outcome 4 Serious neonatal morbidity or perinatal death.
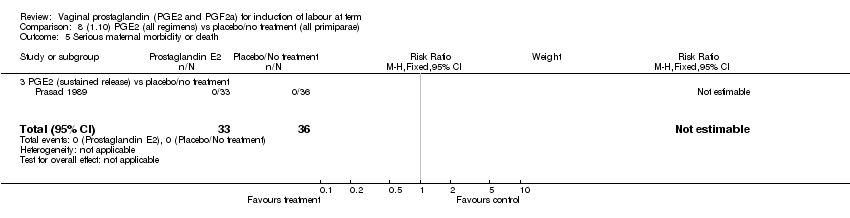
Comparison 8 (1.10) PGE2 (all regimens) vs placebo/no treatment (all primiparae), Outcome 5 Serious maternal morbidity or death.

Comparison 8 (1.10) PGE2 (all regimens) vs placebo/no treatment (all primiparae), Outcome 6 Cervix unfavourable/unchanged after 12 to 24 hours.

Comparison 8 (1.10) PGE2 (all regimens) vs placebo/no treatment (all primiparae), Outcome 7 Oxytocin augmentation.
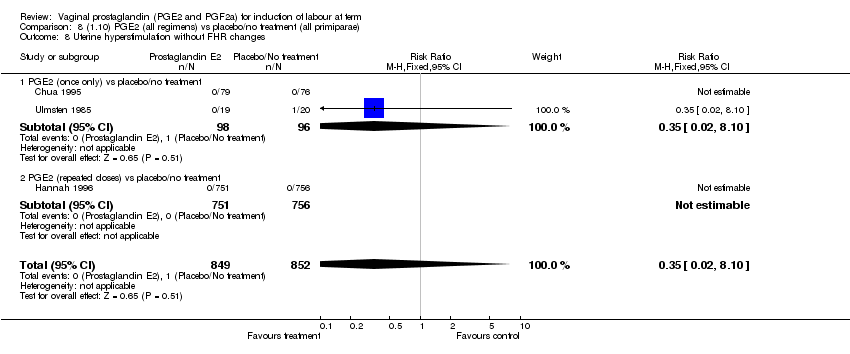
Comparison 8 (1.10) PGE2 (all regimens) vs placebo/no treatment (all primiparae), Outcome 8 Uterine hyperstimulation without FHR changes.

Comparison 8 (1.10) PGE2 (all regimens) vs placebo/no treatment (all primiparae), Outcome 9 Uterine rupture.
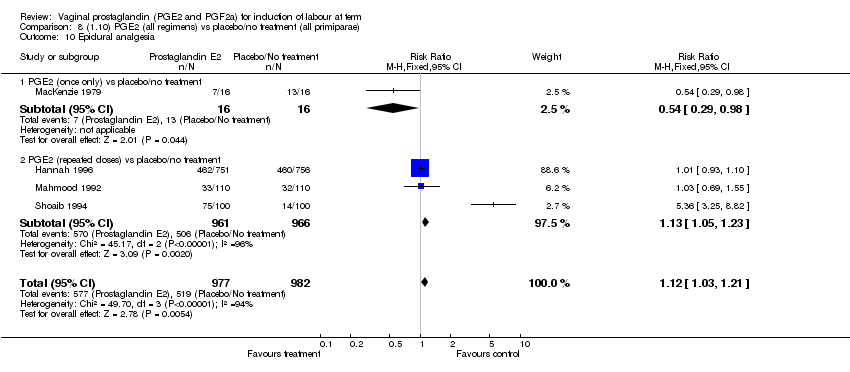
Comparison 8 (1.10) PGE2 (all regimens) vs placebo/no treatment (all primiparae), Outcome 10 Epidural analgesia.
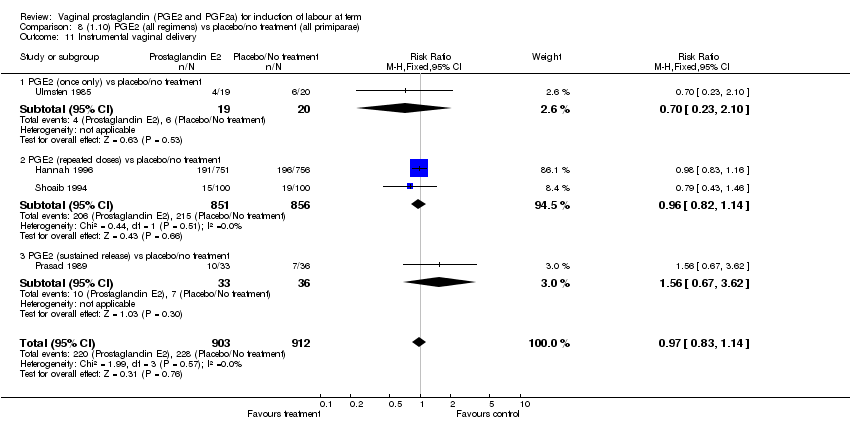
Comparison 8 (1.10) PGE2 (all regimens) vs placebo/no treatment (all primiparae), Outcome 11 Instrumental vaginal delivery.
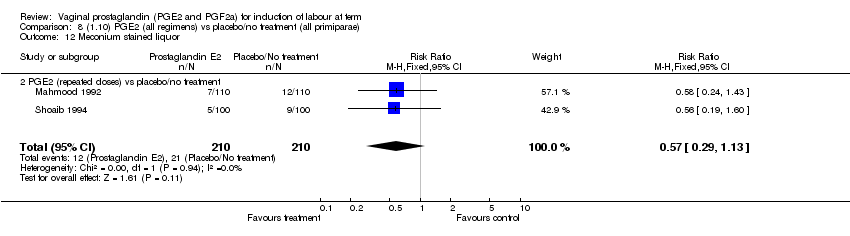
Comparison 8 (1.10) PGE2 (all regimens) vs placebo/no treatment (all primiparae), Outcome 12 Meconium stained liquor.
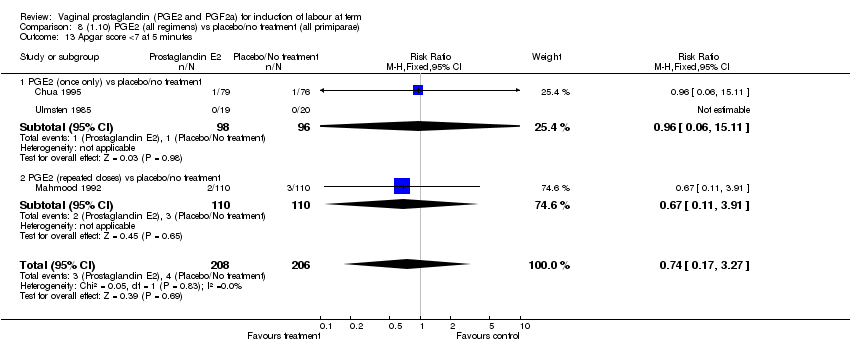
Comparison 8 (1.10) PGE2 (all regimens) vs placebo/no treatment (all primiparae), Outcome 13 Apgar score <7 at 5 minutes.
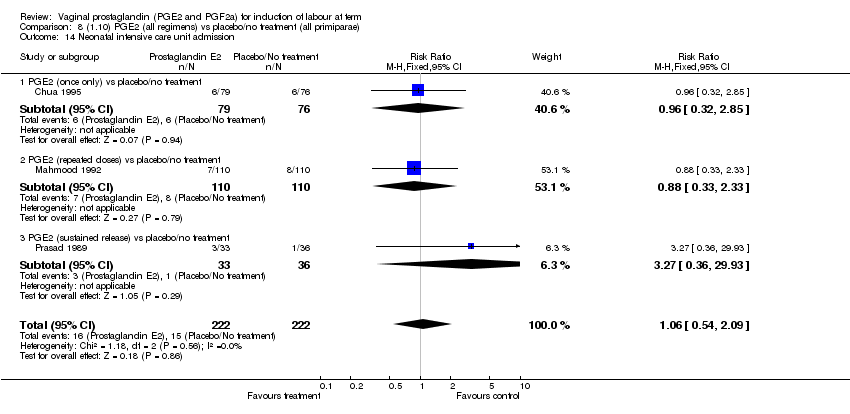
Comparison 8 (1.10) PGE2 (all regimens) vs placebo/no treatment (all primiparae), Outcome 14 Neonatal intensive care unit admission.

Comparison 8 (1.10) PGE2 (all regimens) vs placebo/no treatment (all primiparae), Outcome 16 Perinatal death.
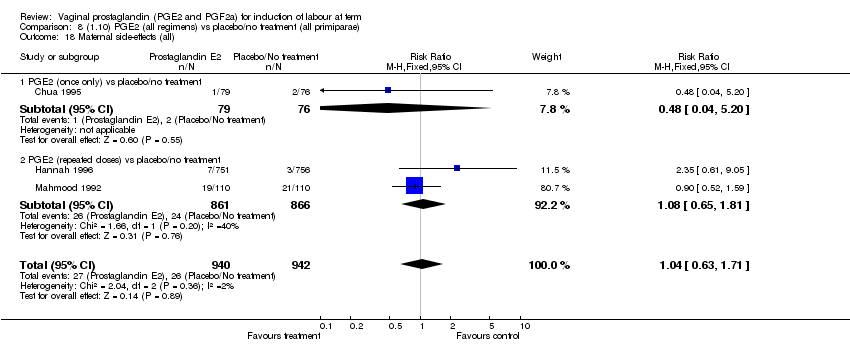
Comparison 8 (1.10) PGE2 (all regimens) vs placebo/no treatment (all primiparae), Outcome 18 Maternal side‐effects (all).
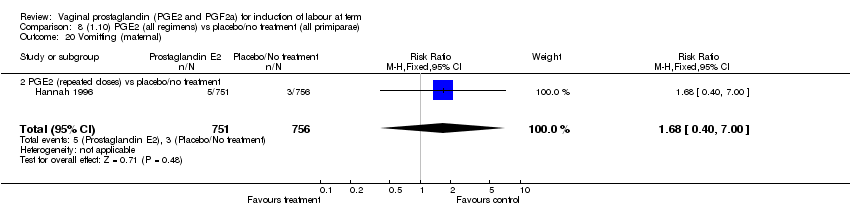
Comparison 8 (1.10) PGE2 (all regimens) vs placebo/no treatment (all primiparae), Outcome 20 Vomitting (maternal).

Comparison 8 (1.10) PGE2 (all regimens) vs placebo/no treatment (all primiparae), Outcome 21 Diarrhoea (maternal).
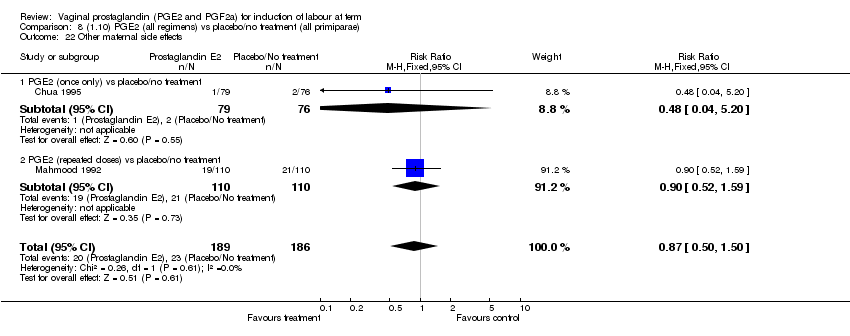
Comparison 8 (1.10) PGE2 (all regimens) vs placebo/no treatment (all primiparae), Outcome 22 Other maternal side effects.

Comparison 8 (1.10) PGE2 (all regimens) vs placebo/no treatment (all primiparae), Outcome 23 Postpartum haemorrhage.

Comparison 9 (1.11) PGE2 (all regimens) vs placebo/no treatment (all primiparae, unfavourable cervix), Outcome 1 Vaginal delivery not achieved within 24 hours.
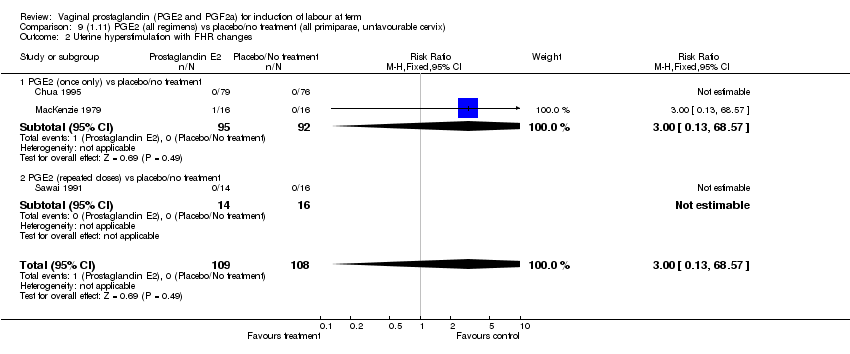
Comparison 9 (1.11) PGE2 (all regimens) vs placebo/no treatment (all primiparae, unfavourable cervix), Outcome 2 Uterine hyperstimulation with FHR changes.
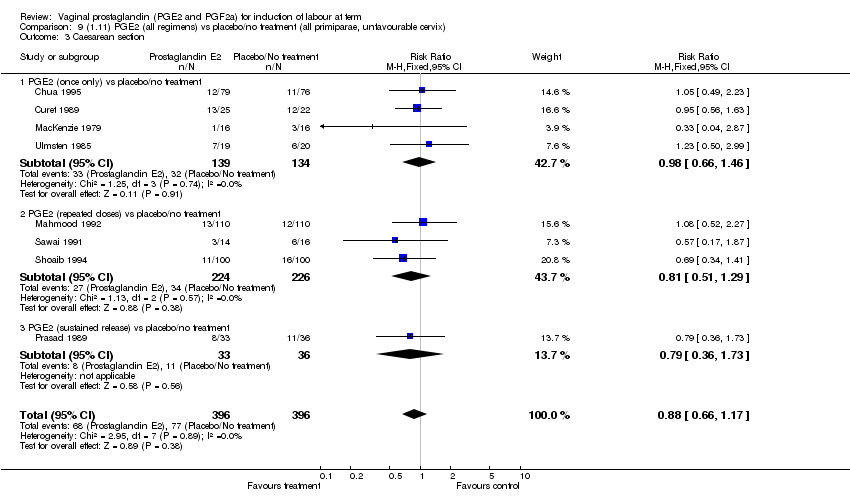
Comparison 9 (1.11) PGE2 (all regimens) vs placebo/no treatment (all primiparae, unfavourable cervix), Outcome 3 Caesarean section.

Comparison 9 (1.11) PGE2 (all regimens) vs placebo/no treatment (all primiparae, unfavourable cervix), Outcome 4 Serious neonatal morbidity or perinatal death.
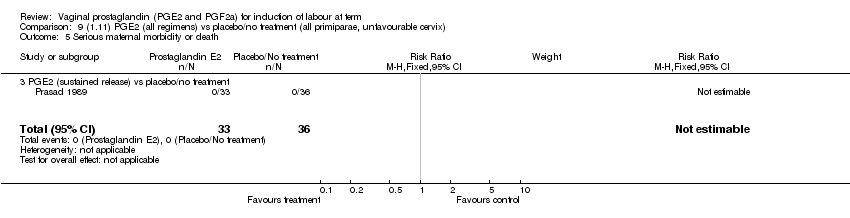
Comparison 9 (1.11) PGE2 (all regimens) vs placebo/no treatment (all primiparae, unfavourable cervix), Outcome 5 Serious maternal morbidity or death.
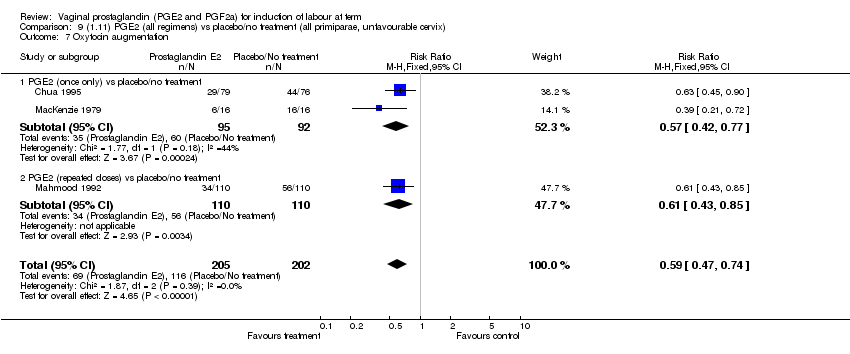
Comparison 9 (1.11) PGE2 (all regimens) vs placebo/no treatment (all primiparae, unfavourable cervix), Outcome 7 Oxytocin augmentation.
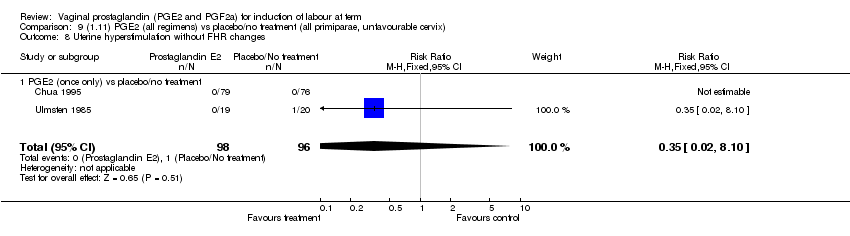
Comparison 9 (1.11) PGE2 (all regimens) vs placebo/no treatment (all primiparae, unfavourable cervix), Outcome 8 Uterine hyperstimulation without FHR changes.
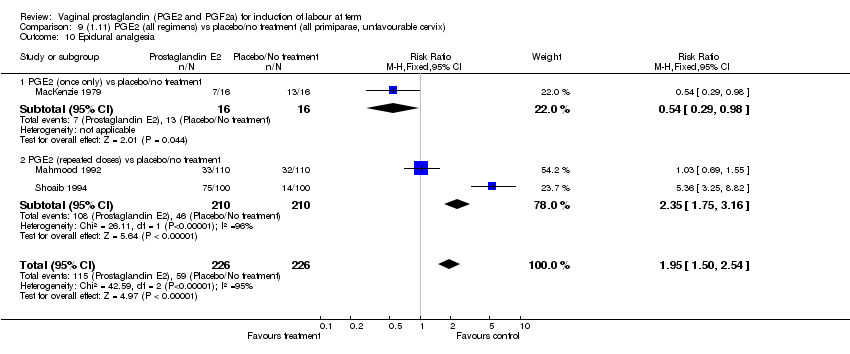
Comparison 9 (1.11) PGE2 (all regimens) vs placebo/no treatment (all primiparae, unfavourable cervix), Outcome 10 Epidural analgesia.
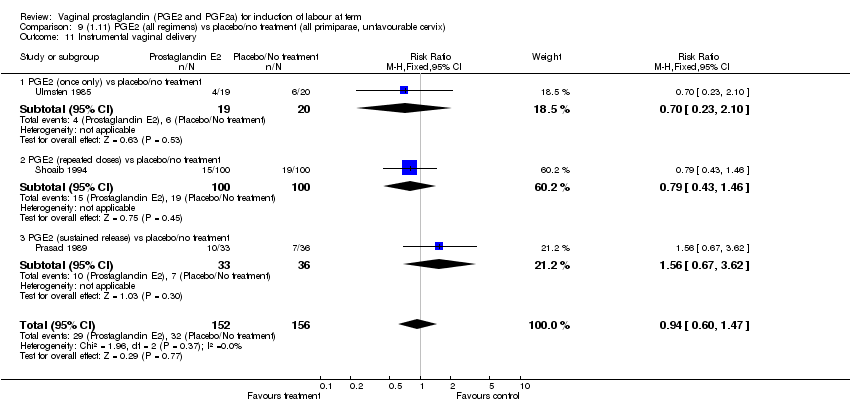
Comparison 9 (1.11) PGE2 (all regimens) vs placebo/no treatment (all primiparae, unfavourable cervix), Outcome 11 Instrumental vaginal delivery.

Comparison 9 (1.11) PGE2 (all regimens) vs placebo/no treatment (all primiparae, unfavourable cervix), Outcome 12 Meconium stained liquor.

Comparison 9 (1.11) PGE2 (all regimens) vs placebo/no treatment (all primiparae, unfavourable cervix), Outcome 13 Apgar score <7 at 5 minutes.
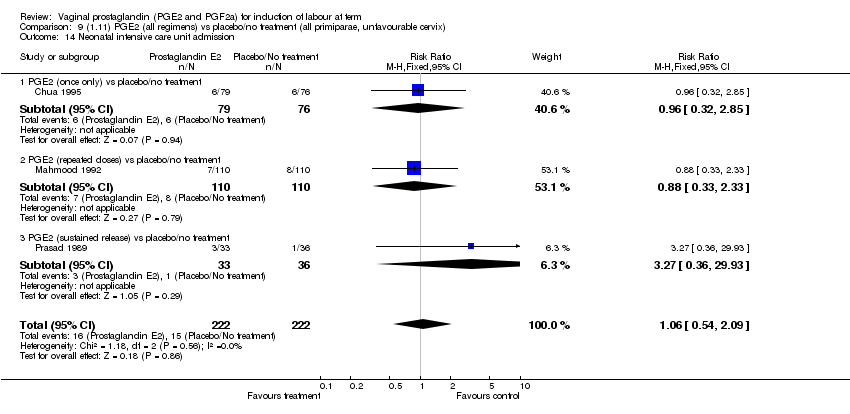
Comparison 9 (1.11) PGE2 (all regimens) vs placebo/no treatment (all primiparae, unfavourable cervix), Outcome 14 Neonatal intensive care unit admission.

Comparison 9 (1.11) PGE2 (all regimens) vs placebo/no treatment (all primiparae, unfavourable cervix), Outcome 16 Perinatal death.

Comparison 9 (1.11) PGE2 (all regimens) vs placebo/no treatment (all primiparae, unfavourable cervix), Outcome 18 Maternal side‐effects (all).
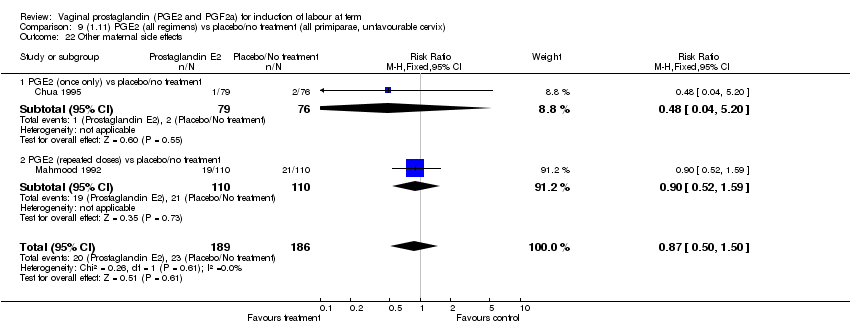
Comparison 9 (1.11) PGE2 (all regimens) vs placebo/no treatment (all primiparae, unfavourable cervix), Outcome 22 Other maternal side effects.

Comparison 9 (1.11) PGE2 (all regimens) vs placebo/no treatment (all primiparae, unfavourable cervix), Outcome 23 Postpartum haemorrhage.

Comparison 10 (1.12) PGE2 (all regimens) vs placebo/no treatment (all primiparae, favourable cervix), Outcome 1 Vaginal delivery not achieved within 24 hours.

Comparison 10 (1.12) PGE2 (all regimens) vs placebo/no treatment (all primiparae, favourable cervix), Outcome 3 Caesarean section.
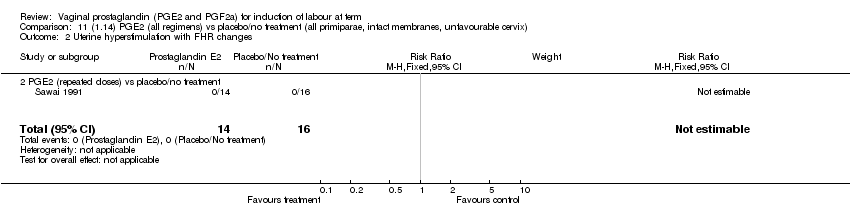
Comparison 11 (1.14) PGE2 (all regimens) vs placebo/no treatment (all primiparae, intact membranes, unfavourable cervix), Outcome 2 Uterine hyperstimulation with FHR changes.

Comparison 11 (1.14) PGE2 (all regimens) vs placebo/no treatment (all primiparae, intact membranes, unfavourable cervix), Outcome 3 Caesarean section.

Comparison 12 (1.15) PGE2 (all regimens) vs placebo/no treatment (all primiparae, intact membranes, favourable cervix), Outcome 1 Vaginal delivery not achieved within 24 hours.

Comparison 12 (1.15) PGE2 (all regimens) vs placebo/no treatment (all primiparae, intact membranes, favourable cervix), Outcome 3 Caesarean section.

Comparison 13 (1.16) PGE2 (all regimens) vs placebo/no treatment (all primiparae, ruptured memb., variable/undefined cervix), Outcome 3 Caesarean section.

Comparison 13 (1.16) PGE2 (all regimens) vs placebo/no treatment (all primiparae, ruptured memb., variable/undefined cervix), Outcome 4 Serious neonatal morbidity or perinatal death.
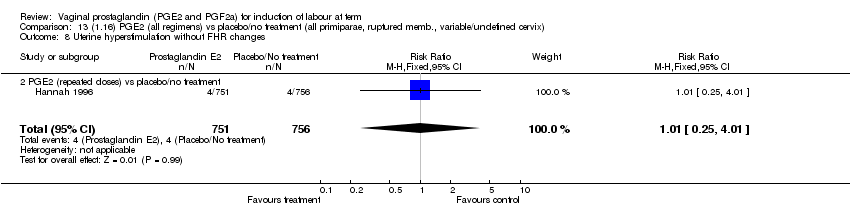
Comparison 13 (1.16) PGE2 (all regimens) vs placebo/no treatment (all primiparae, ruptured memb., variable/undefined cervix), Outcome 8 Uterine hyperstimulation without FHR changes.

Comparison 13 (1.16) PGE2 (all regimens) vs placebo/no treatment (all primiparae, ruptured memb., variable/undefined cervix), Outcome 9 Uterine rupture.
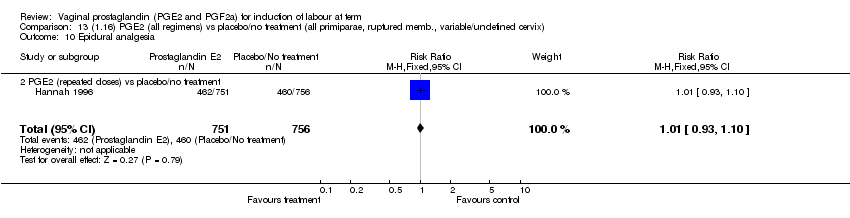
Comparison 13 (1.16) PGE2 (all regimens) vs placebo/no treatment (all primiparae, ruptured memb., variable/undefined cervix), Outcome 10 Epidural analgesia.

Comparison 13 (1.16) PGE2 (all regimens) vs placebo/no treatment (all primiparae, ruptured memb., variable/undefined cervix), Outcome 11 Instrumental vaginal delivery.

Comparison 13 (1.16) PGE2 (all regimens) vs placebo/no treatment (all primiparae, ruptured memb., variable/undefined cervix), Outcome 16 Perinatal death.

Comparison 13 (1.16) PGE2 (all regimens) vs placebo/no treatment (all primiparae, ruptured memb., variable/undefined cervix), Outcome 18 Maternal side‐effects (all).

Comparison 13 (1.16) PGE2 (all regimens) vs placebo/no treatment (all primiparae, ruptured memb., variable/undefined cervix), Outcome 20 Vomitting (maternal).

Comparison 13 (1.16) PGE2 (all regimens) vs placebo/no treatment (all primiparae, ruptured memb., variable/undefined cervix), Outcome 21 Diarrhoea (maternal).

Comparison 13 (1.16) PGE2 (all regimens) vs placebo/no treatment (all primiparae, ruptured memb., variable/undefined cervix), Outcome 23 Postpartum haemorrhage.
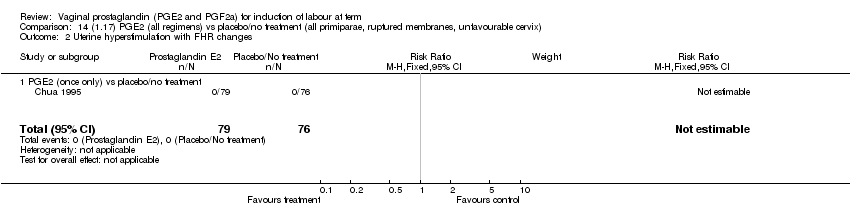
Comparison 14 (1.17) PGE2 (all regimens) vs placebo/no treatment (all primiparae, ruptured membranes, unfavourable cervix), Outcome 2 Uterine hyperstimulation with FHR changes.
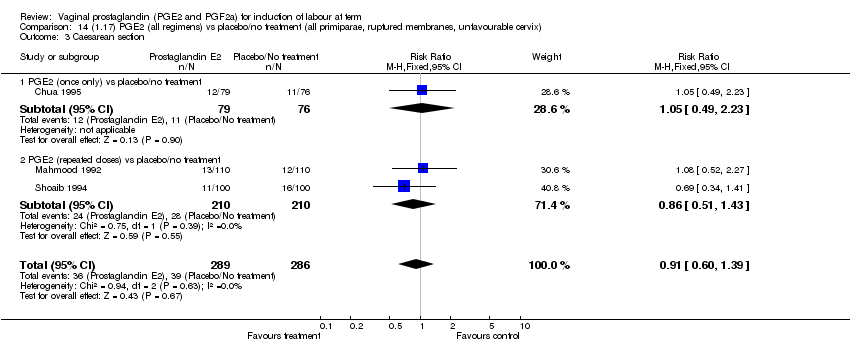
Comparison 14 (1.17) PGE2 (all regimens) vs placebo/no treatment (all primiparae, ruptured membranes, unfavourable cervix), Outcome 3 Caesarean section.

Comparison 14 (1.17) PGE2 (all regimens) vs placebo/no treatment (all primiparae, ruptured membranes, unfavourable cervix), Outcome 4 Serious neonatal morbidity or perinatal death.

Comparison 14 (1.17) PGE2 (all regimens) vs placebo/no treatment (all primiparae, ruptured membranes, unfavourable cervix), Outcome 7 Oxytocin augmentation.

Comparison 14 (1.17) PGE2 (all regimens) vs placebo/no treatment (all primiparae, ruptured membranes, unfavourable cervix), Outcome 8 Uterine hyperstimulation without FHR changes.
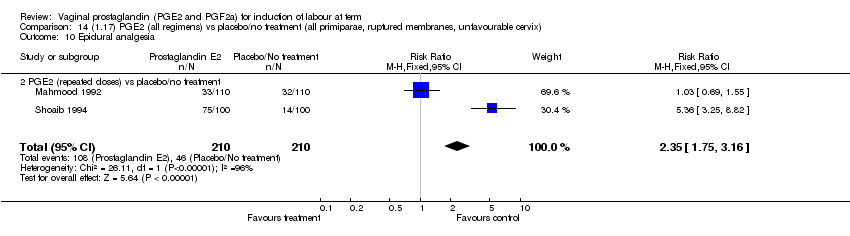
Comparison 14 (1.17) PGE2 (all regimens) vs placebo/no treatment (all primiparae, ruptured membranes, unfavourable cervix), Outcome 10 Epidural analgesia.
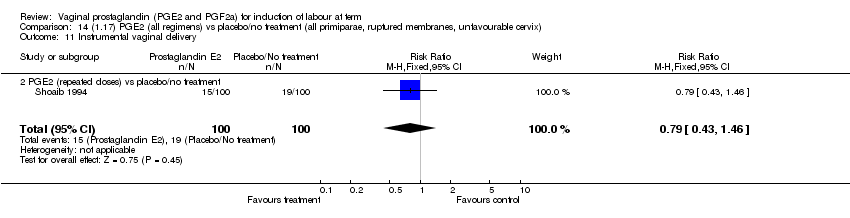
Comparison 14 (1.17) PGE2 (all regimens) vs placebo/no treatment (all primiparae, ruptured membranes, unfavourable cervix), Outcome 11 Instrumental vaginal delivery.

Comparison 14 (1.17) PGE2 (all regimens) vs placebo/no treatment (all primiparae, ruptured membranes, unfavourable cervix), Outcome 12 Meconium stained liquor.
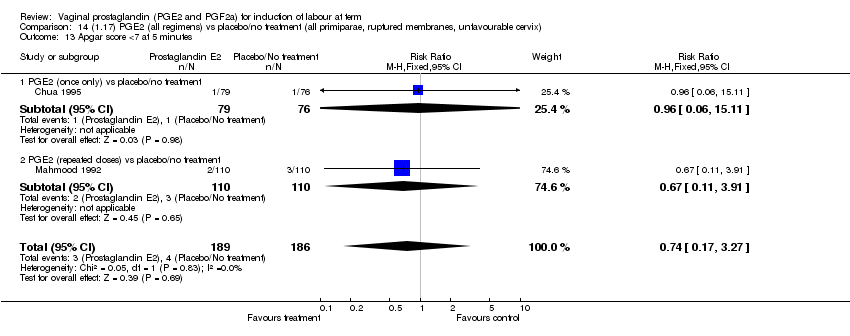
Comparison 14 (1.17) PGE2 (all regimens) vs placebo/no treatment (all primiparae, ruptured membranes, unfavourable cervix), Outcome 13 Apgar score <7 at 5 minutes.

Comparison 14 (1.17) PGE2 (all regimens) vs placebo/no treatment (all primiparae, ruptured membranes, unfavourable cervix), Outcome 14 Neonatal intensive care unit admission.
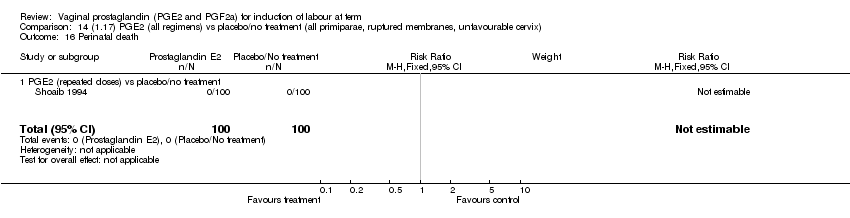
Comparison 14 (1.17) PGE2 (all regimens) vs placebo/no treatment (all primiparae, ruptured membranes, unfavourable cervix), Outcome 16 Perinatal death.

Comparison 14 (1.17) PGE2 (all regimens) vs placebo/no treatment (all primiparae, ruptured membranes, unfavourable cervix), Outcome 18 Maternal side‐effects (all).

Comparison 14 (1.17) PGE2 (all regimens) vs placebo/no treatment (all primiparae, ruptured membranes, unfavourable cervix), Outcome 22 Other maternal side effects.

Comparison 14 (1.17) PGE2 (all regimens) vs placebo/no treatment (all primiparae, ruptured membranes, unfavourable cervix), Outcome 23 Postpartum haemorrhage.

Comparison 15 (1.19) PGE2 (all regimens) vs placebo/no treatment (all multiparae, without previous caesarean section), Outcome 1 Vaginal delivery not achieved within 24 hours.

Comparison 15 (1.19) PGE2 (all regimens) vs placebo/no treatment (all multiparae, without previous caesarean section), Outcome 2 Uterine hyperstimulation with FHR changes.
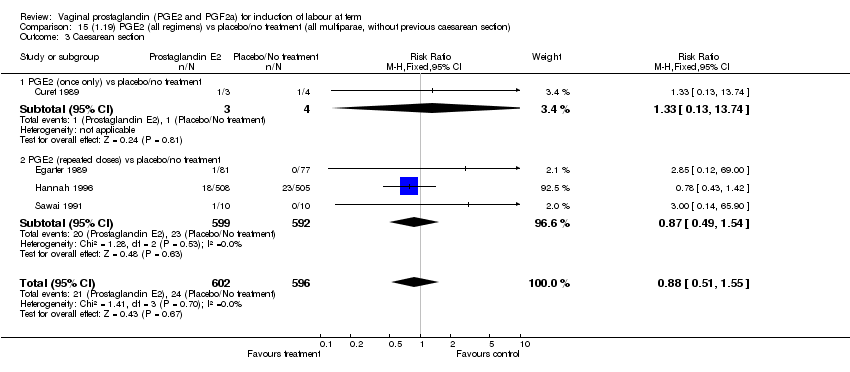
Comparison 15 (1.19) PGE2 (all regimens) vs placebo/no treatment (all multiparae, without previous caesarean section), Outcome 3 Caesarean section.

Comparison 15 (1.19) PGE2 (all regimens) vs placebo/no treatment (all multiparae, without previous caesarean section), Outcome 4 Serious neonatal morbidity or perinatal death.
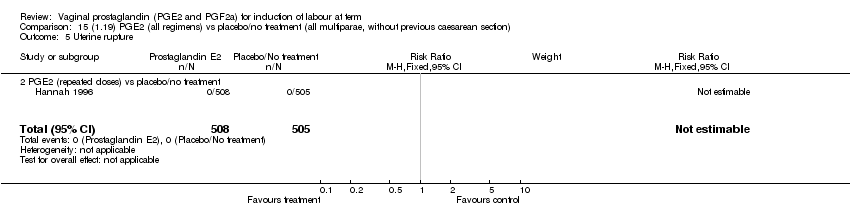
Comparison 15 (1.19) PGE2 (all regimens) vs placebo/no treatment (all multiparae, without previous caesarean section), Outcome 5 Uterine rupture.

Comparison 15 (1.19) PGE2 (all regimens) vs placebo/no treatment (all multiparae, without previous caesarean section), Outcome 6 Epidural analgesia.
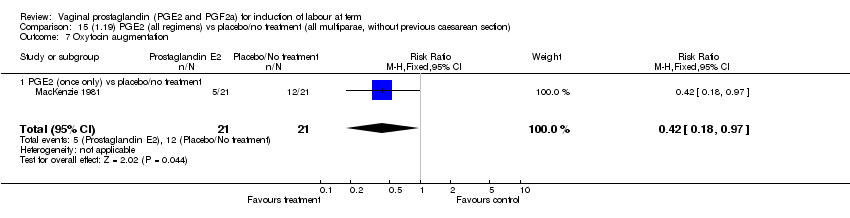
Comparison 15 (1.19) PGE2 (all regimens) vs placebo/no treatment (all multiparae, without previous caesarean section), Outcome 7 Oxytocin augmentation.

Comparison 15 (1.19) PGE2 (all regimens) vs placebo/no treatment (all multiparae, without previous caesarean section), Outcome 8 Uterine hyperstimulation without FHR changes.
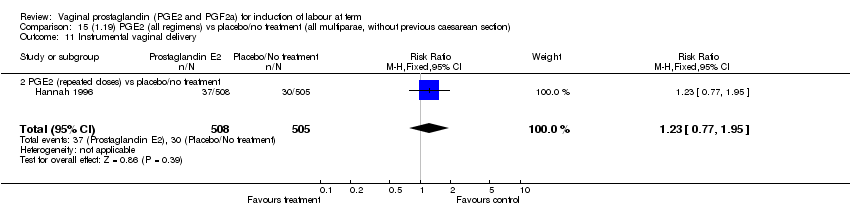
Comparison 15 (1.19) PGE2 (all regimens) vs placebo/no treatment (all multiparae, without previous caesarean section), Outcome 11 Instrumental vaginal delivery.
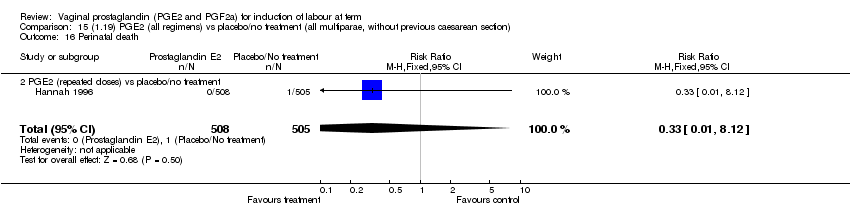
Comparison 15 (1.19) PGE2 (all regimens) vs placebo/no treatment (all multiparae, without previous caesarean section), Outcome 16 Perinatal death.
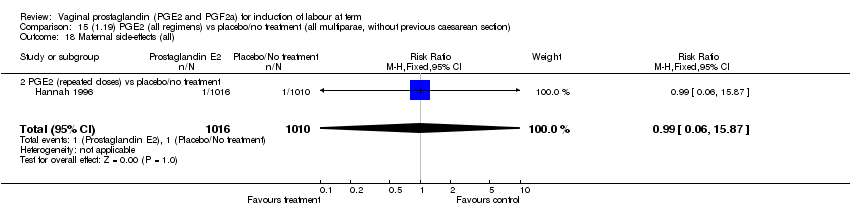
Comparison 15 (1.19) PGE2 (all regimens) vs placebo/no treatment (all multiparae, without previous caesarean section), Outcome 18 Maternal side‐effects (all).

Comparison 15 (1.19) PGE2 (all regimens) vs placebo/no treatment (all multiparae, without previous caesarean section), Outcome 20 Vomitting (maternal).
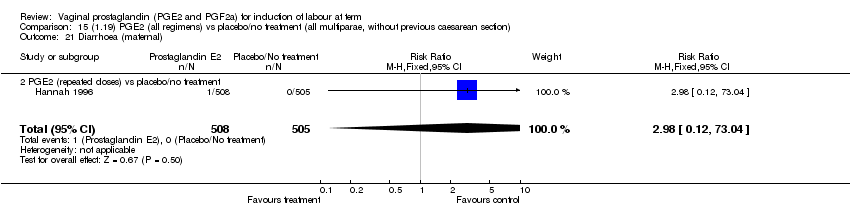
Comparison 15 (1.19) PGE2 (all regimens) vs placebo/no treatment (all multiparae, without previous caesarean section), Outcome 21 Diarrhoea (maternal).
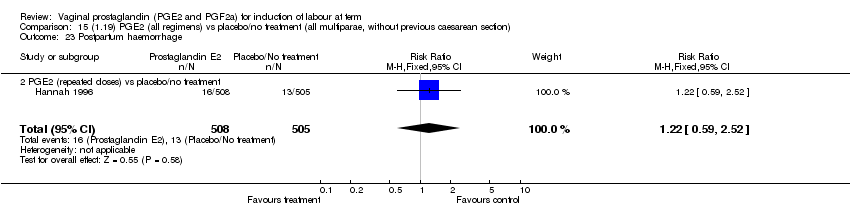
Comparison 15 (1.19) PGE2 (all regimens) vs placebo/no treatment (all multiparae, without previous caesarean section), Outcome 23 Postpartum haemorrhage.

Comparison 16 (1.20) PGE2 (all regimens) vs placebo/no treatment (all multiparae, unfavourable cervix), Outcome 2 Uterine hyperstimulation with FHR changes.

Comparison 16 (1.20) PGE2 (all regimens) vs placebo/no treatment (all multiparae, unfavourable cervix), Outcome 3 Caesarean section.

Comparison 17 (1.21) PGE2 (all regimens) vs placebo/no treatment (all multiparae, favourable cervix), Outcome 1 Vaginal delivery not achieved within 24 hours.

Comparison 17 (1.21) PGE2 (all regimens) vs placebo/no treatment (all multiparae, favourable cervix), Outcome 3 Caesarean section.
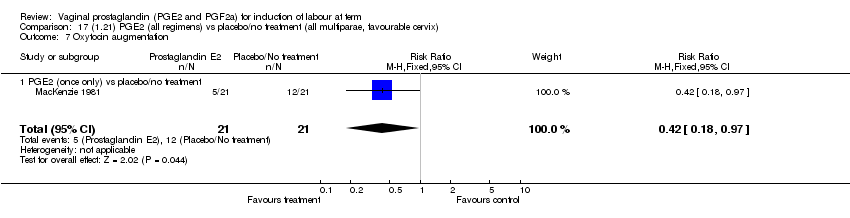
Comparison 17 (1.21) PGE2 (all regimens) vs placebo/no treatment (all multiparae, favourable cervix), Outcome 7 Oxytocin augmentation.

Comparison 18 (1.23) PGE2 (all regimens) vs placebo/no treatment (all multiparae, intact membranes, unfavourable cervix), Outcome 2 Uterine hyperstimulation with FHR changes.
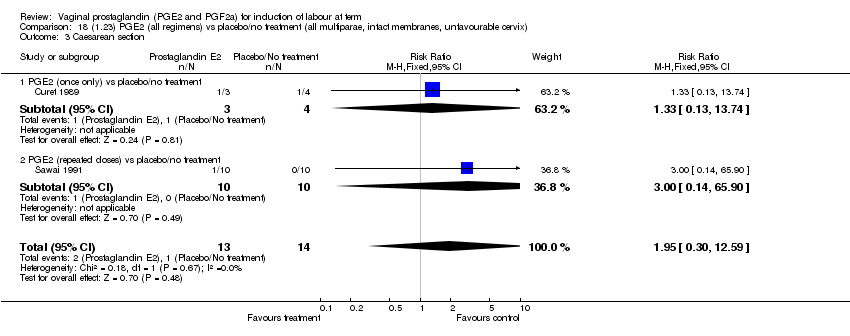
Comparison 18 (1.23) PGE2 (all regimens) vs placebo/no treatment (all multiparae, intact membranes, unfavourable cervix), Outcome 3 Caesarean section.

Comparison 19 (1.24) PGE2 (all regimens) vs placebo/no treatment (all multiparae, intact membranes, favourable cervix), Outcome 1 Vaginal delivery not achieved within 24 hours.
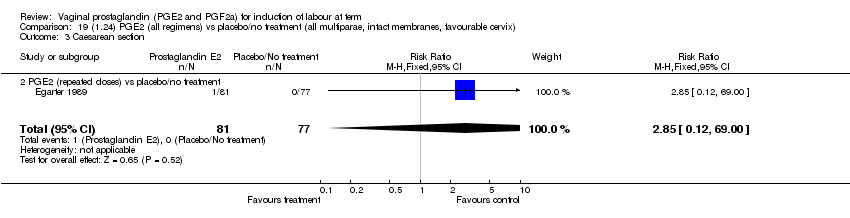
Comparison 19 (1.24) PGE2 (all regimens) vs placebo/no treatment (all multiparae, intact membranes, favourable cervix), Outcome 3 Caesarean section.

Comparison 20 (1.25) PGE2 (all regimens) vs placebo/no treatment (all multi., ruptured membranes, variable/undefined cervix), Outcome 3 Caesarean section.

Comparison 20 (1.25) PGE2 (all regimens) vs placebo/no treatment (all multi., ruptured membranes, variable/undefined cervix), Outcome 4 Serious neonatal morbidity or perinatal death.

Comparison 20 (1.25) PGE2 (all regimens) vs placebo/no treatment (all multi., ruptured membranes, variable/undefined cervix), Outcome 8 Uterine hyperstimulation without FHR changes.

Comparison 20 (1.25) PGE2 (all regimens) vs placebo/no treatment (all multi., ruptured membranes, variable/undefined cervix), Outcome 9 Uterine rupture.

Comparison 20 (1.25) PGE2 (all regimens) vs placebo/no treatment (all multi., ruptured membranes, variable/undefined cervix), Outcome 10 Epidural analgesia.
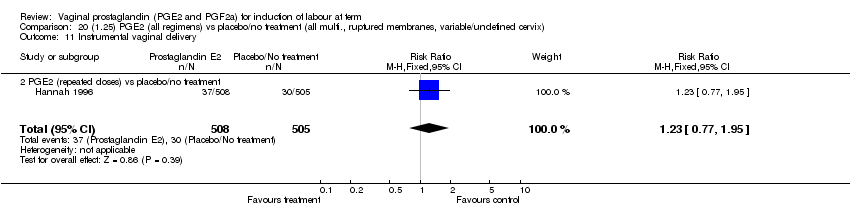
Comparison 20 (1.25) PGE2 (all regimens) vs placebo/no treatment (all multi., ruptured membranes, variable/undefined cervix), Outcome 11 Instrumental vaginal delivery.

Comparison 20 (1.25) PGE2 (all regimens) vs placebo/no treatment (all multi., ruptured membranes, variable/undefined cervix), Outcome 16 Perinatal death.

Comparison 20 (1.25) PGE2 (all regimens) vs placebo/no treatment (all multi., ruptured membranes, variable/undefined cervix), Outcome 18 Maternal side‐effects (all).

Comparison 20 (1.25) PGE2 (all regimens) vs placebo/no treatment (all multi., ruptured membranes, variable/undefined cervix), Outcome 20 Vomitting (maternal).

Comparison 20 (1.25) PGE2 (all regimens) vs placebo/no treatment (all multi., ruptured membranes, variable/undefined cervix), Outcome 21 Diarrhoea (maternal).
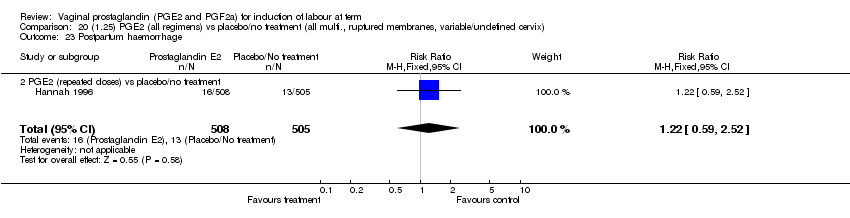
Comparison 20 (1.25) PGE2 (all regimens) vs placebo/no treatment (all multi., ruptured membranes, variable/undefined cervix), Outcome 23 Postpartum haemorrhage.

Comparison 22 (2.1) PGF2a vs placebo (all women), Outcome 2 Uterine hyperstimulation with FHR changes.

Comparison 22 (2.1) PGF2a vs placebo (all women), Outcome 3 Caesarean section.

Comparison 22 (2.1) PGF2a vs placebo (all women), Outcome 6 Cervix unfavourable/unchanged after 12 to 24 hours.

Comparison 22 (2.1) PGF2a vs placebo (all women), Outcome 7 Oxytocin augmentation.

Comparison 22 (2.1) PGF2a vs placebo (all women), Outcome 10 Epidural analgesia.

Comparison 22 (2.1) PGF2a vs placebo (all women), Outcome 11 Instrumental vaginal delivery.
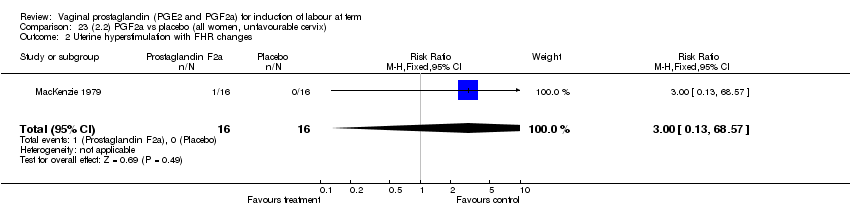
Comparison 23 (2.2) PGF2a vs placebo (all women, unfavourable cervix), Outcome 2 Uterine hyperstimulation with FHR changes.

Comparison 23 (2.2) PGF2a vs placebo (all women, unfavourable cervix), Outcome 3 Caesarean section.
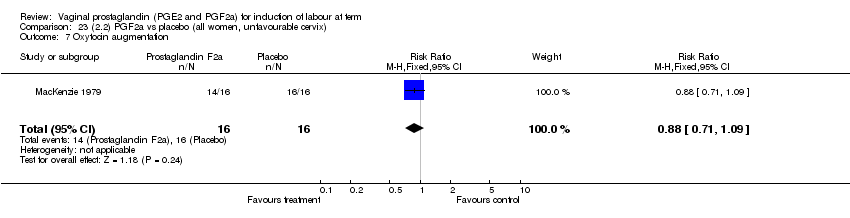
Comparison 23 (2.2) PGF2a vs placebo (all women, unfavourable cervix), Outcome 7 Oxytocin augmentation.

Comparison 23 (2.2) PGF2a vs placebo (all women, unfavourable cervix), Outcome 10 Epidural analgesia.

Comparison 24 (2.10) PGF2a vs placebo (all primiparae), Outcome 2 Uterine hyperstimulation with FHR changes.

Comparison 24 (2.10) PGF2a vs placebo (all primiparae), Outcome 3 Caesarean section.

Comparison 24 (2.10) PGF2a vs placebo (all primiparae), Outcome 7 Oxytocin augmentation.

Comparison 24 (2.10) PGF2a vs placebo (all primiparae), Outcome 10 Epidural analgesia.

Comparison 25 (2.11) PGF2a vs placebo (all primiparae, unfavourable cervix), Outcome 2 Uterine hyperstimulation with FHR changes.

Comparison 25 (2.11) PGF2a vs placebo (all primiparae, unfavourable cervix), Outcome 3 Caesarean section.

Comparison 25 (2.11) PGF2a vs placebo (all primiparae, unfavourable cervix), Outcome 7 Oxytocin augmentation.
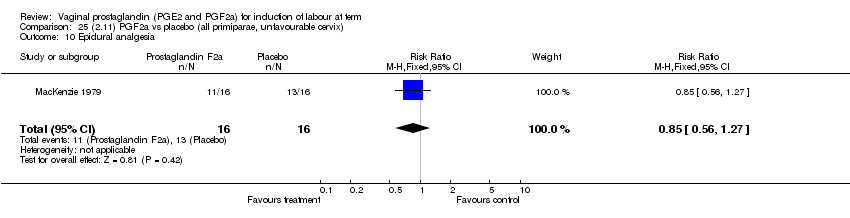
Comparison 25 (2.11) PGF2a vs placebo (all primiparae, unfavourable cervix), Outcome 10 Epidural analgesia.

Comparison 26 (3.1) PGF2a vs PGE2 (all women), Outcome 1 Vaginal delivery not achieved within 24 hours.
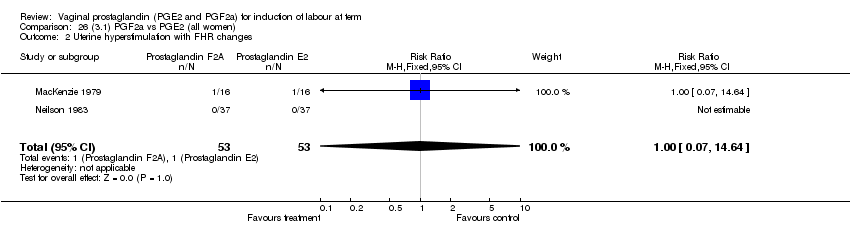
Comparison 26 (3.1) PGF2a vs PGE2 (all women), Outcome 2 Uterine hyperstimulation with FHR changes.
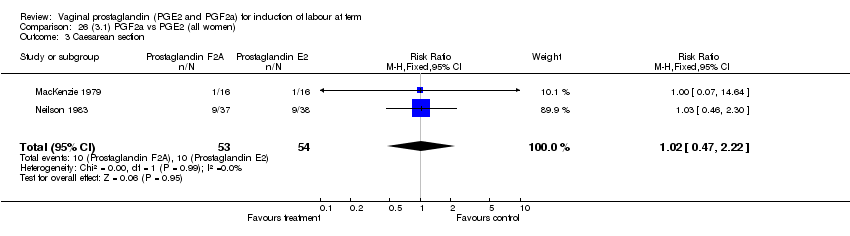
Comparison 26 (3.1) PGF2a vs PGE2 (all women), Outcome 3 Caesarean section.

Comparison 26 (3.1) PGF2a vs PGE2 (all women), Outcome 7 Oxytocin augmentation.

Comparison 26 (3.1) PGF2a vs PGE2 (all women), Outcome 10 Epidural analgesia.
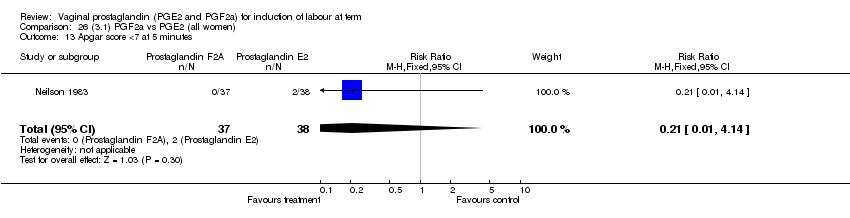
Comparison 26 (3.1) PGF2a vs PGE2 (all women), Outcome 13 Apgar score <7 at 5 minutes.

Comparison 27 (3.2) PGF2a vs PGE2 (all women, unfavourable cervix), Outcome 1 Vaginal delivery not achieved within 24 hours.
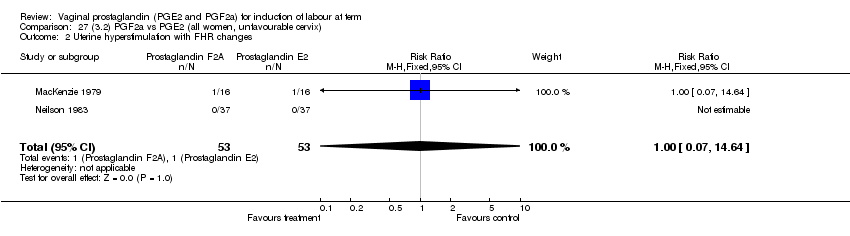
Comparison 27 (3.2) PGF2a vs PGE2 (all women, unfavourable cervix), Outcome 2 Uterine hyperstimulation with FHR changes.
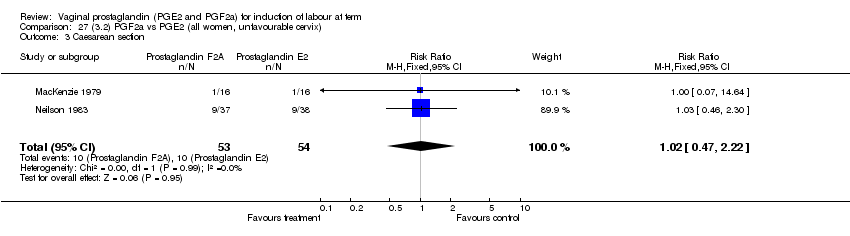
Comparison 27 (3.2) PGF2a vs PGE2 (all women, unfavourable cervix), Outcome 3 Caesarean section.

Comparison 27 (3.2) PGF2a vs PGE2 (all women, unfavourable cervix), Outcome 7 Oxytocin augmentation.

Comparison 27 (3.2) PGF2a vs PGE2 (all women, unfavourable cervix), Outcome 10 Epidural analgesia.
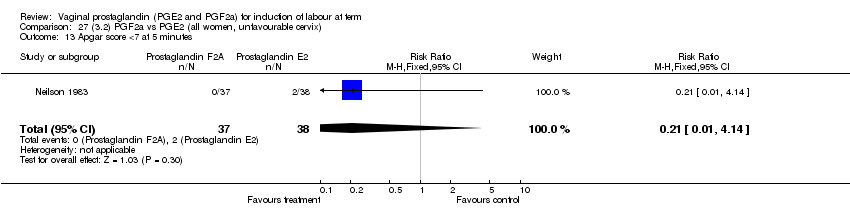
Comparison 27 (3.2) PGF2a vs PGE2 (all women, unfavourable cervix), Outcome 13 Apgar score <7 at 5 minutes.

Comparison 28 (3.10) PGF2a vs PGE2 (all primiparae), Outcome 2 Uterine hyperstimulation with FHR changes.

Comparison 28 (3.10) PGF2a vs PGE2 (all primiparae), Outcome 3 Caesarean section.
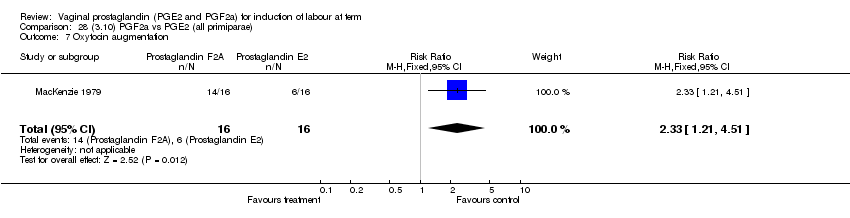
Comparison 28 (3.10) PGF2a vs PGE2 (all primiparae), Outcome 7 Oxytocin augmentation.
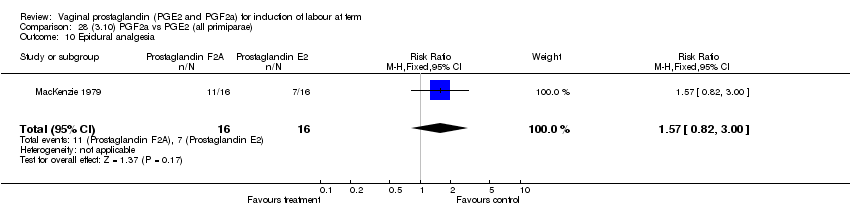
Comparison 28 (3.10) PGF2a vs PGE2 (all primiparae), Outcome 10 Epidural analgesia.

Comparison 29 (3.11) PGF2a vs PGE2 (all primiparae, unfavourable cervix), Outcome 2 Uterine hyperstimulation with FHR changes.

Comparison 29 (3.11) PGF2a vs PGE2 (all primiparae, unfavourable cervix), Outcome 3 Caesarean section.

Comparison 29 (3.11) PGF2a vs PGE2 (all primiparae, unfavourable cervix), Outcome 7 Oxytocin augmentation.

Comparison 29 (3.11) PGF2a vs PGE2 (all primiparae, unfavourable cervix), Outcome 10 Epidural analgesia.

Comparison 31 (4.1) PGE2 gel vs PGE2 tablet (all women), Outcome 1 Vaginal delivery not achieved within 24 hours.
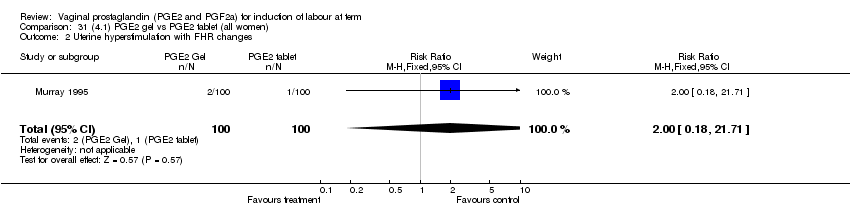
Comparison 31 (4.1) PGE2 gel vs PGE2 tablet (all women), Outcome 2 Uterine hyperstimulation with FHR changes.

Comparison 31 (4.1) PGE2 gel vs PGE2 tablet (all women), Outcome 3 Caesarean section.

Comparison 31 (4.1) PGE2 gel vs PGE2 tablet (all women), Outcome 5 Serious maternal morbidity or death.
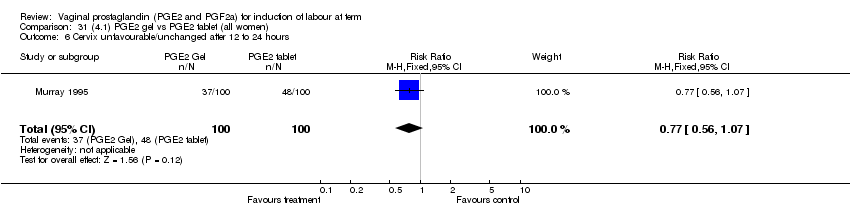
Comparison 31 (4.1) PGE2 gel vs PGE2 tablet (all women), Outcome 6 Cervix unfavourable/unchanged after 12 to 24 hours.
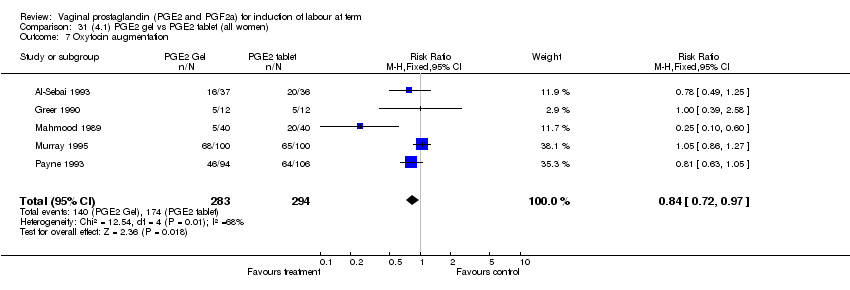
Comparison 31 (4.1) PGE2 gel vs PGE2 tablet (all women), Outcome 7 Oxytocin augmentation.
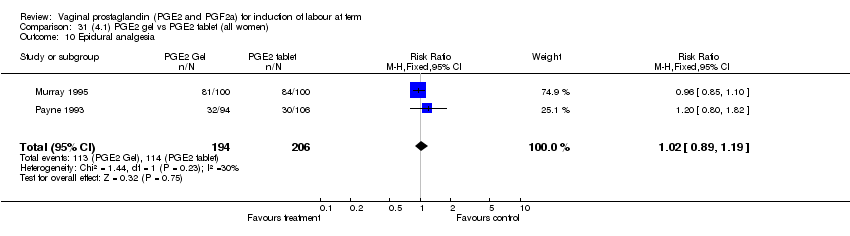
Comparison 31 (4.1) PGE2 gel vs PGE2 tablet (all women), Outcome 10 Epidural analgesia.

Comparison 31 (4.1) PGE2 gel vs PGE2 tablet (all women), Outcome 11 Instrumental vaginal delivery.

Comparison 31 (4.1) PGE2 gel vs PGE2 tablet (all women), Outcome 13 Apgar score <7 at 5 minutes.

Comparison 31 (4.1) PGE2 gel vs PGE2 tablet (all women), Outcome 23 Postpartum haemorrhage.

Comparison 33 (4.2) PGE2 gel vs PGE2 tablet (all women, unfavourable cervix), Outcome 1 Vaginal delivery not achieved within 24 hours.
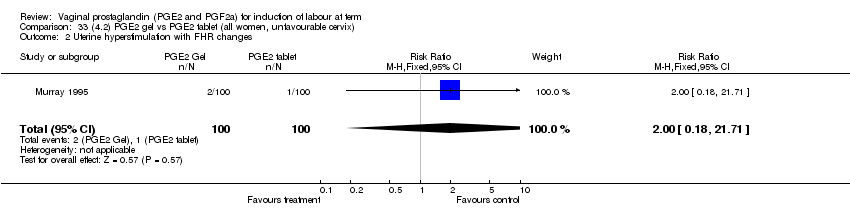
Comparison 33 (4.2) PGE2 gel vs PGE2 tablet (all women, unfavourable cervix), Outcome 2 Uterine hyperstimulation with FHR changes.

Comparison 33 (4.2) PGE2 gel vs PGE2 tablet (all women, unfavourable cervix), Outcome 3 Caesarean section.
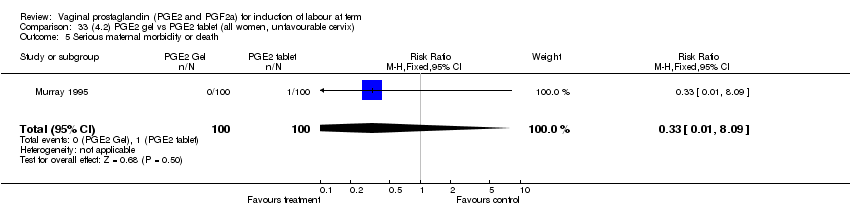
Comparison 33 (4.2) PGE2 gel vs PGE2 tablet (all women, unfavourable cervix), Outcome 5 Serious maternal morbidity or death.

Comparison 33 (4.2) PGE2 gel vs PGE2 tablet (all women, unfavourable cervix), Outcome 6 Cervix unfavourable/unchanged after 12 to 24 hours.
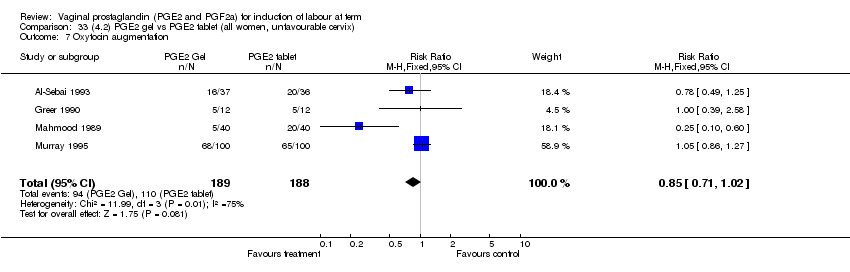
Comparison 33 (4.2) PGE2 gel vs PGE2 tablet (all women, unfavourable cervix), Outcome 7 Oxytocin augmentation.

Comparison 33 (4.2) PGE2 gel vs PGE2 tablet (all women, unfavourable cervix), Outcome 10 Epidural analgesia.

Comparison 33 (4.2) PGE2 gel vs PGE2 tablet (all women, unfavourable cervix), Outcome 11 Instrumental vaginal delivery.
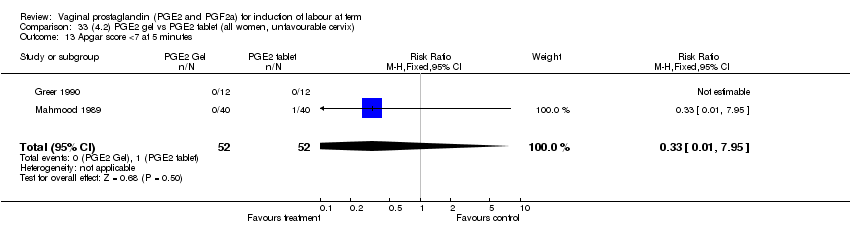
Comparison 33 (4.2) PGE2 gel vs PGE2 tablet (all women, unfavourable cervix), Outcome 13 Apgar score <7 at 5 minutes.

Comparison 33 (4.2) PGE2 gel vs PGE2 tablet (all women, unfavourable cervix), Outcome 23 Postpartum haemorrhage.
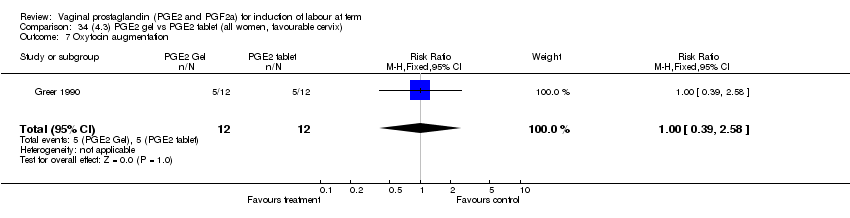
Comparison 34 (4.3) PGE2 gel vs PGE2 tablet (all women, favourable cervix), Outcome 7 Oxytocin augmentation.
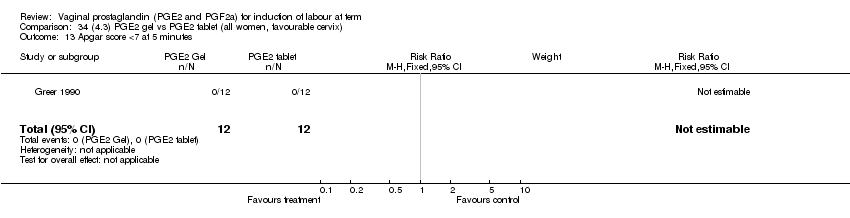
Comparison 34 (4.3) PGE2 gel vs PGE2 tablet (all women, favourable cervix), Outcome 13 Apgar score <7 at 5 minutes.
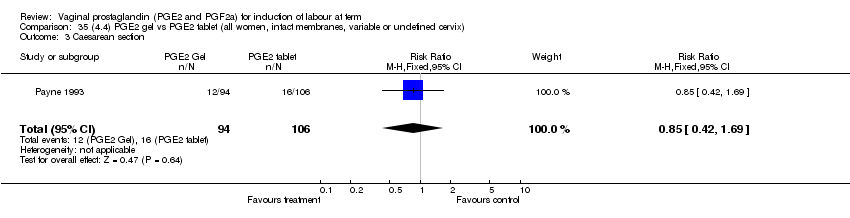
Comparison 35 (4.4) PGE2 gel vs PGE2 tablet (all women, intact membranes, variable or undefined cervix), Outcome 3 Caesarean section.

Comparison 35 (4.4) PGE2 gel vs PGE2 tablet (all women, intact membranes, variable or undefined cervix), Outcome 7 Oxytocin augmentation.
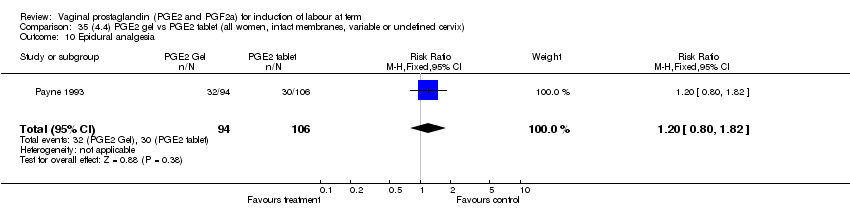
Comparison 35 (4.4) PGE2 gel vs PGE2 tablet (all women, intact membranes, variable or undefined cervix), Outcome 10 Epidural analgesia.
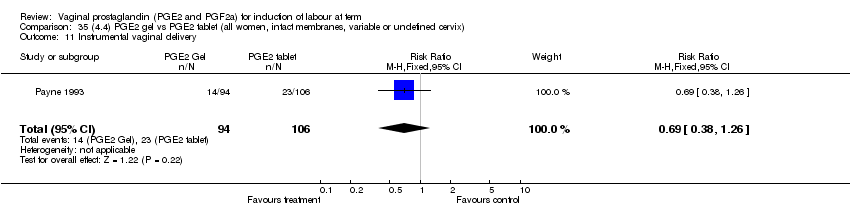
Comparison 35 (4.4) PGE2 gel vs PGE2 tablet (all women, intact membranes, variable or undefined cervix), Outcome 11 Instrumental vaginal delivery.

Comparison 35 (4.4) PGE2 gel vs PGE2 tablet (all women, intact membranes, variable or undefined cervix), Outcome 23 Postpartum haemorrhage.
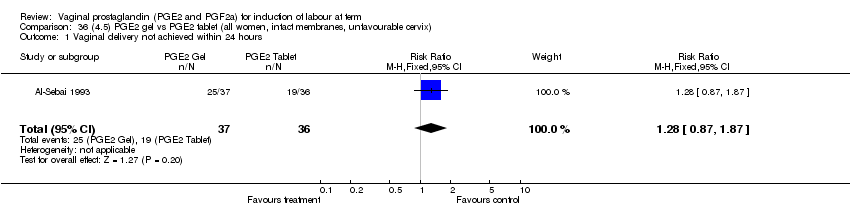
Comparison 36 (4.5) PGE2 gel vs PGE2 tablet (all women, intact membranes, unfavourable cervix), Outcome 1 Vaginal delivery not achieved within 24 hours.
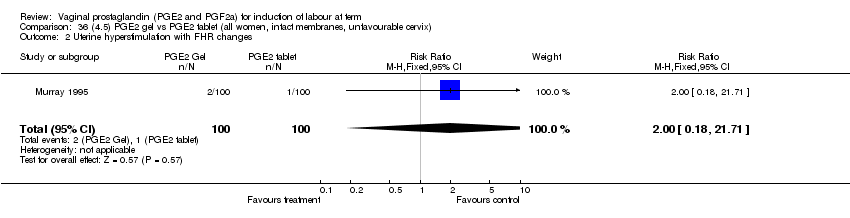
Comparison 36 (4.5) PGE2 gel vs PGE2 tablet (all women, intact membranes, unfavourable cervix), Outcome 2 Uterine hyperstimulation with FHR changes.

Comparison 36 (4.5) PGE2 gel vs PGE2 tablet (all women, intact membranes, unfavourable cervix), Outcome 3 Caesarean section.

Comparison 36 (4.5) PGE2 gel vs PGE2 tablet (all women, intact membranes, unfavourable cervix), Outcome 5 Serious maternal morbidity or death.
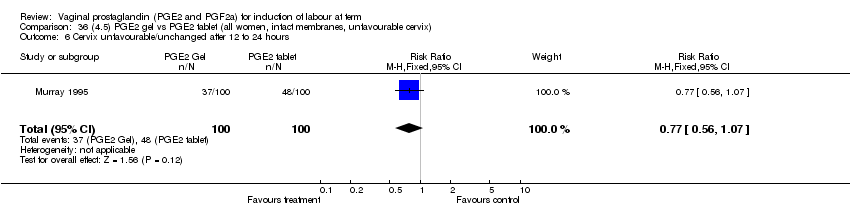
Comparison 36 (4.5) PGE2 gel vs PGE2 tablet (all women, intact membranes, unfavourable cervix), Outcome 6 Cervix unfavourable/unchanged after 12 to 24 hours.

Comparison 36 (4.5) PGE2 gel vs PGE2 tablet (all women, intact membranes, unfavourable cervix), Outcome 7 Oxytocin augmentation.
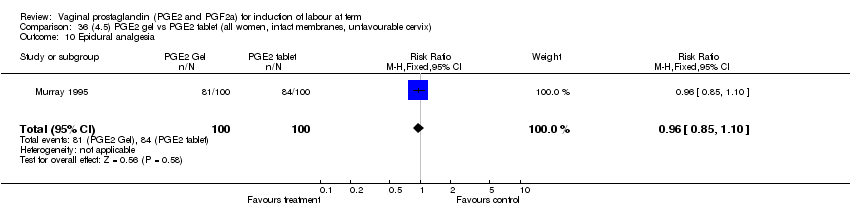
Comparison 36 (4.5) PGE2 gel vs PGE2 tablet (all women, intact membranes, unfavourable cervix), Outcome 10 Epidural analgesia.

Comparison 36 (4.5) PGE2 gel vs PGE2 tablet (all women, intact membranes, unfavourable cervix), Outcome 11 Instrumental vaginal delivery.

Comparison 37 (4.10) PGE2 gel vs PGE2 tablet (all primiparae), Outcome 1 Vaginal delivery not achieved within 24 hours.

Comparison 37 (4.10) PGE2 gel vs PGE2 tablet (all primiparae), Outcome 2 Uterine hyperstimulation with FHR changes.
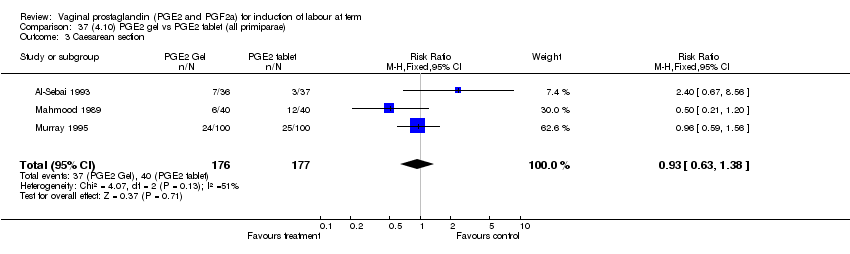
Comparison 37 (4.10) PGE2 gel vs PGE2 tablet (all primiparae), Outcome 3 Caesarean section.

Comparison 37 (4.10) PGE2 gel vs PGE2 tablet (all primiparae), Outcome 5 Serious maternal morbidity or death.
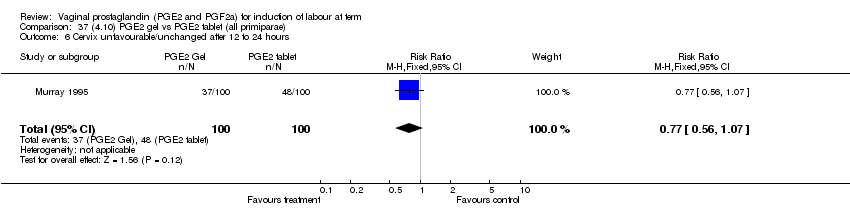
Comparison 37 (4.10) PGE2 gel vs PGE2 tablet (all primiparae), Outcome 6 Cervix unfavourable/unchanged after 12 to 24 hours.

Comparison 37 (4.10) PGE2 gel vs PGE2 tablet (all primiparae), Outcome 7 Oxytocin augmentation.

Comparison 37 (4.10) PGE2 gel vs PGE2 tablet (all primiparae), Outcome 10 Epidural analgesia.

Comparison 37 (4.10) PGE2 gel vs PGE2 tablet (all primiparae), Outcome 11 Instrumental vaginal delivery.

Comparison 37 (4.10) PGE2 gel vs PGE2 tablet (all primiparae), Outcome 13 Apgar score <7 at 5 minutes.

Comparison 37 (4.10) PGE2 gel vs PGE2 tablet (all primiparae), Outcome 23 Postpartum haemorrhage.

Comparison 38 (4.11) PGE2 gel vs PGE2 tablet (all primiparae, unfavourable cervix), Outcome 1 Vaginal delivery not achieved within 24 hours.

Comparison 38 (4.11) PGE2 gel vs PGE2 tablet (all primiparae, unfavourable cervix), Outcome 2 Uterine hyperstimulation with FHR changes.
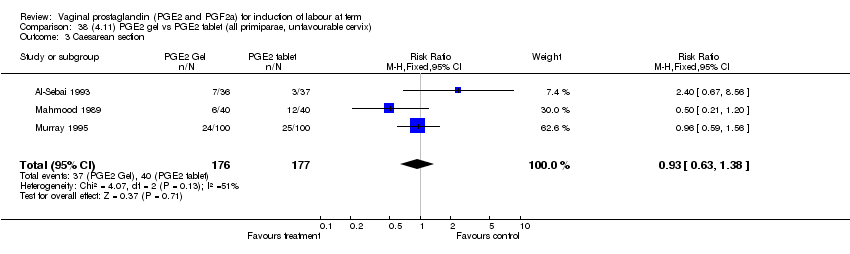
Comparison 38 (4.11) PGE2 gel vs PGE2 tablet (all primiparae, unfavourable cervix), Outcome 3 Caesarean section.

Comparison 38 (4.11) PGE2 gel vs PGE2 tablet (all primiparae, unfavourable cervix), Outcome 5 Serious maternal morbidity or death.
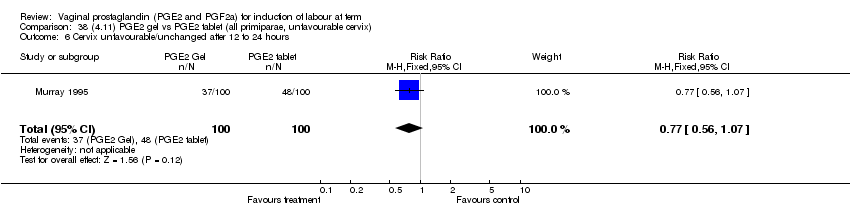
Comparison 38 (4.11) PGE2 gel vs PGE2 tablet (all primiparae, unfavourable cervix), Outcome 6 Cervix unfavourable/unchanged after 12 to 24 hours.

Comparison 38 (4.11) PGE2 gel vs PGE2 tablet (all primiparae, unfavourable cervix), Outcome 7 Oxytocin augmentation.
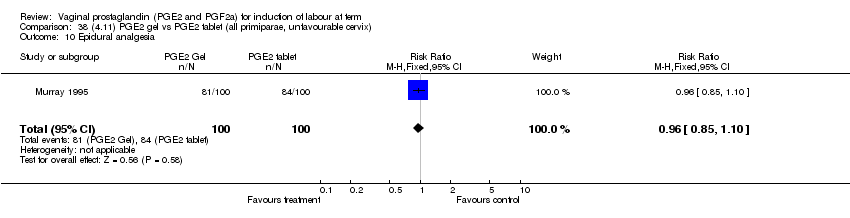
Comparison 38 (4.11) PGE2 gel vs PGE2 tablet (all primiparae, unfavourable cervix), Outcome 10 Epidural analgesia.

Comparison 38 (4.11) PGE2 gel vs PGE2 tablet (all primiparae, unfavourable cervix), Outcome 11 Instrumental vaginal delivery.

Comparison 38 (4.11) PGE2 gel vs PGE2 tablet (all primiparae, unfavourable cervix), Outcome 13 Apgar score <7 at 5 minutes.

Comparison 38 (4.11) PGE2 gel vs PGE2 tablet (all primiparae, unfavourable cervix), Outcome 23 Postpartum haemorrhage.

Comparison 39 (4.14) PGE2 gel vs PGE2 tablet (all primiparae, intact membranes, unfavourable cervix), Outcome 1 Vaginal delivery not achieved within 24 hours.

Comparison 39 (4.14) PGE2 gel vs PGE2 tablet (all primiparae, intact membranes, unfavourable cervix), Outcome 2 Uterine hyperstimulation with FHR changes.

Comparison 39 (4.14) PGE2 gel vs PGE2 tablet (all primiparae, intact membranes, unfavourable cervix), Outcome 3 Caesarean section.

Comparison 39 (4.14) PGE2 gel vs PGE2 tablet (all primiparae, intact membranes, unfavourable cervix), Outcome 5 Serious maternal morbidity or death.

Comparison 39 (4.14) PGE2 gel vs PGE2 tablet (all primiparae, intact membranes, unfavourable cervix), Outcome 6 Cervix unfavourable/unchanged after 12 to 24 hours.

Comparison 39 (4.14) PGE2 gel vs PGE2 tablet (all primiparae, intact membranes, unfavourable cervix), Outcome 7 Oxytocin augmentation.

Comparison 39 (4.14) PGE2 gel vs PGE2 tablet (all primiparae, intact membranes, unfavourable cervix), Outcome 10 Epidural analgesia.

Comparison 39 (4.14) PGE2 gel vs PGE2 tablet (all primiparae, intact membranes, unfavourable cervix), Outcome 11 Instrumental vaginal delivery.

Comparison 40 (5.1) PGE2 gel vs PGE2 suppository/pessary (all women), Outcome 2 Uterine hyperstimulation with FHR changes.

Comparison 40 (5.1) PGE2 gel vs PGE2 suppository/pessary (all women), Outcome 3 Caesarean section.
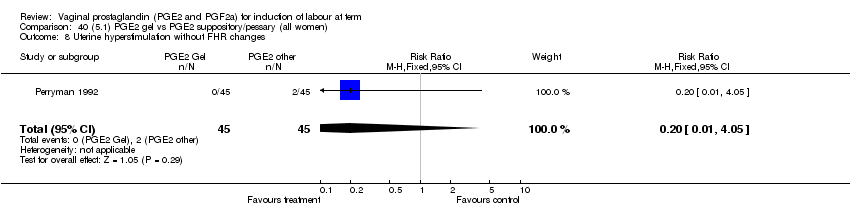
Comparison 40 (5.1) PGE2 gel vs PGE2 suppository/pessary (all women), Outcome 8 Uterine hyperstimulation without FHR changes.
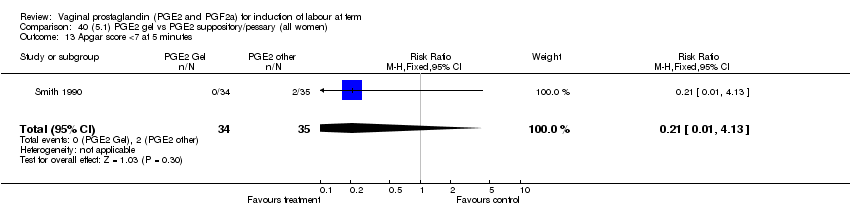
Comparison 40 (5.1) PGE2 gel vs PGE2 suppository/pessary (all women), Outcome 13 Apgar score <7 at 5 minutes.
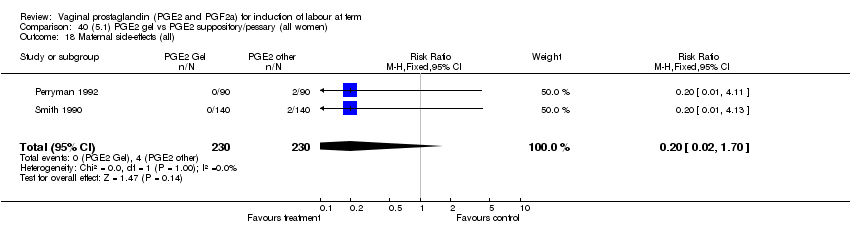
Comparison 40 (5.1) PGE2 gel vs PGE2 suppository/pessary (all women), Outcome 18 Maternal side‐effects (all).
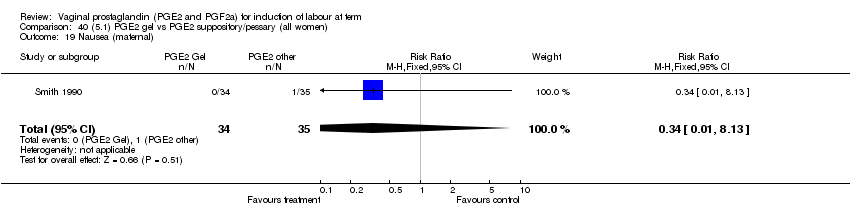
Comparison 40 (5.1) PGE2 gel vs PGE2 suppository/pessary (all women), Outcome 19 Nausea (maternal).

Comparison 40 (5.1) PGE2 gel vs PGE2 suppository/pessary (all women), Outcome 20 Vomitting (maternal).
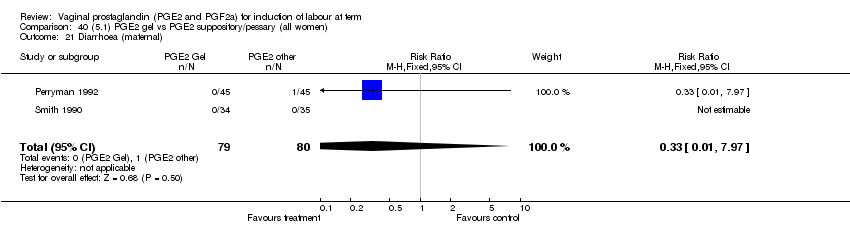
Comparison 40 (5.1) PGE2 gel vs PGE2 suppository/pessary (all women), Outcome 21 Diarrhoea (maternal).
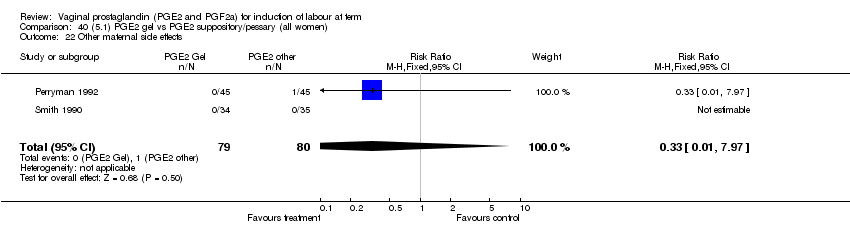
Comparison 40 (5.1) PGE2 gel vs PGE2 suppository/pessary (all women), Outcome 22 Other maternal side effects.

Comparison 41 (5.2) PGE2 gel vs PGE2 suppository/pessary (all women, unfavourable cervix), Outcome 2 Uterine hyperstimulation with FHR changes.

Comparison 41 (5.2) PGE2 gel vs PGE2 suppository/pessary (all women, unfavourable cervix), Outcome 3 Caesarean section.

Comparison 41 (5.2) PGE2 gel vs PGE2 suppository/pessary (all women, unfavourable cervix), Outcome 8 Uterine hyperstimulation without FHR changes.

Comparison 41 (5.2) PGE2 gel vs PGE2 suppository/pessary (all women, unfavourable cervix), Outcome 13 Apgar score <7 at 5 minutes.
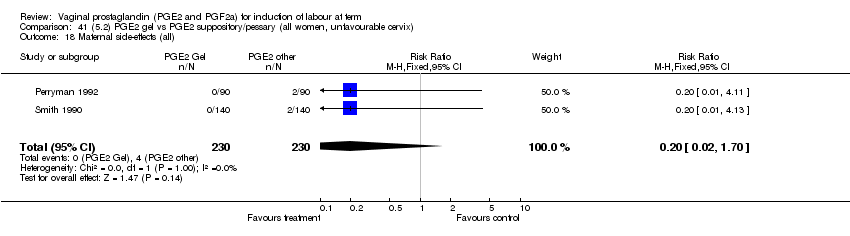
Comparison 41 (5.2) PGE2 gel vs PGE2 suppository/pessary (all women, unfavourable cervix), Outcome 18 Maternal side‐effects (all).
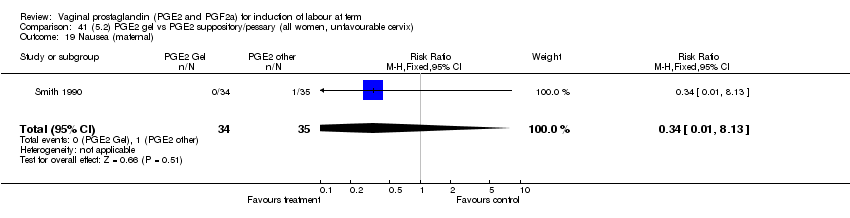
Comparison 41 (5.2) PGE2 gel vs PGE2 suppository/pessary (all women, unfavourable cervix), Outcome 19 Nausea (maternal).

Comparison 41 (5.2) PGE2 gel vs PGE2 suppository/pessary (all women, unfavourable cervix), Outcome 20 Vomitting (maternal).

Comparison 41 (5.2) PGE2 gel vs PGE2 suppository/pessary (all women, unfavourable cervix), Outcome 21 Diarrhoea (maternal).

Comparison 41 (5.2) PGE2 gel vs PGE2 suppository/pessary (all women, unfavourable cervix), Outcome 22 Other maternal side‐effects.

Comparison 42 (5.5) PGE2 gel vs PGE2 suppository/pessary (all women, intact membranes, unfavourable cervix), Outcome 2 Uterine hyperstimulation with FHR changes.

Comparison 42 (5.5) PGE2 gel vs PGE2 suppository/pessary (all women, intact membranes, unfavourable cervix), Outcome 3 Caesarean section.

Comparison 42 (5.5) PGE2 gel vs PGE2 suppository/pessary (all women, intact membranes, unfavourable cervix), Outcome 8 Uterine hyperstimulation without FHR changes.

Comparison 42 (5.5) PGE2 gel vs PGE2 suppository/pessary (all women, intact membranes, unfavourable cervix), Outcome 13 Apgar score <7 at 5 minutes.
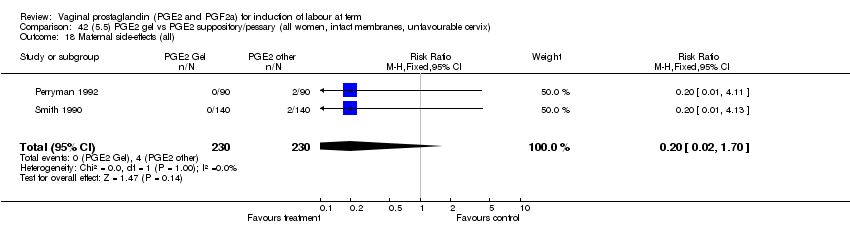
Comparison 42 (5.5) PGE2 gel vs PGE2 suppository/pessary (all women, intact membranes, unfavourable cervix), Outcome 18 Maternal side‐effects (all).

Comparison 42 (5.5) PGE2 gel vs PGE2 suppository/pessary (all women, intact membranes, unfavourable cervix), Outcome 19 Nausea (maternal).

Comparison 42 (5.5) PGE2 gel vs PGE2 suppository/pessary (all women, intact membranes, unfavourable cervix), Outcome 20 Vomitting (maternal).
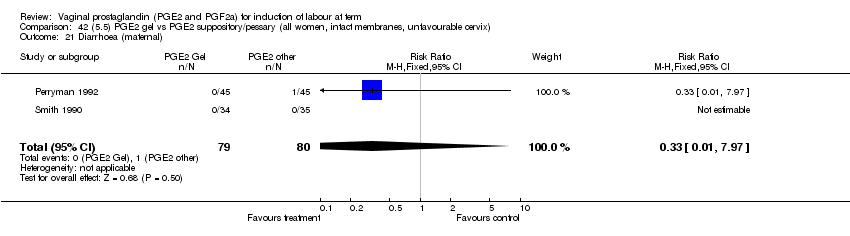
Comparison 42 (5.5) PGE2 gel vs PGE2 suppository/pessary (all women, intact membranes, unfavourable cervix), Outcome 21 Diarrhoea (maternal).
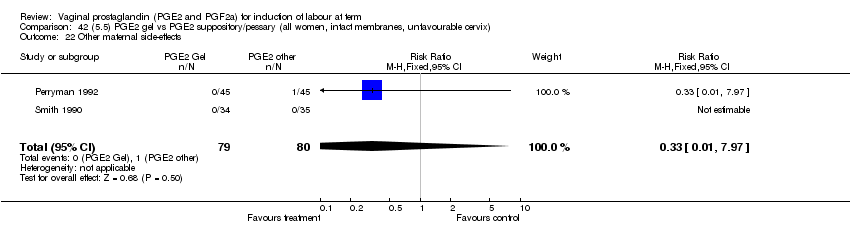
Comparison 42 (5.5) PGE2 gel vs PGE2 suppository/pessary (all women, intact membranes, unfavourable cervix), Outcome 22 Other maternal side‐effects.

Comparison 43 (6.1) PGE2 tablet vs PGE2 pessary/suppository (all women), Outcome 3 Caesarean section.

Comparison 43 (6.1) PGE2 tablet vs PGE2 pessary/suppository (all women), Outcome 7 Oxytocin augmentation.

Comparison 43 (6.1) PGE2 tablet vs PGE2 pessary/suppository (all women), Outcome 8 Uterine hyperstimulation without FHR changes.

Comparison 43 (6.1) PGE2 tablet vs PGE2 pessary/suppository (all women), Outcome 10 Epidural analgesia.

Comparison 43 (6.1) PGE2 tablet vs PGE2 pessary/suppository (all women), Outcome 11 Instrumental vaginal delivery.

Comparison 43 (6.1) PGE2 tablet vs PGE2 pessary/suppository (all women), Outcome 13 Apgar score <7 at 5 minutes.

Comparison 43 (6.1) PGE2 tablet vs PGE2 pessary/suppository (all women), Outcome 18 Maternal side‐effects (all).

Comparison 43 (6.1) PGE2 tablet vs PGE2 pessary/suppository (all women), Outcome 20 Vomitting (maternal).
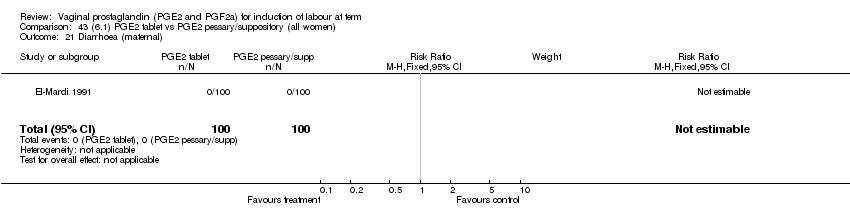
Comparison 43 (6.1) PGE2 tablet vs PGE2 pessary/suppository (all women), Outcome 21 Diarrhoea (maternal).
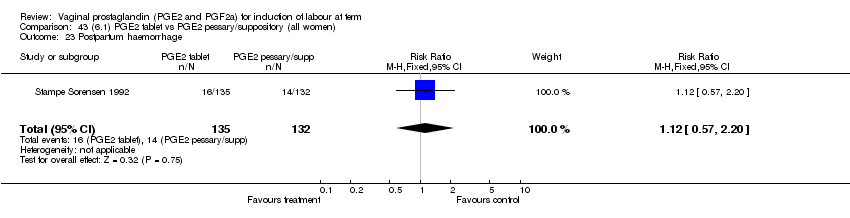
Comparison 43 (6.1) PGE2 tablet vs PGE2 pessary/suppository (all women), Outcome 23 Postpartum haemorrhage.

Comparison 44 (6.2) PGE2 tablet vs PGE2 pessary/suppository (all women, unfavourable cervix), Outcome 3 Caesarean section.
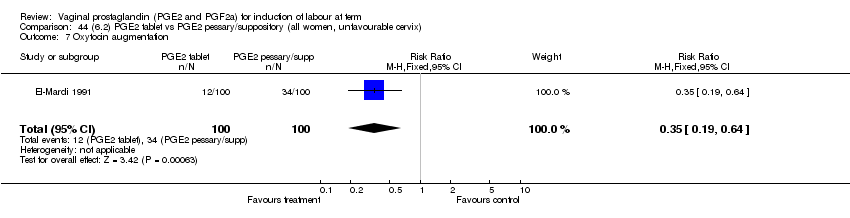
Comparison 44 (6.2) PGE2 tablet vs PGE2 pessary/suppository (all women, unfavourable cervix), Outcome 7 Oxytocin augmentation.
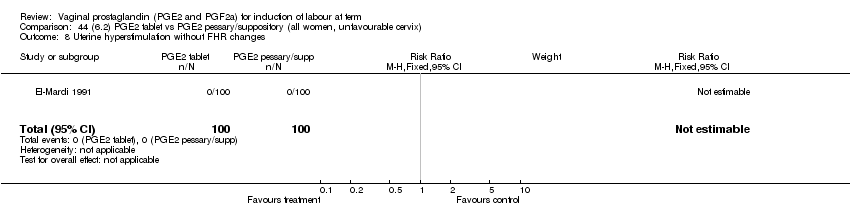
Comparison 44 (6.2) PGE2 tablet vs PGE2 pessary/suppository (all women, unfavourable cervix), Outcome 8 Uterine hyperstimulation without FHR changes.
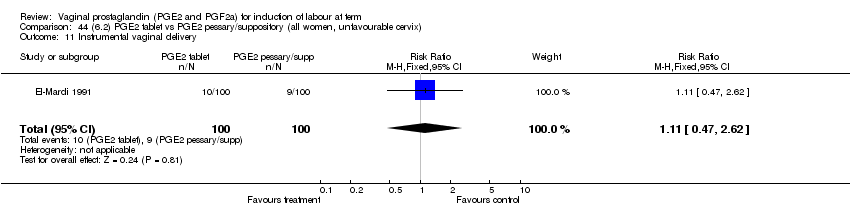
Comparison 44 (6.2) PGE2 tablet vs PGE2 pessary/suppository (all women, unfavourable cervix), Outcome 11 Instrumental vaginal delivery.
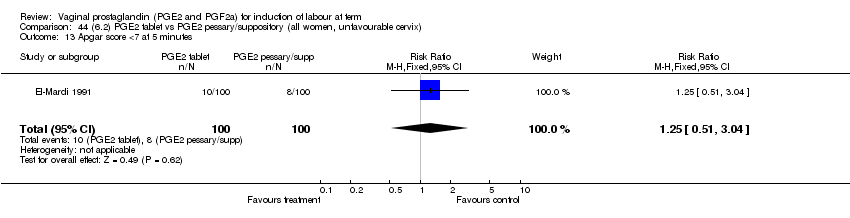
Comparison 44 (6.2) PGE2 tablet vs PGE2 pessary/suppository (all women, unfavourable cervix), Outcome 13 Apgar score <7 at 5 minutes.

Comparison 44 (6.2) PGE2 tablet vs PGE2 pessary/suppository (all women, unfavourable cervix), Outcome 18 Maternal side‐effects (all).

Comparison 44 (6.2) PGE2 tablet vs PGE2 pessary/suppository (all women, unfavourable cervix), Outcome 20 Vomitting (maternal).

Comparison 44 (6.2) PGE2 tablet vs PGE2 pessary/suppository (all women, unfavourable cervix), Outcome 21 Diarrhoea (maternal).
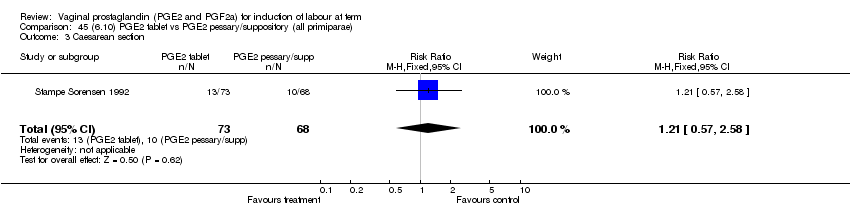
Comparison 45 (6.10) PGE2 tablet vs PGE2 pessary/suppository (all primiparae), Outcome 3 Caesarean section.

Comparison 45 (6.10) PGE2 tablet vs PGE2 pessary/suppository (all primiparae), Outcome 7 Oxytocin augmentation.

Comparison 46 (6.19) PGE2 tablet vs PGE2 pessary/suppository (all multiparae), Outcome 3 Caesarean section.

Comparison 46 (6.19) PGE2 tablet vs PGE2 pessary/suppository (all multiparae), Outcome 7 Oxytocin augmentation.

Comparison 47 (7.1) PGE2 (controlled release) vs all PGE2 delivery systems (all women), Outcome 1 Vaginal delivery not achieved within 24 hours.

Comparison 47 (7.1) PGE2 (controlled release) vs all PGE2 delivery systems (all women), Outcome 2 Uterine hyperstimulation with FHR changes.
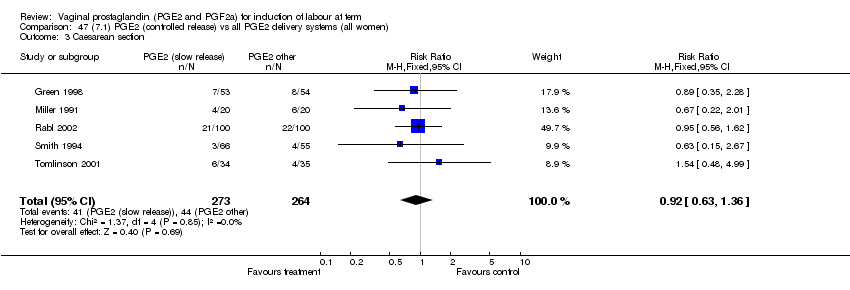
Comparison 47 (7.1) PGE2 (controlled release) vs all PGE2 delivery systems (all women), Outcome 3 Caesarean section.
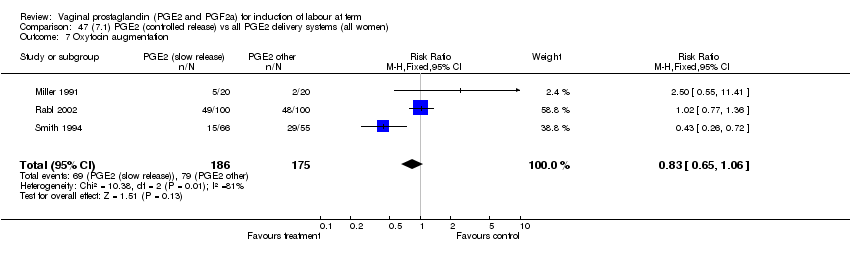
Comparison 47 (7.1) PGE2 (controlled release) vs all PGE2 delivery systems (all women), Outcome 7 Oxytocin augmentation.

Comparison 47 (7.1) PGE2 (controlled release) vs all PGE2 delivery systems (all women), Outcome 8 Uterine hyperstimulation without FHR changes.

Comparison 47 (7.1) PGE2 (controlled release) vs all PGE2 delivery systems (all women), Outcome 9 Uterine rupture.
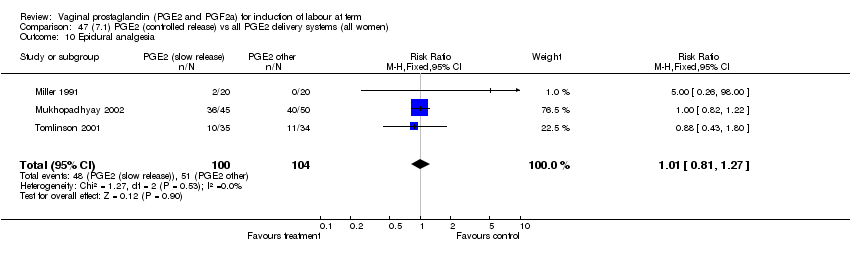
Comparison 47 (7.1) PGE2 (controlled release) vs all PGE2 delivery systems (all women), Outcome 10 Epidural analgesia.

Comparison 47 (7.1) PGE2 (controlled release) vs all PGE2 delivery systems (all women), Outcome 11 Instrumental vaginal delivery.

Comparison 47 (7.1) PGE2 (controlled release) vs all PGE2 delivery systems (all women), Outcome 13 Apgar score <7 at 5 minutes.

Comparison 48 (7.2) PGE2 (controlled release) vs all PGE2 delivery systems (all women, unfavourable cervix), Outcome 2 Uterine hyperstimulation with FHR changes.
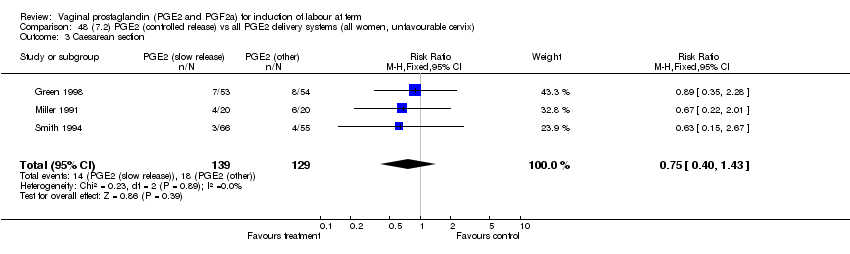
Comparison 48 (7.2) PGE2 (controlled release) vs all PGE2 delivery systems (all women, unfavourable cervix), Outcome 3 Caesarean section.

Comparison 48 (7.2) PGE2 (controlled release) vs all PGE2 delivery systems (all women, unfavourable cervix), Outcome 7 Oxytocin augmentation.
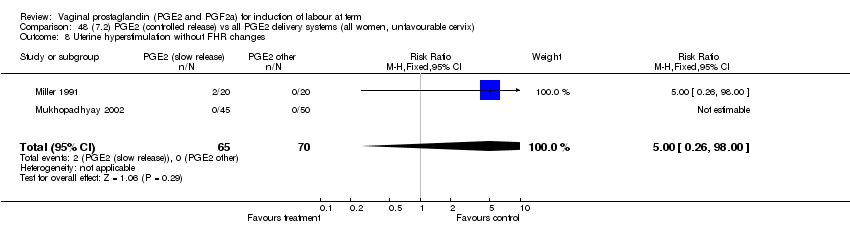
Comparison 48 (7.2) PGE2 (controlled release) vs all PGE2 delivery systems (all women, unfavourable cervix), Outcome 8 Uterine hyperstimulation without FHR changes.

Comparison 48 (7.2) PGE2 (controlled release) vs all PGE2 delivery systems (all women, unfavourable cervix), Outcome 10 Epidural analgesia.
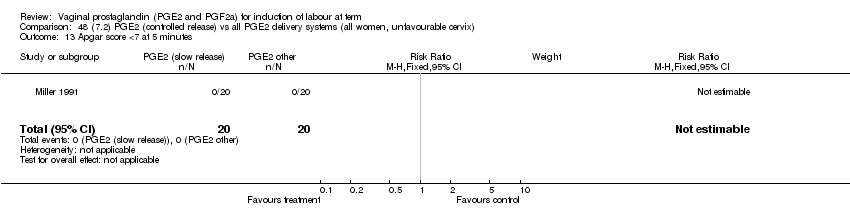
Comparison 48 (7.2) PGE2 (controlled release) vs all PGE2 delivery systems (all women, unfavourable cervix), Outcome 13 Apgar score <7 at 5 minutes.
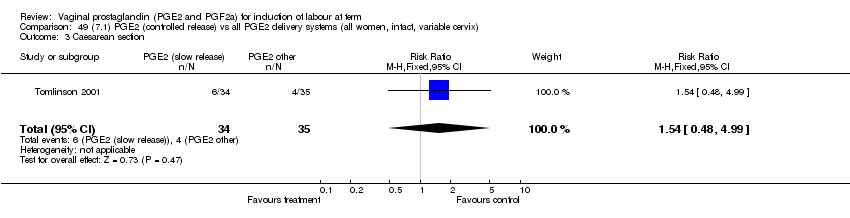
Comparison 49 (7.1) PGE2 (controlled release) vs all PGE2 delivery systems (all women, intact, variable cervix), Outcome 3 Caesarean section.

Comparison 49 (7.1) PGE2 (controlled release) vs all PGE2 delivery systems (all women, intact, variable cervix), Outcome 10 Epidural analgesia.
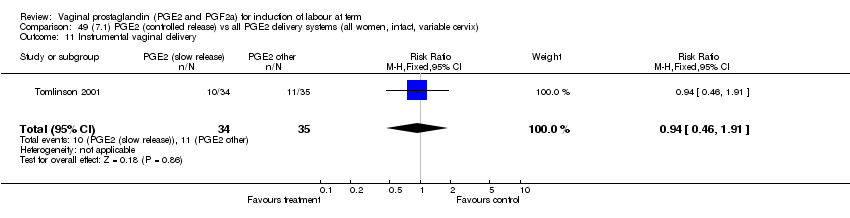
Comparison 49 (7.1) PGE2 (controlled release) vs all PGE2 delivery systems (all women, intact, variable cervix), Outcome 11 Instrumental vaginal delivery.

Comparison 50 (7.5) PGE2 (controlled release) vs all PGE2 delivery systems (all women, intact membranes, unfav. cervix), Outcome 2 Uterine hyperstimulation with FHR changes.

Comparison 50 (7.5) PGE2 (controlled release) vs all PGE2 delivery systems (all women, intact membranes, unfav. cervix), Outcome 3 Caesarean section.
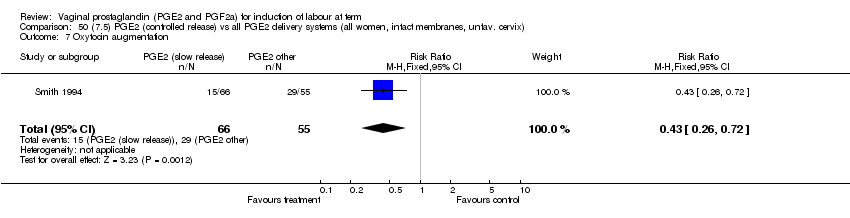
Comparison 50 (7.5) PGE2 (controlled release) vs all PGE2 delivery systems (all women, intact membranes, unfav. cervix), Outcome 7 Oxytocin augmentation.

Comparison 51 (7.10) PGE2 (controlled release) vs all PGE2 delivery systems (all primiparae), Outcome 2 Uterine hyperstimulation with FHR changes.

Comparison 51 (7.10) PGE2 (controlled release) vs all PGE2 delivery systems (all primiparae), Outcome 3 Caesarean section.
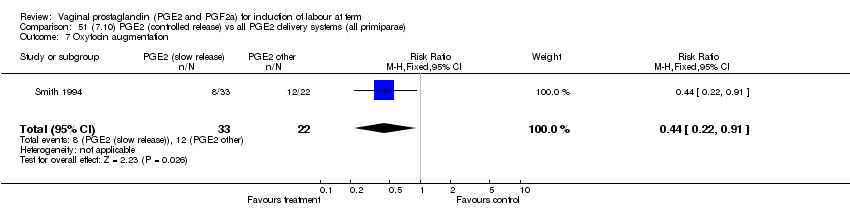
Comparison 51 (7.10) PGE2 (controlled release) vs all PGE2 delivery systems (all primiparae), Outcome 7 Oxytocin augmentation.
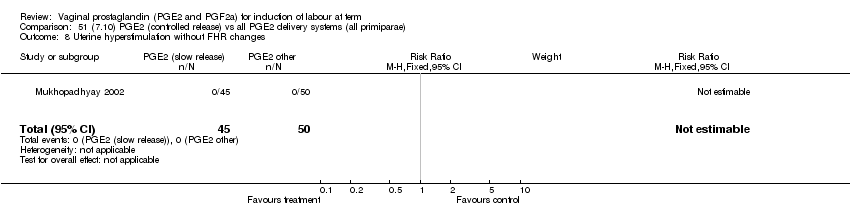
Comparison 51 (7.10) PGE2 (controlled release) vs all PGE2 delivery systems (all primiparae), Outcome 8 Uterine hyperstimulation without FHR changes.
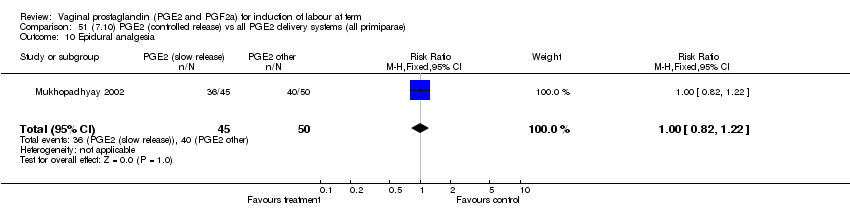
Comparison 51 (7.10) PGE2 (controlled release) vs all PGE2 delivery systems (all primiparae), Outcome 10 Epidural analgesia.
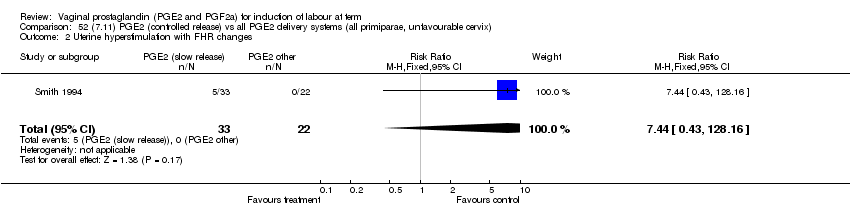
Comparison 52 (7.11) PGE2 (controlled release) vs all PGE2 delivery systems (all primiparae, unfavourable cervix), Outcome 2 Uterine hyperstimulation with FHR changes.
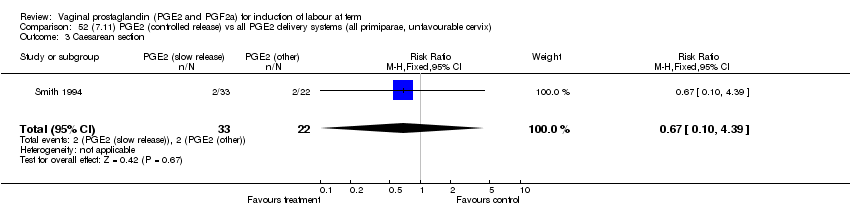
Comparison 52 (7.11) PGE2 (controlled release) vs all PGE2 delivery systems (all primiparae, unfavourable cervix), Outcome 3 Caesarean section.

Comparison 52 (7.11) PGE2 (controlled release) vs all PGE2 delivery systems (all primiparae, unfavourable cervix), Outcome 7 Oxytocin augmentation.

Comparison 52 (7.11) PGE2 (controlled release) vs all PGE2 delivery systems (all primiparae, unfavourable cervix), Outcome 8 Uterine hyperstimulation without FHR changes.

Comparison 52 (7.11) PGE2 (controlled release) vs all PGE2 delivery systems (all primiparae, unfavourable cervix), Outcome 10 Epidural analgesia.

Comparison 53 (7.14) PGE2 (controlled release) vs all PGE2 delivery systems (all prim., intact membranes, unfav. cervix), Outcome 2 Uterine hyperstimulation with FHR changes.
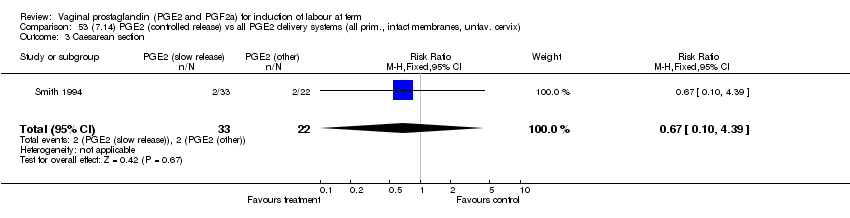
Comparison 53 (7.14) PGE2 (controlled release) vs all PGE2 delivery systems (all prim., intact membranes, unfav. cervix), Outcome 3 Caesarean section.

Comparison 53 (7.14) PGE2 (controlled release) vs all PGE2 delivery systems (all prim., intact membranes, unfav. cervix), Outcome 7 Oxytocin augmentation.

Comparison 54 (7.19) PGE2 (controlled release) vs all PGE2 delivery systems (all multiparae), Outcome 2 Uterine hyperstimulation with FHR changes.

Comparison 54 (7.19) PGE2 (controlled release) vs all PGE2 delivery systems (all multiparae), Outcome 3 Caesarean section.

Comparison 54 (7.19) PGE2 (controlled release) vs all PGE2 delivery systems (all multiparae), Outcome 7 Oxytocin augmentation.

Comparison 55 (7.20) PGE2 (controlled release) vs all PGE2 delivery systems (all multiparae, unfavourable cervix), Outcome 2 Uterine hyperstimulation with FHR changes.

Comparison 55 (7.20) PGE2 (controlled release) vs all PGE2 delivery systems (all multiparae, unfavourable cervix), Outcome 3 Caesarean section.
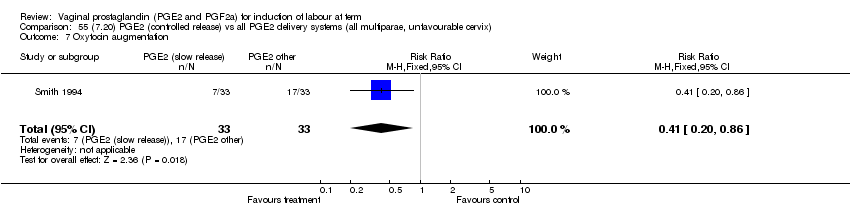
Comparison 55 (7.20) PGE2 (controlled release) vs all PGE2 delivery systems (all multiparae, unfavourable cervix), Outcome 7 Oxytocin augmentation.
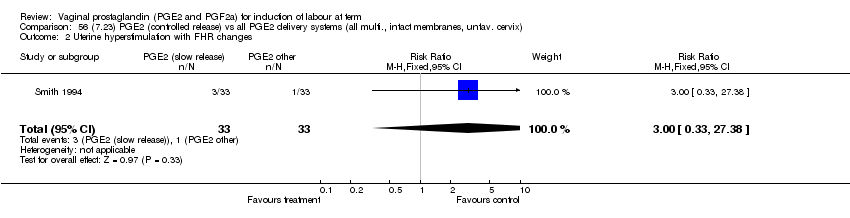
Comparison 56 (7.23) PGE2 (controlled release) vs all PGE2 delivery systems (all multi., intact membranes, unfav. cervix), Outcome 2 Uterine hyperstimulation with FHR changes.

Comparison 56 (7.23) PGE2 (controlled release) vs all PGE2 delivery systems (all multi., intact membranes, unfav. cervix), Outcome 3 Caesarean section.

Comparison 56 (7.23) PGE2 (controlled release) vs all PGE2 delivery systems (all multi., intact membranes, unfav. cervix), Outcome 7 Oxytocin augmentation.
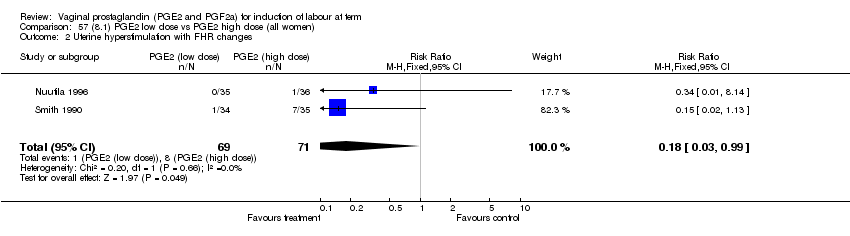
Comparison 57 (8.1) PGE2 low dose vs PGE2 high dose (all women), Outcome 2 Uterine hyperstimulation with FHR changes.
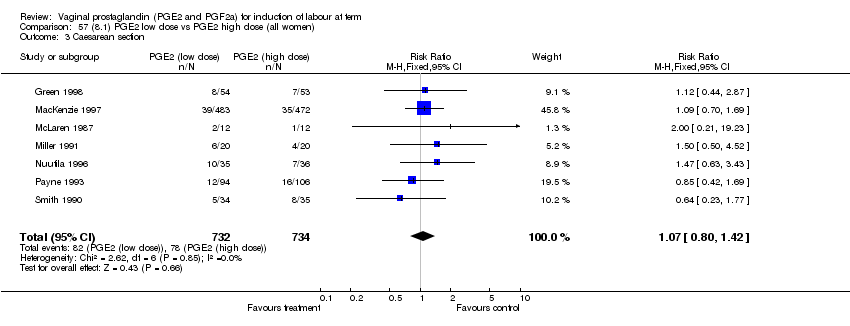
Comparison 57 (8.1) PGE2 low dose vs PGE2 high dose (all women), Outcome 3 Caesarean section.

Comparison 57 (8.1) PGE2 low dose vs PGE2 high dose (all women), Outcome 4 Serious neonatal morbidity or perinatal death.

Comparison 57 (8.1) PGE2 low dose vs PGE2 high dose (all women), Outcome 7 Oxytocin augmentation.
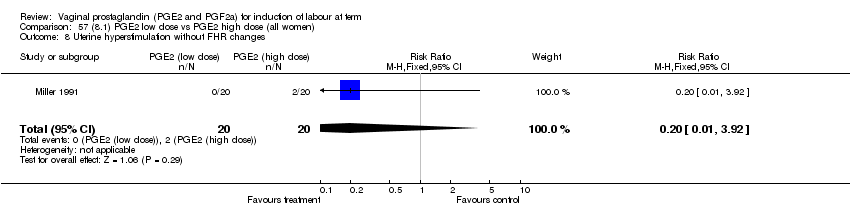
Comparison 57 (8.1) PGE2 low dose vs PGE2 high dose (all women), Outcome 8 Uterine hyperstimulation without FHR changes.

Comparison 57 (8.1) PGE2 low dose vs PGE2 high dose (all women), Outcome 10 Epidural analgesia.

Comparison 57 (8.1) PGE2 low dose vs PGE2 high dose (all women), Outcome 11 Instrumental vaginal delivery.

Comparison 57 (8.1) PGE2 low dose vs PGE2 high dose (all women), Outcome 12 Meconium stained liquor.

Comparison 57 (8.1) PGE2 low dose vs PGE2 high dose (all women), Outcome 13 Apgar score <7 at 5 minutes.

Comparison 57 (8.1) PGE2 low dose vs PGE2 high dose (all women), Outcome 14 Neonatal intensive care unit admission.

Comparison 57 (8.1) PGE2 low dose vs PGE2 high dose (all women), Outcome 16 Perinatal death.

Comparison 57 (8.1) PGE2 low dose vs PGE2 high dose (all women), Outcome 18 Maternal side‐effects (all).

Comparison 57 (8.1) PGE2 low dose vs PGE2 high dose (all women), Outcome 19 Nausea (maternal).
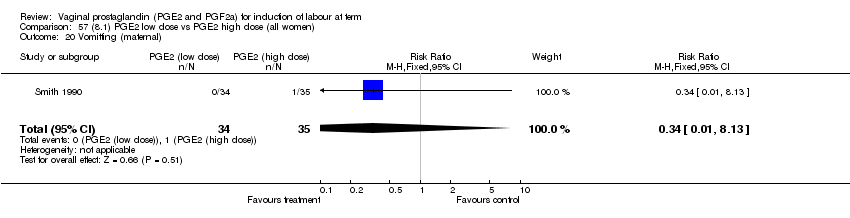
Comparison 57 (8.1) PGE2 low dose vs PGE2 high dose (all women), Outcome 20 Vomitting (maternal).

Comparison 57 (8.1) PGE2 low dose vs PGE2 high dose (all women), Outcome 21 Diarrhoea (maternal).

Comparison 57 (8.1) PGE2 low dose vs PGE2 high dose (all women), Outcome 22 Other maternal side‐effects.

Comparison 57 (8.1) PGE2 low dose vs PGE2 high dose (all women), Outcome 23 Postpartum haemorrhage.

Comparison 58 (8.2) PGE2 low dose vs PGE2 high dose (all women, unfavourable cervix), Outcome 2 Uterine hyperstimulation with FHR changes.

Comparison 58 (8.2) PGE2 low dose vs PGE2 high dose (all women, unfavourable cervix), Outcome 3 Caesarean section.
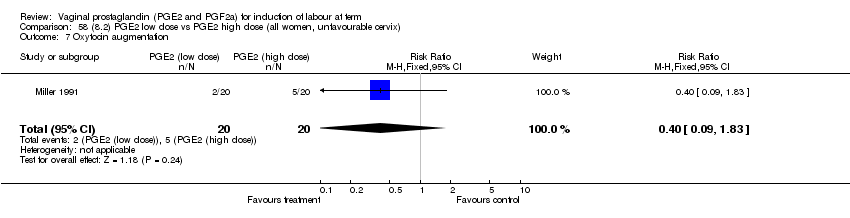
Comparison 58 (8.2) PGE2 low dose vs PGE2 high dose (all women, unfavourable cervix), Outcome 7 Oxytocin augmentation.

Comparison 58 (8.2) PGE2 low dose vs PGE2 high dose (all women, unfavourable cervix), Outcome 8 Uterine hyperstimulation without FHR changes.
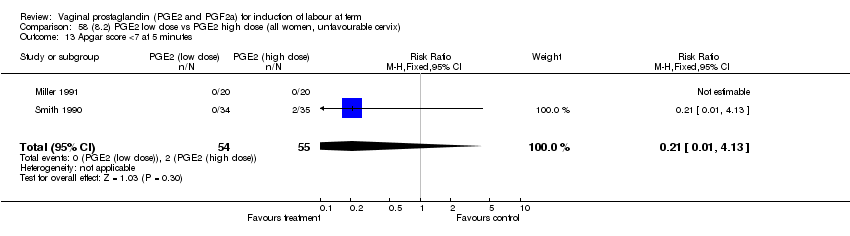
Comparison 58 (8.2) PGE2 low dose vs PGE2 high dose (all women, unfavourable cervix), Outcome 13 Apgar score <7 at 5 minutes.

Comparison 58 (8.2) PGE2 low dose vs PGE2 high dose (all women, unfavourable cervix), Outcome 18 Maternal side‐effects (all).

Comparison 58 (8.2) PGE2 low dose vs PGE2 high dose (all women, unfavourable cervix), Outcome 19 Nausea (maternal).

Comparison 58 (8.2) PGE2 low dose vs PGE2 high dose (all women, unfavourable cervix), Outcome 20 Vomitting (maternal).

Comparison 58 (8.2) PGE2 low dose vs PGE2 high dose (all women, unfavourable cervix), Outcome 21 Diarrhoea (maternal).

Comparison 58 (8.2) PGE2 low dose vs PGE2 high dose (all women, unfavourable cervix), Outcome 22 Other maternal side‐effects.
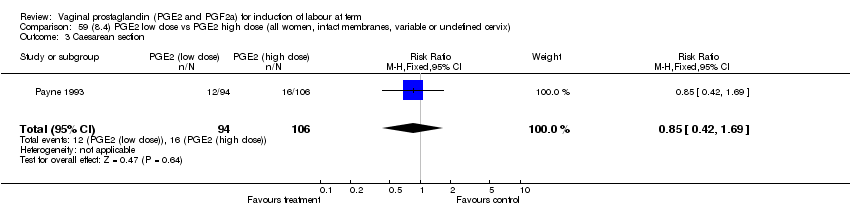
Comparison 59 (8.4) PGE2 low dose vs PGE2 high dose (all women, intact membranes, variable or undefined cervix), Outcome 3 Caesarean section.

Comparison 59 (8.4) PGE2 low dose vs PGE2 high dose (all women, intact membranes, variable or undefined cervix), Outcome 7 Oxytocin augmentation.
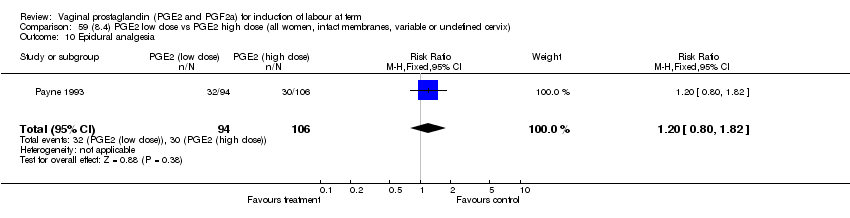
Comparison 59 (8.4) PGE2 low dose vs PGE2 high dose (all women, intact membranes, variable or undefined cervix), Outcome 10 Epidural analgesia.

Comparison 59 (8.4) PGE2 low dose vs PGE2 high dose (all women, intact membranes, variable or undefined cervix), Outcome 11 Instrumental vaginal delivery.
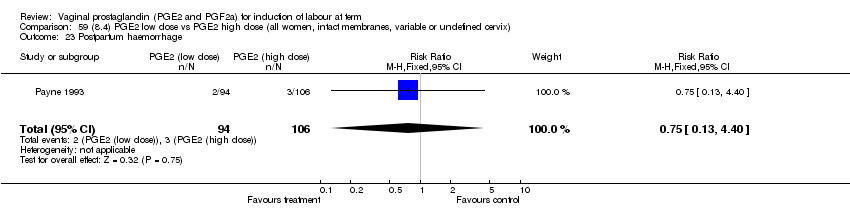
Comparison 59 (8.4) PGE2 low dose vs PGE2 high dose (all women, intact membranes, variable or undefined cervix), Outcome 23 Postpartum haemorrhage.
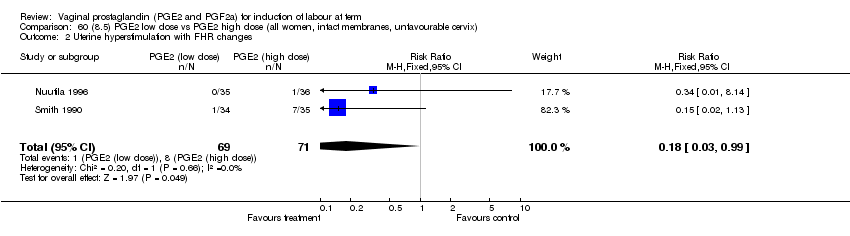
Comparison 60 (8.5) PGE2 low dose vs PGE2 high dose (all women, intact membranes, unfavourable cervix), Outcome 2 Uterine hyperstimulation with FHR changes.

Comparison 60 (8.5) PGE2 low dose vs PGE2 high dose (all women, intact membranes, unfavourable cervix), Outcome 3 Caesarean section.

Comparison 60 (8.5) PGE2 low dose vs PGE2 high dose (all women, intact membranes, unfavourable cervix), Outcome 13 Apgar score <7 at 5 minutes.

Comparison 60 (8.5) PGE2 low dose vs PGE2 high dose (all women, intact membranes, unfavourable cervix), Outcome 18 Maternal side‐effects (all).

Comparison 60 (8.5) PGE2 low dose vs PGE2 high dose (all women, intact membranes, unfavourable cervix), Outcome 19 Nausea (maternal).

Comparison 60 (8.5) PGE2 low dose vs PGE2 high dose (all women, intact membranes, unfavourable cervix), Outcome 20 Vomitting (maternal).

Comparison 60 (8.5) PGE2 low dose vs PGE2 high dose (all women, intact membranes, unfavourable cervix), Outcome 21 Diarrhoea (maternal).

Comparison 60 (8.5) PGE2 low dose vs PGE2 high dose (all women, intact membranes, unfavourable cervix), Outcome 22 Other maternal side‐effects.

Comparison 61 (8.10) PGE2 low dose vs PGE2 high dose (all primiparae), Outcome 3 Caesarean section.

Comparison 61 (8.10) PGE2 low dose vs PGE2 high dose (all primiparae), Outcome 4 Serious neonatal morbidity or perinatal death.

Comparison 61 (8.10) PGE2 low dose vs PGE2 high dose (all primiparae), Outcome 7 Oxytocin augmentation.

Comparison 61 (8.10) PGE2 low dose vs PGE2 high dose (all primiparae), Outcome 10 Epidural analgesia.

Comparison 61 (8.10) PGE2 low dose vs PGE2 high dose (all primiparae), Outcome 11 Instrumental vaginal delivery.
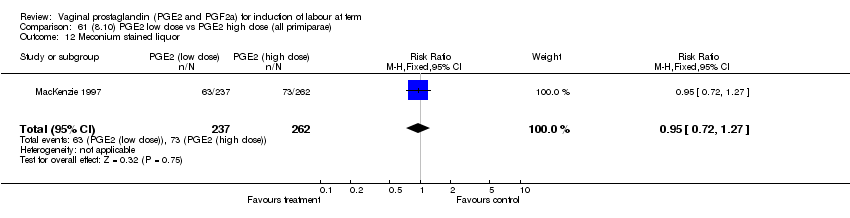
Comparison 61 (8.10) PGE2 low dose vs PGE2 high dose (all primiparae), Outcome 12 Meconium stained liquor.

Comparison 61 (8.10) PGE2 low dose vs PGE2 high dose (all primiparae), Outcome 13 Apgar score <7 at 5 minutes.
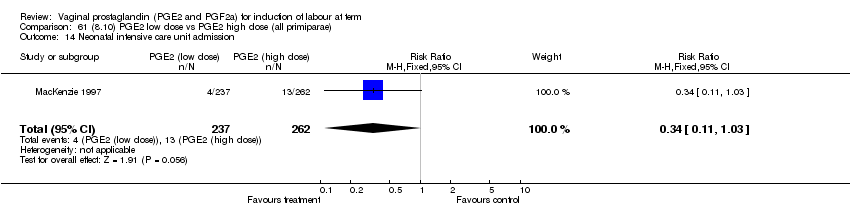
Comparison 61 (8.10) PGE2 low dose vs PGE2 high dose (all primiparae), Outcome 14 Neonatal intensive care unit admission.

Comparison 61 (8.10) PGE2 low dose vs PGE2 high dose (all primiparae), Outcome 16 Perinatal death.
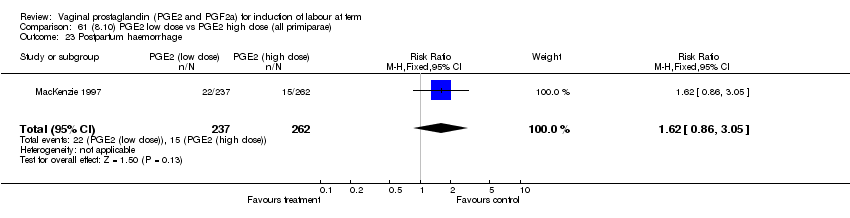
Comparison 61 (8.10) PGE2 low dose vs PGE2 high dose (all primiparae), Outcome 23 Postpartum haemorrhage.

Comparison 62 (8.19) PGE2 low dose vs PGE2 high dose (all multiparae), Outcome 3 Caesarean section.
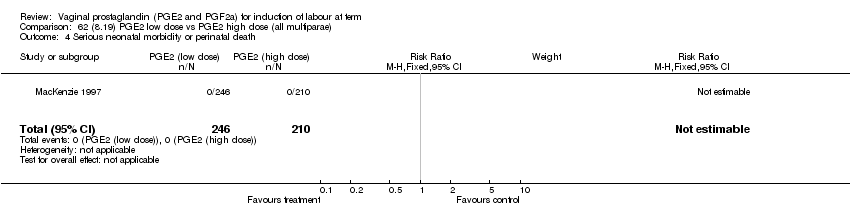
Comparison 62 (8.19) PGE2 low dose vs PGE2 high dose (all multiparae), Outcome 4 Serious neonatal morbidity or perinatal death.

Comparison 62 (8.19) PGE2 low dose vs PGE2 high dose (all multiparae), Outcome 7 Oxytocin augmentation.
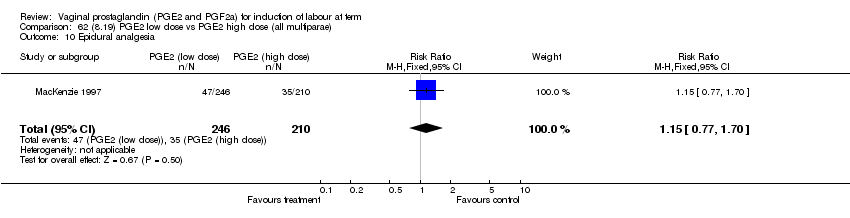
Comparison 62 (8.19) PGE2 low dose vs PGE2 high dose (all multiparae), Outcome 10 Epidural analgesia.

Comparison 62 (8.19) PGE2 low dose vs PGE2 high dose (all multiparae), Outcome 11 Instrumental vaginal delivery.

Comparison 62 (8.19) PGE2 low dose vs PGE2 high dose (all multiparae), Outcome 12 Meconium stained liquor.

Comparison 62 (8.19) PGE2 low dose vs PGE2 high dose (all multiparae), Outcome 13 Apgar score <7 at 5 minutes.
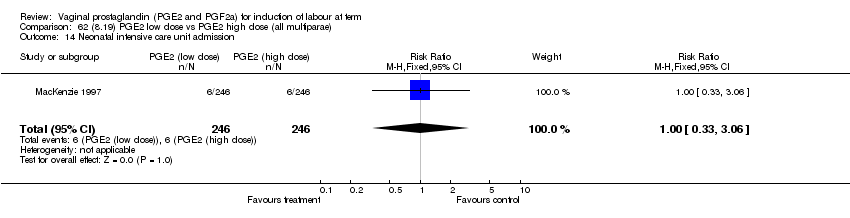
Comparison 62 (8.19) PGE2 low dose vs PGE2 high dose (all multiparae), Outcome 14 Neonatal intensive care unit admission.

Comparison 62 (8.19) PGE2 low dose vs PGE2 high dose (all multiparae), Outcome 16 Perinatal death.
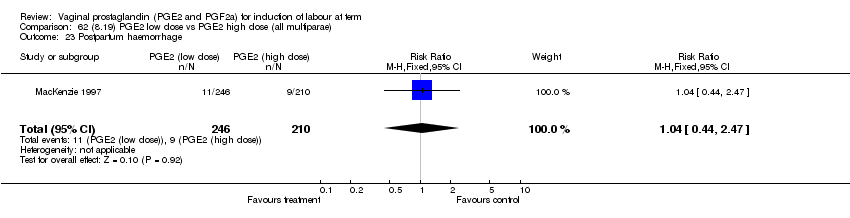
Comparison 62 (8.19) PGE2 low dose vs PGE2 high dose (all multiparae), Outcome 23 Postpartum haemorrhage.
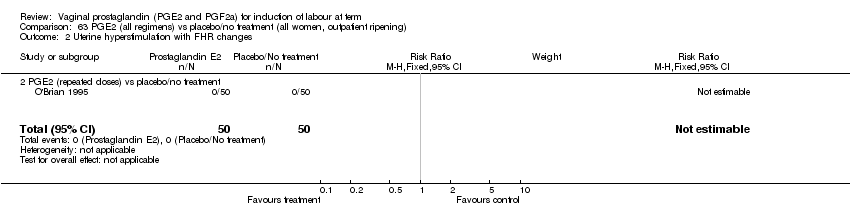
Comparison 63 PGE2 (all regimens) vs placebo/no treatment (all women, outpatient ripening), Outcome 2 Uterine hyperstimulation with FHR changes.

Comparison 63 PGE2 (all regimens) vs placebo/no treatment (all women, outpatient ripening), Outcome 3 Caesarean section.

Comparison 63 PGE2 (all regimens) vs placebo/no treatment (all women, outpatient ripening), Outcome 6 Cervix unfavourable/unchanged after 12 to 24 hours.
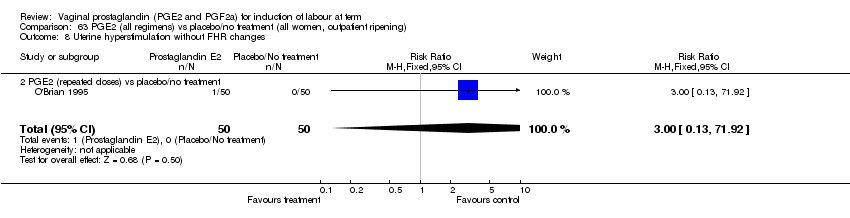
Comparison 63 PGE2 (all regimens) vs placebo/no treatment (all women, outpatient ripening), Outcome 8 Uterine hyperstimulation without FHR changes.
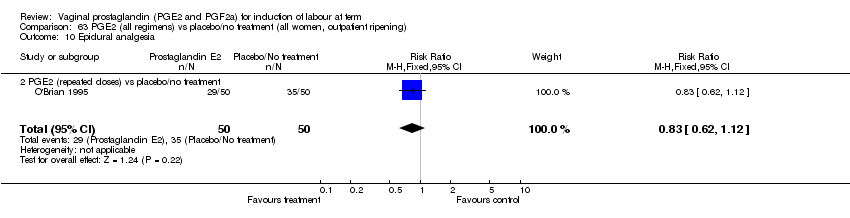
Comparison 63 PGE2 (all regimens) vs placebo/no treatment (all women, outpatient ripening), Outcome 10 Epidural analgesia.
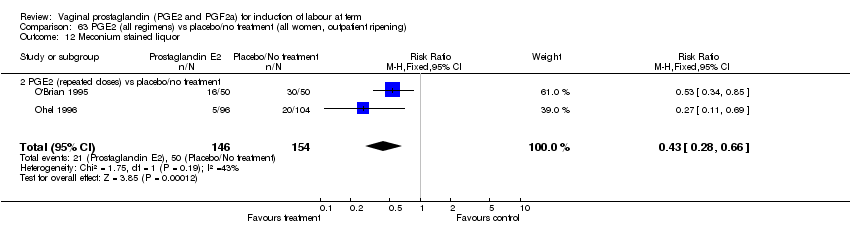
Comparison 63 PGE2 (all regimens) vs placebo/no treatment (all women, outpatient ripening), Outcome 12 Meconium stained liquor.
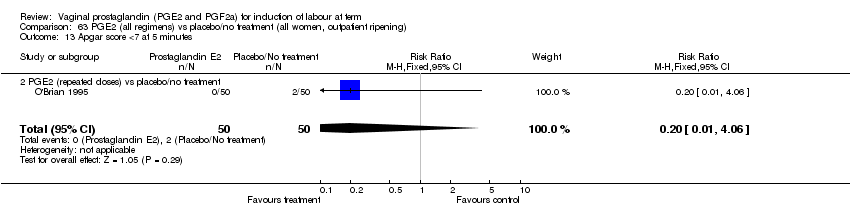
Comparison 63 PGE2 (all regimens) vs placebo/no treatment (all women, outpatient ripening), Outcome 13 Apgar score <7 at 5 minutes.
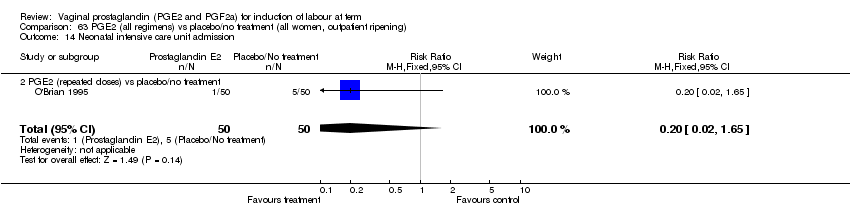
Comparison 63 PGE2 (all regimens) vs placebo/no treatment (all women, outpatient ripening), Outcome 14 Neonatal intensive care unit admission.
| Methodological item | Adequate | Inadequate |
| Generation of random sequence | Computer generated sequence, random number tables, lot drawing, coin tossing, shuffling cards, throwing dice. | Case number, date of birth, date of admission, alternation. |
| Concealment of allocation | Central randomisation, coded drug boxes, sequentially sealed opaque envelopes. | Open allocation sequence, any procedure based on inadequate generation. |
| Outcome or subgroup title | No. of studies | No. of participants | Statistical method | Effect size |
| 1 Vaginal delivery not achieved within 24 hours Show forest plot | 2 | 384 | Risk Ratio (M‐H, Fixed, 95% CI) | 0.19 [0.14, 0.25] |
| 1.1 PGE2 (once only) vs placebo/no treatment | 1 | 39 | Risk Ratio (M‐H, Fixed, 95% CI) | 0.88 [0.67, 1.15] |
| 1.2 PGE2 (repeated doses) vs placebo/no treatment | 1 | 345 | Risk Ratio (M‐H, Fixed, 95% CI) | 0.12 [0.08, 0.18] |
| 2 Uterine hyperstimulation with FHR changes Show forest plot | 13 | 1203 | Risk Ratio (M‐H, Fixed, 95% CI) | 4.14 [1.93, 8.90] |
| 2.1 PGE2 (once only) vs placebo/no treatment | 6 | 459 | Risk Ratio (M‐H, Fixed, 95% CI) | 1.38 [0.46, 4.15] |
| 2.2 PGE2 (repeated doses) vs placebo/no treatment | 3 | 208 | Risk Ratio (M‐H, Fixed, 95% CI) | 5.34 [0.27, 106.70] |
| 2.3 PGE2 (sustained release) vs placebo/no treatment | 4 | 536 | Risk Ratio (M‐H, Fixed, 95% CI) | 10.87 [2.69, 43.92] |
| 3 Caesarean section Show forest plot | 32 | 6243 | Risk Ratio (M‐H, Fixed, 95% CI) | 0.89 [0.79, 1.00] |
| 3.1 PGE2 (once only) vs placebo/no treatment | 15 | 1349 | Risk Ratio (M‐H, Fixed, 95% CI) | 1.01 [0.82, 1.24] |
| 3.2 PGE2 (repeated doses) vs placebo/no treatment | 13 | 4323 | Risk Ratio (M‐H, Fixed, 95% CI) | 0.84 [0.71, 1.00] |
| 3.3 PGE2 (sustained release) vs placebo/no treatment | 4 | 571 | Risk Ratio (M‐H, Fixed, 95% CI) | 0.84 [0.64, 1.10] |
| 4 Serious neonatal morbidity or perinatal death Show forest plot | 7 | 3482 | Risk Ratio (M‐H, Fixed, 95% CI) | 0.46 [0.09, 2.31] |
| 4.1 PGE2 (once only) vs placebo/no treatment | 1 | 29 | Risk Ratio (M‐H, Fixed, 95% CI) | 0.0 [0.0, 0.0] |
| 4.2 PGE2 (repeated doses) vs placebo/no treatment | 4 | 3169 | Risk Ratio (M‐H, Fixed, 95% CI) | 0.46 [0.09, 2.31] |
| 4.3 PGE2 (sustained release) vs placebo/no treatment | 2 | 284 | Risk Ratio (M‐H, Fixed, 95% CI) | 0.0 [0.0, 0.0] |
| 5 Serious maternal morbidity or death Show forest plot | 3 | 530 | Risk Ratio (M‐H, Fixed, 95% CI) | 2.23 [0.34, 14.76] |
| 5.1 PGE2 (once only) vs placebo | 2 | 461 | Risk Ratio (M‐H, Fixed, 95% CI) | 2.23 [0.34, 14.76] |
| 5.3 PGE2 (sustained release) vs placebo/no treatment | 1 | 69 | Risk Ratio (M‐H, Fixed, 95% CI) | 0.0 [0.0, 0.0] |
| 6 Cervix unfavourable/unchanged after 12 to 24 hours Show forest plot | 5 | 467 | Risk Ratio (M‐H, Fixed, 95% CI) | 0.46 [0.35, 0.62] |
| 6.1 PGE2 (once only) vs placebo/no treatment | 3 | 232 | Risk Ratio (M‐H, Fixed, 95% CI) | 0.55 [0.40, 0.75] |
| 6.2 PGE2 (repeated doses) vs placebo/no treatment | 2 | 235 | Risk Ratio (M‐H, Fixed, 95% CI) | 0.34 [0.19, 0.61] |
| 7 Oxytocin augmentation Show forest plot | 11 | 1265 | Risk Ratio (M‐H, Fixed, 95% CI) | 0.80 [0.69, 0.91] |
| 7.1 PGE2 (once only) vs placebo/no treatment | 6 | 489 | Risk Ratio (M‐H, Fixed, 95% CI) | 0.83 [0.67, 1.05] |
| 7.2 PGE2 (repeated doses) vs placebo/no treatment | 4 | 695 | Risk Ratio (M‐H, Fixed, 95% CI) | 0.85 [0.71, 1.02] |
| 7.3 PGE2 (sustained release) vs placebo/no treatment | 1 | 81 | Risk Ratio (M‐H, Fixed, 95% CI) | 0.36 [0.20, 0.64] |
| 8 Uterine hyperstimulation without FHR changes Show forest plot | 12 | 3580 | Risk Ratio (M‐H, Fixed, 95% CI) | 2.48 [1.17, 5.26] |
| 8.1 PGE2 (once only) vs placebo/no treatment | 5 | 387 | Risk Ratio (M‐H, Fixed, 95% CI) | 1.26 [0.33, 4.84] |
| 8.2 PGE2 (repeated doses) vs placebo/no treatment | 5 | 2953 | Risk Ratio (M‐H, Fixed, 95% CI) | 2.34 [0.78, 7.03] |
| 8.3 PGE2 (sustained release) vs placebo/no treatment | 2 | 240 | Risk Ratio (M‐H, Fixed, 95% CI) | 7.85 [1.05, 58.82] |
| 9 Uterine rupture Show forest plot | 2 | 2579 | Risk Ratio (M‐H, Fixed, 95% CI) | 2.90 [0.12, 68.50] |
| 9.1 PGE2 (once only) vs placebo/no treatment | 1 | 59 | Risk Ratio (M‐H, Fixed, 95% CI) | 2.90 [0.12, 68.50] |
| 9.2 PGE2 (repeated doses) vs placebo/no treatment | 1 | 2520 | Risk Ratio (M‐H, Fixed, 95% CI) | 0.0 [0.0, 0.0] |
| 10 Epidural analgesia Show forest plot | 7 | 3555 | Risk Ratio (M‐H, Fixed, 95% CI) | 1.09 [1.01, 1.16] |
| 10.1 PGE2 (once only) vs placebo/no treatment | 2 | 434 | Risk Ratio (M‐H, Fixed, 95% CI) | 0.98 [0.76, 1.25] |
| 10.2 PGE2 (repeated doses) vs placebo/no treatment | 4 | 3040 | Risk Ratio (M‐H, Fixed, 95% CI) | 1.10 [1.02, 1.18] |
| 10.3 PGE2 (sustained release) vs placebo/no treatment | 1 | 81 | Risk Ratio (M‐H, Fixed, 95% CI) | 1.18 [0.83, 1.68] |
| 11 Instrumental vaginal delivery Show forest plot | 13 | 4219 | Risk Ratio (M‐H, Fixed, 95% CI) | 0.95 [0.82, 1.10] |
| 11.1 PGE2 (once only) vs placebo/no treatment | 6 | 721 | Risk Ratio (M‐H, Fixed, 95% CI) | 0.84 [0.55, 1.28] |
| 11.2 PGE2 (repeated doses) vs placebo/no treatment | 5 | 3348 | Risk Ratio (M‐H, Fixed, 95% CI) | 0.97 [0.83, 1.13] |
| 11.3 PGE2 (sustained release) vs placebo/no treatment | 2 | 150 | Risk Ratio (M‐H, Fixed, 95% CI) | 1.01 [0.55, 1.86] |
| 12 Meconium stained liquor Show forest plot | 11 | 4145 | Risk Ratio (M‐H, Fixed, 95% CI) | 0.82 [0.68, 0.98] |
| 12.1 PGE2 (once only) vs placebo/no treatment | 5 | 704 | Risk Ratio (M‐H, Fixed, 95% CI) | 0.95 [0.65, 1.40] |
| 12.2 PGE2 (repeated doses) vs placebo/no treatment | 6 | 3441 | Risk Ratio (M‐H, Fixed, 95% CI) | 0.78 [0.64, 0.97] |
| 13 Apgar score <7 at 5 minutes Show forest plot | 15 | 4381 | Risk Ratio (M‐H, Fixed, 95% CI) | 1.30 [0.86, 1.96] |
| 13.1 PGE2 (once only) vs placebo/no treatment | 9 | 1046 | Risk Ratio (M‐H, Fixed, 95% CI) | 0.56 [0.24, 1.30] |
| 13.2 PGE2 (repeated doses) vs placebo/no treatment | 5 | 3120 | Risk Ratio (M‐H, Fixed, 95% CI) | 1.38 [0.80, 2.37] |
| 13.3 PGE2 (sustained release) vs placebo/no treatment | 1 | 215 | Risk Ratio (M‐H, Fixed, 95% CI) | 6.21 [1.41, 27.34] |
| 14 Neonatal intensive care unit admission Show forest plot | 11 | 3922 | Risk Ratio (M‐H, Fixed, 95% CI) | 0.95 [0.78, 1.15] |
| 14.1 PGE2 (once only) vs placebo/no treatment | 4 | 681 | Risk Ratio (M‐H, Fixed, 95% CI) | 1.23 [0.70, 2.15] |
| 14.2 PGE2 (repeated doses) vs placebo/no treatment | 6 | 3172 | Risk Ratio (M‐H, Fixed, 95% CI) | 0.90 [0.73, 1.11] |
| 14.3 PGE2 (sustained release) vs placebo/no treatment | 1 | 69 | Risk Ratio (M‐H, Fixed, 95% CI) | 3.27 [0.36, 29.93] |
| 16 Perinatal death Show forest plot | 7 | 3648 | Risk Ratio (M‐H, Fixed, 95% CI) | 0.56 [0.14, 2.22] |
| 16.1 PGE2 (once only) vs placebo/no treatment | 2 | 431 | Risk Ratio (M‐H, Fixed, 95% CI) | 1.06 [0.07, 16.85] |
| 16.2 PGE2 (repeated doses) vs placebo/no treatment | 4 | 3148 | Risk Ratio (M‐H, Fixed, 95% CI) | 0.46 [0.09, 2.31] |
| 16.3 PGE2 (sustained release) vs placebo/no treatment | 1 | 69 | Risk Ratio (M‐H, Fixed, 95% CI) | 0.0 [0.0, 0.0] |
| 18 Maternal side‐effects (all) Show forest plot | 12 | 6780 | Risk Ratio (M‐H, Fixed, 95% CI) | 1.15 [0.80, 1.67] |
| 18.1 PGE2 (once only) vs placebo/no treatment | 6 | 577 | Risk Ratio (M‐H, Fixed, 95% CI) | 1.95 [1.02, 3.74] |
| 18.2 PGE2 (repeated doses) vs placebo/no treatment | 5 | 5558 | Risk Ratio (M‐H, Fixed, 95% CI) | 0.84 [0.53, 1.34] |
| 18.3 PGE2 (sustained release) vs placebo/no treatment | 1 | 645 | Risk Ratio (M‐H, Fixed, 95% CI) | 0.0 [0.0, 0.0] |
| 19 Nausea (maternal) Show forest plot | 1 | 84 | Risk Ratio (M‐H, Fixed, 95% CI) | 0.0 [0.0, 0.0] |
| 19.2 PGE2 (repeated doses) vs placebo/no treatment | 1 | 84 | Risk Ratio (M‐H, Fixed, 95% CI) | 0.0 [0.0, 0.0] |
| 20 Vomitting (maternal) Show forest plot | 3 | 2794 | Risk Ratio (M‐H, Fixed, 95% CI) | 1.16 [0.39, 3.39] |
| 20.1 PGE2 (once only) vs placebo/no treatment | 1 | 59 | Risk Ratio (M‐H, Fixed, 95% CI) | 0.97 [0.15, 6.41] |
| 20.2 PGE2 (repeated doses) vs placebo/no treatment | 1 | 2520 | Risk Ratio (M‐H, Fixed, 95% CI) | 1.25 [0.34, 4.65] |
| 20.3 PGE2 (sustained release) vs placebo/no treatment | 1 | 215 | Risk Ratio (M‐H, Fixed, 95% CI) | 0.0 [0.0, 0.0] |
| 21 Diarrhoea (maternal) Show forest plot | 3 | 2819 | Risk Ratio (M‐H, Fixed, 95% CI) | 7.01 [0.36, 135.59] |
| 21.2 PGE2 (repeated doses) vs placebo/no treatment | 2 | 2604 | Risk Ratio (M‐H, Fixed, 95% CI) | 7.01 [0.36, 135.59] |
| 21.3 PGE2 (sustained release) vs placebo/no treatment | 1 | 215 | Risk Ratio (M‐H, Fixed, 95% CI) | 0.0 [0.0, 0.0] |
| 22 Other maternal side effects Show forest plot | 7 | 871 | Risk Ratio (M‐H, Fixed, 95% CI) | 0.97 [0.62, 1.51] |
| 22.1 PGE2 (once only) vs placebo/no treatment | 4 | 356 | Risk Ratio (M‐H, Fixed, 95% CI) | 2.78 [0.97, 8.02] |
| 22.2 PGE2 (repeated doses) vs placebo/no treatment | 2 | 300 | Risk Ratio (M‐H, Fixed, 95% CI) | 0.69 [0.42, 1.15] |
| 22.3 PGE2 (sustained release) vs placebo/no treatment | 1 | 215 | Risk Ratio (M‐H, Fixed, 95% CI) | 0.0 [0.0, 0.0] |
| 23 Postpartum haemorrhage Show forest plot | 8 | 3437 | Risk Ratio (M‐H, Fixed, 95% CI) | 1.44 [1.01, 2.05] |
| 23.1 PGE2 (once only) vs placebo/no treatment | 4 | 282 | Risk Ratio (M‐H, Fixed, 95% CI) | 1.14 [0.33, 3.97] |
| 23.2 PGE2 (repeated doses) vs placebo/no treatment | 3 | 2940 | Risk Ratio (M‐H, Fixed, 95% CI) | 1.42 [0.98, 2.07] |
| 23.3 PGE2 (sustained release) vs placebo/no treatment | 1 | 215 | Risk Ratio (M‐H, Fixed, 95% CI) | 5.64 [0.27, 116.05] |
| 24 Serious maternal complication Show forest plot | 1 | 59 | Risk Ratio (M‐H, Fixed, 95% CI) | 2.90 [0.12, 68.50] |
| 24.1 PGE2 (once only) vs placebo/no treatment | 1 | 59 | Risk Ratio (M‐H, Fixed, 95% CI) | 2.90 [0.12, 68.50] |
| 26 Woman not satisfied Show forest plot | 2 | 2922 | Risk Ratio (M‐H, Fixed, 95% CI) | 0.56 [0.44, 0.71] |
| 26.1 PGE2 (once only) vs placebo/no treatment | 1 | 402 | Risk Ratio (M‐H, Fixed, 95% CI) | 1.40 [0.83, 2.35] |
| 26.2 PGE2 (repeated doses) vs placebo/no treatment | 1 | 2520 | Risk Ratio (M‐H, Fixed, 95% CI) | 0.44 [0.33, 0.58] |
| Outcome or subgroup title | No. of studies | No. of participants | Statistical method | Effect size |
| 1 Vaginal delivery not achieved within 24 hours Show forest plot | 1 | 39 | Risk Ratio (M‐H, Fixed, 95% CI) | 0.88 [0.67, 1.15] |
| 1.1 PGE2 (once only) vs placebo/no treatment | 1 | 39 | Risk Ratio (M‐H, Fixed, 95% CI) | 0.88 [0.67, 1.15] |
| 2 Uterine hyperstimulation with FHR changes Show forest plot | 12 | 1143 | Risk Ratio (M‐H, Fixed, 95% CI) | 4.47 [2.01, 9.93] |
| 2.1 PGE2 (once only) vs placebo/no treatment | 5 | 399 | Risk Ratio (M‐H, Fixed, 95% CI) | 1.44 [0.44, 4.65] |
| 2.2 PGE2 (repeated doses) vs placebo/no treatment | 3 | 208 | Risk Ratio (M‐H, Fixed, 95% CI) | 5.34 [0.27, 106.70] |
| 2.3 PGE2 (sustained release) vs placebo/no treatment | 4 | 536 | Risk Ratio (M‐H, Fixed, 95% CI) | 10.87 [2.69, 43.92] |
| 3 Caesarean section Show forest plot | 22 | 2173 | Risk Ratio (M‐H, Fixed, 95% CI) | 0.87 [0.75, 1.02] |
| 3.1 PGE2 (once only) vs placebo/no treatment | 11 | 828 | Risk Ratio (M‐H, Fixed, 95% CI) | 0.92 [0.73, 1.17] |
| 3.2 PGE2 (repeated doses) vs placebo/no treatment | 7 | 774 | Risk Ratio (M‐H, Fixed, 95% CI) | 0.84 [0.61, 1.15] |
| 3.3 PGE2 (sustained release) vs placebo/no treatment | 4 | 571 | Risk Ratio (M‐H, Fixed, 95% CI) | 0.84 [0.64, 1.10] |
| 4 Serious neonatal morbidity or perinatal death Show forest plot | 4 | 533 | Risk Ratio (M‐H, Fixed, 95% CI) | 0.0 [0.0, 0.0] |
| 4.1 PGE2 (once only) vs placebo/no treatment | 1 | 29 | Risk Ratio (M‐H, Fixed, 95% CI) | 0.0 [0.0, 0.0] |
| 4.2 PGE2 (repeated doses) vs placebo/no treatment | 1 | 220 | Risk Ratio (M‐H, Fixed, 95% CI) | 0.0 [0.0, 0.0] |
| 4.3 PGE2 (sustained release) vs placebo/no treatment | 2 | 284 | Risk Ratio (M‐H, Fixed, 95% CI) | 0.0 [0.0, 0.0] |
| 5 Serious maternal morbidity or death Show forest plot | 2 | 128 | Risk Ratio (M‐H, Fixed, 95% CI) | 4.84 [0.24, 96.66] |
| 5.1 PGE2 (once only) vs placebo | 1 | 59 | Risk Ratio (M‐H, Fixed, 95% CI) | 4.84 [0.24, 96.66] |
| 5.3 PGE2 (sustained release) vs placebo/no treatment | 1 | 69 | Risk Ratio (M‐H, Fixed, 95% CI) | 0.0 [0.0, 0.0] |
| 6 Cervix unfavourable/unchanged after 12 to 24 hours Show forest plot | 2 | 172 | Risk Ratio (M‐H, Fixed, 95% CI) | 0.53 [0.35, 0.79] |
| 6.1 PGE2 (once only) vs placebo/no treatment | 2 | 172 | Risk Ratio (M‐H, Fixed, 95% CI) | 0.53 [0.35, 0.79] |
| 7 Oxytocin augmentation Show forest plot | 8 | 813 | Risk Ratio (M‐H, Fixed, 95% CI) | 0.72 [0.61, 0.85] |
| 7.1 PGE2 (once only) vs placebo/no treatment | 4 | 382 | Risk Ratio (M‐H, Fixed, 95% CI) | 0.87 [0.67, 1.13] |
| 7.2 PGE2 (repeated doses) vs placebo/no treatment | 3 | 350 | Risk Ratio (M‐H, Fixed, 95% CI) | 0.70 [0.55, 0.89] |
| 7.3 PGE2 (sustained release) vs placebo/no treatment | 1 | 81 | Risk Ratio (M‐H, Fixed, 95% CI) | 0.36 [0.20, 0.64] |
| 8 Uterine hyperstimulation without FHR changes Show forest plot | 9 | 777 | Risk Ratio (M‐H, Fixed, 95% CI) | 2.63 [0.99, 7.01] |
| 8.1 PGE2 (once only) vs placebo/no treatment | 5 | 387 | Risk Ratio (M‐H, Fixed, 95% CI) | 1.26 [0.33, 4.84] |
| 8.2 PGE2 (repeated doses) vs placebo/no treatment | 2 | 150 | Risk Ratio (M‐H, Fixed, 95% CI) | 3.0 [0.13, 71.92] |
| 8.3 PGE2 (sustained release) vs placebo/no treatment | 2 | 240 | Risk Ratio (M‐H, Fixed, 95% CI) | 7.85 [1.05, 58.82] |
| 9 Uterine rupture Show forest plot | 1 | 59 | Risk Ratio (M‐H, Fixed, 95% CI) | 2.90 [0.12, 68.50] |
| 9.1 PGE2 (once only) vs placebo/no treatment | 1 | 59 | Risk Ratio (M‐H, Fixed, 95% CI) | 2.90 [0.12, 68.50] |
| 10 Epidural analgesia Show forest plot | 5 | 633 | Risk Ratio (M‐H, Fixed, 95% CI) | 1.46 [1.22, 1.75] |
| 10.1 PGE2 (once only) vs placebo/no treatment | 1 | 32 | Risk Ratio (M‐H, Fixed, 95% CI) | 0.54 [0.29, 0.98] |
| 10.2 PGE2 (repeated doses) vs placebo/no treatment | 3 | 520 | Risk Ratio (M‐H, Fixed, 95% CI) | 1.69 [1.36, 2.10] |
| 10.3 PGE2 (sustained release) vs placebo/no treatment | 1 | 81 | Risk Ratio (M‐H, Fixed, 95% CI) | 1.18 [0.83, 1.68] |
| 11 Instrumental vaginal delivery Show forest plot | 7 | 643 | Risk Ratio (M‐H, Fixed, 95% CI) | 0.88 [0.61, 1.27] |
| 11.1 PGE2 (once only) vs placebo/no treatment | 4 | 293 | Risk Ratio (M‐H, Fixed, 95% CI) | 0.87 [0.45, 1.69] |
| 11.2 PGE2 (repeated doses) vs placebo/no treatment | 1 | 200 | Risk Ratio (M‐H, Fixed, 95% CI) | 0.79 [0.43, 1.46] |
| 11.3 PGE2 (sustained release) vs placebo/no treatment | 2 | 150 | Risk Ratio (M‐H, Fixed, 95% CI) | 1.01 [0.55, 1.86] |
| 12 Meconium stained liquor Show forest plot | 5 | 697 | Risk Ratio (M‐H, Fixed, 95% CI) | 0.65 [0.47, 0.89] |
| 12.1 PGE2 (once only) vs placebo/no treatment | 2 | 177 | Risk Ratio (M‐H, Fixed, 95% CI) | 0.90 [0.51, 1.57] |
| 12.2 PGE2 (repeated doses) vs placebo/no treatment | 3 | 520 | Risk Ratio (M‐H, Fixed, 95% CI) | 0.55 [0.37, 0.81] |
| 13 Apgar score <7 at 5 minutes Show forest plot | 11 | 1194 | Risk Ratio (M‐H, Fixed, 95% CI) | 1.08 [0.59, 1.99] |
| 13.1 PGE2 (once only) vs placebo/no treatment | 7 | 579 | Risk Ratio (M‐H, Fixed, 95% CI) | 0.48 [0.17, 1.36] |
| 13.2 PGE2 (repeated doses) vs placebo/no treatment | 3 | 400 | Risk Ratio (M‐H, Fixed, 95% CI) | 0.55 [0.15, 1.98] |
| 13.3 PGE2 (sustained release) vs placebo/no treatment | 1 | 215 | Risk Ratio (M‐H, Fixed, 95% CI) | 6.21 [1.41, 27.34] |
| 14 Neonatal intensive care unit admission Show forest plot | 7 | 735 | Risk Ratio (M‐H, Fixed, 95% CI) | 0.80 [0.51, 1.27] |
| 14.1 PGE2 (once only) vs placebo/no treatment | 2 | 214 | Risk Ratio (M‐H, Fixed, 95% CI) | 0.96 [0.51, 1.82] |
| 14.2 PGE2 (repeated doses) vs placebo/no treatment | 4 | 452 | Risk Ratio (M‐H, Fixed, 95% CI) | 0.55 [0.27, 1.14] |
| 14.3 PGE2 (sustained release) vs placebo/no treatment | 1 | 69 | Risk Ratio (M‐H, Fixed, 95% CI) | 3.27 [0.36, 29.93] |
| 16 Perinatal death Show forest plot | 3 | 298 | Risk Ratio (M‐H, Fixed, 95% CI) | 0.0 [0.0, 0.0] |
| 16.1 PGE2 (once only) vs placebo/no treatment | 1 | 29 | Risk Ratio (M‐H, Fixed, 95% CI) | 0.0 [0.0, 0.0] |
| 16.2 PGE2 (repeated doses) vs placebo/no treatment | 1 | 200 | Risk Ratio (M‐H, Fixed, 95% CI) | 0.0 [0.0, 0.0] |
| 16.3 PGE2 (sustained release) vs placebo/no treatment | 1 | 69 | Risk Ratio (M‐H, Fixed, 95% CI) | 0.0 [0.0, 0.0] |
| 18 Maternal side‐effects (all) Show forest plot | 10 | 1572 | Risk Ratio (M‐H, Fixed, 95% CI) | 1.08 [0.73, 1.59] |
| 18.1 PGE2 (once only) vs placebo/no treatment | 6 | 577 | Risk Ratio (M‐H, Fixed, 95% CI) | 1.95 [1.02, 3.74] |
| 18.2 PGE2 (repeated doses) vs placebo/no treatment | 3 | 350 | Risk Ratio (M‐H, Fixed, 95% CI) | 0.69 [0.42, 1.15] |
| 18.3 PGE2 (sustained release) vs placebo/no treatment | 1 | 645 | Risk Ratio (M‐H, Fixed, 95% CI) | 0.0 [0.0, 0.0] |
| 19 Nausea (maternal) Show forest plot | 1 | 116 | Risk Ratio (M‐H, Fixed, 95% CI) | 0.0 [0.0, 0.0] |
| 19.2 PGE2 (repeated doses) vs placebo/no treatment | 1 | 116 | Risk Ratio (M‐H, Fixed, 95% CI) | 0.0 [0.0, 0.0] |
| 20 Vomitting (maternal) Show forest plot | 2 | 274 | Risk Ratio (M‐H, Fixed, 95% CI) | 0.97 [0.15, 6.41] |
| 20.1 PGE2 (once only) vs placebo/no treatment | 1 | 59 | Risk Ratio (M‐H, Fixed, 95% CI) | 0.97 [0.15, 6.41] |
| 20.3 PGE2 (sustained release) vs placebo/no treatment | 1 | 215 | Risk Ratio (M‐H, Fixed, 95% CI) | 0.0 [0.0, 0.0] |
| 21 Diarrhoea (maternal) Show forest plot | 2 | 331 | Risk Ratio (M‐H, Fixed, 95% CI) | 0.0 [0.0, 0.0] |
| 21.2 PGE2 (repeated doses) vs placebo/no treatment | 1 | 116 | Risk Ratio (M‐H, Fixed, 95% CI) | 0.0 [0.0, 0.0] |
| 21.3 PGE2 (sustained release) vs placebo/no treatment | 1 | 215 | Risk Ratio (M‐H, Fixed, 95% CI) | 0.0 [0.0, 0.0] |
| 22 Other maternal side effects Show forest plot | 7 | 871 | Risk Ratio (M‐H, Fixed, 95% CI) | 0.97 [0.62, 1.51] |
| 22.1 PGE2 (once only) vs placebo/no treatment | 4 | 356 | Risk Ratio (M‐H, Fixed, 95% CI) | 2.78 [0.97, 8.02] |
| 22.2 PGE2 (repeated doses) vs placebo/no treatment | 2 | 300 | Risk Ratio (M‐H, Fixed, 95% CI) | 0.69 [0.42, 1.15] |
| 22.3 PGE2 (sustained release) vs placebo/no treatment | 1 | 215 | Risk Ratio (M‐H, Fixed, 95% CI) | 0.0 [0.0, 0.0] |
| 23 Postpartum haemorrhage Show forest plot | 7 | 917 | Risk Ratio (M‐H, Fixed, 95% CI) | 0.99 [0.47, 2.05] |
| 23.1 PGE2 (once only) vs placebo/no treatment | 4 | 282 | Risk Ratio (M‐H, Fixed, 95% CI) | 1.14 [0.33, 3.97] |
| 23.2 PGE2 (repeated doses) vs placebo/no treatment | 2 | 420 | Risk Ratio (M‐H, Fixed, 95% CI) | 0.67 [0.24, 1.84] |
| 23.3 PGE2 (sustained release) vs placebo/no treatment | 1 | 215 | Risk Ratio (M‐H, Fixed, 95% CI) | 5.64 [0.27, 116.05] |
| 24 Serious maternal complication Show forest plot | 1 | 59 | Risk Ratio (M‐H, Fixed, 95% CI) | 2.90 [0.12, 68.50] |
| 24.1 PGE2 (once only) vs placebo/no treatment | 1 | 59 | Risk Ratio (M‐H, Fixed, 95% CI) | 2.90 [0.12, 68.50] |
| Outcome or subgroup title | No. of studies | No. of participants | Statistical method | Effect size |
| 1 Vaginal delivery not achieved within 24 hours Show forest plot | 1 | 345 | Risk Ratio (M‐H, Fixed, 95% CI) | 0.12 [0.08, 0.18] |
| 1.2 PGE2 (repeated doses) vs placebo/no treatment | 1 | 345 | Risk Ratio (M‐H, Fixed, 95% CI) | 0.12 [0.08, 0.18] |
| 3 Caesarean section Show forest plot | 1 | 345 | Risk Ratio (M‐H, Fixed, 95% CI) | 0.61 [0.10, 3.61] |
| 3.2 PGE2 (repeated doses) vs placebo/no treatment | 1 | 345 | Risk Ratio (M‐H, Fixed, 95% CI) | 0.61 [0.10, 3.61] |
| 4 Serious neonatal morbidity or perinatal death Show forest plot | 1 | 345 | Risk Ratio (M‐H, Fixed, 95% CI) | 0.31 [0.01, 7.45] |
| 4.2 PGE2 (repeated doses) vs placebo/no treatment | 1 | 345 | Risk Ratio (M‐H, Fixed, 95% CI) | 0.31 [0.01, 7.45] |
| 7 Oxytocin augmentation Show forest plot | 2 | 387 | Risk Ratio (M‐H, Fixed, 95% CI) | 0.97 [0.74, 1.26] |
| 7.1 PGE2 (once only) vs placebo/no treatment | 1 | 42 | Risk Ratio (M‐H, Fixed, 95% CI) | 0.42 [0.18, 0.97] |
| 7.2 PGE2 (repeated doses) vs placebo/no treatment | 1 | 345 | Risk Ratio (M‐H, Fixed, 95% CI) | 1.07 [0.81, 1.42] |
| 11 Instrumental vaginal delivery Show forest plot | 1 | 345 | Risk Ratio (M‐H, Fixed, 95% CI) | 1.22 [0.28, 5.38] |
| 11.2 PGE2 (repeated doses) vs placebo/no treatment | 1 | 345 | Risk Ratio (M‐H, Fixed, 95% CI) | 1.22 [0.28, 5.38] |
| 16 Perinatal death Show forest plot | 1 | 345 | Risk Ratio (M‐H, Fixed, 95% CI) | 0.31 [0.01, 7.45] |
| 16.2 PGE2 (repeated doses) vs placebo/no treatment | 1 | 345 | Risk Ratio (M‐H, Fixed, 95% CI) | 0.31 [0.01, 7.45] |
| Outcome or subgroup title | No. of studies | No. of participants | Statistical method | Effect size |
| 2 Uterine hyperstimulation with FHR changes Show forest plot | 5 | 425 | Risk Ratio (M‐H, Fixed, 95% CI) | 2.16 [0.57, 8.21] |
| 2.1 PGE2 (once only) vs placebo/no treatment | 2 | 135 | Risk Ratio (M‐H, Fixed, 95% CI) | 0.95 [0.14, 6.69] |
| 2.2 PGE2 (repeated doses) vs placebo/no treatment | 1 | 50 | Risk Ratio (M‐H, Fixed, 95% CI) | 0.0 [0.0, 0.0] |
| 2.3 PGE2 (sustained release) vs placebo/no treatment | 2 | 240 | Risk Ratio (M‐H, Fixed, 95% CI) | 4.44 [0.55, 35.61] |
| 3 Caesarean section Show forest plot | 5 | 471 | Risk Ratio (M‐H, Fixed, 95% CI) | 1.17 [0.84, 1.63] |
| 3.1 PGE2 (once only) vs placebo/no treatment | 3 | 215 | Risk Ratio (M‐H, Fixed, 95% CI) | 1.28 [0.77, 2.11] |
| 3.2 PGE2 (repeated doses) vs placebo/no treatment | 1 | 50 | Risk Ratio (M‐H, Fixed, 95% CI) | 1.63 [0.52, 5.07] |
| 3.3 PGE2 (sustained release) vs placebo/no treatment | 1 | 206 | Risk Ratio (M‐H, Fixed, 95% CI) | 1.02 [0.63, 1.65] |
| 6 Cervix unfavourable/unchanged after 12 to 24 hours Show forest plot | 1 | 54 | Risk Ratio (M‐H, Fixed, 95% CI) | 0.40 [0.24, 0.68] |
| 6.1 PGE2 (once only) vs placebo/no treatment | 1 | 54 | Risk Ratio (M‐H, Fixed, 95% CI) | 0.40 [0.24, 0.68] |
| 7 Oxytocin augmentation Show forest plot | 1 | 50 | Risk Ratio (M‐H, Fixed, 95% CI) | 1.01 [0.60, 1.68] |
| 7.2 PGE2 (repeated doses) vs placebo/no treatment | 1 | 50 | Risk Ratio (M‐H, Fixed, 95% CI) | 1.01 [0.60, 1.68] |
| 8 Uterine hyperstimulation without FHR changes Show forest plot | 5 | 424 | Risk Ratio (M‐H, Fixed, 95% CI) | 6.76 [1.32, 34.54] |
| 8.1 PGE2 (once only) vs placebo/no treatment | 2 | 134 | Risk Ratio (M‐H, Fixed, 95% CI) | 5.16 [0.31, 86.59] |
| 8.2 PGE2 (repeated doses) vs placebo/no treatment | 1 | 50 | Risk Ratio (M‐H, Fixed, 95% CI) | 0.0 [0.0, 0.0] |
| 8.3 PGE2 (sustained release) vs placebo/no treatment | 2 | 240 | Risk Ratio (M‐H, Fixed, 95% CI) | 7.85 [1.05, 58.82] |
| 13 Apgar score <7 at 5 minutes Show forest plot | 2 | 161 | Risk Ratio (M‐H, Fixed, 95% CI) | 0.54 [0.14, 2.05] |
| 13.1 PGE2 (once only) vs placebo/no treatment | 2 | 161 | Risk Ratio (M‐H, Fixed, 95% CI) | 0.54 [0.14, 2.05] |
| 14 Neonatal intensive care unit admission Show forest plot | 1 | 50 | Risk Ratio (M‐H, Fixed, 95% CI) | 0.22 [0.01, 4.28] |
| 14.2 PGE2 (repeated doses) vs placebo/no treatment | 1 | 50 | Risk Ratio (M‐H, Fixed, 95% CI) | 0.22 [0.01, 4.28] |
| 18 Maternal side‐effects (all) Show forest plot | 3 | 212 | Risk Ratio (M‐H, Fixed, 95% CI) | 1.68 [0.66, 4.31] |
| 18.1 PGE2 (once only) vs placebo/no treatment | 2 | 162 | Risk Ratio (M‐H, Fixed, 95% CI) | 1.68 [0.66, 4.31] |
| 18.2 PGE2 (repeated doses) vs placebo/no treatment | 1 | 50 | Risk Ratio (M‐H, Fixed, 95% CI) | 0.0 [0.0, 0.0] |
| 23 Postpartum haemorrhage Show forest plot | 1 | 81 | Risk Ratio (M‐H, Fixed, 95% CI) | 0.0 [0.0, 0.0] |
| 23.1 PGE2 (once only) vs placebo/no treatment | 1 | 81 | Risk Ratio (M‐H, Fixed, 95% CI) | 0.0 [0.0, 0.0] |
| Outcome or subgroup title | No. of studies | No. of participants | Statistical method | Effect size |
| 1 Vaginal delivery not achieved within 24 hours Show forest plot | 1 | 345 | Risk Ratio (M‐H, Fixed, 95% CI) | 0.12 [0.08, 0.18] |
| 1.2 PGE2 (repeated doses) vs placebo/no treatment | 1 | 345 | Risk Ratio (M‐H, Fixed, 95% CI) | 0.12 [0.08, 0.18] |
| 3 Caesarean section Show forest plot | 1 | 345 | Risk Ratio (M‐H, Fixed, 95% CI) | 0.61 [0.10, 3.61] |
| 3.2 PGE2 (repeated doses) vs placebo/no treatment | 1 | 345 | Risk Ratio (M‐H, Fixed, 95% CI) | 0.61 [0.10, 3.61] |
| 4 Serious neonatal morbidity or perinatal death Show forest plot | 1 | 345 | Risk Ratio (M‐H, Fixed, 95% CI) | 0.31 [0.01, 7.45] |
| 4.2 PGE2 (repeated doses) vs placebo/no treatment | 1 | 345 | Risk Ratio (M‐H, Fixed, 95% CI) | 0.31 [0.01, 7.45] |
| 7 Oxytocin augmentation Show forest plot | 1 | 345 | Risk Ratio (M‐H, Fixed, 95% CI) | 1.07 [0.81, 1.42] |
| 7.2 PGE2 (repeated doses) vs placebo/no treatment | 1 | 345 | Risk Ratio (M‐H, Fixed, 95% CI) | 1.07 [0.81, 1.42] |
| 11 Instrumental vaginal delivery Show forest plot | 1 | 345 | Risk Ratio (M‐H, Fixed, 95% CI) | 1.22 [0.28, 5.38] |
| 11.2 PGE2 (repeated doses) vs placebo/no treatment | 1 | 345 | Risk Ratio (M‐H, Fixed, 95% CI) | 1.22 [0.28, 5.38] |
| 16 Perinatal death Show forest plot | 1 | 345 | Risk Ratio (M‐H, Fixed, 95% CI) | 0.31 [0.01, 7.45] |
| 16.2 PGE2 (repeated doses) vs placebo/no treatment | 1 | 345 | Risk Ratio (M‐H, Fixed, 95% CI) | 0.31 [0.01, 7.45] |
| Outcome or subgroup title | No. of studies | No. of participants | Statistical method | Effect size |
| 3 Caesarean section Show forest plot | 1 | 2520 | Risk Ratio (M‐H, Fixed, 95% CI) | 0.88 [0.70, 1.11] |
| 3.2 PGE2 (repeated doses) vs placebo/no treatment | 1 | 2520 | Risk Ratio (M‐H, Fixed, 95% CI) | 0.88 [0.70, 1.11] |
| 4 Serious neonatal morbidity or perinatal death Show forest plot | 1 | 2520 | Risk Ratio (M‐H, Fixed, 95% CI) | 0.20 [0.01, 4.17] |
| 4.2 PGE2 (repeated doses) vs placebo/no treatment | 1 | 2520 | Risk Ratio (M‐H, Fixed, 95% CI) | 0.20 [0.01, 4.17] |
| 8 Uterine hyperstimulation without FHR changes Show forest plot | 1 | 2520 | Risk Ratio (M‐H, Fixed, 95% CI) | 2.25 [0.70, 7.30] |
| 8.2 PGE2 (repeated doses) vs placebo/no treatment | 1 | 2520 | Risk Ratio (M‐H, Fixed, 95% CI) | 2.25 [0.70, 7.30] |
| 9 Uterine rupture Show forest plot | 1 | 2520 | Risk Ratio (M‐H, Fixed, 95% CI) | 0.0 [0.0, 0.0] |
| 9.2 PGE2 (repeated doses) vs placebo/no treatment | 1 | 2520 | Risk Ratio (M‐H, Fixed, 95% CI) | 0.0 [0.0, 0.0] |
| 10 Epidural analgesia Show forest plot | 1 | 2520 | Risk Ratio (M‐H, Fixed, 95% CI) | 1.02 [0.94, 1.10] |
| 10.2 PGE2 (repeated doses) vs placebo/no treatment | 1 | 2520 | Risk Ratio (M‐H, Fixed, 95% CI) | 1.02 [0.94, 1.10] |
| 11 Instrumental vaginal delivery Show forest plot | 1 | 2520 | Risk Ratio (M‐H, Fixed, 95% CI) | 0.96 [0.80, 1.14] |
| 11.2 PGE2 (repeated doses) vs placebo/no treatment | 1 | 2520 | Risk Ratio (M‐H, Fixed, 95% CI) | 0.96 [0.80, 1.14] |
| 12 Meconium stained liquor Show forest plot | 1 | 2520 | Risk Ratio (M‐H, Fixed, 95% CI) | 1.04 [0.80, 1.36] |
| 12.2 PGE2 (repeated doses) vs placebo/no treatment | 1 | 2520 | Risk Ratio (M‐H, Fixed, 95% CI) | 1.04 [0.80, 1.36] |
| 13 Apgar score <7 at 5 minutes Show forest plot | 1 | 2519 | Risk Ratio (M‐H, Fixed, 95% CI) | 1.67 [0.89, 3.15] |
| 13.2 PGE2 (repeated doses) vs placebo/no treatment | 1 | 2519 | Risk Ratio (M‐H, Fixed, 95% CI) | 1.67 [0.89, 3.15] |
| 14 Neonatal intensive care unit admission Show forest plot | 1 | 2519 | Risk Ratio (M‐H, Fixed, 95% CI) | 0.91 [0.72, 1.15] |
| 14.2 PGE2 (repeated doses) vs placebo/no treatment | 1 | 2519 | Risk Ratio (M‐H, Fixed, 95% CI) | 0.91 [0.72, 1.15] |
| 16 Perinatal death Show forest plot | 1 | 2519 | Risk Ratio (M‐H, Fixed, 95% CI) | 0.20 [0.01, 4.17] |
| 16.2 PGE2 (repeated doses) vs placebo/no treatment | 1 | 2519 | Risk Ratio (M‐H, Fixed, 95% CI) | 0.20 [0.01, 4.17] |
| 18 Maternal side‐effects (all) Show forest plot | 1 | 5040 | Risk Ratio (M‐H, Fixed, 95% CI) | 2.00 [0.60, 6.64] |
| 18.2 PGE2 (repeated doses) vs placebo/no treatment | 1 | 5040 | Risk Ratio (M‐H, Fixed, 95% CI) | 2.00 [0.60, 6.64] |
| 20 Vomitting (maternal) Show forest plot | 1 | 2520 | Risk Ratio (M‐H, Fixed, 95% CI) | 1.25 [0.34, 4.65] |
| 20.2 PGE2 (repeated doses) vs placebo/no treatment | 1 | 2520 | Risk Ratio (M‐H, Fixed, 95% CI) | 1.25 [0.34, 4.65] |
| 21 Diarrhoea (maternal) Show forest plot | 1 | 2520 | Risk Ratio (M‐H, Fixed, 95% CI) | 7.01 [0.36, 135.59] |
| 21.2 PGE2 (repeated doses) vs placebo/no treatment | 1 | 2520 | Risk Ratio (M‐H, Fixed, 95% CI) | 7.01 [0.36, 135.59] |
| 23 Postpartum haemorrhage Show forest plot | 1 | 2520 | Risk Ratio (M‐H, Fixed, 95% CI) | 1.61 [1.07, 2.43] |
| 23.2 PGE2 (repeated doses) vs placebo/no treatment | 1 | 2520 | Risk Ratio (M‐H, Fixed, 95% CI) | 1.61 [1.07, 2.43] |
| 26 Woman not satisfied Show forest plot | 1 | 2520 | Risk Ratio (M‐H, Fixed, 95% CI) | 0.44 [0.33, 0.58] |
| 26.2 PGE2 (repeated doses) vs placebo/no treatment | 1 | 2520 | Risk Ratio (M‐H, Fixed, 95% CI) | 0.44 [0.33, 0.58] |
| Outcome or subgroup title | No. of studies | No. of participants | Statistical method | Effect size |
| 2 Uterine hyperstimulation with FHR changes Show forest plot | 1 | 155 | Risk Ratio (M‐H, Fixed, 95% CI) | 0.0 [0.0, 0.0] |
| 2.1 PGE2 (once only) vs placebo/no treatment | 1 | 155 | Risk Ratio (M‐H, Fixed, 95% CI) | 0.0 [0.0, 0.0] |
| 3 Caesarean section Show forest plot | 5 | 700 | Risk Ratio (M‐H, Fixed, 95% CI) | 0.96 [0.66, 1.40] |
| 3.1 PGE2 (once only) vs placebo/no treatment | 2 | 214 | Risk Ratio (M‐H, Fixed, 95% CI) | 1.02 [0.57, 1.82] |
| 3.2 PGE2 (repeated doses) vs placebo/no treatment | 3 | 486 | Risk Ratio (M‐H, Fixed, 95% CI) | 0.92 [0.56, 1.51] |
| 4 Serious neonatal morbidity or perinatal death Show forest plot | 1 | 220 | Risk Ratio (M‐H, Fixed, 95% CI) | 0.0 [0.0, 0.0] |
| 4.2 PGE2 (repeated doses) vs placebo/no treatment | 1 | 220 | Risk Ratio (M‐H, Fixed, 95% CI) | 0.0 [0.0, 0.0] |
| 5 Serious maternal morbidity or death Show forest plot | 1 | 59 | Risk Ratio (M‐H, Fixed, 95% CI) | 4.84 [0.24, 96.66] |
| 5.1 PGE2 (once only) vs placebo | 1 | 59 | Risk Ratio (M‐H, Fixed, 95% CI) | 4.84 [0.24, 96.66] |
| 7 Oxytocin augmentation Show forest plot | 2 | 375 | Risk Ratio (M‐H, Fixed, 95% CI) | 0.62 [0.49, 0.79] |
| 7.1 PGE2 (once only) vs placebo/no treatment | 1 | 155 | Risk Ratio (M‐H, Fixed, 95% CI) | 0.63 [0.45, 0.90] |
| 7.2 PGE2 (repeated doses) vs placebo/no treatment | 1 | 220 | Risk Ratio (M‐H, Fixed, 95% CI) | 0.61 [0.43, 0.85] |
| 8 Uterine hyperstimulation without FHR changes Show forest plot | 2 | 214 | Risk Ratio (M‐H, Fixed, 95% CI) | 0.48 [0.05, 5.05] |
| 8.1 PGE2 (once only) vs placebo/no treatment | 2 | 214 | Risk Ratio (M‐H, Fixed, 95% CI) | 0.48 [0.05, 5.05] |
| 9 Uterine rupture Show forest plot | 1 | 59 | Risk Ratio (M‐H, Fixed, 95% CI) | 2.90 [0.12, 68.50] |
| 9.1 PGE2 (once only) vs placebo/no treatment | 1 | 59 | Risk Ratio (M‐H, Fixed, 95% CI) | 2.90 [0.12, 68.50] |
| 10 Epidural analgesia Show forest plot | 2 | 420 | Risk Ratio (M‐H, Fixed, 95% CI) | 2.35 [1.75, 3.16] |
| 10.2 PGE2 (repeated doses) vs placebo/no treatment | 2 | 420 | Risk Ratio (M‐H, Fixed, 95% CI) | 2.35 [1.75, 3.16] |
| 11 Instrumental vaginal delivery Show forest plot | 2 | 259 | Risk Ratio (M‐H, Fixed, 95% CI) | 0.99 [0.57, 1.73] |
| 11.1 PGE2 (once only) vs placebo/no treatment | 1 | 59 | Risk Ratio (M‐H, Fixed, 95% CI) | 2.9 [0.64, 13.22] |
| 11.2 PGE2 (repeated doses) vs placebo/no treatment | 1 | 200 | Risk Ratio (M‐H, Fixed, 95% CI) | 0.79 [0.43, 1.46] |
| 12 Meconium stained liquor Show forest plot | 3 | 479 | Risk Ratio (M‐H, Fixed, 95% CI) | 0.60 [0.32, 1.10] |
| 12.1 PGE2 (once only) vs placebo/no treatment | 1 | 59 | Risk Ratio (M‐H, Fixed, 95% CI) | 0.73 [0.18, 2.96] |
| 12.2 PGE2 (repeated doses) vs placebo/no treatment | 2 | 420 | Risk Ratio (M‐H, Fixed, 95% CI) | 0.57 [0.29, 1.13] |
| 13 Apgar score <7 at 5 minutes Show forest plot | 2 | 375 | Risk Ratio (M‐H, Fixed, 95% CI) | 0.74 [0.17, 3.27] |
| 13.1 PGE2 (once only) vs placebo/no treatment | 1 | 155 | Risk Ratio (M‐H, Fixed, 95% CI) | 0.96 [0.06, 15.11] |
| 13.2 PGE2 (repeated doses) vs placebo/no treatment | 1 | 220 | Risk Ratio (M‐H, Fixed, 95% CI) | 0.67 [0.11, 3.91] |
| 14 Neonatal intensive care unit admission Show forest plot | 3 | 434 | Risk Ratio (M‐H, Fixed, 95% CI) | 0.93 [0.55, 1.59] |
| 14.1 PGE2 (once only) vs placebo/no treatment | 2 | 214 | Risk Ratio (M‐H, Fixed, 95% CI) | 0.96 [0.51, 1.82] |
| 14.2 PGE2 (repeated doses) vs placebo/no treatment | 1 | 220 | Risk Ratio (M‐H, Fixed, 95% CI) | 0.88 [0.33, 2.33] |
| 16 Perinatal death Show forest plot | 1 | 200 | Risk Ratio (M‐H, Fixed, 95% CI) | 0.0 [0.0, 0.0] |
| 16.2 PGE2 (repeated doses) vs placebo/no treatment | 1 | 200 | Risk Ratio (M‐H, Fixed, 95% CI) | 0.0 [0.0, 0.0] |
| 18 Maternal side‐effects (all) Show forest plot | 3 | 493 | Risk Ratio (M‐H, Fixed, 95% CI) | 1.03 [0.63, 1.69] |
| 18.1 PGE2 (once only) vs placebo/no treatment | 2 | 273 | Risk Ratio (M‐H, Fixed, 95% CI) | 1.54 [0.52, 4.57] |
| 18.2 PGE2 (repeated doses) vs placebo/no treatment | 1 | 220 | Risk Ratio (M‐H, Fixed, 95% CI) | 0.90 [0.52, 1.59] |
| 20 Vomitting (maternal) Show forest plot | 1 | 59 | Risk Ratio (M‐H, Fixed, 95% CI) | 0.97 [0.15, 6.41] |
| 20.1 PGE2 (once only) vs placebo/no treatment | 1 | 59 | Risk Ratio (M‐H, Fixed, 95% CI) | 0.97 [0.15, 6.41] |
| 22 Other maternal side effects Show forest plot | 1 | 155 | Risk Ratio (M‐H, Fixed, 95% CI) | 0.48 [0.04, 5.20] |
| 22.1 PGE2 (once only) vs placebo/no treatment | 1 | 155 | Risk Ratio (M‐H, Fixed, 95% CI) | 0.48 [0.04, 5.20] |
| 23 Postpartum haemorrhage Show forest plot | 3 | 479 | Risk Ratio (M‐H, Fixed, 95% CI) | 0.79 [0.31, 2.02] |
| 23.1 PGE2 (once only) vs placebo/no treatment | 1 | 59 | Risk Ratio (M‐H, Fixed, 95% CI) | 2.90 [0.12, 68.50] |
| 23.2 PGE2 (repeated doses) vs placebo/no treatment | 2 | 420 | Risk Ratio (M‐H, Fixed, 95% CI) | 0.67 [0.24, 1.84] |
| 24 Serious maternal complication Show forest plot | 1 | 59 | Risk Ratio (M‐H, Fixed, 95% CI) | 2.90 [0.12, 68.50] |
| 24.1 PGE2 (once only) vs placebo/no treatment | 1 | 59 | Risk Ratio (M‐H, Fixed, 95% CI) | 2.90 [0.12, 68.50] |
| Outcome or subgroup title | No. of studies | No. of participants | Statistical method | Effect size |
| 1 Vaginal delivery not achieved within 24 hours Show forest plot | 2 | 226 | Risk Ratio (M‐H, Fixed, 95% CI) | 0.30 [0.23, 0.40] |
| 1.1 PGE2 (once only) vs placebo/no treatment | 1 | 39 | Risk Ratio (M‐H, Fixed, 95% CI) | 0.88 [0.67, 1.15] |
| 1.2 PGE2 (repeated doses) vs placebo/no treatment | 1 | 187 | Risk Ratio (M‐H, Fixed, 95% CI) | 0.20 [0.13, 0.29] |
| 2 Uterine hyperstimulation with FHR changes Show forest plot | 3 | 217 | Risk Ratio (M‐H, Fixed, 95% CI) | 3.0 [0.13, 68.57] |
| 2.1 PGE2 (once only) vs placebo/no treatment | 2 | 187 | Risk Ratio (M‐H, Fixed, 95% CI) | 3.0 [0.13, 68.57] |
| 2.2 PGE2 (repeated doses) vs placebo/no treatment | 1 | 30 | Risk Ratio (M‐H, Fixed, 95% CI) | 0.0 [0.0, 0.0] |
| 3 Caesarean section Show forest plot | 10 | 2486 | Risk Ratio (M‐H, Fixed, 95% CI) | 0.93 [0.77, 1.12] |
| 3.1 PGE2 (once only) vs placebo/no treatment | 4 | 273 | Risk Ratio (M‐H, Fixed, 95% CI) | 0.98 [0.66, 1.46] |
| 3.2 PGE2 (repeated doses) vs placebo/no treatment | 5 | 2144 | Risk Ratio (M‐H, Fixed, 95% CI) | 0.93 [0.75, 1.16] |
| 3.3 PGE2 (sustained release) vs placebo/no treatment | 1 | 69 | Risk Ratio (M‐H, Fixed, 95% CI) | 0.79 [0.36, 1.73] |
| 4 Serious neonatal morbidity or perinatal death Show forest plot | 3 | 1796 | Risk Ratio (M‐H, Fixed, 95% CI) | 0.34 [0.01, 8.22] |
| 4.2 PGE2 (repeated doses) vs placebo/no treatment | 2 | 1727 | Risk Ratio (M‐H, Fixed, 95% CI) | 0.34 [0.01, 8.22] |
| 4.3 PGE2 (sustained release) vs placebo/no treatment | 1 | 69 | Risk Ratio (M‐H, Fixed, 95% CI) | 0.0 [0.0, 0.0] |
| 5 Serious maternal morbidity or death Show forest plot | 1 | 69 | Risk Ratio (M‐H, Fixed, 95% CI) | 0.0 [0.0, 0.0] |
| 5.3 PGE2 (sustained release) vs placebo/no treatment | 1 | 69 | Risk Ratio (M‐H, Fixed, 95% CI) | 0.0 [0.0, 0.0] |
| 6 Cervix unfavourable/unchanged after 12 to 24 hours Show forest plot | 1 | 36 | Risk Ratio (M‐H, Fixed, 95% CI) | 0.13 [0.03, 0.47] |
| 6.2 PGE2 (repeated doses) vs placebo/no treatment | 1 | 36 | Risk Ratio (M‐H, Fixed, 95% CI) | 0.13 [0.03, 0.47] |
| 7 Oxytocin augmentation Show forest plot | 3 | 407 | Risk Ratio (M‐H, Fixed, 95% CI) | 0.59 [0.47, 0.74] |
| 7.1 PGE2 (once only) vs placebo/no treatment | 2 | 187 | Risk Ratio (M‐H, Fixed, 95% CI) | 0.57 [0.42, 0.77] |
| 7.2 PGE2 (repeated doses) vs placebo/no treatment | 1 | 220 | Risk Ratio (M‐H, Fixed, 95% CI) | 0.61 [0.43, 0.85] |
| 8 Uterine hyperstimulation without FHR changes Show forest plot | 3 | 1701 | Risk Ratio (M‐H, Fixed, 95% CI) | 0.35 [0.02, 8.10] |
| 8.1 PGE2 (once only) vs placebo/no treatment | 2 | 194 | Risk Ratio (M‐H, Fixed, 95% CI) | 0.35 [0.02, 8.10] |
| 8.2 PGE2 (repeated doses) vs placebo/no treatment | 1 | 1507 | Risk Ratio (M‐H, Fixed, 95% CI) | 0.0 [0.0, 0.0] |
| 9 Uterine rupture Show forest plot | 1 | 1507 | Risk Ratio (M‐H, Fixed, 95% CI) | 0.0 [0.0, 0.0] |
| 9.2 PGE2 (repeated doses) vs placebo/no treatment | 1 | 1507 | Risk Ratio (M‐H, Fixed, 95% CI) | 0.0 [0.0, 0.0] |
| 10 Epidural analgesia Show forest plot | 4 | 1959 | Risk Ratio (M‐H, Fixed, 95% CI) | 1.12 [1.03, 1.21] |
| 10.1 PGE2 (once only) vs placebo/no treatment | 1 | 32 | Risk Ratio (M‐H, Fixed, 95% CI) | 0.54 [0.29, 0.98] |
| 10.2 PGE2 (repeated doses) vs placebo/no treatment | 3 | 1927 | Risk Ratio (M‐H, Fixed, 95% CI) | 1.13 [1.05, 1.23] |
| 11 Instrumental vaginal delivery Show forest plot | 4 | 1815 | Risk Ratio (M‐H, Fixed, 95% CI) | 0.97 [0.83, 1.14] |
| 11.1 PGE2 (once only) vs placebo/no treatment | 1 | 39 | Risk Ratio (M‐H, Fixed, 95% CI) | 0.70 [0.23, 2.10] |
| 11.2 PGE2 (repeated doses) vs placebo/no treatment | 2 | 1707 | Risk Ratio (M‐H, Fixed, 95% CI) | 0.96 [0.82, 1.14] |
| 11.3 PGE2 (sustained release) vs placebo/no treatment | 1 | 69 | Risk Ratio (M‐H, Fixed, 95% CI) | 1.56 [0.67, 3.62] |
| 12 Meconium stained liquor Show forest plot | 2 | 420 | Risk Ratio (M‐H, Fixed, 95% CI) | 0.57 [0.29, 1.13] |
| 12.2 PGE2 (repeated doses) vs placebo/no treatment | 2 | 420 | Risk Ratio (M‐H, Fixed, 95% CI) | 0.57 [0.29, 1.13] |
| 13 Apgar score <7 at 5 minutes Show forest plot | 3 | 414 | Risk Ratio (M‐H, Fixed, 95% CI) | 0.74 [0.17, 3.27] |
| 13.1 PGE2 (once only) vs placebo/no treatment | 2 | 194 | Risk Ratio (M‐H, Fixed, 95% CI) | 0.96 [0.06, 15.11] |
| 13.2 PGE2 (repeated doses) vs placebo/no treatment | 1 | 220 | Risk Ratio (M‐H, Fixed, 95% CI) | 0.67 [0.11, 3.91] |
| 14 Neonatal intensive care unit admission Show forest plot | 3 | 444 | Risk Ratio (M‐H, Fixed, 95% CI) | 1.06 [0.54, 2.09] |
| 14.1 PGE2 (once only) vs placebo/no treatment | 1 | 155 | Risk Ratio (M‐H, Fixed, 95% CI) | 0.96 [0.32, 2.85] |
| 14.2 PGE2 (repeated doses) vs placebo/no treatment | 1 | 220 | Risk Ratio (M‐H, Fixed, 95% CI) | 0.88 [0.33, 2.33] |
| 14.3 PGE2 (sustained release) vs placebo/no treatment | 1 | 69 | Risk Ratio (M‐H, Fixed, 95% CI) | 3.27 [0.36, 29.93] |
| 16 Perinatal death Show forest plot | 3 | 1776 | Risk Ratio (M‐H, Fixed, 95% CI) | 0.34 [0.01, 8.22] |
| 16.1 PGE2 (repeated doses) vs placebo/no treatment | 2 | 1707 | Risk Ratio (M‐H, Fixed, 95% CI) | 0.34 [0.01, 8.22] |
| 16.3 PGE2 (sustained release) vs placebo/no treatment | 1 | 69 | Risk Ratio (M‐H, Fixed, 95% CI) | 0.0 [0.0, 0.0] |
| 18 Maternal side‐effects (all) Show forest plot | 3 | 1882 | Risk Ratio (M‐H, Fixed, 95% CI) | 1.04 [0.63, 1.71] |
| 18.1 PGE2 (once only) vs placebo/no treatment | 1 | 155 | Risk Ratio (M‐H, Fixed, 95% CI) | 0.48 [0.04, 5.20] |
| 18.2 PGE2 (repeated doses) vs placebo/no treatment | 2 | 1727 | Risk Ratio (M‐H, Fixed, 95% CI) | 1.08 [0.65, 1.81] |
| 20 Vomitting (maternal) Show forest plot | 1 | 1507 | Risk Ratio (M‐H, Fixed, 95% CI) | 1.68 [0.40, 7.00] |
| 20.2 PGE2 (repeated doses) vs placebo/no treatment | 1 | 1507 | Risk Ratio (M‐H, Fixed, 95% CI) | 1.68 [0.40, 7.00] |
| 21 Diarrhoea (maternal) Show forest plot | 1 | 1507 | Risk Ratio (M‐H, Fixed, 95% CI) | 5.03 [0.24, 104.66] |
| 21.2 PGE2 (repeated doses) vs placebo/no treatment | 1 | 1507 | Risk Ratio (M‐H, Fixed, 95% CI) | 5.03 [0.24, 104.66] |
| 22 Other maternal side effects Show forest plot | 2 | 375 | Risk Ratio (M‐H, Fixed, 95% CI) | 0.87 [0.50, 1.50] |
| 22.1 PGE2 (once only) vs placebo/no treatment | 1 | 155 | Risk Ratio (M‐H, Fixed, 95% CI) | 0.48 [0.04, 5.20] |
| 22.2 PGE2 (repeated doses) vs placebo/no treatment | 1 | 220 | Risk Ratio (M‐H, Fixed, 95% CI) | 0.90 [0.52, 1.59] |
| 23 Postpartum haemorrhage Show forest plot | 3 | 1927 | Risk Ratio (M‐H, Fixed, 95% CI) | 1.51 [0.97, 2.34] |
| 23.2 PGE2 (repeated doses) vs placebo/no treatment | 3 | 1927 | Risk Ratio (M‐H, Fixed, 95% CI) | 1.51 [0.97, 2.34] |
| Outcome or subgroup title | No. of studies | No. of participants | Statistical method | Effect size |
| 1 Vaginal delivery not achieved within 24 hours Show forest plot | 1 | 39 | Risk Ratio (M‐H, Fixed, 95% CI) | 0.88 [0.67, 1.15] |
| 1.1 PGE2 (once only) vs placebo/no treatment | 1 | 39 | Risk Ratio (M‐H, Fixed, 95% CI) | 0.88 [0.67, 1.15] |
| 2 Uterine hyperstimulation with FHR changes Show forest plot | 3 | 217 | Risk Ratio (M‐H, Fixed, 95% CI) | 3.0 [0.13, 68.57] |
| 2.1 PGE2 (once only) vs placebo/no treatment | 2 | 187 | Risk Ratio (M‐H, Fixed, 95% CI) | 3.0 [0.13, 68.57] |
| 2.2 PGE2 (repeated doses) vs placebo/no treatment | 1 | 30 | Risk Ratio (M‐H, Fixed, 95% CI) | 0.0 [0.0, 0.0] |
| 3 Caesarean section Show forest plot | 8 | 792 | Risk Ratio (M‐H, Fixed, 95% CI) | 0.88 [0.66, 1.17] |
| 3.1 PGE2 (once only) vs placebo/no treatment | 4 | 273 | Risk Ratio (M‐H, Fixed, 95% CI) | 0.98 [0.66, 1.46] |
| 3.2 PGE2 (repeated doses) vs placebo/no treatment | 3 | 450 | Risk Ratio (M‐H, Fixed, 95% CI) | 0.81 [0.51, 1.29] |
| 3.3 PGE2 (sustained release) vs placebo/no treatment | 1 | 69 | Risk Ratio (M‐H, Fixed, 95% CI) | 0.79 [0.36, 1.73] |
| 4 Serious neonatal morbidity or perinatal death Show forest plot | 2 | 289 | Risk Ratio (M‐H, Fixed, 95% CI) | 0.0 [0.0, 0.0] |
| 4.2 PGE2 (repeated doses) vs placebo/no treatment | 1 | 220 | Risk Ratio (M‐H, Fixed, 95% CI) | 0.0 [0.0, 0.0] |
| 4.3 PGE2 (sustained release) vs placebo/no treatment | 1 | 69 | Risk Ratio (M‐H, Fixed, 95% CI) | 0.0 [0.0, 0.0] |
| 5 Serious maternal morbidity or death Show forest plot | 1 | 69 | Risk Ratio (M‐H, Fixed, 95% CI) | 0.0 [0.0, 0.0] |
| 5.3 PGE2 (sustained release) vs placebo/no treatment | 1 | 69 | Risk Ratio (M‐H, Fixed, 95% CI) | 0.0 [0.0, 0.0] |
| 7 Oxytocin augmentation Show forest plot | 3 | 407 | Risk Ratio (M‐H, Fixed, 95% CI) | 0.59 [0.47, 0.74] |
| 7.1 PGE2 (once only) vs placebo/no treatment | 2 | 187 | Risk Ratio (M‐H, Fixed, 95% CI) | 0.57 [0.42, 0.77] |
| 7.2 PGE2 (repeated doses) vs placebo/no treatment | 1 | 220 | Risk Ratio (M‐H, Fixed, 95% CI) | 0.61 [0.43, 0.85] |
| 8 Uterine hyperstimulation without FHR changes Show forest plot | 2 | 194 | Risk Ratio (M‐H, Fixed, 95% CI) | 0.35 [0.02, 8.10] |
| 8.1 PGE2 (once only) vs placebo/no treatment | 2 | 194 | Risk Ratio (M‐H, Fixed, 95% CI) | 0.35 [0.02, 8.10] |
| 10 Epidural analgesia Show forest plot | 3 | 452 | Risk Ratio (M‐H, Fixed, 95% CI) | 1.95 [1.50, 2.54] |
| 10.1 PGE2 (once only) vs placebo/no treatment | 1 | 32 | Risk Ratio (M‐H, Fixed, 95% CI) | 0.54 [0.29, 0.98] |
| 10.2 PGE2 (repeated doses) vs placebo/no treatment | 2 | 420 | Risk Ratio (M‐H, Fixed, 95% CI) | 2.35 [1.75, 3.16] |
| 11 Instrumental vaginal delivery Show forest plot | 3 | 308 | Risk Ratio (M‐H, Fixed, 95% CI) | 0.94 [0.60, 1.47] |
| 11.1 PGE2 (once only) vs placebo/no treatment | 1 | 39 | Risk Ratio (M‐H, Fixed, 95% CI) | 0.70 [0.23, 2.10] |
| 11.2 PGE2 (repeated doses) vs placebo/no treatment | 1 | 200 | Risk Ratio (M‐H, Fixed, 95% CI) | 0.79 [0.43, 1.46] |
| 11.3 PGE2 (sustained release) vs placebo/no treatment | 1 | 69 | Risk Ratio (M‐H, Fixed, 95% CI) | 1.56 [0.67, 3.62] |
| 12 Meconium stained liquor Show forest plot | 2 | 420 | Risk Ratio (M‐H, Fixed, 95% CI) | 0.57 [0.29, 1.13] |
| 12.2 PGE2 (repeated doses) vs placebo/no treatment | 2 | 420 | Risk Ratio (M‐H, Fixed, 95% CI) | 0.57 [0.29, 1.13] |
| 13 Apgar score <7 at 5 minutes Show forest plot | 3 | 414 | Risk Ratio (M‐H, Fixed, 95% CI) | 0.74 [0.17, 3.27] |
| 13.1 PGE2 (once only) vs placebo/no treatment | 2 | 194 | Risk Ratio (M‐H, Fixed, 95% CI) | 0.96 [0.06, 15.11] |
| 13.2 PGE2 (repeated doses) vs placebo/no treatment | 1 | 220 | Risk Ratio (M‐H, Fixed, 95% CI) | 0.67 [0.11, 3.91] |
| 14 Neonatal intensive care unit admission Show forest plot | 3 | 444 | Risk Ratio (M‐H, Fixed, 95% CI) | 1.06 [0.54, 2.09] |
| 14.1 PGE2 (once only) vs placebo/no treatment | 1 | 155 | Risk Ratio (M‐H, Fixed, 95% CI) | 0.96 [0.32, 2.85] |
| 14.2 PGE2 (repeated doses) vs placebo/no treatment | 1 | 220 | Risk Ratio (M‐H, Fixed, 95% CI) | 0.88 [0.33, 2.33] |
| 14.3 PGE2 (sustained release) vs placebo/no treatment | 1 | 69 | Risk Ratio (M‐H, Fixed, 95% CI) | 3.27 [0.36, 29.93] |
| 16 Perinatal death Show forest plot | 1 | 200 | Risk Ratio (M‐H, Fixed, 95% CI) | 0.0 [0.0, 0.0] |
| 16.1 PGE2 (repeated doses) vs placebo/no treatment | 1 | 200 | Risk Ratio (M‐H, Fixed, 95% CI) | 0.0 [0.0, 0.0] |
| 18 Maternal side‐effects (all) Show forest plot | 2 | 375 | Risk Ratio (M‐H, Fixed, 95% CI) | 0.87 [0.50, 1.50] |
| 18.1 PGE2 (once only) vs placebo/no treatment | 1 | 155 | Risk Ratio (M‐H, Fixed, 95% CI) | 0.48 [0.04, 5.20] |
| 18.2 PGE2 (repeated doses) vs placebo/no treatment | 1 | 220 | Risk Ratio (M‐H, Fixed, 95% CI) | 0.90 [0.52, 1.59] |
| 22 Other maternal side effects Show forest plot | 2 | 375 | Risk Ratio (M‐H, Fixed, 95% CI) | 0.87 [0.50, 1.50] |
| 22.1 PGE2 (once only) vs placebo/no treatment | 1 | 155 | Risk Ratio (M‐H, Fixed, 95% CI) | 0.48 [0.04, 5.20] |
| 22.2 PGE2 (repeated doses) vs placebo/no treatment | 1 | 220 | Risk Ratio (M‐H, Fixed, 95% CI) | 0.90 [0.52, 1.59] |
| 23 Postpartum haemorrhage Show forest plot | 2 | 420 | Risk Ratio (M‐H, Fixed, 95% CI) | 0.67 [0.24, 1.84] |
| 23.2 PGE2 (repeated doses) vs placebo/no treatment | 2 | 420 | Risk Ratio (M‐H, Fixed, 95% CI) | 0.67 [0.24, 1.84] |
| Outcome or subgroup title | No. of studies | No. of participants | Statistical method | Effect size |
| 1 Vaginal delivery not achieved within 24 hours Show forest plot | 1 | 187 | Risk Ratio (M‐H, Fixed, 95% CI) | 0.20 [0.13, 0.29] |
| 1.2 PGE2 (repeated doses) vs placebo/no treatment | 1 | 187 | Risk Ratio (M‐H, Fixed, 95% CI) | 0.20 [0.13, 0.29] |
| 3 Caesarean section Show forest plot | 1 | 187 | Risk Ratio (M‐H, Fixed, 95% CI) | 0.30 [0.03, 2.80] |
| 3.2 PGE2 (repeated doses) vs placebo/no treatment | 1 | 187 | Risk Ratio (M‐H, Fixed, 95% CI) | 0.30 [0.03, 2.80] |
| Outcome or subgroup title | No. of studies | No. of participants | Statistical method | Effect size |
| 2 Uterine hyperstimulation with FHR changes Show forest plot | 1 | 30 | Risk Ratio (M‐H, Fixed, 95% CI) | 0.0 [0.0, 0.0] |
| 2.2 PGE2 (repeated doses) vs placebo/no treatment | 1 | 30 | Risk Ratio (M‐H, Fixed, 95% CI) | 0.0 [0.0, 0.0] |
| 3 Caesarean section Show forest plot | 2 | 77 | Risk Ratio (M‐H, Fixed, 95% CI) | 0.84 [0.51, 1.38] |
| 3.1 PGE2 (once only) vs placebo/no treatment | 1 | 47 | Risk Ratio (M‐H, Fixed, 95% CI) | 0.95 [0.56, 1.63] |
| 3.2 PGE2 (repeated doses) vs placebo/no treatment | 1 | 30 | Risk Ratio (M‐H, Fixed, 95% CI) | 0.57 [0.17, 1.87] |
| Outcome or subgroup title | No. of studies | No. of participants | Statistical method | Effect size |
| 1 Vaginal delivery not achieved within 24 hours Show forest plot | 1 | 187 | Risk Ratio (M‐H, Fixed, 95% CI) | 0.20 [0.13, 0.29] |
| 1.2 PGE2 (repeated doses) vs placebo/no treatment | 1 | 187 | Risk Ratio (M‐H, Fixed, 95% CI) | 0.20 [0.13, 0.29] |
| 3 Caesarean section Show forest plot | 1 | 187 | Risk Ratio (M‐H, Fixed, 95% CI) | 0.30 [0.03, 2.80] |
| 3.2 PGE2 (repeated doses) vs placebo/no treatment | 1 | 187 | Risk Ratio (M‐H, Fixed, 95% CI) | 0.30 [0.03, 2.80] |
| Outcome or subgroup title | No. of studies | No. of participants | Statistical method | Effect size |
| 3 Caesarean section Show forest plot | 1 | 1507 | Risk Ratio (M‐H, Fixed, 95% CI) | 0.99 [0.77, 1.27] |
| 3.2 PGE2 (repeated doses) vs placebo/no treatment | 1 | 1507 | Risk Ratio (M‐H, Fixed, 95% CI) | 0.99 [0.77, 1.27] |
| 4 Serious neonatal morbidity or perinatal death Show forest plot | 1 | 1507 | Risk Ratio (M‐H, Fixed, 95% CI) | 0.34 [0.01, 8.22] |
| 4.2 PGE2 (repeated doses) vs placebo/no treatment | 1 | 1507 | Risk Ratio (M‐H, Fixed, 95% CI) | 0.34 [0.01, 8.22] |
| 8 Uterine hyperstimulation without FHR changes Show forest plot | 1 | 1507 | Risk Ratio (M‐H, Fixed, 95% CI) | 1.01 [0.25, 4.01] |
| 8.2 PGE2 (repeated doses) vs placebo/no treatment | 1 | 1507 | Risk Ratio (M‐H, Fixed, 95% CI) | 1.01 [0.25, 4.01] |
| 9 Uterine rupture Show forest plot | 1 | 1507 | Risk Ratio (M‐H, Fixed, 95% CI) | 0.0 [0.0, 0.0] |
| 9.2 PGE2 (repeated doses) vs placebo/no treatment | 1 | 1507 | Risk Ratio (M‐H, Fixed, 95% CI) | 0.0 [0.0, 0.0] |
| 10 Epidural analgesia Show forest plot | 1 | 1507 | Risk Ratio (M‐H, Fixed, 95% CI) | 1.01 [0.93, 1.10] |
| 10.2 PGE2 (repeated doses) vs placebo/no treatment | 1 | 1507 | Risk Ratio (M‐H, Fixed, 95% CI) | 1.01 [0.93, 1.10] |
| 11 Instrumental vaginal delivery Show forest plot | 1 | 1507 | Risk Ratio (M‐H, Fixed, 95% CI) | 0.98 [0.83, 1.16] |
| 11.2 PGE2 (repeated doses) vs placebo/no treatment | 1 | 1507 | Risk Ratio (M‐H, Fixed, 95% CI) | 0.98 [0.83, 1.16] |
| 16 Perinatal death Show forest plot | 1 | 1507 | Risk Ratio (M‐H, Fixed, 95% CI) | 0.34 [0.01, 8.22] |
| 16.2 PGE2 (repeated doses) vs placebo/no treatment | 1 | 1507 | Risk Ratio (M‐H, Fixed, 95% CI) | 0.34 [0.01, 8.22] |
| 18 Maternal side‐effects (all) Show forest plot | 1 | 1507 | Risk Ratio (M‐H, Fixed, 95% CI) | 2.35 [0.61, 9.05] |
| 18.2 PGE2 (repeated doses) vs placebo/no treatment | 1 | 1507 | Risk Ratio (M‐H, Fixed, 95% CI) | 2.35 [0.61, 9.05] |
| 20 Vomitting (maternal) Show forest plot | 1 | 1507 | Risk Ratio (M‐H, Fixed, 95% CI) | 1.68 [0.40, 7.00] |
| 20.2 PGE2 (repeated doses) vs placebo/no treatment | 1 | 1507 | Risk Ratio (M‐H, Fixed, 95% CI) | 1.68 [0.40, 7.00] |
| 21 Diarrhoea (maternal) Show forest plot | 1 | 1507 | Risk Ratio (M‐H, Fixed, 95% CI) | 5.03 [0.24, 104.66] |
| 21.2 PGE2 (repeated doses) vs placebo/no treatment | 1 | 1507 | Risk Ratio (M‐H, Fixed, 95% CI) | 5.03 [0.24, 104.66] |
| 23 Postpartum haemorrhage Show forest plot | 1 | 1507 | Risk Ratio (M‐H, Fixed, 95% CI) | 1.84 [1.12, 3.03] |
| 23.2 PGE2 (repeated doses) vs placebo/no treatment | 1 | 1507 | Risk Ratio (M‐H, Fixed, 95% CI) | 1.84 [1.12, 3.03] |
| Outcome or subgroup title | No. of studies | No. of participants | Statistical method | Effect size |
| 2 Uterine hyperstimulation with FHR changes Show forest plot | 1 | 155 | Risk Ratio (M‐H, Fixed, 95% CI) | 0.0 [0.0, 0.0] |
| 2.1 PGE2 (once only) vs placebo/no treatment | 1 | 155 | Risk Ratio (M‐H, Fixed, 95% CI) | 0.0 [0.0, 0.0] |
| 3 Caesarean section Show forest plot | 3 | 575 | Risk Ratio (M‐H, Fixed, 95% CI) | 0.91 [0.60, 1.39] |
| 3.1 PGE2 (once only) vs placebo/no treatment | 1 | 155 | Risk Ratio (M‐H, Fixed, 95% CI) | 1.05 [0.49, 2.23] |
| 3.2 PGE2 (repeated doses) vs placebo/no treatment | 2 | 420 | Risk Ratio (M‐H, Fixed, 95% CI) | 0.86 [0.51, 1.43] |
| 4 Serious neonatal morbidity or perinatal death Show forest plot | 1 | 220 | Risk Ratio (M‐H, Fixed, 95% CI) | 0.0 [0.0, 0.0] |
| 4.2 PGE2 (repeated doses) vs placebo/no treatment | 1 | 220 | Risk Ratio (M‐H, Fixed, 95% CI) | 0.0 [0.0, 0.0] |
| 7 Oxytocin augmentation Show forest plot | 2 | 375 | Risk Ratio (M‐H, Fixed, 95% CI) | 0.62 [0.49, 0.79] |
| 7.1 PGE2 (once only) vs placebo/no treatment | 1 | 155 | Risk Ratio (M‐H, Fixed, 95% CI) | 0.63 [0.45, 0.90] |
| 7.2 PGE2 (repeated doses) vs placebo/no treatment | 1 | 220 | Risk Ratio (M‐H, Fixed, 95% CI) | 0.61 [0.43, 0.85] |
| 8 Uterine hyperstimulation without FHR changes Show forest plot | 1 | 155 | Risk Ratio (M‐H, Fixed, 95% CI) | 0.0 [0.0, 0.0] |
| 8.1 PGE2 (once only) vs placebo/no treatment | 1 | 155 | Risk Ratio (M‐H, Fixed, 95% CI) | 0.0 [0.0, 0.0] |
| 10 Epidural analgesia Show forest plot | 2 | 420 | Risk Ratio (M‐H, Fixed, 95% CI) | 2.35 [1.75, 3.16] |
| 10.2 PGE2 (repeated doses) vs placebo/no treatment | 2 | 420 | Risk Ratio (M‐H, Fixed, 95% CI) | 2.35 [1.75, 3.16] |
| 11 Instrumental vaginal delivery Show forest plot | 1 | 200 | Risk Ratio (M‐H, Fixed, 95% CI) | 0.79 [0.43, 1.46] |
| 11.2 PGE2 (repeated doses) vs placebo/no treatment | 1 | 200 | Risk Ratio (M‐H, Fixed, 95% CI) | 0.79 [0.43, 1.46] |
| 12 Meconium stained liquor Show forest plot | 2 | 420 | Risk Ratio (M‐H, Fixed, 95% CI) | 0.57 [0.29, 1.13] |
| 12.2 PGE2 (repeated doses) vs placebo/no treatment | 2 | 420 | Risk Ratio (M‐H, Fixed, 95% CI) | 0.57 [0.29, 1.13] |
| 13 Apgar score <7 at 5 minutes Show forest plot | 2 | 375 | Risk Ratio (M‐H, Fixed, 95% CI) | 0.74 [0.17, 3.27] |
| 13.1 PGE2 (once only) vs placebo/no treatment | 1 | 155 | Risk Ratio (M‐H, Fixed, 95% CI) | 0.96 [0.06, 15.11] |
| 13.2 PGE2 (repeated doses) vs placebo/no treatment | 1 | 220 | Risk Ratio (M‐H, Fixed, 95% CI) | 0.67 [0.11, 3.91] |
| 14 Neonatal intensive care unit admission Show forest plot | 2 | 375 | Risk Ratio (M‐H, Fixed, 95% CI) | 0.91 [0.44, 1.89] |
| 14.1 PGE2 (once only) vs placebo/no treatment | 1 | 155 | Risk Ratio (M‐H, Fixed, 95% CI) | 0.96 [0.32, 2.85] |
| 14.2 PGE2 (repeated doses) vs placebo/no treatment | 1 | 220 | Risk Ratio (M‐H, Fixed, 95% CI) | 0.88 [0.33, 2.33] |
| 16 Perinatal death Show forest plot | 1 | 200 | Risk Ratio (M‐H, Fixed, 95% CI) | 0.0 [0.0, 0.0] |
| 16.1 PGE2 (repeated doses) vs placebo/no treatment | 1 | 200 | Risk Ratio (M‐H, Fixed, 95% CI) | 0.0 [0.0, 0.0] |
| 18 Maternal side‐effects (all) Show forest plot | 2 | 375 | Risk Ratio (M‐H, Fixed, 95% CI) | 0.87 [0.50, 1.50] |
| 18.1 PGE2 (once only) vs placebo/no treatment | 1 | 155 | Risk Ratio (M‐H, Fixed, 95% CI) | 0.48 [0.04, 5.20] |
| 18.2 PGE2 (repeated doses) vs placebo/no treatment | 1 | 220 | Risk Ratio (M‐H, Fixed, 95% CI) | 0.90 [0.52, 1.59] |
| 22 Other maternal side effects Show forest plot | 2 | 375 | Risk Ratio (M‐H, Fixed, 95% CI) | 0.87 [0.50, 1.50] |
| 22.1 PGE2 (once only) vs placebo/no treatment | 1 | 155 | Risk Ratio (M‐H, Fixed, 95% CI) | 0.48 [0.04, 5.20] |
| 22.2 PGE2 (repeated doses) vs placebo/no treatment | 1 | 220 | Risk Ratio (M‐H, Fixed, 95% CI) | 0.90 [0.52, 1.59] |
| 23 Postpartum haemorrhage Show forest plot | 2 | 420 | Risk Ratio (M‐H, Fixed, 95% CI) | 0.67 [0.24, 1.84] |
| 23.2 PGE2 (repeated doses) vs placebo/no treatment | 2 | 420 | Risk Ratio (M‐H, Fixed, 95% CI) | 0.67 [0.24, 1.84] |
| Outcome or subgroup title | No. of studies | No. of participants | Statistical method | Effect size |
| 1 Vaginal delivery not achieved within 24 hours Show forest plot | 1 | 158 | Risk Ratio (M‐H, Fixed, 95% CI) | 0.04 [0.02, 0.12] |
| 1.2 PGE2 (repeated doses) vs placebo/no treatment | 1 | 158 | Risk Ratio (M‐H, Fixed, 95% CI) | 0.04 [0.02, 0.12] |
| 2 Uterine hyperstimulation with FHR changes Show forest plot | 1 | 20 | Risk Ratio (M‐H, Fixed, 95% CI) | 0.0 [0.0, 0.0] |
| 2.2 PGE2 (repeated doses) vs placebo/no treatment | 1 | 20 | Risk Ratio (M‐H, Fixed, 95% CI) | 0.0 [0.0, 0.0] |
| 3 Caesarean section Show forest plot | 4 | 1198 | Risk Ratio (M‐H, Fixed, 95% CI) | 0.88 [0.51, 1.55] |
| 3.1 PGE2 (once only) vs placebo/no treatment | 1 | 7 | Risk Ratio (M‐H, Fixed, 95% CI) | 1.33 [0.13, 13.74] |
| 3.2 PGE2 (repeated doses) vs placebo/no treatment | 3 | 1191 | Risk Ratio (M‐H, Fixed, 95% CI) | 0.87 [0.49, 1.54] |
| 4 Serious neonatal morbidity or perinatal death Show forest plot | 1 | 1013 | Risk Ratio (M‐H, Fixed, 95% CI) | 0.33 [0.01, 8.12] |
| 4.2 PGE2 (repeated doses) vs placebo/no treatment | 1 | 1013 | Risk Ratio (M‐H, Fixed, 95% CI) | 0.33 [0.01, 8.12] |
| 5 Uterine rupture Show forest plot | 1 | 1013 | Risk Ratio (M‐H, Fixed, 95% CI) | 0.0 [0.0, 0.0] |
| 5.2 PGE2 (repeated doses) vs placebo/no treatment | 1 | 1013 | Risk Ratio (M‐H, Fixed, 95% CI) | 0.0 [0.0, 0.0] |
| 6 Epidural analgesia Show forest plot | 1 | 1013 | Risk Ratio (M‐H, Fixed, 95% CI) | 1.05 [0.88, 1.24] |
| 6.2 PGE2 (repeated doses) vs placebo/no treatment | 1 | 1013 | Risk Ratio (M‐H, Fixed, 95% CI) | 1.05 [0.88, 1.24] |
| 7 Oxytocin augmentation Show forest plot | 1 | 42 | Risk Ratio (M‐H, Fixed, 95% CI) | 0.42 [0.18, 0.97] |
| 7.1 PGE2 (once only) vs placebo/no treatment | 1 | 42 | Risk Ratio (M‐H, Fixed, 95% CI) | 0.42 [0.18, 0.97] |
| 8 Uterine hyperstimulation without FHR changes Show forest plot | 1 | 1013 | Risk Ratio (M‐H, Fixed, 95% CI) | 10.94 [0.61, 197.24] |
| 8.2 PGE2 (repeated doses) vs placebo/no treatment | 1 | 1013 | Risk Ratio (M‐H, Fixed, 95% CI) | 10.94 [0.61, 197.24] |
| 11 Instrumental vaginal delivery Show forest plot | 1 | 1013 | Risk Ratio (M‐H, Fixed, 95% CI) | 1.23 [0.77, 1.95] |
| 11.2 PGE2 (repeated doses) vs placebo/no treatment | 1 | 1013 | Risk Ratio (M‐H, Fixed, 95% CI) | 1.23 [0.77, 1.95] |
| 16 Perinatal death Show forest plot | 1 | 1013 | Risk Ratio (M‐H, Fixed, 95% CI) | 0.33 [0.01, 8.12] |
| 16.2 PGE2 (repeated doses) vs placebo/no treatment | 1 | 1013 | Risk Ratio (M‐H, Fixed, 95% CI) | 0.33 [0.01, 8.12] |
| 18 Maternal side‐effects (all) Show forest plot | 1 | 2026 | Risk Ratio (M‐H, Fixed, 95% CI) | 0.99 [0.06, 15.87] |
| 18.2 PGE2 (repeated doses) vs placebo/no treatment | 1 | 2026 | Risk Ratio (M‐H, Fixed, 95% CI) | 0.99 [0.06, 15.87] |
| 20 Vomitting (maternal) Show forest plot | 1 | 1013 | Risk Ratio (M‐H, Fixed, 95% CI) | 0.33 [0.01, 8.12] |
| 20.2 PGE2 (repeated doses) vs placebo/no treatment | 1 | 1013 | Risk Ratio (M‐H, Fixed, 95% CI) | 0.33 [0.01, 8.12] |
| 21 Diarrhoea (maternal) Show forest plot | 1 | 1013 | Risk Ratio (M‐H, Fixed, 95% CI) | 2.98 [0.12, 73.04] |
| 21.2 PGE2 (repeated doses) vs placebo/no treatment | 1 | 1013 | Risk Ratio (M‐H, Fixed, 95% CI) | 2.98 [0.12, 73.04] |
| 23 Postpartum haemorrhage Show forest plot | 1 | 1013 | Risk Ratio (M‐H, Fixed, 95% CI) | 1.22 [0.59, 2.52] |
| 23.2 PGE2 (repeated doses) vs placebo/no treatment | 1 | 1013 | Risk Ratio (M‐H, Fixed, 95% CI) | 1.22 [0.59, 2.52] |
| Outcome or subgroup title | No. of studies | No. of participants | Statistical method | Effect size |
| 2 Uterine hyperstimulation with FHR changes Show forest plot | 1 | 20 | Risk Ratio (M‐H, Fixed, 95% CI) | 0.0 [0.0, 0.0] |
| 2.2 PGE2 (repeated doses) vs placebo/no treatment | 1 | 20 | Risk Ratio (M‐H, Fixed, 95% CI) | 0.0 [0.0, 0.0] |
| 3 Caesarean section Show forest plot | 2 | 27 | Risk Ratio (M‐H, Fixed, 95% CI) | 1.95 [0.30, 12.59] |
| 3.1 PGE2 (once only) vs placebo/no treatment | 1 | 7 | Risk Ratio (M‐H, Fixed, 95% CI) | 1.33 [0.13, 13.74] |
| 3.2 PGE2 (repeated doses) vs placebo/no treatment | 1 | 20 | Risk Ratio (M‐H, Fixed, 95% CI) | 3.0 [0.14, 65.90] |
| Outcome or subgroup title | No. of studies | No. of participants | Statistical method | Effect size |
| 1 Vaginal delivery not achieved within 24 hours Show forest plot | 1 | 158 | Risk Ratio (M‐H, Fixed, 95% CI) | 0.04 [0.02, 0.12] |
| 1.2 PGE2 (repeated doses) vs placebo/no treatment | 1 | 158 | Risk Ratio (M‐H, Fixed, 95% CI) | 0.04 [0.02, 0.12] |
| 3 Caesarean section Show forest plot | 1 | 158 | Risk Ratio (M‐H, Fixed, 95% CI) | 2.85 [0.12, 69.00] |
| 3.2 PGE2 (repeated doses) vs placebo/no treatment | 1 | 158 | Risk Ratio (M‐H, Fixed, 95% CI) | 2.85 [0.12, 69.00] |
| 7 Oxytocin augmentation Show forest plot | 1 | 42 | Risk Ratio (M‐H, Fixed, 95% CI) | 0.42 [0.18, 0.97] |
| 7.1 PGE2 (once only) vs placebo/no treatment | 1 | 42 | Risk Ratio (M‐H, Fixed, 95% CI) | 0.42 [0.18, 0.97] |
| Outcome or subgroup title | No. of studies | No. of participants | Statistical method | Effect size |
| 2 Uterine hyperstimulation with FHR changes Show forest plot | 1 | 20 | Risk Ratio (M‐H, Fixed, 95% CI) | 0.0 [0.0, 0.0] |
| 2.2 PGE2 (repeated doses) vs placebo/no treatment | 1 | 20 | Risk Ratio (M‐H, Fixed, 95% CI) | 0.0 [0.0, 0.0] |
| 3 Caesarean section Show forest plot | 2 | 27 | Risk Ratio (M‐H, Fixed, 95% CI) | 1.95 [0.30, 12.59] |
| 3.1 PGE2 (once only) vs placebo/no treatment | 1 | 7 | Risk Ratio (M‐H, Fixed, 95% CI) | 1.33 [0.13, 13.74] |
| 3.2 PGE2 (repeated doses) vs placebo/no treatment | 1 | 20 | Risk Ratio (M‐H, Fixed, 95% CI) | 3.0 [0.14, 65.90] |
| Outcome or subgroup title | No. of studies | No. of participants | Statistical method | Effect size |
| 1 Vaginal delivery not achieved within 24 hours Show forest plot | 1 | 158 | Risk Ratio (M‐H, Fixed, 95% CI) | 0.04 [0.02, 0.12] |
| 1.2 PGE2 (repeated doses) vs placebo/no treatment | 1 | 158 | Risk Ratio (M‐H, Fixed, 95% CI) | 0.04 [0.02, 0.12] |
| 3 Caesarean section Show forest plot | 1 | 158 | Risk Ratio (M‐H, Fixed, 95% CI) | 2.85 [0.12, 69.00] |
| 3.2 PGE2 (repeated doses) vs placebo/no treatment | 1 | 158 | Risk Ratio (M‐H, Fixed, 95% CI) | 2.85 [0.12, 69.00] |
| Outcome or subgroup title | No. of studies | No. of participants | Statistical method | Effect size |
| 3 Caesarean section Show forest plot | 1 | 1013 | Risk Ratio (M‐H, Fixed, 95% CI) | 0.78 [0.43, 1.42] |
| 3.2 PGE2 (repeated doses) vs placebo/no treatment | 1 | 1013 | Risk Ratio (M‐H, Fixed, 95% CI) | 0.78 [0.43, 1.42] |
| 4 Serious neonatal morbidity or perinatal death Show forest plot | 1 | 1013 | Risk Ratio (M‐H, Fixed, 95% CI) | 0.33 [0.01, 8.12] |
| 4.2 PGE2 (repeated doses) vs placebo/no treatment | 1 | 1013 | Risk Ratio (M‐H, Fixed, 95% CI) | 0.33 [0.01, 8.12] |
| 8 Uterine hyperstimulation without FHR changes Show forest plot | 1 | 1013 | Risk Ratio (M‐H, Fixed, 95% CI) | 10.94 [0.61, 197.24] |
| 8.2 PGE2 (repeated doses) vs placebo/no treatment | 1 | 1013 | Risk Ratio (M‐H, Fixed, 95% CI) | 10.94 [0.61, 197.24] |
| 9 Uterine rupture Show forest plot | 1 | 1013 | Risk Ratio (M‐H, Fixed, 95% CI) | 0.0 [0.0, 0.0] |
| 9.2 PGE2 (repeated doses) vs placebo/no treatment | 1 | 1013 | Risk Ratio (M‐H, Fixed, 95% CI) | 0.0 [0.0, 0.0] |
| 10 Epidural analgesia Show forest plot | 1 | 1013 | Risk Ratio (M‐H, Fixed, 95% CI) | 1.05 [0.88, 1.24] |
| 10.2 PGE2 (repeated doses) vs placebo/no treatment | 1 | 1013 | Risk Ratio (M‐H, Fixed, 95% CI) | 1.05 [0.88, 1.24] |
| 11 Instrumental vaginal delivery Show forest plot | 1 | 1013 | Risk Ratio (M‐H, Fixed, 95% CI) | 1.23 [0.77, 1.95] |
| 11.2 PGE2 (repeated doses) vs placebo/no treatment | 1 | 1013 | Risk Ratio (M‐H, Fixed, 95% CI) | 1.23 [0.77, 1.95] |
| 16 Perinatal death Show forest plot | 1 | 1013 | Risk Ratio (M‐H, Fixed, 95% CI) | 0.33 [0.01, 8.12] |
| 16.2 PGE2 (repeated doses) vs placebo/no treatment | 1 | 1013 | Risk Ratio (M‐H, Fixed, 95% CI) | 0.33 [0.01, 8.12] |
| 18 Maternal side‐effects (all) Show forest plot | 1 | 2026 | Risk Ratio (M‐H, Fixed, 95% CI) | 0.99 [0.06, 15.87] |
| 18.2 PGE2 (repeated doses) vs placebo/no treatment | 1 | 2026 | Risk Ratio (M‐H, Fixed, 95% CI) | 0.99 [0.06, 15.87] |
| 20 Vomitting (maternal) Show forest plot | 1 | 1013 | Risk Ratio (M‐H, Fixed, 95% CI) | 0.33 [0.01, 8.12] |
| 20.2 PGE2 (repeated doses) vs placebo/no treatment | 1 | 1013 | Risk Ratio (M‐H, Fixed, 95% CI) | 0.33 [0.01, 8.12] |
| 21 Diarrhoea (maternal) Show forest plot | 1 | 1013 | Risk Ratio (M‐H, Fixed, 95% CI) | 2.98 [0.12, 73.04] |
| 21.2 PGE2 (repeated doses) vs placebo/no treatment | 1 | 1013 | Risk Ratio (M‐H, Fixed, 95% CI) | 2.98 [0.12, 73.04] |
| 23 Postpartum haemorrhage Show forest plot | 1 | 1013 | Risk Ratio (M‐H, Fixed, 95% CI) | 1.22 [0.59, 2.52] |
| 23.2 PGE2 (repeated doses) vs placebo/no treatment | 1 | 1013 | Risk Ratio (M‐H, Fixed, 95% CI) | 1.22 [0.59, 2.52] |
| Outcome or subgroup title | No. of studies | No. of participants | Statistical method | Effect size |
| 2 Uterine hyperstimulation with FHR changes Show forest plot | 1 | 32 | Risk Ratio (M‐H, Fixed, 95% CI) | 3.0 [0.13, 68.57] |
| 3 Caesarean section Show forest plot | 3 | 387 | Risk Ratio (M‐H, Fixed, 95% CI) | 0.58 [0.29, 1.18] |
| 6 Cervix unfavourable/unchanged after 12 to 24 hours Show forest plot | 1 | 90 | Risk Ratio (M‐H, Fixed, 95% CI) | 0.25 [0.13, 0.49] |
| 7 Oxytocin augmentation Show forest plot | 2 | 122 | Risk Ratio (M‐H, Fixed, 95% CI) | 0.65 [0.53, 0.81] |
| 10 Epidural analgesia Show forest plot | 3 | 387 | Risk Ratio (M‐H, Fixed, 95% CI) | 0.72 [0.53, 0.98] |
| 11 Instrumental vaginal delivery Show forest plot | 2 | 355 | Risk Ratio (M‐H, Fixed, 95% CI) | 0.60 [0.43, 0.84] |
| Outcome or subgroup title | No. of studies | No. of participants | Statistical method | Effect size |
| 2 Uterine hyperstimulation with FHR changes Show forest plot | 1 | 32 | Risk Ratio (M‐H, Fixed, 95% CI) | 3.0 [0.13, 68.57] |
| 3 Caesarean section Show forest plot | 1 | 32 | Risk Ratio (M‐H, Fixed, 95% CI) | 0.33 [0.04, 2.87] |
| 7 Oxytocin augmentation Show forest plot | 1 | 32 | Risk Ratio (M‐H, Fixed, 95% CI) | 0.88 [0.71, 1.09] |
| 10 Epidural analgesia Show forest plot | 1 | 32 | Risk Ratio (M‐H, Fixed, 95% CI) | 0.85 [0.56, 1.27] |
| Outcome or subgroup title | No. of studies | No. of participants | Statistical method | Effect size |
| 1 Vaginal delivery not achieved within 24 hours Show forest plot | 1 | 75 | Risk Ratio (M‐H, Fixed, 95% CI) | 0.51 [0.05, 5.42] |
| 2 Uterine hyperstimulation with FHR changes Show forest plot | 2 | 106 | Risk Ratio (M‐H, Fixed, 95% CI) | 1.0 [0.07, 14.64] |
| 3 Caesarean section Show forest plot | 2 | 107 | Risk Ratio (M‐H, Fixed, 95% CI) | 1.02 [0.47, 2.22] |
| 7 Oxytocin augmentation Show forest plot | 1 | 32 | Risk Ratio (M‐H, Fixed, 95% CI) | 2.33 [1.21, 4.51] |
| 10 Epidural analgesia Show forest plot | 1 | 32 | Risk Ratio (M‐H, Fixed, 95% CI) | 1.57 [0.82, 3.00] |
| 13 Apgar score <7 at 5 minutes Show forest plot | 1 | 75 | Risk Ratio (M‐H, Fixed, 95% CI) | 0.21 [0.01, 4.14] |
| Outcome or subgroup title | No. of studies | No. of participants | Statistical method | Effect size |
| 2 Uterine hyperstimulation with FHR changes Show forest plot | 1 | 32 | Risk Ratio (M‐H, Fixed, 95% CI) | 1.0 [0.07, 14.64] |
| 3 Caesarean section Show forest plot | 1 | 32 | Risk Ratio (M‐H, Fixed, 95% CI) | 1.0 [0.07, 14.64] |
| 7 Oxytocin augmentation Show forest plot | 1 | 32 | Risk Ratio (M‐H, Fixed, 95% CI) | 2.33 [1.21, 4.51] |
| 10 Epidural analgesia Show forest plot | 1 | 32 | Risk Ratio (M‐H, Fixed, 95% CI) | 1.57 [0.82, 3.00] |
| Outcome or subgroup title | No. of studies | No. of participants | Statistical method | Effect size |
| 1 Vaginal delivery not achieved within 24 hours Show forest plot | 1 | 73 | Risk Ratio (M‐H, Fixed, 95% CI) | 1.28 [0.87, 1.87] |
| 2 Uterine hyperstimulation with FHR changes Show forest plot | 1 | 200 | Risk Ratio (M‐H, Fixed, 95% CI) | 2.0 [0.18, 21.71] |
| 3 Caesarean section Show forest plot | 4 | 553 | Risk Ratio (M‐H, Fixed, 95% CI) | 0.91 [0.64, 1.28] |
| 5 Serious maternal morbidity or death Show forest plot | 1 | 200 | Risk Ratio (M‐H, Fixed, 95% CI) | 0.33 [0.01, 8.09] |
| 6 Cervix unfavourable/unchanged after 12 to 24 hours Show forest plot | 1 | 200 | Risk Ratio (M‐H, Fixed, 95% CI) | 0.77 [0.56, 1.07] |
| 7 Oxytocin augmentation Show forest plot | 5 | 577 | Risk Ratio (M‐H, Fixed, 95% CI) | 0.84 [0.72, 0.97] |
| 10 Epidural analgesia Show forest plot | 2 | 400 | Risk Ratio (M‐H, Fixed, 95% CI) | 1.02 [0.89, 1.19] |
| 11 Instrumental vaginal delivery Show forest plot | 2 | 400 | Risk Ratio (M‐H, Fixed, 95% CI) | 0.81 [0.59, 1.10] |
| 13 Apgar score <7 at 5 minutes Show forest plot | 2 | 104 | Risk Ratio (M‐H, Fixed, 95% CI) | 0.33 [0.01, 7.95] |
| 23 Postpartum haemorrhage Show forest plot | 2 | 280 | Risk Ratio (M‐H, Fixed, 95% CI) | 0.65 [0.16, 2.65] |
| Outcome or subgroup title | No. of studies | No. of participants | Statistical method | Effect size |
| 1 Vaginal delivery not achieved within 24 hours Show forest plot | 1 | 73 | Risk Ratio (M‐H, Fixed, 95% CI) | 1.28 [0.87, 1.87] |
| 2 Uterine hyperstimulation with FHR changes Show forest plot | 1 | 200 | Risk Ratio (M‐H, Fixed, 95% CI) | 2.0 [0.18, 21.71] |
| 3 Caesarean section Show forest plot | 3 | 353 | Risk Ratio (M‐H, Fixed, 95% CI) | 0.93 [0.63, 1.38] |
| 5 Serious maternal morbidity or death Show forest plot | 1 | 200 | Risk Ratio (M‐H, Fixed, 95% CI) | 0.33 [0.01, 8.09] |
| 6 Cervix unfavourable/unchanged after 12 to 24 hours Show forest plot | 1 | 200 | Risk Ratio (M‐H, Fixed, 95% CI) | 0.77 [0.56, 1.07] |
| 7 Oxytocin augmentation Show forest plot | 4 | 377 | Risk Ratio (M‐H, Fixed, 95% CI) | 0.85 [0.71, 1.02] |
| 10 Epidural analgesia Show forest plot | 1 | 200 | Risk Ratio (M‐H, Fixed, 95% CI) | 0.96 [0.85, 1.10] |
| 11 Instrumental vaginal delivery Show forest plot | 1 | 200 | Risk Ratio (M‐H, Fixed, 95% CI) | 0.88 [0.61, 1.25] |
| 13 Apgar score <7 at 5 minutes Show forest plot | 2 | 104 | Risk Ratio (M‐H, Fixed, 95% CI) | 0.33 [0.01, 7.95] |
| 23 Postpartum haemorrhage Show forest plot | 1 | 80 | Risk Ratio (M‐H, Fixed, 95% CI) | 0.5 [0.05, 5.30] |
| Outcome or subgroup title | No. of studies | No. of participants | Statistical method | Effect size |
| 7 Oxytocin augmentation Show forest plot | 1 | 24 | Risk Ratio (M‐H, Fixed, 95% CI) | 1.0 [0.39, 2.58] |
| 13 Apgar score <7 at 5 minutes Show forest plot | 1 | 24 | Risk Ratio (M‐H, Fixed, 95% CI) | 0.0 [0.0, 0.0] |
| Outcome or subgroup title | No. of studies | No. of participants | Statistical method | Effect size |
| 3 Caesarean section Show forest plot | 1 | 200 | Risk Ratio (M‐H, Fixed, 95% CI) | 0.85 [0.42, 1.69] |
| 7 Oxytocin augmentation Show forest plot | 1 | 200 | Risk Ratio (M‐H, Fixed, 95% CI) | 0.81 [0.63, 1.05] |
| 10 Epidural analgesia Show forest plot | 1 | 200 | Risk Ratio (M‐H, Fixed, 95% CI) | 1.20 [0.80, 1.82] |
| 11 Instrumental vaginal delivery Show forest plot | 1 | 200 | Risk Ratio (M‐H, Fixed, 95% CI) | 0.69 [0.38, 1.26] |
| 23 Postpartum haemorrhage Show forest plot | 1 | 200 | Risk Ratio (M‐H, Fixed, 95% CI) | 0.75 [0.13, 4.40] |
| Outcome or subgroup title | No. of studies | No. of participants | Statistical method | Effect size |
| 1 Vaginal delivery not achieved within 24 hours Show forest plot | 1 | 73 | Risk Ratio (M‐H, Fixed, 95% CI) | 1.28 [0.87, 1.87] |
| 2 Uterine hyperstimulation with FHR changes Show forest plot | 1 | 200 | Risk Ratio (M‐H, Fixed, 95% CI) | 2.0 [0.18, 21.71] |
| 3 Caesarean section Show forest plot | 2 | 273 | Risk Ratio (M‐H, Fixed, 95% CI) | 1.11 [0.71, 1.74] |
| 5 Serious maternal morbidity or death Show forest plot | 1 | 200 | Risk Ratio (M‐H, Fixed, 95% CI) | 0.33 [0.01, 8.09] |
| 6 Cervix unfavourable/unchanged after 12 to 24 hours Show forest plot | 1 | 200 | Risk Ratio (M‐H, Fixed, 95% CI) | 0.77 [0.56, 1.07] |
| 7 Oxytocin augmentation Show forest plot | 2 | 273 | Risk Ratio (M‐H, Fixed, 95% CI) | 0.98 [0.82, 1.18] |
| 10 Epidural analgesia Show forest plot | 1 | 200 | Risk Ratio (M‐H, Fixed, 95% CI) | 0.96 [0.85, 1.10] |
| 11 Instrumental vaginal delivery Show forest plot | 1 | 200 | Risk Ratio (M‐H, Fixed, 95% CI) | 0.88 [0.61, 1.25] |
| Outcome or subgroup title | No. of studies | No. of participants | Statistical method | Effect size |
| 1 Vaginal delivery not achieved within 24 hours Show forest plot | 1 | 73 | Risk Ratio (M‐H, Fixed, 95% CI) | 1.28 [0.87, 1.87] |
| 2 Uterine hyperstimulation with FHR changes Show forest plot | 1 | 200 | Risk Ratio (M‐H, Fixed, 95% CI) | 2.0 [0.18, 21.71] |
| 3 Caesarean section Show forest plot | 3 | 353 | Risk Ratio (M‐H, Fixed, 95% CI) | 0.93 [0.63, 1.38] |
| 5 Serious maternal morbidity or death Show forest plot | 1 | 200 | Risk Ratio (M‐H, Fixed, 95% CI) | 0.33 [0.01, 8.09] |
| 6 Cervix unfavourable/unchanged after 12 to 24 hours Show forest plot | 1 | 200 | Risk Ratio (M‐H, Fixed, 95% CI) | 0.77 [0.56, 1.07] |
| 7 Oxytocin augmentation Show forest plot | 3 | 353 | Risk Ratio (M‐H, Fixed, 95% CI) | 0.84 [0.70, 1.01] |
| 10 Epidural analgesia Show forest plot | 1 | 200 | Risk Ratio (M‐H, Fixed, 95% CI) | 0.96 [0.85, 1.10] |
| 11 Instrumental vaginal delivery Show forest plot | 1 | 200 | Risk Ratio (M‐H, Fixed, 95% CI) | 0.88 [0.61, 1.25] |
| 13 Apgar score <7 at 5 minutes Show forest plot | 1 | 80 | Risk Ratio (M‐H, Fixed, 95% CI) | 0.33 [0.01, 7.95] |
| 23 Postpartum haemorrhage Show forest plot | 1 | 80 | Risk Ratio (M‐H, Fixed, 95% CI) | 0.5 [0.05, 5.30] |
| Outcome or subgroup title | No. of studies | No. of participants | Statistical method | Effect size |
| 1 Vaginal delivery not achieved within 24 hours Show forest plot | 1 | 73 | Risk Ratio (M‐H, Fixed, 95% CI) | 1.28 [0.87, 1.87] |
| 2 Uterine hyperstimulation with FHR changes Show forest plot | 1 | 200 | Risk Ratio (M‐H, Fixed, 95% CI) | 2.0 [0.18, 21.71] |
| 3 Caesarean section Show forest plot | 2 | 273 | Risk Ratio (M‐H, Fixed, 95% CI) | 1.11 [0.71, 1.74] |
| 5 Serious maternal morbidity or death Show forest plot | 1 | 200 | Risk Ratio (M‐H, Fixed, 95% CI) | 0.33 [0.01, 8.09] |
| 6 Cervix unfavourable/unchanged after 12 to 24 hours Show forest plot | 1 | 200 | Risk Ratio (M‐H, Fixed, 95% CI) | 0.77 [0.56, 1.07] |
| 7 Oxytocin augmentation Show forest plot | 2 | 273 | Risk Ratio (M‐H, Fixed, 95% CI) | 0.98 [0.82, 1.18] |
| 10 Epidural analgesia Show forest plot | 1 | 200 | Risk Ratio (M‐H, Fixed, 95% CI) | 0.96 [0.85, 1.10] |
| 11 Instrumental vaginal delivery Show forest plot | 1 | 200 | Risk Ratio (M‐H, Fixed, 95% CI) | 0.88 [0.61, 1.25] |
| Outcome or subgroup title | No. of studies | No. of participants | Statistical method | Effect size |
| 2 Uterine hyperstimulation with FHR changes Show forest plot | 2 | 159 | Risk Ratio (M‐H, Fixed, 95% CI) | 0.16 [0.03, 0.87] |
| 3 Caesarean section Show forest plot | 2 | 159 | Risk Ratio (M‐H, Fixed, 95% CI) | 0.65 [0.38, 1.11] |
| 8 Uterine hyperstimulation without FHR changes Show forest plot | 1 | 90 | Risk Ratio (M‐H, Fixed, 95% CI) | 0.2 [0.01, 4.05] |
| 13 Apgar score <7 at 5 minutes Show forest plot | 1 | 69 | Risk Ratio (M‐H, Fixed, 95% CI) | 0.21 [0.01, 4.13] |
| 18 Maternal side‐effects (all) Show forest plot | 2 | 460 | Risk Ratio (M‐H, Fixed, 95% CI) | 0.2 [0.02, 1.70] |
| 19 Nausea (maternal) Show forest plot | 1 | 69 | Risk Ratio (M‐H, Fixed, 95% CI) | 0.34 [0.01, 8.13] |
| 20 Vomitting (maternal) Show forest plot | 1 | 69 | Risk Ratio (M‐H, Fixed, 95% CI) | 0.34 [0.01, 8.13] |
| 21 Diarrhoea (maternal) Show forest plot | 2 | 159 | Risk Ratio (M‐H, Fixed, 95% CI) | 0.33 [0.01, 7.97] |
| 22 Other maternal side effects Show forest plot | 2 | 159 | Risk Ratio (M‐H, Fixed, 95% CI) | 0.33 [0.01, 7.97] |
| Outcome or subgroup title | No. of studies | No. of participants | Statistical method | Effect size |
| 2 Uterine hyperstimulation with FHR changes Show forest plot | 2 | 159 | Risk Ratio (M‐H, Fixed, 95% CI) | 0.16 [0.03, 0.87] |
| 3 Caesarean section Show forest plot | 2 | 159 | Risk Ratio (M‐H, Fixed, 95% CI) | 0.65 [0.38, 1.11] |
| 8 Uterine hyperstimulation without FHR changes Show forest plot | 1 | 90 | Risk Ratio (M‐H, Fixed, 95% CI) | 0.2 [0.01, 4.05] |
| 13 Apgar score <7 at 5 minutes Show forest plot | 1 | 69 | Risk Ratio (M‐H, Fixed, 95% CI) | 0.21 [0.01, 4.13] |
| 18 Maternal side‐effects (all) Show forest plot | 2 | 460 | Risk Ratio (M‐H, Fixed, 95% CI) | 0.2 [0.02, 1.70] |
| 19 Nausea (maternal) Show forest plot | 1 | 69 | Risk Ratio (M‐H, Fixed, 95% CI) | 0.34 [0.01, 8.13] |
| 20 Vomitting (maternal) Show forest plot | 1 | 69 | Risk Ratio (M‐H, Fixed, 95% CI) | 0.34 [0.01, 8.13] |
| 21 Diarrhoea (maternal) Show forest plot | 2 | 159 | Risk Ratio (M‐H, Fixed, 95% CI) | 0.33 [0.01, 7.97] |
| 22 Other maternal side‐effects Show forest plot | 2 | 159 | Risk Ratio (M‐H, Fixed, 95% CI) | 0.33 [0.01, 7.97] |
| Outcome or subgroup title | No. of studies | No. of participants | Statistical method | Effect size |
| 3 Caesarean section Show forest plot | 3 | 491 | Risk Ratio (M‐H, Fixed, 95% CI) | 1.13 [0.64, 1.99] |
| 7 Oxytocin augmentation Show forest plot | 3 | 491 | Risk Ratio (M‐H, Fixed, 95% CI) | 0.73 [0.56, 0.96] |
| 8 Uterine hyperstimulation without FHR changes Show forest plot | 1 | 200 | Risk Ratio (M‐H, Fixed, 95% CI) | 0.0 [0.0, 0.0] |
| 10 Epidural analgesia Show forest plot | 1 | 24 | Risk Ratio (M‐H, Fixed, 95% CI) | 0.67 [0.25, 1.78] |
| 11 Instrumental vaginal delivery Show forest plot | 3 | 491 | Risk Ratio (M‐H, Fixed, 95% CI) | 1.72 [1.09, 2.70] |
| 13 Apgar score <7 at 5 minutes Show forest plot | 2 | 467 | Risk Ratio (M‐H, Fixed, 95% CI) | 1.33 [0.58, 3.05] |
| 18 Maternal side‐effects (all) Show forest plot | 1 | 400 | Risk Ratio (M‐H, Fixed, 95% CI) | 0.0 [0.0, 0.0] |
| 20 Vomitting (maternal) Show forest plot | 1 | 200 | Risk Ratio (M‐H, Fixed, 95% CI) | 0.0 [0.0, 0.0] |
| 21 Diarrhoea (maternal) Show forest plot | 1 | 200 | Risk Ratio (M‐H, Fixed, 95% CI) | 0.0 [0.0, 0.0] |
| 23 Postpartum haemorrhage Show forest plot | 1 | 267 | Risk Ratio (M‐H, Fixed, 95% CI) | 1.12 [0.57, 2.20] |
| Outcome or subgroup title | No. of studies | No. of participants | Statistical method | Effect size |
| 3 Caesarean section Show forest plot | 1 | 200 | Risk Ratio (M‐H, Fixed, 95% CI) | 1.0 [0.26, 3.89] |
| 7 Oxytocin augmentation Show forest plot | 1 | 200 | Risk Ratio (M‐H, Fixed, 95% CI) | 0.35 [0.19, 0.64] |
| 8 Uterine hyperstimulation without FHR changes Show forest plot | 1 | 200 | Risk Ratio (M‐H, Fixed, 95% CI) | 0.0 [0.0, 0.0] |
| 11 Instrumental vaginal delivery Show forest plot | 1 | 200 | Risk Ratio (M‐H, Fixed, 95% CI) | 1.11 [0.47, 2.62] |
| 13 Apgar score <7 at 5 minutes Show forest plot | 1 | 200 | Risk Ratio (M‐H, Fixed, 95% CI) | 1.25 [0.51, 3.04] |
| 18 Maternal side‐effects (all) Show forest plot | 1 | 400 | Risk Ratio (M‐H, Fixed, 95% CI) | 0.0 [0.0, 0.0] |
| 20 Vomitting (maternal) Show forest plot | 1 | 200 | Risk Ratio (M‐H, Fixed, 95% CI) | 0.0 [0.0, 0.0] |
| 21 Diarrhoea (maternal) Show forest plot | 1 | 200 | Risk Ratio (M‐H, Fixed, 95% CI) | 0.0 [0.0, 0.0] |
| Outcome or subgroup title | No. of studies | No. of participants | Statistical method | Effect size |
| 3 Caesarean section Show forest plot | 1 | 141 | Risk Ratio (M‐H, Fixed, 95% CI) | 1.21 [0.57, 2.58] |
| 7 Oxytocin augmentation Show forest plot | 1 | 141 | Risk Ratio (M‐H, Fixed, 95% CI) | 1.27 [0.85, 1.88] |
| Outcome or subgroup title | No. of studies | No. of participants | Statistical method | Effect size |
| 3 Caesarean section Show forest plot | 1 | 126 | Risk Ratio (M‐H, Fixed, 95% CI) | 0.83 [0.23, 2.93] |
| 7 Oxytocin augmentation Show forest plot | 1 | 126 | Risk Ratio (M‐H, Fixed, 95% CI) | 0.66 [0.37, 1.16] |
| Outcome or subgroup title | No. of studies | No. of participants | Statistical method | Effect size |
| 1 Vaginal delivery not achieved within 24 hours Show forest plot | 1 | 200 | Risk Ratio (M‐H, Fixed, 95% CI) | 0.92 [0.68, 1.23] |
| 2 Uterine hyperstimulation with FHR changes Show forest plot | 2 | 321 | Risk Ratio (M‐H, Fixed, 95% CI) | 2.76 [0.89, 8.56] |
| 3 Caesarean section Show forest plot | 5 | 537 | Risk Ratio (M‐H, Fixed, 95% CI) | 0.92 [0.63, 1.36] |
| 7 Oxytocin augmentation Show forest plot | 3 | 361 | Risk Ratio (M‐H, Fixed, 95% CI) | 0.83 [0.65, 1.06] |
| 8 Uterine hyperstimulation without FHR changes Show forest plot | 4 | 386 | Risk Ratio (M‐H, Fixed, 95% CI) | 1.31 [0.63, 2.72] |
| 9 Uterine rupture Show forest plot | 1 | 200 | Risk Ratio (M‐H, Fixed, 95% CI) | 0.33 [0.01, 8.09] |
| 10 Epidural analgesia Show forest plot | 3 | 204 | Risk Ratio (M‐H, Fixed, 95% CI) | 1.01 [0.81, 1.27] |
| 11 Instrumental vaginal delivery Show forest plot | 2 | 269 | Risk Ratio (M‐H, Fixed, 95% CI) | 0.68 [0.38, 1.19] |
| 13 Apgar score <7 at 5 minutes Show forest plot | 2 | 240 | Risk Ratio (M‐H, Fixed, 95% CI) | 3.0 [0.12, 72.77] |
| Outcome or subgroup title | No. of studies | No. of participants | Statistical method | Effect size |
| 2 Uterine hyperstimulation with FHR changes Show forest plot | 1 | 121 | Risk Ratio (M‐H, Fixed, 95% CI) | 6.67 [0.86, 51.67] |
| 3 Caesarean section Show forest plot | 3 | 268 | Risk Ratio (M‐H, Fixed, 95% CI) | 0.75 [0.40, 1.43] |
| 7 Oxytocin augmentation Show forest plot | 2 | 161 | Risk Ratio (M‐H, Fixed, 95% CI) | 0.55 [0.35, 0.88] |
| 8 Uterine hyperstimulation without FHR changes Show forest plot | 2 | 135 | Risk Ratio (M‐H, Fixed, 95% CI) | 5.0 [0.26, 98.00] |
| 10 Epidural analgesia Show forest plot | 2 | 135 | Risk Ratio (M‐H, Fixed, 95% CI) | 1.05 [0.85, 1.30] |
| 13 Apgar score <7 at 5 minutes Show forest plot | 1 | 40 | Risk Ratio (M‐H, Fixed, 95% CI) | 0.0 [0.0, 0.0] |
| Outcome or subgroup title | No. of studies | No. of participants | Statistical method | Effect size |
| 3 Caesarean section Show forest plot | 1 | 69 | Risk Ratio (M‐H, Fixed, 95% CI) | 1.54 [0.48, 4.99] |
| 10 Epidural analgesia Show forest plot | 1 | 69 | Risk Ratio (M‐H, Fixed, 95% CI) | 1.13 [0.55, 2.31] |
| 11 Instrumental vaginal delivery Show forest plot | 1 | 69 | Risk Ratio (M‐H, Fixed, 95% CI) | 0.94 [0.46, 1.91] |
| Outcome or subgroup title | No. of studies | No. of participants | Statistical method | Effect size |
| 2 Uterine hyperstimulation with FHR changes Show forest plot | 1 | 121 | Risk Ratio (M‐H, Fixed, 95% CI) | 6.67 [0.86, 51.67] |
| 3 Caesarean section Show forest plot | 1 | 121 | Risk Ratio (M‐H, Fixed, 95% CI) | 0.63 [0.15, 2.67] |
| 7 Oxytocin augmentation Show forest plot | 1 | 121 | Risk Ratio (M‐H, Fixed, 95% CI) | 0.43 [0.26, 0.72] |
| Outcome or subgroup title | No. of studies | No. of participants | Statistical method | Effect size |
| 2 Uterine hyperstimulation with FHR changes Show forest plot | 1 | 55 | Risk Ratio (M‐H, Fixed, 95% CI) | 7.44 [0.43, 128.16] |
| 3 Caesarean section Show forest plot | 1 | 55 | Risk Ratio (M‐H, Fixed, 95% CI) | 0.67 [0.10, 4.39] |
| 7 Oxytocin augmentation Show forest plot | 1 | 55 | Risk Ratio (M‐H, Fixed, 95% CI) | 0.44 [0.22, 0.91] |
| 8 Uterine hyperstimulation without FHR changes Show forest plot | 1 | 95 | Risk Ratio (M‐H, Fixed, 95% CI) | 0.0 [0.0, 0.0] |
| 10 Epidural analgesia Show forest plot | 1 | 95 | Risk Ratio (M‐H, Fixed, 95% CI) | 1.0 [0.82, 1.22] |
| Outcome or subgroup title | No. of studies | No. of participants | Statistical method | Effect size |
| 2 Uterine hyperstimulation with FHR changes Show forest plot | 1 | 55 | Risk Ratio (M‐H, Fixed, 95% CI) | 7.44 [0.43, 128.16] |
| 3 Caesarean section Show forest plot | 1 | 55 | Risk Ratio (M‐H, Fixed, 95% CI) | 0.67 [0.10, 4.39] |
| 7 Oxytocin augmentation Show forest plot | 1 | 55 | Risk Ratio (M‐H, Fixed, 95% CI) | 0.44 [0.22, 0.91] |
| Outcome or subgroup title | No. of studies | No. of participants | Statistical method | Effect size |
| 2 Uterine hyperstimulation with FHR changes Show forest plot | 1 | 66 | Risk Ratio (M‐H, Fixed, 95% CI) | 3.0 [0.33, 27.38] |
| 3 Caesarean section Show forest plot | 1 | 66 | Risk Ratio (M‐H, Fixed, 95% CI) | 0.5 [0.05, 5.25] |
| 7 Oxytocin augmentation Show forest plot | 1 | 66 | Risk Ratio (M‐H, Fixed, 95% CI) | 0.41 [0.20, 0.86] |
| Outcome or subgroup title | No. of studies | No. of participants | Statistical method | Effect size |
| 2 Uterine hyperstimulation with FHR changes Show forest plot | 2 | 140 | Risk Ratio (M‐H, Fixed, 95% CI) | 0.18 [0.03, 0.99] |
| 3 Caesarean section Show forest plot | 7 | 1466 | Risk Ratio (M‐H, Fixed, 95% CI) | 1.07 [0.80, 1.42] |
| 4 Serious neonatal morbidity or perinatal death Show forest plot | 1 | 955 | Risk Ratio (M‐H, Fixed, 95% CI) | 0.0 [0.0, 0.0] |
| 7 Oxytocin augmentation Show forest plot | 4 | 1219 | Risk Ratio (M‐H, Fixed, 95% CI) | 1.09 [0.95, 1.24] |
| 8 Uterine hyperstimulation without FHR changes Show forest plot | 1 | 40 | Risk Ratio (M‐H, Fixed, 95% CI) | 0.2 [0.01, 3.92] |
| 10 Epidural analgesia Show forest plot | 3 | 1179 | Risk Ratio (M‐H, Fixed, 95% CI) | 1.11 [0.96, 1.29] |
| 11 Instrumental vaginal delivery Show forest plot | 3 | 1179 | Risk Ratio (M‐H, Fixed, 95% CI) | 0.89 [0.70, 1.13] |
| 12 Meconium stained liquor Show forest plot | 1 | 955 | Risk Ratio (M‐H, Fixed, 95% CI) | 0.86 [0.67, 1.10] |
| 13 Apgar score <7 at 5 minutes Show forest plot | 3 | 1064 | Risk Ratio (M‐H, Fixed, 95% CI) | 0.51 [0.20, 1.31] |
| 14 Neonatal intensive care unit admission Show forest plot | 1 | 955 | Risk Ratio (M‐H, Fixed, 95% CI) | 0.51 [0.24, 1.09] |
| 16 Perinatal death Show forest plot | 1 | 955 | Risk Ratio (M‐H, Fixed, 95% CI) | 0.0 [0.0, 0.0] |
| 18 Maternal side‐effects (all) Show forest plot | 2 | 351 | Risk Ratio (M‐H, Fixed, 95% CI) | 0.34 [0.08, 1.36] |
| 19 Nausea (maternal) Show forest plot | 1 | 69 | Risk Ratio (M‐H, Fixed, 95% CI) | 0.34 [0.01, 8.13] |
| 20 Vomitting (maternal) Show forest plot | 1 | 69 | Risk Ratio (M‐H, Fixed, 95% CI) | 0.34 [0.01, 8.13] |
| 21 Diarrhoea (maternal) Show forest plot | 1 | 69 | Risk Ratio (M‐H, Fixed, 95% CI) | 0.0 [0.0, 0.0] |
| 22 Other maternal side‐effects Show forest plot | 1 | 69 | Risk Ratio (M‐H, Fixed, 95% CI) | 0.0 [0.0, 0.0] |
| 23 Postpartum haemorrhage Show forest plot | 2 | 1155 | Risk Ratio (M‐H, Fixed, 95% CI) | 1.28 [0.79, 2.09] |
| Outcome or subgroup title | No. of studies | No. of participants | Statistical method | Effect size |
| 2 Uterine hyperstimulation with FHR changes Show forest plot | 2 | 140 | Risk Ratio (M‐H, Fixed, 95% CI) | 0.18 [0.03, 0.99] |
| 3 Caesarean section Show forest plot | 4 | 287 | Risk Ratio (M‐H, Fixed, 95% CI) | 1.13 [0.70, 1.81] |
| 7 Oxytocin augmentation Show forest plot | 1 | 40 | Risk Ratio (M‐H, Fixed, 95% CI) | 0.4 [0.09, 1.83] |
| 8 Uterine hyperstimulation without FHR changes Show forest plot | 1 | 40 | Risk Ratio (M‐H, Fixed, 95% CI) | 0.2 [0.01, 3.92] |
| 13 Apgar score <7 at 5 minutes Show forest plot | 2 | 109 | Risk Ratio (M‐H, Fixed, 95% CI) | 0.21 [0.01, 4.13] |
| 18 Maternal side‐effects (all) Show forest plot | 2 | 351 | Risk Ratio (M‐H, Fixed, 95% CI) | 0.34 [0.08, 1.36] |
| 19 Nausea (maternal) Show forest plot | 1 | 69 | Risk Ratio (M‐H, Fixed, 95% CI) | 0.34 [0.01, 8.13] |
| 20 Vomitting (maternal) Show forest plot | 1 | 69 | Risk Ratio (M‐H, Fixed, 95% CI) | 0.34 [0.01, 8.13] |
| 21 Diarrhoea (maternal) Show forest plot | 1 | 69 | Risk Ratio (M‐H, Fixed, 95% CI) | 0.0 [0.0, 0.0] |
| 22 Other maternal side‐effects Show forest plot | 1 | 69 | Risk Ratio (M‐H, Fixed, 95% CI) | 0.0 [0.0, 0.0] |
| Outcome or subgroup title | No. of studies | No. of participants | Statistical method | Effect size |
| 3 Caesarean section Show forest plot | 1 | 200 | Risk Ratio (M‐H, Fixed, 95% CI) | 0.85 [0.42, 1.69] |
| 7 Oxytocin augmentation Show forest plot | 1 | 200 | Risk Ratio (M‐H, Fixed, 95% CI) | 0.81 [0.63, 1.05] |
| 10 Epidural analgesia Show forest plot | 1 | 200 | Risk Ratio (M‐H, Fixed, 95% CI) | 1.20 [0.80, 1.82] |
| 11 Instrumental vaginal delivery Show forest plot | 1 | 200 | Risk Ratio (M‐H, Fixed, 95% CI) | 0.69 [0.38, 1.26] |
| 23 Postpartum haemorrhage Show forest plot | 1 | 200 | Risk Ratio (M‐H, Fixed, 95% CI) | 0.75 [0.13, 4.40] |
| Outcome or subgroup title | No. of studies | No. of participants | Statistical method | Effect size |
| 2 Uterine hyperstimulation with FHR changes Show forest plot | 2 | 140 | Risk Ratio (M‐H, Fixed, 95% CI) | 0.18 [0.03, 0.99] |
| 3 Caesarean section Show forest plot | 2 | 140 | Risk Ratio (M‐H, Fixed, 95% CI) | 1.03 [0.54, 1.94] |
| 13 Apgar score <7 at 5 minutes Show forest plot | 1 | 69 | Risk Ratio (M‐H, Fixed, 95% CI) | 0.21 [0.01, 4.13] |
| 18 Maternal side‐effects (all) Show forest plot | 2 | 351 | Risk Ratio (M‐H, Fixed, 95% CI) | 0.34 [0.08, 1.36] |
| 19 Nausea (maternal) Show forest plot | 1 | 69 | Risk Ratio (M‐H, Fixed, 95% CI) | 0.34 [0.01, 8.13] |
| 20 Vomitting (maternal) Show forest plot | 1 | 69 | Risk Ratio (M‐H, Fixed, 95% CI) | 0.34 [0.01, 8.13] |
| 21 Diarrhoea (maternal) Show forest plot | 1 | 69 | Risk Ratio (M‐H, Fixed, 95% CI) | 0.0 [0.0, 0.0] |
| 22 Other maternal side‐effects Show forest plot | 1 | 69 | Risk Ratio (M‐H, Fixed, 95% CI) | 0.0 [0.0, 0.0] |
| Outcome or subgroup title | No. of studies | No. of participants | Statistical method | Effect size |
| 3 Caesarean section Show forest plot | 1 | 499 | Risk Ratio (M‐H, Fixed, 95% CI) | 1.29 [0.82, 2.03] |
| 4 Serious neonatal morbidity or perinatal death Show forest plot | 1 | 499 | Risk Ratio (M‐H, Fixed, 95% CI) | 0.0 [0.0, 0.0] |
| 7 Oxytocin augmentation Show forest plot | 1 | 499 | Risk Ratio (M‐H, Fixed, 95% CI) | 1.10 [0.94, 1.28] |
| 10 Epidural analgesia Show forest plot | 1 | 499 | Risk Ratio (M‐H, Fixed, 95% CI) | 1.19 [1.03, 1.39] |
| 11 Instrumental vaginal delivery Show forest plot | 1 | 499 | Risk Ratio (M‐H, Fixed, 95% CI) | 0.92 [0.71, 1.18] |
| 12 Meconium stained liquor Show forest plot | 1 | 499 | Risk Ratio (M‐H, Fixed, 95% CI) | 0.95 [0.72, 1.27] |
| 13 Apgar score <7 at 5 minutes Show forest plot | 1 | 499 | Risk Ratio (M‐H, Fixed, 95% CI) | 0.16 [0.02, 1.27] |
| 14 Neonatal intensive care unit admission Show forest plot | 1 | 499 | Risk Ratio (M‐H, Fixed, 95% CI) | 0.34 [0.11, 1.03] |
| 16 Perinatal death Show forest plot | 1 | 499 | Risk Ratio (M‐H, Fixed, 95% CI) | 0.0 [0.0, 0.0] |
| 23 Postpartum haemorrhage Show forest plot | 1 | 499 | Risk Ratio (M‐H, Fixed, 95% CI) | 1.62 [0.86, 3.05] |
| Outcome or subgroup title | No. of studies | No. of participants | Statistical method | Effect size |
| 3 Caesarean section Show forest plot | 1 | 456 | Risk Ratio (M‐H, Fixed, 95% CI) | 0.68 [0.19, 2.51] |
| 4 Serious neonatal morbidity or perinatal death Show forest plot | 1 | 456 | Risk Ratio (M‐H, Fixed, 95% CI) | 0.0 [0.0, 0.0] |
| 7 Oxytocin augmentation Show forest plot | 1 | 456 | Risk Ratio (M‐H, Fixed, 95% CI) | 1.94 [1.35, 2.80] |
| 10 Epidural analgesia Show forest plot | 1 | 456 | Risk Ratio (M‐H, Fixed, 95% CI) | 1.15 [0.77, 1.70] |
| 11 Instrumental vaginal delivery Show forest plot | 1 | 456 | Risk Ratio (M‐H, Fixed, 95% CI) | 5.98 [1.37, 25.99] |
| 12 Meconium stained liquor Show forest plot | 1 | 456 | Risk Ratio (M‐H, Fixed, 95% CI) | 0.77 [0.48, 1.24] |
| 13 Apgar score <7 at 5 minutes Show forest plot | 1 | 456 | Risk Ratio (M‐H, Fixed, 95% CI) | 1.42 [0.34, 5.88] |
| 14 Neonatal intensive care unit admission Show forest plot | 1 | 492 | Risk Ratio (M‐H, Fixed, 95% CI) | 1.0 [0.33, 3.06] |
| 16 Perinatal death Show forest plot | 1 | 465 | Risk Ratio (M‐H, Fixed, 95% CI) | 0.0 [0.0, 0.0] |
| 23 Postpartum haemorrhage Show forest plot | 1 | 456 | Risk Ratio (M‐H, Fixed, 95% CI) | 1.04 [0.44, 2.47] |
| Outcome or subgroup title | No. of studies | No. of participants | Statistical method | Effect size |
| 2 Uterine hyperstimulation with FHR changes Show forest plot | 1 | 100 | Risk Ratio (M‐H, Fixed, 95% CI) | 0.0 [0.0, 0.0] |
| 2.2 PGE2 (repeated doses) vs placebo/no treatment | 1 | 100 | Risk Ratio (M‐H, Fixed, 95% CI) | 0.0 [0.0, 0.0] |
| 3 Caesarean section Show forest plot | 2 | 300 | Risk Ratio (M‐H, Fixed, 95% CI) | 0.70 [0.42, 1.18] |
| 3.2 PGE2 (repeated doses) vs placebo/no treatment | 2 | 300 | Risk Ratio (M‐H, Fixed, 95% CI) | 0.70 [0.42, 1.18] |
| 6 Cervix unfavourable/unchanged after 12 to 24 hours Show forest plot | 1 | 36 | Risk Ratio (M‐H, Fixed, 95% CI) | 0.13 [0.03, 0.47] |
| 6.2 PGE2 (repeated doses) vs placebo/no treatment | 1 | 36 | Risk Ratio (M‐H, Fixed, 95% CI) | 0.13 [0.03, 0.47] |
| 8 Uterine hyperstimulation without FHR changes Show forest plot | 1 | 100 | Risk Ratio (M‐H, Fixed, 95% CI) | 3.0 [0.13, 71.92] |
| 8.2 PGE2 (repeated doses) vs placebo/no treatment | 1 | 100 | Risk Ratio (M‐H, Fixed, 95% CI) | 3.0 [0.13, 71.92] |
| 10 Epidural analgesia Show forest plot | 1 | 100 | Risk Ratio (M‐H, Fixed, 95% CI) | 0.83 [0.62, 1.12] |
| 10.2 PGE2 (repeated doses) vs placebo/no treatment | 1 | 100 | Risk Ratio (M‐H, Fixed, 95% CI) | 0.83 [0.62, 1.12] |
| 12 Meconium stained liquor Show forest plot | 2 | 300 | Risk Ratio (M‐H, Fixed, 95% CI) | 0.43 [0.28, 0.66] |
| 12.2 PGE2 (repeated doses) vs placebo/no treatment | 2 | 300 | Risk Ratio (M‐H, Fixed, 95% CI) | 0.43 [0.28, 0.66] |
| 13 Apgar score <7 at 5 minutes Show forest plot | 1 | 100 | Risk Ratio (M‐H, Fixed, 95% CI) | 0.2 [0.01, 4.06] |
| 13.2 PGE2 (repeated doses) vs placebo/no treatment | 1 | 100 | Risk Ratio (M‐H, Fixed, 95% CI) | 0.2 [0.01, 4.06] |
| 14 Neonatal intensive care unit admission Show forest plot | 1 | 100 | Risk Ratio (M‐H, Fixed, 95% CI) | 0.2 [0.02, 1.65] |
| 14.2 PGE2 (repeated doses) vs placebo/no treatment | 1 | 100 | Risk Ratio (M‐H, Fixed, 95% CI) | 0.2 [0.02, 1.65] |