Vaginal prostaglandin (PGE2 and PGF2a) for induction of labour at term
Abstract
Background
Prostaglandins have been used for induction of labour since the 1960s. This is one of a series of reviews evaluating methods of induction of labour. This review focuses on prostaglandins given per vaginam, evaluating these in comparison with placebo (or expectant management) and with each other; prostaglandins (PGE2 and PGF2a); different formulations (gels, tablets, pessaries) and doses.
Objectives
To determine the effects of vaginal prostaglandins E2 and F2a for third trimester cervical ripening or induction of labour in comparison with placebo/no treatment or other vaginal prostaglandins (except misoprostol).
Search methods
We searched the Cochrane Pregnancy and Childbirth Group's Trials Register (1 March 2014) and bibliographies of relevant papers.
Selection criteria
Clinical trials comparing vaginal prostaglandins used for third trimester cervical ripening or labour induction with placebo/no treatment, with each other, or other methods listed above it on a predefined list of labour induction methods.
Data collection and analysis
We assessed studies and extracted data independently.
Main results
Seventy randomised controlled trials (RCTs) (11,487 women) are included. In this update seven new RCTs (778 women) have been added. Two of these new trials compare PGE2 with no treatment, four compare different PGE2 formulations (gels versus tablets, or sustained release pessaries) and one trial compares PGF2a with placebo. The majority of trials were at unclear risk of bias for most domains.
Overall, vaginal prostaglandin E2 compared with placebo or no treatment probably reduces the likelihood of vaginal delivery not being achieved within 24 hours. The risk of uterine hyperstimulation with fetal heart rate changes is increased (4.8% versus 1.0%, risk ratio (RR) 3.16, 95% confidence interval (CI) 1.67 to 5.98, 15 trials, 1359 women). The caesarean section rate is probably reduced by about 10% (13.5% versus 14.8%, RR 0.91, 95% CI 0.81 to 1.02, 36 trials, 6599 women). The overall effect on improving maternal and fetal outcomes (across a variety of measures) is uncertain.
PGE2 tablets, gels and pessaries (including sustained release preparations) appear to be as effective as each other, small differences are detected between some outcomes, but these maybe due to chance.
Authors' conclusions
Prostaglandins PGE2 probably increase the chance of vaginal delivery in 24 hours, they increase uterine hyperstimulation with fetal heart changes but do not effect or may reduce caesarean section rates. They increase the likelihood of cervical change, with no increase in operative delivery rates. PGE2 tablets, gels and pessaries appear to be as effective as each other, any differences between formulations are marginal but may be important.
PICO
Plain language summary
Vaginal prostaglandin (PGE2 and PGF2a) for induction of labour at term
Induction of labour is offered to pregnant women when it is thought the outcome will be better for the mother and/or baby if the baby is born than if the pregnancy continues. Common reasons include prolonged pregnancy, prelabour rupture of the membranes, concerns about the health of the mother such as pre‐eclampsia or the baby such as poor growth. Prostaglandins are hormones, produced throughout the body and can be used to start (induce) labour. They are applied locally to the vagina as tablets, gels, suppositories and pessaries to reduce side‐effects. The dose, number of doses, and time between doses vary considerably. Sustained release pessaries reduce the need for repeat doses and so the number of vaginal examinations.
This review set out to determine the effectiveness and safety of vaginal prostaglandins for third trimester cervical ripening and induction of labour (the cervix softens, shortens and opens, the uterus starts to contract regularly). Eight different comparisons were made, different vaginal prostaglandins were compared with placebos or no treatment, or other vaginal prostaglandins (PGE2, PGF2a, except misoprostol) and different preparations and dosages were compared. We identified 70 studies involving a total of 11,487 women. Vaginal prostaglandins increase the likelihood of vaginal birth within 24 hours, but they can also stimulate the uterus to contract too much and this may cause the baby's heart to slow, however they did not increase the caesarean section rate and may reduce it. Overall, the trials do not show any effect (improvement or worsening) of many important outcomes. Prostaglandin E2 tablets, gels, or pessaries including sustained release preparations appear to be as good as each other or the differences between them are small and have not yet been detected in the trials. Lower‐dose regimens, as defined in the review, appeared to be as good as higher‐dose regimens (eight trials, 1615 women).
Very limited data were available in the included trials on time in labour and patient satisfaction. Few studies have addressed issues relating to the safety of using vaginal prostaglandins for induction of labour as outpatients.
Authors' conclusions
Summary of findings
| PGE2 compared with placebo or no treatment for induction of labour at term (all women) | ||||||
| Patient or population: patients with induction of labour at term | ||||||
| Outcomes | Illustrative comparative risks* (95% CI) | Relative effect | No of Participants | Quality of the evidence | Comments | |
| Assumed risk | Corresponding risk | |||||
| Placebo or no treatment (all women) | PGE2 (all regimens) | |||||
| Vaginal delivery not achieved within 24 hours | Study population | RR 0.32 | 384 | ⊕⊝⊝⊝ | Probable reduction in time to delivery using PGE2. Useable data only available in 2 of 15 studies reporting time as an outcome. 39 studies in this comparison. | |
| 989 per 1000 | 317 per 1000 | |||||
| Moderate | ||||||
| 950 per 1000 | 304 per 1000 | |||||
| Uterine hyperstimulation with FHR changes | Study population | RR 3.16 | 1359 | ⊕⊕⊕⊝ | The risk of bias is "unclear" for most quality domain of the 15 RCT's and this may be a serious limitation. | |
| 10 per 1000 | 33 per 1000 | |||||
| Moderate | ||||||
| 0 per 1000 | 0 per 1000 | |||||
| Caesarean section | Study population | RR 0.91 | 6599 | ⊕⊕⊕⊕ | The risk of bias is unclear for most of the studies, but the largest study with a quarter of the participants) has a low risk of bias. | |
| 148 per 1000 | 134 per 1000 | |||||
| Moderate | ||||||
| 166 per 1000 | 151 per 1000 | |||||
| Serious neonatal morbidity or perinatal death | Study population | RR 0.46 | 3638 | ⊕⊕⊝⊝ | Neonatal morbidity or mortality is rare, several studies have no events. Underpowered to detect a difference even if one exists. | |
| 2 per 1000 | 1 per 1000 | |||||
| Moderate | ||||||
| 0 per 1000 | 0 per 1000 | |||||
| Serious maternal morbidity or death | Study population | RR 2.23 | 530 | ⊕⊝⊝⊝ | A very rare outcome, so underpowered to detect a difference if one exists. | |
| 4 per 1000 | 9 per 1000 | |||||
| Moderate | ||||||
| 0 per 1000 | 0 per 1000 | |||||
| *The basis for the assumed risk (e.g. the median control group risk across studies) is provided in footnotes. The corresponding risk (and its 95% confidence interval) is based on the assumed risk in the comparison group and the relative effect of the intervention (and its 95% CI). | ||||||
| GRADE Working Group grades of evidence | ||||||
| (4.1) PGE2 gel compared with PGE2 tablet (all women) for induction of labour at term | ||||||
| Patient or population: patients with induction of labour at term | ||||||
| Outcomes | Illustrative comparative risks* (95% CI) | Relative effect | No of Participants | Quality of the evidence | Comments | |
| Assumed risk | Corresponding risk | |||||
| PGE2 tablet (all women) | (4.1) PGE2 gel | |||||
| Vaginal delivery not achieved within 24 hours | Study population | RR 1.03 | 566 | ⊕⊕⊕⊝ | Most quality domains unclear or low risk but loss to follow up and reporting bias high in 1 trial. | |
| 369 per 1000 | 380 per 1000 | |||||
| Moderate | ||||||
| 528 per 1000 | 544 per 1000 | |||||
| Uterine hyperstimulation with FHR changes | Study population | RR 2 | 200 | ⊕⊝⊝⊝ | Only 1 small trial with an unclear risk of bias reports this outcome. | |
| 10 per 1000 | 20 per 1000 | |||||
| Moderate | ||||||
| 10 per 1000 | 20 per 1000 | |||||
| Caesarean section | Study population | RR 0.91 | 1046 | ⊕⊕⊕⊕ | The risk of bias is unclear for most studies, but the largest study has a low risk of bias. | |
| 198 per 1000 | 180 per 1000 | |||||
| Moderate | ||||||
| 201 per 1000 | 183 per 1000 | |||||
| Serious maternal morbidity or death | Study population | RR 0.33 | 200 | See comment | Study far too small to detect a difference. | |
| 10 per 1000 | 3 per 1000 | |||||
| Moderate | ||||||
| 10 per 1000 | 3 per 1000 | |||||
| Instrumental vaginal delivery | Study population | RR 0.77 | 565 | ⊕⊕⊕⊝ | The largest study has a high risk of bias. This is a secondary outcome in this review. | |
| 287 per 1000 | 221 per 1000 | |||||
| Moderate | ||||||
| 241 per 1000 | 186 per 1000 | |||||
| *The basis for the assumed risk (e.g. the median control group risk across studies) is provided in footnotes. The corresponding risk (and its 95% confidence interval) is based on the assumed risk in the comparison group and the relative effect of the intervention (and its 95% CI). | ||||||
| GRADE Working Group grades of evidence | ||||||
| (7.1) PGE2 (controlled release) compared with all PGE2 delivery systems (all women) for induction of labour at term | ||||||
| Patient or population: patients with induction of labour at term | ||||||
| Outcomes | Illustrative comparative risks* (95% CI) | Relative effect | No of Participants | Quality of the evidence | Comments | |
| Assumed risk | Corresponding risk | |||||
| All PGE2 delivery systems (all women) | (7.1) PGE2 (controlled release) | |||||
| Vaginal delivery not achieved within 24 hours | Study population | RR 1.15 | 450 | ⊕⊕⊕⊝ | Although all published after 2002, the risk of bias for most quality domains unclear. | |
| 373 per 1000 | 429 per 1000 | |||||
| Moderate | ||||||
| 333 per 1000 | 383 per 1000 | |||||
| Uterine hyperstimulation with FHR changes | Study population | RR 2.15 | 643 | ⊕⊕⊕⊝ | 4 of the studies are recent but risk of bias unclear. | |
| 22 per 1000 | 47 per 1000 | |||||
| Moderate | ||||||
| 18 per 1000 | 39 per 1000 | |||||
| Caesarean section | Study population | RR 1.02 | 1262 | ⊕⊕⊕⊝ | Risk of bias unclear, recent studies poorly reported. | |
| 201 per 1000 | 205 per 1000 | |||||
| Moderate | ||||||
| 177 per 1000 | 181 per 1000 | |||||
| Serious neonatal morbidity or perinatal death | Study population | RR 0.31 | 320 | ⊕⊕⊝⊝ | Underpowered to detect effect even if exists. | |
| 6 per 1000 | 2 per 1000 | |||||
| Moderate | ||||||
| 5 per 1000 | 2 per 1000 | |||||
| *The basis for the assumed risk (e.g. the median control group risk across studies) is provided in footnotes. The corresponding risk (and its 95% confidence interval) is based on the assumed risk in the comparison group and the relative effect of the intervention (and its 95% CI). | ||||||
| GRADE Working Group grades of evidence | ||||||
Background
Description of the condition
Induction of labour is a common intervention in pregnancy, it is undertaken when it is thought that the outcome of the pregnancy will be better for the mother and/or her baby if the baby is born. Approximately one in four or five women in the UK, Europe and USA are induced. Common reasons include prolonged pregnancy, prelabour rupture of the membranes, concerns about fetal well being (for example, poor growth, twin pregnancy) and maternal medical conditions (for example, diabetes, or pre‐eclampsia).The evidence that induction is beneficial in specific clinical situations is not part of this review but is considered in other Cohrane systematic reviews and clinical guidelines (NICE 2008).
The physiological processes surrounding the initiation and promotion of labour are complex. During normal pregnancy the uterus is relaxed and the cervix long, firm and closed. In preparation for labour the cervix "ripens" becoming softer, shorter (effaced) and more open, the uterine smooth muscle begins to respond to stimuli that cause the waves of contractions leading up to and during labour. A variety of physical and pharmacological interventions are or have been used to induce labour. This review is one of a series of reviews of methods for induction of labour that use a standardised published ’generic’ protocol (Hofmeyr 2009). These reviews were initially developed to help inform the recommendations of the NICE clinical practice guidelines on Induction of labour (NICE 2001).
Description of the intervention
Prostaglandins are hormones, produced throughout the body from arachidonic acid via the cyclo‐oxygenase pathway. Their role in cervical ripening and induction of labour was discovered in the 1960s. They have a variety of effects at different sites and receptors in the body that lead to unwanted side‐effects when used. The use of vaginal preparations (rather than oral or intravenous routes) for induction of labour aims to lessen side‐effects. There are a number of different vaginal preparations of prostaglandins used, including gels, tablets, suppositories and pessaries. The induction regimens used vary in the dosage used, the number of applications and time intervals between repeat applications. Sustained release pessaries have been developed to reduce the number of applications (and vaginal examinations) needed during induction of labour.
How the intervention might work
Prostaglandins ripen the cervix and induce uterine contractions. They have been used for induction of labour since the 1960s. Initial work focused on prostaglandin F2a (PGF2a ‐ Dinoprost), but prostaglandin E2 (PGE2, Dinoprostone) is now the most commonly used agent. Prostaglandins are now available in a variety of formulations and may be given by mouth, intravenously, vaginally or intra cervically. Information on the effectiveness of other routes of administration and types of prostaglandin (such as misoprostol) are reviewed separately in the linked reviews. To avoid duplication, the labour induction methods have been listed in a specific order, from one to 27. Each review includes comparisons between one of the methods (from two to 27) with only those methods above it on the list. Thus, this review includes comparison of vaginal prostaglandins to placebo or each other. Comparisons with interventions below it on the list are included in other reviews, for example (4) intravenous oxytocin will include only comparisons with intracervical prostaglandins (3), vaginal prostaglandins (2) or placebo (1). Methods identified in the future will be added to the end of the list. The current list is as follows:
-
placebo/no treatment;
-
vaginal prostaglandins (this review);
-
intracervical prostaglandins (Boulvain 2008);
-
intravenous oxytocin (Alfirevic 2009);
-
amniotomy (Bricker 2000);
-
intravenous oxytocin with amniotomy (Howarth 2001; Bimbashi 2012);
-
vaginal misoprostol (Hofmeyr 2010);
-
oral misoprostol (Alfirevic 2014);
-
mechanical methods including extra‐amniotic Foley catheter (Jozwiak 2012);
-
membrane sweeping (Boulvain 2005);
-
extra‐amniotic prostaglandins (Hutton 2001);
-
intravenous prostaglandins (Luckas 2000);
-
oral prostaglandins (French 2001);
-
mifepristone (Hapangama 2009);
-
oestrogens (Thomas 2001);
-
corticosteroids (Kavanagh 2006a);
-
relaxin (Kelly 2001b);
-
hyaluronidase (Kavanagh 2006b);
-
castor oil, bath, and/or enema (Kelly 2013);
-
acupuncture (Smith 2013);
-
breast stimulation (Kavanagh 2005);
-
sexual intercourse (Kavanagh 2001);
-
homoeopathic methods (Smith 2003);
-
nitric oxide (Kelly 2011);
-
buccal or sublingual misoprostol (Muzonzini 2004);
-
hypnosis (Nishi 2013);
-
other methods for induction of labour.
Why it is important to do this review
These reviews were initially developed to help inform the recommendations of the NICE clinical practice guidelines on Induction of labour (NICE 2001). This review is one of a series of reviews of methods for induction of labour that use a standardised published ’generic’ protocol (Hofmeyr 2009).
Objectives
To determine, from the best available evidence, the effectiveness and safety of vaginal prostaglandin E2 and F2a for third trimester cervical ripening and induction of labour in comparison with placebo/no treatment or other vaginal prostaglandins (except misoprostol).
Methods
Criteria for considering studies for this review
Types of studies
Clinical trials comparing vaginal prostaglandins for cervical ripening or labour induction, with placebo/no treatment or where different formulations of vaginal prostaglandin (either PGE2 or PGF2a) are compared with each other; the trials included some form of random allocation to either group; and they report one or more of the pre‐stated outcomes.
Types of participants
Pregnant women due for third trimester induction of labour, carrying a viable fetus.
Types of interventions
Vaginal prostaglandins E2 and F2a compared with placebo/no treatment or other vaginal prostaglandins (except misoprostol).
Primary comparisons
-
Prostaglandin E2 versus placebo.
-
Prostaglandin F2a versus placebo.
-
Prostaglandin F2a versus prostaglandin E2.
-
Prostaglandin E2 gel versus prostaglandin E2 tablet.
-
Prostaglandin E2 gel versus prostaglandin E2 pessary/suppository.
-
Prostaglandin E2 tablet versus prostaglandin E2 pessary/suppository.
-
Prostaglandin E2 (sustained release) versus prostaglandin E2 (any vehicle).
-
Prostaglandin E2 (low dose) versus prostaglandin E2 (high dose).
Dose comparisons of PGE2 into 'low‐dose' and 'high‐dose' categories are made to compare two common clinical practices. 'Low dose': where the maximum possible dose in one arm of the trial protocol was up to 3 mg PGE2. 'High dose': where the maximum possible dose in one arm of the trial protocol was 3 mg PGE2 or more. It was thought that this division would separate those trials using, on the whole, a single or repeated dose protocol. In addition, division at this level allows the largest number of trials to be included in the comparison. Trials comparing doses that both fall into either the high‐ or low‐dose category were excluded.
Subgroup analyses and justifications
In addition to evaluating comparisons for all women entered into the randomised controlled trials, we subdivided the trial participants into four clinical subgroups. These divisions were made prior to examination of the trial data and were thought, by the review authors, to be clinically relevant.
-
Previous caesarean section or not.
-
Nulliparity or multiparity.
-
Membranes intact or ruptured.
-
Cervix favourable, unfavourable or undefined.
For the comparison prostaglandin E2 versus placebo, subgroup analysis on different vehicle comparisons were included because it was thought that it would not be correct to assume equal effects irrespective of method of application. The three subgroups that were compared to placebo were single‐dose PGE2, repeated dose of PGE2 and sustained release PGE2.
Trial setting
For the updates of the review from 2007, the setting (outpatient or inpatient) of induction of labour, is included. However, this issue is addressed specifically in other Cochrane reviews (Dowswell 2010; Kelly 2013a).
Types of outcome measures
Primary outcomes
Five primary outcomes were chosen as being most representative of the clinically important measures of effectiveness and complications:
(1) vaginal delivery not achieved within 24 hours (or period specified by trial authors);
(2) uterine hyperstimulation with fetal heart rate (FHR) changes;
(3) caesarean section;
(4) serious neonatal morbidity or perinatal death (e.g. seizures, birth asphyxia defined by trialists, neonatal encephalopathy, disability in childhood);
(5) serious maternal morbidity or death (e.g. uterine rupture, admission to intensive care unit, septicaemia).
Perinatal and maternal morbidity and mortality are infrequent and so composite outcomes have been used. This is not an ideal solution because some components of morbidity are clearly less severe than others and adverse events tend to cluster in individuals, so care is needed to count individuals rather than events. It is also possible for an intervention to cause more deaths but less severe morbidity, however, in the context of labour induction at term, this is unlikely. All of these events will be rare, and a modest change in their incidence will be easier to detect if composite outcomes are presented. The incidence of individual components where available will be explored as secondary outcomes (see below).
Secondary outcomes
Secondary outcomes relate to measures of effectiveness, complications and satisfaction.
Measures of effectiveness
(6) Cervix unfavourable/unchanged after 12 to 24 hours;
(7) oxytocin augmentation.
Complications
(8) Uterine hyperstimulation without FHR changes;
(9) uterine rupture;
(10) epidural analgesia;
(11) instrumental vaginal delivery;
(12) meconium‐stained liquor;
(13) Apgar score less than seven at five minutes;
(14) neonatal intensive care unit admission;
(15) neonatal encephalopathy;
(16) perinatal death;
(17) disability in childhood;
(18) maternal side‐effects (all);
(19) maternal nausea;
(20) maternal vomiting;
(21) maternal diarrhoea;
(22) other maternal side‐effects;
(23) postpartum haemorrhage (as defined by the trial authors);
(24) serious maternal complications (e.g. intensive care unit admission, septicaemia but excluding uterine rupture);
(25) maternal death.
Measures of satisfaction
(26) Woman not satisfied;
(27) caregiver not satisfied.
'Uterine rupture' will include all clinically significant ruptures of unscarred or scarred uteri. Asymptomatic scar dehiscence noted incidentally at the time of surgery will be excluded. Additional outcomes may appear in individual reviews. While all the above outcomes will be sought, only those with data will appear in the analysis tables.
The terminology of uterine hyperstimulation is problematic (Curtis 1987). In the reviews we will use the term 'uterine hyperstimulation without FHR changes' to include uterine tachysystole (more than five contractions per 10 minutes for at least 20 minutes) and uterine hypersystole/hypertonus (a contraction lasting at least two minutes) and 'uterine hyperstimulation with FHR changes' to denote uterine hyperstimulation syndrome (tachysystole or hypersystole with FHR changes such as persistent decelerations, tachycardia or decreased short‐term variability).
Outcomes will be included in the analysis: if reasonable measures were taken to minimise observer bias; and data were available for analysis according to original allocation.
In more recent reviews and updates, the following outcomes have been added:
(28) neonatal infection;
(29) neonatal antibiotics;
(30) chorioamnionitis;
(31) endometritis;
(32) maternal antibiotics.
Search methods for identification of studies
Electronic searches
We contacted the Trials Search Co‐ordinator to search the Cochrane Pregnancy and Childbirth Group’s Trials Register (1 March 2014)
The Cochrane Pregnancy and Childbirth Group’s Trials Register is maintained by the Trials Search Co‐ordinator and contains trials identified from:
-
monthly searches of the Cochrane Central Register of Controlled Trials (CENTRAL);
-
weekly searches of MEDLINE;
-
weekly searches of Embase;
-
handsearches of 30 journals and the proceedings of major conferences;
-
weekly current awareness alerts for a further 44 journals plus monthly BioMed Central email alerts.
Details of the search strategies for CENTRAL, MEDLINE and Embase, the list of handsearched journals and conference proceedings, and the list of journals reviewed via the current awareness service can be found in the ‘Specialized Register’ section within the editorial information about the Cochrane Pregnancy and Childbirth Group.
Trials identified through the searching activities described above are each assigned to a review topic (or topics). The Trials Search Co‐ordinator searches the register for each review using the topic list rather than keywords.
Searching other resources
We searched the reference lists of trial reports and reviews by hand.
We did not apply any language restrictions.
The original search was performed simultaneously for all reviews of methods of inducing labour, as outlined in the generic protocol for these reviews. Reviews have been updated individually, in accordance with the generic protocol (Hofmeyr 2009).
Data collection and analysis
For this review (and other linked induction of labour (IOL) methods reviews), the initial data extraction in 2000 was conducted and co‐ordinated by (Josephine Kavanagh (JK),Tony Kelly (TK) Jane Thomas (JT)) at the Clinical Effectiveness Support Unit (CESU) at the Royal College of Obstetricians and Gynaecologists, UK, in co‐operation with the Pregnancy and Childbirth Group of The Cochrane Collaboration. This process allowed the data extraction process to be standardised across all the reviews. For updates, the data extraction has been undertaken by authors of the individual review, for this update it was undertaken by JT and Anna Fairclough (AF).
The trials were initially reviewed on eligibility criteria, using a standardised form and the basic selection criteria specified. A standardised data extraction form was developed and then piloted for consistency and completeness. This pilot process involved the researchers at the CESU and the authors of the initial induction of labour series of reviews. For a description of the methods used to carry out the initial reviews, seeAppendix 1. For the methods used when assessing the trials identified in the previous version of this review, seeAppendix 2. For this update we used the following methods when assessing the reports identified by the updated search.
Selection of studies
For this update two review authors (JT and AF) independently assessed for inclusion all the potential studies identified as a result of the search strategy. We resolved any disagreement through discussion or, if required, we consulted another author (JK or TK).
Data extraction and management
For this update the same data extraction form was used to extract data. For eligible studies, JT and AF extracted the data using the agreed form. We resolved discrepancies through discussion or, if required, consulted the other authors (TK or JK). We entered data into Review Manager software (RevMan 2012) and checked for accuracy.
When information regarding any of the above was unclear, we contacted the authors of the original reports to provide further details.
Assessment of risk of bias in included studies
For this update two review authors (JT, AF) independently assessed the risk of bias for each study using the criteria outlined in theCochrane Handbook for Systematic Reviews of Interventions (Higgins 2011). We resolved any disagreement by discussion or by involving another author (JK or TK).
(1) Random sequence generation (checking for possible selection bias)
We described for each included study the method used to generate the allocation sequence in sufficient detail to allow an assessment of whether it should produce comparable groups.
We assessed the method as:
-
low risk of bias (any truly random process, e.g. random number table; computer random number generator);
-
high risk of bias (any non‐random process, e.g. odd or even date of birth; hospital or clinic record number);
-
unclear risk of bias.
(2) Allocation concealment (checking for possible selection bias)
We described for each included study the method used to conceal allocation to interventions prior to assignment and assessed whether intervention allocation could have been foreseen in advance of, or during recruitment, or changed after assignment.
We assessed the methods as:
-
low risk of bias (e.g. telephone or central randomisation; consecutively numbered sealed opaque envelopes);
-
high risk of bias (open random allocation; unsealed or non‐opaque envelopes, alternation; date of birth);
-
unclear risk of bias.
(3.1) Blinding of participants and personnel (checking for possible performance bias)
We described for each included study the methods used, if any, to blind study participants and personnel from knowledge of which intervention a participant received. We considered that studies were at low risk of bias if they were blinded, or if we judged that the lack of blinding unlikely to affect results. We assessed blinding separately for different outcomes or classes of outcomes.
We assessed the methods as:
-
low, high or unclear risk of bias for participants;
-
low, high or unclear risk of bias for personnel.
(3.2) Blinding of outcome assessment (checking for possible detection bias)
We described for each included study the methods used, if any, to blind outcome assessors from knowledge of which intervention a participant received. We assessed blinding separately for different outcomes or classes of outcomes.
We assessed methods used to blind outcome assessment as:
-
low, high or unclear risk of bias.
(4) Incomplete outcome data (checking for possible attrition bias due to the amount, nature and handling of incomplete outcome data)
We described for each included study, and for each outcome or class of outcomes, the completeness of data including attrition and exclusions from the analysis. We stated whether attrition and exclusions were reported and the numbers included in the analysis at each stage (compared with the total randomised participants), reasons for attrition or exclusion where reported, and whether missing data were balanced across groups or were related to outcomes. Where sufficient information was reported, or could be supplied by the trial authors, we planned to re‐include missing data in the analyses which we undertook.
We assessed methods as:
-
low risk of bias (e.g. no missing outcome data; missing outcome data balanced across groups);
-
high risk of bias (e.g. numbers or reasons for missing data imbalanced across groups; ‘as treated’ analysis done with substantial departure of intervention received from that assigned at randomisation);
-
unclear risk of bias.
(5) Selective reporting (checking for reporting bias)
We described for each included study how we investigated the possibility of selective outcome reporting bias and what we found.
We assessed the methods as:
-
low risk of bias (where it is clear that all of the study’s prespecified outcomes and all expected outcomes of interest to the review have been reported);
-
high risk of bias (where not all the study’s prespecified outcomes have been reported; one or more reported primary outcomes were not prespecified; outcomes of interest are reported incompletely and so cannot be used; study fails to include results of a key outcome that would have been expected to have been reported);
-
unclear risk of bias.
(6) Other bias (checking for bias due to problems not covered by (1) to (5) above)
We described for each included study any important concerns we had about other possible sources of bias.
(7) Overall risk of bias
We made explicit judgements about whether studies were at high risk of bias, according to the criteria given in the Handbook (Higgins 2011). With reference to (1) to (6) above, we planned to assess the likely magnitude and direction of the bias and whether we considered it is likely to impact on the findings. In future updates, we will explore the impact of the level of bias through undertaking sensitivity analyses ‐ seeSensitivity analysis.
Measures of treatment effect
Dichotomous data
For dichotomous data, we presented results as summary risk ratio with 95% confidence intervals.
Continuous data
No continuous data were analysed in this update (2013). In future updates, if continuous data are analysed, we will use the mean difference if outcomes are measured in the same way between trials. We will use the standardised mean difference to combine trials that measure the same outcome, but use different methods.
Unit of analysis issues
Cluster‐randomised trials
Cluster‐randomised trials are eligible for inclusion in the analyses along with individually randomised trials. None have currently been identified. If in future such trials are identified we will adjust their standard errors using the methods described in the Handbook (Higgins 2011), using an estimate of the intracluster correlation co‐efficient (ICC) derived from the trial (if possible), from a similar trial or from a study of a similar population. If ICCs from other sources are used, we will report this and conduct sensitivity analyses to investigate the effect of variation in the ICC. If both cluster‐randomised trials and individually‐randomised trials are identified, we plan to synthesise the relevant information. We will consider it reasonable to combine the results from both if there is little heterogeneity between the study designs and the interaction between the effect of intervention and the choice of randomisation unit is considered to be unlikely. We will also acknowledge heterogeneity in the randomisation unit and perform a sensitivity analysis to investigate the effects of the randomisation unit.
Cross‐over trials
Cross‐over trials are not eligible for inclusion.
Other unit of analysis issues
Trials in pregnancy and childbirth may include outcomes for multiple pregnancies, the generic protocol does not explicitly exclude multiple pregnancies, but the trials identified to date have included singleton pregnancies only. Trials with multiple pregnancy will be included but the outcomes relating to the babies will have to take account of clustering of events. As outlined in the Pregnancy and Childbirth Group Methodological Guidelines and the Handbook (Higgins 2011).
Some trials are multi‐arm studies, where this occurs only the intervention arms relevant to this review are included, where this occurs it is noted in the Included studies table.
Dealing with missing data
For included studies, we noted levels of attrition. We planned to explore the impact of including studies with high levels of missing data in the overall assessment of treatment effect by using sensitivity analysis.
For all outcomes, we carried out analyses, as far as possible, on an intention‐to‐treat basis, i.e. we attempted to include all participants randomised to each group in the analyses, and all participants were analysed in the group to which they were allocated, regardless of whether or not they received the allocated intervention. The denominator for each outcome in each trial was the number randomised minus any participants whose outcomes were known to be missing.
Assessment of heterogeneity
We assessed statistical heterogeneity in each meta‐analysis using the Tau², I² and Chi² statistics. We regarded heterogeneity as substantial if I² was greater than 50% and either Tau² was greater than zero, or there was a low P value (less than 0.10) in the Chi² test for heterogeneity.
Assessment of reporting biases
If there were 10 or more studies in the meta‐analysis we investigated reporting biases (such as publication bias) using funnel plots. We assessed funnel plot asymmetry visually.
Data synthesis
We carried out statistical analysis using the Review Manager software (RevMan 2012). We use fixed‐effect meta‐analysis for combining data where it was reasonable to assume that studies were estimating the same underlying treatment effect: i.e. where trials were examining the same intervention, and the trials’ populations and methods were judged sufficiently similar. If there was clinical heterogeneity sufficient to expect that the underlying treatment effects differed between trials, or if substantial statistical heterogeneity was detected, we used random‐effects meta‐analysis to produce an overall summary if an average treatment effect across trials was considered clinically meaningful. The random‐effects summary was treated as the average of the range of possible treatment effects and the clinical implications of treatment effects differing between trials are discussed. If the average treatment effect was not clinically meaningful we did not combine trials.
If we used random‐effects analyses, the results were presented as the average treatment effect with 95% confidence intervals, and the estimates of Tau² and I².
Subgroup analysis and investigation of heterogeneity
Where substantial heterogeneity was identified, we investigated it using subgroup analyses and sensitivity analyses. We considered whether an overall summary was meaningful, and if it was, we used random‐effects analysis to produce it.
The following subgroup analyses are included:
-
previous caesarean section or not;
-
nulliparity or multiparity;
-
membranes intact or ruptured;
-
cervix favourable, unfavourable or undefined.
The following outcomes are used in subgroup analysis:
-
vaginal delivery not achieved within 24 hours (or period specified by trial authors);
-
uterine hyperstimulation with fetal heart rate (FHR) changes;
-
caesarean section;
-
serious neonatal morbidity or perinatal death (e.g. seizures, birth asphyxia defined by trialists, neonatal encephalopathy, disability in childhood);
-
serious maternal morbidity or death (e.g. uterine rupture, admission to intensive care unit, septicaemia).
We assessed subgroup differences by interaction tests available within RevMan (RevMan 2012). We reported the results of subgroup analyses quoting the Chi² statistic and P value, and the interaction test I² value.
Sensitivity analysis
Sensitivity analyses were performed for aspects of the review that might affect the results, for example, where there is risk of bias associated with the quality of some of the included trials.
Results
Description of studies
Results of the search
In total, 116 studies were considered; 46 have been excluded, 70 randomised controlled trials with a total of 11,487 women have been included. For further details of study characteristics refer to Characteristics of included studies and Characteristics of excluded studies.
Trial setting
Most of the trials examined outcomes of induction of labour in an inpatient environment. Three trials examined outpatient‐based induction policies (Hage 1993; O'Brien 1995; Ohel 1996).
Included studies
1. Prostaglandin E2 (PGE2) versus placebo or no treatment
Thirty‐nine trials (with 6761 women) compare prostaglandin E2 (PGE2) versus placebo or no treatment (Al Malt 1995; Bezircioglu 2012; Buchanan 1984; Campbell 1984; Cardozo 1986; Chaterjee 1990; Chua 1995; Chung 1992; Curet 1989; Doany 1997; Dommisse 1980; Dunston‐Boone 1991; Egarter 1989; Graves 1985; Hage 1993; Hannah 1996; Hayashi 1983; Liggins 1979; MacKenzie 1979; MacKenzie 1981; Mahmood 1992; Mahmood 1995; McCaul 1997; Newman 1997; O'Brien 1995; Ohel 1996; Poornima 2011; Prasad 1989; Prins 1983; Rayburn 1988; Rayburn 1992; Roach 1997; Sawai 1991; Sawai 1994; Shoaib 1994; Thiery 1984; Ulmsten 1985; Witter 1992; Witter 1996). Two new trials (200 women) have been included in this comparison for this update (Bezircioglu 2012; Poornima 2011).
In most of these studies the comparison was to a placebo, but in 12 trials, the comparison was "expectant management" (no treatment with monitoring for maternal/fetal well being) (Bezircioglu 2012; Cardozo 1986; Egarter 1989; Hannah 1996; Mahmood 1992; Mahmood 1995; McCaul 1997; Newman 1997; Ohel 1996; Poornima 2011; Roach 1997; Shoaib 1994).
Fifteen trials of these trials used prostaglandin gel, the dose used ranged between 0.5 mg to 3 mg (Al Malt 1995; Chaterjee 1990; Graves 1985; Hannah 1996; Hayashi 1983; MacKenzie 1979; Mahmood 1992; Mahmood 1995; McCaul 1997; O'Brien 1995; Poornima 2011; Prins 1983; Rayburn 1988; Sawai 1991; Thiery 1984). In four trials prostaglandin tablets (3 mg or 4 mg) were used (Dommisse 1980; Egarter 1989; Ohel 1996; Shoaib 1994). In 17 trials, the prostaglandin preparation was described as a pessary, the dose given varied from 0.2 mg pessaries (given hourly) (Liggins 1979), a single 2 mg pessary (Doany 1997; Ulmsten 1985 ), repeat 2 mg pessaries (Sawai 1994), single 2.5 mg (MacKenzie 1981), single 3 mg pessaries (Buchanan 1984; Cardozo 1986; Chua 1995; Chung 1992; Curet 1989), repeat 3 mg pessaries (Campbell 1984; Roach 1997), to a single 10 mg from sustained release pessaries, which were used in five trials (Bezircioglu 2012; Dunston‐Boone 1991; Rayburn 1992; Witter 1992; Witter 1996). In one study the prostaglandin was given as a "film" and the dose was 8.5 mg (Prasad 1989).
In 18 studies a single dose of prostaglandin was used, (gel: Al Malt 1995; Chaterjee 1990; Graves 1985; Hayashi 1983; MacKenzie 1979; MacKenzie 1981; Poornima 2011; Prins 1983; Rayburn 1988; Thiery 1984; pessary: Buchanan 1984; Cardozo 1986; Chua 1995; Chung 1992; Curet 1989; Doany 1997; Ulmsten 1985; tablet: Dommisse 1980), and these trials used 2, 2.5 or 3 mg doses, except Poornima 2011 which used 0.5 mg and MacKenzie 1979 which used 5 mg.
Fifteen trials used repeated prostaglandin doses (gel: Hage 1993; Hannah 1996; Mahmood 1992; Mahmood 1995; McCaul 1997; O'Brien 1995; Sawai 1991; pessary: Campbell 1984; Liggins 1979; Roach 1997; Sawai 1994; tablet: Egarter 1989; Ohel 1996; Shoaib 1994); the formulation of PGE2 was unclear in one study: Newman 1997.
2. Prostaglandin F2a (PGF2a) with placebo
Four trials with 435 women compared prostaglandin F2a (PGF2a) with placebo (MacKenzie 1979; MacLennan 1979; MacLennan 1980; Murphy 1980).
3. Prostaglandin F2a versus prostaglandin E2
Two trials with 107 women compared PGF2a with PGE2 (MacKenzie 1979; Neilson 1983).
4. Prostaglandin E2 gel versus prostaglandin E2 tablet
Seven trials with 1086 women compared PGE2: gel (dose varied from 1 mg to 3 mg) with PGE2 tablets (3 mg tablets), single‐dose tablet (Al‐Sebai 1993; Greer 1990; Mahmood 1989; Murray 1995; Rath 1999, or repeat dose 3 mg tablets Payne 1993; Taher 2011). One new trial (Taher 2011) with 165 patients has been added to this section for this update.
5. Prostaglandin E2 gel versus prostaglandin E2 pessary/suppository
Two trials with 159 women compared different PGE2 preparations: gel with pessary or suppository (Perryman 1992; Smith 1990).
6. Prostaglandin E2 tablet versus prostaglandin E2 pessary/suppository
Three trials with 491 women compared PGE2 tablet with pessary/suppository (El‐Mardi 1991; McLaren 1987; Stampe Sorensen 1992).
7. Prostaglandin E2 (sustained release) versus prostaglandin E2 (any vehicle)
Sustained release PGE2 (SR) pessaries were compared with other PGE2 preparations in 13 trials involving 1436 women (Duhl 1997; El Shawarby 2006; Ferraiolo 2010, Glanville 2002; Green 1998; Kalkat 2008; Miller 1991; Mukhopadhyay 2002; Rabl 2002; Smith 1994; Tomlinson 2001, Triglia 2010; Zanconato 2011). In only one trial was the comparison with PGE2 tablet (Rabl 2002), in the remaining 12 trials the comparison was PGE2 gel and the dose varied from 1 mg to 3 mg. In one trial a single dose of PGE2 gel (Miller 1991) was used. The other studies used repeat doses. Three new trials with 333 women have been added to this section for this update (Ferraiolo 2010; Triglia 2010; Zanconato 2011).
8. Prostaglandin E2 (low dose) versus prostaglandin E2 (high dose)
Low dose PGE2 (less than 3 mg) versus high dose PGE2 (more than 3 mg) was compared in eight trials with 1615 women (Ferraiolo 2010; Green 1998: MacKenzie 1997a; McLaren 1987; Miller 1991; Payne 1993; Smith 1990; Tomlinson 2001). Seven of the trials used low dose PGE2 gel; in one trial a single tablet was used (McLaren 1987). The high‐dose comparison was a 10 mg sustained release pessary in four trials (Ferraiolo 2010; Green 1998; Miller 1991; Tomlinson 2001); two trials also used pessaries but in other doses (McLaren 1987; Smith 1990); one used repeat doses of PGE2 tablets (Payne 1993); and the other repeat PGE2 gel (MacKenzie 1997a). A trial previously included in this comparison has been removed in this update because in both arms of the trial women received a low dose (less than 3 mg of PGE2) and so it does not meet the inclusion criteria (Nuutila 1996).One new trial with 151 women has been included (Ferraiolo 2010).
Excluded studies
In 26 studies, primary outcome data were either not reported or extractable (Bamford 1992; Bex 1990; Castle 1983; Danna 1995; De Laat 1991; Dommisse 1981; Fusi 1989; Gordon‐Wright 1979; Greer 1986; Greer 1988; Knogler 1988; Krammer 1995; Lass 1994; Lindblad 1985; MacKenzie 1977; MacKenzie 1997b; MacKenzie 1988; Parker 1990; Ramsey 1998; Sadaty 1998; Sellers 1985; Sorokin 1992; Spitzberg 1991; Tan 1994; Toppozada 1992; Veligati 1998).
Six trials were excluded on grounds of eligibility. Four trials only reported on, or included data on, women undergoing induction of labour who had suffered an intrauterine death (Gauger 1991; Hill 1991; Lorenz 1984; Odum 1993). One study only examined induction in preterm pregnancies (Loria‐Casanova 1989). One study compared three different doses of PGF2a, which was not a prespecified intervention comparison (Tang 1997).
Fourteen trials were excluded that compared prostaglandin E2 with prostaglandin E2 at different doses. These trials were excluded as the dosages used were not comparable within the division made in the review into 'high‐dose' and 'low‐dose' categories (Carlan 1995; Granstrom 1995; Grunstein 1990; Hunter 1982; Hunter 1984; Hunter 1998; Norchi 1993; Seeras 1995; Smith 1996; Tan 1999; Toplis 1979; Varma 1984; Walker 1983; Zanini 1991).
Two studies were excluded because they were not randomised controlled trials (Nikolov 2003; Petrou 2011) and one was an economic analysis (Sorensen 2008).
Risk of bias in included studies
See Figure 1 and Figure 2 for summaries of 'Risk of bias' assessments.

'Risk of bias' graph: review authors' judgements about each risk of bias item presented as percentages across all included studies.

'Risk of bias' summary: review authors' judgements about each risk of bias item for each included study.
Allocation
Randomisation and allocation concealment (selection bias)
-
Fourteen trials employed central/pharmacy preparation of drugs in coded boxes or syringes (Chua 1995; Chung 1992; Curet 1989; Hannah 1996; Liggins 1979; McCaul 1997; Neilson 1983; O'Brien 1995; Perryman 1992; Prins 1983; Rayburn 1992; Smith 1990; Smith 1994; Witter 1996). The randomisation sequences were generated from computer‐generated lists or random number tables.
-
Thirty‐six trials were unclear on either the method of generation of the randomisation sequence, the method of allocation concealment or both (Al Malt 1995; Al‐Sebai 1993; Buchanan 1984; Chaterjee 1990; Doany 1997; Duhl 1997; Dunston‐Boone 1991; Egarter 1989; El‐Mardi 1991; El Shawarby 2006; Glanville 2002; Graves 1985; Green 1998; Greer 1990; Hage 1993; Hayashi 1983; Kalkat 2008; McLaren 1987; MacKenzie 1979; MacKenzie 1997a; MacKenzie 1981; Miller 1991; Mukhopadhyay 2002; Murphy 1980; Newman 1997; Prasad 1989; Rabl 2002; Rayburn 1988; Sawai 1991; Sawai 1994; Shoaib 1994; Stampe Sorensen 1992; Thiery 1984; Tomlinson 2001; Ulmsten 1985; Witter 1992).
-
Allocation by alternation was used in one trial (Campbell 1984), two trials allocated using the last digit of the hospital number (Cardozo 1986; Ohel 1996); one trial allocated depending on month of entry into the trial (Payne 1993); and one trial used "year of birth" with even years assigned to group A, odd to group B initially but changing this every five cases (Ferraiolo 2010).
Blinding
A double‐blind approach was used in 21 trials (Al Malt 1995; Buchanan 1984; Campbell 1984; Chaterjee 1990; Chua 1995; Chung 1992; Curet 1989; Doany 1997; Dunston‐Boone 1991; MacKenzie 1981; MacLennan 1979; Prasad 1989; Rayburn 1988; Rayburn 1992; Sawai 1991; Sawai 1994; Smith 1990; Thiery 1984; Ulmsten 1985; Witter 1992; Witter 1996).
Incomplete outcome data
Outcome data were incomplete in five trials (Cardozo 1986; Ferraiolo 2010; Rath 1999; Witter 1992; Witter 1996).
Selective reporting
Selective reporting bias was not assessed in the previous versions of this review. Time from induction to delivery is an important outcome. It is reported in numerous ways in different studies. The choice of endpoint and choice of summary measurement used is a potential source of bias. In this update seven randomised controlled trials have been added. The trials are mainly small single‐centre studies, from a variety of countries. Two trials reported information about trial registration (Taher 2011; Triglia 2010); for the other trials it has not been possible to establish changes and selective reporting of positive findings between protocol and publication. Two of the new studies have a greater risk of selective reporting as they used a variety measures to assess patient satisfaction (Ferraiolo 2010) and pain experienced in labour (average and percentage, repeated measures) (Zanconato 2011), a priori criteria for selecting these are not apparent.
Other potential sources of bias
Other potential sources of bias were not included in earlier versions of this review. Of the seven new trials included in this update only two reported the source of funding (MacLennan 1979; Taher 2011). Two trials included a statement "The authors report no conflicts of interest. The authors alone are responsible for the content and writing of the paper" (Triglia 2010; Zanconato 2011) and the other states under financial disclosure " the authors have no connection to any companies or products mentioned in this article" (Ferraiolo 2010). Generic names are used in four of the studies (Bezircioglu 2012; MacLennan 1979; Poornima 2011; Taher 2011). Three studies used proprietary names of the preparations (Ferraiolo 2010; Triglia 2010; Zanconato 2011) and in all of these the comparison was sustained release PGE2 (named as Propess by Ferring Pharmaceuticals) versus a vaginal gel. In one of these papers only the generic name of the vaginal gel was used (Triglia 2010). In Zanconato 2011 it is stated that 1 to 2 mg of vaginal PGE2 gel was used but the proprietary name given was"Prepidil", (Pharmacia Upjohn); this is the name of an intracervical preparation. In the third paper (Ferraiolo 2010), intravaginal gel is referred to, (named Prepidil) and the dose of prostaglandin given was 0.5 mg per 3 mg, which is typical of an intracervical preparation doses (Prepidil) and may be less effective than the usual dose given vaginally (making the sustained release preparations appear more effective).
Effects of interventions
See: Summary of findings for the main comparison PGE2 compared with placebo or no treatment for induction of labour at term (all women); Summary of findings 2 (4.1) PGE2 gel compared with PGE2 tablet (all women) for induction of labour at term; Summary of findings 3 (7.1) PGE2 (controlled release) compared with all PGE2 delivery systems (all women) for induction of labour at term
All the outcomes listed under Types of outcome measures and subgroups defined in Types of participants, were sought. Only those with data appear in the analysis tables.
Data discussed applies to the 'all women' group and, unless stated, there was no difference between any of the prespecified subgroups. This was formally examined by using subgroup interaction tests available within RevMan (RevMan 2012). The results are referred to within the text where relevant.
1. Vaginal prostaglandin E2 versus placebo/no treatment (39 trials, 6761 women)
Primary outcomes
Fifteen trials included some measurement of time from induction to delivery as an outcome but in only two trials (384 women) (Egarter 1989; Ulmsten 1985) is 'Vaginal delivery not achieved within 24 hours' reported in a suitable format to contribute data to this review. Of the trials reporting time from induction to delivery in a format that is not useable in the meta‐analysis, the largest trial (Hannah 1996) (2522 women) compared PGE2 gel with expectant management for women with ruptured membranes (ROM). The authors reported a reduction in the median time from ROM to delivery in the group given PGE2 compared to those in an expectant management. Of the two studies contributing data to this outcome, the larger study by Egarter 1989 (345 women), included both primiparae and multiparae, all with a favourable cervix (Bishop score (BS) > 4), intact membranes and the study used a higher dose of PGE2 (3 mg tablet). They found more women delivered within 24 hours with vaginal PGE2 compared with expectant management (up to 42 weeks' gestation) (12% of the PGE2 group versus 100% expectant management group were undelivered after 24 hours (risk ratio (RR) 0.12, 95% confidence interval (CI) 0.08 to 0.18). The smaller trial by Ulmsten (39 women) included only primiparae with an unfavourable cervix and used a single dose of 2 mg PGE2 suppository compared with a placebo. In this trial (Ulmsten 1985), 79% of the PGE2 group and 90% of the placebo group were undelivered after 24 hours (RR 0.88, 95% CI 0.67 to 1.15). Although both trials' findings are compatible with an increase in vaginal delivery within 24 hours, differences between the interventions used, comparisons groups and characteristics of the participants contribute to the marked heterogeneity observed when the results are combined (I² = 98%). Given the heterogeneity, it is reasonable not to combine these results in meta‐analysis, but if combined, a random‐effects model should be used; the CIs are wider and the difference does not reach statistical significance, (18.1% versus 98.9%, average RR 0.32, 95% CI 0.02 to 4.83, (heterogeneity: Tau² = 3.77; Chi² = 125.43, df = 1 (P < 0.00001); I² = 98%), two trials, 384 women, (test for subgroup differences: Chi² = 43.14, df = 1 (P < 0.00001), I² = 97.7%) (Analysis 1.1). Overall therefore, although not certain, it is likely that vaginal prostaglandin E2 compared with placebo or no treatment reduces the likelihood of vaginal delivery not being achieved within 24 hours.
'Uterine hyperstimulation with fetal heart rate (FHR) changes' was reported in 15 studies (Analysis 1.2). An increase in uterine hyperstimulation with FHR changes is seen in association with vaginal PGE2 (4.8% versus 1.0%, RR 3.16, 95% CI 1.67 to 5.98, 15 trials, 1359 women) in comparison with placebo. This RR is reduced compared to previous versions of this review (which was 4.4% versus 0.5%, RR 4.14, 95% CI 1.93 to 8.90), because of a small decrease in event rate in the PGE2 group and an increase event rate in the control group. Uterine hyperstimulation with FHR changes did not occur in either arms of four trials (Chua 1995; Dommisse 1980; O'Brien 1995; Sawai 1991) and is influenced by one trial (Rayburn 1992) where the estimate is a 30‐fold increase in hyperstimulation rates associated with FHR changes (based on 13 events in the PGE2 group and zero in the control group, 12.9% versus 0.0%, RR 30.44, 95% CI 1.83 to 505.65). The new trial (Bezircioglu 2012) had a higher event rate in both arms of the trial. The estimated rates of hyperstimulation with FHR changes seen in either the once only or repeated dose subgroups compared with placebo or no treatment are compatible with no difference between the groups (Analysis 1.2).
The caesarean section rate is lower in the PGE2 groups compared with placebo/expectant management, the estimates are compatible with no difference or a reduction of 10% or more in caesarean section (13.5% versus 14.8%, RR 0.91, 95% CI 0.81 to 1.02, 36 trials, 6599 women) (Analysis 1.3). This finding is mirrored when the data were considered by parity, membrane status or cervical favourability. There was no statistical heterogeneity, and the results were similar when only higher quality studies were considered.
Serious neonatal (Analysis 1.4) or maternal morbidity or death (Analysis 1.5) are rare events and there are insufficient data to make conclusions about the impact of PGE2 on this outcome.
Secondary outcomes
The risk of the cervix remaining unchanged/unfavourable after 12 to 24 hours is reduced with the use of vaginal prostaglandins when compared with placebo (18.9% versus 40.5%, average RR 0.41, 95% CI 0.27 to 0.65, heterogeneity: Tau² = 0.16; Chi² = 11.68, df = 5 (P = 0.04); I² = 57%, six trials, 567 women), test for subgroup differences: Chi² = 5.42, df = 2 (P = 0.07), I² = 63.1% (Analysis 1.6).
The use of oxytocin augmentation may be reduced if vaginal prostaglandins are used (39.0% versus 47.8%, average RR 0.81, 95% CI 0.63 to 1.05, heterogeneity: Tau² = 0.15; Chi² = 55.20, df = 12 (P < 0.00001); I² = 78%, 13 trials, 1421 women), test for subgroup differences: Chi² = 7.31, df = 2 (P = 0.03), I² = 72.6% (Analysis 1.7). Within the clinical subgroups, the reduction in the use of oxytocin augmentation is apparent in women with an unfavourable cervix (average RR 0.77, 95% CI 0.53 to 1.10, heterogeneity: Tau² = 0.20; Chi² = 27.80, df = 7 (P = 0.0002); I² = 75%. eight trials, 813 women) (Analysis 6.7); where repeated doses or sustained release preparations have been used, in women with a favourable cervix, no reduction is evident (43.7% versus 42.5%, average RR 1.00, 95% CI 0.66 to 1.51, heterogeneity: Tau² = 0.09; Chi² = 7.96, df = 2 (P = 0.02); I² = 75%, three trials, 443 women) (Analysis 7.5).
Overall, hyperstimulation without FHR changes is increased with PGE2 (1.4% versus 0.4%, RR 2.48, 95% CI 1.17 to 5.26, 13 trials, 3636 women), this effect is greatest in the sustained release subgroup (6.6% versus 0.0%, RR 7.85, 95% CI 1.05 to 58.82) (Analysis 1.8), (test for subgroup differences: Chi² = 2.20, df = 2 (P = 0.33), I² = 9.0%).
There was no increase in the use of epidural anaesthesia when prostaglandins were used (49.6% versus 45.5%, average RR 1.16, 95% CI 0.85 to 1.60, heterogeneity: Tau² = 0.15; Chi² = 50.62, df = 6 (P < 0.000001), I² = 88%, seven trials, 3555 women) (Analysis 1.10). One study (Shoaib 1994) reported a five‐fold increase in epidural rates. The trial compared active and conservative management for ruptured membranes at term. No difference was seen in this study between caesarean section rates or the need for instrumental delivery but the results on epidural use of this study contrast sharply with the other trials. When excluded from the analysis, there is no difference detected between the groups, (48% versus 47%, average RR 0.99, 95% CI 0.87 to 1.12, heterogeneity: Tau² = 0.01; Chi² = 6.85, df = 5 (P = 0.23); I² = 27%). This study also impacts in the analysis of the clinical subgroup of women with ruptured membranes (Analysis 5.5), again when removed the heterogeneity is reduced.
There was no evidence on an effect of instrumental vaginal delivery. Meconium‐stained liquor was less likely if induction was undertaken with vaginal prostaglandins (8.5% versus 10.5%, RR 0.82, 95% CI 0.68 to 0.98, 12 trials, 4245 women) (Analysis 1.12).
There was no evidence of a difference between the two groups in Apgar score less than seven at five minutes (2.2% versus 1.7%, RR 1.28, 95% CI 0.86 to 1.92, 16 trials, 4481 women), (test for subgroup differences: Chi² = 8.05, df = 2 (P = 0.02), I² = 75.2%) (Analysis 1.13) and neonatal intensive care unit admission (8.8% versus 9.4%, RR 0.94, 95% CI 0.78 to 1.14, 12 trials, 4022 women) (Analysis 1.14). Apgar score less than seven at five minutes was not a common event and only 88 cases were reported in the 4481 patients, so the trials may be too small to detect a difference if one exists.
Maternal side‐effects were not increased with the use of vaginal prostaglandins. The rate of postpartum haemorrhage was increased with the use of prostaglandins (4.1% versus 2.8%, RR 1.47, 95% CI 1.04 to 2.09, nine trials, 3537 women) (Analysis 1.21), the majority of this result is as a result of the increase seen in one study that compared active versus conservative management of ruptured membranes (Hannah 1996).
Two studies looked at maternal satisfaction with mode of induction (Cardozo 1986; Hannah 1996). In both trials a policy of active induction was compared with expectant management, but the indications for induction were different. In the Cardozo trial, women at 40 + 10 days gestation were offered induction within two to four days or expectant management until labour started spontaneously or monitoring raised concern about either fetal or maternal well being; this could be many days or weeks. Allocation was based on odd or even last digit of hospital number, mothers who did not like their assigned group could request the alternative treatment group. The Hannah trial included women with prelabour rupture of the membranes, expectant management lasted a maximum of four days. The results of the two trials are different, but the larger trial, which is a better quality study with 2520 women (Hannah 1996), has fewer women who are unsatisfied in the PGE2 group. Overall, women were less satisfied with a policy of expectant management (6.4% versus 11.5%, average RR 0.76, 95% CI 0.24 to 2.40, heterogeneity: Tau² = 0.64; Chi² = 14.99, df = 1 (P = 0.0001); I² = 93%, test for subgroup differences: Chi² = 14.97, df = 1 (P = 0.0001), I² = 93.3%, two trials, 2922 women) (Analysis 1.23).
There were insufficient data to draw any meaningful conclusions for the remaining outcomes (uterine rupture, neonatal encephalopathy, disability in childhood, perinatal death, postpartum haemorrhage, serious maternal complications or caregiver not satisfied).
2. Vaginal prostaglandin F2a versus placebo (four trials, 435 women)
Three trials included length of labour as an outcome but vaginal delivery not achieved in 24 hours was not reported in a useable format. Uterine hyperstimulation with FHR changes were reported in one small trial of 32 participants, so the effects are uncertain (Analysis 8.1). Caesarean section rates in the trials are lower than are currently found in many countries. The caesarean section rates in the PGF2a group compared with placebo are reduced, this reduction does not reach statistical significance (5.7% versus 9.7%, RR 0.59, 95% CI 0.31 to 1.14, four trials, 467 women) (Analysis 8.2). Instrumental vaginal delivery rates are significantly lower but the rates of operative vaginal delivery are higher than would now be usual in most settings (23.7% versus 37.6%, RR 0.63, 95% CI 0.47 to 0.84, three trials, 435 women) Analysis 8.6. Cervical scores were less likely to be unchanged (12.0% versus 54.2%, RR 0.20, 95% CI 0.11 to 0.37, two trials, 170 women) (MacLennan 1979; MacLennan 1980) (Analysis 8.3). Oxytocin augmentation appeared to be reduced with the use of PGF2a but this does not reach statistical significance (44.0% versus 78.0%, RR 0.59, 95% CI 0.32 to 1.07, three trials, 202 women) (Analysis 8.4), and epidural analgesia (23.1% versus 33.3%, RR 0.74, 95% CI 0.56 to 0.97, four trials, 467 women) (Analysis 8.5).
3. Prostaglandin F2a versus prostaglandin E2 (two trials, 107 women)
Overall, there are insufficient data to make any meaningful conclusions (Analysis 11.1; Analysis 11.2; Analysis 11.3). One trial (MacKenzie 1979) showed a significant increase in the need for oxytocin augmentation with the use of PGF2a (87.5% versus 37.5%, RR 2.33, 95% CI 1.21 to 4.51, one trial, 32 women) (Analysis 11.4), but the numbers in this trial are small (16 in each arm), hence the results must be interpreted with caution. There is no evidence of any difference between any of the other reported outcomes.
4. Prostaglandin E2 gel versus prostaglandin E2 tablet (seven trials, 1086 women)
Primary outcomes
There is no evidence of a difference in vaginal delivery rates not achieved in 24 hours (37.0% versus 36.9%, RR 1.03, 95% CI 0.84 to 1.26, three trials, 566 women) (Analysis 14.1). There is no evidence of a difference between gel or tablet regarding uterine hyperstimulation with FHR changes (0.5% versus 1.0%, RR 2.00, 95% CI 0.18 to 21.71, one trial, 200 women) (Analysis 14.2), or caesarean section rates (17.9% versus 19.8%, RR 0.91, 95% CI 0.72 to 1.17, six trials 1046 women) (Analysis 14.3). There are insufficient data to make any conclusions regarding serious maternal morbidity or death.
Secondary outcomes
There is no evidence of a difference between the rates of cervix remaining unfavourable/unchanged at 24 to 48 hours (44.5% versus 51.4%, RR 0.87, 95% CI 0.70 to 1.07, two trials, 365 women) (Murray 1995; Taher 2011) (Analysis 14.5) or in the use of oxytocin augmentation (50.4% versus 58.4%, heterogeneity: Chi² = 12.47, df = 5 (P = 0.03); I² = 60%, six trials, 742 women) (Analysis 14.6). The reduction in oxytocin use with PGE2 gel found in Mahmood 1989 study is not replicated in the other studies. There was no evidence of a difference in epidural use (61.6% versus 56.4%, RR 1.07, 95% CI 0.95 to 1.21, three trials, 565 women) (Analysis 14.7). The findings for instrumental vaginal delivery rates are compatible with a reduction in instrumental delivery, this could be a small difference or a significant reduction of 23% or more (22.5% versus 28.7%, RR 0.77, 95% CI 0.58 to 1.02, three trials, 565 women) (Analysis 14.8); this effect reduction is not seen in the clinical subgroups (Analysis 18.8, Analysis 17.8, Analysis 15.8). The rates of postpartum haemorrhage between the two groups are similar (25.5% versus 27.5%, RR 0.89, 95% CI 0.71 to 1.11, three trials, 445 women) (Analysis 14.12). Except for instrumental vaginal delivery the effects are consistent across clinical groups. One trial reported on neonatal intensive care admissions, there was no difference between the groups but there were insufficient data to make any conclusions regarding neonatal outcomes.
5. Prostaglandin E2 gel versus prostaglandin E2 pessary/suppository (two trials, 159 women)
Primary outcomes
There were no data available regarding vaginal delivery not achieved in 24 hours. A reduction in hyperstimulation with FHR changes was seen in association with PGE2 gel use in comparison with PGE2 pessaries (1.3% versus 11.2%, RR 0.16, 95% CI 0.03 to 0.87, two trials, 159 women) (Perryman 1992; Smith 1990) (Analysis 20.1). The dose used in both arms of one trial (Perryman 1992) was 5 mg of PGE2, which is much higher than commonly used as a single dose. The other trial (Smith 1990) compared 2.5 mg PGE2 gel with a vaginal 'chip' containing 3 mg to 3.5 mg of PGE2. For these reasons, these results should be interpreted with caution. There was no evidence that caesarean section rates differed between the two delivery systems (20.3% versus 31.3%, RR 0.65, 95% CI 0.38 to 1.11, two trials, 159 women) (Analysis 21.2).
Secondary outcomes
Uterine hyperstimulation rates without FHR changes were not different between gel and pessary groups in the one trial reporting this outcome (Perryman 1992) (0.0% versus 4.4%, RR 0.20, 95% CI 0.01 to 4.05, one trial, 90 women) (Analysis 20.3). There was no evidence of a difference between maternal side‐effects or Apgar scores less than seven at five minutes.
6. Prostaglandin E2 tablet versus prostaglandin E2 pessary/suppository (three trials, 491 women)
Primary outcomes
No evidence of a difference was seen between caesarean section rates between tablet and pessary (9.3% versus 8.1%, RR 1.13, 95% CI 0.64 to 1.99, three trials, 491 women) (Analysis 22.1). No data were available regarding vaginal delivery not achieved in 24 hours.
Secondary outcomes
There was no difference detected in the proportion of women needing oxytocin augmentation between tablet and pessary groups (25.9% versus 35.2%, average RR 0.66, 95% CI 0.31 to 1.40, heterogeneity: Tau² = 0.33; Chi² = 9.31, df = 2 (P = 0.010); I² = 79%, three trials, 491 women) (Analysis 22.2). Marked heterogeneity between the three trials was seen (El‐Mardi 1991; McLaren 1987; Stampe Sorensen 1992) even though all three trials used single applications of PGE2 with similar doses of each medication.
Insufficient data were available to comment on uterine hyperstimulation without FHR changes, epidural usage or maternal side‐effects. Instrumental vaginal delivery rates were increased with the use of PGE2 tablets (17.8% versus 10.2%, RR 1.72, 95% CI 1.09 to 2.70, three trials, 491 women) (Analysis 22.5). Postpartum haemorrhage and Apgar scores less than seven at five minutes showed no evidence of a difference.
7. Prostaglandin E2 (sustained release) versus prostaglandin E2 (any vehicle) (13 trials, 1436 women)
Primary outcomes
There is no evidence of a difference between vaginal delivery not achieved in 24 hours (43.1% versus 37.3%, RR 1.15, 95% CI 0.92 to 1.45, three trials, 450 women) (Analysis 26.1). The outcome uterine hyperstimulation rates with FHR changes was reported by five trials and no difference was detected (4.9% versus 2.2%, RR 2.15, 95% CI 0.89 to 5.21, five trials, 643 women) (Analysis 26.2), however, in two of these trials there were no events reported in either arm (El Shawarby 2006; Triglia 2010). In the three remaining trials there was an increase in events in the controlled release arms of the trials but this increase was greatest in the Smith 1994 trial. Caesarean section rates are not different between the two groups (20.4% versus 20.1%, RR 1.02, 95% CI 0.82 to 1.26, 11 trials, 1262 women) (Analysis 26.3). Serious neonatal morbidity or mortality was reported in two trials that included 320 women, poor neonatal outcomes were infrequent so these studies are too small to detect any difference that might exist, and there was a single event in the other PGE2 arm, which may be due to chance (Analysis 26.4). This is also true of maternal morbidity and mortality.
Secondary outcomes
PGE2 controlled release pessaries were associated with a reduction in the likelihood that the cervix would remain unfavourable or unchanged (RR 0.61, 95% CI 0.46 to 0.80, two trials, 271 women) (Analysis 26.6). This is also the finding for the single trial that reported on this in the subgroup of women with unfavourable cervix (RR 0.60, 95% CI 0.45 to 0.80, one trial 151 women) (Analysis 29.6). There is no evidence of a difference in the use of oxytocin augmentation (35.0% versus 40.4%, average RR 0.88, 95% CI 0.69 to 1.13, heterogeneity: Tau² = 0.06; Chi² = 15.04, df = 6 (P = 0.02); I² = 60% seven trials, 884 women) (Analysis 26.7). This heterogeneity is caused by just one trial (Smith 1994) and when this trial is removed, there is no difference in oxytocin augmentation and the heterogeneity is reduced (average RR 1.01 95% CI 0.89 to 1.15, heterogeneity: Tau² = 0.00; Chi² = 4.37, df = 5 (P = 0.50); I² = 0%, six trials, 763 women). The Smith 1994 study reported a large reduction in oxytocin use with the sustained release pessary. The Smith 1994 study may differ from others within the group in that they used oxytocin augmentation at 12 hours after the onset of the induction process in both groups. There is also an imbalance in gestational age between the two groups which may have arisen by chance or may reflect bias in the study's methodology. The sustained release insert group has a higher gestational age which may allow potentially for a more straightforward induction process, hence explaining the greater reduction in the use of oxytocin for augmentation in the insert group. The same study reported a reduction in oxytocin use in multiparous women (RR 0.41, 95% CI 0.20 to 0.86, one trial, 66 women) (Analysis 28.4). No difference was detected in the subgroup of women with an unfavourable cervix (average RR 0.81, 95% CI 0.54 to 1.21, heterogeneity: Tau² = 0.14; Chi² = 15.50, df = 4 (P = 0.004); I² = 74%, five trials, 564 women) (Analysis 29.7).
The rate of uterine hyperstimulation rates without FHR changes may be higher in the sustained release group; the event is infrequent and this does not reach statistical significance (4.2% versus 2.4%, RR 1.59, 95% CI 0.81 to 3.14, eight trials, 908 women) (Analysis 26.8). There is a reduction in instrumental delivery rates associated with the use of the vaginal insert (8.8% versus 18.8%, RR 0.47, 95% CI 0.32 to 0.68, six trials, 791 women) (Analysis 26.11). This effect seems to be greater in the clinical subgroup of women with an unfavourable cervix (7.4% versus 22.0%, RR 0.34, 95% CI 0.20 to 0.59, three trials, 402 women) (Analysis 29.11). There was no evidence of any significant heterogeneity within these results (as compared to those when examining rates of oxytocin augmentation). There were insufficient data regarding neonatal outcomes to draw any conclusions.
8. Prostaglandin E2 (low dose) versus prostaglandin E2 high dose (eight trials, 1615 women)
Primary outcomes
A reduction in hyperstimulation with FHR changes is seen in association with low‐dose regimens (Smith 1990), but this is a small trial and the reduction does not reach statistical significance (2.9% versus 20.0%, RR 0.15, 95% CI 0.02 to 1.13, one trial, 69 women) (Analysis 30.1). The trial (Smith 1990) used a 3 mg to 3.5 mg pessary in the high‐dose arm. Caesarean section rates do not appear to be different between the two groups (12.1% versus 12.1%, RR 1.02, 95% CI 0.78 to 1.33, seven trials, 1546 women) (Analysis 30.2). There were no neonatal deaths or cases of serious neonatal morbidity in the one trial reporting this outcome (MacKenzie 1997a). No data were available regarding vaginal delivery not achieved in 24 hours.
Secondary outcomes
One trial reported on the cervix being unchanged/unfavourable after 12 to 24 hours; this was significantly more likely in the low‐dose group (RR 1.66, 95% CI 1.25 to 2.21, one trial, 151 women) (Analysis 30.4) (Ferraiolo 2010); this study included only primiparous women so this is the effect in this clinical subgroup (Analysis 31.3). In the all women group, overall no evidence of a difference in the use of oxytocin augmentation between the two groups is apparent (47% versus 45%, average RR 0.96, 95% CI 0.77 to 1.20, heterogeneity: Tau² = 0.03; Chi² = 10.47, df = 4 (P = 0.03); I² = 62%, five trials, 1370 women) (Analysis 30.5). However, there is marked heterogeneity between the trials. The heterogeneity in this group is reduced (I² = 0) when the MacKenzie 1997a is excluded, however, this is the only trial to compare the same preparation of PGE2 at different doses (one dose of 2 mg PGE2 gel versus two doses 2 mg PGE2 gel). The other studies compared different PGE2 formulations and doses. MacKenzie 1997a is also the largest study (955 of 1370 women in the meta‐analysis are from this study) and methodologically it has a lower likelihood of bias in comparison to the other studies (Figure 2). MacKenzie 1997a found that oxytocin use was increased when lower doses of PGE2 were used, this effect is mainly in one clinical subgroup ‐ multiparous women, oxytocin use in this group was almost double if the low‐dose regimen was used compared to the high dose (30.5% versus 15.7%, RR 1.94, 95% CI 1.35 to 2.80, one trial, 456 women) (Analysis 32.3). In primiparous women there was no difference detected (RR 1.05, 95% CI 0.93 to 1.18, two studies, 650 women) (Analysis 31.4).
There was no difference in the following outcomes between low and high doses: Uterine hyperstimulation without FHR changes (Analysis 30.6); epidural analgesia use (Analysis 30.7), instrumental vaginal delivery rates (17.3% versus 19.5%, RR 0.89, 95% CI 0.70 to 1.13, three trials, 1179 women) (Analysis 30.8), meconium‐stained liquor (Analysis 30.9), Apgar score less than seven at five minutes (Analysis 30.10), neonatal intensive care unit admission (Analysis 30.11), maternal side‐effects (Analysis 30.13) or postpartum haemorrhage (Analysis 30.18). However, in the clinical subgroup of multiparae, instrumental delivery rates were increased (5.7% versus 1.0%, RR 5.98, 95% CI 1.37 to 25.99, one trial, 456 women) (Analysis 32.5).
Discussion
Summary of main results
PGE2 versus placebo
Prostaglandins are probably effective at inducing labour: they probably increase the likelihood of delivery within 24 hours (although this does not reach statistical significance in the meta‐analysis), they increase uterine hyperstimulation with fetal heart rate changes, have no effect or may reduce the risk of caesarean section, but there is an absence of evidence on the overall effect on improving maternal and fetal outcomes (across a variety of measures). The reporting of maternal and fetal morbidity is very limited. Induction of labour is a common procedure so even small differences in effects could be important.
Vehicle comparisons
It is not possible to detect a difference in the effectiveness between the gel or tablet forms of PGE2 or between the sustained release pessaries and PGE2 gel/tablets. This is not that surprising as differences between different formulations of the same drug are likely to be small and so the trials in this review may be underpowered to detect such differences if they exist. However, because induction of labour is a frequently used intervention, even small differences could be important.
Dose comparisons
It is not possible to demonstrate a difference in outcomes between low‐ and high‐dose regimens. Accepting the problems with the arbitrary division made in this review, there is no evidence of an advantage of a higher‐dose regimen.
Overall completeness and applicability of evidence
There are numerous trials examining the efficacy of various vaginal prostaglandin (E2) preparations. However, data on the effect of these on important outcomes are limited. There is a particular paucity of comparable data on time in labour/to delivery, and evidence of maternal and neonatal benefits and harms. The evidence is relevant to current clinical practice, and to the one in five pregnant women who undergo induction of labour, because vaginal prostaglandins are the main induction methods recommended in clinical practice guidelines (NICE 2008).
Quality of the evidence
Sensitivity analysis
We attempted to quantify the impact of inadequate or unclear randomisation and/or concealment within the review. The effect of including only those trials with adequate methodology was highlighted in the results. Lower‐quality factors appeared to be responsible for significant heterogeneity in two main areas of the review (caesarean section rates and oxytocin augmentation regarding PGE2 versus placebo), but in neither case was the overall result altered.
Due to the number of agent comparisons in this review and the small number of trials in each group, a more detailed analysis of the impact of trial quality on the results in the other sections of the review could not be undertaken.
Publication bias
We attempted to examine the effect of possible publication bias in this review and its impact on the five primary outcomes. Due to the restriction in data on vaginal delivery rates not achieved in 24 hours and the small amount of data available on serious maternal and neonatal morbidity and mortality, the calculations have been restricted to hyperstimulation rates with fetal heart rate changes and caesarean section. Examination of a standard funnel plot reveals no graphical evidence of publication bias within this review for the two examined outcomes, although the plot does become asymmetrical when only studies of adequate quality are included when examining caesarean section.
Further analysis of publication bias on secondary outcomes was limited to comparisons where more than 10 trials were present. There was evidence of asymmetry within the plot for Apgar score less than seven at five minutes when comparing PGE2 to placebo (Figure 3). However, there was no evidence of similar asymmetry seen for other similar neonatal outcomes.

Funnel plot of comparison: 1 (1.1) PGE2 (all regimens) vs placebo/no treatment (all women), outcome: 1.13 Apgar score < 7 at 5 minutes.
Potential biases in the review process
The review includes a measurement of time to delivery (percentage not delivered in 24 hours), although most studies included time to delivery as an outcome, the data are not provided in a way that is usable in this review. The review has five primary outcomes and up to 26 secondary outcomes have been included, so by chance alone we should have at least one significant finding.
Agreements and disagreements with other studies or reviews
Other Cochrane reviews: There are 43 reviews on induction of labour in The Cochrane Library. This review is one in a series of 27 reviews on methods of induction of labour. Four of these linked reviews compare prostaglandins (PGE2/PGF2a) given by alternate routes (intracervical PG (Boulvain 2008), extra‐amniotic PG (Hutton 2001), intravenous PG (Luckas 2000), oral PG (French 2001)) and a further three evaluate misoprostol, a prostaglandin E1 analogue (vaginal misoprostol (Hofmeyr 2010), oral misoprostol (Alfirevic 2014), buccal or sublingual misoprostol (Muzonzini 2004)). Overall, these agents seem to be effective at inducing labour, vaginal delivery within 24 hours is more likely when they are used. In contrast to this review's conclusions, women in trials comparing intracervical PGE2 with placebo were significantly more likely to deliver within 24 hours (Boulvain 2008), and when intracervical and vaginal PGE2 are compared, the findings favour vaginal PGE2. The other reviews include other commonly used interventions that are often used in conjunction with prostaglandins for induction of labour (such as intravenous oxytocin (Alfirevic 2009), amniotomy (Bricker 2000), oxytocin and amniotomy combined (Howarth 2001)).
Two reviews evaluate induction of labour setting ‐ comparing methods of induction of labour in an outpatient setting. Dowswell 2010 includes five trials, also included in this review, but the outcomes considered important differ between the reviews; where the same outcome is considered the findings are consistent. The studies included in outpatient versus inpatient induction (Kelly 2013a) and morning versus evening induction (Bakker 2013) do not overlap with studies in this review because the method of induction is consistent between the groups, but the setting/timing is varied.
Of the 13 reviews on specific indications for induction of labour, reviews comparing induction of labour with expectant management beyond 40 weeks and with ruptured membranes potentially overlap with this review although the outcomes assessed may differ (Dare 2009; Gülmezoglu 2012). Jozwiak 2012a considers methods of induction of labour for women who have had a previous caesarean section, currently none of trials included in that review are eligible for this review, but there is potential for overlap.
Finally searching PROSPERO and Pubmed for reviews including induction of labour using vaginal prostaglandins identified two further non‐Cochrane systematic reviews. A review of reviews on methods of induction of labour by Mozurkewich 2011 summarises the findings of the 27 linked Cochrane reviews and as such, for vaginal prostaglandins its findings are based on the previous version of this review (Kelly 2009). Facchinetti 2012 compares sustained release vaginal PGE2 with repeat PGE2 (both vaginal or intracervical), specifically in a subgroup of women having their first baby, with an unfavourable cervix (Bishop score (BS) < 5) and with intact membranes. Their primary outcome is caesarean section, and although 18 trials are identified, 11 of these are excluded (reasons given included results not stratified into multips/primips, BS > 4, rupture of membranes). In the current version of this review, 13 trials are included in the comparison sustained release vaginal PGE2 versus vaginal PGE2 gel or tablet, 11 of these report caesarean section as an outcome and overall, no difference is detected (Analysis 26.3). Eight trials specify women with an unfavourable cervix and again no difference was detected (Analysis 29.3). If only primips with an unfavourable cervix (five trials) were included, again no difference is found (analysis done but not included for this update as not a prespecified subgroup) and finally the subgroup of women having their first baby, who have an unfavourable cervix and intact membranes, no difference is detected (four trials included) (analysis not included here as not a prespecified subgroup). The same four studies are included in the Facchinetti 2012 review, but two studies using intracervical PGE2 are also included in the meta‐analysis. These trials were not eligible for this review and were excluded from Boulvain 2008 review, both favour sustained release preparations and give 40% of the weight to the result, which is in favour of SR pessaries. Boulvain 2008 identified 29 trials comparing intracervical PGE2 versus vaginal PGE2 (not stratified into gel, tablet, sustained release), so there would appear to be 42 potentially eligible trials, yet Franchetti identified only 18 studies; this is a potential source of bias. In addition, the inclusion/exclusion criteria are not consistently expressed. The review acknowledges sponsorship by Ferring (makers of a sustained release preparation).
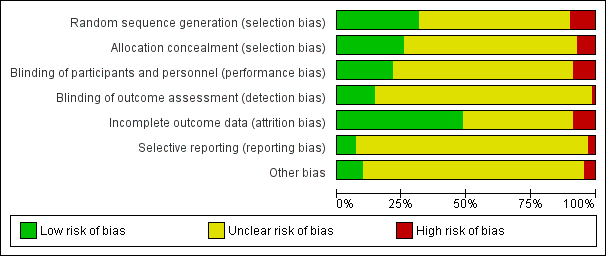
'Risk of bias' graph: review authors' judgements about each risk of bias item presented as percentages across all included studies.
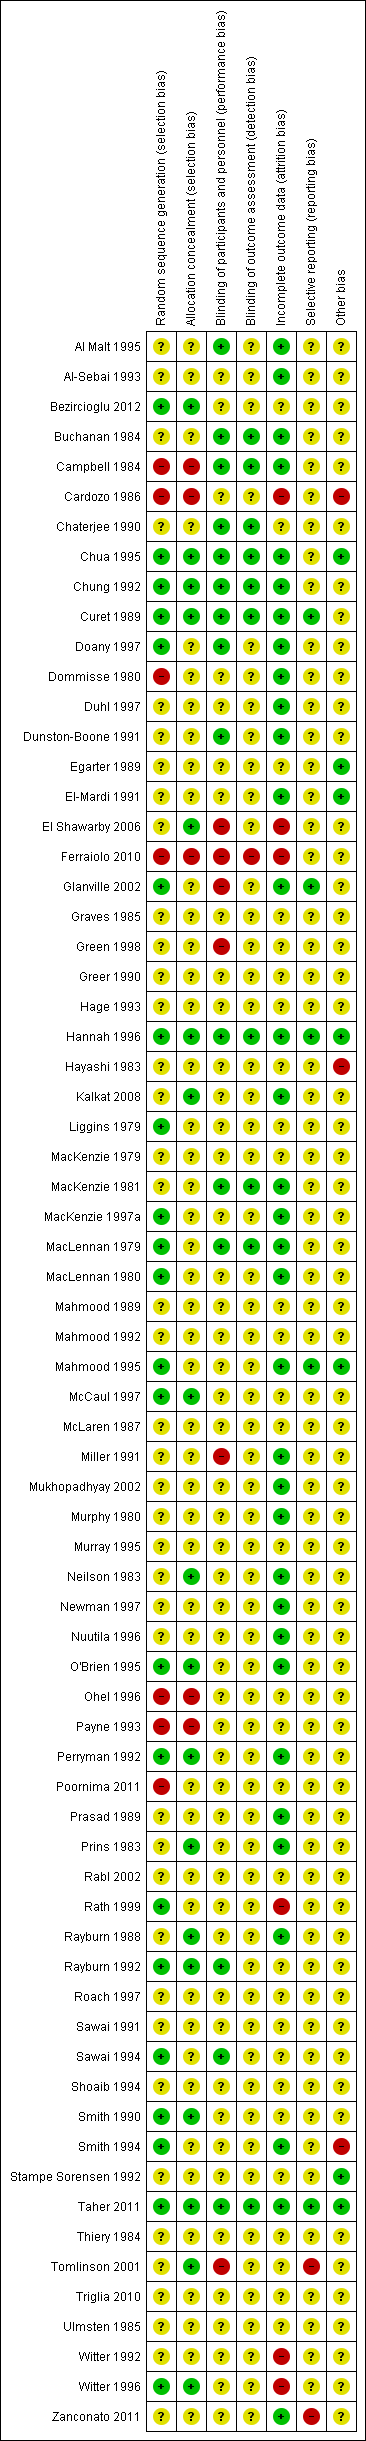
'Risk of bias' summary: review authors' judgements about each risk of bias item for each included study.

Funnel plot of comparison: 1 (1.1) PGE2 (all regimens) vs placebo/no treatment (all women), outcome: 1.13 Apgar score < 7 at 5 minutes.
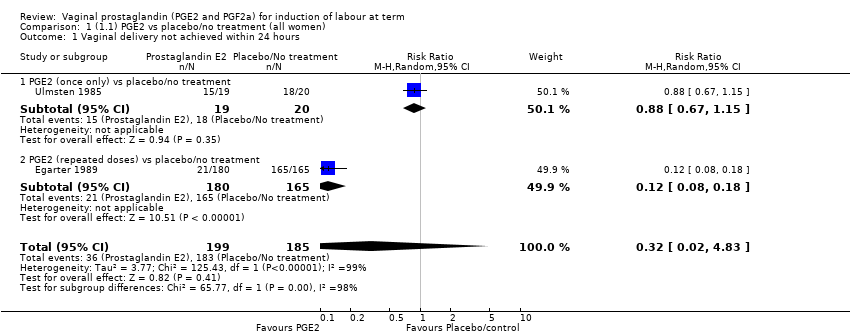
Comparison 1 (1.1) PGE2 vs placebo/no treatment (all women), Outcome 1 Vaginal delivery not achieved within 24 hours.

Comparison 1 (1.1) PGE2 vs placebo/no treatment (all women), Outcome 2 Uterine hyperstimulation with FHR changes.
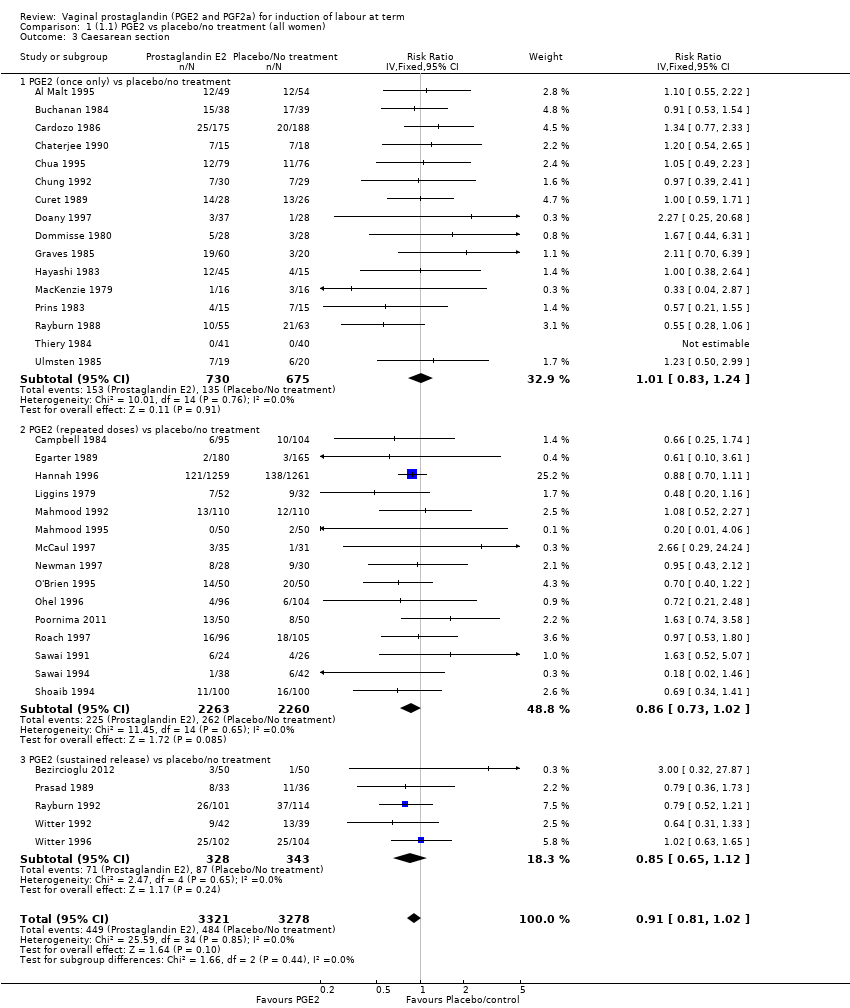
Comparison 1 (1.1) PGE2 vs placebo/no treatment (all women), Outcome 3 Caesarean section.

Comparison 1 (1.1) PGE2 vs placebo/no treatment (all women), Outcome 4 Serious neonatal morbidity or perinatal death.
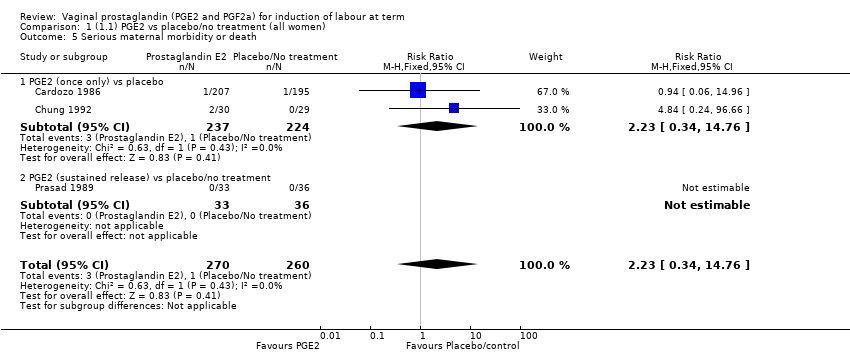
Comparison 1 (1.1) PGE2 vs placebo/no treatment (all women), Outcome 5 Serious maternal morbidity or death.

Comparison 1 (1.1) PGE2 vs placebo/no treatment (all women), Outcome 6 Cervix unfavourable/unchanged after 12 to 24 hours.

Comparison 1 (1.1) PGE2 vs placebo/no treatment (all women), Outcome 7 Oxytocin augmentation.
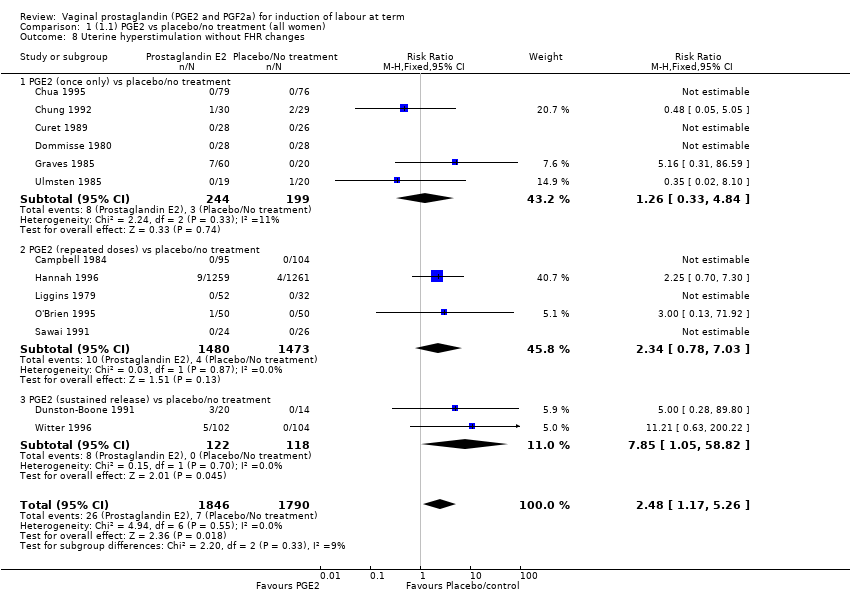
Comparison 1 (1.1) PGE2 vs placebo/no treatment (all women), Outcome 8 Uterine hyperstimulation without FHR changes.
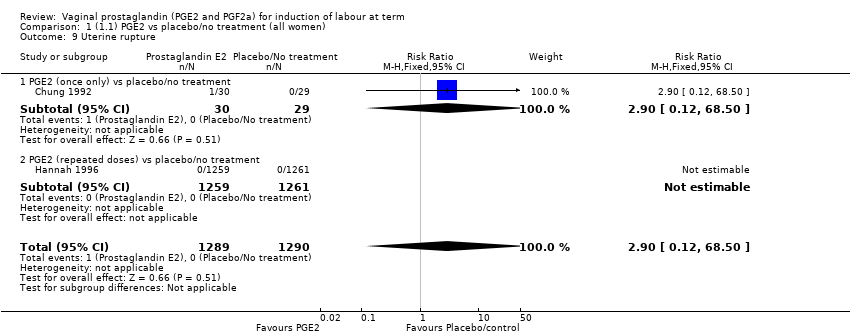
Comparison 1 (1.1) PGE2 vs placebo/no treatment (all women), Outcome 9 Uterine rupture.

Comparison 1 (1.1) PGE2 vs placebo/no treatment (all women), Outcome 10 Epidural analgesia.

Comparison 1 (1.1) PGE2 vs placebo/no treatment (all women), Outcome 11 Instrumental vaginal delivery.
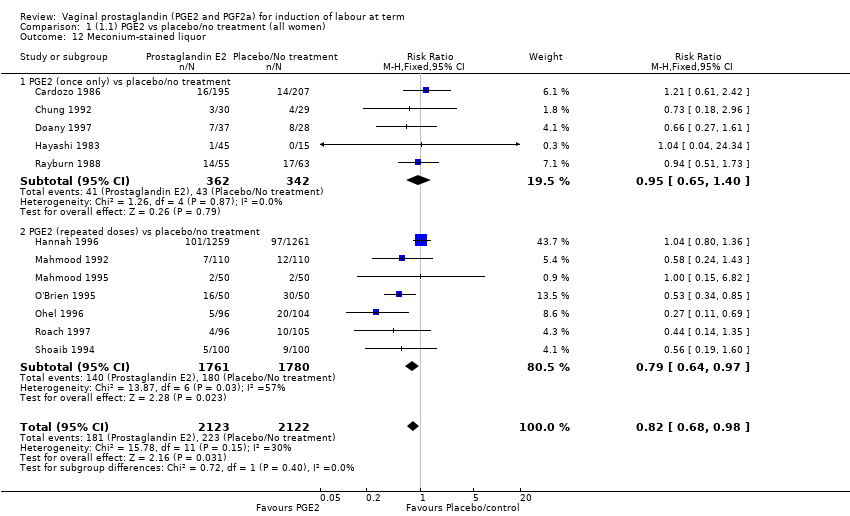
Comparison 1 (1.1) PGE2 vs placebo/no treatment (all women), Outcome 12 Meconium‐stained liquor.
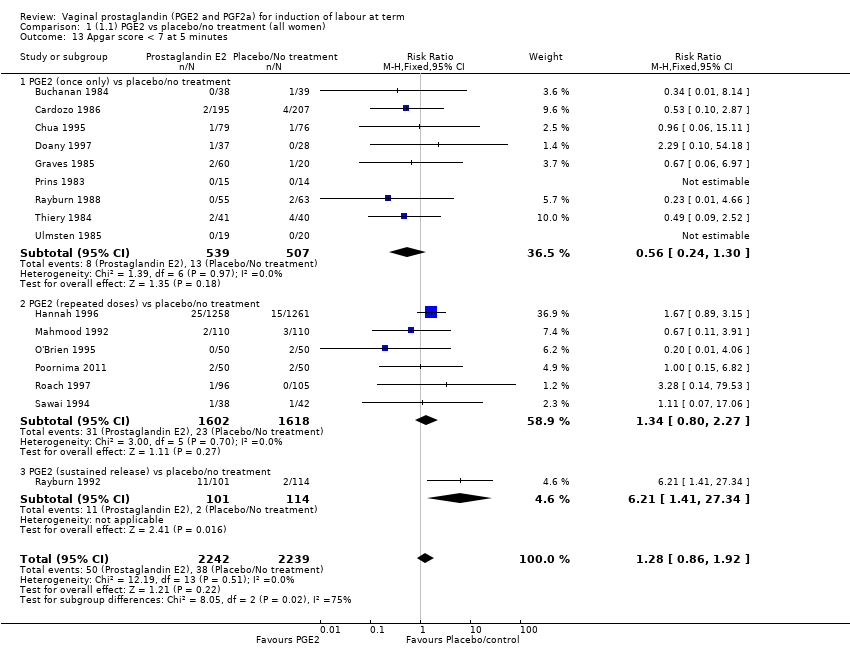
Comparison 1 (1.1) PGE2 vs placebo/no treatment (all women), Outcome 13 Apgar score < 7 at 5 minutes.

Comparison 1 (1.1) PGE2 vs placebo/no treatment (all women), Outcome 14 Neonatal intensive care unit admission.
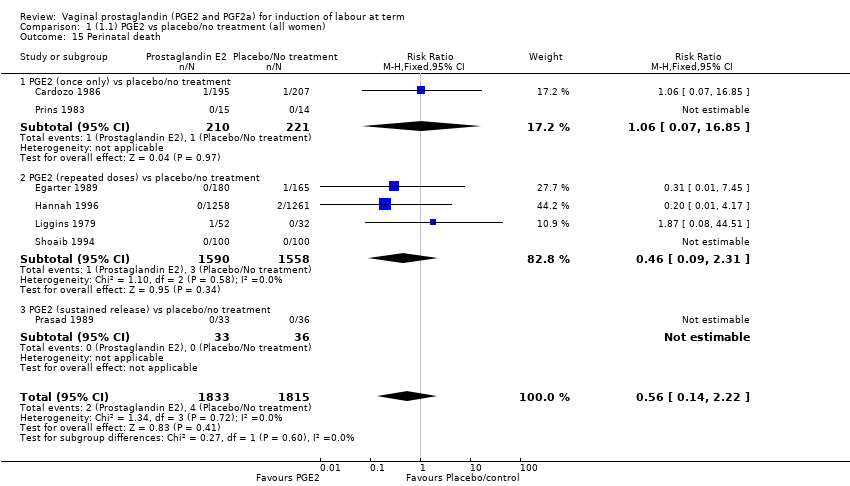
Comparison 1 (1.1) PGE2 vs placebo/no treatment (all women), Outcome 15 Perinatal death.

Comparison 1 (1.1) PGE2 vs placebo/no treatment (all women), Outcome 16 Maternal side‐effects (all).
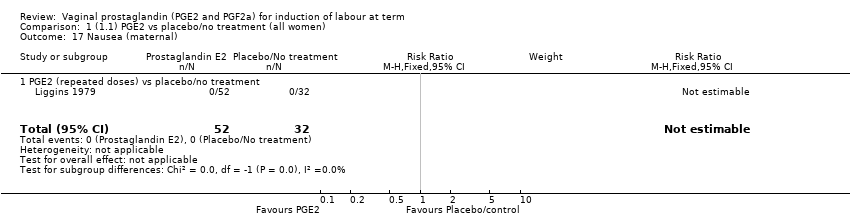
Comparison 1 (1.1) PGE2 vs placebo/no treatment (all women), Outcome 17 Nausea (maternal).
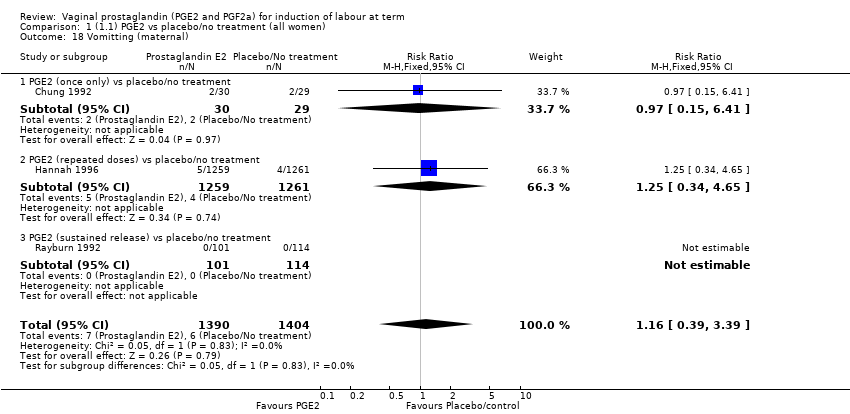
Comparison 1 (1.1) PGE2 vs placebo/no treatment (all women), Outcome 18 Vomitting (maternal).
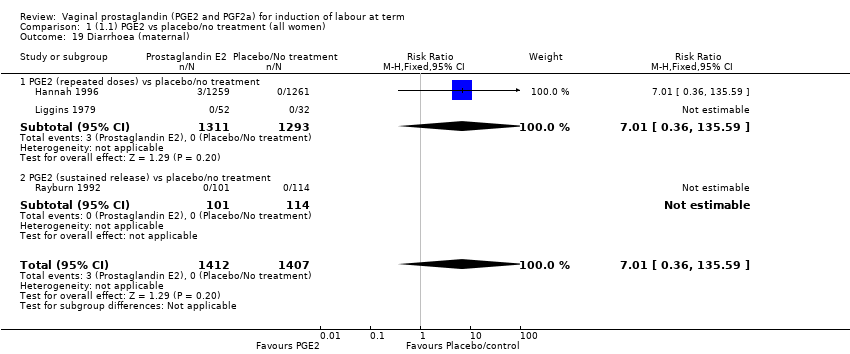
Comparison 1 (1.1) PGE2 vs placebo/no treatment (all women), Outcome 19 Diarrhoea (maternal).
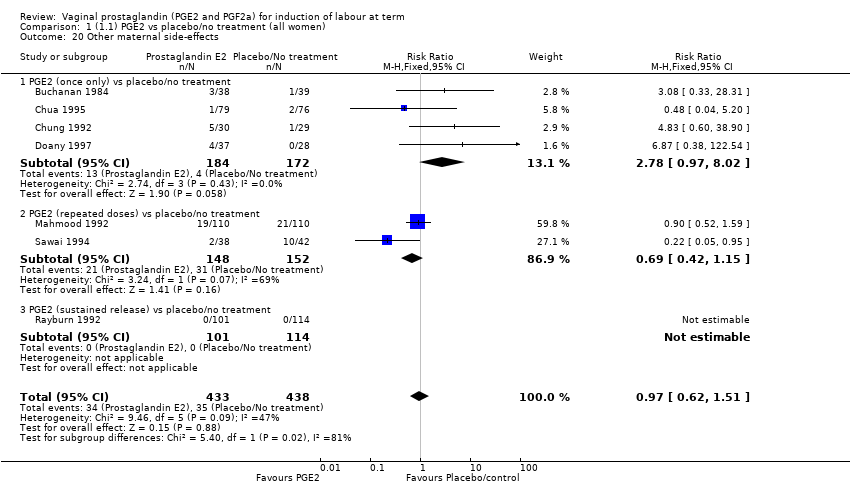
Comparison 1 (1.1) PGE2 vs placebo/no treatment (all women), Outcome 20 Other maternal side‐effects.

Comparison 1 (1.1) PGE2 vs placebo/no treatment (all women), Outcome 21 Postpartum haemorrhage.

Comparison 1 (1.1) PGE2 vs placebo/no treatment (all women), Outcome 22 Serious maternal complication.
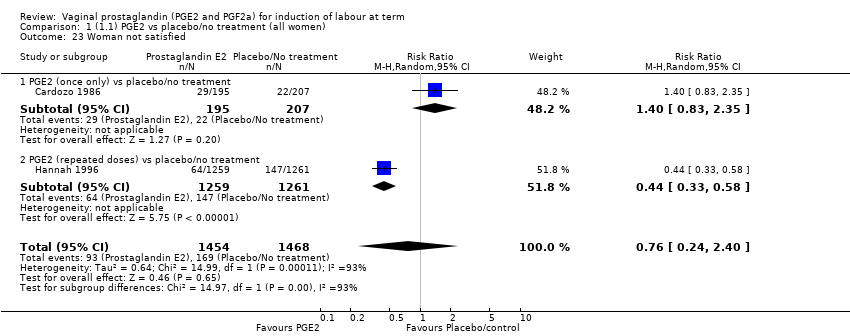
Comparison 1 (1.1) PGE2 vs placebo/no treatment (all women), Outcome 23 Woman not satisfied.
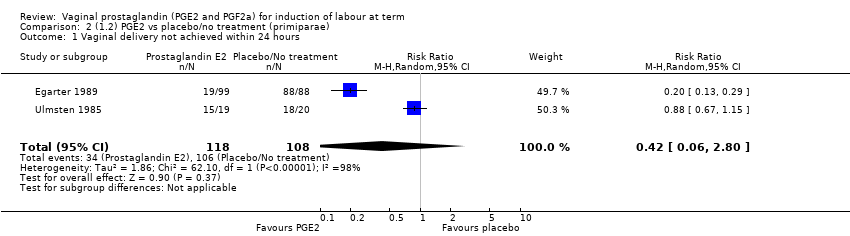
Comparison 2 (1.2) PGE2 vs placebo/no treatment (primiparae), Outcome 1 Vaginal delivery not achieved within 24 hours.

Comparison 2 (1.2) PGE2 vs placebo/no treatment (primiparae), Outcome 2 Uterine hyperstimulation with FHR changes.
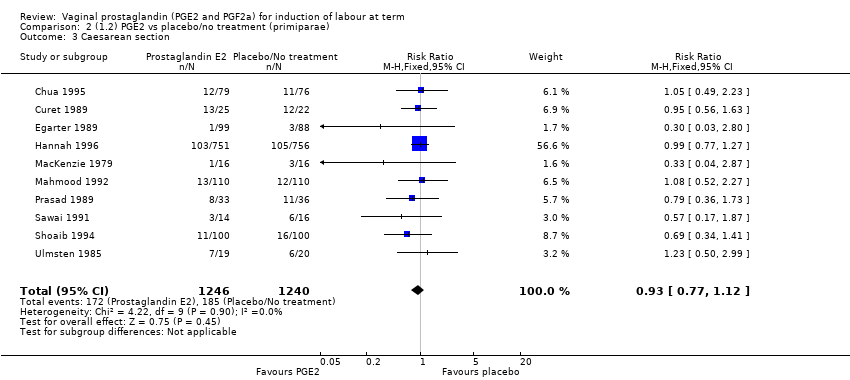
Comparison 2 (1.2) PGE2 vs placebo/no treatment (primiparae), Outcome 3 Caesarean section.

Comparison 2 (1.2) PGE2 vs placebo/no treatment (primiparae), Outcome 4 Serious neonatal morbidity or perinatal death.

Comparison 2 (1.2) PGE2 vs placebo/no treatment (primiparae), Outcome 5 Serious maternal morbidity or death.
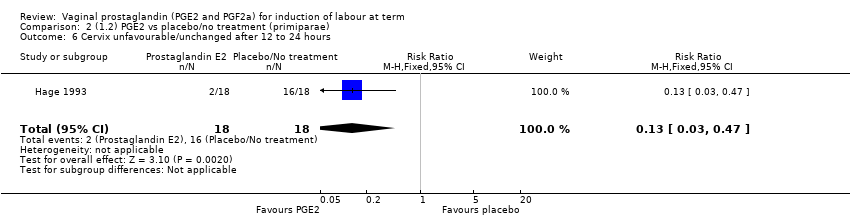
Comparison 2 (1.2) PGE2 vs placebo/no treatment (primiparae), Outcome 6 Cervix unfavourable/unchanged after 12 to 24 hours.
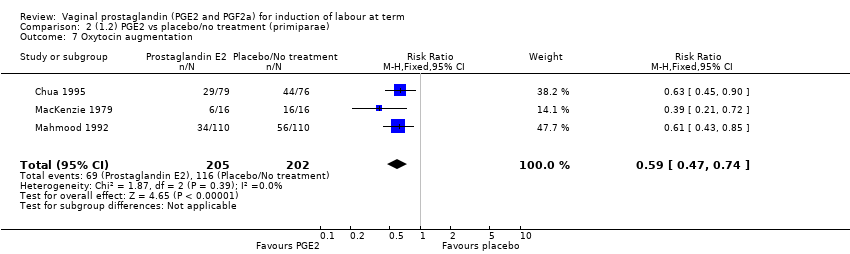
Comparison 2 (1.2) PGE2 vs placebo/no treatment (primiparae), Outcome 7 Oxytocin augmentation.
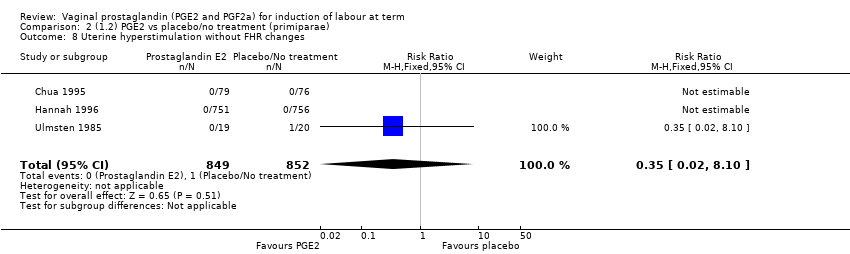
Comparison 2 (1.2) PGE2 vs placebo/no treatment (primiparae), Outcome 8 Uterine hyperstimulation without FHR changes.
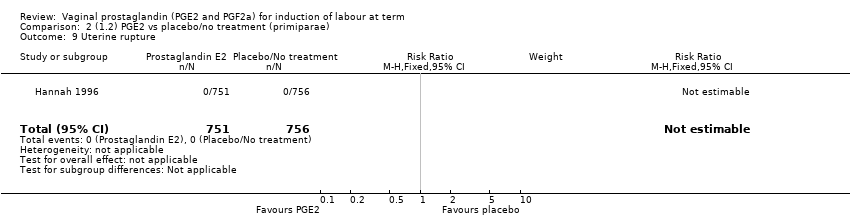
Comparison 2 (1.2) PGE2 vs placebo/no treatment (primiparae), Outcome 9 Uterine rupture.

Comparison 2 (1.2) PGE2 vs placebo/no treatment (primiparae), Outcome 10 Epidural analgesia.
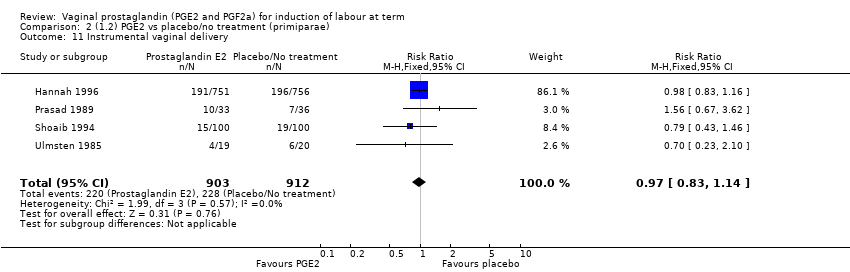
Comparison 2 (1.2) PGE2 vs placebo/no treatment (primiparae), Outcome 11 Instrumental vaginal delivery.
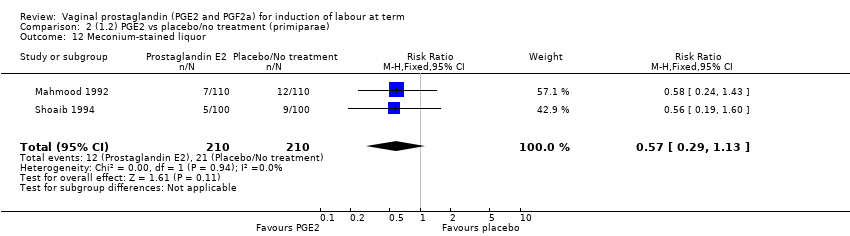
Comparison 2 (1.2) PGE2 vs placebo/no treatment (primiparae), Outcome 12 Meconium‐stained liquor.
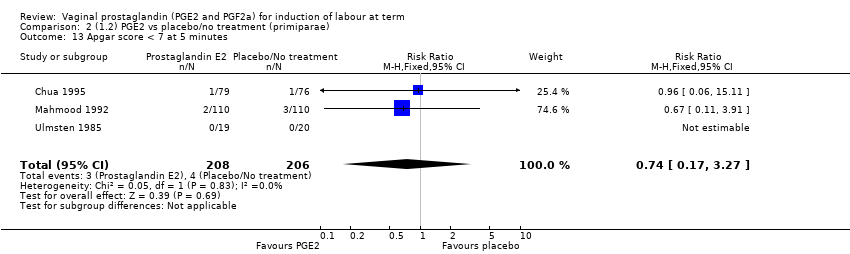
Comparison 2 (1.2) PGE2 vs placebo/no treatment (primiparae), Outcome 13 Apgar score < 7 at 5 minutes.

Comparison 2 (1.2) PGE2 vs placebo/no treatment (primiparae), Outcome 14 Neonatal intensive care unit admission.

Comparison 2 (1.2) PGE2 vs placebo/no treatment (primiparae), Outcome 15 Perinatal death.

Comparison 2 (1.2) PGE2 vs placebo/no treatment (primiparae), Outcome 16 Maternal side‐effects (all).
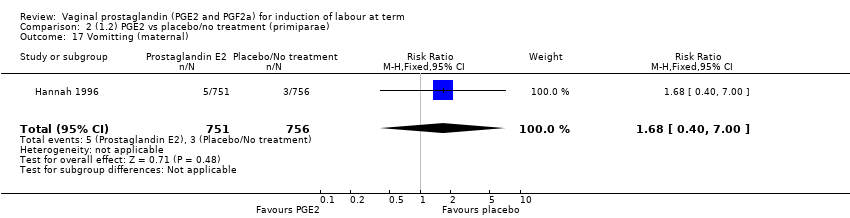
Comparison 2 (1.2) PGE2 vs placebo/no treatment (primiparae), Outcome 17 Vomitting (maternal).
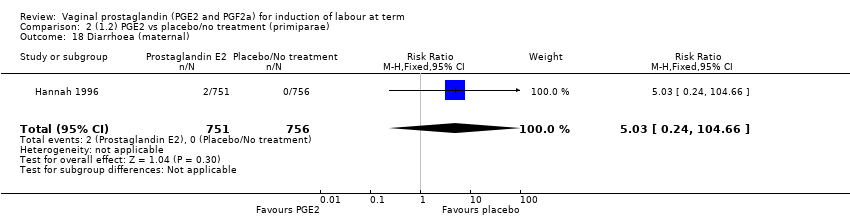
Comparison 2 (1.2) PGE2 vs placebo/no treatment (primiparae), Outcome 18 Diarrhoea (maternal).
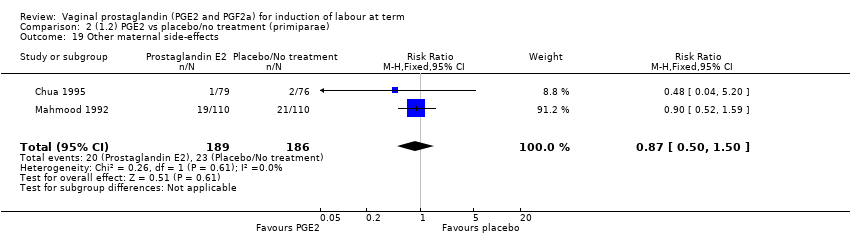
Comparison 2 (1.2) PGE2 vs placebo/no treatment (primiparae), Outcome 19 Other maternal side‐effects.

Comparison 2 (1.2) PGE2 vs placebo/no treatment (primiparae), Outcome 20 Postpartum haemorrhage.

Comparison 3 (1.3) PGE2 vs placebo/no treatment (multiparae), Outcome 1 Vaginal delivery not achieved within 24 hours.

Comparison 3 (1.3) PGE2 vs placebo/no treatment (multiparae), Outcome 2 Uterine hyperstimulation with FHR changes.

Comparison 3 (1.3) PGE2 vs placebo/no treatment (multiparae), Outcome 3 Caesarean section.

Comparison 3 (1.3) PGE2 vs placebo/no treatment (multiparae), Outcome 4 Serious neonatal morbidity or perinatal death.

Comparison 3 (1.3) PGE2 vs placebo/no treatment (multiparae), Outcome 5 Uterine rupture.
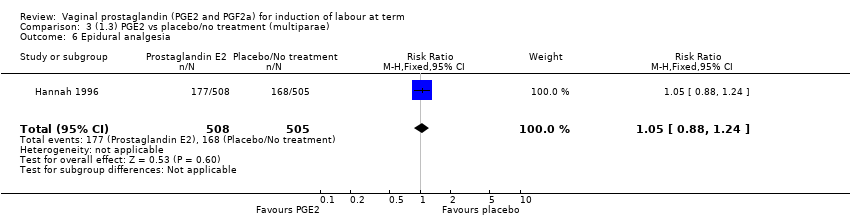
Comparison 3 (1.3) PGE2 vs placebo/no treatment (multiparae), Outcome 6 Epidural analgesia.
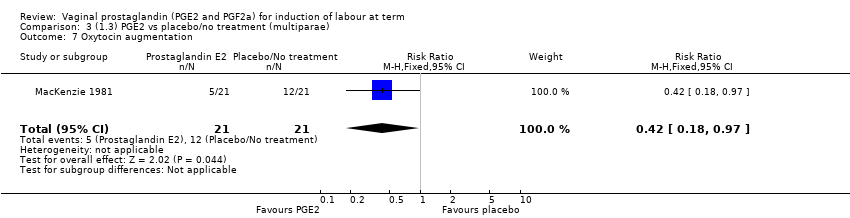
Comparison 3 (1.3) PGE2 vs placebo/no treatment (multiparae), Outcome 7 Oxytocin augmentation.

Comparison 3 (1.3) PGE2 vs placebo/no treatment (multiparae), Outcome 8 Uterine hyperstimulation without FHR changes.

Comparison 3 (1.3) PGE2 vs placebo/no treatment (multiparae), Outcome 9 Instrumental vaginal delivery.

Comparison 3 (1.3) PGE2 vs placebo/no treatment (multiparae), Outcome 10 Meconium‐stained liquor.

Comparison 3 (1.3) PGE2 vs placebo/no treatment (multiparae), Outcome 11 Perinatal death.
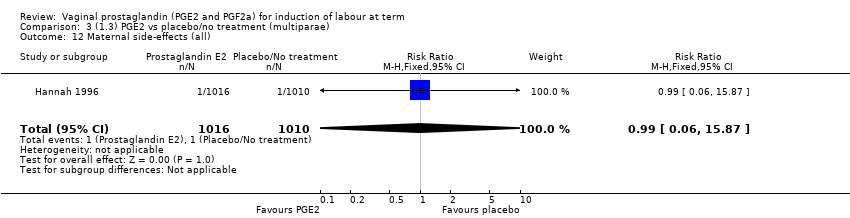
Comparison 3 (1.3) PGE2 vs placebo/no treatment (multiparae), Outcome 12 Maternal side‐effects (all).

Comparison 3 (1.3) PGE2 vs placebo/no treatment (multiparae), Outcome 13 Vomitting (maternal).
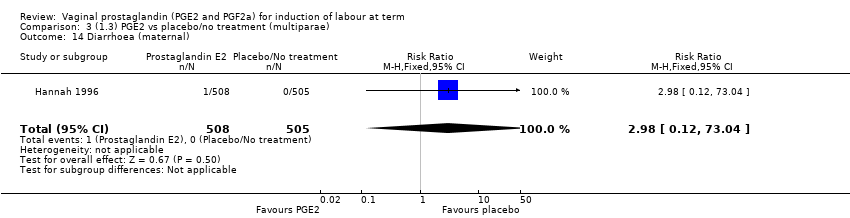
Comparison 3 (1.3) PGE2 vs placebo/no treatment (multiparae), Outcome 14 Diarrhoea (maternal).
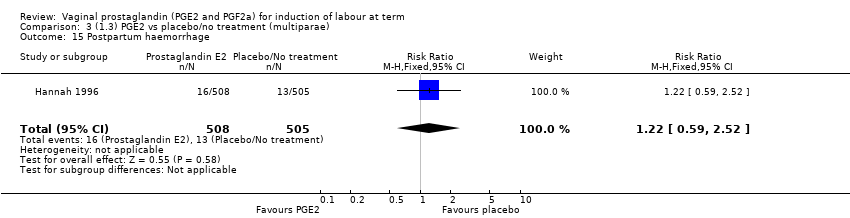
Comparison 3 (1.3) PGE2 vs placebo/no treatment (multiparae), Outcome 15 Postpartum haemorrhage.

Comparison 4 (1.4) PGE2 vs placebo/no treatment (women with intact membranes), Outcome 1 Vaginal delivery not achieved within 24 hours.
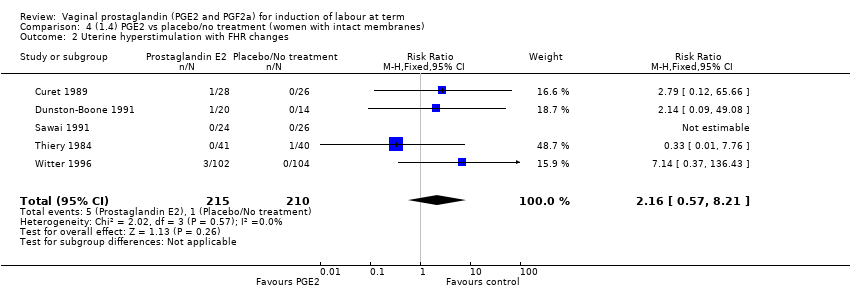
Comparison 4 (1.4) PGE2 vs placebo/no treatment (women with intact membranes), Outcome 2 Uterine hyperstimulation with FHR changes.

Comparison 4 (1.4) PGE2 vs placebo/no treatment (women with intact membranes), Outcome 3 Caesarean section.

Comparison 4 (1.4) PGE2 vs placebo/no treatment (women with intact membranes), Outcome 4 Serious neonatal morbidity or perinatal death.
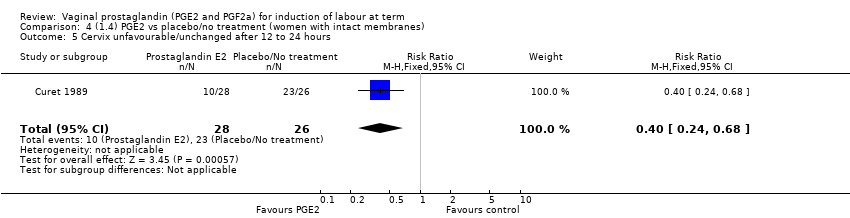
Comparison 4 (1.4) PGE2 vs placebo/no treatment (women with intact membranes), Outcome 5 Cervix unfavourable/unchanged after 12 to 24 hours.
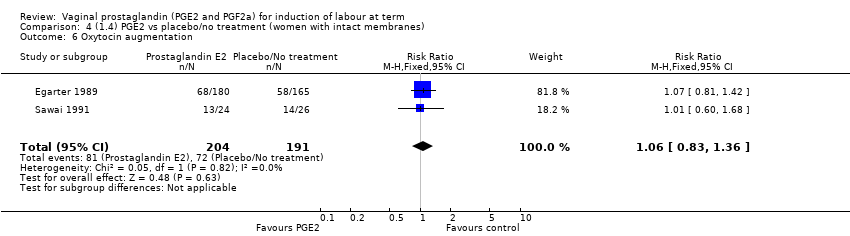
Comparison 4 (1.4) PGE2 vs placebo/no treatment (women with intact membranes), Outcome 6 Oxytocin augmentation.
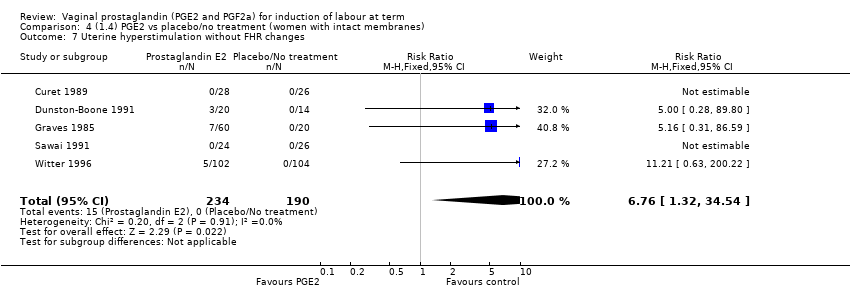
Comparison 4 (1.4) PGE2 vs placebo/no treatment (women with intact membranes), Outcome 7 Uterine hyperstimulation without FHR changes.
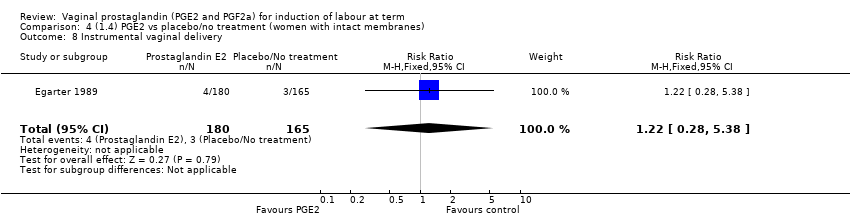
Comparison 4 (1.4) PGE2 vs placebo/no treatment (women with intact membranes), Outcome 8 Instrumental vaginal delivery.

Comparison 4 (1.4) PGE2 vs placebo/no treatment (women with intact membranes), Outcome 9 Apgar score < 7 at 5 minutes.

Comparison 4 (1.4) PGE2 vs placebo/no treatment (women with intact membranes), Outcome 10 Neonatal intensive care unit admission.

Comparison 4 (1.4) PGE2 vs placebo/no treatment (women with intact membranes), Outcome 11 Maternal side‐effects (all).
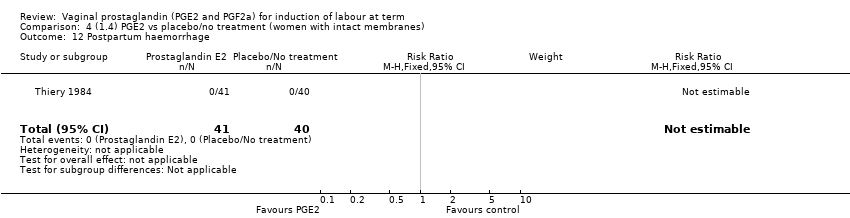
Comparison 4 (1.4) PGE2 vs placebo/no treatment (women with intact membranes), Outcome 12 Postpartum haemorrhage.

Comparison 4 (1.4) PGE2 vs placebo/no treatment (women with intact membranes), Outcome 13 Perinatal death.
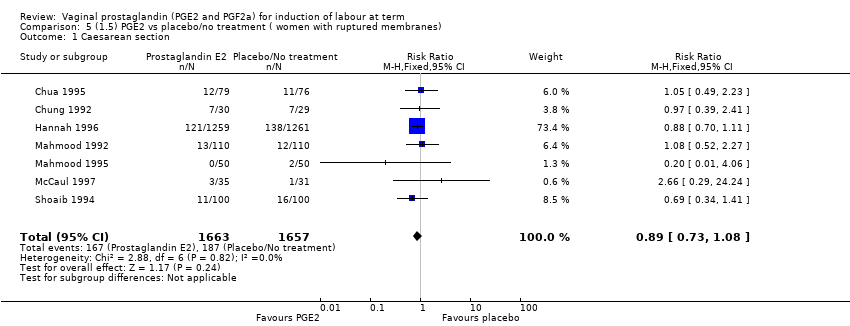
Comparison 5 (1.5) PGE2 vs placebo/no treatment ( women with ruptured membranes), Outcome 1 Caesarean section.

Comparison 5 (1.5) PGE2 vs placebo/no treatment ( women with ruptured membranes), Outcome 2 Serious neonatal morbidity or perinatal death.

Comparison 5 (1.5) PGE2 vs placebo/no treatment ( women with ruptured membranes), Outcome 3 Uterine hyperstimulation without FHR changes.

Comparison 5 (1.5) PGE2 vs placebo/no treatment ( women with ruptured membranes), Outcome 4 Uterine rupture.

Comparison 5 (1.5) PGE2 vs placebo/no treatment ( women with ruptured membranes), Outcome 5 Epidural analgesia.

Comparison 5 (1.5) PGE2 vs placebo/no treatment ( women with ruptured membranes), Outcome 6 Instrumental vaginal delivery.

Comparison 5 (1.5) PGE2 vs placebo/no treatment ( women with ruptured membranes), Outcome 7 Meconium‐stained liquor.

Comparison 5 (1.5) PGE2 vs placebo/no treatment ( women with ruptured membranes), Outcome 8 Apgar score < 7 at 5 minutes.
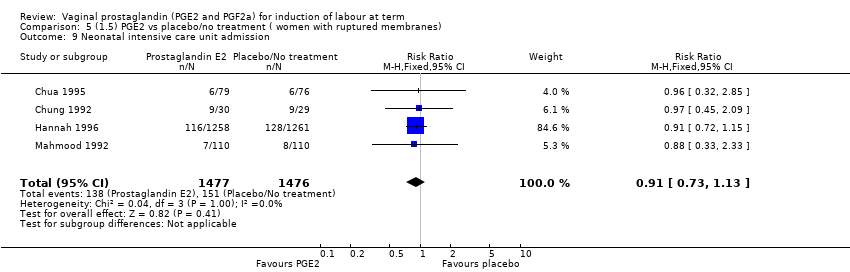
Comparison 5 (1.5) PGE2 vs placebo/no treatment ( women with ruptured membranes), Outcome 9 Neonatal intensive care unit admission.

Comparison 5 (1.5) PGE2 vs placebo/no treatment ( women with ruptured membranes), Outcome 10 Perinatal death.

Comparison 5 (1.5) PGE2 vs placebo/no treatment ( women with ruptured membranes), Outcome 11 Maternal side‐effects (all).

Comparison 5 (1.5) PGE2 vs placebo/no treatment ( women with ruptured membranes), Outcome 12 Vomitting (maternal).

Comparison 5 (1.5) PGE2 vs placebo/no treatment ( women with ruptured membranes), Outcome 13 Diarrhoea (maternal).

Comparison 5 (1.5) PGE2 vs placebo/no treatment ( women with ruptured membranes), Outcome 14 Postpartum haemorrhage.

Comparison 5 (1.5) PGE2 vs placebo/no treatment ( women with ruptured membranes), Outcome 15 Woman not satisfied.
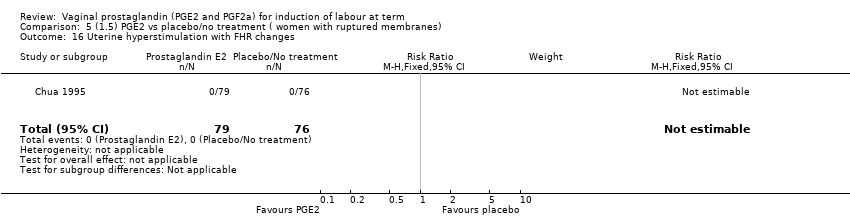
Comparison 5 (1.5) PGE2 vs placebo/no treatment ( women with ruptured membranes), Outcome 16 Uterine hyperstimulation with FHR changes.

Comparison 5 (1.5) PGE2 vs placebo/no treatment ( women with ruptured membranes), Outcome 17 Serious maternal morbidity or death.

Comparison 5 (1.5) PGE2 vs placebo/no treatment ( women with ruptured membranes), Outcome 18 Oxytocin augmentation.

Comparison 5 (1.5) PGE2 vs placebo/no treatment ( women with ruptured membranes), Outcome 19 Other maternal side‐effects.
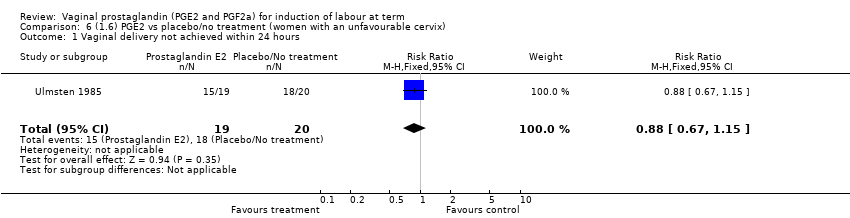
Comparison 6 (1.6) PGE2 vs placebo/no treatment (women with an unfavourable cervix), Outcome 1 Vaginal delivery not achieved within 24 hours.

Comparison 6 (1.6) PGE2 vs placebo/no treatment (women with an unfavourable cervix), Outcome 2 Uterine hyperstimulation with FHR changes.
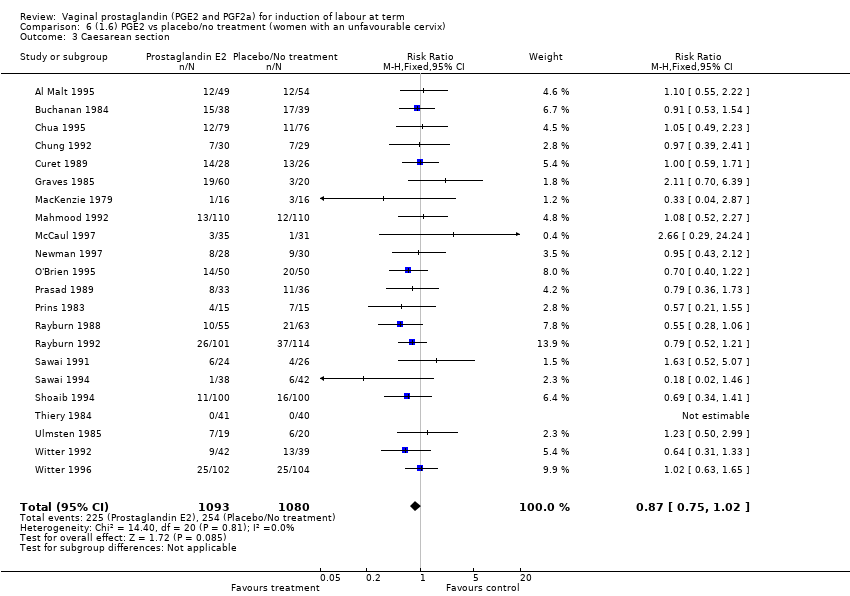
Comparison 6 (1.6) PGE2 vs placebo/no treatment (women with an unfavourable cervix), Outcome 3 Caesarean section.
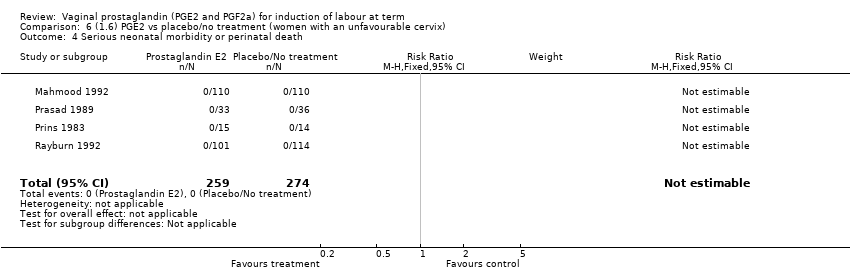
Comparison 6 (1.6) PGE2 vs placebo/no treatment (women with an unfavourable cervix), Outcome 4 Serious neonatal morbidity or perinatal death.
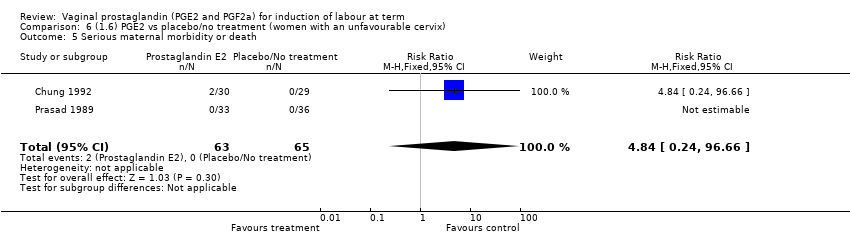
Comparison 6 (1.6) PGE2 vs placebo/no treatment (women with an unfavourable cervix), Outcome 5 Serious maternal morbidity or death.

Comparison 6 (1.6) PGE2 vs placebo/no treatment (women with an unfavourable cervix), Outcome 6 Cervix unfavourable/unchanged after 12 to 24 hours.

Comparison 6 (1.6) PGE2 vs placebo/no treatment (women with an unfavourable cervix), Outcome 7 Oxytocin augmentation.
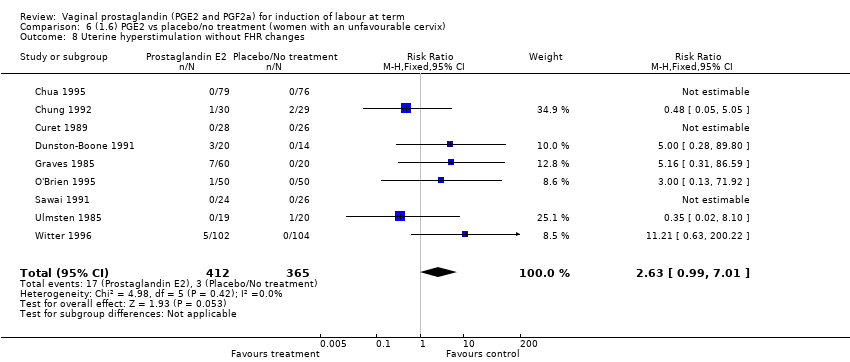
Comparison 6 (1.6) PGE2 vs placebo/no treatment (women with an unfavourable cervix), Outcome 8 Uterine hyperstimulation without FHR changes.

Comparison 6 (1.6) PGE2 vs placebo/no treatment (women with an unfavourable cervix), Outcome 9 Uterine rupture.
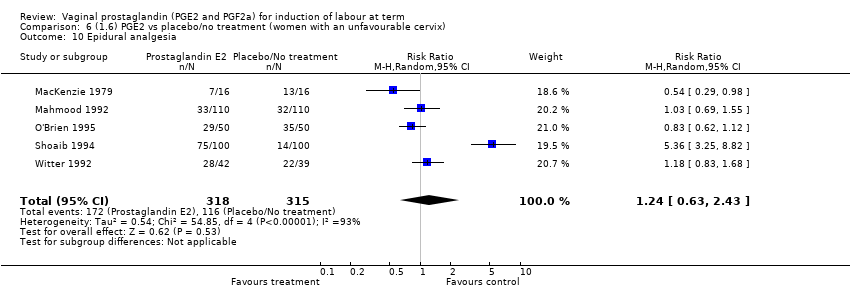
Comparison 6 (1.6) PGE2 vs placebo/no treatment (women with an unfavourable cervix), Outcome 10 Epidural analgesia.
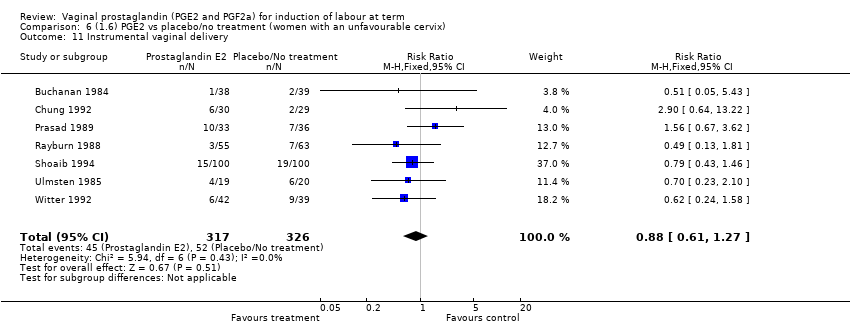
Comparison 6 (1.6) PGE2 vs placebo/no treatment (women with an unfavourable cervix), Outcome 11 Instrumental vaginal delivery.

Comparison 6 (1.6) PGE2 vs placebo/no treatment (women with an unfavourable cervix), Outcome 12 Meconium‐stained liquor.
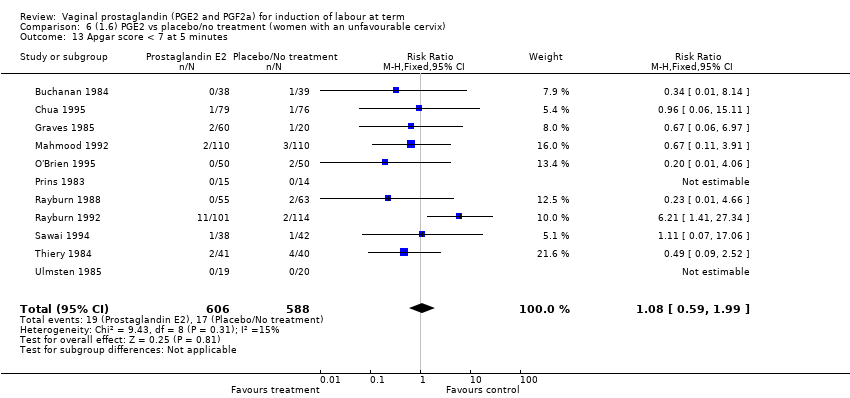
Comparison 6 (1.6) PGE2 vs placebo/no treatment (women with an unfavourable cervix), Outcome 13 Apgar score < 7 at 5 minutes.

Comparison 6 (1.6) PGE2 vs placebo/no treatment (women with an unfavourable cervix), Outcome 14 Neonatal intensive care unit admission.

Comparison 6 (1.6) PGE2 vs placebo/no treatment (women with an unfavourable cervix), Outcome 15 Perinatal death.
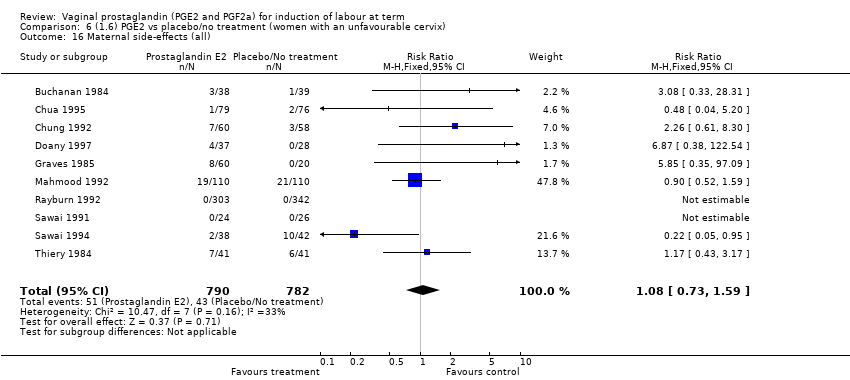
Comparison 6 (1.6) PGE2 vs placebo/no treatment (women with an unfavourable cervix), Outcome 16 Maternal side‐effects (all).
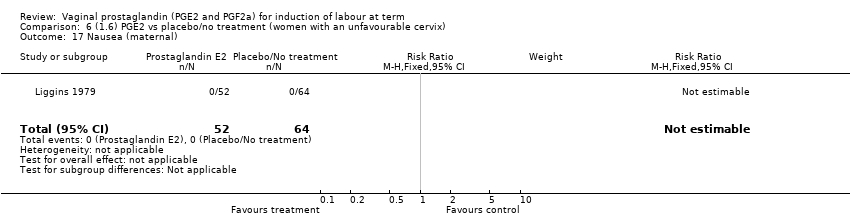
Comparison 6 (1.6) PGE2 vs placebo/no treatment (women with an unfavourable cervix), Outcome 17 Nausea (maternal).
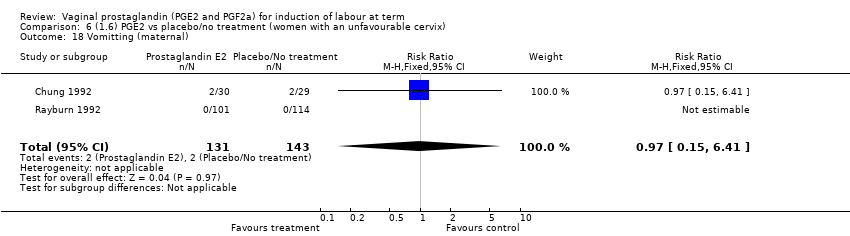
Comparison 6 (1.6) PGE2 vs placebo/no treatment (women with an unfavourable cervix), Outcome 18 Vomitting (maternal).

Comparison 6 (1.6) PGE2 vs placebo/no treatment (women with an unfavourable cervix), Outcome 19 Diarrhoea (maternal).
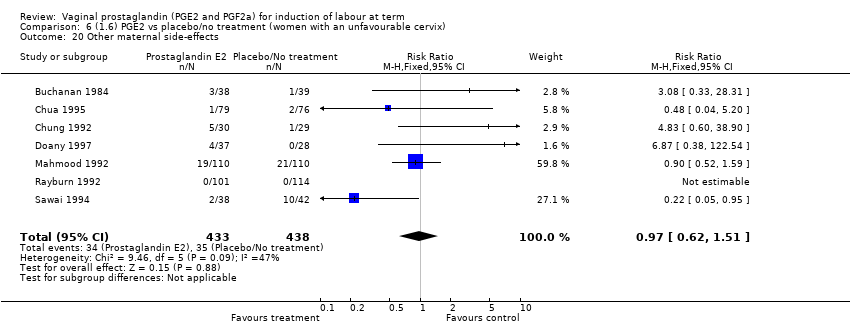
Comparison 6 (1.6) PGE2 vs placebo/no treatment (women with an unfavourable cervix), Outcome 20 Other maternal side‐effects.
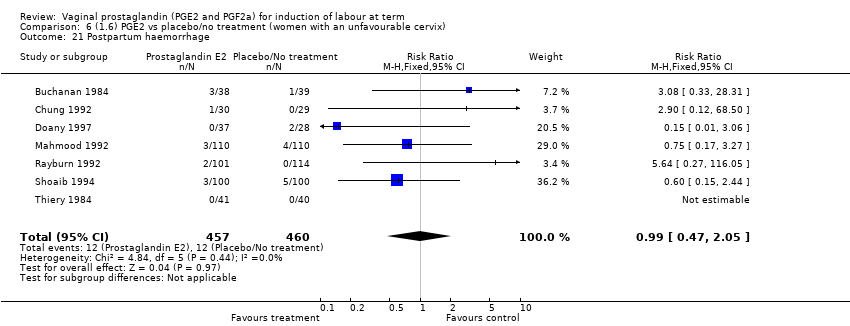
Comparison 6 (1.6) PGE2 vs placebo/no treatment (women with an unfavourable cervix), Outcome 21 Postpartum haemorrhage.

Comparison 6 (1.6) PGE2 vs placebo/no treatment (women with an unfavourable cervix), Outcome 22 Serious maternal complication.

Comparison 7 (1.7) PGE2 vs placebo/no treatment (women with a favourable cervix), Outcome 1 Uterine hyperstimulation without FHR changes.
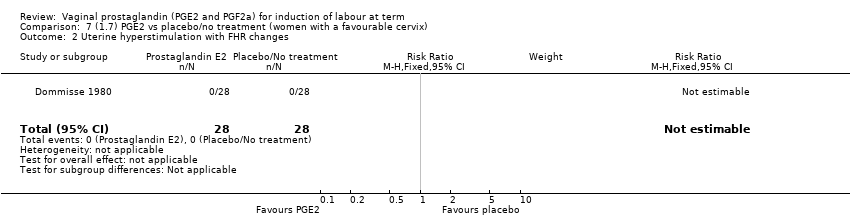
Comparison 7 (1.7) PGE2 vs placebo/no treatment (women with a favourable cervix), Outcome 2 Uterine hyperstimulation with FHR changes.

Comparison 7 (1.7) PGE2 vs placebo/no treatment (women with a favourable cervix), Outcome 3 Caesarean section.

Comparison 7 (1.7) PGE2 vs placebo/no treatment (women with a favourable cervix), Outcome 4 Serious neonatal morbidity or perinatal death.

Comparison 7 (1.7) PGE2 vs placebo/no treatment (women with a favourable cervix), Outcome 5 Oxytocin augmentation.

Comparison 7 (1.7) PGE2 vs placebo/no treatment (women with a favourable cervix), Outcome 6 Vaginal delivery not achieved within 24 hours.

Comparison 7 (1.7) PGE2 vs placebo/no treatment (women with a favourable cervix), Outcome 7 Instrumental vaginal delivery.
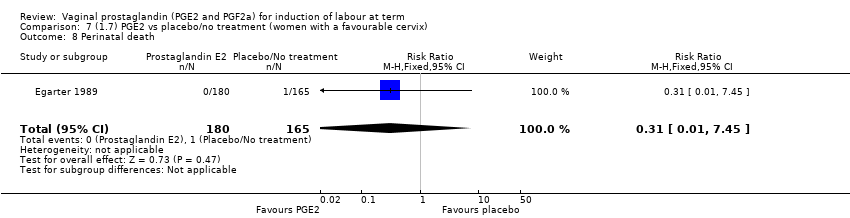
Comparison 7 (1.7) PGE2 vs placebo/no treatment (women with a favourable cervix), Outcome 8 Perinatal death.

Comparison 8 (2.1) PGF2a vs placebo (all women), Outcome 1 Uterine hyperstimulation with FHR changes.
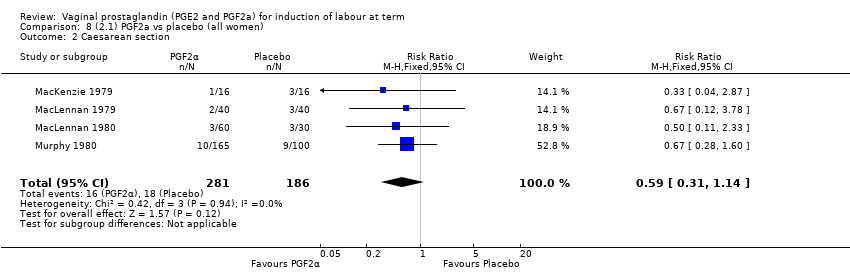
Comparison 8 (2.1) PGF2a vs placebo (all women), Outcome 2 Caesarean section.
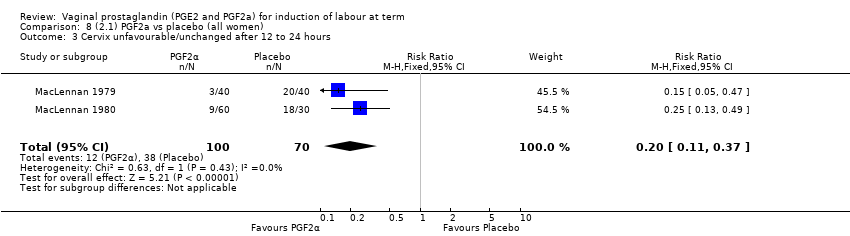
Comparison 8 (2.1) PGF2a vs placebo (all women), Outcome 3 Cervix unfavourable/unchanged after 12 to 24 hours.
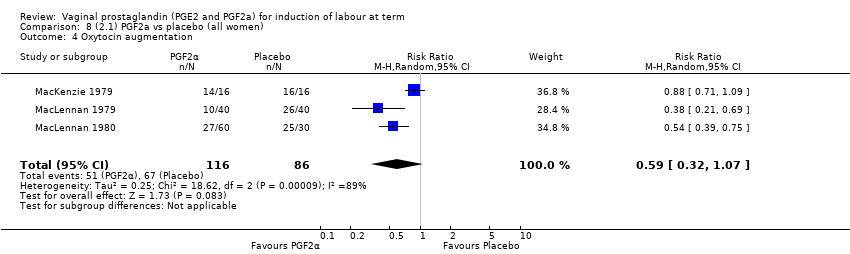
Comparison 8 (2.1) PGF2a vs placebo (all women), Outcome 4 Oxytocin augmentation.

Comparison 8 (2.1) PGF2a vs placebo (all women), Outcome 5 Epidural analgesia.
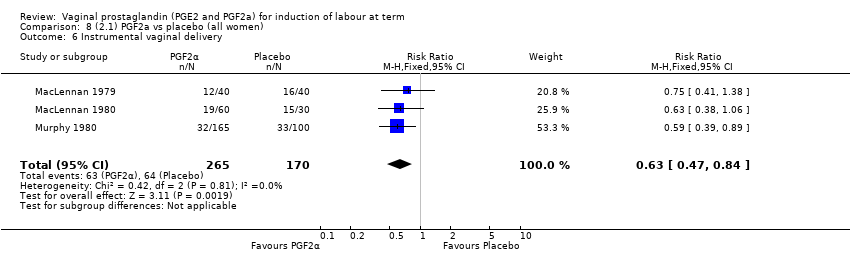
Comparison 8 (2.1) PGF2a vs placebo (all women), Outcome 6 Instrumental vaginal delivery.
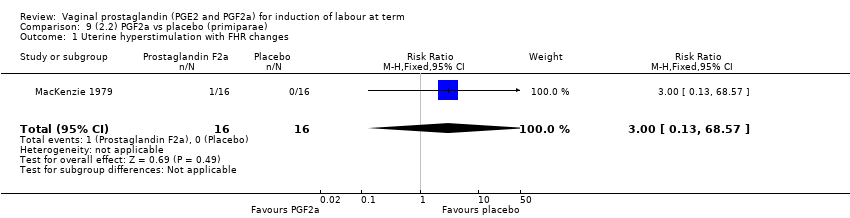
Comparison 9 (2.2) PGF2a vs placebo (primiparae), Outcome 1 Uterine hyperstimulation with FHR changes.
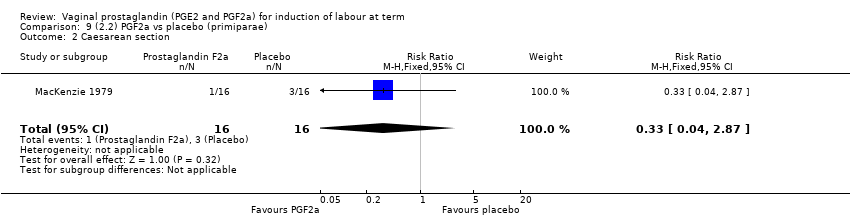
Comparison 9 (2.2) PGF2a vs placebo (primiparae), Outcome 2 Caesarean section.
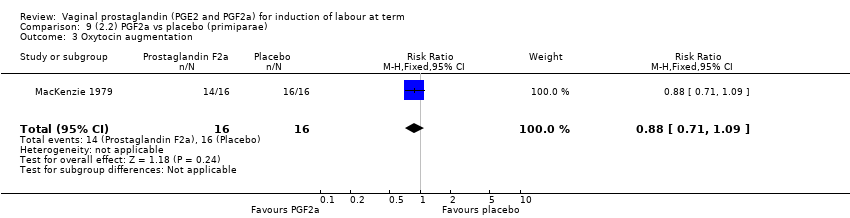
Comparison 9 (2.2) PGF2a vs placebo (primiparae), Outcome 3 Oxytocin augmentation.

Comparison 9 (2.2) PGF2a vs placebo (primiparae), Outcome 4 Epidural analgesia.
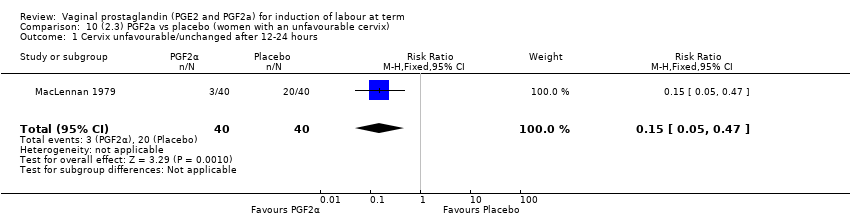
Comparison 10 (2.3) PGF2a vs placebo (women with an unfavourable cervix), Outcome 1 Cervix unfavourable/unchanged after 12‐24 hours.

Comparison 10 (2.3) PGF2a vs placebo (women with an unfavourable cervix), Outcome 2 Uterine hyperstimulation with FHR changes.

Comparison 10 (2.3) PGF2a vs placebo (women with an unfavourable cervix), Outcome 3 Caesarean section.
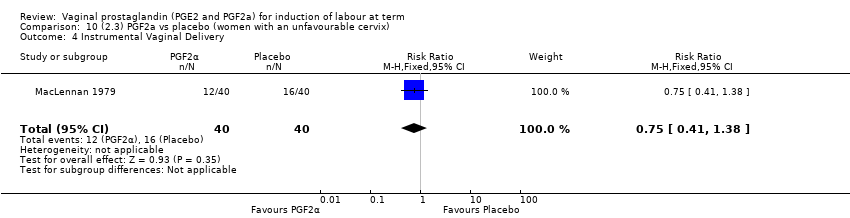
Comparison 10 (2.3) PGF2a vs placebo (women with an unfavourable cervix), Outcome 4 Instrumental Vaginal Delivery.

Comparison 10 (2.3) PGF2a vs placebo (women with an unfavourable cervix), Outcome 5 Oxytocin augmentation.
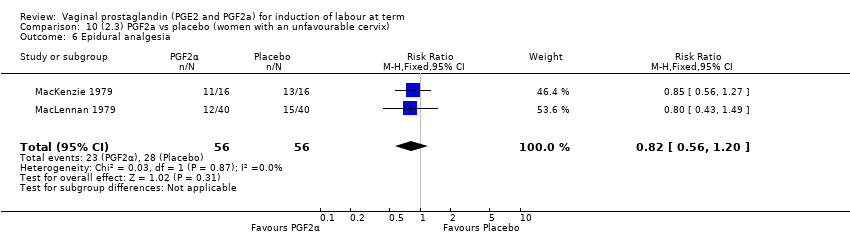
Comparison 10 (2.3) PGF2a vs placebo (women with an unfavourable cervix), Outcome 6 Epidural analgesia.

Comparison 11 (3.1) PGF2a vs PGE2 ( All women), Outcome 1 Vaginal delivery not achieved within 24 hours.

Comparison 11 (3.1) PGF2a vs PGE2 ( All women), Outcome 2 Uterine hyperstimulation with FHR changes.

Comparison 11 (3.1) PGF2a vs PGE2 ( All women), Outcome 3 Caesarean section.
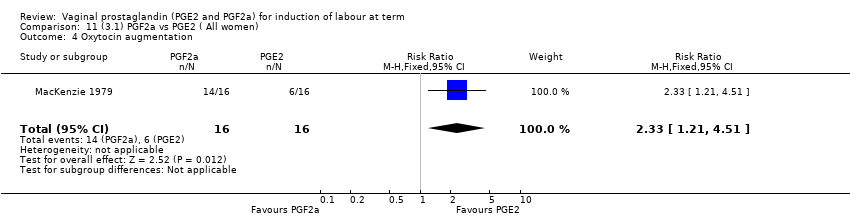
Comparison 11 (3.1) PGF2a vs PGE2 ( All women), Outcome 4 Oxytocin augmentation.

Comparison 11 (3.1) PGF2a vs PGE2 ( All women), Outcome 5 Epidural analgesia.

Comparison 11 (3.1) PGF2a vs PGE2 ( All women), Outcome 6 Apgar score < 7 at 5 minutes.

Comparison 12 (3.2) PGF2a vs PGE2 (primiparae), Outcome 1 Uterine hyperstimulation with FHR changes.
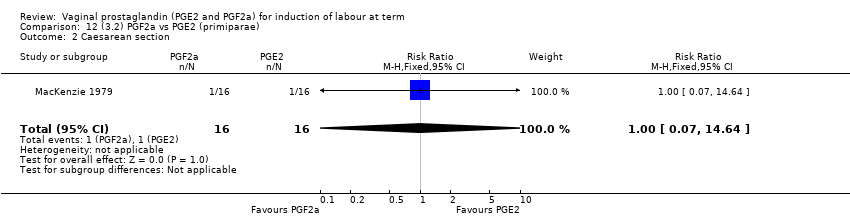
Comparison 12 (3.2) PGF2a vs PGE2 (primiparae), Outcome 2 Caesarean section.

Comparison 12 (3.2) PGF2a vs PGE2 (primiparae), Outcome 3 Oxytocin augmentation.
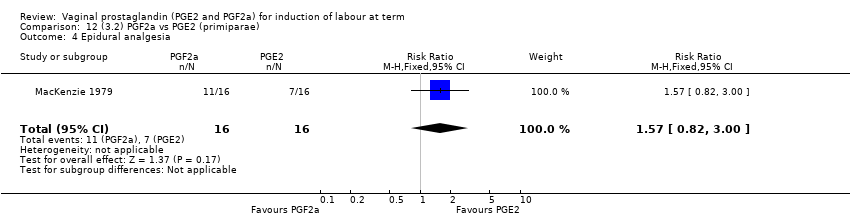
Comparison 12 (3.2) PGF2a vs PGE2 (primiparae), Outcome 4 Epidural analgesia.
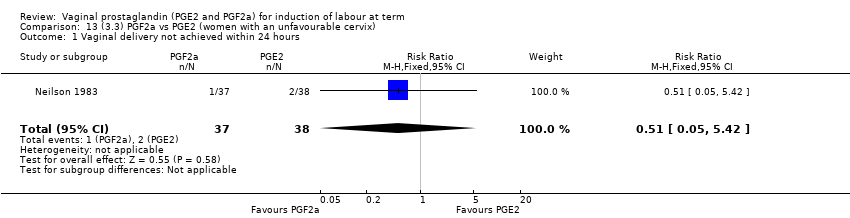
Comparison 13 (3.3) PGF2a vs PGE2 (women with an unfavourable cervix), Outcome 1 Vaginal delivery not achieved within 24 hours.

Comparison 13 (3.3) PGF2a vs PGE2 (women with an unfavourable cervix), Outcome 2 Uterine hyperstimulation with FHR changes.

Comparison 13 (3.3) PGF2a vs PGE2 (women with an unfavourable cervix), Outcome 3 Caesarean section.
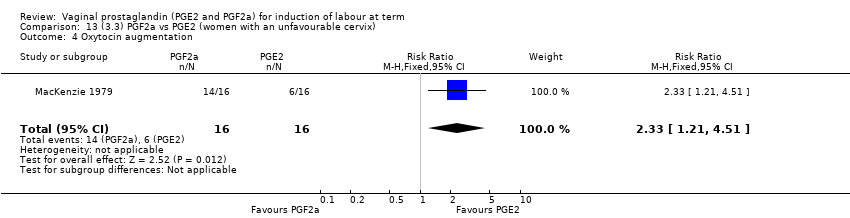
Comparison 13 (3.3) PGF2a vs PGE2 (women with an unfavourable cervix), Outcome 4 Oxytocin augmentation.

Comparison 13 (3.3) PGF2a vs PGE2 (women with an unfavourable cervix), Outcome 5 Epidural analgesia.

Comparison 13 (3.3) PGF2a vs PGE2 (women with an unfavourable cervix), Outcome 6 Apgar score < 7 at 5 minutes.

Comparison 14 (4.1) PGE2 gel vs PGE2 tablet ( all women), Outcome 1 Vaginal delivery not achieved within 24 hours.

Comparison 14 (4.1) PGE2 gel vs PGE2 tablet ( all women), Outcome 2 Uterine hyperstimulation with FHR changes.

Comparison 14 (4.1) PGE2 gel vs PGE2 tablet ( all women), Outcome 3 Caesarean section.

Comparison 14 (4.1) PGE2 gel vs PGE2 tablet ( all women), Outcome 4 Serious maternal morbidity or death.

Comparison 14 (4.1) PGE2 gel vs PGE2 tablet ( all women), Outcome 5 Cervix unfavourable/unchanged after 12 to 24 hours.

Comparison 14 (4.1) PGE2 gel vs PGE2 tablet ( all women), Outcome 6 Oxytocin augmentation.

Comparison 14 (4.1) PGE2 gel vs PGE2 tablet ( all women), Outcome 7 Epidural analgesia.

Comparison 14 (4.1) PGE2 gel vs PGE2 tablet ( all women), Outcome 8 Instrumental vaginal delivery.

Comparison 14 (4.1) PGE2 gel vs PGE2 tablet ( all women), Outcome 9 Meconium Stained Liquor.
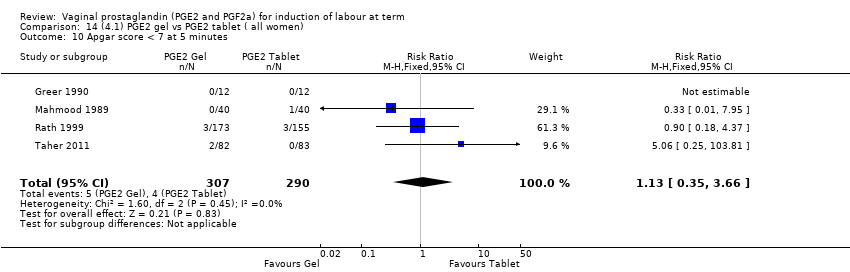
Comparison 14 (4.1) PGE2 gel vs PGE2 tablet ( all women), Outcome 10 Apgar score < 7 at 5 minutes.

Comparison 14 (4.1) PGE2 gel vs PGE2 tablet ( all women), Outcome 11 Neonatal Intensive Care Unit Admission.

Comparison 14 (4.1) PGE2 gel vs PGE2 tablet ( all women), Outcome 12 Postpartum haemorrhage.

Comparison 15 (4.1) PGE2 gel vs PGE2 tablet (primiparae), Outcome 1 Vaginal delivery not achieved within 24 hours.

Comparison 15 (4.1) PGE2 gel vs PGE2 tablet (primiparae), Outcome 2 Uterine hyperstimulation with FHR changes.

Comparison 15 (4.1) PGE2 gel vs PGE2 tablet (primiparae), Outcome 3 Caesarean section.

Comparison 15 (4.1) PGE2 gel vs PGE2 tablet (primiparae), Outcome 4 Serious maternal morbidity or death.
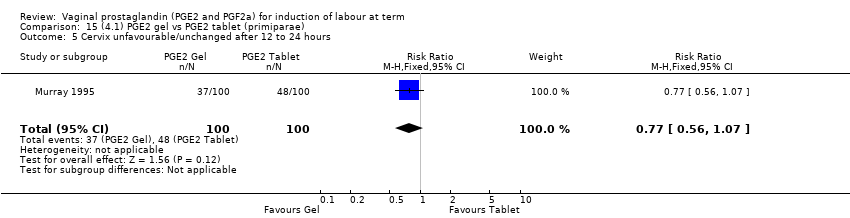
Comparison 15 (4.1) PGE2 gel vs PGE2 tablet (primiparae), Outcome 5 Cervix unfavourable/unchanged after 12 to 24 hours.
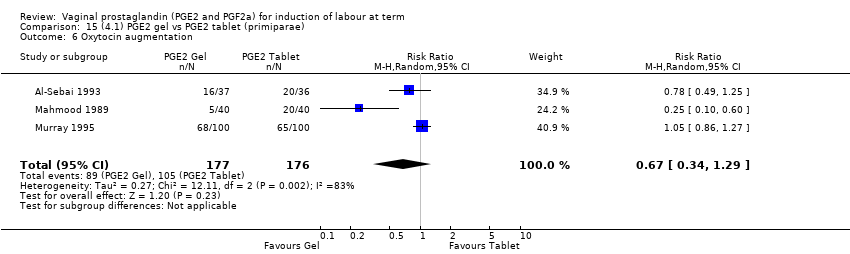
Comparison 15 (4.1) PGE2 gel vs PGE2 tablet (primiparae), Outcome 6 Oxytocin augmentation.

Comparison 15 (4.1) PGE2 gel vs PGE2 tablet (primiparae), Outcome 7 Epidural analgesia.
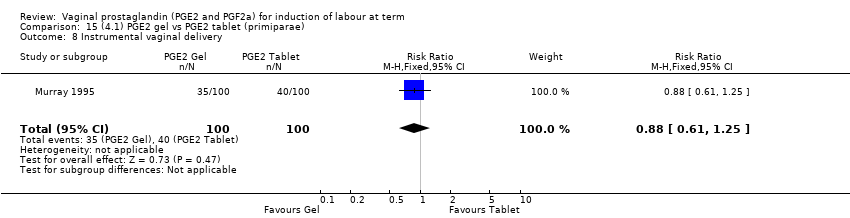
Comparison 15 (4.1) PGE2 gel vs PGE2 tablet (primiparae), Outcome 8 Instrumental vaginal delivery.

Comparison 15 (4.1) PGE2 gel vs PGE2 tablet (primiparae), Outcome 9 Apgar score < 7 at 5 minutes.

Comparison 15 (4.1) PGE2 gel vs PGE2 tablet (primiparae), Outcome 10 Postpartum haemorrhage.
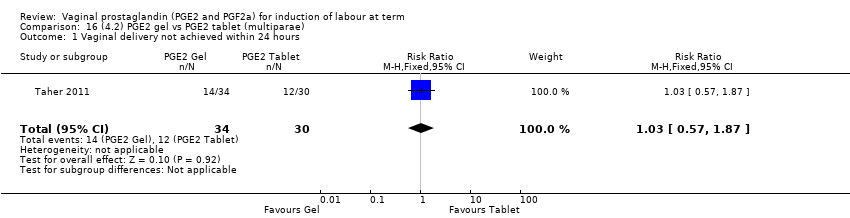
Comparison 16 (4.2) PGE2 gel vs PGE2 tablet (multiparae), Outcome 1 Vaginal delivery not achieved within 24 hours.

Comparison 16 (4.2) PGE2 gel vs PGE2 tablet (multiparae), Outcome 2 Caesarean section.

Comparison 17 (4.3) PGE2 gel vs PGE2 tablet (women with intact membranes), Outcome 1 Vaginal delivery not achieved within 24 hours.
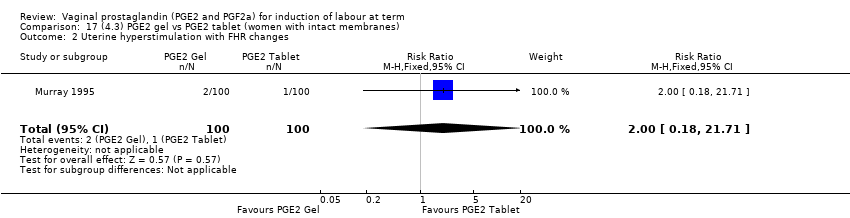
Comparison 17 (4.3) PGE2 gel vs PGE2 tablet (women with intact membranes), Outcome 2 Uterine hyperstimulation with FHR changes.
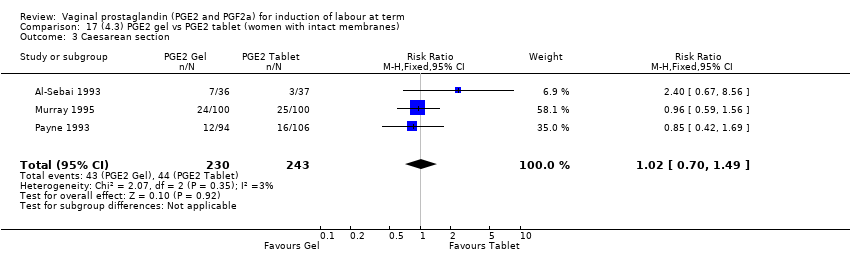
Comparison 17 (4.3) PGE2 gel vs PGE2 tablet (women with intact membranes), Outcome 3 Caesarean section.

Comparison 17 (4.3) PGE2 gel vs PGE2 tablet (women with intact membranes), Outcome 4 Serious maternal morbidity or death.

Comparison 17 (4.3) PGE2 gel vs PGE2 tablet (women with intact membranes), Outcome 5 Cervix unfavourable/unchanged after 12 to 24 hours.

Comparison 17 (4.3) PGE2 gel vs PGE2 tablet (women with intact membranes), Outcome 6 Oxytocin augmentation.

Comparison 17 (4.3) PGE2 gel vs PGE2 tablet (women with intact membranes), Outcome 7 Epidural analgesia.
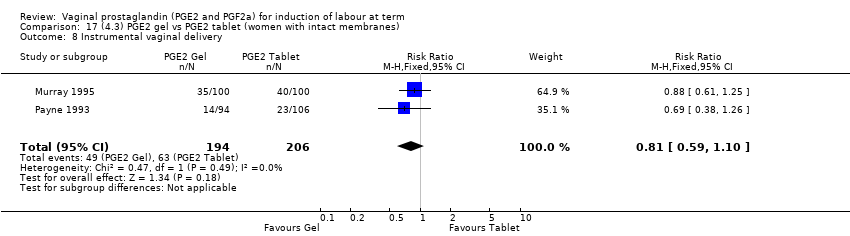
Comparison 17 (4.3) PGE2 gel vs PGE2 tablet (women with intact membranes), Outcome 8 Instrumental vaginal delivery.

Comparison 17 (4.3) PGE2 gel vs PGE2 tablet (women with intact membranes), Outcome 9 Postpartum haemorrhage.

Comparison 18 (4.4) PGE2 gel vs PGE2 tablet (women with an unfavourable cervix), Outcome 1 Vaginal delivery not achieved within 24 hours.

Comparison 18 (4.4) PGE2 gel vs PGE2 tablet (women with an unfavourable cervix), Outcome 2 Uterine hyperstimulation with FHR changes.

Comparison 18 (4.4) PGE2 gel vs PGE2 tablet (women with an unfavourable cervix), Outcome 3 Caesarean section.
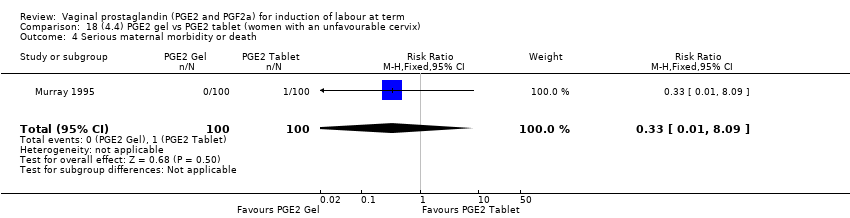
Comparison 18 (4.4) PGE2 gel vs PGE2 tablet (women with an unfavourable cervix), Outcome 4 Serious maternal morbidity or death.
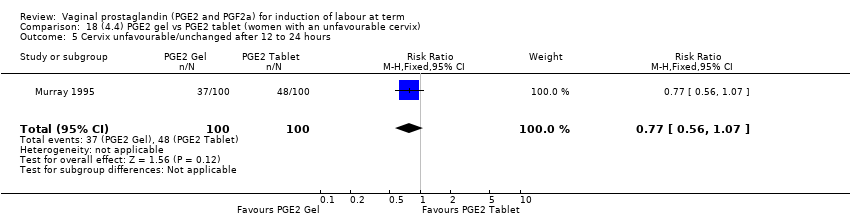
Comparison 18 (4.4) PGE2 gel vs PGE2 tablet (women with an unfavourable cervix), Outcome 5 Cervix unfavourable/unchanged after 12 to 24 hours.

Comparison 18 (4.4) PGE2 gel vs PGE2 tablet (women with an unfavourable cervix), Outcome 6 Oxytocin augmentation.
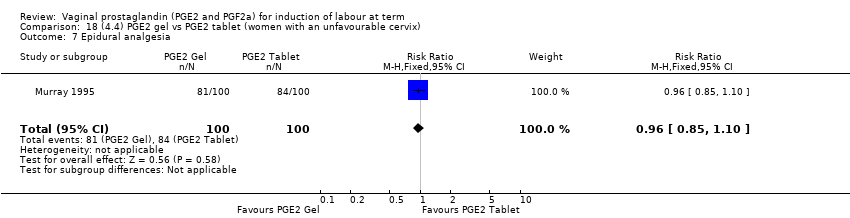
Comparison 18 (4.4) PGE2 gel vs PGE2 tablet (women with an unfavourable cervix), Outcome 7 Epidural analgesia.
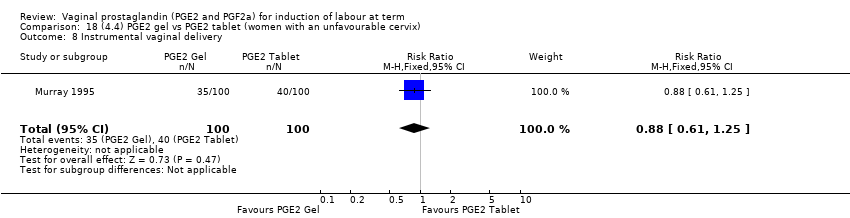
Comparison 18 (4.4) PGE2 gel vs PGE2 tablet (women with an unfavourable cervix), Outcome 8 Instrumental vaginal delivery.

Comparison 18 (4.4) PGE2 gel vs PGE2 tablet (women with an unfavourable cervix), Outcome 9 Apgar score < 7 at 5 minutes.
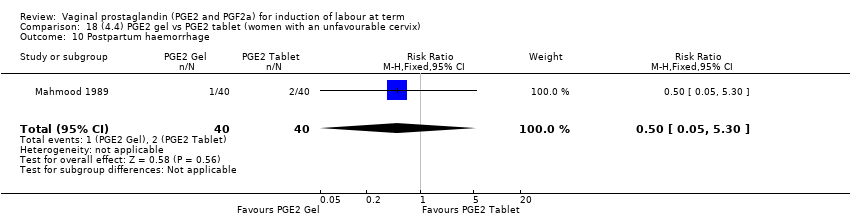
Comparison 18 (4.4) PGE2 gel vs PGE2 tablet (women with an unfavourable cervix), Outcome 10 Postpartum haemorrhage.
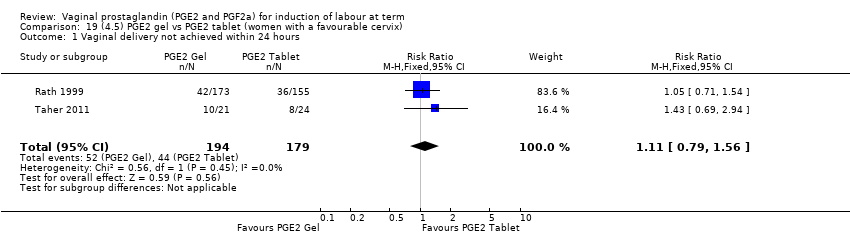
Comparison 19 (4.5) PGE2 gel vs PGE2 tablet (women with a favourable cervix), Outcome 1 Vaginal delivery not achieved within 24 hours.
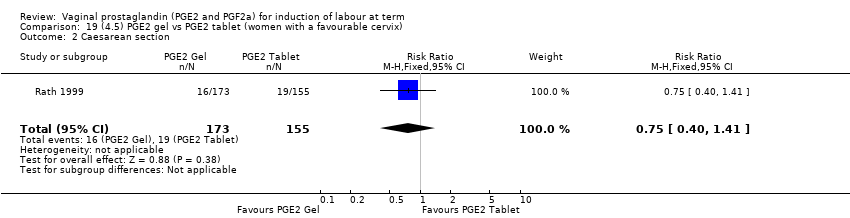
Comparison 19 (4.5) PGE2 gel vs PGE2 tablet (women with a favourable cervix), Outcome 2 Caesarean section.

Comparison 19 (4.5) PGE2 gel vs PGE2 tablet (women with a favourable cervix), Outcome 3 Oxytocin augmentation.

Comparison 19 (4.5) PGE2 gel vs PGE2 tablet (women with a favourable cervix), Outcome 4 Apgar score < 7 at 5 minutes.
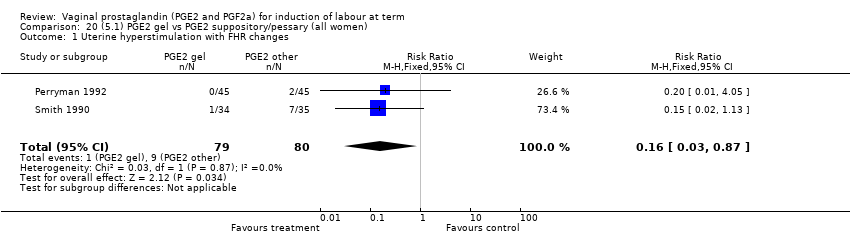
Comparison 20 (5.1) PGE2 gel vs PGE2 suppository/pessary (all women), Outcome 1 Uterine hyperstimulation with FHR changes.

Comparison 20 (5.1) PGE2 gel vs PGE2 suppository/pessary (all women), Outcome 2 Caesarean section.
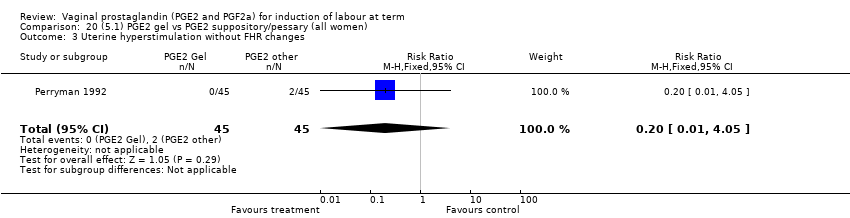
Comparison 20 (5.1) PGE2 gel vs PGE2 suppository/pessary (all women), Outcome 3 Uterine hyperstimulation without FHR changes.

Comparison 20 (5.1) PGE2 gel vs PGE2 suppository/pessary (all women), Outcome 4 Apgar score < 7 at 5 minutes.

Comparison 20 (5.1) PGE2 gel vs PGE2 suppository/pessary (all women), Outcome 5 Maternal side‐effects (all).

Comparison 20 (5.1) PGE2 gel vs PGE2 suppository/pessary (all women), Outcome 6 Nausea (maternal).

Comparison 20 (5.1) PGE2 gel vs PGE2 suppository/pessary (all women), Outcome 7 Vomitting (maternal).

Comparison 20 (5.1) PGE2 gel vs PGE2 suppository/pessary (all women), Outcome 8 Diarrhoea (maternal).

Comparison 20 (5.1) PGE2 gel vs PGE2 suppository/pessary (all women), Outcome 9 Other maternal side‐effects.

Comparison 21 (5.2) PGE2 gel vs PGE2 suppository/pessary (women with an unfavourable cervix), Outcome 1 Uterine hyperstimulation with FHR changes.
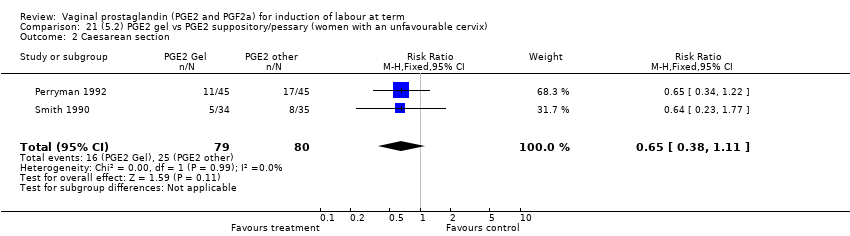
Comparison 21 (5.2) PGE2 gel vs PGE2 suppository/pessary (women with an unfavourable cervix), Outcome 2 Caesarean section.
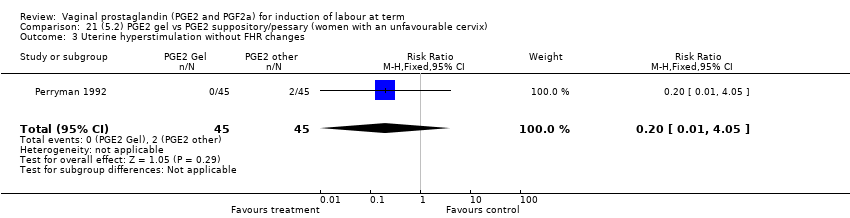
Comparison 21 (5.2) PGE2 gel vs PGE2 suppository/pessary (women with an unfavourable cervix), Outcome 3 Uterine hyperstimulation without FHR changes.
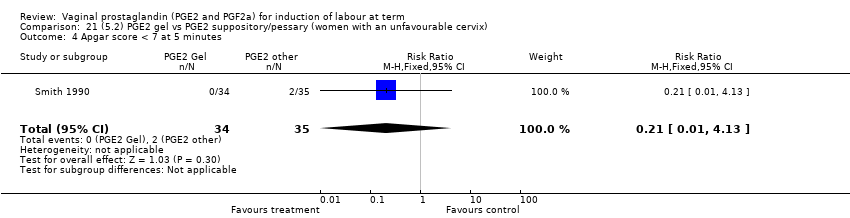
Comparison 21 (5.2) PGE2 gel vs PGE2 suppository/pessary (women with an unfavourable cervix), Outcome 4 Apgar score < 7 at 5 minutes.

Comparison 21 (5.2) PGE2 gel vs PGE2 suppository/pessary (women with an unfavourable cervix), Outcome 5 Maternal side‐effects (all).

Comparison 21 (5.2) PGE2 gel vs PGE2 suppository/pessary (women with an unfavourable cervix), Outcome 6 Nausea (maternal).
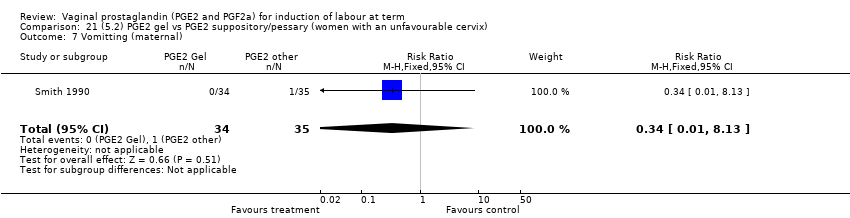
Comparison 21 (5.2) PGE2 gel vs PGE2 suppository/pessary (women with an unfavourable cervix), Outcome 7 Vomitting (maternal).
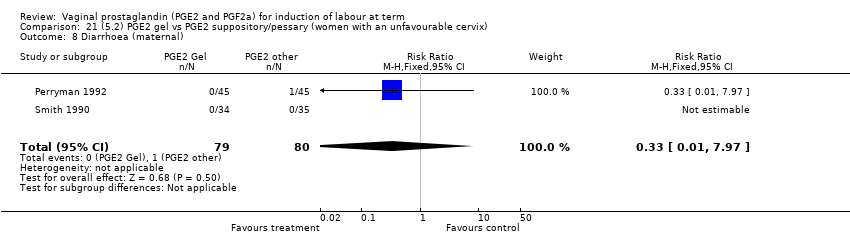
Comparison 21 (5.2) PGE2 gel vs PGE2 suppository/pessary (women with an unfavourable cervix), Outcome 8 Diarrhoea (maternal).
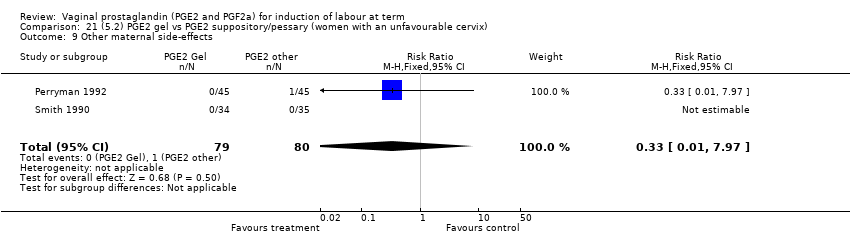
Comparison 21 (5.2) PGE2 gel vs PGE2 suppository/pessary (women with an unfavourable cervix), Outcome 9 Other maternal side‐effects.
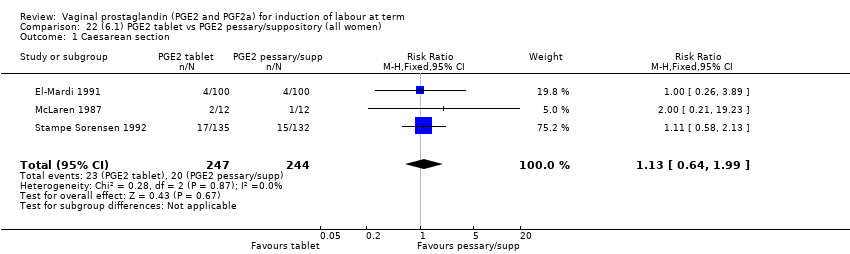
Comparison 22 (6.1) PGE2 tablet vs PGE2 pessary/suppository (all women), Outcome 1 Caesarean section.

Comparison 22 (6.1) PGE2 tablet vs PGE2 pessary/suppository (all women), Outcome 2 Oxytocin augmentation.

Comparison 22 (6.1) PGE2 tablet vs PGE2 pessary/suppository (all women), Outcome 3 Uterine hyperstimulation without FHR changes.

Comparison 22 (6.1) PGE2 tablet vs PGE2 pessary/suppository (all women), Outcome 4 Epidural analgesia.

Comparison 22 (6.1) PGE2 tablet vs PGE2 pessary/suppository (all women), Outcome 5 Instrumental vaginal delivery.

Comparison 22 (6.1) PGE2 tablet vs PGE2 pessary/suppository (all women), Outcome 6 Apgar score < 7 at 5 minutes.
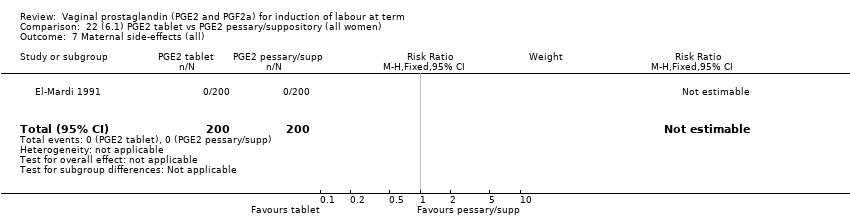
Comparison 22 (6.1) PGE2 tablet vs PGE2 pessary/suppository (all women), Outcome 7 Maternal side‐effects (all).

Comparison 22 (6.1) PGE2 tablet vs PGE2 pessary/suppository (all women), Outcome 8 Vomitting (maternal).

Comparison 22 (6.1) PGE2 tablet vs PGE2 pessary/suppository (all women), Outcome 9 Diarrhoea (maternal).
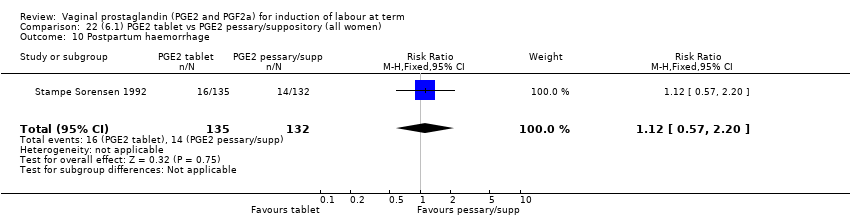
Comparison 22 (6.1) PGE2 tablet vs PGE2 pessary/suppository (all women), Outcome 10 Postpartum haemorrhage.
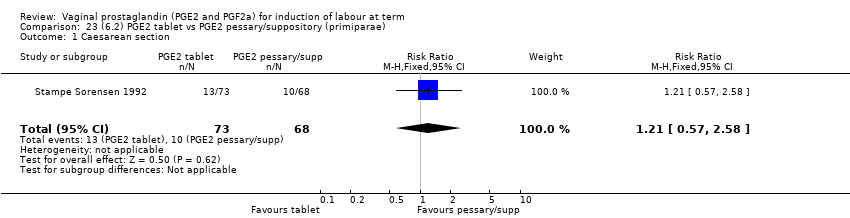
Comparison 23 (6.2) PGE2 tablet vs PGE2 pessary/suppository (primiparae), Outcome 1 Caesarean section.

Comparison 23 (6.2) PGE2 tablet vs PGE2 pessary/suppository (primiparae), Outcome 2 Oxytocin augmentation.

Comparison 24 (6.3) PGE2 tablet vs PGE2 pessary/suppository (multiparae), Outcome 1 Caesarean section.

Comparison 24 (6.3) PGE2 tablet vs PGE2 pessary/suppository (multiparae), Outcome 2 Oxytocin augmentation.

Comparison 25 (6.4) PGE2 tablet vs PGE2 pessary/suppository (women with an unfavourable cervix), Outcome 1 Caesarean section.

Comparison 25 (6.4) PGE2 tablet vs PGE2 pessary/suppository (women with an unfavourable cervix), Outcome 2 Oxytocin augmentation.

Comparison 25 (6.4) PGE2 tablet vs PGE2 pessary/suppository (women with an unfavourable cervix), Outcome 3 Uterine hyperstimulation without FHR changes.
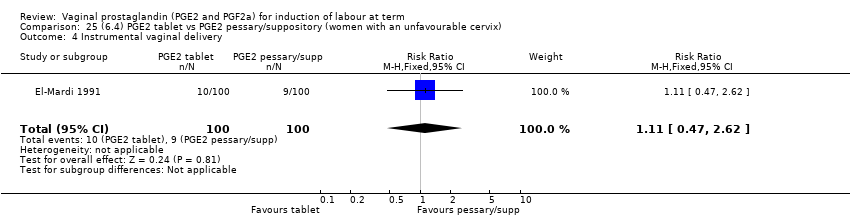
Comparison 25 (6.4) PGE2 tablet vs PGE2 pessary/suppository (women with an unfavourable cervix), Outcome 4 Instrumental vaginal delivery.

Comparison 25 (6.4) PGE2 tablet vs PGE2 pessary/suppository (women with an unfavourable cervix), Outcome 5 Apgar score < 7 at 5 minutes.

Comparison 25 (6.4) PGE2 tablet vs PGE2 pessary/suppository (women with an unfavourable cervix), Outcome 6 Maternal side‐effects (all).

Comparison 25 (6.4) PGE2 tablet vs PGE2 pessary/suppository (women with an unfavourable cervix), Outcome 7 Vomitting (maternal).
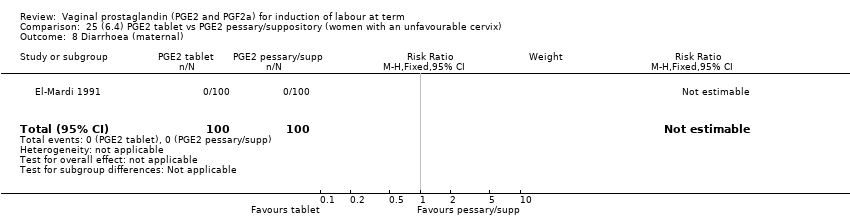
Comparison 25 (6.4) PGE2 tablet vs PGE2 pessary/suppository (women with an unfavourable cervix), Outcome 8 Diarrhoea (maternal).

Comparison 26 (7.1) PGE2 (controlled release) vs all PGE2 delivery systems (all women), Outcome 1 Vaginal delivery not achieved within 24 hours.
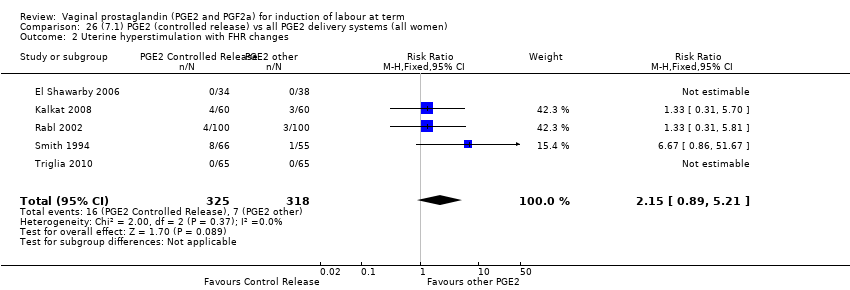
Comparison 26 (7.1) PGE2 (controlled release) vs all PGE2 delivery systems (all women), Outcome 2 Uterine hyperstimulation with FHR changes.

Comparison 26 (7.1) PGE2 (controlled release) vs all PGE2 delivery systems (all women), Outcome 3 Caesarean section.
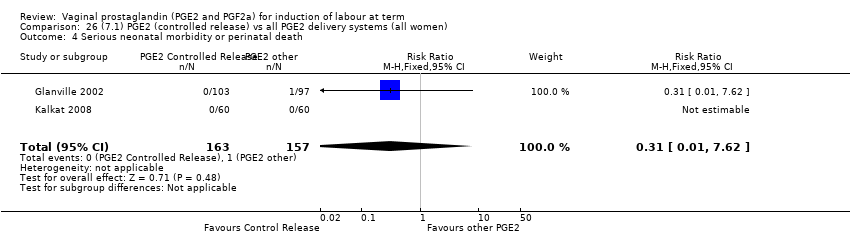
Comparison 26 (7.1) PGE2 (controlled release) vs all PGE2 delivery systems (all women), Outcome 4 Serious neonatal morbidity or perinatal death.
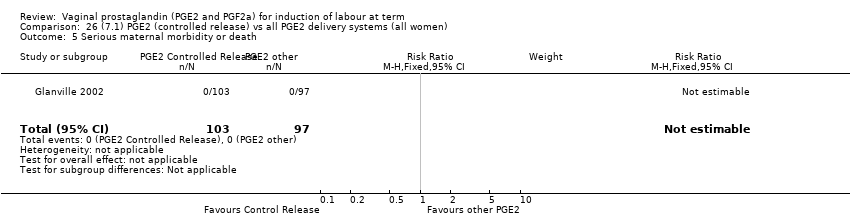
Comparison 26 (7.1) PGE2 (controlled release) vs all PGE2 delivery systems (all women), Outcome 5 Serious maternal morbidity or death.

Comparison 26 (7.1) PGE2 (controlled release) vs all PGE2 delivery systems (all women), Outcome 6 Cervix unfavourable/unchanged after 12 ‐24 hours (BS < 3).

Comparison 26 (7.1) PGE2 (controlled release) vs all PGE2 delivery systems (all women), Outcome 7 Oxytocin augmentation.
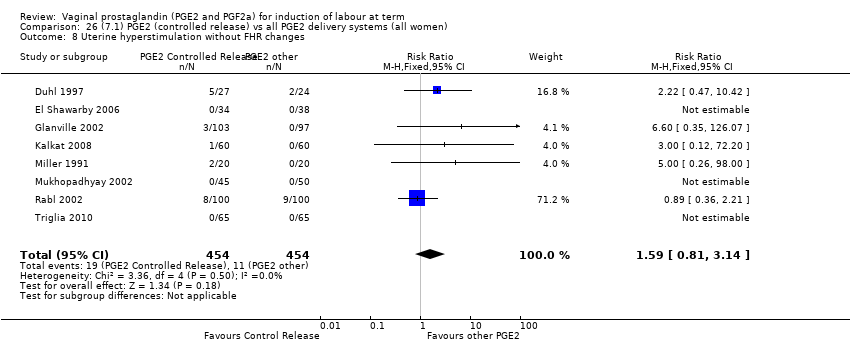
Comparison 26 (7.1) PGE2 (controlled release) vs all PGE2 delivery systems (all women), Outcome 8 Uterine hyperstimulation without FHR changes.

Comparison 26 (7.1) PGE2 (controlled release) vs all PGE2 delivery systems (all women), Outcome 9 Uterine rupture.

Comparison 26 (7.1) PGE2 (controlled release) vs all PGE2 delivery systems (all women), Outcome 10 Epidural analgesia.
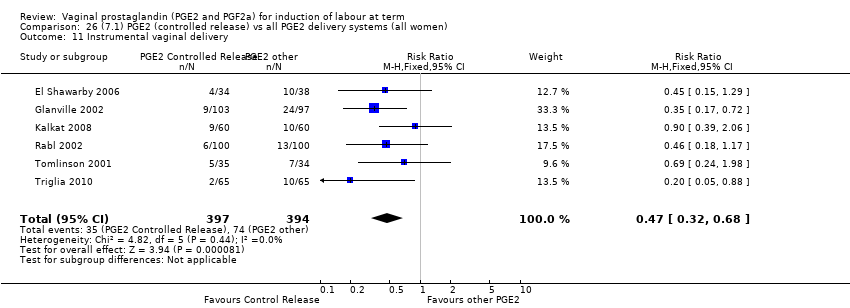
Comparison 26 (7.1) PGE2 (controlled release) vs all PGE2 delivery systems (all women), Outcome 11 Instrumental vaginal delivery.

Comparison 26 (7.1) PGE2 (controlled release) vs all PGE2 delivery systems (all women), Outcome 12 Postpartum haemorrhage.

Comparison 26 (7.1) PGE2 (controlled release) vs all PGE2 delivery systems (all women), Outcome 13 Apgar score < 7 at 5 minutes.
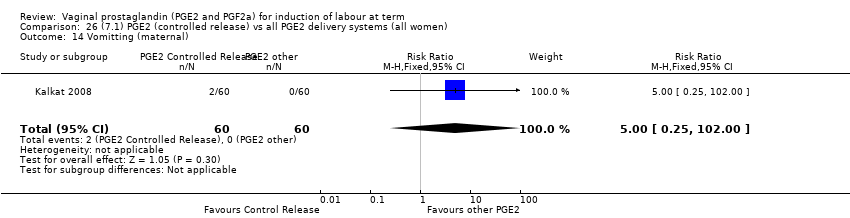
Comparison 26 (7.1) PGE2 (controlled release) vs all PGE2 delivery systems (all women), Outcome 14 Vomitting (maternal).

Comparison 26 (7.1) PGE2 (controlled release) vs all PGE2 delivery systems (all women), Outcome 15 Diarrhoea (maternal).

Comparison 27 (7.2) PGE2 (controlled release) vs all PGE2 delivery systems (primiparae), Outcome 1 Vaginal delivery not achieved within 24 hours.
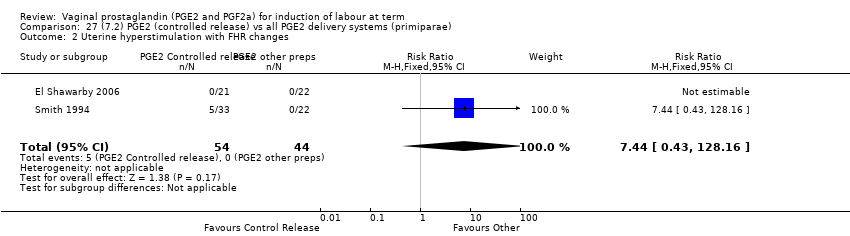
Comparison 27 (7.2) PGE2 (controlled release) vs all PGE2 delivery systems (primiparae), Outcome 2 Uterine hyperstimulation with FHR changes.
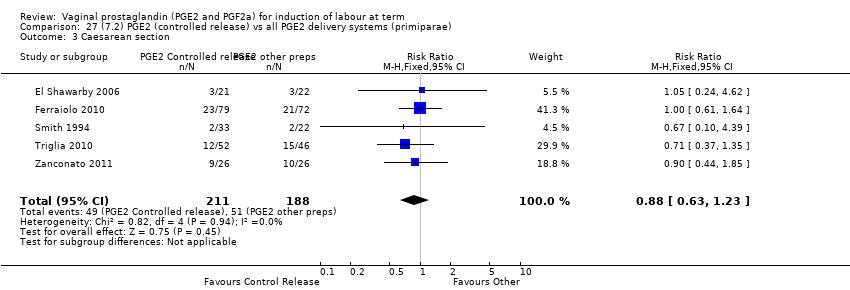
Comparison 27 (7.2) PGE2 (controlled release) vs all PGE2 delivery systems (primiparae), Outcome 3 Caesarean section.

Comparison 27 (7.2) PGE2 (controlled release) vs all PGE2 delivery systems (primiparae), Outcome 4 Cervix unfavourable/unchanged after 12‐24 hours.
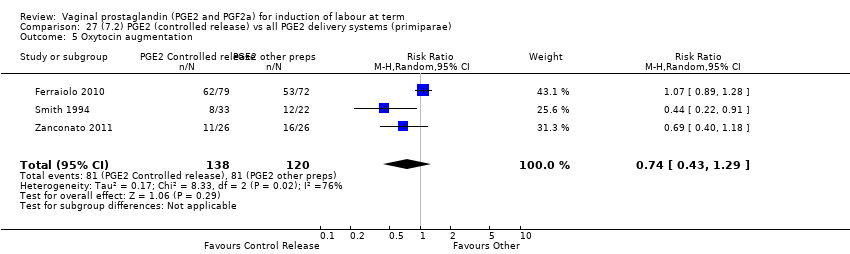
Comparison 27 (7.2) PGE2 (controlled release) vs all PGE2 delivery systems (primiparae), Outcome 5 Oxytocin augmentation.
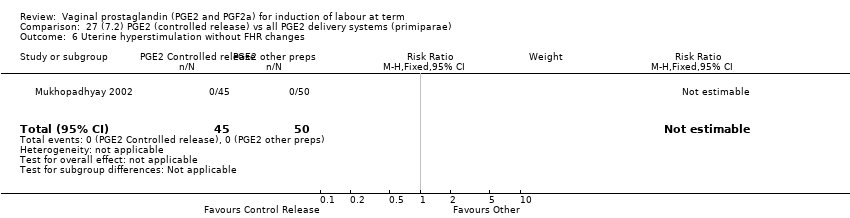
Comparison 27 (7.2) PGE2 (controlled release) vs all PGE2 delivery systems (primiparae), Outcome 6 Uterine hyperstimulation without FHR changes.
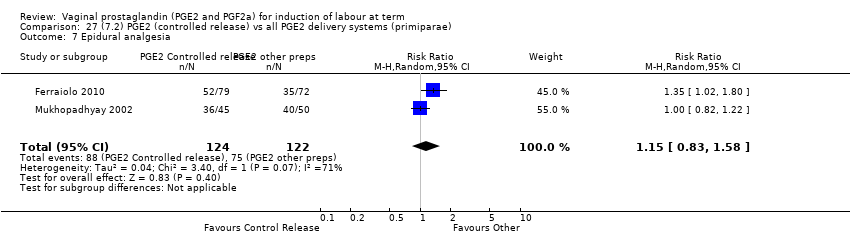
Comparison 27 (7.2) PGE2 (controlled release) vs all PGE2 delivery systems (primiparae), Outcome 7 Epidural analgesia.

Comparison 27 (7.2) PGE2 (controlled release) vs all PGE2 delivery systems (primiparae), Outcome 8 Instrumental vaginal delivery.

Comparison 28 (7.3) PGE2 (controlled release) vs all PGE2 delivery systems (multiparae), Outcome 1 Vaginal delivery not achieved within 24 hours.

Comparison 28 (7.3) PGE2 (controlled release) vs all PGE2 delivery systems (multiparae), Outcome 2 Uterine hyperstimulation with FHR changes.
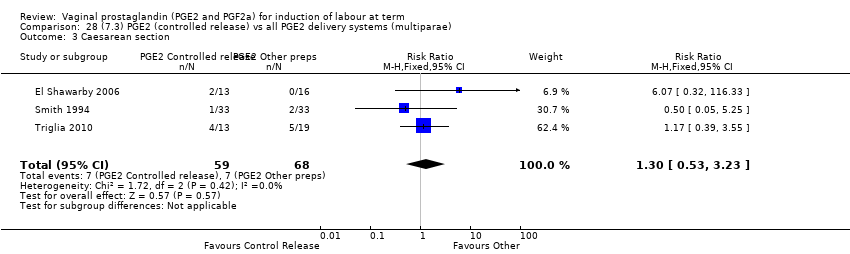
Comparison 28 (7.3) PGE2 (controlled release) vs all PGE2 delivery systems (multiparae), Outcome 3 Caesarean section.

Comparison 28 (7.3) PGE2 (controlled release) vs all PGE2 delivery systems (multiparae), Outcome 4 Oxytocin augmentation.

Comparison 28 (7.3) PGE2 (controlled release) vs all PGE2 delivery systems (multiparae), Outcome 5 Instrumental vaginal delivery.

Comparison 29 (7.4) PGE2 (controlled release) vs all PGE2 delivery systems (women with an unfavourable cervix), Outcome 1 Vaginal delivery not achieved within 24 hours.

Comparison 29 (7.4) PGE2 (controlled release) vs all PGE2 delivery systems (women with an unfavourable cervix), Outcome 2 Uterine hyperstimulation with FHR changes.
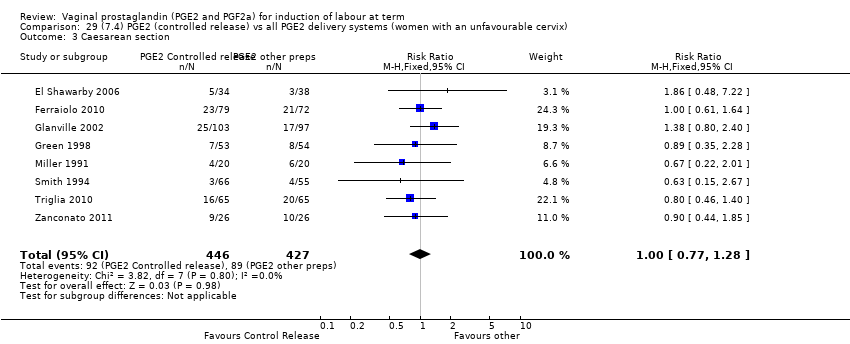
Comparison 29 (7.4) PGE2 (controlled release) vs all PGE2 delivery systems (women with an unfavourable cervix), Outcome 3 Caesarean section.

Comparison 29 (7.4) PGE2 (controlled release) vs all PGE2 delivery systems (women with an unfavourable cervix), Outcome 4 Serious neonatal morbidity or perinatal death.

Comparison 29 (7.4) PGE2 (controlled release) vs all PGE2 delivery systems (women with an unfavourable cervix), Outcome 5 Serious maternal morbidity or death.

Comparison 29 (7.4) PGE2 (controlled release) vs all PGE2 delivery systems (women with an unfavourable cervix), Outcome 6 Cervix unfavourable/unchanged after 12‐24 hours.

Comparison 29 (7.4) PGE2 (controlled release) vs all PGE2 delivery systems (women with an unfavourable cervix), Outcome 7 Oxytocin augmentation.
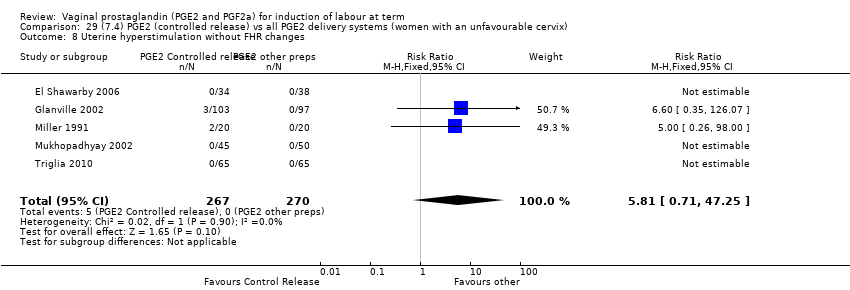
Comparison 29 (7.4) PGE2 (controlled release) vs all PGE2 delivery systems (women with an unfavourable cervix), Outcome 8 Uterine hyperstimulation without FHR changes.

Comparison 29 (7.4) PGE2 (controlled release) vs all PGE2 delivery systems (women with an unfavourable cervix), Outcome 9 Uterine rupture.

Comparison 29 (7.4) PGE2 (controlled release) vs all PGE2 delivery systems (women with an unfavourable cervix), Outcome 10 Epidural analgesia.
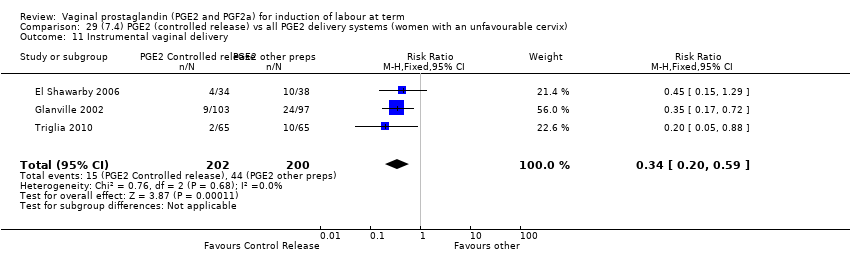
Comparison 29 (7.4) PGE2 (controlled release) vs all PGE2 delivery systems (women with an unfavourable cervix), Outcome 11 Instrumental vaginal delivery.

Comparison 29 (7.4) PGE2 (controlled release) vs all PGE2 delivery systems (women with an unfavourable cervix), Outcome 12 Apgar score < 7 at 5 minutes.

Comparison 29 (7.4) PGE2 (controlled release) vs all PGE2 delivery systems (women with an unfavourable cervix), Outcome 13 Postpartum haemorrhage.
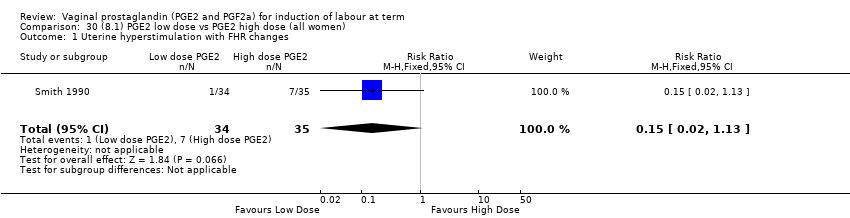
Comparison 30 (8.1) PGE2 low dose vs PGE2 high dose (all women), Outcome 1 Uterine hyperstimulation with FHR changes.

Comparison 30 (8.1) PGE2 low dose vs PGE2 high dose (all women), Outcome 2 Caesarean section.

Comparison 30 (8.1) PGE2 low dose vs PGE2 high dose (all women), Outcome 3 Serious neonatal morbidity or perinatal death.

Comparison 30 (8.1) PGE2 low dose vs PGE2 high dose (all women), Outcome 4 Cervix unfavourable/unchanged after 12‐24hrs .

Comparison 30 (8.1) PGE2 low dose vs PGE2 high dose (all women), Outcome 5 Oxytocin augmentation.

Comparison 30 (8.1) PGE2 low dose vs PGE2 high dose (all women), Outcome 6 Uterine hyperstimulation without FHR changes.

Comparison 30 (8.1) PGE2 low dose vs PGE2 high dose (all women), Outcome 7 Epidural analgesia.

Comparison 30 (8.1) PGE2 low dose vs PGE2 high dose (all women), Outcome 8 Instrumental vaginal delivery.
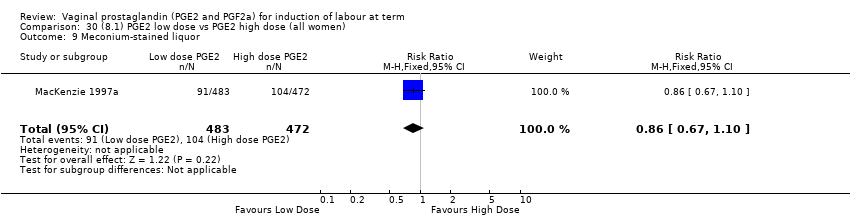
Comparison 30 (8.1) PGE2 low dose vs PGE2 high dose (all women), Outcome 9 Meconium‐stained liquor.
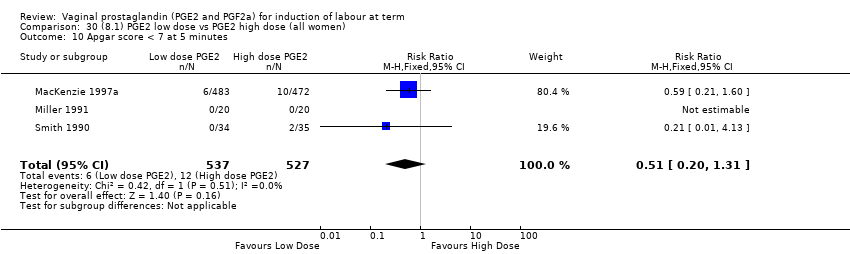
Comparison 30 (8.1) PGE2 low dose vs PGE2 high dose (all women), Outcome 10 Apgar score < 7 at 5 minutes.
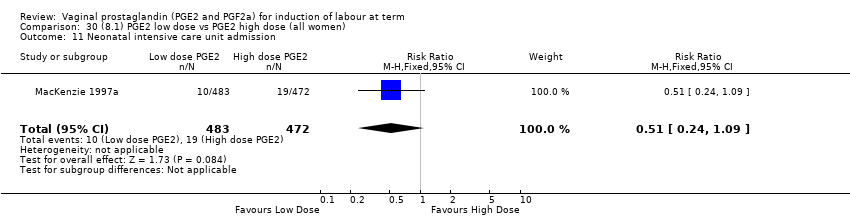
Comparison 30 (8.1) PGE2 low dose vs PGE2 high dose (all women), Outcome 11 Neonatal intensive care unit admission.

Comparison 30 (8.1) PGE2 low dose vs PGE2 high dose (all women), Outcome 12 Perinatal death.
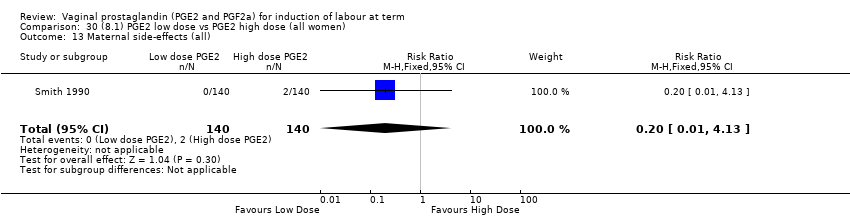
Comparison 30 (8.1) PGE2 low dose vs PGE2 high dose (all women), Outcome 13 Maternal side‐effects (all).

Comparison 30 (8.1) PGE2 low dose vs PGE2 high dose (all women), Outcome 14 Nausea (maternal).
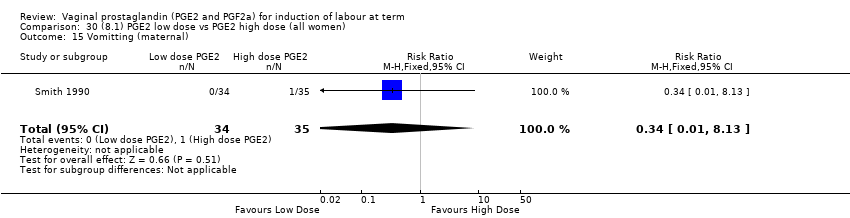
Comparison 30 (8.1) PGE2 low dose vs PGE2 high dose (all women), Outcome 15 Vomitting (maternal).

Comparison 30 (8.1) PGE2 low dose vs PGE2 high dose (all women), Outcome 16 Diarrhoea (maternal).

Comparison 30 (8.1) PGE2 low dose vs PGE2 high dose (all women), Outcome 17 Other maternal side‐effects.

Comparison 30 (8.1) PGE2 low dose vs PGE2 high dose (all women), Outcome 18 Postpartum haemorrhage.
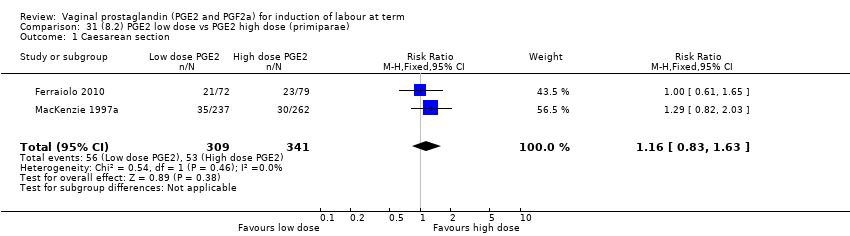
Comparison 31 (8.2) PGE2 low dose vs PGE2 high dose (primiparae), Outcome 1 Caesarean section.

Comparison 31 (8.2) PGE2 low dose vs PGE2 high dose (primiparae), Outcome 2 Serious neonatal morbidity or perinatal death.
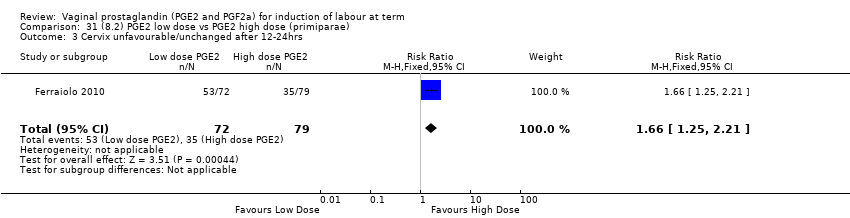
Comparison 31 (8.2) PGE2 low dose vs PGE2 high dose (primiparae), Outcome 3 Cervix unfavourable/unchanged after 12‐24hrs .

Comparison 31 (8.2) PGE2 low dose vs PGE2 high dose (primiparae), Outcome 4 Oxytocin augmentation.

Comparison 31 (8.2) PGE2 low dose vs PGE2 high dose (primiparae), Outcome 5 Epidural analgesia.

Comparison 31 (8.2) PGE2 low dose vs PGE2 high dose (primiparae), Outcome 6 Instrumental vaginal delivery.
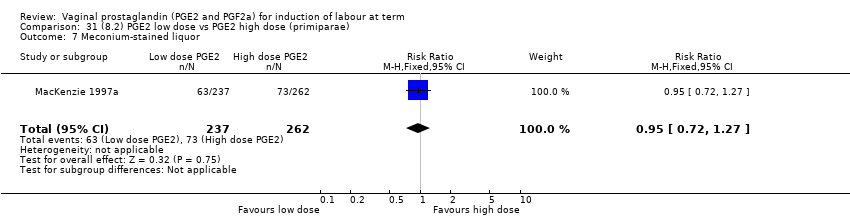
Comparison 31 (8.2) PGE2 low dose vs PGE2 high dose (primiparae), Outcome 7 Meconium‐stained liquor.

Comparison 31 (8.2) PGE2 low dose vs PGE2 high dose (primiparae), Outcome 8 Apgar score < 7 at 5 minutes.

Comparison 31 (8.2) PGE2 low dose vs PGE2 high dose (primiparae), Outcome 9 Neonatal intensive care unit admission.
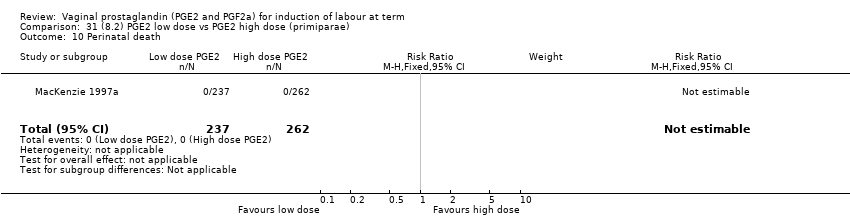
Comparison 31 (8.2) PGE2 low dose vs PGE2 high dose (primiparae), Outcome 10 Perinatal death.

Comparison 31 (8.2) PGE2 low dose vs PGE2 high dose (primiparae), Outcome 11 Postpartum haemorrhage.
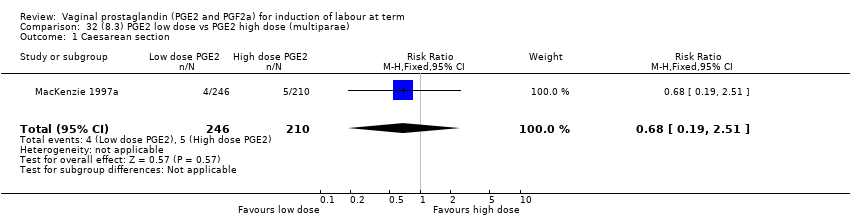
Comparison 32 (8.3) PGE2 low dose vs PGE2 high dose (multiparae), Outcome 1 Caesarean section.

Comparison 32 (8.3) PGE2 low dose vs PGE2 high dose (multiparae), Outcome 2 Serious neonatal morbidity or perinatal death.
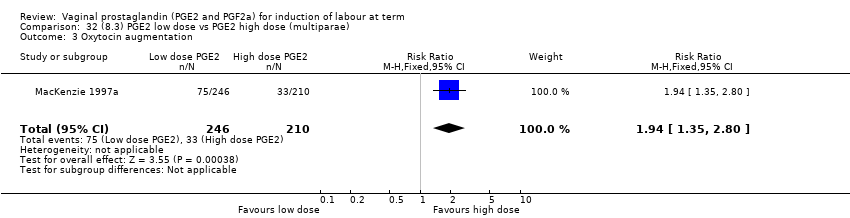
Comparison 32 (8.3) PGE2 low dose vs PGE2 high dose (multiparae), Outcome 3 Oxytocin augmentation.

Comparison 32 (8.3) PGE2 low dose vs PGE2 high dose (multiparae), Outcome 4 Epidural analgesia.

Comparison 32 (8.3) PGE2 low dose vs PGE2 high dose (multiparae), Outcome 5 Instrumental vaginal delivery.
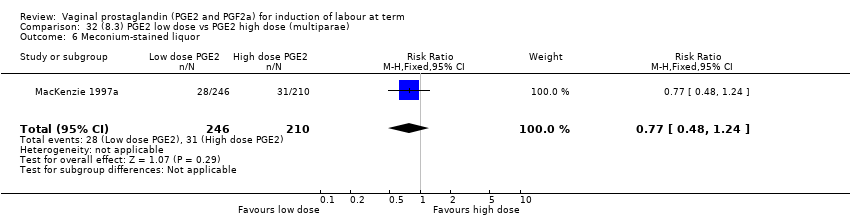
Comparison 32 (8.3) PGE2 low dose vs PGE2 high dose (multiparae), Outcome 6 Meconium‐stained liquor.

Comparison 32 (8.3) PGE2 low dose vs PGE2 high dose (multiparae), Outcome 7 Apgar score < 7 at 5 minutes.
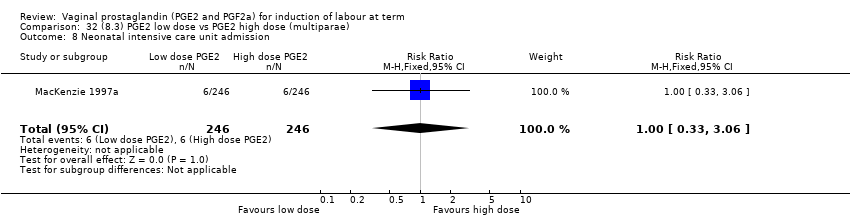
Comparison 32 (8.3) PGE2 low dose vs PGE2 high dose (multiparae), Outcome 8 Neonatal intensive care unit admission.

Comparison 32 (8.3) PGE2 low dose vs PGE2 high dose (multiparae), Outcome 9 Perinatal death.
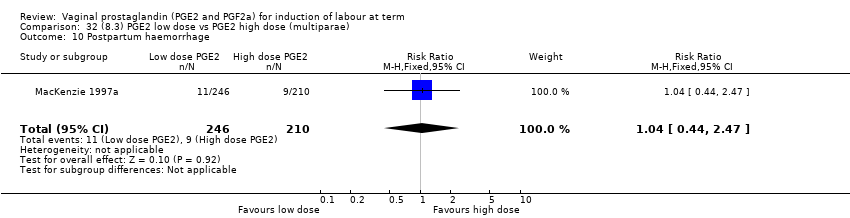
Comparison 32 (8.3) PGE2 low dose vs PGE2 high dose (multiparae), Outcome 10 Postpartum haemorrhage.
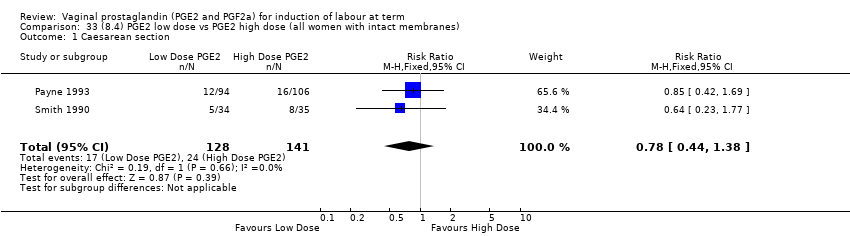
Comparison 33 (8.4) PGE2 low dose vs PGE2 high dose (all women with intact membranes), Outcome 1 Caesarean section.
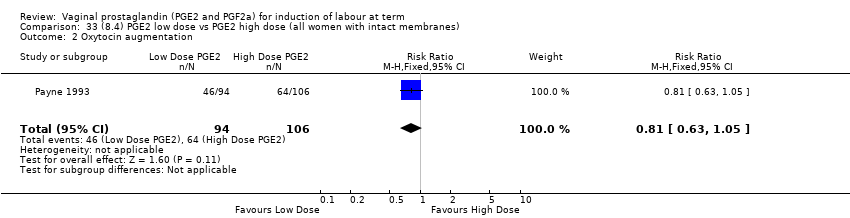
Comparison 33 (8.4) PGE2 low dose vs PGE2 high dose (all women with intact membranes), Outcome 2 Oxytocin augmentation.
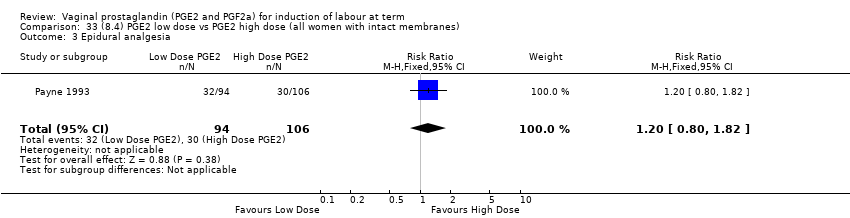
Comparison 33 (8.4) PGE2 low dose vs PGE2 high dose (all women with intact membranes), Outcome 3 Epidural analgesia.
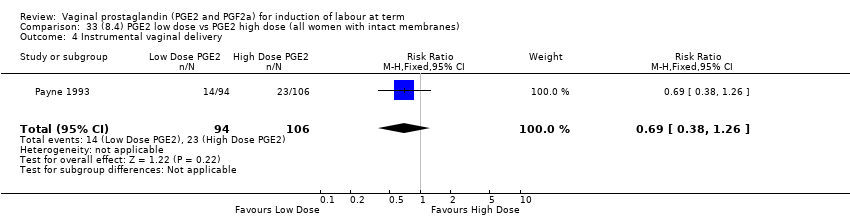
Comparison 33 (8.4) PGE2 low dose vs PGE2 high dose (all women with intact membranes), Outcome 4 Instrumental vaginal delivery.
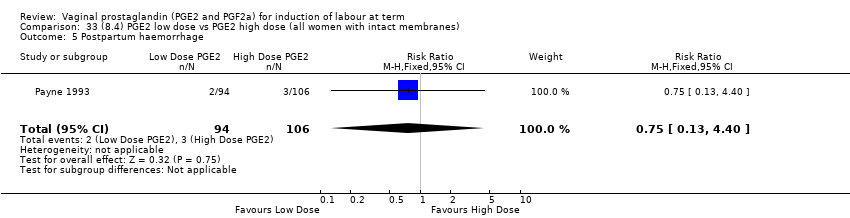
Comparison 33 (8.4) PGE2 low dose vs PGE2 high dose (all women with intact membranes), Outcome 5 Postpartum haemorrhage.

Comparison 33 (8.4) PGE2 low dose vs PGE2 high dose (all women with intact membranes), Outcome 6 Uterine hyperstimulation with FHR changes.

Comparison 33 (8.4) PGE2 low dose vs PGE2 high dose (all women with intact membranes), Outcome 7 Apgar score < 7 at 5 minutes.

Comparison 33 (8.4) PGE2 low dose vs PGE2 high dose (all women with intact membranes), Outcome 8 Maternal side‐effects (all).
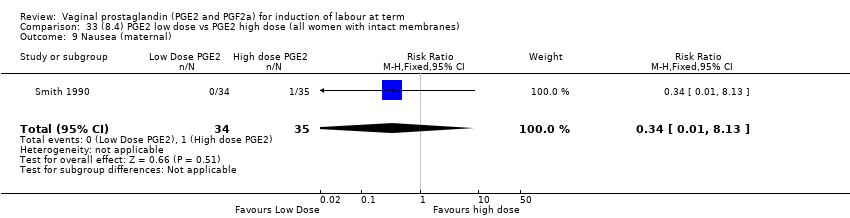
Comparison 33 (8.4) PGE2 low dose vs PGE2 high dose (all women with intact membranes), Outcome 9 Nausea (maternal).

Comparison 33 (8.4) PGE2 low dose vs PGE2 high dose (all women with intact membranes), Outcome 10 Vomitting (maternal).

Comparison 33 (8.4) PGE2 low dose vs PGE2 high dose (all women with intact membranes), Outcome 11 Diarrhoea (maternal).
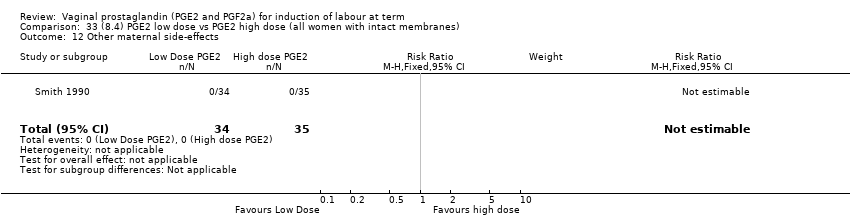
Comparison 33 (8.4) PGE2 low dose vs PGE2 high dose (all women with intact membranes), Outcome 12 Other maternal side‐effects.

Comparison 34 (8.5) PGE2 low dose vs PGE2 high dose (all women, unfavourable cervix), Outcome 1 Uterine hyperstimulation with FHR changes.
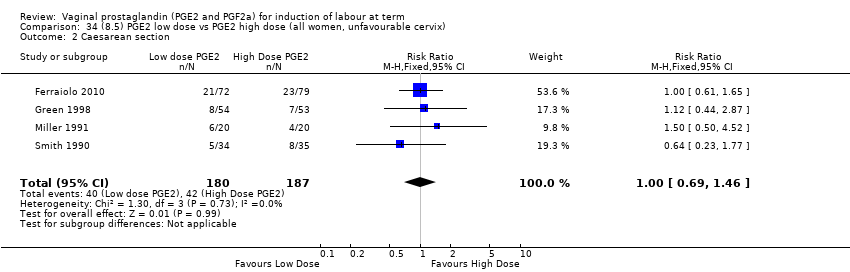
Comparison 34 (8.5) PGE2 low dose vs PGE2 high dose (all women, unfavourable cervix), Outcome 2 Caesarean section.
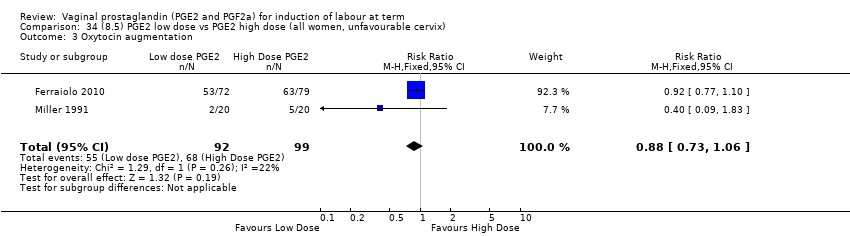
Comparison 34 (8.5) PGE2 low dose vs PGE2 high dose (all women, unfavourable cervix), Outcome 3 Oxytocin augmentation.
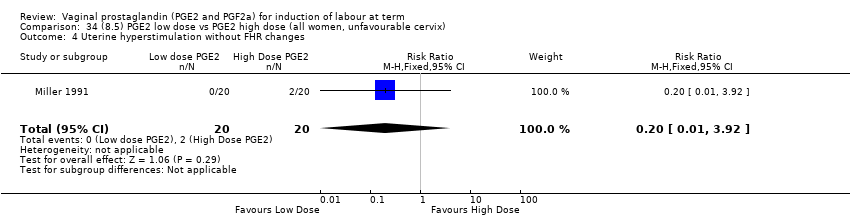
Comparison 34 (8.5) PGE2 low dose vs PGE2 high dose (all women, unfavourable cervix), Outcome 4 Uterine hyperstimulation without FHR changes.

Comparison 34 (8.5) PGE2 low dose vs PGE2 high dose (all women, unfavourable cervix), Outcome 5 Apgar score < 7 at 5 minutes.

Comparison 34 (8.5) PGE2 low dose vs PGE2 high dose (all women, unfavourable cervix), Outcome 6 Maternal side‐effects (all).
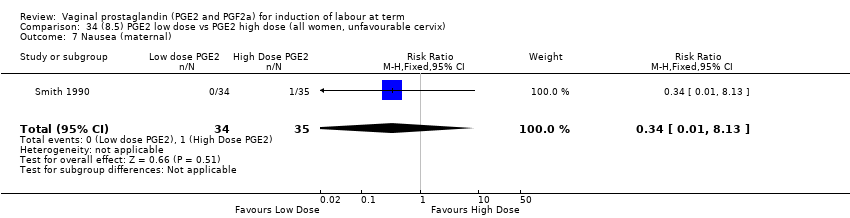
Comparison 34 (8.5) PGE2 low dose vs PGE2 high dose (all women, unfavourable cervix), Outcome 7 Nausea (maternal).

Comparison 34 (8.5) PGE2 low dose vs PGE2 high dose (all women, unfavourable cervix), Outcome 8 Vomitting (maternal).

Comparison 34 (8.5) PGE2 low dose vs PGE2 high dose (all women, unfavourable cervix), Outcome 9 Diarrhoea (maternal).

Comparison 34 (8.5) PGE2 low dose vs PGE2 high dose (all women, unfavourable cervix), Outcome 10 Other maternal side‐effects.
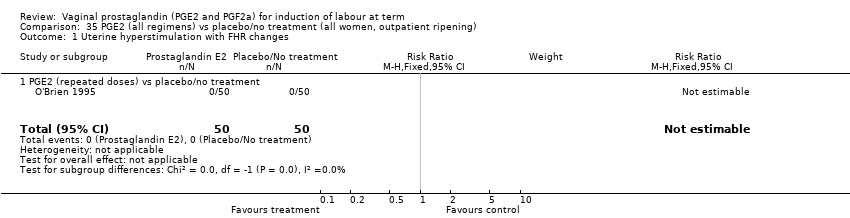
Comparison 35 PGE2 (all regimens) vs placebo/no treatment (all women, outpatient ripening), Outcome 1 Uterine hyperstimulation with FHR changes.
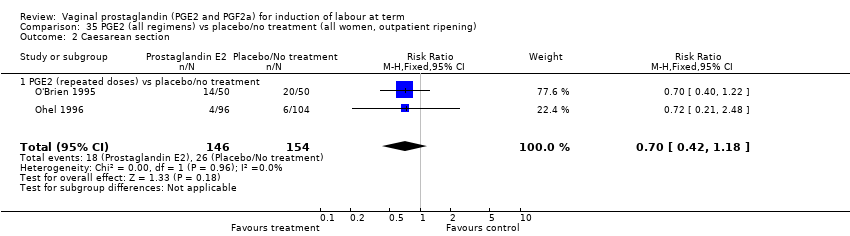
Comparison 35 PGE2 (all regimens) vs placebo/no treatment (all women, outpatient ripening), Outcome 2 Caesarean section.

Comparison 35 PGE2 (all regimens) vs placebo/no treatment (all women, outpatient ripening), Outcome 3 Cervix unfavourable/unchanged after 12 to 24 hours.
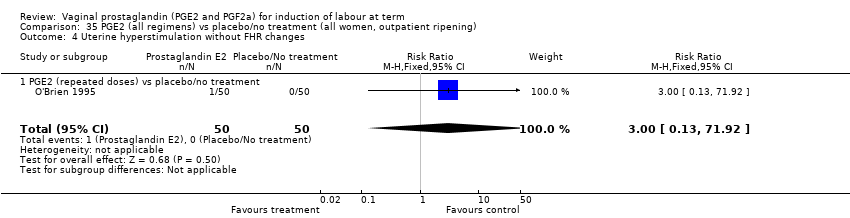
Comparison 35 PGE2 (all regimens) vs placebo/no treatment (all women, outpatient ripening), Outcome 4 Uterine hyperstimulation without FHR changes.

Comparison 35 PGE2 (all regimens) vs placebo/no treatment (all women, outpatient ripening), Outcome 5 Epidural analgesia.

Comparison 35 PGE2 (all regimens) vs placebo/no treatment (all women, outpatient ripening), Outcome 6 Meconium‐stained liquor.
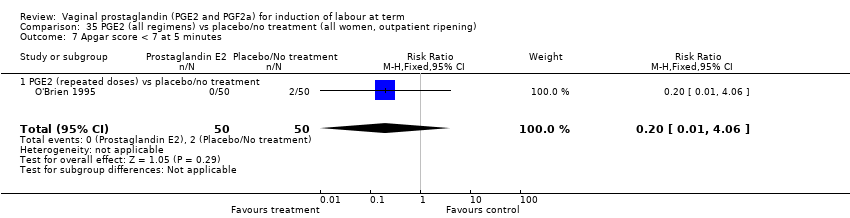
Comparison 35 PGE2 (all regimens) vs placebo/no treatment (all women, outpatient ripening), Outcome 7 Apgar score < 7 at 5 minutes.

Comparison 35 PGE2 (all regimens) vs placebo/no treatment (all women, outpatient ripening), Outcome 8 Neonatal intensive care unit admission.
| PGE2 compared with placebo or no treatment for induction of labour at term (all women) | ||||||
| Patient or population: patients with induction of labour at term | ||||||
| Outcomes | Illustrative comparative risks* (95% CI) | Relative effect | No of Participants | Quality of the evidence | Comments | |
| Assumed risk | Corresponding risk | |||||
| Placebo or no treatment (all women) | PGE2 (all regimens) | |||||
| Vaginal delivery not achieved within 24 hours | Study population | RR 0.32 | 384 | ⊕⊝⊝⊝ | Probable reduction in time to delivery using PGE2. Useable data only available in 2 of 15 studies reporting time as an outcome. 39 studies in this comparison. | |
| 989 per 1000 | 317 per 1000 | |||||
| Moderate | ||||||
| 950 per 1000 | 304 per 1000 | |||||
| Uterine hyperstimulation with FHR changes | Study population | RR 3.16 | 1359 | ⊕⊕⊕⊝ | The risk of bias is "unclear" for most quality domain of the 15 RCT's and this may be a serious limitation. | |
| 10 per 1000 | 33 per 1000 | |||||
| Moderate | ||||||
| 0 per 1000 | 0 per 1000 | |||||
| Caesarean section | Study population | RR 0.91 | 6599 | ⊕⊕⊕⊕ | The risk of bias is unclear for most of the studies, but the largest study with a quarter of the participants) has a low risk of bias. | |
| 148 per 1000 | 134 per 1000 | |||||
| Moderate | ||||||
| 166 per 1000 | 151 per 1000 | |||||
| Serious neonatal morbidity or perinatal death | Study population | RR 0.46 | 3638 | ⊕⊕⊝⊝ | Neonatal morbidity or mortality is rare, several studies have no events. Underpowered to detect a difference even if one exists. | |
| 2 per 1000 | 1 per 1000 | |||||
| Moderate | ||||||
| 0 per 1000 | 0 per 1000 | |||||
| Serious maternal morbidity or death | Study population | RR 2.23 | 530 | ⊕⊝⊝⊝ | A very rare outcome, so underpowered to detect a difference if one exists. | |
| 4 per 1000 | 9 per 1000 | |||||
| Moderate | ||||||
| 0 per 1000 | 0 per 1000 | |||||
| *The basis for the assumed risk (e.g. the median control group risk across studies) is provided in footnotes. The corresponding risk (and its 95% confidence interval) is based on the assumed risk in the comparison group and the relative effect of the intervention (and its 95% CI). | ||||||
| GRADE Working Group grades of evidence | ||||||
| (4.1) PGE2 gel compared with PGE2 tablet (all women) for induction of labour at term | ||||||
| Patient or population: patients with induction of labour at term | ||||||
| Outcomes | Illustrative comparative risks* (95% CI) | Relative effect | No of Participants | Quality of the evidence | Comments | |
| Assumed risk | Corresponding risk | |||||
| PGE2 tablet (all women) | (4.1) PGE2 gel | |||||
| Vaginal delivery not achieved within 24 hours | Study population | RR 1.03 | 566 | ⊕⊕⊕⊝ | Most quality domains unclear or low risk but loss to follow up and reporting bias high in 1 trial. | |
| 369 per 1000 | 380 per 1000 | |||||
| Moderate | ||||||
| 528 per 1000 | 544 per 1000 | |||||
| Uterine hyperstimulation with FHR changes | Study population | RR 2 | 200 | ⊕⊝⊝⊝ | Only 1 small trial with an unclear risk of bias reports this outcome. | |
| 10 per 1000 | 20 per 1000 | |||||
| Moderate | ||||||
| 10 per 1000 | 20 per 1000 | |||||
| Caesarean section | Study population | RR 0.91 | 1046 | ⊕⊕⊕⊕ | The risk of bias is unclear for most studies, but the largest study has a low risk of bias. | |
| 198 per 1000 | 180 per 1000 | |||||
| Moderate | ||||||
| 201 per 1000 | 183 per 1000 | |||||
| Serious maternal morbidity or death | Study population | RR 0.33 | 200 | See comment | Study far too small to detect a difference. | |
| 10 per 1000 | 3 per 1000 | |||||
| Moderate | ||||||
| 10 per 1000 | 3 per 1000 | |||||
| Instrumental vaginal delivery | Study population | RR 0.77 | 565 | ⊕⊕⊕⊝ | The largest study has a high risk of bias. This is a secondary outcome in this review. | |
| 287 per 1000 | 221 per 1000 | |||||
| Moderate | ||||||
| 241 per 1000 | 186 per 1000 | |||||
| *The basis for the assumed risk (e.g. the median control group risk across studies) is provided in footnotes. The corresponding risk (and its 95% confidence interval) is based on the assumed risk in the comparison group and the relative effect of the intervention (and its 95% CI). | ||||||
| GRADE Working Group grades of evidence | ||||||
| (7.1) PGE2 (controlled release) compared with all PGE2 delivery systems (all women) for induction of labour at term | ||||||
| Patient or population: patients with induction of labour at term | ||||||
| Outcomes | Illustrative comparative risks* (95% CI) | Relative effect | No of Participants | Quality of the evidence | Comments | |
| Assumed risk | Corresponding risk | |||||
| All PGE2 delivery systems (all women) | (7.1) PGE2 (controlled release) | |||||
| Vaginal delivery not achieved within 24 hours | Study population | RR 1.15 | 450 | ⊕⊕⊕⊝ | Although all published after 2002, the risk of bias for most quality domains unclear. | |
| 373 per 1000 | 429 per 1000 | |||||
| Moderate | ||||||
| 333 per 1000 | 383 per 1000 | |||||
| Uterine hyperstimulation with FHR changes | Study population | RR 2.15 | 643 | ⊕⊕⊕⊝ | 4 of the studies are recent but risk of bias unclear. | |
| 22 per 1000 | 47 per 1000 | |||||
| Moderate | ||||||
| 18 per 1000 | 39 per 1000 | |||||
| Caesarean section | Study population | RR 1.02 | 1262 | ⊕⊕⊕⊝ | Risk of bias unclear, recent studies poorly reported. | |
| 201 per 1000 | 205 per 1000 | |||||
| Moderate | ||||||
| 177 per 1000 | 181 per 1000 | |||||
| Serious neonatal morbidity or perinatal death | Study population | RR 0.31 | 320 | ⊕⊕⊝⊝ | Underpowered to detect effect even if exists. | |
| 6 per 1000 | 2 per 1000 | |||||
| Moderate | ||||||
| 5 per 1000 | 2 per 1000 | |||||
| *The basis for the assumed risk (e.g. the median control group risk across studies) is provided in footnotes. The corresponding risk (and its 95% confidence interval) is based on the assumed risk in the comparison group and the relative effect of the intervention (and its 95% CI). | ||||||
| GRADE Working Group grades of evidence | ||||||
| Methodological item | Adequate | Inadequate |
| Generation of random sequence | Computer‐generated sequence, random number tables, lot drawing, coin tossing, shuffling cards, throwing dice. | Case number, date of birth, date of admission, alternation. |
| Concealment of allocation | Central randomisation, coded drug boxes, sequentially sealed opaque envelopes. | Open allocation sequence, any procedure based on inadequate generation. |
| Outcome or subgroup title | No. of studies | No. of participants | Statistical method | Effect size |
| 1 Vaginal delivery not achieved within 24 hours Show forest plot | 2 | 384 | Risk Ratio (M‐H, Random, 95% CI) | 0.32 [0.02, 4.83] |
| 1.1 PGE2 (once only) vs placebo/no treatment | 1 | 39 | Risk Ratio (M‐H, Random, 95% CI) | 0.88 [0.67, 1.15] |
| 1.2 PGE2 (repeated doses) vs placebo/no treatment | 1 | 345 | Risk Ratio (M‐H, Random, 95% CI) | 0.12 [0.08, 0.18] |
| 2 Uterine hyperstimulation with FHR changes Show forest plot | 15 | 1359 | Risk Ratio (M‐H, Fixed, 95% CI) | 3.16 [1.67, 5.98] |
| 2.1 PGE2 (once only) vs placebo/no treatment | 7 | 515 | Risk Ratio (M‐H, Fixed, 95% CI) | 1.38 [0.46, 4.15] |
| 2.2 PGE2 (repeated doses) vs placebo/no treatment | 3 | 208 | Risk Ratio (M‐H, Fixed, 95% CI) | 5.34 [0.27, 106.70] |
| 2.3 PGE2 (sustained release) vs placebo/no treatment | 5 | 636 | Risk Ratio (M‐H, Fixed, 95% CI) | 4.53 [1.92, 10.65] |
| 3 Caesarean section Show forest plot | 36 | 6599 | Risk Ratio (IV, Fixed, 95% CI) | 0.91 [0.81, 1.02] |
| 3.1 PGE2 (once only) vs placebo/no treatment | 16 | 1405 | Risk Ratio (IV, Fixed, 95% CI) | 1.01 [0.83, 1.24] |
| 3.2 PGE2 (repeated doses) vs placebo/no treatment | 15 | 4523 | Risk Ratio (IV, Fixed, 95% CI) | 0.86 [0.73, 1.02] |
| 3.3 PGE2 (sustained release) vs placebo/no treatment | 5 | 671 | Risk Ratio (IV, Fixed, 95% CI) | 0.85 [0.65, 1.12] |
| 4 Serious neonatal morbidity or perinatal death Show forest plot | 9 | 3638 | Risk Ratio (M‐H, Fixed, 95% CI) | 0.46 [0.09, 2.31] |
| 4.1 PGE2 (once only) vs placebo/no treatment | 2 | 85 | Risk Ratio (M‐H, Fixed, 95% CI) | 0.0 [0.0, 0.0] |
| 4.2 PGE2 (repeated doses) vs placebo/no treatment | 5 | 3269 | Risk Ratio (M‐H, Fixed, 95% CI) | 0.46 [0.09, 2.31] |
| 4.3 PGE2 (sustained release) vs placebo/no treatment | 2 | 284 | Risk Ratio (M‐H, Fixed, 95% CI) | 0.0 [0.0, 0.0] |
| 5 Serious maternal morbidity or death Show forest plot | 3 | 530 | Risk Ratio (M‐H, Fixed, 95% CI) | 2.23 [0.34, 14.76] |
| 5.1 PGE2 (once only) vs placebo | 2 | 461 | Risk Ratio (M‐H, Fixed, 95% CI) | 2.23 [0.34, 14.76] |
| 5.2 PGE2 (sustained release) vs placebo/no treatment | 1 | 69 | Risk Ratio (M‐H, Fixed, 95% CI) | 0.0 [0.0, 0.0] |
| 6 Cervix unfavourable/unchanged after 12 to 24 hours Show forest plot | 6 | 567 | Risk Ratio (M‐H, Random, 95% CI) | 0.41 [0.27, 0.65] |
| 6.1 PGE2 (once only) vs placebo/no treatment | 3 | 232 | Risk Ratio (M‐H, Random, 95% CI) | 0.54 [0.39, 0.73] |
| 6.2 PGE2 (repeated doses) vs placebo/no treatment | 2 | 235 | Risk Ratio (M‐H, Random, 95% CI) | 0.28 [0.07, 1.08] |
| 6.3 1.6.3 PGE2 (sustained release) vs placebo/no treatment | 1 | 100 | Risk Ratio (M‐H, Random, 95% CI) | 0.14 [0.05, 0.45] |
| 7 Oxytocin augmentation Show forest plot | 13 | 1421 | Risk Ratio (M‐H, Random, 95% CI) | 0.81 [0.63, 1.05] |
| 7.1 PGE2 (once only) vs placebo/no treatment | 7 | 545 | Risk Ratio (M‐H, Random, 95% CI) | 0.93 [0.59, 1.47] |
| 7.2 PGE2 (repeated doses) vs placebo/no treatment | 5 | 795 | Risk Ratio (M‐H, Random, 95% CI) | 0.80 [0.63, 1.01] |
| 7.3 PGE2 (sustained release) vs placebo/no treatment | 1 | 81 | Risk Ratio (M‐H, Random, 95% CI) | 0.36 [0.20, 0.64] |
| 8 Uterine hyperstimulation without FHR changes Show forest plot | 13 | 3636 | Risk Ratio (M‐H, Fixed, 95% CI) | 2.48 [1.17, 5.26] |
| 8.1 PGE2 (once only) vs placebo/no treatment | 6 | 443 | Risk Ratio (M‐H, Fixed, 95% CI) | 1.26 [0.33, 4.84] |
| 8.2 PGE2 (repeated doses) vs placebo/no treatment | 5 | 2953 | Risk Ratio (M‐H, Fixed, 95% CI) | 2.34 [0.78, 7.03] |
| 8.3 PGE2 (sustained release) vs placebo/no treatment | 2 | 240 | Risk Ratio (M‐H, Fixed, 95% CI) | 7.85 [1.05, 58.82] |
| 9 Uterine rupture Show forest plot | 2 | 2579 | Risk Ratio (M‐H, Fixed, 95% CI) | 2.90 [0.12, 68.50] |
| 9.1 PGE2 (once only) vs placebo/no treatment | 1 | 59 | Risk Ratio (M‐H, Fixed, 95% CI) | 2.90 [0.12, 68.50] |
| 9.2 PGE2 (repeated doses) vs placebo/no treatment | 1 | 2520 | Risk Ratio (M‐H, Fixed, 95% CI) | 0.0 [0.0, 0.0] |
| 10 Epidural analgesia Show forest plot | 7 | 3555 | Risk Ratio (M‐H, Random, 95% CI) | 1.16 [0.85, 1.60] |
| 10.1 PGE2 (once only) vs placebo/no treatment | 2 | 434 | Risk Ratio (M‐H, Random, 95% CI) | 0.80 [0.41, 1.55] |
| 10.2 PGE2 (repeated doses) vs placebo/no treatment | 4 | 3040 | Risk Ratio (M‐H, Random, 95% CI) | 1.41 [0.81, 2.44] |
| 10.3 PGE2 (sustained release) vs placebo/no treatment | 1 | 81 | Risk Ratio (M‐H, Random, 95% CI) | 1.18 [0.83, 1.68] |
| 11 Instrumental vaginal delivery Show forest plot | 13 | 4219 | Risk Ratio (M‐H, Fixed, 95% CI) | 0.95 [0.82, 1.10] |
| 11.1 PGE2 (once only) vs placebo/no treatment | 6 | 721 | Risk Ratio (M‐H, Fixed, 95% CI) | 0.84 [0.55, 1.28] |
| 11.2 PGE2 (repeated doses) vs placebo/no treatment | 5 | 3348 | Risk Ratio (M‐H, Fixed, 95% CI) | 0.97 [0.83, 1.13] |
| 11.3 PGE2 (sustained release) vs placebo/no treatment | 2 | 150 | Risk Ratio (M‐H, Fixed, 95% CI) | 1.01 [0.55, 1.86] |
| 12 Meconium‐stained liquor Show forest plot | 12 | 4245 | Risk Ratio (M‐H, Fixed, 95% CI) | 0.82 [0.68, 0.98] |
| 12.1 PGE2 (once only) vs placebo/no treatment | 5 | 704 | Risk Ratio (M‐H, Fixed, 95% CI) | 0.95 [0.65, 1.40] |
| 12.2 PGE2 (repeated doses) vs placebo/no treatment | 7 | 3541 | Risk Ratio (M‐H, Fixed, 95% CI) | 0.79 [0.64, 0.97] |
| 13 Apgar score < 7 at 5 minutes Show forest plot | 16 | 4481 | Risk Ratio (M‐H, Fixed, 95% CI) | 1.28 [0.86, 1.92] |
| 13.1 PGE2 (once only) vs placebo/no treatment | 9 | 1046 | Risk Ratio (M‐H, Fixed, 95% CI) | 0.56 [0.24, 1.30] |
| 13.2 PGE2 (repeated doses) vs placebo/no treatment | 6 | 3220 | Risk Ratio (M‐H, Fixed, 95% CI) | 1.34 [0.80, 2.27] |
| 13.3 PGE2 (sustained release) vs placebo/no treatment | 1 | 215 | Risk Ratio (M‐H, Fixed, 95% CI) | 6.21 [1.41, 27.34] |
| 14 Neonatal intensive care unit admission Show forest plot | 12 | 4022 | Risk Ratio (M‐H, Fixed, 95% CI) | 0.94 [0.78, 1.14] |
| 14.1 PGE2 (once only) vs placebo/no treatment | 4 | 681 | Risk Ratio (M‐H, Fixed, 95% CI) | 1.23 [0.70, 2.15] |
| 14.2 PGE2 (repeated doses) vs placebo/no treatment | 7 | 3272 | Risk Ratio (M‐H, Fixed, 95% CI) | 0.90 [0.73, 1.10] |
| 14.3 PGE2 (sustained release) vs placebo/no treatment | 1 | 69 | Risk Ratio (M‐H, Fixed, 95% CI) | 3.27 [0.36, 29.93] |
| 15 Perinatal death Show forest plot | 7 | 3648 | Risk Ratio (M‐H, Fixed, 95% CI) | 0.56 [0.14, 2.22] |
| 15.1 PGE2 (once only) vs placebo/no treatment | 2 | 431 | Risk Ratio (M‐H, Fixed, 95% CI) | 1.06 [0.07, 16.85] |
| 15.2 PGE2 (repeated doses) vs placebo/no treatment | 4 | 3148 | Risk Ratio (M‐H, Fixed, 95% CI) | 0.46 [0.09, 2.31] |
| 15.3 PGE2 (sustained release) vs placebo/no treatment | 1 | 69 | Risk Ratio (M‐H, Fixed, 95% CI) | 0.0 [0.0, 0.0] |
| 16 Maternal side‐effects (all) Show forest plot | 12 | 6780 | Risk Ratio (M‐H, Fixed, 95% CI) | 1.15 [0.80, 1.67] |
| 16.1 PGE2 (once only) vs placebo/no treatment | 6 | 577 | Risk Ratio (M‐H, Fixed, 95% CI) | 1.95 [1.02, 3.74] |
| 16.2 PGE2 (repeated doses) vs placebo/no treatment | 5 | 5558 | Risk Ratio (M‐H, Fixed, 95% CI) | 0.84 [0.53, 1.34] |
| 16.3 PGE2 (sustained release) vs placebo/no treatment | 1 | 645 | Risk Ratio (M‐H, Fixed, 95% CI) | 0.0 [0.0, 0.0] |
| 17 Nausea (maternal) Show forest plot | 1 | 84 | Risk Ratio (M‐H, Fixed, 95% CI) | 0.0 [0.0, 0.0] |
| 17.1 PGE2 (repeated doses) vs placebo/no treatment | 1 | 84 | Risk Ratio (M‐H, Fixed, 95% CI) | 0.0 [0.0, 0.0] |
| 18 Vomitting (maternal) Show forest plot | 3 | 2794 | Risk Ratio (M‐H, Fixed, 95% CI) | 1.16 [0.39, 3.39] |
| 18.1 PGE2 (once only) vs placebo/no treatment | 1 | 59 | Risk Ratio (M‐H, Fixed, 95% CI) | 0.97 [0.15, 6.41] |
| 18.2 PGE2 (repeated doses) vs placebo/no treatment | 1 | 2520 | Risk Ratio (M‐H, Fixed, 95% CI) | 1.25 [0.34, 4.65] |
| 18.3 PGE2 (sustained release) vs placebo/no treatment | 1 | 215 | Risk Ratio (M‐H, Fixed, 95% CI) | 0.0 [0.0, 0.0] |
| 19 Diarrhoea (maternal) Show forest plot | 3 | 2819 | Risk Ratio (M‐H, Fixed, 95% CI) | 7.01 [0.36, 135.59] |
| 19.1 PGE2 (repeated doses) vs placebo/no treatment | 2 | 2604 | Risk Ratio (M‐H, Fixed, 95% CI) | 7.01 [0.36, 135.59] |
| 19.2 PGE2 (sustained release) vs placebo/no treatment | 1 | 215 | Risk Ratio (M‐H, Fixed, 95% CI) | 0.0 [0.0, 0.0] |
| 20 Other maternal side‐effects Show forest plot | 7 | 871 | Risk Ratio (M‐H, Fixed, 95% CI) | 0.97 [0.62, 1.51] |
| 20.1 PGE2 (once only) vs placebo/no treatment | 4 | 356 | Risk Ratio (M‐H, Fixed, 95% CI) | 2.78 [0.97, 8.02] |
| 20.2 PGE2 (repeated doses) vs placebo/no treatment | 2 | 300 | Risk Ratio (M‐H, Fixed, 95% CI) | 0.69 [0.42, 1.15] |
| 20.3 PGE2 (sustained release) vs placebo/no treatment | 1 | 215 | Risk Ratio (M‐H, Fixed, 95% CI) | 0.0 [0.0, 0.0] |
| 21 Postpartum haemorrhage Show forest plot | 9 | 3537 | Risk Ratio (M‐H, Fixed, 95% CI) | 1.47 [1.04, 2.09] |
| 21.1 PGE2 (once only) vs placebo/no treatment | 4 | 282 | Risk Ratio (M‐H, Fixed, 95% CI) | 1.14 [0.33, 3.97] |
| 21.2 PGE2 (repeated doses) vs placebo/no treatment | 4 | 3040 | Risk Ratio (M‐H, Fixed, 95% CI) | 1.46 [1.01, 2.11] |
| 21.3 PGE2 (sustained release) vs placebo/no treatment | 1 | 215 | Risk Ratio (M‐H, Fixed, 95% CI) | 5.64 [0.27, 116.05] |
| 22 Serious maternal complication Show forest plot | 1 | 59 | Risk Ratio (M‐H, Fixed, 95% CI) | 2.90 [0.12, 68.50] |
| 22.1 PGE2 (once only) vs placebo/no treatment | 1 | 59 | Risk Ratio (M‐H, Fixed, 95% CI) | 2.90 [0.12, 68.50] |
| 23 Woman not satisfied Show forest plot | 2 | 2922 | Risk Ratio (M‐H, Random, 95% CI) | 0.76 [0.24, 2.40] |
| 23.1 PGE2 (once only) vs placebo/no treatment | 1 | 402 | Risk Ratio (M‐H, Random, 95% CI) | 1.40 [0.83, 2.35] |
| 23.2 PGE2 (repeated doses) vs placebo/no treatment | 1 | 2520 | Risk Ratio (M‐H, Random, 95% CI) | 0.44 [0.33, 0.58] |
| Outcome or subgroup title | No. of studies | No. of participants | Statistical method | Effect size |
| 1 Vaginal delivery not achieved within 24 hours Show forest plot | 2 | 226 | Risk Ratio (M‐H, Random, 95% CI) | 0.42 [0.06, 2.80] |
| 2 Uterine hyperstimulation with FHR changes Show forest plot | 3 | 217 | Risk Ratio (M‐H, Fixed, 95% CI) | 3.0 [0.13, 68.57] |
| 3 Caesarean section Show forest plot | 10 | 2486 | Risk Ratio (M‐H, Fixed, 95% CI) | 0.93 [0.77, 1.12] |
| 4 Serious neonatal morbidity or perinatal death Show forest plot | 3 | 1796 | Risk Ratio (M‐H, Fixed, 95% CI) | 0.34 [0.01, 8.22] |
| 5 Serious maternal morbidity or death Show forest plot | 1 | 69 | Risk Ratio (M‐H, Fixed, 95% CI) | 0.0 [0.0, 0.0] |
| 6 Cervix unfavourable/unchanged after 12 to 24 hours Show forest plot | 1 | 36 | Risk Ratio (M‐H, Fixed, 95% CI) | 0.13 [0.03, 0.47] |
| 7 Oxytocin augmentation Show forest plot | 3 | 407 | Risk Ratio (M‐H, Fixed, 95% CI) | 0.59 [0.47, 0.74] |
| 8 Uterine hyperstimulation without FHR changes Show forest plot | 3 | 1701 | Risk Ratio (M‐H, Fixed, 95% CI) | 0.35 [0.02, 8.10] |
| 9 Uterine rupture Show forest plot | 1 | 1507 | Risk Ratio (M‐H, Fixed, 95% CI) | 0.0 [0.0, 0.0] |
| 10 Epidural analgesia Show forest plot | 4 | 1959 | Risk Ratio (M‐H, Random, 95% CI) | 1.32 [0.64, 2.73] |
| 11 Instrumental vaginal delivery Show forest plot | 4 | 1815 | Risk Ratio (M‐H, Fixed, 95% CI) | 0.97 [0.83, 1.14] |
| 12 Meconium‐stained liquor Show forest plot | 2 | 420 | Risk Ratio (M‐H, Fixed, 95% CI) | 0.57 [0.29, 1.13] |
| 13 Apgar score < 7 at 5 minutes Show forest plot | 3 | 414 | Risk Ratio (M‐H, Fixed, 95% CI) | 0.74 [0.17, 3.27] |
| 14 Neonatal intensive care unit admission Show forest plot | 3 | 444 | Risk Ratio (M‐H, Fixed, 95% CI) | 1.06 [0.54, 2.09] |
| 15 Perinatal death Show forest plot | 3 | 1776 | Risk Ratio (M‐H, Fixed, 95% CI) | 0.34 [0.01, 8.22] |
| 16 Maternal side‐effects (all) Show forest plot | 3 | 1882 | Risk Ratio (M‐H, Fixed, 95% CI) | 1.04 [0.63, 1.71] |
| 17 Vomitting (maternal) Show forest plot | 1 | 1507 | Risk Ratio (M‐H, Fixed, 95% CI) | 1.68 [0.40, 7.00] |
| 18 Diarrhoea (maternal) Show forest plot | 1 | 1507 | Risk Ratio (M‐H, Fixed, 95% CI) | 5.03 [0.24, 104.66] |
| 19 Other maternal side‐effects Show forest plot | 2 | 375 | Risk Ratio (M‐H, Fixed, 95% CI) | 0.87 [0.50, 1.50] |
| 20 Postpartum haemorrhage Show forest plot | 3 | 1927 | Risk Ratio (M‐H, Fixed, 95% CI) | 1.51 [0.97, 2.34] |
| Outcome or subgroup title | No. of studies | No. of participants | Statistical method | Effect size |
| 1 Vaginal delivery not achieved within 24 hours Show forest plot | 1 | 158 | Risk Ratio (M‐H, Fixed, 95% CI) | 0.04 [0.02, 0.12] |
| 2 Uterine hyperstimulation with FHR changes Show forest plot | 1 | 20 | Risk Ratio (M‐H, Fixed, 95% CI) | 0.0 [0.0, 0.0] |
| 3 Caesarean section Show forest plot | 5 | 1298 | Risk Ratio (M‐H, Fixed, 95% CI) | 0.82 [0.48, 1.42] |
| 4 Serious neonatal morbidity or perinatal death Show forest plot | 2 | 1113 | Risk Ratio (M‐H, Fixed, 95% CI) | 0.33 [0.01, 8.12] |
| 5 Uterine rupture Show forest plot | 1 | 1013 | Risk Ratio (M‐H, Fixed, 95% CI) | 0.0 [0.0, 0.0] |
| 6 Epidural analgesia Show forest plot | 1 | 1013 | Risk Ratio (M‐H, Fixed, 95% CI) | 1.05 [0.88, 1.24] |
| 7 Oxytocin augmentation Show forest plot | 1 | 42 | Risk Ratio (M‐H, Fixed, 95% CI) | 0.42 [0.18, 0.97] |
| 8 Uterine hyperstimulation without FHR changes Show forest plot | 1 | 1013 | Risk Ratio (M‐H, Fixed, 95% CI) | 10.94 [0.61, 197.24] |
| 9 Instrumental vaginal delivery Show forest plot | 1 | 1013 | Risk Ratio (M‐H, Fixed, 95% CI) | 1.23 [0.77, 1.95] |
| 10 Meconium‐stained liquor Show forest plot | 1 | 100 | Risk Ratio (M‐H, Fixed, 95% CI) | 1.0 [0.15, 6.82] |
| 11 Perinatal death Show forest plot | 1 | 1013 | Risk Ratio (M‐H, Fixed, 95% CI) | 0.33 [0.01, 8.12] |
| 12 Maternal side‐effects (all) Show forest plot | 1 | 2026 | Risk Ratio (M‐H, Fixed, 95% CI) | 0.99 [0.06, 15.87] |
| 13 Vomitting (maternal) Show forest plot | 1 | 1013 | Risk Ratio (M‐H, Fixed, 95% CI) | 0.33 [0.01, 8.12] |
| 14 Diarrhoea (maternal) Show forest plot | 1 | 1013 | Risk Ratio (M‐H, Fixed, 95% CI) | 2.98 [0.12, 73.04] |
| 15 Postpartum haemorrhage Show forest plot | 1 | 1013 | Risk Ratio (M‐H, Fixed, 95% CI) | 1.22 [0.59, 2.52] |
| Outcome or subgroup title | No. of studies | No. of participants | Statistical method | Effect size |
| 1 Vaginal delivery not achieved within 24 hours Show forest plot | 1 | 345 | Risk Ratio (M‐H, Fixed, 95% CI) | 0.12 [0.08, 0.18] |
| 2 Uterine hyperstimulation with FHR changes Show forest plot | 5 | 425 | Risk Ratio (M‐H, Fixed, 95% CI) | 2.16 [0.57, 8.21] |
| 3 Caesarean section Show forest plot | 6 | 816 | Risk Ratio (M‐H, Fixed, 95% CI) | 1.13 [0.82, 1.57] |
| 4 Serious neonatal morbidity or perinatal death Show forest plot | 1 | 345 | Risk Ratio (M‐H, Fixed, 95% CI) | 0.31 [0.01, 7.45] |
| 5 Cervix unfavourable/unchanged after 12 to 24 hours Show forest plot | 1 | 54 | Risk Ratio (M‐H, Fixed, 95% CI) | 0.40 [0.24, 0.68] |
| 6 Oxytocin augmentation Show forest plot | 2 | 395 | Risk Ratio (M‐H, Fixed, 95% CI) | 1.06 [0.83, 1.36] |
| 7 Uterine hyperstimulation without FHR changes Show forest plot | 5 | 424 | Risk Ratio (M‐H, Fixed, 95% CI) | 6.76 [1.32, 34.54] |
| 8 Instrumental vaginal delivery Show forest plot | 1 | 345 | Risk Ratio (M‐H, Fixed, 95% CI) | 1.22 [0.28, 5.38] |
| 9 Apgar score < 7 at 5 minutes Show forest plot | 2 | 161 | Risk Ratio (M‐H, Fixed, 95% CI) | 0.54 [0.14, 2.05] |
| 10 Neonatal intensive care unit admission Show forest plot | 1 | 50 | Risk Ratio (M‐H, Fixed, 95% CI) | 0.22 [0.01, 4.28] |
| 11 Maternal side‐effects (all) Show forest plot | 3 | 212 | Risk Ratio (M‐H, Fixed, 95% CI) | 1.68 [0.66, 4.31] |
| 12 Postpartum haemorrhage Show forest plot | 1 | 81 | Risk Ratio (M‐H, Fixed, 95% CI) | 0.0 [0.0, 0.0] |
| 13 Perinatal death Show forest plot | 1 | 345 | Risk Ratio (M‐H, Fixed, 95% CI) | 0.31 [0.01, 7.45] |
| Outcome or subgroup title | No. of studies | No. of participants | Statistical method | Effect size |
| 1 Caesarean section Show forest plot | 7 | 3320 | Risk Ratio (M‐H, Fixed, 95% CI) | 0.89 [0.73, 1.08] |
| 2 Serious neonatal morbidity or perinatal death Show forest plot | 3 | 2840 | Risk Ratio (M‐H, Fixed, 95% CI) | 0.20 [0.01, 4.17] |
| 3 Uterine hyperstimulation without FHR changes Show forest plot | 3 | 2734 | Risk Ratio (M‐H, Fixed, 95% CI) | 1.66 [0.61, 4.52] |
| 4 Uterine rupture Show forest plot | 2 | 2579 | Risk Ratio (M‐H, Fixed, 95% CI) | 2.90 [0.12, 68.50] |
| 5 Epidural analgesia Show forest plot | 3 | 2940 | Risk Ratio (M‐H, Random, 95% CI) | 1.73 [0.73, 4.14] |
| 6 Instrumental vaginal delivery Show forest plot | 3 | 2779 | Risk Ratio (M‐H, Fixed, 95% CI) | 0.96 [0.81, 1.13] |
| 7 Meconium‐stained liquor Show forest plot | 5 | 3099 | Risk Ratio (M‐H, Fixed, 95% CI) | 0.95 [0.75, 1.21] |
| 8 Apgar score < 7 at 5 minutes Show forest plot | 3 | 2894 | Risk Ratio (M‐H, Fixed, 95% CI) | 1.47 [0.83, 2.63] |
| 9 Neonatal intensive care unit admission Show forest plot | 4 | 2953 | Risk Ratio (M‐H, Fixed, 95% CI) | 0.91 [0.73, 1.13] |
| 10 Perinatal death Show forest plot | 2 | 2719 | Risk Ratio (M‐H, Fixed, 95% CI) | 0.20 [0.01, 4.17] |
| 11 Maternal side‐effects (all) Show forest plot | 4 | 5533 | Risk Ratio (M‐H, Fixed, 95% CI) | 1.16 [0.73, 1.83] |
| 12 Vomitting (maternal) Show forest plot | 2 | 2579 | Risk Ratio (M‐H, Fixed, 95% CI) | 1.16 [0.39, 3.39] |
| 13 Diarrhoea (maternal) Show forest plot | 1 | 2520 | Risk Ratio (M‐H, Fixed, 95% CI) | 7.01 [0.36, 135.59] |
| 14 Postpartum haemorrhage Show forest plot | 5 | 3099 | Risk Ratio (M‐H, Fixed, 95% CI) | 1.47 [1.02, 2.13] |
| 15 Woman not satisfied Show forest plot | 1 | 2520 | Risk Ratio (M‐H, Fixed, 95% CI) | 0.44 [0.33, 0.58] |
| 16 Uterine hyperstimulation with FHR changes Show forest plot | 1 | 155 | Risk Ratio (M‐H, Fixed, 95% CI) | 0.0 [0.0, 0.0] |
| 17 Serious maternal morbidity or death Show forest plot | 1 | 59 | Risk Ratio (M‐H, Fixed, 95% CI) | 4.84 [0.24, 96.66] |
| 18 Oxytocin augmentation Show forest plot | 2 | 375 | Risk Ratio (M‐H, Fixed, 95% CI) | 0.62 [0.49, 0.79] |
| 19 Other maternal side‐effects Show forest plot | 1 | 155 | Risk Ratio (M‐H, Fixed, 95% CI) | 0.48 [0.04, 5.20] |
| Outcome or subgroup title | No. of studies | No. of participants | Statistical method | Effect size |
| 1 Vaginal delivery not achieved within 24 hours Show forest plot | 1 | 39 | Risk Ratio (M‐H, Fixed, 95% CI) | 0.88 [0.67, 1.15] |
| 2 Uterine hyperstimulation with FHR changes Show forest plot | 12 | 1143 | Risk Ratio (M‐H, Fixed, 95% CI) | 4.47 [2.01, 9.93] |
| 3 Caesarean section Show forest plot | 22 | 2173 | Risk Ratio (M‐H, Fixed, 95% CI) | 0.87 [0.75, 1.02] |
| 4 Serious neonatal morbidity or perinatal death Show forest plot | 4 | 533 | Risk Ratio (M‐H, Fixed, 95% CI) | 0.0 [0.0, 0.0] |
| 5 Serious maternal morbidity or death Show forest plot | 2 | 128 | Risk Ratio (M‐H, Fixed, 95% CI) | 4.84 [0.24, 96.66] |
| 6 Cervix unfavourable/unchanged after 12 to 24 hours Show forest plot | 2 | 172 | Risk Ratio (M‐H, Fixed, 95% CI) | 0.53 [0.35, 0.79] |
| 7 Oxytocin augmentation Show forest plot | 8 | 813 | Risk Ratio (M‐H, Random, 95% CI) | 0.77 [0.53, 1.10] |
| 8 Uterine hyperstimulation without FHR changes Show forest plot | 9 | 777 | Risk Ratio (M‐H, Fixed, 95% CI) | 2.63 [0.99, 7.01] |
| 9 Uterine rupture Show forest plot | 1 | 59 | Risk Ratio (M‐H, Fixed, 95% CI) | 2.90 [0.12, 68.50] |
| 10 Epidural analgesia Show forest plot | 5 | 633 | Risk Ratio (M‐H, Random, 95% CI) | 1.24 [0.63, 2.43] |
| 11 Instrumental vaginal delivery Show forest plot | 7 | 643 | Risk Ratio (M‐H, Fixed, 95% CI) | 0.88 [0.61, 1.27] |
| 12 Meconium‐stained liquor Show forest plot | 5 | 697 | Risk Ratio (M‐H, Fixed, 95% CI) | 0.65 [0.47, 0.89] |
| 13 Apgar score < 7 at 5 minutes Show forest plot | 11 | 1194 | Risk Ratio (M‐H, Fixed, 95% CI) | 1.08 [0.59, 1.99] |
| 14 Neonatal intensive care unit admission Show forest plot | 7 | 735 | Risk Ratio (M‐H, Fixed, 95% CI) | 0.80 [0.51, 1.27] |
| 15 Perinatal death Show forest plot | 3 | 298 | Risk Ratio (M‐H, Fixed, 95% CI) | 0.0 [0.0, 0.0] |
| 16 Maternal side‐effects (all) Show forest plot | 10 | 1572 | Risk Ratio (M‐H, Fixed, 95% CI) | 1.08 [0.73, 1.59] |
| 17 Nausea (maternal) Show forest plot | 1 | 116 | Risk Ratio (M‐H, Fixed, 95% CI) | 0.0 [0.0, 0.0] |
| 18 Vomitting (maternal) Show forest plot | 2 | 274 | Risk Ratio (M‐H, Fixed, 95% CI) | 0.97 [0.15, 6.41] |
| 19 Diarrhoea (maternal) Show forest plot | 2 | 331 | Risk Ratio (M‐H, Fixed, 95% CI) | 0.0 [0.0, 0.0] |
| 20 Other maternal side‐effects Show forest plot | 7 | 871 | Risk Ratio (M‐H, Fixed, 95% CI) | 0.97 [0.62, 1.51] |
| 21 Postpartum haemorrhage Show forest plot | 7 | 917 | Risk Ratio (M‐H, Fixed, 95% CI) | 0.99 [0.47, 2.05] |
| 22 Serious maternal complication Show forest plot | 1 | 59 | Risk Ratio (M‐H, Fixed, 95% CI) | 2.90 [0.12, 68.50] |
| Outcome or subgroup title | No. of studies | No. of participants | Statistical method | Effect size |
| 1 Uterine hyperstimulation without FHR changes Show forest plot | 1 | 56 | Risk Ratio (M‐H, Fixed, 95% CI) | 0.0 [0.0, 0.0] |
| 2 Uterine hyperstimulation with FHR changes Show forest plot | 1 | 56 | Risk Ratio (M‐H, Fixed, 95% CI) | 0.0 [0.0, 0.0] |
| 3 Caesarean section Show forest plot | 2 | 401 | Risk Ratio (M‐H, Fixed, 95% CI) | 1.13 [0.40, 3.18] |
| 4 Serious neonatal morbidity or perinatal death Show forest plot | 2 | 401 | Risk Ratio (M‐H, Fixed, 95% CI) | 0.31 [0.01, 7.45] |
| 5 Oxytocin augmentation Show forest plot | 3 | 443 | Risk Ratio (M‐H, Random, 95% CI) | 1.00 [0.66, 1.51] |
| 6 Vaginal delivery not achieved within 24 hours Show forest plot | 1 | 345 | Risk Ratio (M‐H, Fixed, 95% CI) | 0.12 [0.08, 0.18] |
| 7 Instrumental vaginal delivery Show forest plot | 1 | 345 | Risk Ratio (M‐H, Fixed, 95% CI) | 1.22 [0.28, 5.38] |
| 8 Perinatal death Show forest plot | 1 | 345 | Risk Ratio (M‐H, Fixed, 95% CI) | 0.31 [0.01, 7.45] |
| Outcome or subgroup title | No. of studies | No. of participants | Statistical method | Effect size |
| 1 Uterine hyperstimulation with FHR changes Show forest plot | 1 | 32 | Risk Ratio (M‐H, Fixed, 95% CI) | 3.0 [0.13, 68.57] |
| 2 Caesarean section Show forest plot | 4 | 467 | Risk Ratio (M‐H, Fixed, 95% CI) | 0.59 [0.31, 1.14] |
| 3 Cervix unfavourable/unchanged after 12 to 24 hours Show forest plot | 2 | 170 | Risk Ratio (M‐H, Fixed, 95% CI) | 0.20 [0.11, 0.37] |
| 4 Oxytocin augmentation Show forest plot | 3 | 202 | Risk Ratio (M‐H, Random, 95% CI) | 0.59 [0.32, 1.07] |
| 5 Epidural analgesia Show forest plot | 4 | 467 | Risk Ratio (M‐H, Fixed, 95% CI) | 0.74 [0.56, 0.97] |
| 6 Instrumental vaginal delivery Show forest plot | 3 | 435 | Risk Ratio (M‐H, Fixed, 95% CI) | 0.63 [0.47, 0.84] |
| Outcome or subgroup title | No. of studies | No. of participants | Statistical method | Effect size |
| 1 Uterine hyperstimulation with FHR changes Show forest plot | 1 | 32 | Risk Ratio (M‐H, Fixed, 95% CI) | 3.0 [0.13, 68.57] |
| 2 Caesarean section Show forest plot | 1 | 32 | Risk Ratio (M‐H, Fixed, 95% CI) | 0.33 [0.04, 2.87] |
| 3 Oxytocin augmentation Show forest plot | 1 | 32 | Risk Ratio (M‐H, Fixed, 95% CI) | 0.88 [0.71, 1.09] |
| 4 Epidural analgesia Show forest plot | 1 | 32 | Risk Ratio (M‐H, Fixed, 95% CI) | 0.85 [0.56, 1.27] |
| Outcome or subgroup title | No. of studies | No. of participants | Statistical method | Effect size |
| 1 Cervix unfavourable/unchanged after 12‐24 hours Show forest plot | 1 | 80 | Risk Ratio (M‐H, Fixed, 95% CI) | 0.15 [0.05, 0.47] |
| 2 Uterine hyperstimulation with FHR changes Show forest plot | 1 | 32 | Risk Ratio (M‐H, Fixed, 95% CI) | 3.0 [0.13, 68.57] |
| 3 Caesarean section Show forest plot | 2 | 112 | Risk Ratio (M‐H, Fixed, 95% CI) | 0.5 [0.13, 1.90] |
| 4 Instrumental Vaginal Delivery Show forest plot | 1 | 80 | Risk Ratio (M‐H, Fixed, 95% CI) | 0.75 [0.41, 1.38] |
| 5 Oxytocin augmentation Show forest plot | 2 | 112 | Risk Ratio (M‐H, Random, 95% CI) | 0.59 [0.17, 2.11] |
| 6 Epidural analgesia Show forest plot | 2 | 112 | Risk Ratio (M‐H, Fixed, 95% CI) | 0.82 [0.56, 1.20] |
| Outcome or subgroup title | No. of studies | No. of participants | Statistical method | Effect size |
| 1 Vaginal delivery not achieved within 24 hours Show forest plot | 1 | 75 | Risk Ratio (M‐H, Fixed, 95% CI) | 0.51 [0.05, 5.42] |
| 2 Uterine hyperstimulation with FHR changes Show forest plot | 2 | 106 | Risk Ratio (M‐H, Fixed, 95% CI) | 1.0 [0.07, 14.64] |
| 3 Caesarean section Show forest plot | 2 | 107 | Risk Ratio (M‐H, Fixed, 95% CI) | 1.02 [0.47, 2.22] |
| 4 Oxytocin augmentation Show forest plot | 1 | 32 | Risk Ratio (M‐H, Fixed, 95% CI) | 2.33 [1.21, 4.51] |
| 5 Epidural analgesia Show forest plot | 1 | 32 | Risk Ratio (M‐H, Fixed, 95% CI) | 1.57 [0.82, 3.00] |
| 6 Apgar score < 7 at 5 minutes Show forest plot | 1 | 75 | Risk Ratio (M‐H, Fixed, 95% CI) | 0.21 [0.01, 4.14] |
| Outcome or subgroup title | No. of studies | No. of participants | Statistical method | Effect size |
| 1 Uterine hyperstimulation with FHR changes Show forest plot | 1 | 32 | Risk Ratio (M‐H, Fixed, 95% CI) | 1.0 [0.07, 14.64] |
| 2 Caesarean section Show forest plot | 1 | 32 | Risk Ratio (M‐H, Fixed, 95% CI) | 1.0 [0.07, 14.64] |
| 3 Oxytocin augmentation Show forest plot | 1 | 32 | Risk Ratio (M‐H, Fixed, 95% CI) | 2.33 [1.21, 4.51] |
| 4 Epidural analgesia Show forest plot | 1 | 32 | Risk Ratio (M‐H, Fixed, 95% CI) | 1.57 [0.82, 3.00] |
| Outcome or subgroup title | No. of studies | No. of participants | Statistical method | Effect size |
| 1 Vaginal delivery not achieved within 24 hours Show forest plot | 1 | 75 | Risk Ratio (M‐H, Fixed, 95% CI) | 0.51 [0.05, 5.42] |
| 2 Uterine hyperstimulation with FHR changes Show forest plot | 2 | 106 | Risk Ratio (M‐H, Fixed, 95% CI) | 1.0 [0.07, 14.64] |
| 3 Caesarean section Show forest plot | 2 | 107 | Risk Ratio (M‐H, Fixed, 95% CI) | 1.02 [0.47, 2.22] |
| 4 Oxytocin augmentation Show forest plot | 1 | 32 | Risk Ratio (M‐H, Fixed, 95% CI) | 2.33 [1.21, 4.51] |
| 5 Epidural analgesia Show forest plot | 1 | 32 | Risk Ratio (M‐H, Fixed, 95% CI) | 1.57 [0.82, 3.00] |
| 6 Apgar score < 7 at 5 minutes Show forest plot | 1 | 75 | Risk Ratio (M‐H, Fixed, 95% CI) | 0.21 [0.01, 4.14] |
| Outcome or subgroup title | No. of studies | No. of participants | Statistical method | Effect size |
| 1 Vaginal delivery not achieved within 24 hours Show forest plot | 3 | 566 | Risk Ratio (M‐H, Fixed, 95% CI) | 1.03 [0.84, 1.26] |
| 2 Uterine hyperstimulation with FHR changes Show forest plot | 1 | 200 | Risk Ratio (M‐H, Fixed, 95% CI) | 2.0 [0.18, 21.71] |
| 3 Caesarean section Show forest plot | 6 | 1046 | Risk Ratio (M‐H, Fixed, 95% CI) | 0.91 [0.72, 1.17] |
| 4 Serious maternal morbidity or death Show forest plot | 1 | 200 | Risk Ratio (M‐H, Fixed, 95% CI) | 0.33 [0.01, 8.09] |
| 5 Cervix unfavourable/unchanged after 12 to 24 hours Show forest plot | 2 | 365 | Risk Ratio (M‐H, Fixed, 95% CI) | 0.87 [0.70, 1.07] |
| 6 Oxytocin augmentation Show forest plot | 6 | 742 | Risk Ratio (M‐H, Random, 95% CI) | 0.85 [0.67, 1.08] |
| 7 Epidural analgesia Show forest plot | 3 | 565 | Risk Ratio (M‐H, Fixed, 95% CI) | 1.07 [0.95, 1.21] |
| 8 Instrumental vaginal delivery Show forest plot | 3 | 565 | Risk Ratio (M‐H, Fixed, 95% CI) | 0.77 [0.58, 1.02] |
| 9 Meconium Stained Liquor Show forest plot | 1 | 165 | Risk Ratio (M‐H, Fixed, 95% CI) | 0.91 [0.39, 2.13] |
| 10 Apgar score < 7 at 5 minutes Show forest plot | 4 | 597 | Risk Ratio (M‐H, Fixed, 95% CI) | 1.13 [0.35, 3.66] |
| 11 Neonatal Intensive Care Unit Admission Show forest plot | 1 | 165 | Risk Ratio (M‐H, Fixed, 95% CI) | 0.51 [0.05, 5.47] |
| 12 Postpartum haemorrhage Show forest plot | 3 | 445 | Risk Ratio (M‐H, Fixed, 95% CI) | 0.89 [0.71, 1.11] |
| Outcome or subgroup title | No. of studies | No. of participants | Statistical method | Effect size |
| 1 Vaginal delivery not achieved within 24 hours Show forest plot | 2 | 174 | Risk Ratio (M‐H, Random, 95% CI) | 1.04 [0.72, 1.51] |
| 2 Uterine hyperstimulation with FHR changes Show forest plot | 1 | 200 | Risk Ratio (M‐H, Fixed, 95% CI) | 2.0 [0.18, 21.71] |
| 3 Caesarean section Show forest plot | 4 | 454 | Risk Ratio (M‐H, Fixed, 95% CI) | 1.01 [0.76, 1.34] |
| 4 Serious maternal morbidity or death Show forest plot | 1 | 200 | Risk Ratio (M‐H, Fixed, 95% CI) | 0.33 [0.01, 8.09] |
| 5 Cervix unfavourable/unchanged after 12 to 24 hours Show forest plot | 1 | 200 | Risk Ratio (M‐H, Fixed, 95% CI) | 0.77 [0.56, 1.07] |
| 6 Oxytocin augmentation Show forest plot | 3 | 353 | Risk Ratio (M‐H, Random, 95% CI) | 0.67 [0.34, 1.29] |
| 7 Epidural analgesia Show forest plot | 1 | 200 | Risk Ratio (M‐H, Fixed, 95% CI) | 0.96 [0.85, 1.10] |
| 8 Instrumental vaginal delivery Show forest plot | 1 | 200 | Risk Ratio (M‐H, Fixed, 95% CI) | 0.88 [0.61, 1.25] |
| 9 Apgar score < 7 at 5 minutes Show forest plot | 1 | 80 | Risk Ratio (M‐H, Fixed, 95% CI) | 0.33 [0.01, 7.95] |
| 10 Postpartum haemorrhage Show forest plot | 1 | 80 | Risk Ratio (M‐H, Fixed, 95% CI) | 0.5 [0.05, 5.30] |
| Outcome or subgroup title | No. of studies | No. of participants | Statistical method | Effect size |
| 1 Vaginal delivery not achieved within 24 hours Show forest plot | 1 | 64 | Risk Ratio (M‐H, Fixed, 95% CI) | 1.03 [0.57, 1.87] |
| 2 Caesarean section Show forest plot | 1 | 64 | Risk Ratio (M‐H, Fixed, 95% CI) | 0.88 [0.24, 3.22] |
| Outcome or subgroup title | No. of studies | No. of participants | Statistical method | Effect size |
| 1 Vaginal delivery not achieved within 24 hours Show forest plot | 1 | 73 | Risk Ratio (M‐H, Fixed, 95% CI) | 1.28 [0.87, 1.87] |
| 2 Uterine hyperstimulation with FHR changes Show forest plot | 1 | 200 | Risk Ratio (M‐H, Fixed, 95% CI) | 2.0 [0.18, 21.71] |
| 3 Caesarean section Show forest plot | 3 | 473 | Risk Ratio (M‐H, Fixed, 95% CI) | 1.02 [0.70, 1.49] |
| 4 Serious maternal morbidity or death Show forest plot | 1 | 200 | Risk Ratio (M‐H, Fixed, 95% CI) | 0.33 [0.01, 8.09] |
| 5 Cervix unfavourable/unchanged after 12 to 24 hours Show forest plot | 1 | 200 | Risk Ratio (M‐H, Fixed, 95% CI) | 0.77 [0.56, 1.07] |
| 6 Oxytocin augmentation Show forest plot | 3 | 473 | Risk Ratio (M‐H, Fixed, 95% CI) | 0.91 [0.78, 1.06] |
| 7 Epidural analgesia Show forest plot | 2 | 400 | Risk Ratio (M‐H, Fixed, 95% CI) | 1.02 [0.89, 1.19] |
| 8 Instrumental vaginal delivery Show forest plot | 2 | 400 | Risk Ratio (M‐H, Fixed, 95% CI) | 0.81 [0.59, 1.10] |
| 9 Postpartum haemorrhage Show forest plot | 1 | 200 | Risk Ratio (M‐H, Fixed, 95% CI) | 0.75 [0.13, 4.40] |
| Outcome or subgroup title | No. of studies | No. of participants | Statistical method | Effect size |
| 1 Vaginal delivery not achieved within 24 hours Show forest plot | 2 | 191 | Risk Ratio (M‐H, Random, 95% CI) | 0.99 [0.62, 1.59] |
| 2 Uterine hyperstimulation with FHR changes Show forest plot | 1 | 200 | Risk Ratio (M‐H, Fixed, 95% CI) | 2.0 [0.18, 21.71] |
| 3 Caesarean section Show forest plot | 3 | 353 | Risk Ratio (M‐H, Random, 95% CI) | 0.94 [0.48, 1.86] |
| 4 Serious maternal morbidity or death Show forest plot | 1 | 200 | Risk Ratio (M‐H, Fixed, 95% CI) | 0.33 [0.01, 8.09] |
| 5 Cervix unfavourable/unchanged after 12 to 24 hours Show forest plot | 1 | 200 | Risk Ratio (M‐H, Fixed, 95% CI) | 0.77 [0.56, 1.07] |
| 6 Oxytocin augmentation Show forest plot | 4 | 377 | Risk Ratio (M‐H, Random, 95% CI) | 0.73 [0.43, 1.25] |
| 7 Epidural analgesia Show forest plot | 1 | 200 | Risk Ratio (M‐H, Fixed, 95% CI) | 0.96 [0.85, 1.10] |
| 8 Instrumental vaginal delivery Show forest plot | 1 | 200 | Risk Ratio (M‐H, Fixed, 95% CI) | 0.88 [0.61, 1.25] |
| 9 Apgar score < 7 at 5 minutes Show forest plot | 2 | 104 | Risk Ratio (M‐H, Fixed, 95% CI) | 0.33 [0.01, 7.95] |
| 10 Postpartum haemorrhage Show forest plot | 1 | 80 | Risk Ratio (M‐H, Fixed, 95% CI) | 0.5 [0.05, 5.30] |
| Outcome or subgroup title | No. of studies | No. of participants | Statistical method | Effect size |
| 1 Vaginal delivery not achieved within 24 hours Show forest plot | 2 | 373 | Risk Ratio (M‐H, Fixed, 95% CI) | 1.11 [0.79, 1.56] |
| 2 Caesarean section Show forest plot | 1 | 328 | Risk Ratio (M‐H, Fixed, 95% CI) | 0.75 [0.40, 1.41] |
| 3 Oxytocin augmentation Show forest plot | 1 | 24 | Risk Ratio (M‐H, Fixed, 95% CI) | 1.0 [0.39, 2.58] |
| 4 Apgar score < 7 at 5 minutes Show forest plot | 2 | 352 | Risk Ratio (M‐H, Fixed, 95% CI) | 0.90 [0.18, 4.37] |
| Outcome or subgroup title | No. of studies | No. of participants | Statistical method | Effect size |
| 1 Uterine hyperstimulation with FHR changes Show forest plot | 2 | 159 | Risk Ratio (M‐H, Fixed, 95% CI) | 0.16 [0.03, 0.87] |
| 2 Caesarean section Show forest plot | 2 | 159 | Risk Ratio (M‐H, Fixed, 95% CI) | 0.65 [0.38, 1.11] |
| 3 Uterine hyperstimulation without FHR changes Show forest plot | 1 | 90 | Risk Ratio (M‐H, Fixed, 95% CI) | 0.2 [0.01, 4.05] |
| 4 Apgar score < 7 at 5 minutes Show forest plot | 1 | 69 | Risk Ratio (M‐H, Fixed, 95% CI) | 0.21 [0.01, 4.13] |
| 5 Maternal side‐effects (all) Show forest plot | 2 | 460 | Risk Ratio (M‐H, Fixed, 95% CI) | 0.2 [0.02, 1.70] |
| 6 Nausea (maternal) Show forest plot | 1 | 69 | Risk Ratio (M‐H, Fixed, 95% CI) | 0.34 [0.01, 8.13] |
| 7 Vomitting (maternal) Show forest plot | 1 | 69 | Risk Ratio (M‐H, Fixed, 95% CI) | 0.34 [0.01, 8.13] |
| 8 Diarrhoea (maternal) Show forest plot | 2 | 159 | Risk Ratio (M‐H, Fixed, 95% CI) | 0.33 [0.01, 7.97] |
| 9 Other maternal side‐effects Show forest plot | 2 | 159 | Risk Ratio (M‐H, Fixed, 95% CI) | 0.33 [0.01, 7.97] |
| Outcome or subgroup title | No. of studies | No. of participants | Statistical method | Effect size |
| 1 Caesarean section Show forest plot | 3 | 491 | Risk Ratio (M‐H, Fixed, 95% CI) | 1.13 [0.64, 1.99] |
| 2 Oxytocin augmentation Show forest plot | 3 | 491 | Risk Ratio (M‐H, Random, 95% CI) | 0.66 [0.31, 1.40] |
| 3 Uterine hyperstimulation without FHR changes Show forest plot | 1 | 200 | Risk Ratio (M‐H, Fixed, 95% CI) | 0.0 [0.0, 0.0] |
| 4 Epidural analgesia Show forest plot | 1 | 24 | Risk Ratio (M‐H, Fixed, 95% CI) | 0.67 [0.25, 1.78] |
| 5 Instrumental vaginal delivery Show forest plot | 3 | 491 | Risk Ratio (M‐H, Fixed, 95% CI) | 1.72 [1.09, 2.70] |
| 6 Apgar score < 7 at 5 minutes Show forest plot | 2 | 467 | Risk Ratio (M‐H, Fixed, 95% CI) | 1.33 [0.58, 3.05] |
| 7 Maternal side‐effects (all) Show forest plot | 1 | 400 | Risk Ratio (M‐H, Fixed, 95% CI) | 0.0 [0.0, 0.0] |
| 8 Vomitting (maternal) Show forest plot | 1 | 200 | Risk Ratio (M‐H, Fixed, 95% CI) | 0.0 [0.0, 0.0] |
| 9 Diarrhoea (maternal) Show forest plot | 1 | 200 | Risk Ratio (M‐H, Fixed, 95% CI) | 0.0 [0.0, 0.0] |
| 10 Postpartum haemorrhage Show forest plot | 1 | 267 | Risk Ratio (M‐H, Fixed, 95% CI) | 1.12 [0.57, 2.20] |
| Outcome or subgroup title | No. of studies | No. of participants | Statistical method | Effect size |
| 1 Caesarean section Show forest plot | 1 | 141 | Risk Ratio (M‐H, Fixed, 95% CI) | 1.21 [0.57, 2.58] |
| 2 Oxytocin augmentation Show forest plot | 1 | 141 | Risk Ratio (M‐H, Fixed, 95% CI) | 1.27 [0.85, 1.88] |
| Outcome or subgroup title | No. of studies | No. of participants | Statistical method | Effect size |
| 1 Caesarean section Show forest plot | 1 | 126 | Risk Ratio (M‐H, Fixed, 95% CI) | 0.83 [0.23, 2.93] |
| 2 Oxytocin augmentation Show forest plot | 1 | 126 | Risk Ratio (M‐H, Fixed, 95% CI) | 0.66 [0.37, 1.16] |
| Outcome or subgroup title | No. of studies | No. of participants | Statistical method | Effect size |
| 1 Caesarean section Show forest plot | 1 | 200 | Risk Ratio (M‐H, Fixed, 95% CI) | 1.0 [0.26, 3.89] |
| 2 Oxytocin augmentation Show forest plot | 1 | 200 | Risk Ratio (M‐H, Fixed, 95% CI) | 0.35 [0.19, 0.64] |
| 3 Uterine hyperstimulation without FHR changes Show forest plot | 1 | 200 | Risk Ratio (M‐H, Fixed, 95% CI) | 0.0 [0.0, 0.0] |
| 4 Instrumental vaginal delivery Show forest plot | 1 | 200 | Risk Ratio (M‐H, Fixed, 95% CI) | 1.11 [0.47, 2.62] |
| 5 Apgar score < 7 at 5 minutes Show forest plot | 1 | 200 | Risk Ratio (M‐H, Fixed, 95% CI) | 1.25 [0.51, 3.04] |
| 6 Maternal side‐effects (all) Show forest plot | 1 | 400 | Risk Ratio (M‐H, Fixed, 95% CI) | 0.0 [0.0, 0.0] |
| 7 Vomitting (maternal) Show forest plot | 1 | 200 | Risk Ratio (M‐H, Fixed, 95% CI) | 0.0 [0.0, 0.0] |
| 8 Diarrhoea (maternal) Show forest plot | 1 | 200 | Risk Ratio (M‐H, Fixed, 95% CI) | 0.0 [0.0, 0.0] |
| Outcome or subgroup title | No. of studies | No. of participants | Statistical method | Effect size |
| 1 Vaginal delivery not achieved within 24 hours Show forest plot | 3 | 450 | Risk Ratio (M‐H, Fixed, 95% CI) | 1.15 [0.92, 1.45] |
| 2 Uterine hyperstimulation with FHR changes Show forest plot | 5 | 643 | Risk Ratio (M‐H, Fixed, 95% CI) | 2.15 [0.89, 5.21] |
| 3 Caesarean section Show forest plot | 11 | 1262 | Risk Ratio (M‐H, Fixed, 95% CI) | 1.02 [0.82, 1.26] |
| 4 Serious neonatal morbidity or perinatal death Show forest plot | 2 | 320 | Risk Ratio (M‐H, Fixed, 95% CI) | 0.31 [0.01, 7.62] |
| 5 Serious maternal morbidity or death Show forest plot | 1 | 200 | Risk Ratio (M‐H, Fixed, 95% CI) | 0.0 [0.0, 0.0] |
| 6 Cervix unfavourable/unchanged after 12 ‐24 hours (BS < 3) Show forest plot | 2 | 271 | Risk Ratio (M‐H, Fixed, 95% CI) | 0.61 [0.46, 0.80] |
| 7 Oxytocin augmentation Show forest plot | 7 | 884 | Risk Ratio (M‐H, Random, 95% CI) | 0.88 [0.69, 1.13] |
| 8 Uterine hyperstimulation without FHR changes Show forest plot | 8 | 908 | Risk Ratio (M‐H, Fixed, 95% CI) | 1.59 [0.81, 3.14] |
| 9 Uterine rupture Show forest plot | 2 | 330 | Risk Ratio (M‐H, Fixed, 95% CI) | 0.33 [0.01, 8.09] |
| 10 Epidural analgesia Show forest plot | 3 | 315 | Risk Ratio (M‐H, Fixed, 95% CI) | 1.14 [0.95, 1.36] |
| 11 Instrumental vaginal delivery Show forest plot | 6 | 791 | Risk Ratio (M‐H, Fixed, 95% CI) | 0.47 [0.32, 0.68] |
| 12 Postpartum haemorrhage Show forest plot | 1 | 130 | Risk Ratio (M‐H, Fixed, 95% CI) | 1.33 [0.31, 5.72] |
| 13 Apgar score < 7 at 5 minutes Show forest plot | 3 | 370 | Risk Ratio (M‐H, Fixed, 95% CI) | 3.0 [0.12, 72.77] |
| 14 Vomitting (maternal) Show forest plot | 1 | 120 | Risk Ratio (M‐H, Fixed, 95% CI) | 5.0 [0.25, 102.00] |
| 15 Diarrhoea (maternal) Show forest plot | 1 | 120 | Risk Ratio (M‐H, Fixed, 95% CI) | 0.33 [0.01, 8.02] |
| Outcome or subgroup title | No. of studies | No. of participants | Statistical method | Effect size |
| 1 Vaginal delivery not achieved within 24 hours Show forest plot | 1 | 98 | Risk Ratio (M‐H, Fixed, 95% CI) | 1.27 [0.77, 2.10] |
| 2 Uterine hyperstimulation with FHR changes Show forest plot | 2 | 98 | Risk Ratio (M‐H, Fixed, 95% CI) | 7.44 [0.43, 128.16] |
| 3 Caesarean section Show forest plot | 5 | 399 | Risk Ratio (M‐H, Fixed, 95% CI) | 0.88 [0.63, 1.23] |
| 4 Cervix unfavourable/unchanged after 12‐24 hours Show forest plot | 1 | 151 | Risk Ratio (M‐H, Fixed, 95% CI) | 0.60 [0.45, 0.80] |
| 5 Oxytocin augmentation Show forest plot | 3 | 258 | Risk Ratio (M‐H, Random, 95% CI) | 0.74 [0.43, 1.29] |
| 6 Uterine hyperstimulation without FHR changes Show forest plot | 1 | 95 | Risk Ratio (M‐H, Fixed, 95% CI) | 0.0 [0.0, 0.0] |
| 7 Epidural analgesia Show forest plot | 2 | 246 | Risk Ratio (M‐H, Random, 95% CI) | 1.15 [0.83, 1.58] |
| 8 Instrumental vaginal delivery Show forest plot | 1 | 43 | Risk Ratio (M‐H, Fixed, 95% CI) | 0.70 [0.23, 2.13] |
| Outcome or subgroup title | No. of studies | No. of participants | Statistical method | Effect size |
| 1 Vaginal delivery not achieved within 24 hours Show forest plot | 1 | 32 | Risk Ratio (M‐H, Fixed, 95% CI) | 1.46 [0.35, 6.15] |
| 2 Uterine hyperstimulation with FHR changes Show forest plot | 2 | 95 | Risk Ratio (M‐H, Fixed, 95% CI) | 3.0 [0.33, 27.38] |
| 3 Caesarean section Show forest plot | 3 | 127 | Risk Ratio (M‐H, Fixed, 95% CI) | 1.30 [0.53, 3.23] |
| 4 Oxytocin augmentation Show forest plot | 1 | 66 | Risk Ratio (M‐H, Fixed, 95% CI) | 0.41 [0.20, 0.86] |
| 5 Instrumental vaginal delivery Show forest plot | 1 | 29 | Risk Ratio (M‐H, Fixed, 95% CI) | 0.62 [0.13, 2.85] |
| Outcome or subgroup title | No. of studies | No. of participants | Statistical method | Effect size |
| 1 Vaginal delivery not achieved within 24 hours Show forest plot | 1 | 130 | Risk Ratio (M‐H, Fixed, 95% CI) | 1.37 [0.85, 2.21] |
| 2 Uterine hyperstimulation with FHR changes Show forest plot | 3 | 323 | Risk Ratio (M‐H, Fixed, 95% CI) | 6.67 [0.86, 51.67] |
| 3 Caesarean section Show forest plot | 8 | 873 | Risk Ratio (M‐H, Fixed, 95% CI) | 1.00 [0.77, 1.28] |
| 4 Serious neonatal morbidity or perinatal death Show forest plot | 1 | 200 | Risk Ratio (M‐H, Fixed, 95% CI) | 0.31 [0.01, 7.62] |
| 5 Serious maternal morbidity or death Show forest plot | 1 | 200 | Risk Ratio (M‐H, Fixed, 95% CI) | 0.0 [0.0, 0.0] |
| 6 Cervix unfavourable/unchanged after 12‐24 hours Show forest plot | 1 | 151 | Risk Ratio (M‐H, Fixed, 95% CI) | 0.60 [0.45, 0.80] |
| 7 Oxytocin augmentation Show forest plot | 5 | 564 | Risk Ratio (M‐H, Random, 95% CI) | 0.81 [0.54, 1.21] |
| 8 Uterine hyperstimulation without FHR changes Show forest plot | 5 | 537 | Risk Ratio (M‐H, Fixed, 95% CI) | 5.81 [0.71, 47.25] |
| 9 Uterine rupture Show forest plot | 1 | 130 | Risk Ratio (M‐H, Fixed, 95% CI) | 0.0 [0.0, 0.0] |
| 10 Epidural analgesia Show forest plot | 3 | 286 | Risk Ratio (M‐H, Random, 95% CI) | 1.17 [0.84, 1.63] |
| 11 Instrumental vaginal delivery Show forest plot | 3 | 402 | Risk Ratio (M‐H, Fixed, 95% CI) | 0.34 [0.20, 0.59] |
| 12 Apgar score < 7 at 5 minutes Show forest plot | 2 | 170 | Risk Ratio (M‐H, Fixed, 95% CI) | 0.0 [0.0, 0.0] |
| 13 Postpartum haemorrhage Show forest plot | 1 | 130 | Risk Ratio (M‐H, Fixed, 95% CI) | 1.33 [0.31, 5.72] |
| Outcome or subgroup title | No. of studies | No. of participants | Statistical method | Effect size |
| 1 Uterine hyperstimulation with FHR changes Show forest plot | 1 | 69 | Risk Ratio (M‐H, Fixed, 95% CI) | 0.15 [0.02, 1.13] |
| 2 Caesarean section Show forest plot | 7 | 1546 | Risk Ratio (M‐H, Fixed, 95% CI) | 1.02 [0.78, 1.33] |
| 3 Serious neonatal morbidity or perinatal death Show forest plot | 1 | 955 | Risk Ratio (M‐H, Fixed, 95% CI) | 0.0 [0.0, 0.0] |
| 4 Cervix unfavourable/unchanged after 12‐24hrs Show forest plot | 1 | 151 | Risk Ratio (M‐H, Fixed, 95% CI) | 1.66 [1.25, 2.21] |
| 5 Oxytocin augmentation Show forest plot | 5 | 1370 | Risk Ratio (M‐H, Random, 95% CI) | 0.96 [0.77, 1.20] |
| 6 Uterine hyperstimulation without FHR changes Show forest plot | 1 | 40 | Risk Ratio (M‐H, Fixed, 95% CI) | 0.2 [0.01, 3.92] |
| 7 Epidural analgesia Show forest plot | 4 | 1330 | Risk Ratio (M‐H, Random, 95% CI) | 0.96 [0.74, 1.26] |
| 8 Instrumental vaginal delivery Show forest plot | 3 | 1179 | Risk Ratio (M‐H, Fixed, 95% CI) | 0.89 [0.70, 1.13] |
| 9 Meconium‐stained liquor Show forest plot | 1 | 955 | Risk Ratio (M‐H, Fixed, 95% CI) | 0.86 [0.67, 1.10] |
| 10 Apgar score < 7 at 5 minutes Show forest plot | 3 | 1064 | Risk Ratio (M‐H, Fixed, 95% CI) | 0.51 [0.20, 1.31] |
| 11 Neonatal intensive care unit admission Show forest plot | 1 | 955 | Risk Ratio (M‐H, Fixed, 95% CI) | 0.51 [0.24, 1.09] |
| 12 Perinatal death Show forest plot | 1 | 955 | Risk Ratio (M‐H, Fixed, 95% CI) | 0.0 [0.0, 0.0] |
| 13 Maternal side‐effects (all) Show forest plot | 1 | 280 | Risk Ratio (M‐H, Fixed, 95% CI) | 0.2 [0.01, 4.13] |
| 14 Nausea (maternal) Show forest plot | 1 | 69 | Risk Ratio (M‐H, Fixed, 95% CI) | 0.34 [0.01, 8.13] |
| 15 Vomitting (maternal) Show forest plot | 1 | 69 | Risk Ratio (M‐H, Fixed, 95% CI) | 0.34 [0.01, 8.13] |
| 16 Diarrhoea (maternal) Show forest plot | 1 | 69 | Risk Ratio (M‐H, Fixed, 95% CI) | 0.0 [0.0, 0.0] |
| 17 Other maternal side‐effects Show forest plot | 1 | 69 | Risk Ratio (M‐H, Fixed, 95% CI) | 0.0 [0.0, 0.0] |
| 18 Postpartum haemorrhage Show forest plot | 2 | 1155 | Risk Ratio (M‐H, Fixed, 95% CI) | 1.28 [0.79, 2.09] |
| Outcome or subgroup title | No. of studies | No. of participants | Statistical method | Effect size |
| 1 Caesarean section Show forest plot | 2 | 650 | Risk Ratio (M‐H, Fixed, 95% CI) | 1.16 [0.83, 1.63] |
| 2 Serious neonatal morbidity or perinatal death Show forest plot | 1 | 499 | Risk Ratio (M‐H, Fixed, 95% CI) | 0.0 [0.0, 0.0] |
| 3 Cervix unfavourable/unchanged after 12‐24hrs Show forest plot | 1 | 151 | Risk Ratio (M‐H, Fixed, 95% CI) | 1.66 [1.25, 2.21] |
| 4 Oxytocin augmentation Show forest plot | 2 | 650 | Risk Ratio (M‐H, Fixed, 95% CI) | 1.05 [0.93, 1.18] |
| 5 Epidural analgesia Show forest plot | 2 | 650 | Risk Ratio (M‐H, Fixed, 95% CI) | 1.07 [0.93, 1.22] |
| 6 Instrumental vaginal delivery Show forest plot | 1 | 499 | Risk Ratio (M‐H, Fixed, 95% CI) | 0.92 [0.71, 1.18] |
| 7 Meconium‐stained liquor Show forest plot | 1 | 499 | Risk Ratio (M‐H, Fixed, 95% CI) | 0.95 [0.72, 1.27] |
| 8 Apgar score < 7 at 5 minutes Show forest plot | 1 | 499 | Risk Ratio (M‐H, Fixed, 95% CI) | 0.16 [0.02, 1.27] |
| 9 Neonatal intensive care unit admission Show forest plot | 1 | 499 | Risk Ratio (M‐H, Fixed, 95% CI) | 0.34 [0.11, 1.03] |
| 10 Perinatal death Show forest plot | 1 | 499 | Risk Ratio (M‐H, Fixed, 95% CI) | 0.0 [0.0, 0.0] |
| 11 Postpartum haemorrhage Show forest plot | 1 | 499 | Risk Ratio (M‐H, Fixed, 95% CI) | 1.62 [0.86, 3.05] |
| Outcome or subgroup title | No. of studies | No. of participants | Statistical method | Effect size |
| 1 Caesarean section Show forest plot | 1 | 456 | Risk Ratio (M‐H, Fixed, 95% CI) | 0.68 [0.19, 2.51] |
| 2 Serious neonatal morbidity or perinatal death Show forest plot | 1 | 456 | Risk Ratio (M‐H, Fixed, 95% CI) | 0.0 [0.0, 0.0] |
| 3 Oxytocin augmentation Show forest plot | 1 | 456 | Risk Ratio (M‐H, Fixed, 95% CI) | 1.94 [1.35, 2.80] |
| 4 Epidural analgesia Show forest plot | 1 | 456 | Risk Ratio (M‐H, Fixed, 95% CI) | 1.15 [0.77, 1.70] |
| 5 Instrumental vaginal delivery Show forest plot | 1 | 456 | Risk Ratio (M‐H, Fixed, 95% CI) | 5.98 [1.37, 25.99] |
| 6 Meconium‐stained liquor Show forest plot | 1 | 456 | Risk Ratio (M‐H, Fixed, 95% CI) | 0.77 [0.48, 1.24] |
| 7 Apgar score < 7 at 5 minutes Show forest plot | 1 | 456 | Risk Ratio (M‐H, Fixed, 95% CI) | 1.42 [0.34, 5.88] |
| 8 Neonatal intensive care unit admission Show forest plot | 1 | 492 | Risk Ratio (M‐H, Fixed, 95% CI) | 1.0 [0.33, 3.06] |
| 9 Perinatal death Show forest plot | 1 | 465 | Risk Ratio (M‐H, Fixed, 95% CI) | 0.0 [0.0, 0.0] |
| 10 Postpartum haemorrhage Show forest plot | 1 | 456 | Risk Ratio (M‐H, Fixed, 95% CI) | 1.04 [0.44, 2.47] |
| Outcome or subgroup title | No. of studies | No. of participants | Statistical method | Effect size |
| 1 Caesarean section Show forest plot | 2 | 269 | Risk Ratio (M‐H, Fixed, 95% CI) | 0.78 [0.44, 1.38] |
| 2 Oxytocin augmentation Show forest plot | 1 | 200 | Risk Ratio (M‐H, Fixed, 95% CI) | 0.81 [0.63, 1.05] |
| 3 Epidural analgesia Show forest plot | 1 | 200 | Risk Ratio (M‐H, Fixed, 95% CI) | 1.20 [0.80, 1.82] |
| 4 Instrumental vaginal delivery Show forest plot | 1 | 200 | Risk Ratio (M‐H, Fixed, 95% CI) | 0.69 [0.38, 1.26] |
| 5 Postpartum haemorrhage Show forest plot | 1 | 200 | Risk Ratio (M‐H, Fixed, 95% CI) | 0.75 [0.13, 4.40] |
| 6 Uterine hyperstimulation with FHR changes Show forest plot | 1 | 69 | Risk Ratio (M‐H, Fixed, 95% CI) | 0.15 [0.02, 1.13] |
| 7 Apgar score < 7 at 5 minutes Show forest plot | 1 | 69 | Risk Ratio (M‐H, Fixed, 95% CI) | 0.21 [0.01, 4.13] |
| 8 Maternal side‐effects (all) Show forest plot | 1 | 280 | Risk Ratio (M‐H, Fixed, 95% CI) | 0.2 [0.01, 4.13] |
| 9 Nausea (maternal) Show forest plot | 1 | 69 | Risk Ratio (M‐H, Fixed, 95% CI) | 0.34 [0.01, 8.13] |
| 10 Vomitting (maternal) Show forest plot | 1 | 69 | Risk Ratio (M‐H, Fixed, 95% CI) | 0.34 [0.01, 8.13] |
| 11 Diarrhoea (maternal) Show forest plot | 1 | 69 | Risk Ratio (M‐H, Fixed, 95% CI) | 0.0 [0.0, 0.0] |
| 12 Other maternal side‐effects Show forest plot | 1 | 69 | Risk Ratio (M‐H, Fixed, 95% CI) | 0.0 [0.0, 0.0] |
| Outcome or subgroup title | No. of studies | No. of participants | Statistical method | Effect size |
| 1 Uterine hyperstimulation with FHR changes Show forest plot | 1 | 69 | Risk Ratio (M‐H, Fixed, 95% CI) | 0.15 [0.02, 1.13] |
| 2 Caesarean section Show forest plot | 4 | 367 | Risk Ratio (M‐H, Fixed, 95% CI) | 1.00 [0.69, 1.46] |
| 3 Oxytocin augmentation Show forest plot | 2 | 191 | Risk Ratio (M‐H, Fixed, 95% CI) | 0.88 [0.73, 1.06] |
| 4 Uterine hyperstimulation without FHR changes Show forest plot | 1 | 40 | Risk Ratio (M‐H, Fixed, 95% CI) | 0.2 [0.01, 3.92] |
| 5 Apgar score < 7 at 5 minutes Show forest plot | 2 | 109 | Risk Ratio (M‐H, Fixed, 95% CI) | 0.21 [0.01, 4.13] |
| 6 Maternal side‐effects (all) Show forest plot | 1 | 280 | Risk Ratio (M‐H, Fixed, 95% CI) | 0.2 [0.01, 4.13] |
| 7 Nausea (maternal) Show forest plot | 1 | 69 | Risk Ratio (M‐H, Fixed, 95% CI) | 0.34 [0.01, 8.13] |
| 8 Vomitting (maternal) Show forest plot | 1 | 69 | Risk Ratio (M‐H, Fixed, 95% CI) | 0.34 [0.01, 8.13] |
| 9 Diarrhoea (maternal) Show forest plot | 1 | 69 | Risk Ratio (M‐H, Fixed, 95% CI) | 0.0 [0.0, 0.0] |
| 10 Other maternal side‐effects Show forest plot | 1 | 69 | Risk Ratio (M‐H, Fixed, 95% CI) | 0.0 [0.0, 0.0] |
| Outcome or subgroup title | No. of studies | No. of participants | Statistical method | Effect size |
| 1 Uterine hyperstimulation with FHR changes Show forest plot | 1 | 100 | Risk Ratio (M‐H, Fixed, 95% CI) | 0.0 [0.0, 0.0] |
| 1.1 PGE2 (repeated doses) vs placebo/no treatment | 1 | 100 | Risk Ratio (M‐H, Fixed, 95% CI) | 0.0 [0.0, 0.0] |
| 2 Caesarean section Show forest plot | 2 | 300 | Risk Ratio (M‐H, Fixed, 95% CI) | 0.70 [0.42, 1.18] |
| 2.1 PGE2 (repeated doses) vs placebo/no treatment | 2 | 300 | Risk Ratio (M‐H, Fixed, 95% CI) | 0.70 [0.42, 1.18] |
| 3 Cervix unfavourable/unchanged after 12 to 24 hours Show forest plot | 1 | 36 | Risk Ratio (M‐H, Fixed, 95% CI) | 0.13 [0.03, 0.47] |
| 3.1 PGE2 (repeated doses) vs placebo/no treatment | 1 | 36 | Risk Ratio (M‐H, Fixed, 95% CI) | 0.13 [0.03, 0.47] |
| 4 Uterine hyperstimulation without FHR changes Show forest plot | 1 | 100 | Risk Ratio (M‐H, Fixed, 95% CI) | 3.0 [0.13, 71.92] |
| 4.1 PGE2 (repeated doses) vs placebo/no treatment | 1 | 100 | Risk Ratio (M‐H, Fixed, 95% CI) | 3.0 [0.13, 71.92] |
| 5 Epidural analgesia Show forest plot | 1 | 100 | Risk Ratio (M‐H, Fixed, 95% CI) | 0.83 [0.62, 1.12] |
| 5.1 PGE2 (repeated doses) vs placebo/no treatment | 1 | 100 | Risk Ratio (M‐H, Fixed, 95% CI) | 0.83 [0.62, 1.12] |
| 6 Meconium‐stained liquor Show forest plot | 2 | 300 | Risk Ratio (M‐H, Fixed, 95% CI) | 0.43 [0.28, 0.66] |
| 6.1 PGE2 (repeated doses) vs placebo/no treatment | 2 | 300 | Risk Ratio (M‐H, Fixed, 95% CI) | 0.43 [0.28, 0.66] |
| 7 Apgar score < 7 at 5 minutes Show forest plot | 1 | 100 | Risk Ratio (M‐H, Fixed, 95% CI) | 0.2 [0.01, 4.06] |
| 7.1 PGE2 (repeated doses) vs placebo/no treatment | 1 | 100 | Risk Ratio (M‐H, Fixed, 95% CI) | 0.2 [0.01, 4.06] |
| 8 Neonatal intensive care unit admission Show forest plot | 1 | 100 | Risk Ratio (M‐H, Fixed, 95% CI) | 0.2 [0.02, 1.65] |
| 8.1 PGE2 (repeated doses) vs placebo/no treatment | 1 | 100 | Risk Ratio (M‐H, Fixed, 95% CI) | 0.2 [0.02, 1.65] |