Colocación de espirales endovasculares versus clips neuroquirúrgicos para pacientes con hemorragia subaracnoidea por un aneurisma
Referencias
Referencias de los estudios incluidos en esta revisión
Referencias de los estudios excluidos de esta revisión
Referencias de los estudios en espera de evaluación
Referencias de los estudios en curso
Referencias adicionales
Referencias de otras versiones publicadas de esta revisión
Characteristics of studies
Characteristics of included studies [ordered by study ID]
| Methods | Method of randomisation: sealed envelopes Blinding of outcome assessment: no Analysis: intention to treat Excluded participants: 9 prior to randomisation Cross‐over cases: no Losses to follow‐up: at 1‐year follow‐up: 2 participants in the endovascular coiling group and 2 participants in the neurosurgical clipping group Definition of outcomes: stated | |
| Participants | Location: University Medical Centre Utrecht and St Elisabeth Hospital Tilburg, The Netherlands Coiling: 10 (men: 3 (30%)) Clipping: 10 (men: 3 (30%)) Age range: 35–75 years Entry criteria: documented aneurysmal SAH by either CT or DSA within the preceding 4 days, clinical state justifying treatment, aneurysm suitable for both treatment modalities Comparability of treatment groups: good for major prognostic factors Clinical grade on admission:
Aneurysm location:
| |
| Interventions | Endovascular coiling Neurosurgical clipping | |
| Outcomes | Clinical outcomes: dependency and death at 1‐year follow‐up (Rankin score 3–6), rebleeding, epilepsy, quality of life at 1 year and neuropsychological outcomes Additional measures: cost‐effectiveness | |
| Notes | Exclusion criteria: the logistic conditions for early operation could not be fulfilled Follow‐up duration: 3 months and 1 year | |
| Risk of bias | ||
| Bias | Authors' judgement | Support for judgement |
| Random sequence generation (selection bias) | Low risk | Used a computer‐generated list |
| Allocation concealment (selection bias) | Low risk | Allocation concealment performed by sealed envelopes that were not within reach of the treating physician. |
| Blinding of participants and personnel (performance bias) | Low risk | Blinding of participants of personnel was not possible due to the characteristics of the interventions. However, review authors judged that the risk of performance bias was low. |
| Blinding of outcome assessment (detection bias) | Unclear risk | Participants or their carers interviewed by telephone to assess functional outcome 3 months after SAH and 12‐month functional outcome assessed at outpatients clinic by a neurologist or by a neurosurgeon who had not operated on the participant. Unclear whether blinding was performed. |
| Incomplete outcome data (attrition bias) | Low risk | Data complete for all outcomes |
| Selective reporting (reporting bias) | Low risk | Study protocol not available but it was clear that the obtained data include all expected outcomes, including those that were prespecified. |
| Other bias | Low risk | Other sources of bias not identified |
| Methods | Method of randomisation: minimisation algorithm by telephone call to central randomisation service Blinding of outcome assessment: unblinded interim data Analysis: intention to treat Excluded participants: 7416 excluded prior to randomisation Cross‐over cases: 48 participants Losses to follow‐up: at 1‐year follow‐up: vital status known for all participants, for 10 participants in the endovascular coiling group and 15 participants in the neurosurgical clipping group the disability status was missing. Definition of outcomes: stated | |
| Participants | Location: 43 major neurosurgical centres (international) Coiling: 1073 (men:women ratio: 0.6) Clipping: 1070 (men:women ratio: 0.6) Age range: 18–87 years Entry criteria: documented aneurysmal SAH by either CT or LP within the preceding 28 days, clinical state justifying treatment, aneurysm suitable for both treatment modalities Comparability of treatment groups: good for major prognostic factors (except for a significant difference in the time interval between SAH and treatment) Clinical grade on admission:
Aneurysm location:
| |
| Interventions | Endovascular coiling Neurosurgical clipping | |
| Outcomes | Clinical outcomes: dependency and death at 1, 5, and 10 years' follow‐up (modified Rankin Scale score of 3–6), rebleeding at 1, 5, and 10 years, proportion of participants with epilepsy, quality of life at 1 year, and neuropsychological outcomes Additional measures: cost‐effectiveness | |
| Notes | Exclusion criteria: refused informed consent, if participating in another randomised trial of a treatment for SAH Follow‐up duration: 2 months, 1 year, 5 years, 10 years Accrual to ISAT was stopped prematurely, before the planned sample size had been achieved, on the basis of an interim analysis. The Data Monitoring Committee analysed the data on 29 April 2002 and advised the Steering Committee, on the basis of the result, to stop recruitment. The Steering Committee met on 2 May 2002 and decided that recruitment should stop but that follow‐up must continue. Recruitment ceased immediately | |
| Risk of bias | ||
| Bias | Authors' judgement | Support for judgement |
| Random sequence generation (selection bias) | Low risk | Quote: "All random assignments were done through a 24‐h [hour] telephone randomisation service, provided by the Clinical Trial Service Unit at the University of Oxford. Key baseline data were recorded before the treatment allocation was issued. A minimisation algorithm was used to ensure balance between the two groups." |
| Allocation concealment (selection bias) | Low risk | See above |
| Blinding of participants and personnel (performance bias) | Low risk | Blinding of participants of personnel was not possible due to the characteristics of the interventions. However, review authors judged that the risk of performance bias was low. |
| Blinding of outcome assessment (detection bias) | Unclear risk | Quote: "Data were collected by a validated method by use of a postal questionnaire mailed to the patient with a Euroqol Health state questionnaire and a questionnaire concerning employment status, further hospital admissions, or any episodes of rebleeding." |
| Incomplete outcome data (attrition bias) | Unclear risk | Primary outcome (functional outcome) at 1 year was available for almost all participants at 1 year. However, long‐term follow‐up data were available for only a proportion of the participants. |
| Selective reporting (reporting bias) | Low risk | Prespecified primary and secondary outcomes reported |
| Other bias | Unclear risk | During recruitment of ISAT, only 22% of participants with SAH treated within the participating centres were enrolled to the study, and 78% were excluded. Most included participants had aneurysm in the anterior circulation. People with SAH in poor clinical condition on admission are under‐represented in the ISAT cohort, which may be considered as a threat to external validity of this trial. |
| Methods | Method of randomisation: sealed envelopes Blinding of outcome assessment: no Analysis: intention to treat Excluded participants: 131 before randomisation, 2 after randomisation Cross‐over cases: 16 Losses to follow‐up: at 1 year: no losses to follow‐up Definition of outcomes: stated | |
| Participants | Location: Kuopio University Hospital, Kuopio, Finland Coiling: 52 (men:women ratio: 0.5) Clipping: 57 (men:women ratio: 0.4) Age range: 14–75 years Entry criteria: informed consent, SAH from a ruptured aneurysm suitable for both endovascular and neurosurgical treatment (based on diagnostic angiographic determinants), SAH in the preceding 3 days Comparability of treatment groups: good for major prognostic factors Clinical grade on admission:
Aneurysm location:
| |
| Interventions | Endovascular coiling Neurosurgical clipping | |
| Outcomes | Clinical outcomes: 12‐month clinical (good or moderate recovery: GOS 5 and 4; severe disability and vegetative state: GOS 3 and 2; death: GOS 1), neuropsychological and radiological outcomes Endpoints:
| |
| Notes | Exclusion criteria: aged > 75 years, presence of large haematoma necessitating surgery, mass effect causing neurological deficit, previous surgery for the ruptured aneurysm Follow‐up duration: 3 months and 1 year | |
| Risk of bias | ||
| Bias | Authors' judgement | Support for judgement |
| Random sequence generation (selection bias) | Low risk | To avoid selection bias, random assignment was performed separately for people with a Hunt and Hess grade of I–II, for those with a grade of III, and for those with a grade of IV–V. |
| Allocation concealment (selection bias) | Low risk | Sealed envelopes used |
| Blinding of participants and personnel (performance bias) | Low risk | Blinding of participants or personnel was not possible due to the characteristics of the interventions. However, review authors judged that the risk of performance bias was low. |
| Blinding of outcome assessment (detection bias) | High risk | Quote: "Clinical outcome at 3 months after treatment was evaluated by the neurosurgeon primarily responsible for treatment or the principal investigator of the study. The 12‐month outcome was evaluated by a single neurosurgeon. The last outcome data obtained by telephone interview were evaluated by a single neurosurgeon or by a single trained nurse." |
| Incomplete outcome data (attrition bias) | Low risk | No missing data |
| Selective reporting (reporting bias) | Low risk | All planned outcomes reported |
| Other bias | Low risk | Other sources of bias were not identified. |
| Methods | Method of randomisation: computer‐generated randomisation sequence Blinding of outcome assessment: no Analysis: treatment received Excluded participants: unclear Cross‐over cases: no Losses to follow‐up at 1 year: none Definition of outcomes: stated | |
| Participants | Location Fengxian District Central Hospital, Shanghai, China Coiling: 94 (men: 68, 72%) Clipping: 92 (men: 62, 67%) Mean age: coiling: 55 years, clipping: 54 years Entry criteria: informed consent, SAH from a ruptured aneurysm Comparability of treatment groups good for major prognostic factors, aneurysm size not given Clinical grade on admission
Aneurysm location:
| |
| Interventions | Endovascular coiling Neurosurgical clipping | |
| Outcomes | Clinical outcomes: 12‐month functional outcome (modified Rankin scale), 12‐month case fatality, 12‐month rebleeding rate, rate of delayed cerebral ischaemia, and rate of non‐complete obliteration of aneurysm within 12 months | |
| Notes | Time to randomisation, maximum time between SAH and treatment, and aneurysm size not given | |
| Risk of bias | ||
| Bias | Authors' judgement | Support for judgement |
| Random sequence generation (selection bias) | Low risk | Computer‐generated randomisation sequence was used |
| Allocation concealment (selection bias) | Low risk | Quote: "…were enrolled into the study and assigned (according to a computer‐generated randomization schedule) to undergo either endovascular coiling or surgical clipping treatment." |
| Blinding of participants and personnel (performance bias) | Low risk | Blinding of participants or personnel was not possible due to the characteristics of the interventions. However, review authors judged that the risk of performance bias was low. |
| Blinding of outcome assessment (detection bias) | Unclear risk | Quote: "Clinical follow‐up was performed in both groups during outpatient clinic visits. A structured telephone interview was performed with outpatients or family who missed the clinic visits; a close relative was contacted in cases where the patient was unavailable." It was unclear whether interviewers were blinded to intervention. |
| Incomplete outcome data (attrition bias) | Low risk | No missing data |
| Selective reporting (reporting bias) | Unclear risk | Study protocol not available. Published report suggested that all intended outcomes were reported, but we contacted study authors for clarification. Risk of reporting bias judged as unclear |
| Other bias | Unclear risk | It was unclear whether the published results represented intention‐to‐treat or treatment received. We sought missing data from the trialists but are awaiting response. |
ACA: anterior cerebral artery; Acom: anterior communicating artery; CT: computed tomography; DSA: digital subtraction angiography; ICA: internal carotid artery; LP: lumbar puncture; MCA: middle cerebral artery; Pcom: posterior communicating artery; SAH: subarachnoid haemorrhage; WFNS: World Federation of Neurological Surgeons subarachnoid haemorrhage grading scale.
Characteristics of excluded studies [ordered by study ID]
| Study | Reason for exclusion |
| Inadequate methodological quality:
|
Characteristics of studies awaiting assessment [ordered by study ID]
| Methods | Method of randomisation: unknown Blinding of outcome assessment: no Analysis: treatment received Excluded participants: no Cross‐over cases: unknown Losses to follow‐up at 1 year: none Definition of outcomes: stated |
| Participants | Location Lahore General Hospital, Lahore, Pakistan Coiling: 70 (men 28, 40%) Clipping: 70 (men 28, 40%) Median age: coiling 53 years, clipping 51 years Entry criteria: SAH from a ruptured anterior circulation aneurysm, WFNS 1–3, aged 14–60 years. Giant aneurysms (> 2.5 cm) and aneurysms with broad neck (> 5 mm) were excluded. Comparability of treatment groups good for major prognostic factors, aneurysm size not given Clinical grade on admission
Aneurysm location: not given |
| Interventions | Endovascular treatment by coils Surgical treatment by clips |
| Outcomes | Outcome at 12 months (poor/favourable) |
| Notes | Study authors contacted for missing data in August 2017, but no data received. |
SAH: subarachnoid haemorrhage; World Federation of Neurological Surgeons subarachnoid haemorrhage grading scale.
Characteristics of ongoing studies [ordered by study ID]
| Trial name or title | International Subarachnoid Aneurysm Trial 2 |
| Methods | Method of randomisation: centralised minimisation procedure via web platform Minimisation criteria to be balanced between groups: age ≥ 70 years, WFNS grade > III, aneurysm size > 3 cm, posterior circulation location of aneurysm |
| Participants | Target sample size: 1896 participants, expected loss to follow‐up < 10% Listed location countries: Canada, Spain, US Inclusion criteria
Exclusion criteria
|
| Interventions | Surgical management of the ruptured aneurysm Endovascular management (including use of adjunctive techniques such as flow‐diverting stents and WEB devices in addition to coiling) |
| Outcomes | Primary outcome
Secondary outcomes
|
| Starting date | October 2012 |
| Contact information | clinicaltrials.gov/ct2/show/record/NCT01668563 |
| Notes | Estimated primary completion date: 2023 |
AVM: arteriovenous malformation; mRS: modified Rankin scale; SAH: subarachnoid haemorrhage; WEB: Wowen EndoBridge; WFNS: World Federation of Neurological Surgeons subarachnoid haemorrhage grading scale.
Data and analyses
| Outcome or subgroup title | No. of studies | No. of participants | Statistical method | Effect size |
| 1 Death or dependency at 2–3 months Show forest plot | 3 | 2257 | Risk Ratio (M‐H, Fixed, 95% CI) | 0.71 [0.63, 0.81] |
| Analysis 1.1  Comparison 1 Poor outcome: death or dependence in daily activities, Outcome 1 Death or dependency at 2–3 months. | ||||
| 2 Death or dependency at 12 months after subarachnoid haemorrhage Show forest plot | 4 | 2429 | Risk Ratio (M‐H, Fixed, 95% CI) | 0.77 [0.67, 0.87] |
| Analysis 1.2  Comparison 1 Poor outcome: death or dependence in daily activities, Outcome 2 Death or dependency at 12 months after subarachnoid haemorrhage. | ||||
| 3 Worst‐case scenario at 12 months Show forest plot | 4 | 2458 | Risk Ratio (M‐H, Fixed, 95% CI) | 0.80 [0.71, 0.91] |
| Analysis 1.3  Comparison 1 Poor outcome: death or dependence in daily activities, Outcome 3 Worst‐case scenario at 12 months. | ||||
| 4 Death or dependency at 5 years Show forest plot | 1 | 1724 | Risk Ratio (M‐H, Fixed, 95% CI) | 0.87 [0.75, 1.01] |
| Analysis 1.4  Comparison 1 Poor outcome: death or dependence in daily activities, Outcome 4 Death or dependency at 5 years. | ||||
| 5 Death or dependency at 10 years Show forest plot | 1 | 1316 | Risk Ratio (M‐H, Fixed, 95% CI) | 0.81 [0.70, 0.92] |
| Analysis 1.5  Comparison 1 Poor outcome: death or dependence in daily activities, Outcome 5 Death or dependency at 10 years. | ||||
| Outcome or subgroup title | No. of studies | No. of participants | Statistical method | Effect size |
| 1 Death from any cause 2–3 months Show forest plot | 3 | 2257 | Risk Ratio (M‐H, Fixed, 95% CI) | 0.88 [0.66, 1.18] |
| Analysis 2.1  Comparison 2 Death from any cause, Outcome 1 Death from any cause 2–3 months. | ||||
| 2 Death from any cause between randomisation and 1 year after SAH Show forest plot | 4 | 2429 | Risk Ratio (M‐H, Fixed, 95% CI) | 0.80 [0.63, 1.02] |
| Analysis 2.2  Comparison 2 Death from any cause, Outcome 2 Death from any cause between randomisation and 1 year after SAH. | ||||
| 3 Death from any cause up to 5 years Show forest plot | 1 | 2087 | Risk Ratio (M‐H, Fixed, 95% CI) | 0.77 [0.61, 0.98] |
| Analysis 2.3  Comparison 2 Death from any cause, Outcome 3 Death from any cause up to 5 years. | ||||
| 4 Death from any cause up to 10 years Show forest plot | 1 | 1644 | Risk Ratio (M‐H, Fixed, 95% CI) | 0.78 [0.64, 0.96] |
| Analysis 2.4  Comparison 2 Death from any cause, Outcome 4 Death from any cause up to 10 years. | ||||
| Outcome or subgroup title | No. of studies | No. of participants | Statistical method | Effect size |
| 1 DCI at 2–3 months Show forest plot | 4 | 2450 | Risk Ratio (M‐H, Fixed, 95% CI) | 0.84 [0.74, 0.96] |
| Analysis 3.1  Comparison 3 Delayed cerebral ischaemia (DCI), Outcome 1 DCI at 2–3 months. | ||||
| Outcome or subgroup title | No. of studies | No. of participants | Statistical method | Effect size |
| 1 Rebleed before treatment Show forest plot | 3 | 2272 | Risk Ratio (M‐H, Fixed, 95% CI) | 0.64 [0.37, 1.12] |
| Analysis 4.1  Comparison 4 Rebleeding, Outcome 1 Rebleed before treatment. | ||||
| 2 Rebleed postprocedure up to 1 year Show forest plot | 4 | 2458 | Risk Ratio (M‐H, Fixed, 95% CI) | 1.83 [1.04, 3.23] |
| Analysis 4.2  Comparison 4 Rebleeding, Outcome 2 Rebleed postprocedure up to 1 year. | ||||
| 3 Rebleed postprocedure up to 3 months Show forest plot | 3 | 2272 | Risk Ratio (M‐H, Fixed, 95% CI) | 2.66 [0.71, 10.00] |
| Analysis 4.3  Comparison 4 Rebleeding, Outcome 3 Rebleed postprocedure up to 3 months. | ||||
| 4 Rebleed postprocedure up to 5 years Show forest plot | 1 | 1448 | Risk Ratio (M‐H, Fixed, 95% CI) | 2.75 [1.51, 5.02] |
| Analysis 4.4  Comparison 4 Rebleeding, Outcome 4 Rebleed postprocedure up to 5 years. | ||||
| 5 Rebleed postprocedure up to 10 years Show forest plot | 1 | 1323 | Risk Ratio (M‐H, Fixed, 95% CI) | 2.69 [1.50, 4.81] |
| Analysis 4.5  Comparison 4 Rebleeding, Outcome 5 Rebleed postprocedure up to 10 years. | ||||
| Outcome or subgroup title | No. of studies | No. of participants | Statistical method | Effect size |
| 1 Complications from intervention Show forest plot | 2 | 129 | Risk Ratio (M‐H, Fixed, 95% CI) | 1.05 [0.44, 2.53] |
| Analysis 5.1  Comparison 5 Complications from intervention, Outcome 1 Complications from intervention. | ||||
| Outcome or subgroup title | No. of studies | No. of participants | Statistical method | Effect size |
| 1 Non‐complete obliteration after 1 year Show forest plot | 3 | 1626 | Risk Ratio (M‐H, Fixed, 95% CI) | 2.02 [1.65, 2.47] |
| Analysis 6.1  Comparison 6 Degree of obliteration, Outcome 1 Non‐complete obliteration after 1 year. | ||||
| 2 < 90% occlusion after 1 year Show forest plot | 2 | 1440 | Risk Ratio (M‐H, Fixed, 95% CI) | 1.43 [0.93, 2.21] |
| Analysis 6.2  Comparison 6 Degree of obliteration, Outcome 2 < 90% occlusion after 1 year. | ||||
| Outcome or subgroup title | No. of studies | No. of participants | Statistical method | Effect size |
| 1 Poor outcome at 12 months: posterior and anterior circulation Show forest plot | 2 | 2226 | Risk Ratio (M‐H, Fixed, 95% CI) | 0.76 [0.66, 0.88] |
| Analysis 7.1  Comparison 7 Subgroup analysis: aneurysm location, Outcome 1 Poor outcome at 12 months: posterior and anterior circulation. | ||||
| 1.1 Poor outcome at 12 months: posterior circulation | 2 | 69 | Risk Ratio (M‐H, Fixed, 95% CI) | 0.41 [0.19, 0.92] |
| 1.2 Poor outcome at 12 months: anterior circulation | 2 | 2157 | Risk Ratio (M‐H, Fixed, 95% CI) | 0.78 [0.68, 0.90] |
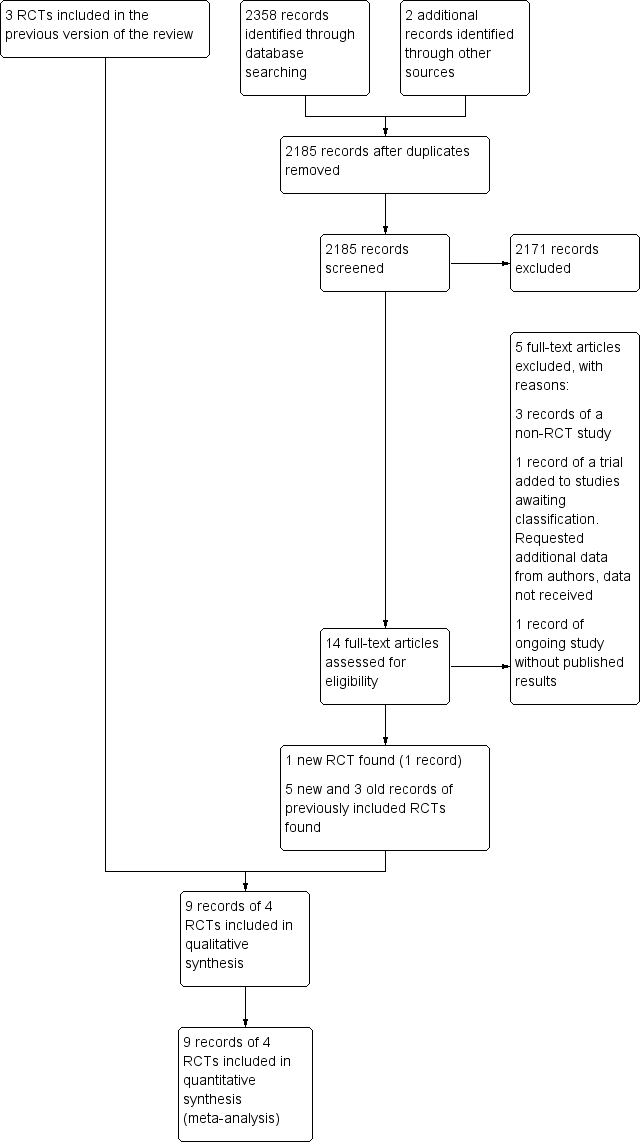
Study flow diagram. RCT: randomised controlled trial.
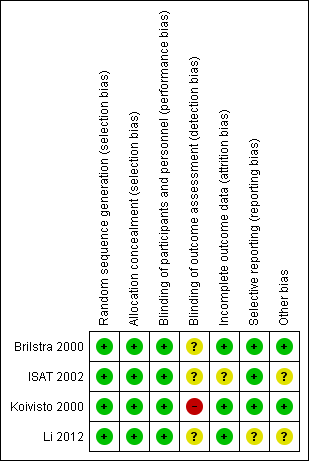
Risk of bias summary: review authors' judgements about each risk of bias item for each included study.
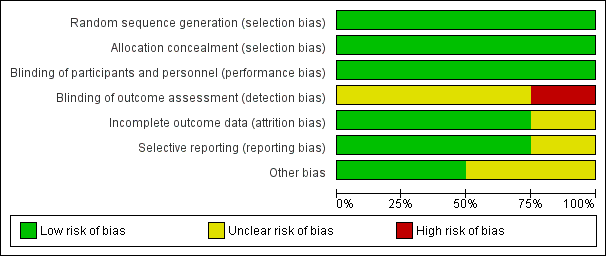
Risk of bias graph: review authors' judgements about each risk of bias item presented as percentages across all included studies.
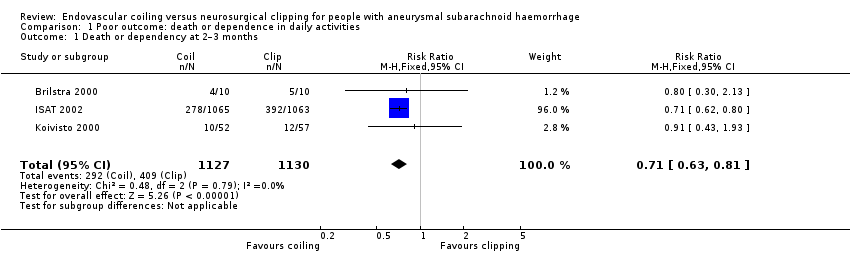
Comparison 1 Poor outcome: death or dependence in daily activities, Outcome 1 Death or dependency at 2–3 months.
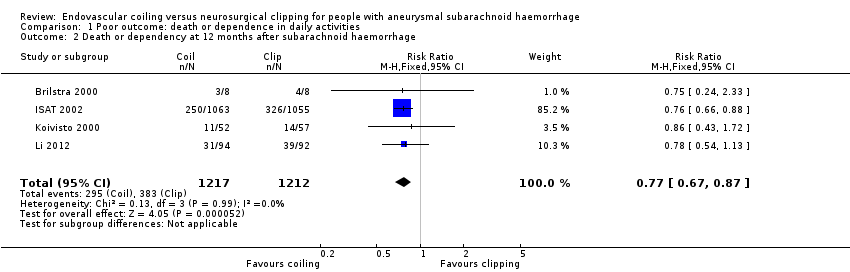
Comparison 1 Poor outcome: death or dependence in daily activities, Outcome 2 Death or dependency at 12 months after subarachnoid haemorrhage.
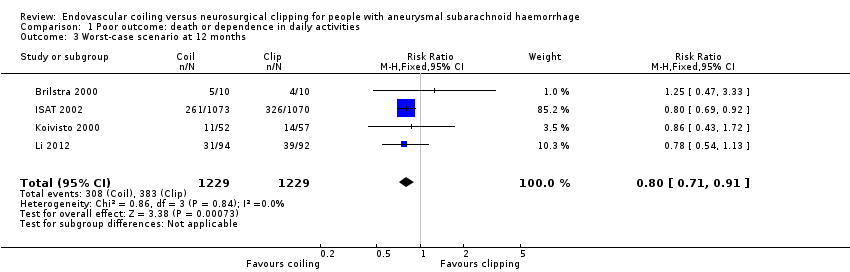
Comparison 1 Poor outcome: death or dependence in daily activities, Outcome 3 Worst‐case scenario at 12 months.

Comparison 1 Poor outcome: death or dependence in daily activities, Outcome 4 Death or dependency at 5 years.
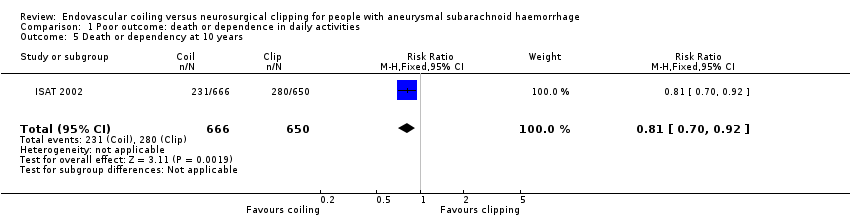
Comparison 1 Poor outcome: death or dependence in daily activities, Outcome 5 Death or dependency at 10 years.

Comparison 2 Death from any cause, Outcome 1 Death from any cause 2–3 months.

Comparison 2 Death from any cause, Outcome 2 Death from any cause between randomisation and 1 year after SAH.

Comparison 2 Death from any cause, Outcome 3 Death from any cause up to 5 years.

Comparison 2 Death from any cause, Outcome 4 Death from any cause up to 10 years.
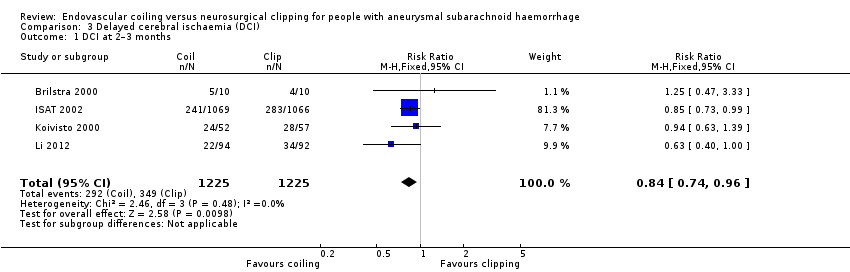
Comparison 3 Delayed cerebral ischaemia (DCI), Outcome 1 DCI at 2–3 months.

Comparison 4 Rebleeding, Outcome 1 Rebleed before treatment.
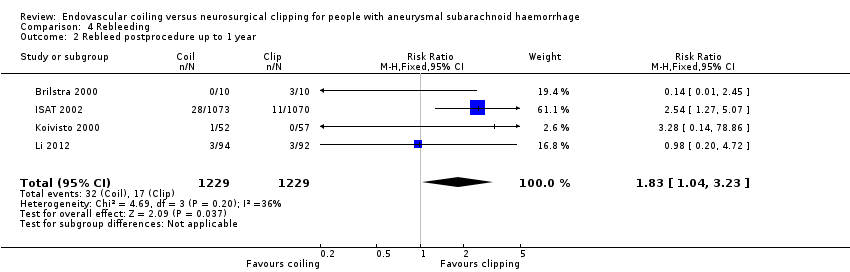
Comparison 4 Rebleeding, Outcome 2 Rebleed postprocedure up to 1 year.
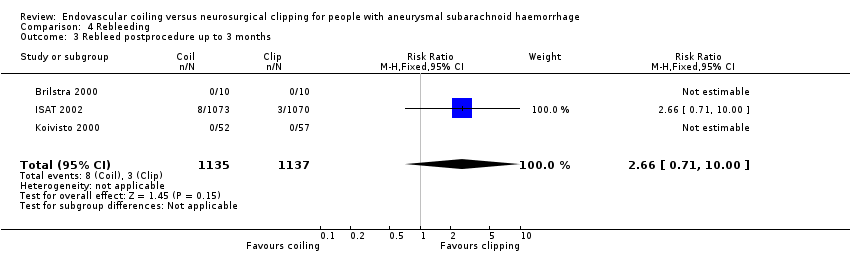
Comparison 4 Rebleeding, Outcome 3 Rebleed postprocedure up to 3 months.

Comparison 4 Rebleeding, Outcome 4 Rebleed postprocedure up to 5 years.
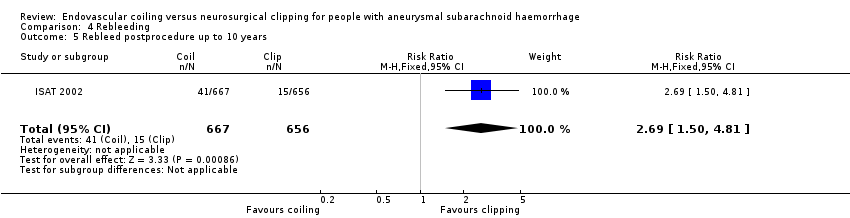
Comparison 4 Rebleeding, Outcome 5 Rebleed postprocedure up to 10 years.

Comparison 5 Complications from intervention, Outcome 1 Complications from intervention.
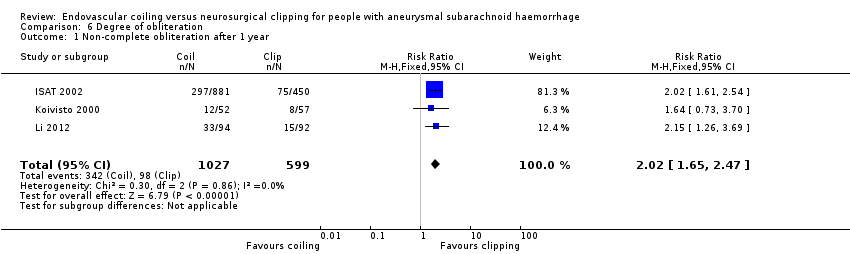
Comparison 6 Degree of obliteration, Outcome 1 Non‐complete obliteration after 1 year.

Comparison 6 Degree of obliteration, Outcome 2 < 90% occlusion after 1 year.

Comparison 7 Subgroup analysis: aneurysm location, Outcome 1 Poor outcome at 12 months: posterior and anterior circulation.
| Endovascular coiling compared with neurosurgical clipping for subarachnoid haemorrhage | ||||||
| Patient or population: people with subarachnoid haemorrhage from a ruptured intracranial aneurysm Settings: tertiary care Intervention: endovascular coiling of aneurysm Comparison: neurosurgical clipping of aneurysm | ||||||
| Outcomes | Illustrative comparative risks* (95% CI) | Relative effect | No of participants | Quality of the evidence | Comments | |
| Assumed risk | Corresponding risk | |||||
| Neurosurgical clipping | Endovascular coiling | |||||
| Poor outcome: death or dependence in daily activities (12 months) | Study population | RR 0.77 (0.67 to 0.87) | 2429 | ⊕⊕⊕⊝ | — | |
| 366 per 1000 | 281 per 1000 | |||||
| Poor outcome (death or dependence) (10 years) | Study population | RR 0.81 (0.70 to 0.92) | 1316 | ⊕⊕⊝⊝a,b | Based on subgroup of participants in 1 large RCT only | |
| 430 per 1000 | 348 per 1000 | |||||
| Death from any cause (12 months) | Study population | RR 0.80 (0.63 to 1.02) | 2429 | ⊕⊕⊕⊝ | — | |
| 154 per 1000 | 123 per 1000 | |||||
| Delayed cerebral ischaemia (2–3 months) | Study population | RR 0.84 (0.74 to 0.96) | 2450 (4 RCTs) | ⊕⊕⊕⊝ | — | |
| 384 per 1000 | 322 per 1000 | |||||
| Rebleeding postprocedure up to 1 year | Study population | RR 1.83 (1.04 to 3.23) | 2458 (4 RCTs) | ⊕⊕⊕⊕ | — | |
| 21 per 1000 | 38 per 1000 (21 to 67) | |||||
| Rebleeding postprocedure up to 10 years | Study population | RR 2.69 (1.50 to 4.81) | 1323 (1 RCT) | ⊕⊕⊝⊝a,b | Based on 1 large RCT only | |
| 22 per 1000 | 61 per 1000 | |||||
| Complications from the intervention | Study population | RR 1.05 (0.44 to 2.53) | 129 (2 RCTs) | ⊕⊕⊝⊝c | Based on 2 small RCTs only | |
| 235 per 1000 | 246 per 1000 (103 to 594) | |||||
| *The basis for the assumed risk (e.g. the median control group risk across studies) is derived from the studies included in the meta‐analysis. The corresponding risk (and its 95% confidence interval) is based on the assumed risk in the comparison group and the relative effect of the intervention (and its 95% CI). CI: confidence interval; RCT: randomised controlled trial; RR: risk ratio. | ||||||
| GRADE Working Group grades of evidence | ||||||
| aDowngraded one level due to indirectness of evidence: participants in poor condition on admission under‐represented in the largest RCT. bDowngraded one level due to risk of bias: long‐term outcome data available for only a subgroup of participants. cDowngraded two levels due to risk of bias: underpowered due to data availability from only two small trials, unclear definition of complication from intervention. | ||||||
| Number of participants per treatment | Extent of occlusion | ||
| 100% | 90% to 100% | < 90% | |
| Endovascular coiling: 881 | 584 (66%) | 228 (26%) | 69 (8%) |
| Neurosurgical clipping: 450 | 370 (82%) | 55 (12%) | 25 (6%) |
| Endovascular coiling: 52 | 40 (77%) | 10 (19%) | 2 (4%) |
| Neurosurgical clipping: 57 | 49 (86%) | 7 (12%) | 1 (2%) |
| Total | |||
| Endovascular coiling: 933 | 624 (67%) | 238 (26%) | 71 (8%) |
| Neurosurgical clipping: 507 | 419 (83%) | 62 (12%) | 26 (5%) |
| Outcome or subgroup title | No. of studies | No. of participants | Statistical method | Effect size |
| 1 Death or dependency at 2–3 months Show forest plot | 3 | 2257 | Risk Ratio (M‐H, Fixed, 95% CI) | 0.71 [0.63, 0.81] |
| 2 Death or dependency at 12 months after subarachnoid haemorrhage Show forest plot | 4 | 2429 | Risk Ratio (M‐H, Fixed, 95% CI) | 0.77 [0.67, 0.87] |
| 3 Worst‐case scenario at 12 months Show forest plot | 4 | 2458 | Risk Ratio (M‐H, Fixed, 95% CI) | 0.80 [0.71, 0.91] |
| 4 Death or dependency at 5 years Show forest plot | 1 | 1724 | Risk Ratio (M‐H, Fixed, 95% CI) | 0.87 [0.75, 1.01] |
| 5 Death or dependency at 10 years Show forest plot | 1 | 1316 | Risk Ratio (M‐H, Fixed, 95% CI) | 0.81 [0.70, 0.92] |
| Outcome or subgroup title | No. of studies | No. of participants | Statistical method | Effect size |
| 1 Death from any cause 2–3 months Show forest plot | 3 | 2257 | Risk Ratio (M‐H, Fixed, 95% CI) | 0.88 [0.66, 1.18] |
| 2 Death from any cause between randomisation and 1 year after SAH Show forest plot | 4 | 2429 | Risk Ratio (M‐H, Fixed, 95% CI) | 0.80 [0.63, 1.02] |
| 3 Death from any cause up to 5 years Show forest plot | 1 | 2087 | Risk Ratio (M‐H, Fixed, 95% CI) | 0.77 [0.61, 0.98] |
| 4 Death from any cause up to 10 years Show forest plot | 1 | 1644 | Risk Ratio (M‐H, Fixed, 95% CI) | 0.78 [0.64, 0.96] |
| Outcome or subgroup title | No. of studies | No. of participants | Statistical method | Effect size |
| 1 DCI at 2–3 months Show forest plot | 4 | 2450 | Risk Ratio (M‐H, Fixed, 95% CI) | 0.84 [0.74, 0.96] |
| Outcome or subgroup title | No. of studies | No. of participants | Statistical method | Effect size |
| 1 Rebleed before treatment Show forest plot | 3 | 2272 | Risk Ratio (M‐H, Fixed, 95% CI) | 0.64 [0.37, 1.12] |
| 2 Rebleed postprocedure up to 1 year Show forest plot | 4 | 2458 | Risk Ratio (M‐H, Fixed, 95% CI) | 1.83 [1.04, 3.23] |
| 3 Rebleed postprocedure up to 3 months Show forest plot | 3 | 2272 | Risk Ratio (M‐H, Fixed, 95% CI) | 2.66 [0.71, 10.00] |
| 4 Rebleed postprocedure up to 5 years Show forest plot | 1 | 1448 | Risk Ratio (M‐H, Fixed, 95% CI) | 2.75 [1.51, 5.02] |
| 5 Rebleed postprocedure up to 10 years Show forest plot | 1 | 1323 | Risk Ratio (M‐H, Fixed, 95% CI) | 2.69 [1.50, 4.81] |
| Outcome or subgroup title | No. of studies | No. of participants | Statistical method | Effect size |
| 1 Complications from intervention Show forest plot | 2 | 129 | Risk Ratio (M‐H, Fixed, 95% CI) | 1.05 [0.44, 2.53] |
| Outcome or subgroup title | No. of studies | No. of participants | Statistical method | Effect size |
| 1 Non‐complete obliteration after 1 year Show forest plot | 3 | 1626 | Risk Ratio (M‐H, Fixed, 95% CI) | 2.02 [1.65, 2.47] |
| 2 < 90% occlusion after 1 year Show forest plot | 2 | 1440 | Risk Ratio (M‐H, Fixed, 95% CI) | 1.43 [0.93, 2.21] |
| Outcome or subgroup title | No. of studies | No. of participants | Statistical method | Effect size |
| 1 Poor outcome at 12 months: posterior and anterior circulation Show forest plot | 2 | 2226 | Risk Ratio (M‐H, Fixed, 95% CI) | 0.76 [0.66, 0.88] |
| 1.1 Poor outcome at 12 months: posterior circulation | 2 | 69 | Risk Ratio (M‐H, Fixed, 95% CI) | 0.41 [0.19, 0.92] |
| 1.2 Poor outcome at 12 months: anterior circulation | 2 | 2157 | Risk Ratio (M‐H, Fixed, 95% CI) | 0.78 [0.68, 0.90] |