Scolaris Content Display Scolaris Content Display

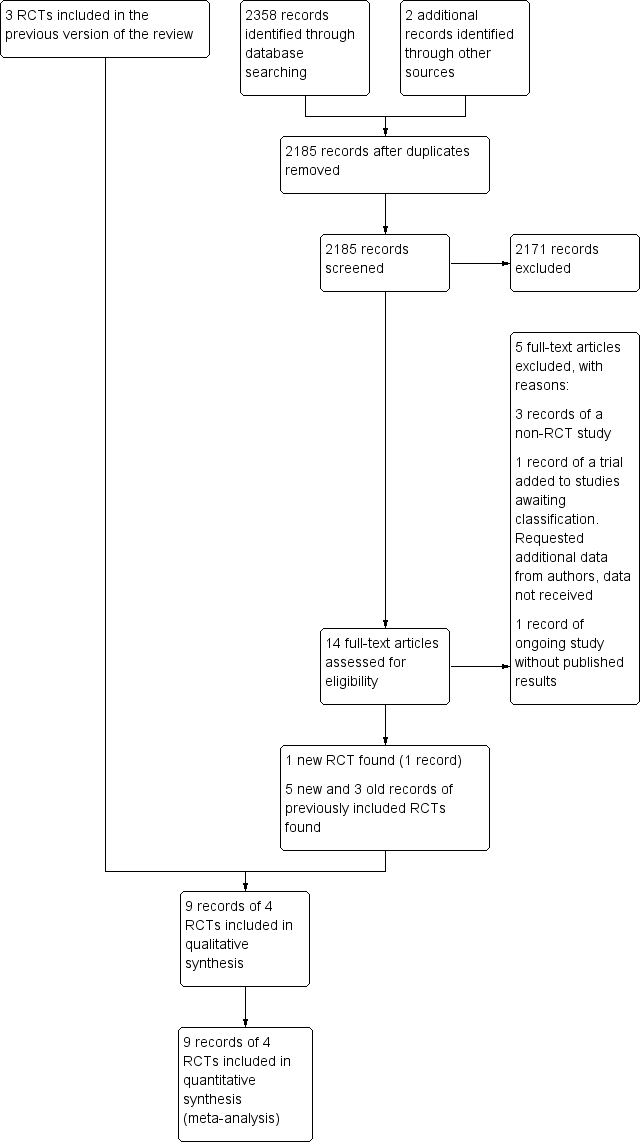
Study flow diagram. RCT: randomised controlled trial.
Figuras y tablas -
Figure 1

Study flow diagram. RCT: randomised controlled trial.

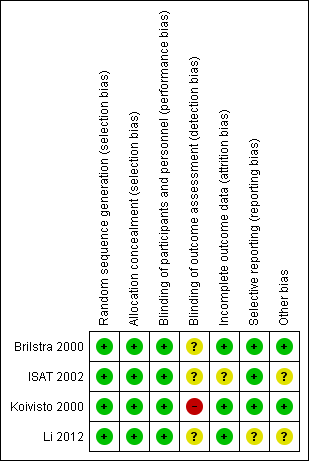
Risk of bias summary: review authors' judgements about each risk of bias item for each included study.
Figuras y tablas -
Figure 2

Risk of bias summary: review authors' judgements about each risk of bias item for each included study.

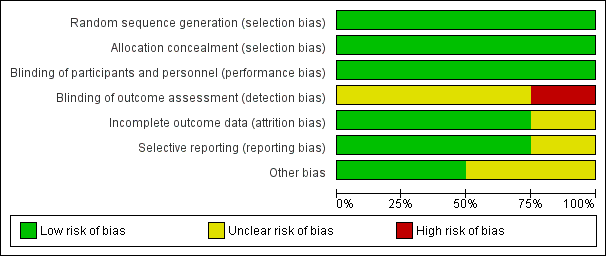
Risk of bias graph: review authors' judgements about each risk of bias item presented as percentages across all included studies.
Figuras y tablas -
Figure 3

Risk of bias graph: review authors' judgements about each risk of bias item presented as percentages across all included studies.

Comparison 1 Poor outcome: death or dependence in daily activities, Outcome 1 Death or dependency at 2–3 months.
Figuras y tablas -
Analysis 1.1

Comparison 1 Poor outcome: death or dependence in daily activities, Outcome 1 Death or dependency at 2–3 months.

Comparison 1 Poor outcome: death or dependence in daily activities, Outcome 2 Death or dependency at 12 months after subarachnoid haemorrhage.
Figuras y tablas -
Analysis 1.2

Comparison 1 Poor outcome: death or dependence in daily activities, Outcome 2 Death or dependency at 12 months after subarachnoid haemorrhage.

Comparison 1 Poor outcome: death or dependence in daily activities, Outcome 3 Worst‐case scenario at 12 months.
Figuras y tablas -
Analysis 1.3

Comparison 1 Poor outcome: death or dependence in daily activities, Outcome 3 Worst‐case scenario at 12 months.

Comparison 1 Poor outcome: death or dependence in daily activities, Outcome 4 Death or dependency at 5 years.
Figuras y tablas -
Analysis 1.4

Comparison 1 Poor outcome: death or dependence in daily activities, Outcome 4 Death or dependency at 5 years.

Comparison 1 Poor outcome: death or dependence in daily activities, Outcome 5 Death or dependency at 10 years.
Figuras y tablas -
Analysis 1.5

Comparison 1 Poor outcome: death or dependence in daily activities, Outcome 5 Death or dependency at 10 years.

Comparison 2 Death from any cause, Outcome 1 Death from any cause 2–3 months.
Figuras y tablas -
Analysis 2.1

Comparison 2 Death from any cause, Outcome 1 Death from any cause 2–3 months.

Comparison 2 Death from any cause, Outcome 2 Death from any cause between randomisation and 1 year after SAH.
Figuras y tablas -
Analysis 2.2

Comparison 2 Death from any cause, Outcome 2 Death from any cause between randomisation and 1 year after SAH.

Comparison 2 Death from any cause, Outcome 3 Death from any cause up to 5 years.
Figuras y tablas -
Analysis 2.3

Comparison 2 Death from any cause, Outcome 3 Death from any cause up to 5 years.

Comparison 2 Death from any cause, Outcome 4 Death from any cause up to 10 years.
Figuras y tablas -
Analysis 2.4

Comparison 2 Death from any cause, Outcome 4 Death from any cause up to 10 years.

Comparison 3 Delayed cerebral ischaemia (DCI), Outcome 1 DCI at 2–3 months.
Figuras y tablas -
Analysis 3.1

Comparison 3 Delayed cerebral ischaemia (DCI), Outcome 1 DCI at 2–3 months.

Comparison 4 Rebleeding, Outcome 1 Rebleed before treatment.
Figuras y tablas -
Analysis 4.1

Comparison 4 Rebleeding, Outcome 1 Rebleed before treatment.

Comparison 4 Rebleeding, Outcome 2 Rebleed postprocedure up to 1 year.
Figuras y tablas -
Analysis 4.2

Comparison 4 Rebleeding, Outcome 2 Rebleed postprocedure up to 1 year.

Comparison 4 Rebleeding, Outcome 3 Rebleed postprocedure up to 3 months.
Figuras y tablas -
Analysis 4.3

Comparison 4 Rebleeding, Outcome 3 Rebleed postprocedure up to 3 months.

Comparison 4 Rebleeding, Outcome 4 Rebleed postprocedure up to 5 years.
Figuras y tablas -
Analysis 4.4

Comparison 4 Rebleeding, Outcome 4 Rebleed postprocedure up to 5 years.

Comparison 4 Rebleeding, Outcome 5 Rebleed postprocedure up to 10 years.
Figuras y tablas -
Analysis 4.5

Comparison 4 Rebleeding, Outcome 5 Rebleed postprocedure up to 10 years.

Comparison 5 Complications from intervention, Outcome 1 Complications from intervention.
Figuras y tablas -
Analysis 5.1

Comparison 5 Complications from intervention, Outcome 1 Complications from intervention.

Comparison 6 Degree of obliteration, Outcome 1 Non‐complete obliteration after 1 year.
Figuras y tablas -
Analysis 6.1

Comparison 6 Degree of obliteration, Outcome 1 Non‐complete obliteration after 1 year.

Comparison 6 Degree of obliteration, Outcome 2 < 90% occlusion after 1 year.
Figuras y tablas -
Analysis 6.2

Comparison 6 Degree of obliteration, Outcome 2 < 90% occlusion after 1 year.

Comparison 7 Subgroup analysis: aneurysm location, Outcome 1 Poor outcome at 12 months: posterior and anterior circulation.
Figuras y tablas -
Analysis 7.1

Comparison 7 Subgroup analysis: aneurysm location, Outcome 1 Poor outcome at 12 months: posterior and anterior circulation.

Summary of findings for the main comparison. Endovascular coiling compared with neurosurgical clipping for subarachnoid haemorrhage

Endovascular coiling compared with neurosurgical clipping for subarachnoid haemorrhage

Patient or population: people with subarachnoid haemorrhage from a ruptured intracranial aneurysm

Settings: tertiary care

Intervention: endovascular coiling of aneurysm

Comparison: neurosurgical clipping of aneurysm

Outcomes

Illustrative comparative risks* (95% CI)

Relative effect
(95% CI)

No of participants
(studies)

Quality of the evidence
(GRADE)

Comments

Assumed risk

Corresponding risk

Neurosurgical clipping

Endovascular coiling

Poor outcome: death or dependence in daily activities (12 months)

Study population

RR 0.77 (0.67 to 0.87)

2429
(4 RCTs)

⊕⊕⊕⊝
Moderatea

366 per 1000

281 per 1000
(245 to 318)

Poor outcome (death or dependence) (10 years)

Study population

RR 0.81 (0.70 to 0.92)

1316
(1 RCT)

⊕⊕⊝⊝a,b
Low

Based on subgroup of participants in 1 large RCT only

430 per 1000

348 per 1000
(301 to 395)

Death from any cause (12 months)

Study population

RR 0.80 (0.63 to 1.02)

2429
(4 RCTs)

⊕⊕⊕⊝
Moderatea

154 per 1000

123 per 1000
(97 to 157)

Delayed cerebral ischaemia (2–3 months)

Study population

RR 0.84 (0.74 to 0.96)

2450 (4 RCTs)

⊕⊕⊕⊝
Moderatea

384 per 1000

322 per 1000
(284 to 368 )

Rebleeding postprocedure up to 1 year

Study population

RR 1.83 (1.04 to 3.23)

2458 (4 RCTs)

⊕⊕⊕⊕
High

21 per 1000

38 per 1000 (21 to 67)

Rebleeding postprocedure up to 10 years

Study population

RR 2.69 (1.50 to 4.81)

1323 (1 RCT)

⊕⊕⊝⊝a,b
Low

Based on 1 large RCT only

22 per 1000

61 per 1000
(34 to 109)

Complications from the intervention

Study population

RR 1.05 (0.44 to 2.53)

129 (2 RCTs)

⊕⊕⊝⊝c
Low

Based on 2 small RCTs only

235 per 1000

246 per 1000

(103 to 594)

*The basis for the assumed risk (e.g. the median control group risk across studies) is derived from the studies included in the meta‐analysis. The corresponding risk (and its 95% confidence interval) is based on the assumed risk in the comparison group and the relative effect of the intervention (and its 95% CI).

CI: confidence interval; RCT: randomised controlled trial; RR: risk ratio.

GRADE Working Group grades of evidence
High quality: further research is very unlikely to change our confidence in the estimate of effect.
Moderate quality: further research is likely to have an important impact on our confidence in the estimate of effect and may change the estimate.
Low quality: further research is very likely to have an important impact on our confidence in the estimate of effect and is likely to change the estimate.
Very low quality: we are very uncertain about the estimate.

aDowngraded one level due to indirectness of evidence: participants in poor condition on admission under‐represented in the largest RCT.

bDowngraded one level due to risk of bias: long‐term outcome data available for only a subgroup of participants.

cDowngraded two levels due to risk of bias: underpowered due to data availability from only two small trials, unclear definition of complication from intervention.

Figuras y tablas -
Summary of findings for the main comparison. Endovascular coiling compared with neurosurgical clipping for subarachnoid haemorrhage
Table 1. Angiographic occlusion on follow‐up angiography during first year post‐treatment

Number of participants per treatment

Extent of occlusion

100%

90% to 100%

< 90%

ISAT 2002

Endovascular coiling: 881

584 (66%)

228 (26%)

69 (8%)

Neurosurgical clipping: 450

370 (82%)

55 (12%)

25 (6%)

Koivisto 2000

Endovascular coiling: 52

40 (77%)

10 (19%)

2 (4%)

Neurosurgical clipping: 57

49 (86%)

7 (12%)

1 (2%)

Total

Endovascular coiling: 933

624 (67%)

238 (26%)

71 (8%)

Neurosurgical clipping: 507

419 (83%)

62 (12%)

26 (5%)

Figuras y tablas -
Table 1. Angiographic occlusion on follow‐up angiography during first year post‐treatment
Comparison 1. Poor outcome: death or dependence in daily activities

Outcome or subgroup title

No. of studies

No. of participants

Statistical method

Effect size

1 Death or dependency at 2–3 months Show forest plot

3

2257

Risk Ratio (M‐H, Fixed, 95% CI)

0.71 [0.63, 0.81]

2 Death or dependency at 12 months after subarachnoid haemorrhage Show forest plot

4

2429

Risk Ratio (M‐H, Fixed, 95% CI)

0.77 [0.67, 0.87]

3 Worst‐case scenario at 12 months Show forest plot

4

2458

Risk Ratio (M‐H, Fixed, 95% CI)

0.80 [0.71, 0.91]

4 Death or dependency at 5 years Show forest plot

1

1724

Risk Ratio (M‐H, Fixed, 95% CI)

0.87 [0.75, 1.01]

5 Death or dependency at 10 years Show forest plot

1

1316

Risk Ratio (M‐H, Fixed, 95% CI)

0.81 [0.70, 0.92]

Figuras y tablas -
Comparison 1. Poor outcome: death or dependence in daily activities
Comparison 2. Death from any cause

Outcome or subgroup title

No. of studies

No. of participants

Statistical method

Effect size

1 Death from any cause 2–3 months Show forest plot

3

2257

Risk Ratio (M‐H, Fixed, 95% CI)

0.88 [0.66, 1.18]

2 Death from any cause between randomisation and 1 year after SAH Show forest plot

4

2429

Risk Ratio (M‐H, Fixed, 95% CI)

0.80 [0.63, 1.02]

3 Death from any cause up to 5 years Show forest plot

1

2087

Risk Ratio (M‐H, Fixed, 95% CI)

0.77 [0.61, 0.98]

4 Death from any cause up to 10 years Show forest plot

1

1644

Risk Ratio (M‐H, Fixed, 95% CI)

0.78 [0.64, 0.96]

Figuras y tablas -
Comparison 2. Death from any cause
Comparison 3. Delayed cerebral ischaemia (DCI)

Outcome or subgroup title

No. of studies

No. of participants

Statistical method

Effect size

1 DCI at 2–3 months Show forest plot

4

2450

Risk Ratio (M‐H, Fixed, 95% CI)

0.84 [0.74, 0.96]

Figuras y tablas -
Comparison 3. Delayed cerebral ischaemia (DCI)
Comparison 4. Rebleeding

Outcome or subgroup title

No. of studies

No. of participants

Statistical method

Effect size

1 Rebleed before treatment Show forest plot

3

2272

Risk Ratio (M‐H, Fixed, 95% CI)

0.64 [0.37, 1.12]

2 Rebleed postprocedure up to 1 year Show forest plot

4

2458

Risk Ratio (M‐H, Fixed, 95% CI)

1.83 [1.04, 3.23]

3 Rebleed postprocedure up to 3 months Show forest plot

3

2272

Risk Ratio (M‐H, Fixed, 95% CI)

2.66 [0.71, 10.00]

4 Rebleed postprocedure up to 5 years Show forest plot

1

1448

Risk Ratio (M‐H, Fixed, 95% CI)

2.75 [1.51, 5.02]

5 Rebleed postprocedure up to 10 years Show forest plot

1

1323

Risk Ratio (M‐H, Fixed, 95% CI)

2.69 [1.50, 4.81]

Figuras y tablas -
Comparison 4. Rebleeding
Comparison 5. Complications from intervention

Outcome or subgroup title

No. of studies

No. of participants

Statistical method

Effect size

1 Complications from intervention Show forest plot

2

129

Risk Ratio (M‐H, Fixed, 95% CI)

1.05 [0.44, 2.53]

Figuras y tablas -
Comparison 5. Complications from intervention
Comparison 6. Degree of obliteration

Outcome or subgroup title

No. of studies

No. of participants

Statistical method

Effect size

1 Non‐complete obliteration after 1 year Show forest plot

3

1626

Risk Ratio (M‐H, Fixed, 95% CI)

2.02 [1.65, 2.47]

2 < 90% occlusion after 1 year Show forest plot

2

1440

Risk Ratio (M‐H, Fixed, 95% CI)

1.43 [0.93, 2.21]

Figuras y tablas -
Comparison 6. Degree of obliteration
Comparison 7. Subgroup analysis: aneurysm location

Outcome or subgroup title

No. of studies

No. of participants

Statistical method

Effect size

1 Poor outcome at 12 months: posterior and anterior circulation Show forest plot

2

2226

Risk Ratio (M‐H, Fixed, 95% CI)

0.76 [0.66, 0.88]

1.1 Poor outcome at 12 months: posterior circulation

2

69

Risk Ratio (M‐H, Fixed, 95% CI)

0.41 [0.19, 0.92]

1.2 Poor outcome at 12 months: anterior circulation

2

2157

Risk Ratio (M‐H, Fixed, 95% CI)

0.78 [0.68, 0.90]

Figuras y tablas -
Comparison 7. Subgroup analysis: aneurysm location