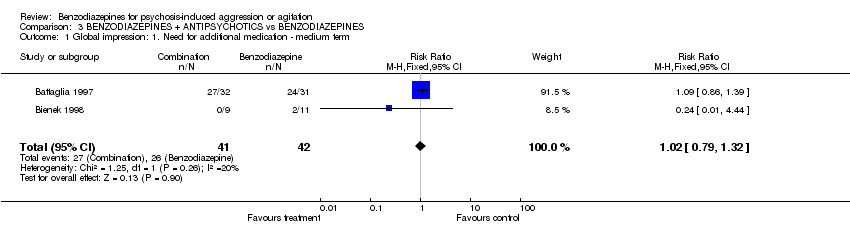
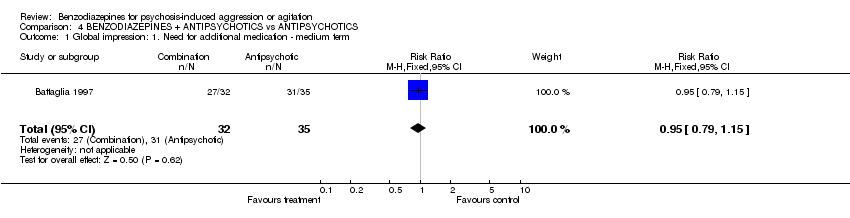
| 1 Global impression: 1. Need for additional medication ‐ medium term Show forest plot | 2 | 216 | Risk Ratio (M‐H, Random, 95% CI) | 1.28 [0.51, 3.22] |
|
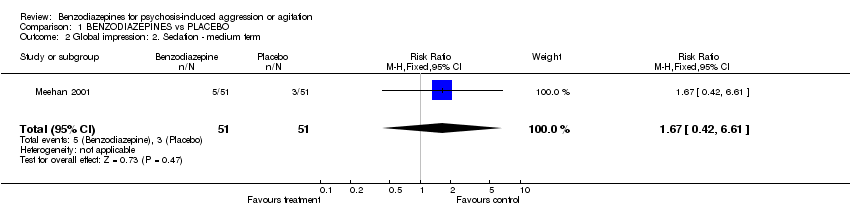
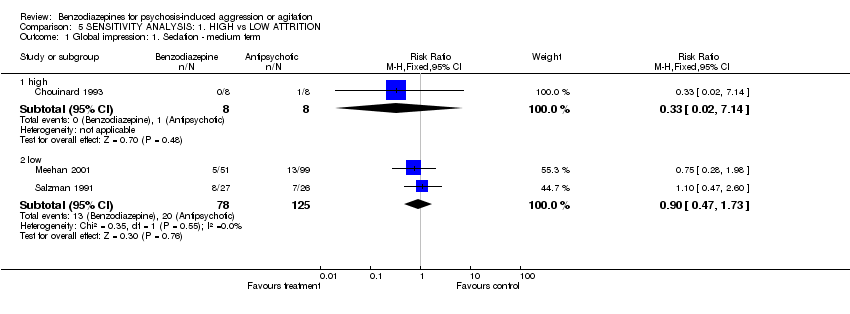
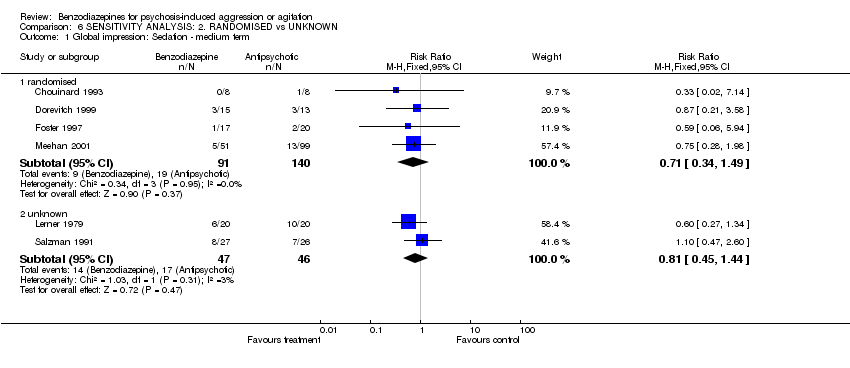
| 2 Global impression: 2. Sedation ‐ medium term Show forest plot | 6 | 324 | Risk Ratio (M‐H, Fixed, 95% CI) | 0.76 [0.48, 1.21] |
|
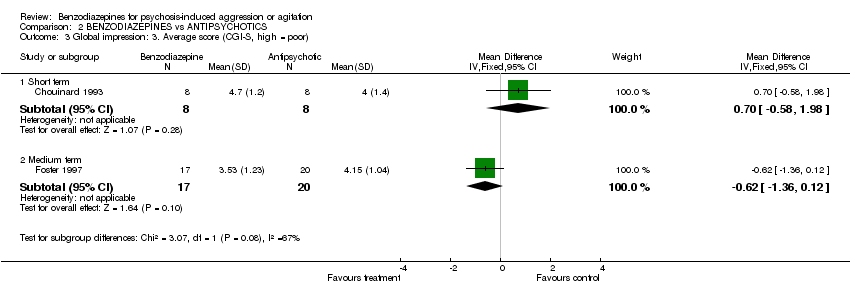
| 3 Global impression: 3. Average score (CGI‐S, high = poor) Show forest plot | 2 | | Mean Difference (IV, Fixed, 95% CI) | Subtotals only |
|
| 3.1 Short term | 1 | 16 | Mean Difference (IV, Fixed, 95% CI) | 0.70 [‐0.58, 1.98] |
| 3.2 Medium term | 1 | 37 | Mean Difference (IV, Fixed, 95% CI) | ‐0.62 [‐1.36, 0.12] |
| 4 Global impression: 4. Average change ‐ medium term (CGI‐S, high = poor) Show forest plot | 2 | 189 | Mean Difference (IV, Fixed, 95% CI) | 0.20 [‐0.07, 0.47] |
|
| 5 Global impression: 5. Average score ‐ medium term (CGI‐S, skewed) Show forest plot | | | Other data | No numeric data |
|
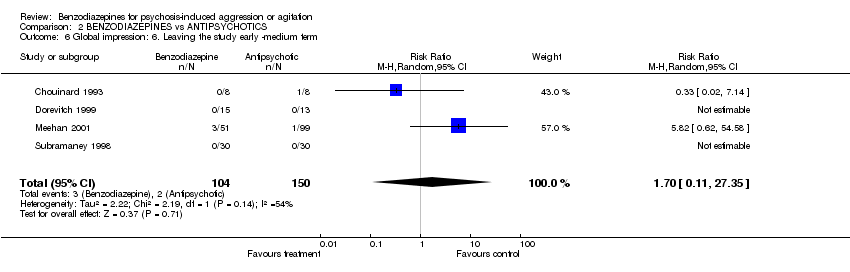
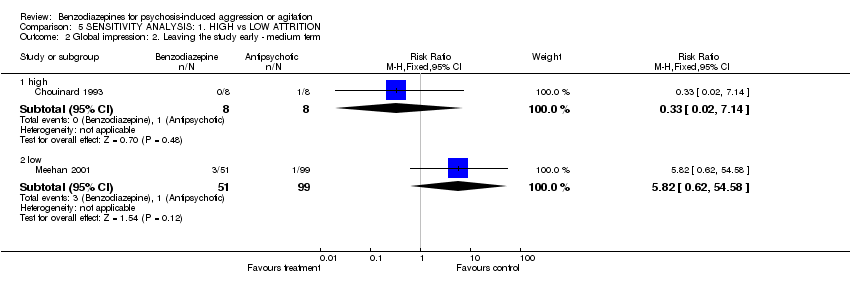
| 6 Global impression: 6. Leaving the study early ‐medium term Show forest plot | 4 | 254 | Risk Ratio (M‐H, Random, 95% CI) | 1.70 [0.11, 27.35] |
|
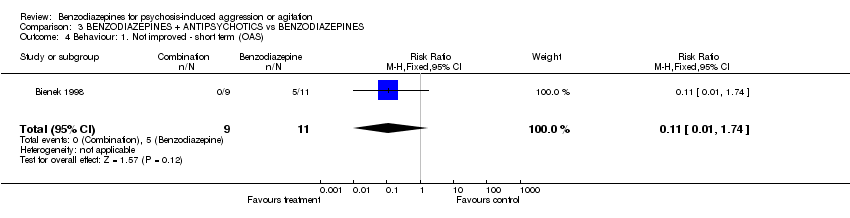
| 7 Behaviour: 1. Not improved ‐ medium term (OAS) Show forest plot | 1 | 28 | Risk Ratio (M‐H, Fixed, 95% CI) | 2.6 [0.31, 22.05] |
|
| 8 Behaviour: 2. Average aggression score ‐ medium term (OAS, skewed) Show forest plot | | | Other data | No numeric data |
|
| 9 Mental state: 1. Not improved ‐ medium term (IMPS) Show forest plot | 1 | 16 | Risk Ratio (M‐H, Fixed, 95% CI) | 1.5 [0.34, 6.70] |
|
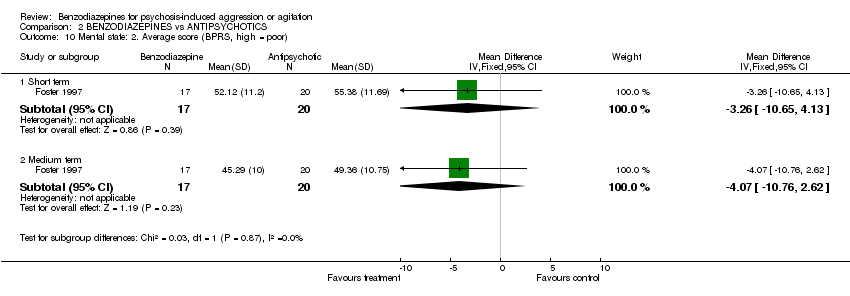
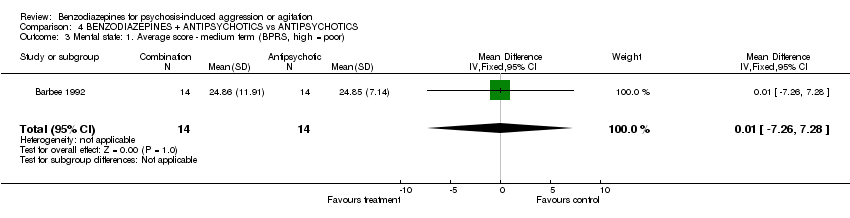
| 10 Mental state: 2. Average score (BPRS, high = poor) Show forest plot | 1 | | Mean Difference (IV, Fixed, 95% CI) | Subtotals only |
|
| 10.1 Short term | 1 | 37 | Mean Difference (IV, Fixed, 95% CI) | ‐3.26 [‐10.65, 4.13] |
| 10.2 Medium term | 1 | 37 | Mean Difference (IV, Fixed, 95% CI) | ‐4.07 [‐10.76, 2.62] |
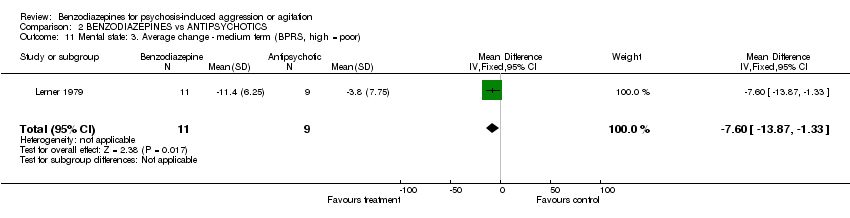
| 11 Mental state: 3. Average change ‐ medium term (BPRS, high = poor) Show forest plot | 1 | 20 | Mean Difference (IV, Fixed, 95% CI) | ‐7.60 [‐13.87, ‐1.33] |
|
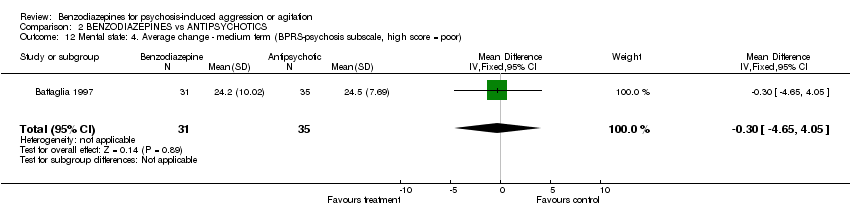
| 12 Mental state: 4. Average change ‐ medium term (BPRS‐psychosis subscale, high score = poor) Show forest plot | 1 | 66 | Mean Difference (IV, Fixed, 95% CI) | ‐0.30 [‐4.65, 4.05] |
|
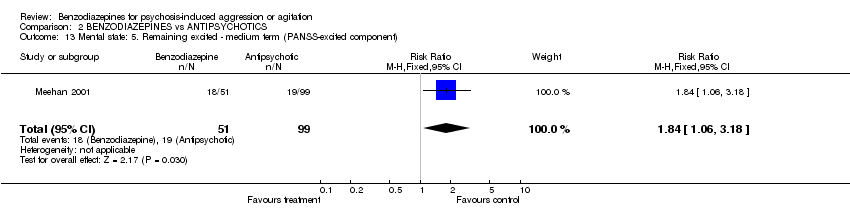
| 13 Mental state: 5. Remaining excited ‐ medium term (PANSS‐excited component) Show forest plot | 1 | 150 | Risk Ratio (M‐H, Fixed, 95% CI) | 1.84 [1.06, 3.18] |
|
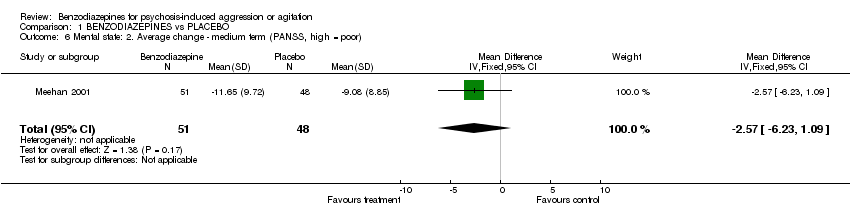
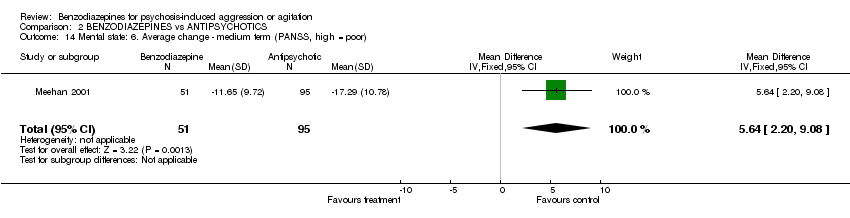
| 14 Mental state: 6. Average change ‐ medium term (PANSS, high = poor) Show forest plot | 1 | 146 | Mean Difference (IV, Fixed, 95% CI) | 5.64 [2.20, 9.08] |
|
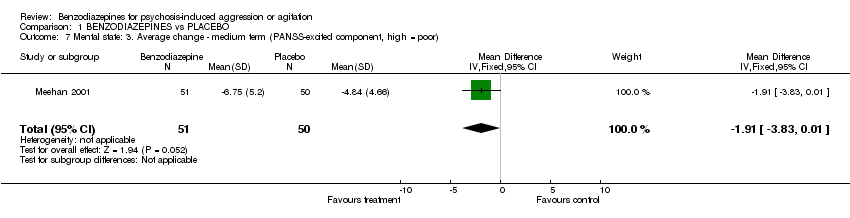
| 15 Mental state: 7. Average change ‐ medium term (PANSS‐Excited component, high = poor) Show forest plot | 1 | 149 | Mean Difference (IV, Fixed, 95% CI) | 2.85 [1.14, 4.56] |
|
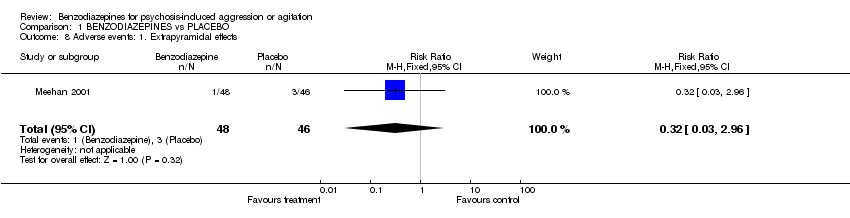
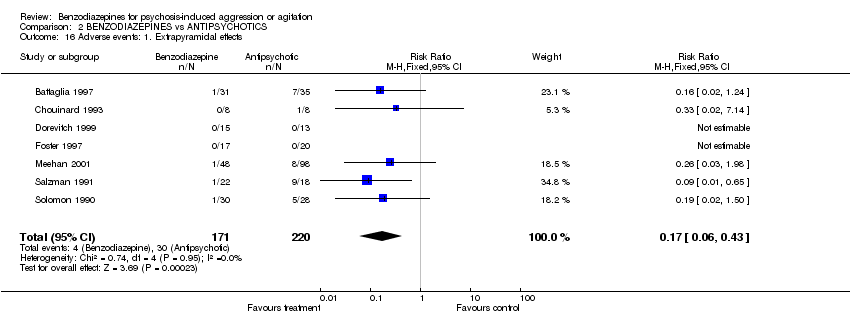
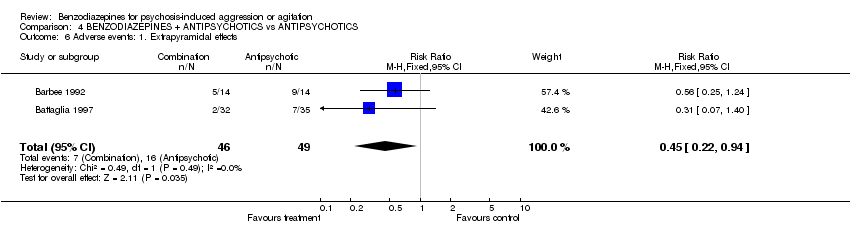
| 16 Adverse events: 1. Extrapyramidal effects Show forest plot | 7 | 391 | Risk Ratio (M‐H, Fixed, 95% CI) | 0.17 [0.06, 0.43] |
|
| 17 Adverse events: 2. Requiring anticholinergic medication ‐ medium term Show forest plot | 1 | 150 | Risk Ratio (M‐H, Fixed, 95% CI) | 0.24 [0.03, 1.89] |
|
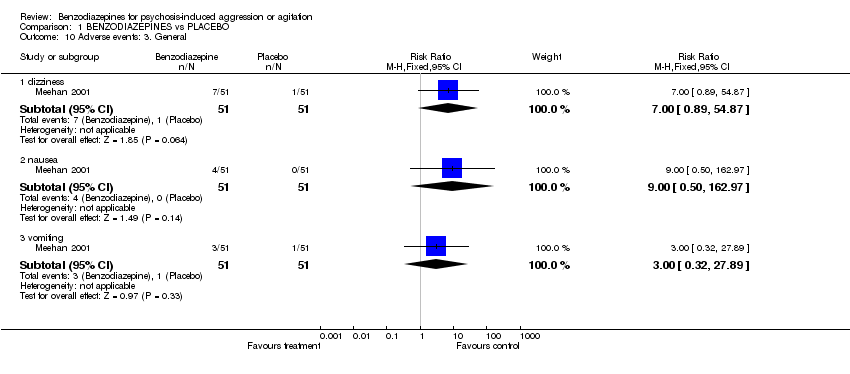
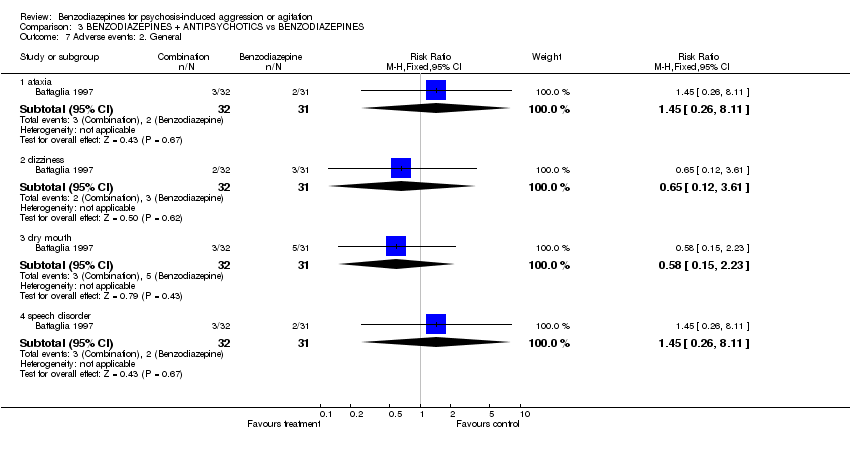
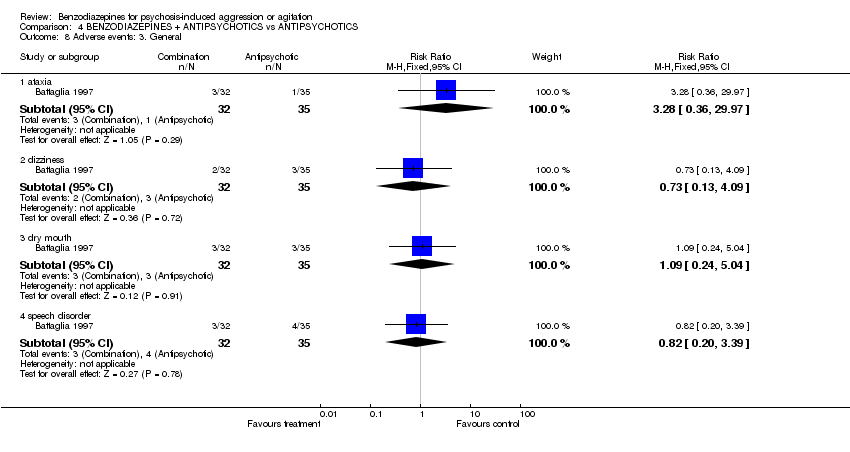
| 18 Adverse events: 3. General Show forest plot | 2 | | Risk Ratio (M‐H, Fixed, 95% CI) | Subtotals only |
|
| 18.1 ataxia | 1 | 66 | Risk Ratio (M‐H, Fixed, 95% CI) | 2.26 [0.22, 23.71] |
| 18.2 dizziness | 2 | 216 | Risk Ratio (M‐H, Fixed, 95% CI) | 1.39 [0.63, 3.07] |
| 18.3 dry mouth | 1 | 66 | Risk Ratio (M‐H, Fixed, 95% CI) | 1.88 [0.49, 7.24] |
| 18.4 nausea | 1 | 150 | Risk Ratio (M‐H, Fixed, 95% CI) | 7.76 [0.89, 67.67] |
| 18.5 speech disorder | 1 | 66 | Risk Ratio (M‐H, Fixed, 95% CI) | 0.56 [0.11, 2.87] |
| 18.6 vomiting | 1 | 150 | Risk Ratio (M‐H, Fixed, 95% CI) | 13.46 [0.71, 255.70] |