Bolsa doble o en Y versus sistemas de transferencia estándar para la diálisis peritoneal ambulatoria continua en la insuficiencia renal terminal
Información
- DOI:
- https://doi.org/10.1002/14651858.CD003078.pub2Copiar DOI

- Base de datos:
-
- Cochrane Database of Systematic Reviews
- Versión publicada:
-
- 13 agosto 2014see what's new
- Tipo:
-
- Intervention
- Etapa:
-
- Review
- Grupo Editorial Cochrane:
-
Grupo Cochrane de Riñón y trasplante
- Copyright:
-
- Copyright © 2016 The Cochrane Collaboration. Published by John Wiley & Sons, Ltd.
Cifras del artículo
Altmetric:
Citado por:
Autores
Contributions of authors
-
Study conception (including funding): MacLeod A, Grant A , Daly C, Donaldson C, Campbell M, Khan I, Lawrence P
-
Protocol development: Campbell M, Cody J, Daly C, Donaldson C, Grant A, Vale L, Lawrence P, MacLeod A, Wallace S, Khan I
-
Literature search: Wallace S, Daly C, Lawrence P, Cody J, Khan I, Vale L, MacLeod A
-
Data extraction and analysis: Daly C, Campbell M, Khan I, Cody J
-
Writing of draft report: Daly C
-
Updating the review: Strippoli GFM (2004)
-
Editorial role and agreement of final manuscript: Campbell M, Cody J, Daly C, Donaldson C, Grant A, Vale L, Lawrence P, MacLeod A, Wallace S, Khan I
Sources of support
Internal sources
-
University of Aberdeen, UK.
-
Health Services Research Unit, UK.
-
Health Economics Research Unit, UK.
External sources
-
NHS Executive Research and Development Programme, UK.
Declarations of interest
Sheila Wallace is a Trials Search Co‐ordinator for the Cochrane Incontinence Review Group, whose single largest funder is the UK National Institute for Health Research (NIHR). The exploratory meeting to set up the Cochrane Incontinence Review Group was funded by Zeneca Pharmaceuticals in 1995.
Following completion of this review, an unrestricted educational grant from Janssen Cilag funded a further six systematic reviews related to ESKD and erythropoietin.
Acknowledgements
This review was funded by the NHS Executive Research and Development Health Technology Assessment Programme. The Health Services Research Unit and the Health Economics Research Unit are funded by the Chief Scientist's Office, Scottish Executive Health Department. The authors would like to thank Carol Ritchie and Gloria Montague for secretarial support.
We also wish to gratefully acknowledge the contributions of Marion Campbell, Alison MacLeod, Adrian Grant and Paul Lawrence to earlier versions of this review.
Version history
| Published | Title | Stage | Authors | Version |
| 2014 Aug 13 | Double bag or Y‐set versus standard transfer systems for continuous ambulatory peritoneal dialysis in end‐stage kidney disease | Review | Conal Daly, June D Cody, Izhar Khan, Kannaiyan S Rabindranath, Luke Vale, Sheila A Wallace | |
| 2001 Apr 23 | Double bag or Y‐set versus standard transfer systems for continuous ambulatory peritoneal dialysis in end‐stage kidney disease | Review | Conal Daly, June D Cody, Izhar Khan, Kannaiyan S Rabindranath, Luke Vale, Sheila A Wallace | |
Notes
There have been no new or ongoing studies since 1999, therefore this review is no longer being updated. Correa‐Rotter 1997, listed as awaiting assessment has now been excluded.
Keywords
MeSH
Medical Subject Headings (MeSH) Keywords
Medical Subject Headings Check Words
Humans;
PICO

Comparison 1 Y‐set systems versus standard systems, Outcome 1 Number of patients with peritonitis.

Comparison 1 Y‐set systems versus standard systems, Outcome 2 Peritonitis rate.

Comparison 1 Y‐set systems versus standard systems, Outcome 3 Number of patients with exit site/tunnel infection.

Comparison 1 Y‐set systems versus standard systems, Outcome 4 Exit‐site/tunnel infection rate.

Comparison 1 Y‐set systems versus standard systems, Outcome 5 Number of patients switched to HD.

Comparison 1 Y‐set systems versus standard systems, Outcome 6 Number of patients no longer on allocated treatment for whatever reason.

Comparison 1 Y‐set systems versus standard systems, Outcome 7 Number of patients who had CAPD catheter removed.

Comparison 1 Y‐set systems versus standard systems, Outcome 8 Number of patients hospitalised (all cause).

Comparison 1 Y‐set systems versus standard systems, Outcome 9 Number of patients hospitalised (peritonitis).

Comparison 1 Y‐set systems versus standard systems, Outcome 10 All‐cause mortality.

Comparison 2 Double bag systems versus standard systems, Outcome 1 Number of patients with peritonitis.

Comparison 2 Double bag systems versus standard systems, Outcome 2 Peritonitis rate.

Comparison 2 Double bag systems versus standard systems, Outcome 3 Number of patients switched to HD.

Comparison 2 Double bag systems versus standard systems, Outcome 4 Number of patients with exit site infection.

Comparison 2 Double bag systems versus standard systems, Outcome 5 All‐cause mortality.

Comparison 3 Y‐set or double bag systems versus standard systems, Outcome 1 Number of patients with peritonitis.

Comparison 3 Y‐set or double bag systems versus standard systems, Outcome 2 Peritonitis rate.

Comparison 3 Y‐set or double bag systems versus standard systems, Outcome 3 Number of patients with exit‐site/tunnel infection.

Comparison 3 Y‐set or double bag systems versus standard systems, Outcome 4 Exit‐site/tunnel infection rate.
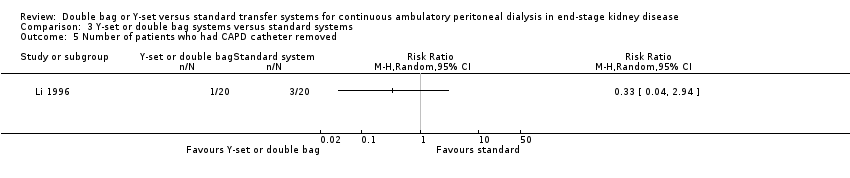
Comparison 3 Y‐set or double bag systems versus standard systems, Outcome 5 Number of patients who had CAPD catheter removed.

Comparison 3 Y‐set or double bag systems versus standard systems, Outcome 6 Number of patients no longer on allocated treatment for whatever reason.

Comparison 3 Y‐set or double bag systems versus standard systems, Outcome 7 Number of patients switched to HD.

Comparison 3 Y‐set or double bag systems versus standard systems, Outcome 8 Number of patients hospitalised (all cause).

Comparison 3 Y‐set or double bag systems versus standard systems, Outcome 9 Number of patients hospitalised (peritonitis).

Comparison 3 Y‐set or double bag systems versus standard systems, Outcome 10 All‐cause mortality.

Comparison 4 Double bag systems versus Y‐set systems, Outcome 1 Number of patients with peritonitis.

Comparison 4 Double bag systems versus Y‐set systems, Outcome 2 Peritonitis rate.

Comparison 4 Double bag systems versus Y‐set systems, Outcome 3 Exit‐site/tunnel infection rate.

Comparison 4 Double bag systems versus Y‐set systems, Outcome 4 Number of patients switched to HD.

Comparison 4 Double bag systems versus Y‐set systems, Outcome 5 Number of patients no longer on allocated treatment for whatever reason.

Comparison 4 Double bag systems versus Y‐set systems, Outcome 6 Number of patients who had CAPD catheter removed.

Comparison 4 Double bag systems versus Y‐set systems, Outcome 7 All‐cause mortality.
| Study | Double bag systems | Y‐set systems | Standard systems |
| ‐‐ | 30.8 | 21.5 | |
| ‐‐ | 21.53 | 9.93 | |
| ‐‐ | 17.0 | 11.4 | |
| ‐‐ | 22.0 | 8.0 | |
| ‐‐ | 33.0 | 11.3 | |
| ‐‐ | 13.4 | 4.9 | |
| ‐‐ | 23.0 | 12.3 | |
| 25.0 | ‐‐ | 9.7 | |
| 24.8 | 11.8 | 6.1 | |
| 46.4 | 14.0 | ‐‐ | |
| 33.9 | 11.7 | ‐‐ | |
| 33.5 | 29.4 | ‐‐ |
| Study | Double bag systems | Y‐set systems | Standard systems |
| ‐‐ | 14.9 | 16.4 | |
| ‐‐ | 26.4 | 21.6 | |
| 28.3 | 12.5 | ‐‐ | |
| 17.4 | 16.0 | ‐‐ |
| Outcome or subgroup title | No. of studies | No. of participants | Statistical method | Effect size |
| 1 Number of patients with peritonitis Show forest plot | 7 | 485 | Risk Ratio (M‐H, Random, 95% CI) | 0.64 [0.53, 0.77] |
| 2 Peritonitis rate Show forest plot | 8 | 7417 | Risk Ratio (M‐H, Random, 95% CI) | 0.49 [0.40, 0.61] |
| 3 Number of patients with exit site/tunnel infection Show forest plot | 2 | 184 | Risk Ratio (M‐H, Random, 95% CI) | 1.02 [0.72, 1.46] |
| 4 Exit‐site/tunnel infection rate Show forest plot | 2 | 2841 | Risk Ratio (M‐H, Random, 95% CI) | 1.24 [0.91, 1.69] |
| 5 Number of patients switched to HD Show forest plot | 2 | 184 | Risk Ratio (M‐H, Random, 95% CI) | 0.45 [0.19, 1.05] |
| 6 Number of patients no longer on allocated treatment for whatever reason Show forest plot | 2 | 184 | Risk Ratio (M‐H, Random, 95% CI) | 1.05 [0.76, 1.46] |
| 7 Number of patients who had CAPD catheter removed Show forest plot | 1 | Risk Ratio (M‐H, Random, 95% CI) | Totals not selected | |
| 8 Number of patients hospitalised (all cause) Show forest plot | 1 | Risk Ratio (M‐H, Random, 95% CI) | Totals not selected | |
| 9 Number of patients hospitalised (peritonitis) Show forest plot | 1 | Risk Ratio (M‐H, Random, 95% CI) | Totals not selected | |
| 10 All‐cause mortality Show forest plot | 5 | 355 | Risk Ratio (M‐H, Random, 95% CI) | 1.03 [0.48, 2.21] |
| Outcome or subgroup title | No. of studies | No. of participants | Statistical method | Effect size |
| 1 Number of patients with peritonitis Show forest plot | 2 | 170 | Risk Ratio (M‐H, Random, 95% CI) | 0.43 [0.29, 0.62] |
| 2 Peritonitis rate Show forest plot | 2 | 2110 | Risk Ratio (M‐H, Random, 95% CI) | 0.31 [0.20, 0.47] |
| 3 Number of patients switched to HD Show forest plot | 1 | Risk Ratio (M‐H, Random, 95% CI) | Totals not selected | |
| 4 Number of patients with exit site infection Show forest plot | 1 | Risk Ratio (M‐H, Random, 95% CI) | Totals not selected | |
| 5 All‐cause mortality Show forest plot | 1 | Risk Ratio (M‐H, Random, 95% CI) | Totals not selected | |
| Outcome or subgroup title | No. of studies | No. of participants | Statistical method | Effect size |
| 1 Number of patients with peritonitis Show forest plot | 8 | 626 | Risk Ratio (M‐H, Random, 95% CI) | 0.58 [0.49, 0.68] |
| 2 Peritonitis rate Show forest plot | 11 | 10082 | Risk Ratio (M‐H, Random, 95% CI) | 0.55 [0.42, 0.73] |
| 3 Number of patients with exit‐site/tunnel infection Show forest plot | 3 | 264 | Risk Ratio (M‐H, Random, 95% CI) | 1.00 [0.71, 1.42] |
| 4 Exit‐site/tunnel infection rate Show forest plot | 2 | 2841 | Risk Ratio (M‐H, Random, 95% CI) | 1.24 [0.91, 1.69] |
| 5 Number of patients who had CAPD catheter removed Show forest plot | 1 | Risk Ratio (M‐H, Random, 95% CI) | Totals not selected | |
| 6 Number of patients no longer on allocated treatment for whatever reason Show forest plot | 2 | 184 | Risk Ratio (M‐H, Random, 95% CI) | 1.05 [0.76, 1.46] |
| 7 Number of patients switched to HD Show forest plot | 3 | 264 | Risk Ratio (M‐H, Random, 95% CI) | 0.48 [0.21, 1.09] |
| 8 Number of patients hospitalised (all cause) Show forest plot | 1 | Risk Ratio (M‐H, Random, 95% CI) | Totals not selected | |
| 9 Number of patients hospitalised (peritonitis) Show forest plot | 1 | Risk Ratio (M‐H, Random, 95% CI) | Totals not selected | |
| 10 All‐cause mortality Show forest plot | 6 | 435 | Risk Ratio (M‐H, Random, 95% CI) | 1.03 [0.52, 2.03] |
| Outcome or subgroup title | No. of studies | No. of participants | Statistical method | Effect size |
| 1 Number of patients with peritonitis Show forest plot | 3 | 292 | Risk Ratio (M‐H, Random, 95% CI) | 0.59 [0.35, 1.01] |
| 2 Peritonitis rate Show forest plot | 4 | 4319 | Risk Ratio (M‐H, Random, 95% CI) | 0.90 [0.49, 1.66] |
| 3 Exit‐site/tunnel infection rate Show forest plot | 3 | 2665 | Risk Ratio (M‐H, Random, 95% CI) | 1.04 [0.52, 2.06] |
| 4 Number of patients switched to HD Show forest plot | 2 | 145 | Risk Ratio (M‐H, Random, 95% CI) | 0.30 [0.03, 3.10] |
| 5 Number of patients no longer on allocated treatment for whatever reason Show forest plot | 1 | Risk Ratio (M‐H, Random, 95% CI) | Totals not selected | |
| 6 Number of patients who had CAPD catheter removed Show forest plot | 1 | Risk Ratio (M‐H, Random, 95% CI) | Totals not selected | |
| 7 All‐cause mortality Show forest plot | 2 | 193 | Risk Ratio (M‐H, Random, 95% CI) | 0.92 [0.25, 3.43] |