Bolsa doble o en Y versus sistemas de transferencia estándar para la diálisis peritoneal ambulatoria continua en la insuficiencia renal terminal
Resumen
Antecedentes
La peritonitis es la complicación grave más frecuente de la diálisis peritoneal ambulatoria continua (DPAC). Este evento tiene una influencia importante en el número de pacientes que cambian de la DPAC a hemodiálisis, y probablemente ha restringido la aceptación y captación amplia de la DPAC como una forma alternativa de diálisis.
Ésta es una actualización de una revisión publicada por primera vez en el año 2000.
Objetivos
Esta revisión sistemática intentó determinar si las modificaciones de los equipos de transferencia (bolsa doble o en Y) utilizados en los intercambios de la DPAC se asocian con una reducción en la peritonitis y una mejoría en otros resultados relevantes.
Métodos de búsqueda
Se hicieron búsquedas en el registro especializado del Grupo Cochrane de Riñón (Cochrane Renal Group) a través del contacto con el coordinador de búsqueda de ensayos. Los estudios contenidos en el registro especializado se identifican a través de estrategias de búsqueda diseñadas específicamente para CENTRAL, MEDLINE y EMBASE. Fecha de la última búsqueda: 22 de octubre de 2013.
Criterios de selección
Ensayos controlados aleatorizados (ECA) o cuasialeatorizados que compararan los sistemas de intercambio de bolsa doble, en Y y de la diálisis peritoneal (DP) estándar en pacientes con insuficiencia renal terminal.
Obtención y análisis de los datos
Un investigador extrajo los datos en un formulario estándar y se analizaron mediante Review Manager. Para el análisis, se utilizó el modelo de efectos aleatorios y los resultados se expresaron como riesgo relativo (RR) o diferencia de medias (DM) con intervalos de confianza (IC) del 95%.
Resultados principales
Se identificaron 12 ensayos elegibles con 991 pacientes asignados al azar. A pesar del elevado número de pacientes, pocos ensayos analizaron las mismas intervenciones, en cada ensayo se reclutaron escasos números de pacientes y la calidad metodológica fue subóptima. Los sistemas de bolsa doble y en Y fueron superiores a los sistemas de punta convencionales (siete ensayos, 485 pacientes, RR 0,64; IC del 95%: 0,53 a 0,77) para prevenir la peritonitis en la DP.
Conclusiones de los autores
Los sistemas de desconexión deberían ser los sistemas de intercambio preferidos en la DPAC.
PICOs
Resumen en términos sencillos
Los sistemas de bolsa doble y en Y ofrecen la mayor protección contra la peritonitis durante la diálisis peritoneal ambulatoria continua (DPAC)
Los pacientes con enfermedad renal avanzada se pueden tratar con DPAC, que consiste en insertar un catéter permanente en el peritoneo (revestimiento alrededor del contenido abdominal) a través de la pared abdominal y hacer circular líquido estéril hacia fuera y hacia dentro varias veces al día. La complicación grave más frecuente es la infección del peritoneo, la peritonitis. La peritonitis puede ser causada por la transferencia accidental de bacterias desde el catéter. Esta revisión de ensayos comparó tres tipos de sistemas de conexión (utilizados para conectar las bolsas y el catéter) y encontró que los sistemas de intercambio en Y y de bolsa doble son más efectivos para prevenir la peritonitis.
Authors' conclusions
Background
Continuous ambulatory peritoneal dialysis (CAPD) has been used as an alternative to haemodialysis for patients with end‐stage renal disease (ESRD) since 1976 (Popovich 1976). It may be used as the first choice dialysis therapy and in a number of countries including the United Kingdom a significant proportion of the ESRD population are treated by this modality in preference to chronic haemodialysis. A peritoneal dialysis (PD) exchange involves draining CAPD dialysate solution into and out of the peritoneal cavity using a permanently implanted PD catheter and a transfer or connection system. Peritonitis is the most common serious complication of PD and is the leading cause of technique failure requiring a switch to haemodialysis (CANUSA 1996). Undertaking a PD exchange is one of the key points during CAPD when micro‐organisms can be inadvertently transferred via the lumen of the peritoneal catheter into the peritoneal space (intraluminal route) causing peritonitis. The CAPD transfer system used may therefore have an important bearing on both the incidence of peritonitis and CAPD technique failure.
There are three main types of catheter connecting systems. In the "standard" or straight connecting system the catheter is connected to the dialysate solution bag using a straight piece of tubing and a "spike" or a luer lock device. At each exchange a new connection is made and the bag is drained. The empty bag is rolled up and remains attached until the next exchange when the process is repeated. The second type of transfer system is the Y‐set in which the patient disconnects (disconnect system) from the bags between exchanges. When a new exchange is due a Y‐connection with one limb connected to an empty bag and one to a bag containing fresh dialysate is used (Buoncristiani 1980; Buoncristiani 1993; Buoncristiani 1996). During an exchange the peritoneal dialysate is first drained from the peritoneal cavity into the empty bag. Before introducing the fresh dialysis solution into the peritoneal cavity the Y‐connecting system is first flushed with fresh dialysis solution and drained into the drainage bag. This allows any bacteria to be flushed into the spent fluid. The fresh fluid is then introduced into the peritoneal cavity and the Y‐connector is disconnected from the CAPD catheter. The early Y‐set technique, in addition, flushed the system with a disinfectant, a hypochlorite, during each exchange (Buoncristiani 1983). The third system, the double bag (twin bag) system, is a further development of the Y‐set disconnect systems. With this system the connection with the fresh dialysis solution bag is already made and the patient has to perform one less connection procedure (Balteau 1991; Bazzato 1980). It has been suggested that use of the Y‐set transfer or double bag systems will lead to a reduced frequency of CAPD peritonitis (Buoncristiani 1983) and some (Golper 1996; Port 1992) observational studies have indicated an association between use of the standard connect system and a significantly increased risk of peritonitis. At present a considerable proportion of CAPD patients, continue to use the standard system. Other techniques, such as the Ultraviolet Germicidal System (Churchill 1991; Nolph 1985), in‐line bacteriological filters (Churchill 1991; Slingeneyer 1983) and heat sterilisation (Churchill 1991; Durand 1995) have been developed and used in an attempt to reduce peritonitis rates; they were not considered as part of this review.
Objectives
To evaluate the evidence that supports the use of the Y‐set (and modifications) and double bag systems for the prevention of peritonitis in PD patients.
Methods
Criteria for considering studies for this review
Types of studies
All randomised controlled trials (RCTs) and quasi‐RCTs investigating the effect of the Y‐set or double‐bag systems to prevent PD peritonitis.
Types of participants
Adult and paediatric patients undergoing PD treatment.
Types of interventions
-
Double bag (experimental group) and/or Y‐set (experimental group) versus standard CAPD exchange systems (control group).
-
Double bag (experimental group) versus Y‐set (control group).
We included studies where disinfectant had or had not been used to flush and/or to be retained in the elements of the Y‐set system. For either the Y‐set or double bag systems the sequence of the exchanges could vary:
-
drain/flush/fill or
-
flush/drain/fill.
Types of outcome measures
-
Number of patients experiencing peritonitis and peritonitis rate (number of episodes per patient months on treatment) (primary outcome)
-
Number of patients experiencing exit‐site/tunnel infections and exit‐site/tunnel infection rate (number of episodes per patient months on treatment)
-
Number of patients in whom CAPD catheters were removed
-
Number of patients switching to haemodialysis
-
Number of patients hospitalised and average number of days of hospitalisation
-
Measures of quality of life and patient preference
-
All‐cause mortality
Search methods for identification of studies
We searched the Cochrane Renal Group's Specialised Register on 23 October 2013 through contact with the Trials' Search Co‐ordinator using search terms relevant to this review.
The Cochrane Renal Group’s Specialised Register contains studies identified from several sources:
-
Monthly searches of the Cochrane Central Register of Controlled Trials (CENTRAL)
-
Weekly searches of MEDLINE OVID SP
-
Handsearching of renal‐related journals and the proceedings of major renal conferences
-
Searching of the current year of EMBASE OVID SP
-
Weekly current awareness alerts for selected renal journals
-
Searches of the International Clinical Trials Register (ICTRP) Search Portal and ClinicalTrials.gov.
Details of these strategies, as well as a list of handsearched journals, conference proceedings and current awareness alerts, are available in the Specialised Register section of information about the Cochrane Renal Group. See Appendix 1 for search terms used in strategies for this review.
For search strategies used in our previous review please see Daly 2000.
Data collection and analysis
The full‐text of each relevant identified study were assessed independently by two assessors for subject relevance and methodological quality using a standard form. Details concerning method of random allocation, blinding, description of withdrawals and dropouts, and whether data were analysed on an intention to treat basis were noted.
Data abstraction
Data on predetermined outcome measures were abstracted from included studies using a standard form, by a single assessor and data‐entry on REVIEW MANAGER 4.2.3 was performed. All data were independently checked from the original papers by a second investigator. A third investigator performed data abstraction and requested additional unpublished or unclear information from the authors of all included trials at the time of updating the present review.
Study quality
The quality of included studies was assessed by two independent investigators without blinding to authorship or journal using the checklist developed by the Cochrane Renal Group. Discrepancies were resolved by discussion with a third investigator. The quality items assessed were allocation concealment, blinding of investigators, participants and outcome assessors, intention‐to‐treat analysis, and the completeness to follow‐up.
Quality checklist
Allocation concealment
-
Adequate (A): Randomisation method described that would not allow investigator/participant to know or influence intervention group before eligible participant entered in the study
-
Unclear (B): Randomisation stated but no information on method used is available
-
Inadequate (C): Method of randomisation used such as alternate medical record numbers or unsealed envelopes; any information in the study that indicated that investigators or participants could influence intervention group
Blinding
-
Blinding of investigators: Yes/no/not stated
-
Blinding of participants: Yes/no/not stated
-
Blinding of outcome assessor: Yes/no/not stated
-
Blinding of data analysis: Yes/no/not stated
The above are considered not blinded if the treatment group can be identified in > 20% of participants because of the side effects of treatment.
Intention‐to‐treat analysis
-
Yes: Specifically reported by authors that intention‐to‐treat analysis was undertaken and this was confirmed on study assessment.
-
Yes: not specifically stated but confirmed on study assessment
-
No: Not reported and lack of intention‐to‐treat analysis confirmed on study assessment (Patients who were randomised were not included in the analysis because they did not receive the study intervention, they withdrew from the study or were not included because of protocol violation).
-
No: Stated, but not confirmed upon study assessment
-
Not stated
Completeness to follow‐up
Percent of participants excluded or lost to follow‐up.
Statistical assessment
Data from individual trials were analysed using the risk ratio (RR) measure and its 95% confidence intervals (CI) for dichotomous outcomes and the mean difference (MD) and its 95% CI for continuous outcomes. Subgroup analysis was planned to explore potential sources of variability in observed treatment effect where possible (paediatric versus adult population, diabetic versus non diabetic, trial quality items, timing of peritonitis or other outcome). Heterogeneity of treatment effects between studies was formally tested using the Q (heterogeneity χ²) and the I² statistics. When appropriate, summary estimators of treatment effects were calculated using a random effects model with RR and its 95% CI. Where data on the number of subjects with events (e.g. number of subjects with one or more episodes of peritonitis) were available, the RR was calculated as the ratio of the incidence of the event (one or more episodes) in the experimental treatment group over the incidence in the control group. Where data on the number of episodes were available, then the RR was calculated as the ratio of the rate of the outcome (e.g. the peritonitis rate) in the experimental treatment group (given by number of episodes of the outcome over total patient months on PD) over the rate in the control group. It was also planned that if sufficient RCTs were identified, an attempt would be made to assess for publication bias using a funnel plot (Egger 1997).
Results
Description of studies
We identified twelve RCTs comparing double bag, Y‐set and standard transfer systems with a total of 991 randomised patients (Cheng 1994; Churchill 1989; Dryden 1992; Harris 1996; Kiernan 1995; Li 1996; Li 1999; Lindholm 1988; Maiorca 1983; Monteon 1998; Owen 1992; Rottembourg 1987). One study (Monteon 1998) compared all three system types, seven compared only Y‐set with standard systems (Cheng 1994; Churchill 1989; Li 1996; Lindholm 1988; Maiorca 1983; Owen 1992; Rottembourg 1987), one compared only double bag with standard systems (Dryden 1992) and three compared only double bag with Y‐set systems (Harris 1996; Kiernan 1995; Li 1999). Some of the trials' reports did not include data relevant to all this review's outcomes or reported these data in a manner that precluded inclusion in the meta‐analyses (e.g. standard deviations were not available). Of all authors which were contacted for clarification and requests of additional information, only one replied (Harris 1996). As a consequence, some of the meta‐analyses include fewer studies and fewer patients than might be expected. The publication of the studies were fairly evenly spread over a 16 year period from 1983 (Maiorca 1983) to 1999 (Li 1999).
A search performed in January 2005 identified three potential studies which were not relevant to this review (Huang 2001; Li 2002; Ong 2003). In this 2013 updated review, we excluded six new trials (Bailie 1990; Burkart 1990; de Fijter 1994; Lee 1997; Tan 2005; Wong 2006); one is awaiting classification (Correa‐Rotter 1997a).
Risk of bias in included studies
Details of the methodological quality of the included RCTs are outlined in the description of included studies. Only four studies described the method of randomisation. One described a probably secure method of random allocation (Monteon 1998, central list of random numbers with order of allocation sent to participating centres in sealed envelopes). Two did not completely describe their method of random allocation (Churchill 1989, "variable blocking factor, by the coordinating centre", no other details given; Maiorca 1983, "closed envelope system", no other details given). Cheng 1994 described an unclear method of random allocation (random number tables but "investigators were not blind to what treatment previously recruited patients received", i.e. the next treatment could be anticipated). All twelve had parallel designs. Only two (Cheng 1994; Lindholm 1988) failed to describe withdrawals and dropouts. None of the study reports clearly stated that data were analysed on an intention to treat basis, although for only four (Harris 1996; Li 1999; Maiorca 1983; Monteon 1998) was it clear that analysis was not on an intention‐to‐treat basis. Blinding or masking was infrequently described and none of the studies stated specifically that patients, healthcare providers or outcome assessors were masked/blinded to the intervention.
Effects of interventions
Y‐set versus standard spike systems
The use of the Y‐set compared to standard spike systems was associated with a significantly lower risk of peritonitis (Analysis 1.1 (7 trials, 485 patients): RR 0.64, 95% CI 0.53 to 0.77), peritonitis rate (Analysis 1.2 (8 trials, 7417 patient‐months): RR 0.49, 95% CI 0.40 to 0.61) but no difference in exit‐site/tunnel infection (Analysis 1.3 (3 trials, 226 patients): RR 1.02, 95% CI 0.72 to 1.46) and rate (Analysis 1.4 (2 trials, 2841 patient‐months): RR 1.24, 95% CI 0.91 to 1.69).
A number of different definitions of "technique failure" (Analysis 1.5, Analysis 1.6) reported in the studies were considered in this review including: (i) switch to haemodialysis, (ii) switch to different transfer set and (iii) no longer on allocated treatment for whatever reason. Overall, there was no significant difference in the risk of technique failure with the Y‐set compared to standard spike systems with any of these definitions. There was also no difference in the risk of catheter removal (Analysis 1.7 (1 trial, 40 patients): RR 0.33, 95% CI 0.04 to 2.94). Only a single study which compared Y‐set with standard systems reported data on all‐cause (Analysis 1.8 (1 study, 69 patients): RR 1.12, 95% CI 0.81 to 1.56) and peritonitis‐related (Analysis 1.9 (1 study, 69 patients): RR 0.61, 95% CI 0.26 to 1.44) hospitalisation, and showed no significant difference in the risk. There was also no significant difference in the risk of all‐cause mortality with the Y‐set compared to standard spike systems (Analysis 1.10 (5 trials, 355 patients): RR 1.03, 95% CI 0.48 to 2.21). Heterogeneity was not significant in any of these analyses.
Double bag versus standard systems
There was no statistically significant difference with double bag systems compared to standard systems for the risk of peritonitis (Analysis 2.1 (2 trials, 170 patients): RR 0.43, 95% CI 0.29 to 0.62), the peritonitis rate (Analysis 2.2 (2 trials, 2110 patient‐months): RR 0.31, 95% CI 0.20 to 0.47), technique failure (Analysis 2.3 (1 trial, 80 patients): RR 1.00, 95% CI 0.06 to 15.44), exit‐site/tunnel infection (Analysis 2.4 (1 trial, 80 patients): RR 0.75, 95% CI 0.18 to 3.14) and all‐cause mortality (Analysis 2.5 (1 trial, 80 patients): RR 1.00, 95% CI 0.21 to 4.66) with no significant heterogeneity in any analysis.
Y‐set or double bag systems versus standard systems
The combined analysis of Y‐set or double bag systems compared to standard systems demonstrated a significant reduction in the risk of peritonitis (Analysis 3.1 (8 trials, 626 patients): RR 0.58, 95% CI 0.49 to 0.68) and peritonitis rate (Analysis 3.2 (11 trials, 10082 patient‐months): RR 0.55, 95% CI 0.42 to 0.32) but no significant difference in the risk of exit‐site/tunnel infection (Analysis 2.3 (3 trials, 264 patients): RR 1.00, 95% CI 0.71 to 1.42) and rate (Analysis 3.4 (2 trials, 2841 patient‐months): RR 1.24, 95% CI 0.91 to 1.69), catheter removal (Analysis 3.5 (1 trial, 40 patients): RR 0.33, 95% CI 0.04 to 2.94), technique failure by various definitions (Analysis 3.6 and Analysis 3.7), the number of patients hospitalised due to any cause (Analysis 3.8 (1 trial, 69 patients): RR 1.12, 95% CI 0.81 to 1.56) or number of patients hospitalised due to peritonitis (Analysis 3.9 (1 trial, 69 patients): RR 0.61, 95% CI 0.26 to 1.44) and all‐cause mortality (Analysis 3.10 (6 trials, 435 patients): RR 1.03, 95% CI 0.52 to 2.03). There was significant heterogeneity in the analysis of peritonitis rate (heterogeneity χ² = 26.78, P = 0.003, I² = 62.7%) caused mainly by the trial of Kiernan 1995 which had a shorter follow‐up duration compared to all others.
Double bag systems versus Y‐set systems
There was no significant difference with double bag compared to Y‐set for the risk of peritonitis (Analysis 4.1 (3 trials, 292 patients): RR 0.59, 95% CI 0.35 to 1.01), peritonitis rate (Analysis 4.2 (4 trials, 4319 patients‐months): RR 0.90, 95% CI 0.49 to 1.66), exit‐site/tunnel infection rate (Analysis 4.3 (2 trials, 2319 patient‐months): RR 1.04, 95% CI 0.52 to 2.06), technique failure by various definitions (Analysis 4.4, Analysis 4.5). There was also no difference in catheter removal/replacement (Analysis 4.6 (1 trial 63 patients): RR 0.10, 95% CI 0.01 to 1.81) and all‐cause mortality (Analysis 4.7 (2 trials, 193 patients): RR 0.98 95% CI 0.25 to 3.43). The analysis of peritonitis rate showed significant heterogeneity (heterogeneity χ² = 12.24, P = 0.007, I² = 75.5%) which is imputable to the trial of Kiernan 1995. This trial had a shorter follow‐up duration compared to all others.
Quality of Life
Only two studies reported quality of life data (Harris 1996; Li 1999). Both compared a double bag with a Y‐set system. Harris 1996, using a Lickert scale, reported significantly greater "ease of use" and Li 1996, using a 6‐item questionnaire, reported significantly greater "patient acceptability" with the double bag system. It was unclear how well‐validated these instruments of assessment are in this particular setting.
Discussion
This systematic review of double bag or Y‐set versus standard transfer systems for CAPD has demonstrated that disconnect (double bag and Y‐connection) systems are superior to conventional spike (or luer lock) connect systems for the prevention of peritonitis. There was no statistically significant advantage of twin bag systems compared with Y‐systems, although the former were associated with a trend towards fewer affected patients with peritonitis (P = 0.05).
To our knowledge, the present study represents the most comprehensive systematic review of the relative benefits and harms of double bag or Y‐set systems in PD patients. Two additional reviews have now been published and relate to the use of anti‐microbial strategies (Strippoli 2004a) and other catheter‐related interventions including catheter type and surgical techniques for insertion of the PD catheter (Strippoli 2004b) used to prevent PD peritonitis.
The most likely reason for the observation that disconnect systems are superior to conventional spike systems is a reduction of inadvertent peritoneal microbial contamination during connections with Y‐set and twin bag systems as a result of the "flush before fill" manoeuvre (Bazzato 1980). Although the elimination of one connection procedure by twin bag systems should theoretically further reduce peritonitis episodes beyond that achieved by Y‐connection systems, this was unable to be demonstrated in our study. In contrast in a previous version of this review (Daly 2000) we reported a significantly lower risk of experiencing peritonitis episodes with double bag systems compared with Y‐systems (odds ratio 0.44, 95% CI 0.27 to 0.71). This apparent disparity may be partly explained by the more conservative statistical approach adopted in the present analysis (random effects model) compared with the previous (fixed effects model). In order to better assess the robustness of our statistical findings, we also additionally evaluated peritonitis rates as episodes/month (rather than just number of patients experiencing peritonitis) and again demonstrated no statistically significant differences between the two disconnect systems. Similar findings were observed for the other outcome measures evaluated, including exit‐site/tunnel infections, catheter removal, technique survival and all‐cause mortality.
These results support the recommendations of the British Renal Association (BRA) and the Caring for Australians with Renal Impairment (CARI) guidelines against the use of conventional spike connection systems. Although the International Society of Peritoneal Dialysis and K/DOQI clinical practice guidelines make no specific recommendations about connection methodology, spike and luer lock connect system usage has generally been declining in recent years. In the United Kingdom, the use of connect PD systems has decreased from 22% in 1998 to less than 1% in 2002 (Ansell 1998). A similar experience has been reported in Australia and New Zealand (Johnson 2003).
The strength of this investigation is that it represents a comprehensive systematic review based on a previous publication of a detailed protocol, rigid inclusion criteria for RCTs only, and a comprehensive multi‐database literature search. Data extraction, data analysis and method quality assessment were performed by two independent investigators, and consistency was checked with an additional reviewer. Furthermore, infectious outcomes were separately examined in terms of rates per patient‐month (Table 1; Table 2) and the number of patients affected in order to maximise statistical power and to verify the robustness of statistical analyses.
| Study | Double bag systems | Y‐set systems | Standard systems |
| ‐‐ | 30.8 | 21.5 | |
| ‐‐ | 21.53 | 9.93 | |
| ‐‐ | 17.0 | 11.4 | |
| ‐‐ | 22.0 | 8.0 | |
| ‐‐ | 33.0 | 11.3 | |
| ‐‐ | 13.4 | 4.9 | |
| ‐‐ | 23.0 | 12.3 | |
| 25.0 | ‐‐ | 9.7 | |
| 24.8 | 11.8 | 6.1 | |
| 46.4 | 14.0 | ‐‐ | |
| 33.9 | 11.7 | ‐‐ | |
| 33.5 | 29.4 | ‐‐ |
| Study | Double bag systems | Y‐set systems | Standard systems |
| ‐‐ | 14.9 | 16.4 | |
| ‐‐ | 26.4 | 21.6 | |
| 28.3 | 12.5 | ‐‐ | |
| 17.4 | 16.0 | ‐‐ |
The main weakness of this study was the relative paucity of quality RCTs identified. The vast majority of studies evaluated failed to specify whether randomisation allocation was concealed, outcome assessors were blinded or data were analysed on an intention to treat basis. Many studies were small and often short in duration, so that the possibility of a type 2 statistical error for some of the less frequently observed outcome measures (e.g. catheter loss) could not be excluded. Moreover, evidence of trial heterogeneity was found in some analyses of peritonitis rates (twin bag versus Y‐set), which most likely reflected significant inter‐trial variation in durations of follow‐up. These issues reduce the strength of the conclusions that have been drawn in this review.

Comparison 1 Y‐set systems versus standard systems, Outcome 1 Number of patients with peritonitis.

Comparison 1 Y‐set systems versus standard systems, Outcome 2 Peritonitis rate.

Comparison 1 Y‐set systems versus standard systems, Outcome 3 Number of patients with exit site/tunnel infection.

Comparison 1 Y‐set systems versus standard systems, Outcome 4 Exit‐site/tunnel infection rate.

Comparison 1 Y‐set systems versus standard systems, Outcome 5 Number of patients switched to HD.

Comparison 1 Y‐set systems versus standard systems, Outcome 6 Number of patients no longer on allocated treatment for whatever reason.
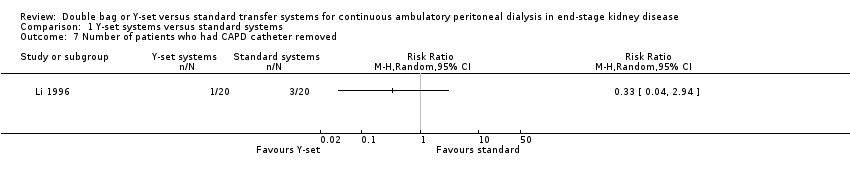
Comparison 1 Y‐set systems versus standard systems, Outcome 7 Number of patients who had CAPD catheter removed.
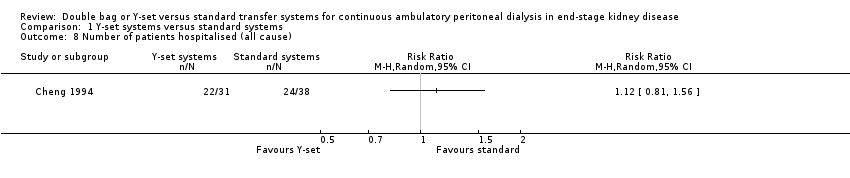
Comparison 1 Y‐set systems versus standard systems, Outcome 8 Number of patients hospitalised (all cause).

Comparison 1 Y‐set systems versus standard systems, Outcome 9 Number of patients hospitalised (peritonitis).

Comparison 1 Y‐set systems versus standard systems, Outcome 10 All‐cause mortality.

Comparison 2 Double bag systems versus standard systems, Outcome 1 Number of patients with peritonitis.

Comparison 2 Double bag systems versus standard systems, Outcome 2 Peritonitis rate.

Comparison 2 Double bag systems versus standard systems, Outcome 3 Number of patients switched to HD.

Comparison 2 Double bag systems versus standard systems, Outcome 4 Number of patients with exit site infection.
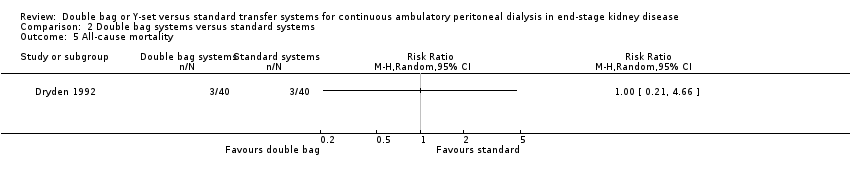
Comparison 2 Double bag systems versus standard systems, Outcome 5 All‐cause mortality.

Comparison 3 Y‐set or double bag systems versus standard systems, Outcome 1 Number of patients with peritonitis.

Comparison 3 Y‐set or double bag systems versus standard systems, Outcome 2 Peritonitis rate.

Comparison 3 Y‐set or double bag systems versus standard systems, Outcome 3 Number of patients with exit‐site/tunnel infection.

Comparison 3 Y‐set or double bag systems versus standard systems, Outcome 4 Exit‐site/tunnel infection rate.

Comparison 3 Y‐set or double bag systems versus standard systems, Outcome 5 Number of patients who had CAPD catheter removed.

Comparison 3 Y‐set or double bag systems versus standard systems, Outcome 6 Number of patients no longer on allocated treatment for whatever reason.

Comparison 3 Y‐set or double bag systems versus standard systems, Outcome 7 Number of patients switched to HD.
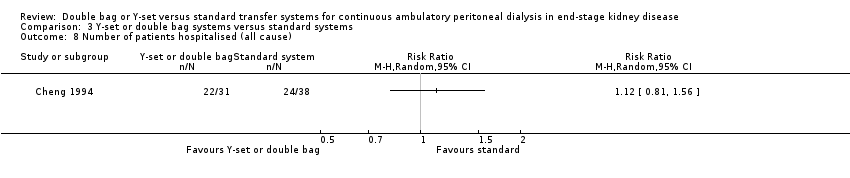
Comparison 3 Y‐set or double bag systems versus standard systems, Outcome 8 Number of patients hospitalised (all cause).

Comparison 3 Y‐set or double bag systems versus standard systems, Outcome 9 Number of patients hospitalised (peritonitis).

Comparison 3 Y‐set or double bag systems versus standard systems, Outcome 10 All‐cause mortality.

Comparison 4 Double bag systems versus Y‐set systems, Outcome 1 Number of patients with peritonitis.

Comparison 4 Double bag systems versus Y‐set systems, Outcome 2 Peritonitis rate.

Comparison 4 Double bag systems versus Y‐set systems, Outcome 3 Exit‐site/tunnel infection rate.

Comparison 4 Double bag systems versus Y‐set systems, Outcome 4 Number of patients switched to HD.

Comparison 4 Double bag systems versus Y‐set systems, Outcome 5 Number of patients no longer on allocated treatment for whatever reason.

Comparison 4 Double bag systems versus Y‐set systems, Outcome 6 Number of patients who had CAPD catheter removed.

Comparison 4 Double bag systems versus Y‐set systems, Outcome 7 All‐cause mortality.
| Study | Double bag systems | Y‐set systems | Standard systems |
| ‐‐ | 30.8 | 21.5 | |
| ‐‐ | 21.53 | 9.93 | |
| ‐‐ | 17.0 | 11.4 | |
| ‐‐ | 22.0 | 8.0 | |
| ‐‐ | 33.0 | 11.3 | |
| ‐‐ | 13.4 | 4.9 | |
| ‐‐ | 23.0 | 12.3 | |
| 25.0 | ‐‐ | 9.7 | |
| 24.8 | 11.8 | 6.1 | |
| 46.4 | 14.0 | ‐‐ | |
| 33.9 | 11.7 | ‐‐ | |
| 33.5 | 29.4 | ‐‐ |
| Study | Double bag systems | Y‐set systems | Standard systems |
| ‐‐ | 14.9 | 16.4 | |
| ‐‐ | 26.4 | 21.6 | |
| 28.3 | 12.5 | ‐‐ | |
| 17.4 | 16.0 | ‐‐ |
| Outcome or subgroup title | No. of studies | No. of participants | Statistical method | Effect size |
| 1 Number of patients with peritonitis Show forest plot | 7 | 485 | Risk Ratio (M‐H, Random, 95% CI) | 0.64 [0.53, 0.77] |
| 2 Peritonitis rate Show forest plot | 8 | 7417 | Risk Ratio (M‐H, Random, 95% CI) | 0.49 [0.40, 0.61] |
| 3 Number of patients with exit site/tunnel infection Show forest plot | 2 | 184 | Risk Ratio (M‐H, Random, 95% CI) | 1.02 [0.72, 1.46] |
| 4 Exit‐site/tunnel infection rate Show forest plot | 2 | 2841 | Risk Ratio (M‐H, Random, 95% CI) | 1.24 [0.91, 1.69] |
| 5 Number of patients switched to HD Show forest plot | 2 | 184 | Risk Ratio (M‐H, Random, 95% CI) | 0.45 [0.19, 1.05] |
| 6 Number of patients no longer on allocated treatment for whatever reason Show forest plot | 2 | 184 | Risk Ratio (M‐H, Random, 95% CI) | 1.05 [0.76, 1.46] |
| 7 Number of patients who had CAPD catheter removed Show forest plot | 1 | Risk Ratio (M‐H, Random, 95% CI) | Totals not selected | |
| 8 Number of patients hospitalised (all cause) Show forest plot | 1 | Risk Ratio (M‐H, Random, 95% CI) | Totals not selected | |
| 9 Number of patients hospitalised (peritonitis) Show forest plot | 1 | Risk Ratio (M‐H, Random, 95% CI) | Totals not selected | |
| 10 All‐cause mortality Show forest plot | 5 | 355 | Risk Ratio (M‐H, Random, 95% CI) | 1.03 [0.48, 2.21] |
| Outcome or subgroup title | No. of studies | No. of participants | Statistical method | Effect size |
| 1 Number of patients with peritonitis Show forest plot | 2 | 170 | Risk Ratio (M‐H, Random, 95% CI) | 0.43 [0.29, 0.62] |
| 2 Peritonitis rate Show forest plot | 2 | 2110 | Risk Ratio (M‐H, Random, 95% CI) | 0.31 [0.20, 0.47] |
| 3 Number of patients switched to HD Show forest plot | 1 | Risk Ratio (M‐H, Random, 95% CI) | Totals not selected | |
| 4 Number of patients with exit site infection Show forest plot | 1 | Risk Ratio (M‐H, Random, 95% CI) | Totals not selected | |
| 5 All‐cause mortality Show forest plot | 1 | Risk Ratio (M‐H, Random, 95% CI) | Totals not selected | |
| Outcome or subgroup title | No. of studies | No. of participants | Statistical method | Effect size |
| 1 Number of patients with peritonitis Show forest plot | 8 | 626 | Risk Ratio (M‐H, Random, 95% CI) | 0.58 [0.49, 0.68] |
| 2 Peritonitis rate Show forest plot | 11 | 10082 | Risk Ratio (M‐H, Random, 95% CI) | 0.55 [0.42, 0.73] |
| 3 Number of patients with exit‐site/tunnel infection Show forest plot | 3 | 264 | Risk Ratio (M‐H, Random, 95% CI) | 1.00 [0.71, 1.42] |
| 4 Exit‐site/tunnel infection rate Show forest plot | 2 | 2841 | Risk Ratio (M‐H, Random, 95% CI) | 1.24 [0.91, 1.69] |
| 5 Number of patients who had CAPD catheter removed Show forest plot | 1 | Risk Ratio (M‐H, Random, 95% CI) | Totals not selected | |
| 6 Number of patients no longer on allocated treatment for whatever reason Show forest plot | 2 | 184 | Risk Ratio (M‐H, Random, 95% CI) | 1.05 [0.76, 1.46] |
| 7 Number of patients switched to HD Show forest plot | 3 | 264 | Risk Ratio (M‐H, Random, 95% CI) | 0.48 [0.21, 1.09] |
| 8 Number of patients hospitalised (all cause) Show forest plot | 1 | Risk Ratio (M‐H, Random, 95% CI) | Totals not selected | |
| 9 Number of patients hospitalised (peritonitis) Show forest plot | 1 | Risk Ratio (M‐H, Random, 95% CI) | Totals not selected | |
| 10 All‐cause mortality Show forest plot | 6 | 435 | Risk Ratio (M‐H, Random, 95% CI) | 1.03 [0.52, 2.03] |
| Outcome or subgroup title | No. of studies | No. of participants | Statistical method | Effect size |
| 1 Number of patients with peritonitis Show forest plot | 3 | 292 | Risk Ratio (M‐H, Random, 95% CI) | 0.59 [0.35, 1.01] |
| 2 Peritonitis rate Show forest plot | 4 | 4319 | Risk Ratio (M‐H, Random, 95% CI) | 0.90 [0.49, 1.66] |
| 3 Exit‐site/tunnel infection rate Show forest plot | 3 | 2665 | Risk Ratio (M‐H, Random, 95% CI) | 1.04 [0.52, 2.06] |
| 4 Number of patients switched to HD Show forest plot | 2 | 145 | Risk Ratio (M‐H, Random, 95% CI) | 0.30 [0.03, 3.10] |
| 5 Number of patients no longer on allocated treatment for whatever reason Show forest plot | 1 | Risk Ratio (M‐H, Random, 95% CI) | Totals not selected | |
| 6 Number of patients who had CAPD catheter removed Show forest plot | 1 | Risk Ratio (M‐H, Random, 95% CI) | Totals not selected | |
| 7 All‐cause mortality Show forest plot | 2 | 193 | Risk Ratio (M‐H, Random, 95% CI) | 0.92 [0.25, 3.43] |