Scolaris Content Display Scolaris Content Display

Comparison 1 Lidocane versus other local anaesthetic, Outcome 1 Transient Neurologic Symptoms.
Figuras y tablas -
Analysis 1.1

Comparison 1 Lidocane versus other local anaesthetic, Outcome 1 Transient Neurologic Symptoms.

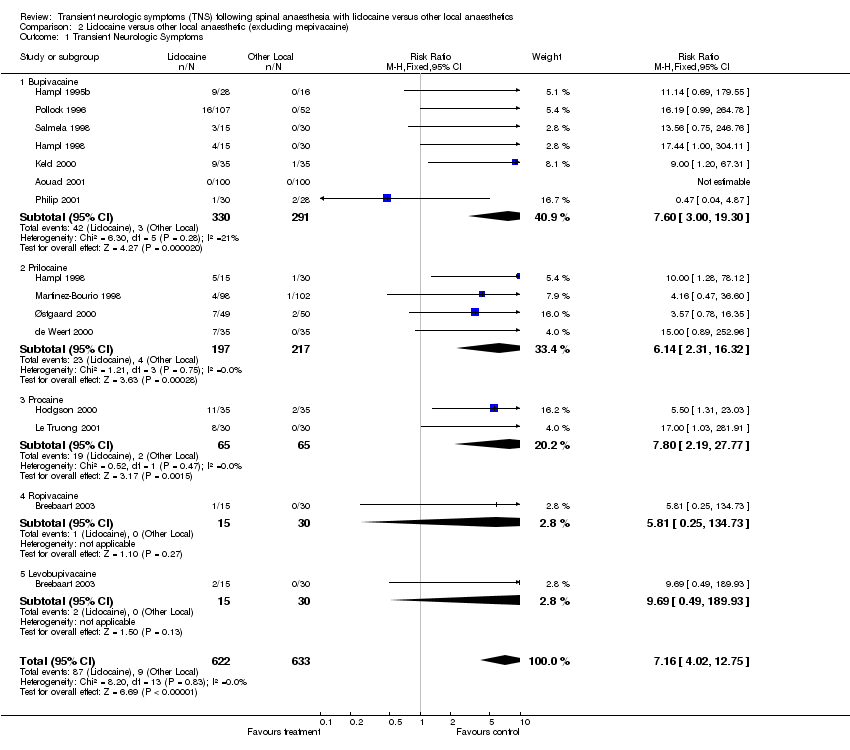
Comparison 2 Lidocaine versus other local anaesthetic (excluding mepivacaine), Outcome 1 Transient Neurologic Symptoms.
Figuras y tablas -
Analysis 2.1

Comparison 2 Lidocaine versus other local anaesthetic (excluding mepivacaine), Outcome 1 Transient Neurologic Symptoms.

Table 1. Patients who developed TNS after intrathecal lidocaine

Study ID

TNS #/N (%)

Pain score (0‐10)

TNS duration

Therapy

Aouad 2001

0 (0)

de Weert 2000

7/35 (20)

Day 1 mean VPS = 5.3 (range 2‐8)

Maximum duration 3 days

Not described

Hampl 1995b

9/28 (32)

Not tallied

Maximum duration 4 days

Not described

Hampl 1998

9/30 (30)

Mean maximum VAS = 3.75

Maximum duration 2 days

Not described

Hodgson 2000

11/35 (31)

Mean VPS = 5

Mean duration 2 days

Not described

Keld 2000

9/35 (26)

Mean VPS = 3.5 (range 2‐8)

Maximum duration 4 days

Not described

Liguori 1998

6/27 (22)

Not tallied

Maximum duration 5 days

NSAIDs

Le Truong

8/30 (27)

Not tallied

Unspecified

Not described

Martinez‐Bourio 1998

4/98 (4)

Not tallied

Maximum duration 10 days

NSAIDs

Østgaard 2000

7/49 (14)

VPS range 5‐9.5

Maximum duration 3 days

Not described

Philip 2001

1/30 (3)

Maximum VAS = 3

Maximum duration 2 days

Not described

Pollock 1996

16/107 (15)

Mean VPS = 6.2 (range 1‐9)

Maximum duration 4 days

NSAIDs and opioids

Salazar 2001

1/40 (3)

Maximum VAS = 9‐10

Maximum duration 1 day

NSAIDs

Salmela 1998

6/30 (20)

Moderate pain

Maximum duration 1 day

NSAIDs and opioids

Breebaart 2003

3/30 (10)

Not tallied

1 day

Not described

Key to abbreviations:

VPS: Verbal Pain Scale

VAS: Visual Analogue Scale

Figuras y tablas -
Table 1. Patients who developed TNS after intrathecal lidocaine
Comparison 1. Lidocane versus other local anaesthetic

Outcome or subgroup title

No. of studies

No. of participants

Statistical method

Effect size

1 Transient Neurologic Symptoms Show forest plot

15

1437

Risk Ratio (M‐H, Random, 95% CI)

4.47 [2.17, 9.20]

1.1 Bupivacaine

7

621

Risk Ratio (M‐H, Random, 95% CI)

6.65 [2.05, 21.56]

1.2 Mepivacaine

3

182

Risk Ratio (M‐H, Random, 95% CI)

1.05 [0.15, 7.45]

1.3 Prilocaine

4

414

Risk Ratio (M‐H, Random, 95% CI)

5.62 [2.07, 15.23]

1.4 Procaine

2

130

Risk Ratio (M‐H, Random, 95% CI)

6.94 [1.94, 24.86]

1.5 Ropivacaine

1

45

Risk Ratio (M‐H, Random, 95% CI)

5.81 [0.25, 134.73]

1.6 Levobupivacine

1

45

Risk Ratio (M‐H, Random, 95% CI)

9.69 [0.49, 189.93]

Figuras y tablas -
Comparison 1. Lidocane versus other local anaesthetic
Comparison 2. Lidocaine versus other local anaesthetic (excluding mepivacaine)

Outcome or subgroup title

No. of studies

No. of participants

Statistical method

Effect size

1 Transient Neurologic Symptoms Show forest plot

13

1255

Risk Ratio (M‐H, Fixed, 95% CI)

7.16 [4.02, 12.75]

1.1 Bupivacaine

7

621

Risk Ratio (M‐H, Fixed, 95% CI)

7.60 [3.00, 19.30]

1.2 Prilocaine

4

414

Risk Ratio (M‐H, Fixed, 95% CI)

6.14 [2.31, 16.32]

1.3 Procaine

2

130

Risk Ratio (M‐H, Fixed, 95% CI)

7.8 [2.19, 27.77]

1.4 Ropivacaine

1

45

Risk Ratio (M‐H, Fixed, 95% CI)

5.81 [0.25, 134.73]

1.5 Levobupivacaine

1

45

Risk Ratio (M‐H, Fixed, 95% CI)

9.69 [0.49, 189.93]

Figuras y tablas -
Comparison 2. Lidocaine versus other local anaesthetic (excluding mepivacaine)