Optimisation du volume de fluides périopératoire après fracture du fémur proximal
Résumé scientifique
Contexte
La fracture du fémur proximal (FFP) est une urgence orthopédique courante qui affecte principalement les personnes âgées à haut risque de complications. Les méthodes de monitorage avancé pour l'administration de fluides pendant le traitement pour les FFP sont disponibles, mais leur rôle dans la réduction du risque de complications n'est pas clair.
Objectifs
Comparer l'innocuité et l'efficacité des méthodes suivantes de l'optimisation de l'administration de fluides en périopératoire chez des patients adultes subissant une prise en charge chirurgicale d'une fracture de la hanche : le monitorage hémodynamique invasif, tels que le Doppler transoesophagien et l'analyse du contour de l'onde de pouls ; un protocole basé sur des paramètres classiques tels que la pression artérielle, la diurèse et la pression veineuse centrale ; et la prise en charge habituelle.
Les comparaisons des types de fluides (par ex. les cristalloïdes vs. colloïdes) et d'autres méthodes d'optimisation de l'apport en oxygène, tels que l'administration de produits sanguins et le traitement pharmacologique par inotropes et médicaments vasoactifs, font l'objet d'autres revues.
Stratégie de recherche documentaire
Nous avons effectué des recherches dans le registre Cochrane des essais contrôlés (CENTRAL, 2015, numéro 9 ) ; MEDLINE (octobre 2012 à septembre 2015) ; et EMBASE (octobre 2012 à septembre 2015), sans restriction de langue. Nous avons effectué des recherches ascendantes et descendantes de références bibliographiques sur les essais identifiés. Nous avons consulté ClinicalTrials.gov et de l'Organisation mondiale de la Santé (OMS), International Clinical Trials Registry Platform pour obtenir des essais non publiés. Ceci est une version mise à jour d'une revue publiée pour la première fois en 2004 et mise à jour pour la première fois en 2013 puis en 2015. Les recherches originales ont été effectuées en octobre 2003 et octobre 2012.
Critères de sélection
Nous avons inclus les essais contrôlés randomisés (ECR) incluant des participants adultes subissant un traitement chirurgical pour FFP qui comparaient deux méthodes parmi le monitorage hémodynamique avancé, le protocole basé sur des paramètres classiques,ou la prise en charge habituelle, indépendamment du caractère "en aveugle" de l'étude, de la langue ou du statut de publication.
Recueil et analyse des données
Deux auteurs de la revue ont évalué l'impact de l'optimisation des fluides sur des critères de jugement tels que la mortalité, la durée de séjour à l'hôpital, le temps nécessaire à être apte à la sortie, le fait que les patients soient capables de retourner à leur mode de vie précédant la fracture au bout de six mois, la mobilité à six mois et les événements indésirables à l'hôpital. Nous avons regroupé les données sous forme de risque relatif (RR) ou de différence moyenne (DM) pour les données dichotomiques et continues, respectivement, à l'aide de modèles à effets aléatoires.
Résultats principaux
Nous avons inclus dans cette revue mise à jour, cinq ECR concernant un total de 403 participants, et nous avons ajouté deux nouveaux essais identifiés au cours de la recherche de 2015. L'une de ces études présente un risque élevé de biais . Aucun essai ne mentionne tous les critères de jugement pré‐cités. Nous avons trouvé deux essais, pour lesquels les données sont en attente de classification et un essai en cours.
Trois études ont comparé le monitorage hémodynamique avancé avec un protocole basé sur des paramètres classiques ; trois comparaient le monitorage hémodynamique avancé avec la prise en charge habituelle ; et un comparait un protocole basé sur des paramètres classiques avec la prise en charge habituelle. Les méta‐analyses pour les deux comparaisons avec un monitorage hémodynamique avancé sont cohérentes avec, à la fois, une augmentation et une réduction du risque de mortalité (Mantel‐Haenszel M‐H) à effets aléatoires (RR 0,41, intervalle de confiance (IC) à 95 % de 0,14 à 1,20 ; 280 participants ; RR M‐H à effets aléatoires 0,45, IC à 95 % de 0,07 à 2,95 ; 213 participants, respectivement). L'étude comparant un protocole avec la prise en charge habituelle n'a trouvé aucune différence entre les groupes pour ce critère de jugement.
Trois études comparant le monitorage hémodynamique avancé avec la prise en charge habituelle, ont rapporté des données pour la durée de séjour et le temps nécessaire pour être médicalement prêt à sortir de l'hôpital. Il n'y avait aucune différence statistiquement significative entre les groupes pour ces critères de jugement dans les deux études que nous avons été en mesure de combiner (DM IV fixe 0,63, IC à 95 % de ‐1,70 à 2,96) ; DM IV fixe 0,01, IC à 95 % de ‐1,74 à 1,71, respectivement) et aucune différence statistiquement significative dans la troisième étude. Une étude a rapporté une réduction du temps nécessaire pour être prêt à sortir de l'hôpital, en comparant le monitorage hémodynamique avancé avec un protocole, et en comparant un protocole avec une prise en charge habituelle.
Le nombre de participants avec une ou plusieurs complications n'a montré aucune différence statistiquement significative pour les deux comparaisons avec un monitorage hémodynamique avancé (RR M‐H à effets aléatoires 0,83, IC à 95 % de 0,59 à 1,17 ; 280 participants ; RR M‐H à effets aléatoires 0,72, IC à 95 % de 0,40 à 1,31 ; 173 participants, respectivement), et ni même pour la comparaison du protocole avec la prise en charge habituelle.
Une seule étude a rapporté le nombre de participants capables de reprendre le mode de vie antérieur à la fracture, après la sortie de l'hôpital, avec une absence de différence statistiquement significative entre les groupes.
Il y avait peu d'études portant sur un petit nombre de participants, et en utilisant la méthode GRADE (Grades of Recommendation, Assessment, Development and Evaluation), nous avons estimé que la qualité des preuves était faible. Une étude présentant un risque de biais élevé a été incluse, mais suivant la méthode GRADE, la qualité des preuves a été réévaluée à très faible.
Conclusions des auteurs
Cinq études, incluant un total de 403 participants, n'ont généré aucune preuve concernant le bénéfice des stratégies d'optimisation des fluides lors d'une chirurgie pour FFP. Des études supplémentaires avec une puissance suffisante, et visant à vérifier certains de ces résultats sont en cours.
PICO
Résumé simplifié
Optimisation du volume de fluides chez les patients souffrant d'une fracture de la hanche
Contexte
Les fractures de la hanche sont fréquentes chez les personnes âgées, qui ont souvent des problèmes médicaux les exposant à un risque majoré de complications après le traitement de leur fracture. Le traitement implique habituellement une chirurgie pour traiter la fracture. L'administration d'un volume trop faible ou trop important de fluides augmente le risque de complications. L'utilisation de nombreuses approches a été décrite pour déterminer le volume de fluides dont le patient a besoin dans cette situation. L'efficacité relative de ces méthodes est inconnue. Dans cette revue Cochrane, nous avons examiné les études concernant les effets des différentes méthodes de maximalisation du résultat de l'administration de fluides, chez les hommes et femmes adultes subissant une chirurgie pour tout type de fracture du col du fémur.
Caractéristiques de l'étude
Les preuves sont à jour à la date de septembre 2015. Nous avons trouvé cinq études totalisant 403 participants, et comparant deux ou trois méthodes d'optimisation de l'administration de fluides. Ces méthodes comprenaient la "prise en charge habituelle" (dans laquelle sont utilisées les modifications de paramètres de base tels que la fréquence cardiaque, afin de déterminer le volume de fluides à donner), les protocoles basés sur des "paramètres classiques" (dans lesquels sont utilisées des modifications de paramètres de base lors de l'administration de fluides mais selon un protocole standardisé) et "un monitorage hémodynamique avancé" (dans lequel est utilisé un système de monitorage invasif, tel qu'un cathétérisme artériel, afin de déterminer le volume de fluides à donner).
Résultats principaux
Ces essais n'ont généré aucune preuve suggérant que l'utilisation d'une méthode plutôt qu'une autre réduisait l'incidence de complications, y compris la mortalité. Nous n'avons trouvé aucune preuve, lorsque les résultats des études ont été combinés, que n'importe quelle méthode réduisait la durée de séjour à l'hôpital ou le temps nécessaire pour que les patients soient considérés comme médicalement apte à sortir de l'hôpital. Les résultats n'ont également montré aucune différence en termes de capacité à reprendre une vie similaire à celle précédant la fracture, après la sortie de l'hôpital.
Qualité des preuves
Nous n'avons trouvé que peu d'études pertinentes, incluant un nombre limité de participants. Le temps s'étant écoulé entre la première étude, publiée en 1985, et la dernière, publiée en 2014, suggère que la pratique médicale concernant la prise en charge de la fracture du col du fémur peut avoir varié entre ces études. Nous avons considéré qu'une étude présentait un risque élevé de biais, et utilisant l'approche GRADE, nous avons évalué la qualité des données comme faible à très faible. Les résultats de cette revue sont applicables uniquement pour les pays dans lesquels ces études ont été réalisées, sachant que la "prise en charge habituelle" peut être différente dans d'autres pays.
Conclusion
Les preuves actuelles sont insuffisantes pour déterminer quelle méthode de maximalisation des effets de l'administration de fluides est préférable chez les patients subissant une chirurgie pour une fracture de la hanche.
Authors' conclusions
Summary of findings
| Advanced haemodynamic monitoring compared with protocol using standard measures such as CVP for proximal femoral fracture | ||||||
| Patient or population: patients with proximal femoral fracture | ||||||
| Outcomes | Illustrative comparative risks* (95% CI) | Relative effect | Number of participants | Quality of the evidence | Comments | |
| Assumed risk | Corresponding risk | |||||
| Protocol using standard measures such as CVP | Advanced haemodynamic monitoring | |||||
| All‐cause mortality | Study population | RR 0.41 | 280 | ⊕⊝⊝⊝ | ||
| 142 per 1000 | 58 per 1000 | |||||
| Moderate | ||||||
| Total length of hospital stay | Not estimabled | 203 | ⊕⊕⊝⊝ | Data reported as median (range) in Bartha 2013 and as mean (95% confidence interval) in Venn 2002 | ||
| Medically fit for discharge | Mean medically fit for discharge in the intervention groups was | 90 | ⊕⊕⊝⊝ | |||
| Return to pre‐fracture accommodation/return to pre‐fracture mobility | Not estimable | ‐ | Not reported | |||
| Adverse outcomes ‐ cardiopulmonary | Study population | Not estimable | 0 | |||
| Moderate | ||||||
| Adverse outcomes ‐ neurological | Not estimable | 0 | ||||
| Adverse outcomes ‐ all | Study population | RR 0.90 | 280 | ⊕⊝⊝⊝ | ||
| 319 per 1000 | 287 per 1000 | |||||
| Moderate | ||||||
| *The basis for the assumed risk (e.g. median control group risk across studies) is provided in footnotes. The corresponding risk (and its 95% confidence interval) is based on the assumed risk in the comparison group and the relative effect of the intervention (and its 95% CI) | ||||||
| GRADE Working Group grades of evidence | ||||||
| aConcerns about randomization process in Schultz 1985; high risk of selection bias eData from 1 study only. Downgraded 2 levels | ||||||
| Advanced haemodynamic monitoring compared with usual care for perioperative fluid optimization | ||||||
| Patient or population: patients with perioperative fluid optimization | ||||||
| Outcomes | Illustrative comparative risks* (95% CI) | Relative effect | Number of participants | Quality of the evidence | Comments | |
| Assumed risk | Corresponding risk | |||||
| Usual care | Advanced haemodynamic monitoring | |||||
| All‐cause mortality | Study population | RR 0.45 | 213 | ⊕⊕⊝⊝ | ||
| 89 per 1000 | 40 per 1000 | |||||
| Moderate | ||||||
| Total length of hospital stay | Mean total length of hospital stay in the control groups was | Mean total length of hospital stay in the intervention groups was | 175 | ⊕⊕⊝⊝ | ||
| Medically fit for discharge | Mean medically fit for discharge in the control groups was | Mean medically fit for discharge in the intervention groups was | 175 | ⊕⊕⊝⊝ | ||
| Return to pre‐fracture accommodation/return to pre‐fracture mobility | Study population | Not estimable | 114 | ⊕⊕⊝⊝ | ||
| 397 per 1000 | 0 per 1000 | |||||
| Moderate | ||||||
| Adverse outcomes ‐ cardiopulmonary | Study population | Not estimable | 0 | |||
| Moderate | ||||||
| Adverse outcomes ‐ neurological | Study population | RR 1.10 | 173 | ⊕⊕⊝⊝ | ||
| 152 per 1000 | 170 per 1000 | |||||
| Moderate | ||||||
| Adverse outcomes ‐ all | Study population | RR 0.78 | 173 | ⊕⊕⊝⊝ | ||
| 554 per 1000 | 432 per 1000 | |||||
| Moderate | ||||||
| *The basis for the assumed risk (e.g. median control group risk across studies) is provided in footnotes. The corresponding risk (and its 95% confidence interval) is based on the assumed risk in the comparison group and the relative effect of the intervention (and its 95% CI) | ||||||
| GRADE Working Group grades of evidence | ||||||
| aConfidence intervals cross no effect and are consistent with increased as well as decreased risk. Downgraded 1 level | ||||||
| Protocol using standard measures such as CVP compared with usual care for perioperative fluid optimization | ||||||
| Patient or population: patients with perioperative fluid optimization | ||||||
| Outcomes | Illustrative comparative risks* (95% CI) | Relative effect | Number of participants | Quality of the evidence | Comments | |
| Assumed risk | Corresponding risk | |||||
| Usual care | Protocol using standard measures such as CVP | |||||
| All‐cause mortality | Study population | RR 2.81 | 60 | ⊕⊕⊝⊝ | ||
| 69 per 1000 | 194 per 1000 | |||||
| Moderate | ||||||
| Total length of hospital stay | Mean total length of hospital stay in the control groups was | Mean total length of hospital stay in the intervention groups was | 60 | ⊕⊕⊝⊝ | ||
| Medically fit for discharge | Mean medically fit for discharge in the intervention groups was | 60 | ⊕⊕⊕⊝ | |||
| Return to pre‐fracture accommodation/return to pre‐fracture mobility | Not estimable | ‐ | Not reported | |||
| Adverse outcomes ‐ cardiopulmonary | Study population | Not estimable | 0 | Not reported | ||
| Moderate | ||||||
| Adverse outcomes ‐ neurological | Study population | RR 0.94 | 60 | ⊕⊕⊝⊝ | ||
| 34 per 1000 | 32 per 1000 | |||||
| Moderate | ||||||
| Adverse outcomes ‐ all | Study population | RR 0.53 | 60 | ⊕⊕⊝⊝ | ||
| 483 per 1000 | 256 per 1000 | |||||
| Moderate | ||||||
| *The basis for the assumed risk (e.g. median control group risk across studies) is provided in footnotes. The corresponding risk (and its 95% confidence interval) is based on the assumed risk in the comparison group and the relative effect of the intervention (and its 95% CI) | ||||||
| GRADE Working Group grades of evidence | ||||||
| aBased on 1 study with a small number of events. Wide confidence intervals consistent with increased as well as decreased risk. Downgraded by 1 level | ||||||
Background
Description of the condition
Proximal femoral fractures (PFFs), or hip fractures, are fractures of the femur immediately distal to the articular surface of the hip joint to about 5 cm below the lesser trochanter. They can be subdivided into intracapsular and extracapsular fractures. Intracapsular (also termed transcervical or subcapital) fractures occur proximal to the trochanteric line, and extracapsular (also termed pertrochanteric, subtrochanteric, trochanteric or intertrochanteric) fractures occur distal to the trochanteric line, up to 5 cm below the lower border of the lesser trochanter.
These fractures occur most commonly in elderly people with osteoporosis after a simple mechanical fall. Approximately 1.5 million hip fractures are reported per year worldwide, and the number of hip fractures is projected to increase to 4.5 million by the year 2050 (Gullberg 1997; Sterling 2011). Incidence varies by country, from about 50 to 500 per 100,000, and is about two times higher among females than males, although this difference varies with race (Kanis 2012; Kannus 1996).
PFF is one of the most common orthopaedic emergencies, and most cases are managed by early surgical fixation to reduce complications from prolonged immobility associated with conservative treatment. Limited evidence has been obtained from randomized controlled trials (RCTs) to inform this practice, but other types of studies have shown increased risk of death when surgery is delayed; it would be difficult to conduct ethically sound trials that compare operative with conservative treatment (Bottle 2006; Handoll 2008). Generally, medically fit patients should undergo surgery within 24 hours.
Undisplaced intracapsular fractures usually are treated by internal fixation to preserve the femoral head, with screws or pins, with or without plates, fixed to the femur. Displaced intracapsular fractures may be reduced and internally fixated or may undergo replacement arthroplasty. Extracapsular fractures may be fixed with a screw passed up the femoral neck to the head,then attached to a plate on the side of the femur, or an intramedullary nail may be used with a side screw passed up into the femoral head.
Description of the intervention
Age‐related co‐morbidities and dehydration in people presenting with PFF put them at increased risk for peritraumatic and perioperative complications. Providing adequate fluid resuscitation is important in minimizing this risk. The adequacy of fluid therapy may be determined by simple, readily available clinical measures, such as tissue turgor, heart rate, blood pressure, urine output and central venous pressure (CVP). However, these are non‐specific and poorly sensitive measures of fluid optimization (Marik 2008). Growing evidence suggests that predicting responsiveness to fluid therapy is more important (Funk 2009). The aim is to use goal‐directed fluid therapy to optimize cardiac output, to avoid overloading the cardiovascular system and precipitating heart failure. This approach, along with adequate haemoglobin and inspired oxygen levels, optimizes delivery of oxygen to tissues and organs and may improve outcomes (Green 2010).
One way to assess fluid responsiveness is to use a protocol that combines several simple measures to determine the effect of a standardized fluid bolus and to decide whether additional fluid will provide benefit for the patient. Another method is to use advanced haemodynamic monitoring techniques to detect cardiovascular changes that occur with incremental fluid boluses, to predict responsiveness to increased fluid. Although some of these advanced techniques are in their infancy, several have become established in clinical practice. These approaches can be split into static measures of cardiac preload (load placed on the heart by blood returning to it) and dynamic measures of interactions between heart and lung.
Static measures aim to determine cardiac preload but fail to estimate response to fluids in about one‐half of patients, thus rendering them exposed to the hazards of unnecessary fluid therapy (Eyre 2010). Despite this, many of these measures are in clinical use. Right ventricular end‐diastolic volume can be measured by a fast‐response thermistor pulmonary artery catheter or by cardiac scintigraphy. Transoesophageal echocardiography (TOE) can measure left ventricular (LV) end‐diastolic area, which correlates well with left ventricular end‐diastolic volume ‐ a measure of LV preload. Transpulmonary thermodilution measured by a commercially available device (PiCCO; Pulsion Medical Systems, Feldkirchen, Germany) assesses global end‐diastolic volume (GEDV), the largest volume of blood contained within the four heart chambers, and intrathoracic blood volume; both measurements have been validated as indicators of cardiac preload (Bendjelid 2010; Muller 2008). Pulmonary artery (Swan‐Ganz) catheters are inserted into the pulmonary artery to measure pulmonary artery occlusion pressure (PAOP); however, their use has been reduced over recent years, as PAOP has been shown to be a poor marker of left ventricular end‐diastolic volume, and therefore of cardiac preload and cardiac output (Maus 2008).
Dynamic measures are generally superior to static measures in predicting fluid responsiveness, although this has been demonstrated mainly in sedated ventilated patients (Eyre 2010). Various technologies use these measures, which include stroke volume variation (SVV), systolic pressure variation (SPV), pulse pressure variation (PPV), aortic blood velocity (ABV), superior vena cava collapsibility index (SVCCI) and inferior vena cava distensibility index (IVCDI). The commercially available LiDCO device (Vigileo/FloTrac, Irvine, California, USA) analyses the waveform of the arterial blood pressure pulse for SVV, SPV and PPV; transthoracic echocardiography (TTE) measures IVCDI; oesophageal Doppler measures SVV and ABV; TOE can measure SVCCI and ABV; and PiCCO can measure SVV. LiDCO and TTE can be used with patients who are awake when undergoing regional anaesthesia, and with those who are unconscious when undergoing general anaesthesia. Oesophageal Doppler and TOE can be used only with patients who are undergoing general anaesthesia.
How the intervention might work
Major surgery and critical illness are associated with increased oxygen demand due to a systemic inflammatory response, the stress response and increased metabolic activity. Inadequate fluid resuscitation and cardiopulmonary disease may reduce the supply of adequate tissue blood flow and delivery of oxygen. This may result in cellular dysfunction, organ damage, organ failure and ultimately death. Fluid overload is also harmful, potentially causing cardiac performance to fall as the result of extreme right shift on the Starling myocardial performance curve, respiratory failure due to fluid accumulation in the lungs, gastric dysmotility and poor wound healing. Growing evidence indicates that standardized methods to optimize fluid and oxygen delivery to tissues may decrease morbidity and mortality in a variety of clinical settings, particularly among high‐risk surgical patients and those with critical illness or sepsis (Lees 2009).
Why it is important to do this review
Protocols, or advanced methods of managing fluid therapy, may improve various outcomes in the large number of people who suffer from PFF each year. However, these methods may cause harm and may incur financial cost. A systematic evaluation of the current evidence is needed to assist clinicians who attempt to optimize fluid volume status in people undergoing surgery for PFF. We selected our included outcomes according to their frequency in studies of PFF and their usefulness in clinical decision making (Liem 2012).
This is the second update of a Cochrane review originally published in 2004 (Price 2004) and first updated in 2013 (Brammar 2013). New monitoring techniques and revised methods have been introduced within Cochrane; therefore, we have re‐run the searches, including extra search terms, and have used different methods to assess study quality.
Objectives
To compare the safety and effectiveness of the following methods of perioperative fluid optimization in adult participants undergoing surgical repair of hip fracture: advanced invasive haemodynamic monitoring, such as transoesophageal Doppler and pulse contour analysis; a protocol using standard measures, such as blood pressure, urine output and central venous pressure; and usual care.
Comparisons of fluid types (e.g. crystalloid vs colloid) and other methods of optimizing oxygen delivery, such as blood product therapies and pharmacological treatment with inotropes and vasoactive drugs, are considered in other reviews.
Methods
Criteria for considering studies for this review
Types of studies
We included only randomized controlled trials (RCTs). If we could have obtained adequate method and results data, we would have considered for inclusion cluster‐randomized trials, quasi‐randomized trials (e.g. alternation) and trials in which treatment allocation was inadequately concealed, as well as unpublished studies and studies published only in abstract form. We did not expect to identify any cross‐over trials for this condition.
Types of participants
We included studies on adults who underwent acute surgical treatment of any type for PFF while under regional or general anaesthesia.
Types of interventions
We included studies that compared use of any two of the following.
-
Advanced invasive haemodynamic monitoring, such as transoesophageal Doppler and pulse contour analysis.
-
A protocol using standard measures, such as blood pressure, urine output and central venous pressure.
-
Usual care.
We undertook reviews of three different comparisons.
-
Advanced haemodynamic monitoring versus a protocol using standard measures.
-
Advanced haemodynamic monitoring versus usual care.
-
A protocol using standard measures versus usual care.
Types of outcome measures
Primary outcomes
-
All‐cause mortality (within 30 days if reported, otherwise as reported in the trial).
-
Length of hospital stay.
-
-
Total length of hospital stay.
-
Time to medical fitness for discharge.
-
-
Return of participant to pre‐fracture category of accommodation at six months.
-
Return to pre‐fracture mobility at six months.
Secondary outcomes
-
Major adverse events in hospital.
-
-
Iatrogenic (related to intervention, e.g. pneumothorax, haemothorax, upper limb thrombosis, line sepsis, local haematoma).
-
Cardiopulmonary (e.g. myocardial infarction, cardiac or respiratory failure, thromboembolic event).
-
Neurological (e.g. delirium, postoperative cognitive dysfunction, cerebrovascular accident).
-
We also recorded any complications reported in the study, including minor events.
Outcomes did not form part of the study eligibility assessment. We included in the review studies that met design, participant and intervention criteria, even if they did not report relevant outcomes.
Search methods for identification of studies
Electronic searches
We searched the Cochrane Central Register of Controlled Trials (CENTRAL; 2015, Issue 9; see Appendix 1); MEDLINE via Ovid SP (October 2012 to September 2015; see Appendix 2); and EMBASE via Ovid SP (October 2012 to September 2015; see Appendix 3) for relevant randomized trials published in any language. When searching MEDLINE, we combined our topic‐specific keywords with the Cochrane highly sensitive search strategy for identifying RCTs (Higgins 2011). We modified this filter for use in EMBASE and used specific keywords to identify potential studies (see Appendix 1; Appendix 2; Appendix 3).
We performed original searches for the review in October 2003 (Price 2004) and October 2012 (Brammar 2013).
We searched for ongoing clinical trials and unpublished studies on the following Internet sites (July 2015).
-
ClinicalTrials.gov trials registry (see Appendix 4).
-
World Health Organization International Clinical Trials Registry Platform (see Appendix 5).
Searching other resources
We undertook backward and forward citation searching for key review articles identified through the initial searches (see Appendix 6). We used Google Scholar for forward citation searching. We read the reference lists of included articles for backward citations.
We contacted investigators to ask for details of ongoing studies and to request unpublished data needed for our analyses.
Data collection and analysis
Selection of studies
Two review authors, Sharon R. Lewis (SRL) and Andrew R. Butler (ARB), independently screened all titles and abstracts identified by the searches for potentially eligible trials. We removed studies that were very unlikely to be eligible. If no abstract was available but the title was possibly relevant, we obtained the full text of the article. The same review authors then independently examined the full text of all remaining articles and made a joint decision at that time regarding inclusion.
Data extraction and management
Review authors SRL and ARB independently extracted and collected data using Covidence software (Covidence) based on the previously used data extraction form (see Appendix 7). No blinding of the study author, the institution or the publication source of the studies was performed. We resolved disagreements by discussion and consensus, and finally with involvement of a third review author (AFS).
Assessment of risk of bias in included studies
Review authors independently assessed risk of bias using the Cochrane 'Risk of bias' tool (Higgins 2011a). We assessed the following six domains: sequence generation, allocation concealment, blinding of participants and personnel, blinding of outcome assessment, incomplete outcome data and selective outcome reporting.
We considered blinding and incomplete outcome data separately for each outcome. Blinding of participants was of particular importance for patient‐reported outcomes such as mobility. Blinding of assessors was particularly important for outcomes such as cognitive function that may be prone to detection bias.
Measures of treatment effect
For dichotomous outcomes (e.g. mortality, adverse outcomes), we entered numbers of events and total number within each randomization group into RevMan 5.3 (RevMan 5.3) and calculated risk ratios (RRs) with 95% confidence intervals (CIs) to express effect size. If data were presented in other forms, such as hazard or odds ratios, and if we were unable to obtain the required tabular data from study authors, we planned to enter these and to use the generic inverse variance option in RevMan 5.3. For continuous measures, such as length of stay, we calculated weighted mean differences when means and standard deviations were available. We calculated standard deviations from 95% CIs using the methods described in Higgins 2011 (Section 7.7.3.2).
Unit of analysis issues
In studies in which participants were randomly assigned to multiple intervention groups, we performed each pair‐wise comparison separately. We did not combine multiple intervention groups in the same analysis.
Dealing with missing data
We attempted to contact the first author or the contact person for each trial with missing data before making a decision about trial eligibility.
Assessment of heterogeneity
Identified trials may not have been carried out according to common protocols, thus introducing differences in participant groups, clinical settings, concomitant care, etc. Important potential sources of heterogeneity include participant characteristics, differences in control or intervention protocols and duration of perioperative fluid optimization.
We described heterogeneity between studies on the basis of participant group, setting and type of intervention. We assessed this statistically when data allowed, using the Chi2 test and the I2 statistic. We investigated important heterogeneity (Chi2 result with a P value < 0.1 and I2 statistic > 50%), when possible, by conducting subgroup analyses and performing meta‐regression.
Assessment of reporting biases
Reporting bias may occur within studies, with certain outcomes not reported. When a report or the original protocol suggested that data on an outcome were collected but were not reported in the paper, we would have contacted study authors to request the data.
If an adequate number of trials had been identified for inclusion, we would have constructed funnel plots and examined them visually to assess the presence of publication bias; we would have used Egger’s test to look for asymmetry.
Data synthesis
We attempted meta‐analysis for outcomes for which we had comparable effect measures from more than one study and when measures of heterogeneity indicated that pooling of results was appropriate. A value of I2 statistic > 80% would argue against presentation of an overall estimate. When we had identified sufficient studies to allow combination of results, differences between studies related to duration and methods of fluid optimization and participant characteristics were likely to suggest that random‐effects models would be the most suitable choice. We used Mantel‐Haenszel models when possible for dichotomous outcomes.
Subgroup analysis and investigation of heterogeneity
If data were sufficient, we investigated the following subgroups, which may account for heterogeneity between studies.
-
Duration of monitoring and protocol use.
-
Timing of outcome measurement. If the timing of outcome measures varied between studies, we analysed the outcome only in a subgroup analysis.
We assessed any differences in effect size between subgroups in RevMan by using I2 statistical estimates (Higgins 2011).
Sensitivity analysis
When possible, we performed the following sensitivity analyses.
-
Re‐analysis excluding studies with a high risk of bias.
-
Re‐analysis excluding unpublished studies.
'Summary of findings' table
We used the principles of the GRADE (Grades of Recommendation, Assessment, Development and Evaluation Working Group) (Guyatt 2008) to assess the quality of the body of evidence associated with the specific outcomes in our review.
-
All‐cause mortality.
-
Length of hospital stay and time to medical fitness for discharge.
-
Return to pre‐fracture category of accommodation at six months.
-
Return to pre‐fracture mobility at six months.
-
Major adverse events in hospital.
We constructed a 'Summary of findings' table by using GRADE software (gradepro.org). The GRADE approach appraises the quality of a body of evidence according to the extent to which one can be confident that an estimate of effect or association reflects the item assessed. The quality of a body of evidence is based on within‐study risk of bias (methodological quality), directness of the evidence, heterogeneity of the data, precision of effect estimates and risk of publication bias.
Results
Description of studies
Results of the search
See Characteristics of included studies; Characteristics of ongoing studies; Characteristics of studies awaiting classification.
We identified 406 records through electronic database searches conducted for the 2015 update. Upon completion of these searches, we included two new studies (Bartha 2013; Moppett 2014) in addition to the three studies included in the previous review update (Brammar 2013); (Schultz 1985; Sinclair 1997; Venn 2002).
We did not identify additional studies for backward citation searching during the 2015 search process. We completed backward citation searching and forward citation searching on the two new studies but identified no additional studies. We searched clinical trials databases using the strategies presented in Appendix 4 and Appendix 5.
See search flow results in Figure 1.

Study flow diagram. Updated search October 2012 to January 2015.
Included studies
We included five studies with 403 randomized participants.
Three trials were conducted in the UK (Moppett 2014; Sinclair 1997; Venn 2002), one in the USA (Schultz 1985) and one in Sweden (Bartha 2013). All provided full‐text publications in the English language. The interval between the first trial and the last trial was approximately 29 years.
All trials included solely adult participants who were undergoing surgery for PFF. Ages of participants ranged from 40 to 102 years. Participants in Bartha 2013 and Moppett 2014 underwent spinal anaesthesia, and those in Sinclair 1997 and Venn 2002 underwent general anaesthesia. Schultz 1985 did not explicitly state the type of anaesthesia, although from the year of this study, we assumed that the clinicians used general anaesthesia. Surgical techniques used to treat PFF included dynamic hip screw, arthroplasty and AO cannulated screws.
Each trial performed different comparisons: goal‐directed haemodynamic treatment (with LiDCO monitor) versus routine fluid treatment based on a treatment algorithm (Bartha 2013); LiDCO monitor‐guided fluid therapy versus standard care (Moppett 2014); Swan‐Ganz monitoring versus CVP monitoring (Schultz 1985); oesophageal Doppler monitoring versus conventional fluid management (Sinclair 1997); and oesophageal Doppler monitoring versus CVP monitoring versus conventional fluid management (Venn 2002). These trial comparisons correspond to the following comparisons in our review: advanced haemodynamic monitoring (LiDCO, Swan‐Ganz, oesophageal Doppler); a protocol using standard measures (CVP monitoring, routine fluid treatment with treatment algorithm); and usual care (standard care, conventional fluid management). Three trials studied only intraoperative fluid optimization (Moppett 2014; Sinclair 1997; Venn 2002); one trial studied intraoperative and postoperative fluid optimization (Bartha 2013); and one trial studied preoperative, intraoperative and postoperative fluid optimization (Schultz 1985).
All trials investigated mortality, although at different time points: at 30 days (Bartha 2013; Moppett 2014), undefined "postoperative" (Schultz 1985) and in‐hospital (Sinclair 1997; Venn 2002). We excluded in‐hospital deaths that occurred more than 30 days postoperatively (Sinclair 1997). On the basis of total hospital stays and ranges reported in Venn 2002, we assumed that all deaths and adverse events in this trial occurred within 30 days of operation. Four trials compared total length of hospital stay (Bartha 2013; Moppett 2014; Sinclair 1997; Venn 2002) and three compared time until medically fit for discharge (Moppett 2014; Sinclair 1997; Venn 2002). One study reported return to pre‐fracture accommodation at six months (Moppett 2014). Across studies, a variety of adverse events were reported, including:
-
cardiovascular (Bartha 2013; Moppett 2014);
-
respiratory (Bartha 2013; Moppett 2014);
-
cerebrovascular (Bartha 2013; Venn 2002);
-
acute kidney failure (Bartha 2013; Moppett 2014);
-
gastrointestinal bleeding (Bartha 2013; Moppett 2014);
-
confusion/delirium (Bartha 2013; Moppett 2014);
-
sepsis (Bartha 2013);
-
deep vein thrombosis (Bartha 2013);
-
wound infection (Bartha 2013; Schultz 1985; Venn 2002);
-
decubitus (Bartha 2013; Schultz 1985);
-
wound haematoma (Bartha 2013);
-
abdominal complications (Moppett 2014);
-
skin complications (Moppett 2014);
-
pneumonia (Schultz 1985);
-
dislocated prosthesis (Schultz 1985);
-
pneumonitis (Schultz 1985);
-
deep haemorrhage (Venn 2002);
-
haematemesis (Venn 2002);
-
chest infection (Venn 2002);
-
urinary tract infection (Venn 2002);
-
cellulitis (Venn 2002);
-
pancreatitis (Venn 2002);
-
pulmonary embolus (Venn 2002);
-
myocardial infarction (Venn 2002);
-
cardiac failure (Venn 2002);
-
rapid atrial fibrillation (Venn 2002);
-
hypotension (Venn 2002);
-
impaired renal function (Venn 2002); and
-
pseudo‐obstruction (Venn 2002).
No studies reported return to pre‐fracture mobility at six months.
Ongoing studies
We identified one ongoing study from clinical trial registers (NCT02382185). This study compares a non‐invasive cardiac monitoring device with usual care and plans to enrol 250 participants. See Characteristics of ongoing studies.
Studies awaiting classification
Two studies are awaiting classification. One study includes a mixed high‐risk surgical population; we have been unable to contact the study authors to request adequate data about participants within the orthopaedic group who were treated for PFF (Sandham 2003). One study appears to be eligible but provided only an abstract with insufficient data. We have not been able to make contact with study authors and await publication of the full report (Vanakas 2012). See Characteristics of studies awaiting classification.
Excluded studies
We excluded 28 full‐text articles identified for further assessment in the 2015 update (see Figure 1). These articles provided the wrong intervention, included the wrong study population or were not RCTs. We have described in the Characteristics of excluded studies table three RCTs that were excluded in the 2015 update because of incorrect intervention or participant group, along with eight RCTs that were excluded in previous versions of this review.
Risk of bias in included studies
We have presented the various bias domains in the ’Risk of bias’ graph and in a ’Risk of bias’ summary figure. We evaluated risk of bias on the basis of major sources of bias (domains), as described above. For a more detailed description of individual trial qualities, see Characteristics of included studies (see Figure 2 and Figure 3).

Risk of bias graph: review authors' judgements about each risk of bias item presented as percentages across all included studies.
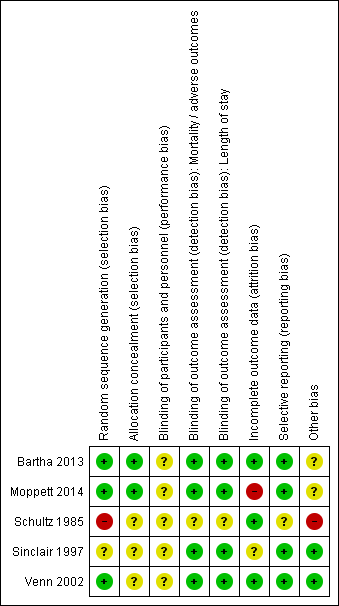
Risk of bias summary: review authors' judgements about each risk of bias item for each included study.
Allocation
Three studies adequately reported methods used for random sequence generation (Bartha 2013; Moppett 2014; Venn 2002), and two studies inadequately reported these methods (Schultz 1985; Sinclair 1997). We found baseline differences in Schultz 1985, which suggested that the randomization process may not have been adequate. Therefore, we judged this study to be at a high risk of bias. Bartha 2013 and Moppett 2014 adequately accounted for allocation concealment with the use of external allocation methods, but this information was not reported in Schultz 1985, Sinclair 1997 or Venn 2002.
Blinding
Defining adequate blinding in trials of fluid optimization was challenging. Given the different monitoring techniques described, it was not possible to effectively blind the anaesthetist/clinician. Three trials addressed this by ensuring that the anaesthetist was blinded to measurements from the Doppler and LiDCO monitors in the control groups (Bartha 2013; Moppett 2014; Sinclair 1997); however, anaesthetists remained aware of group allocation, and we were unclear about whether this may have affected their performance. Therefore, we judged all trials to be at unclear risk of performance bias.
Three studies had made adequate attempts to blind nursing personnel and/or those collecting outcome data to reduce risk of detection bias (Moppett 2014; Sinclair 1997; Venn 2002). Although data on the LiDCO monitor were coded, personnel collecting relevant outcome data for the review outcomes were not blinded in Bartha 2013, and we judged this study to be at a high risk of detection bias. Venn 2002 reported no details of data collection.
Incomplete outcome data
Two trials reported complete follow‐up for mortality, morbidity, adverse events and length of stay (Sinclair 1997; Venn 2002). One trial provided no information about exclusions due to deviations from protocol (Schultz 1985) but reported no participants lost to follow‐up. One study (Moppett 2014) reported a high number of losses (12%), and although study authors provided explanations, we considered this number of losses to have a potential influence on effect estimates. Bartha 2013 explained losses similarly but described fewer losses.Both Bartha 2013 and Venn 2002 performed intention‐to‐treat (ITT) analysis on lost data.
Selective reporting
Both Bartha 2013 and Moppett 2014 were registered with clinical trials registers, and we were able to compare protocols against published study reports. Moppett 2014 had also published a protocol in an open access journal (Wiles 2011). Bartha 2013 reported all outcomes relevant to this review, and we judged this study to be at low risk of bias; however, some long‐term outcomes on health‐related quality of life were reported in an interim publication but not in the full study publication. Similarly, we found that Moppett 2014 reported the outcomes relevant to this review, although study authors did not report data on cost of care nor on changes in the way the heart and blood vessels work with spinal anaesthesia. We judged both of these studies as having low risk of bias.
The remaining three trials were not registered, and we were unable to source any published protocols for them. Two of these trials reported all expected outcomes in their Methods section (Sinclair 1997; Venn 2002). One trial provided inadequate information about expected outcomes; therefore, we assessed the risk of selective reporting as unclear (Schultz 1985).
Some of our analyses were subject to limitations because length of stay data were published in graphical form without adequate corresponding numerical data. One trial did not provide details on length of follow‐up in terms of mortality but provided sufficient data for analysis (Sinclair 1997); data regarding morbidity and adverse events were adequate in all studies.
Other potential sources of bias
Three studies received funding that appeared to be independent and unlikely to influence the results (Bartha 2013; Moppett 2014; Sinclair 1997). Four trials reported sample size calculations (Bartha 2013; Moppett 2014; Sinclair 1997; Venn 2002). One trial was stopped early because of difficulty in recruiting participants (Bartha 2013). Trials were too few to permit construction of funnel plots to facilitate assessment of publication bias, or to allow performance of Egger's test for asymmetry.
Analyses of the benefits of fluid optimization in this group of participants were limited by differences in study design. Three trials involved intraoperative optimization (Moppett 2014; Sinclair 1997; Venn 2002). One involved both intraoperative and postoperative optimization (Bartha 2013), and one involved preoperative, intraoperative and postoperative optimization (Schultz 1985). We noted differences between trials in outcome definitions, in time points for mortality and length of stay reporting and in types of adverse events reported. In addition, all trials involved relatively few participants.
Effects of interventions
See: Summary of findings for the main comparison Advanced haemodynamic monitoring compared with protocol using standard measures such as CVP for proximal femoral fracture; Summary of findings 2 Advanced haemodynamic monitoring compared with usual care for perioperative fluid optimization; Summary of findings 3 Protocol using standard measures such as CVP compared with usual care for perioperative fluid optimization
See also summary of findings Table for the main comparison; summary of findings Table 2; summary of findings Table 3.
Comparison 1. Advanced haemodynamic monitoring versus protocol using standard measures
All‐cause mortality
Three trials reported mortality (Bartha 2013; Schultz 1985; Venn 2002). For one study, the follow‐up period was unclear but was reported as "postoperative" (Schultz 1985). This trial showed a significant reduction in mortality (risk ratio (RR) 0.1, 95% confidence interval (CI) 0.01 to 0.74; 70 participants); however, we had serious concerns about its quality. In Venn 2002, the time frame for death was described as within hospital and results were consistent with both increased and decreased risk of mortality in the intervention group (RR 0.52, 95% CI 0.14 to 1.88; 61 participants). In Bartha 2013, the time frame for death was within 30 days, and again results were consistent with both increased and decreased risk of mortality in the intervention group (RR Mantel‐Haenszel (M‐H) random‐effects 0.76, 95% CI 0.18 to 3.28; 149 participants). See Analysis 1.1 for pooled data that showed no statistically significant differences between groups (RR M‐H random‐effects 0.41, 95% CI 0.14 to 1.20; 280 participants). Using GRADE (Grades of Recommendation, Assessment, Development and Evaluation Working Group), we downgraded the quality of this evidence to very low, as few studies were identified by which we could judge precision and we noted a high level of bias in Schultz 1985 and some inconsistency in the study results (see summary of findings Table for the main comparison).
Length of hospital stay
Total length of hospital stay
Two trials reported length of hospital stay (Bartha 2013; Venn 2002) by providing data as median and interquartile range (Bartha 2013) and as mean and 95% CI (Venn 2002). Therefore, it was not possible for review authors to pool these data. Bartha 2013 (149 participants) reported median length of hospital stay as nine (range, three to 20) days in the advanced haemodynamic monitoring group and as 10 (range one to 38) days in the protocol group. Venn 2002 (61 participants) reported mean length of hospital stay as 13.5 (95% CI 10.9 to 17.5) days in the advanced haemodynamic monitoring group and as 13.3 (95% CI 10.3 to 19.2) days in the protocol group. Study authors did not report these data as statistically significant. Using GRADE, we downgraded the quality of this evidence to low, as studies were few and both studies reported a wide range and confidence interval (see summary of findings Table for the main comparison).
Time to medical fitness for discharge
Venn 2002 also reported time to medical fitness as mean 7.8 (95% CI 5.9 to 12.3) days in the advanced haemodynamic monitoring group and 10.0 (95% CI 8.1 to 12.0) days in the protocol group. Study authors reported this finding as statistically significant (P value = 0.035). No other study reported this outcome. We also downgraded the quality of this evidence to low because data were available for only one study (see summary of findings Table for the main comparison).
Return of participant to pre‐fracture category of accommodation at six months; return to pre‐fracture mobility at six months
No trial reported data for these outcomes.
Major adverse events in‐hospital
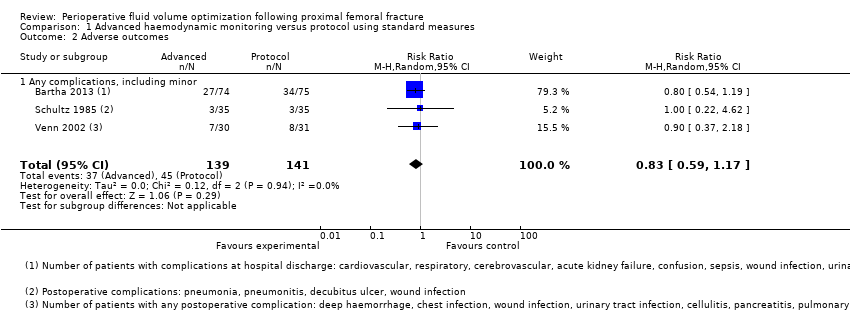
Three trials investigated complications, reporting overall morbidity and cardiovascular or neurological outcomes; however, iatrogenic events were not reported clearly by intervention/control groups (Bartha 2013; Schultz 1985; Venn 2002), and cardiovascular and neurological events were reported in such a way that it was not clear whether participants had experienced more than one event. These results are presented in Table 1. We combined the numbers of participants with one or more complication in Analysis 1.2, which shows no statistically significant differences between the advanced haemodynamic monitoring group and those using a protocol (RR M‐H random‐effects 0.83, 95% CI 0.59 to 1.17; 280 participants). Using GRADE, we downgraded the quality of this evidence to very low, as again studies were too few to allow us to judge precision, level of bias in Schultz 1985 was high and results showed some inconsistency (see summary of findings Table for the main comparison).
| Study ID | Adverse events | Advanced haemodynamic monitoring | Protocol using standard measures |
| n = 74 | n = 75 | ||
| Cardiopulmonary | Cardiovascular 5 Respiratory 5 | Cardiovascular 6 Respiratory 7 | |
| Neurological | Cerebrovascular 0 Confusion 3 | Cerebrovascular 2 Confusion 6 | |
| Other | Acute kidney failure 1 Gastrointestinal bleeding 0 Sepsis 2 Deep vein thrombosis 0 Wound infection 2 Delayed healing 0 Urinary tract infection 16 Decubitus 6 Wound haematoma 0 Other 4 | Acute kidney failure 1 Gastrointestinal bleeding 0 Sepsis 0 Deep vein thrombosis 0 Wound infection 1 Delayed healing 0 Urinary tract infection 12 Decubitus 1 Wound haematoma 1 Other 6 | |
| n = 35 | n = 35 | ||
| Other | Pneumonia 1 Wound infection 1 Pneumonitis 1 | Pneumonia 2 Decubitis ulcer 1 | |
| n = 30 | n = 31 | ||
| Cardiopulmonary | Chest infection 2 Pulmonary embolus 1 Myocardial infarction 0 Cardiac failure 0 Rapid atrial fibrillation 3 Hypotension 0 | Chest infection 3 Pulmonary embolus 0 Myocardial infarction 1 Cardiac failure 1 Rapid atrial fibrillation 1 Hypotension 0 | |
| Neurological | Cerebrovascular accident 2 | Cerebrovascular accident 1 | |
| Other | Deep haemorrhage 1 Haematemesis 0 Wound infection 0 Urinary tract infection 2 Cellulitis 0 Pancreatitis 0 Hypotension 0 Impaired renal function 0 Pseudo‐obstruction 0 | Deep haemorrhage 0 Haematemesis 0 Wound infection 0 Urinary tract infection 1 Cellulitis 1 Pancreatitis 0 Hypotension 0 Impaired renal function 0 Pseudo‐obstruction 1 |
Comparison 2. Advanced haemodynamic monitoring versus usual care
All‐cause mortality
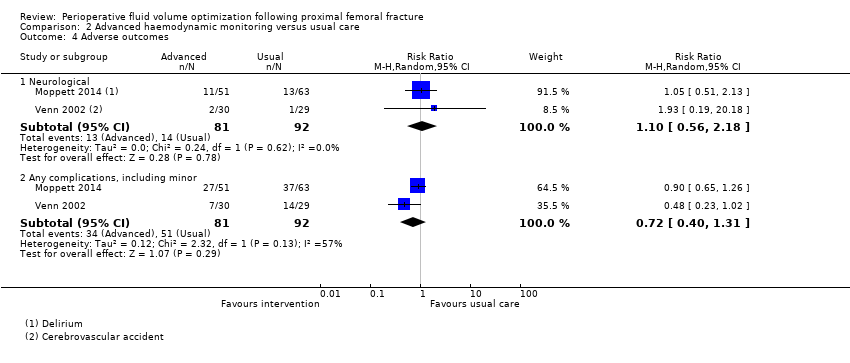
Two trials reported in‐hospital mortality (Sinclair 1997; Venn 2002), and one trial reported mortality at 30 days (Moppett 2014). We excluded two deaths from Sinclair 1997 ‐ one each from the intervention and control groups ‐ as they occurred more than 30 days postoperatively. Pooled results are consistent with both increased and decreased risks of mortality in participants who received advanced haemodynamic monitoring (RR M‐H random‐effects 0.45, 95% CI 0.07 to 2.95; 213 participants). See Analysis 2.1. Using GRADE, we downgraded the quality of this evidence to low, as studies were few (see summary of findings Table 2).
Length of hospital stay
Total length of hospital stay
Three trials investigated total length of hospital stay (Moppett 2014; Sinclair 1997; Venn 2002). In Moppett 2014 (114 participants), the total mean length of stay was 15.3 (95% CI 13.8 to 17.2) days in the intervention group and 14.2 (95% CI 12.9 to 15.8) days in the usual care group.
For Venn 2002 (59 participants), we used the RevMan calculator to determine the mean difference between groups for length of hospital stay. We found no significant difference between the advanced haemodynamic monitoring group and the usual care group (4.00 days shorter, 95% CI 11.65 days shorter to 3.65 days longer). This result differs from previously reported in Brammar 2013 (see Differences between protocol and review).
We carried out meta‐analysis on these two studies, using the RevMan calculator to calculate standard deviations. Results showed no difference between groups for overall length of hospital stay (MD IV fixed 0.63, 95% CI ‐1.70 to 2.96). See Analysis 2.2.
Sinclair 1997 (40 participants) provided data in the form of median and interquartile ranges, which were not suitable for inclusion in a meta‐analysis, but reported a reduction of eight days in total hospital stay (from 20 to 12); study authors reported a significant difference at P value < 0.05 (Mann‐Whitney U test). Using GRADE, we downgraded the quality of this evidence to low, as studies were few (see summary of findings Table 2).
Time to medical fitness for discharge
Three trials investigated time to medical fitness for discharge (Moppett 2014; Sinclair 1997; Venn 2002). Moppett 2014 (114 participants) reported no difference between groups in time to medical fitness for discharge, with a mean of 13.1 (95% CI 11.9 to 14.5) days in the intervention group and 12.2 (95% CI 11.1 to 13.5) days in the usual care group. Venn 2002 (59 participants) described a reduction in time to medical fitness for discharge in the advanced haemodynamic group (6.20 days shorter, 95% CI 11.01 to 1.39 days shorter).
We carried out meta‐analysis on these two studies, using the RevMan calculator to calculate standard deviations. Results showed no differences between groups in the number of days needed for participants to be medically fit for discharge (MD IV fixed 0.01, 95% CI ‐1.74 to 1.71). See Analysis 2.3. We noted a high level of statistical heterogeneity for this effect estimate (I2 = 86%).
Sinclair 1997 (40 participants) provided data in the form of medians and interquartile ranges, which were not suitable for inclusion in a meta‐analysis, but reported a reduction of five days in median time to fitness for discharge (from 15 days to 10 days); study authors reported a significant difference at P value < 0.05 (Mann‐Whitney U test). Using GRADE, we downgraded the quality of this evidence to low, as studies were few (see summary of findings Table 2).
Return of participant to pre‐fracture category of accommodation at six months; return to pre‐fracture mobility at six months
Moppett 2014 reported on the number of participants returning to their normal accommodation after discharge. They noted no statistically significant difference between groups, with 23 of 51 in the group monitored with LiDCO and 25 of 63 in the group receiving usual care. Using GRADE, we downgraded the quality of this evidence to low, as we identified only one study (see summary of findings Table 2).
Major adverse events in hospital
Two trials (Moppett 2014; Venn 2002) reported these. Moppett 2014 reported two types of cardiopulmonary complications, and Venn 2002 reported three types. However, these results were not reported by participant; therefore, overall denominator figures were unclear. These results, along with all reported complications, are presented in Table 2. We combined neurological outcomes in Analysis 2.4, including the number of participants having acute delirium in Moppett 2014 and the number having a cerebrovascular accident in Venn 2002. The data for the number of participants developing one or more complications was combined in Analysis 2.4, noting no statistically significant differences between those receiving advanced haemodynamic monitoring and control groups (M‐H RR random‐effects 0.72, 95% CI 0.40 to 1.31; 173 participants). Using GRADE, we downgraded the quality of this evidence to low, as studies were few (see summary of findings Table 2).
| Study ID | Adverse events | Advanced haemodynamic monitoring | Usual care |
| n = 51 | n = 63 | ||
| Cardiopulmonary | Cardiovascular 8 Respiratory 0 | Cardiovascular 6 Respiratory 0 | |
| Neurological | Acute delirium 11 | Acute delirium 13 | |
| Other | Infectious 21 Abdominal 2 Bleeding 0 Skin 0 Renal (RIFLE) 18* Other 3 | Infectious 34 Abdominal 1 Bleeding 0 Skin 0 Renal (RIFLE) 32* Other 3 | |
| n = 30 | n = 29 | ||
| Cardiopulmonary | Chest infection 2 Pulmonary embolus 1 Myocardial infarction 0 Cardiac failure 0 Rapid atrial fibrillation 3 Hypotension 0 | Chest infection 5 Pulmonary embolus 0 Myocardial infarction 0 Cardiac failure 0 Rapid atrial fibrillation 2 Hypotension 3 | |
| Neurological | Cerebrovascular accident 2 | Cerebrovascular accident 1 | |
| Other | Deep haemorrhage 1 Haematemesis 0 Wound infection 0 Urinary tract infection 2 Cellulitis 0 Pancreatitis 0 Hypotension 0 Impaired renal function 0 Pseudo‐obstruction 0 | Deep haemorrhage 1 Haematemesis 1 Wound infection 2 Urinary tract infection 3 Cellulitis 0 Pancreatitis 1 Hypotension 3 Impaired renal function 2 Pseudo‐obstruction 0 |
*RIFLE scores sum of patients at risk, injury or failure
Comparison 3. Protocol using standard measures versus usual care
All‐cause mortality
Only one trial reported on this outcome (Venn 2002) and found no difference in mortality between participants who received care according to the protocol and those given standard care (RR 2.81, 95% CI 0.61 to 12.81; 60 participants). See Table 3.
| Outcomes reported in Venn 2002: comparison 3 | Protocol ‐ CVP N = 31 | Standard care
N = 29 | Effect estimate (95% CI) | ||
|
| Mean | SD | Mean | SD | Mean difference |
| Length of hospital stay (days) | 13.3 | 12.1 | 17.5 | 13.8 | ‐4.20 (‐11.0 to 2.60) |
| Time to fitness to discharge | 10 | 5.3 | 13.9 | 6.6 | ‐3.90 (‐7.05 to ‐0.75) |
|
|
|
|
|
|
|
|
| Events |
| Events |
| MH relative risk |
| Mortality | 6 |
| 2 |
| 2.81 (0.61 to 12.81) |
| Adverse events |
|
|
|
|
|
| · Cardiopulmonary ‐ episodes | 6 |
| 7 |
| N/A |
| · Neurological ‐ participants | 1 |
| 1 |
| 0.94 (0.06 to 14.27) |
| · Any, including minor ‐ participants | 8 |
| 14 |
| 0.53 (0.26 to 1.08) |
Length of hospital stay
Total length of hospital stay and Time to medical fitness for discharge
One trial reported a reduction in time to medical fitness (3.9 days shorter, 95% CI 7.05 to 0.75 days shorter; 60 participants) but not in total hospital stay (4.2 days shorter, 95% CI 11.0 days shorter to 2.60 days longer; 60 participants) (Venn 2002; see Table 3).
Return of participant to pre‐fracture category of accommodation at six months; return to pre‐fracture mobility at six months
No trial reported data for these outcomes.
Major adverse events in hospital
Only one trial reported these, and results were consistent with increased and decreased risk in participants who had received care according to a protocol for neurological events (RR 0.94, 95% CI 0.06 to 14.27; 60 participants) and for all complications (RR 0.53, 95% CI 0.26 to 1.08; 60 participants) (Venn 2002; see Table 3).
Subgroup and sensitivity analyses
No more than three studies were available for inclusion in any of the comparison groups, and it was not possible to perform meaningful subgroup analyses.
We were particularly concerned about the high risk of bias assessed for Schultz 1985. We removed this study from Analysis 1.1 and Analysis 1.2, with no effect on the results.
We obtained no unpublished data; therefore, it was not possible to carry out this sensitivity analysis.
Discussion
Summary of main results
We included in this review five studies with 403 participants.
The conclusions of this updated review remain the same as those of both the original review and the last update (Brammar 2013; Price 2004). We found no benefit for the use of fluid optimization strategies in participants undergoing surgery for proximal femoral fracture (PFF) in terms of rates of mortality or adverse events (Brammar 2013; Price 2004). In the previous review update, one study had presented data indicating a reduction in length of stay (Venn 2002). However, with the additional studies included in this update, we found no consistent evidence for this outcome. One study reported a reduction in time to medical fitness when advanced haemodynamic monitoring was compared with a protocol using standard monitoring, and when a protocol using standard monitoring was compared with usual care (Venn 2002).
Overall completeness and applicability of evidence
We conducted a thorough search for the 2015 update, carrying out both backward and forward citation tracking of included studies. We used the search strategies delineated in a previous version of this review (Brammar 2013). All five studies included here provided evidence applicable to participants with PFF, with appropriate comparisons of fluid optimization techniques.
Applicability may extend only to those countries in which included studies were conducted, as usual care, fluid management and perioperative care of patients with femoral fracture may differ considerably between countries. Management of this patient group may also differ within countries, with different institutions adopting different protocols; with such few included studies, it could be argued that applicability of the review is limited by institution.
Quality of the evidence
We noted differences in quality among our included studies. We were concerned about the robustness of the randomization process in one study and judged this study to have a high risk of bias (Schultz 1985). We included this study in our analysis but used GRADEpro software to downgrade the overall quality of evidence for relevant outcomes accordingly. Blinding of clinicians to group allocation was an inevitable challenge in this review. However, we were unable to make a decision about whether this had introduced performance bias to our review.
Our main concern was lack of data because we identified few studies with a small number of participants for each of our comparisons. It is arguable that any mortality reduction due to the interventions described in our review would be small because of the many other factors that put participants with PFF at relatively high risk of death. If in‐hospital mortality of 6.6% is assumed (Moppett 2012), a study with 80% power to detect a 50% decrease in in‐hospital mortality (from 6.6% to 3.3%) would require randomization of 678 participants into each group (α = 0.05). Therefore, much larger studies than the ones presented in this review are likely needed to show the benefit derived from these interventions. Similarly, to detect a 50% reduction in adverse event incidence (from 15% to 7.5%) (Lawrence 2002; Roche 2005), 278 participants would be required for each group. We used GRADEpro to downgrade the quality of most outcomes to low or very low, as the review could not offer precision for our objectives.
Potential biases in the review process
To the best of our knowledge, no potential biases arose from the review process.
Agreements and disagreements with other studies or reviews
The authors of the original version of this review stated that invasive methods of fluid optimization may shorten hospital stay, but their effects on other important, patient‐centred, longer‐term outcomes are uncertain. We would agree in general with this but urge caution in interpretation of hospital stay data that are limited in scale and in some cases are not adequate for detailed analysis. We are not aware of any other good quality studies or systematic reviews investigating perioperative fluid optimization after PFF.

Study flow diagram. Updated search October 2012 to January 2015.

Risk of bias graph: review authors' judgements about each risk of bias item presented as percentages across all included studies.

Risk of bias summary: review authors' judgements about each risk of bias item for each included study.

Comparison 1 Advanced haemodynamic monitoring versus protocol using standard measures, Outcome 1 All‐cause mortality.
Comparison 1 Advanced haemodynamic monitoring versus protocol using standard measures, Outcome 2 Adverse outcomes.

Comparison 2 Advanced haemodynamic monitoring versus usual care, Outcome 1 All‐cause mortality.

Comparison 2 Advanced haemodynamic monitoring versus usual care, Outcome 2 Total length of hospital stay.

Comparison 2 Advanced haemodynamic monitoring versus usual care, Outcome 3 Days until medically fit for discharge.
Comparison 2 Advanced haemodynamic monitoring versus usual care, Outcome 4 Adverse outcomes.
| Advanced haemodynamic monitoring compared with protocol using standard measures such as CVP for proximal femoral fracture | ||||||
| Patient or population: patients with proximal femoral fracture | ||||||
| Outcomes | Illustrative comparative risks* (95% CI) | Relative effect | Number of participants | Quality of the evidence | Comments | |
| Assumed risk | Corresponding risk | |||||
| Protocol using standard measures such as CVP | Advanced haemodynamic monitoring | |||||
| All‐cause mortality | Study population | RR 0.41 | 280 | ⊕⊝⊝⊝ | ||
| 142 per 1000 | 58 per 1000 | |||||
| Moderate | ||||||
| Total length of hospital stay | Not estimabled | 203 | ⊕⊕⊝⊝ | Data reported as median (range) in Bartha 2013 and as mean (95% confidence interval) in Venn 2002 | ||
| Medically fit for discharge | Mean medically fit for discharge in the intervention groups was | 90 | ⊕⊕⊝⊝ | |||
| Return to pre‐fracture accommodation/return to pre‐fracture mobility | Not estimable | ‐ | Not reported | |||
| Adverse outcomes ‐ cardiopulmonary | Study population | Not estimable | 0 | |||
| Moderate | ||||||
| Adverse outcomes ‐ neurological | Not estimable | 0 | ||||
| Adverse outcomes ‐ all | Study population | RR 0.90 | 280 | ⊕⊝⊝⊝ | ||
| 319 per 1000 | 287 per 1000 | |||||
| Moderate | ||||||
| *The basis for the assumed risk (e.g. median control group risk across studies) is provided in footnotes. The corresponding risk (and its 95% confidence interval) is based on the assumed risk in the comparison group and the relative effect of the intervention (and its 95% CI) | ||||||
| GRADE Working Group grades of evidence | ||||||
| aConcerns about randomization process in Schultz 1985; high risk of selection bias eData from 1 study only. Downgraded 2 levels | ||||||
| Advanced haemodynamic monitoring compared with usual care for perioperative fluid optimization | ||||||
| Patient or population: patients with perioperative fluid optimization | ||||||
| Outcomes | Illustrative comparative risks* (95% CI) | Relative effect | Number of participants | Quality of the evidence | Comments | |
| Assumed risk | Corresponding risk | |||||
| Usual care | Advanced haemodynamic monitoring | |||||
| All‐cause mortality | Study population | RR 0.45 | 213 | ⊕⊕⊝⊝ | ||
| 89 per 1000 | 40 per 1000 | |||||
| Moderate | ||||||
| Total length of hospital stay | Mean total length of hospital stay in the control groups was | Mean total length of hospital stay in the intervention groups was | 175 | ⊕⊕⊝⊝ | ||
| Medically fit for discharge | Mean medically fit for discharge in the control groups was | Mean medically fit for discharge in the intervention groups was | 175 | ⊕⊕⊝⊝ | ||
| Return to pre‐fracture accommodation/return to pre‐fracture mobility | Study population | Not estimable | 114 | ⊕⊕⊝⊝ | ||
| 397 per 1000 | 0 per 1000 | |||||
| Moderate | ||||||
| Adverse outcomes ‐ cardiopulmonary | Study population | Not estimable | 0 | |||
| Moderate | ||||||
| Adverse outcomes ‐ neurological | Study population | RR 1.10 | 173 | ⊕⊕⊝⊝ | ||
| 152 per 1000 | 170 per 1000 | |||||
| Moderate | ||||||
| Adverse outcomes ‐ all | Study population | RR 0.78 | 173 | ⊕⊕⊝⊝ | ||
| 554 per 1000 | 432 per 1000 | |||||
| Moderate | ||||||
| *The basis for the assumed risk (e.g. median control group risk across studies) is provided in footnotes. The corresponding risk (and its 95% confidence interval) is based on the assumed risk in the comparison group and the relative effect of the intervention (and its 95% CI) | ||||||
| GRADE Working Group grades of evidence | ||||||
| aConfidence intervals cross no effect and are consistent with increased as well as decreased risk. Downgraded 1 level | ||||||
| Protocol using standard measures such as CVP compared with usual care for perioperative fluid optimization | ||||||
| Patient or population: patients with perioperative fluid optimization | ||||||
| Outcomes | Illustrative comparative risks* (95% CI) | Relative effect | Number of participants | Quality of the evidence | Comments | |
| Assumed risk | Corresponding risk | |||||
| Usual care | Protocol using standard measures such as CVP | |||||
| All‐cause mortality | Study population | RR 2.81 | 60 | ⊕⊕⊝⊝ | ||
| 69 per 1000 | 194 per 1000 | |||||
| Moderate | ||||||
| Total length of hospital stay | Mean total length of hospital stay in the control groups was | Mean total length of hospital stay in the intervention groups was | 60 | ⊕⊕⊝⊝ | ||
| Medically fit for discharge | Mean medically fit for discharge in the intervention groups was | 60 | ⊕⊕⊕⊝ | |||
| Return to pre‐fracture accommodation/return to pre‐fracture mobility | Not estimable | ‐ | Not reported | |||
| Adverse outcomes ‐ cardiopulmonary | Study population | Not estimable | 0 | Not reported | ||
| Moderate | ||||||
| Adverse outcomes ‐ neurological | Study population | RR 0.94 | 60 | ⊕⊕⊝⊝ | ||
| 34 per 1000 | 32 per 1000 | |||||
| Moderate | ||||||
| Adverse outcomes ‐ all | Study population | RR 0.53 | 60 | ⊕⊕⊝⊝ | ||
| 483 per 1000 | 256 per 1000 | |||||
| Moderate | ||||||
| *The basis for the assumed risk (e.g. median control group risk across studies) is provided in footnotes. The corresponding risk (and its 95% confidence interval) is based on the assumed risk in the comparison group and the relative effect of the intervention (and its 95% CI) | ||||||
| GRADE Working Group grades of evidence | ||||||
| aBased on 1 study with a small number of events. Wide confidence intervals consistent with increased as well as decreased risk. Downgraded by 1 level | ||||||
| Study ID | Adverse events | Advanced haemodynamic monitoring | Protocol using standard measures |
| n = 74 | n = 75 | ||
| Cardiopulmonary | Cardiovascular 5 Respiratory 5 | Cardiovascular 6 Respiratory 7 | |
| Neurological | Cerebrovascular 0 Confusion 3 | Cerebrovascular 2 Confusion 6 | |
| Other | Acute kidney failure 1 Gastrointestinal bleeding 0 Sepsis 2 Deep vein thrombosis 0 Wound infection 2 Delayed healing 0 Urinary tract infection 16 Decubitus 6 Wound haematoma 0 Other 4 | Acute kidney failure 1 Gastrointestinal bleeding 0 Sepsis 0 Deep vein thrombosis 0 Wound infection 1 Delayed healing 0 Urinary tract infection 12 Decubitus 1 Wound haematoma 1 Other 6 | |
| n = 35 | n = 35 | ||
| Other | Pneumonia 1 Wound infection 1 Pneumonitis 1 | Pneumonia 2 Decubitis ulcer 1 | |
| n = 30 | n = 31 | ||
| Cardiopulmonary | Chest infection 2 Pulmonary embolus 1 Myocardial infarction 0 Cardiac failure 0 Rapid atrial fibrillation 3 Hypotension 0 | Chest infection 3 Pulmonary embolus 0 Myocardial infarction 1 Cardiac failure 1 Rapid atrial fibrillation 1 Hypotension 0 | |
| Neurological | Cerebrovascular accident 2 | Cerebrovascular accident 1 | |
| Other | Deep haemorrhage 1 Haematemesis 0 Wound infection 0 Urinary tract infection 2 Cellulitis 0 Pancreatitis 0 Hypotension 0 Impaired renal function 0 Pseudo‐obstruction 0 | Deep haemorrhage 0 Haematemesis 0 Wound infection 0 Urinary tract infection 1 Cellulitis 1 Pancreatitis 0 Hypotension 0 Impaired renal function 0 Pseudo‐obstruction 1 |
| Study ID | Adverse events | Advanced haemodynamic monitoring | Usual care |
| n = 51 | n = 63 | ||
| Cardiopulmonary | Cardiovascular 8 Respiratory 0 | Cardiovascular 6 Respiratory 0 | |
| Neurological | Acute delirium 11 | Acute delirium 13 | |
| Other | Infectious 21 Abdominal 2 Bleeding 0 Skin 0 Renal (RIFLE) 18* Other 3 | Infectious 34 Abdominal 1 Bleeding 0 Skin 0 Renal (RIFLE) 32* Other 3 | |
| n = 30 | n = 29 | ||
| Cardiopulmonary | Chest infection 2 Pulmonary embolus 1 Myocardial infarction 0 Cardiac failure 0 Rapid atrial fibrillation 3 Hypotension 0 | Chest infection 5 Pulmonary embolus 0 Myocardial infarction 0 Cardiac failure 0 Rapid atrial fibrillation 2 Hypotension 3 | |
| Neurological | Cerebrovascular accident 2 | Cerebrovascular accident 1 | |
| Other | Deep haemorrhage 1 Haematemesis 0 Wound infection 0 Urinary tract infection 2 Cellulitis 0 Pancreatitis 0 Hypotension 0 Impaired renal function 0 Pseudo‐obstruction 0 | Deep haemorrhage 1 Haematemesis 1 Wound infection 2 Urinary tract infection 3 Cellulitis 0 Pancreatitis 1 Hypotension 3 Impaired renal function 2 Pseudo‐obstruction 0 | |
| *RIFLE scores sum of patients at risk, injury or failure | |||
| Outcomes reported in Venn 2002: comparison 3 | Protocol ‐ CVP N = 31 | Standard care
N = 29 | Effect estimate (95% CI) | ||
|
| Mean | SD | Mean | SD | Mean difference |
| Length of hospital stay (days) | 13.3 | 12.1 | 17.5 | 13.8 | ‐4.20 (‐11.0 to 2.60) |
| Time to fitness to discharge | 10 | 5.3 | 13.9 | 6.6 | ‐3.90 (‐7.05 to ‐0.75) |
|
|
|
|
|
|
|
|
| Events |
| Events |
| MH relative risk |
| Mortality | 6 |
| 2 |
| 2.81 (0.61 to 12.81) |
| Adverse events |
|
|
|
|
|
| · Cardiopulmonary ‐ episodes | 6 |
| 7 |
| N/A |
| · Neurological ‐ participants | 1 |
| 1 |
| 0.94 (0.06 to 14.27) |
| · Any, including minor ‐ participants | 8 |
| 14 |
| 0.53 (0.26 to 1.08) |
| Outcome or subgroup title | No. of studies | No. of participants | Statistical method | Effect size |
| 1 All‐cause mortality Show forest plot | 3 | 280 | Risk Ratio (M‐H, Random, 95% CI) | 0.41 [0.14, 1.20] |
| 2 Adverse outcomes Show forest plot | 3 | 280 | Risk Ratio (M‐H, Random, 95% CI) | 0.83 [0.59, 1.17] |
| 2.1 Any complications, including minor | 3 | 280 | Risk Ratio (M‐H, Random, 95% CI) | 0.83 [0.59, 1.17] |
| Outcome or subgroup title | No. of studies | No. of participants | Statistical method | Effect size |
| 1 All‐cause mortality Show forest plot | 3 | 213 | Risk Ratio (M‐H, Random, 95% CI) | 0.45 [0.07, 2.95] |
| 2 Total length of hospital stay Show forest plot | 2 | 173 | Mean Difference (IV, Fixed, 95% CI) | 0.63 [‐1.70, 2.96] |
| 3 Days until medically fit for discharge Show forest plot | 2 | 173 | Mean Difference (IV, Fixed, 95% CI) | ‐0.01 [‐1.74, 1.71] |
| 4 Adverse outcomes Show forest plot | 2 | Risk Ratio (M‐H, Random, 95% CI) | Subtotals only | |
| 4.1 Neurological | 2 | 173 | Risk Ratio (M‐H, Random, 95% CI) | 1.10 [0.56, 2.18] |
| 4.2 Any complications, including minor | 2 | 173 | Risk Ratio (M‐H, Random, 95% CI) | 0.72 [0.40, 1.31] |