Ćwiczenia fizyczne u chorych na cukrzycę typu 2
Appendices
Appendix 1. Search strategy
| Search terms |
| Unless otherwise stated, search terms are free text terms; MeSH = Medical subject heading (Medline medical index term); exp = exploded MeSH; the dollar sign ($) stands for any character(s); the question mark (?) = to substitute for one or no characters; tw = text word; pt = publication type; sh = MeSH; adj = adjacent. Search for Diabetes mellitus, type 2 (1) exp diabetes mellitus, non‐insulin‐dependent/ |
Appendix 2. Risk of bias
| Study | At Baseline | Randomisation | Allocation Concealed | Intention to treat | Assessor blinding | Losses accounted for |
| Similar | Yes | Not reported | Yes | Not reported | No losses | |
| Similar | Yes | Not reported | Yes | Not reported | No losses | |
| Similar | Yes, by drawing lots | Not reported | Yes | Not reported | No losses | |
| Similar | Yes | Not reported | Not done | Not reported | Reasons given | |
| Similar | Yes | Not reported | Not done | Not reported | Reasons given | |
| Similar | Yes | Not reported | Not done | Not reported | Reason given | |
| Similar | Yes | Not reported | Yes | Not reported | No losses | |
| Similar | Yes | Not reported | Not done | Not reported | No reason given | |
| Similar | Yes | Not reported | Not done | Not reported | Reasons given | |
| Similar | Yes | Not reported | Not done | Not reported | Reasons given | |
| Similar | Yes | Not reported | Not done | Not reported | Reasons given | |
| Similar | Yes | Not reported | Not done | Not reported | No reasons given ('variety of reasons') | |
| Similar | Yes | Not reported | Not done | Not reported | No reasons given | |
| Yeater | Plasma triglyceride concentrations were higher in the exercise group. No other baseline differences | Yes | Not reported | Yes | Not reported | No losses |
Appendix 3. QUOROM diagramme
| Papers | Excluded |
| Potentially relevant RCTs identified and screened for retrieval (n = 2101) | |
| Papers excluded (n = 2003) | |
| Papers retrieved for more detailed evaluation (n = 98) | |
| Papers excluded (n = 63) | |
| Potentially appropriate RCTs to be included in the meta‐analysis (n = 35) | |
| RCTs excluded from meta‐analysis (n = 21) | |
| RCTs included in meta‐analysis (n = 14) | |
| RCTs withdrawn (n = 0) | |
| RCTs with usable information (n = 14). |
Appendix 4. Original data
| Study ID / Outcome | Exercise N | Exercise Mean | Exercise SD | Control N | Control Mean | Control SD |
| 01.01 Glycated haemoglobin (%) | ||||||
| 9 | 8.40 | 1.80 | 9 | 8.40 | 1.80 | |
| 10 | 6.80 | 1.26 | 9 | 6.87 | 1.20 | |
| 9 | 8.20 | 1.80 | 7 | 8.50 | 1.59 | |
| 11 | 8.00 | 1.66 | 10 | 8.30 | 2.21 | |
| 16 | 6.90 | 1.00 | 13 | 7.10 | 1.10 | |
| 24 | 7.60 | 1.40 | 25 | 8.30 | 1.40 | |
| 16 | 7.90 | 1.2 | 16 | 8.50 | 1.6 | |
| 10 | 6.20 | 0.63 | 11 | 7.70 | 1.33 | |
| 19 | 11.70 | 2.60 | 19 | 12.90 | 4.20 | |
| 13 | 8.60 | 1.90 | 12 | 9.90 | 1.70 | |
| 19 | 7.60 | 1.20 | 20 | 7.80 | 1.50 | |
| 16 | 7.33 | 1.09 | 10 | 8.17 | 1.30 | |
| 16 | 7.33 | 1.09 | 10 | 8.17 | 1.30 | |
| Wing 1988: 2nd study | 13 | 8.20 | 1.08 | 15 | 9.00 | 1.16 |
| 01.02 Visceral adipose tissue (cm2) | ||||||
| Study ID | Exercise N | Exercise Mean | Exercise SD | Control N | Control Mean | Control SD |
| 10 | 224.80 | 23.40 | 9 | 258.70 | 36.00 | |
| 10 | 80.40 | 22.14 | 11 | 134.90 | 33.83 | |
| 01.03 Subcutaneous adipose tissue (cm2) | ||||||
| Study ID | Exercise N | Exercise Mean | Exercise SD | Control N | Control Mean | Control SD |
| 10 | 446.90 | 48.70 | 9 | 566.70 | 27.00 | |
| 10 | 186.70 | 44.59 | 11 | 260.30 | 71.64 | |
| 01.04 Body Mass (kg) | ||||||
| Study ID | Exercise N | Exercise Mean | Exercise SD | Control N | Control Mean | Control SD |
| 9 | 114.00 | 12.30 | 9 | 110.90 | 22.20 | |
| 10 | 86.60 | 12.33 | 9 | 97.60 | 19.50 | |
| 9 | 97.00 | 12.00 | 7 | 92.00 | 18.52 | |
| 11 | 83.20 | 12.30 | 10 | 83.70 | 12.00 | |
| 16 | 86.20 | 10.90 | 13 | 86.40 | 12.10 | |
| 16 | 88.70 | 17.60 | 16 | 88.70 | 17.60 | |
| 10 | 83.80 | 12.33 | 11 | 84.20 | 15.26 | |
| 13 | 83.20 | 19.50 | 12 | 83.30 | 12.40 | |
| 19 | 83.00 | 17.60 | 20 | 79.50 | 14.60 | |
| Wing 1988: 2nd study | 13 | 94.80 | 21.30 | 15 | 96.40 | 19.74 |
| 01.05 Triglycerides (mmol/litre) | ||||||
| Study ID | Exercise N | Exercise Mean | Exercise SD | Control N | Control Mean | Control SD |
| 16 | 2.20 | 1.20 | 16 | 2.70 | 1.60 | |
| 8 | 1.79 | 1.08 | 8 | 2.33 | 0.63 | |
| 19 | 1.90 | 0.70 | 19 | 2.20 | 0.06 | |
| 13 | 1.91 | 0.97 | 12 | 1.75 | 0.62 | |
| Wing 1988: 2nd study | 13 | 1.42 | 0.69 | 15 | 1.64 | 0.74 |
| 01.06 Maximal exercise capacity (VO2max) | ||||||
| Study ID | Exercise N | Exercise Mean | Exercise SD | Control N | Control Mean | Control SD |
| 24 | 33.80 | 5.50 | 25 | 31.80 | 6.60 | |
| 10 | 32.40 | 4.11 | 11 | 23.00 | 4.97 | |
| 13 | 29.30 | 6.20 | 12 | 25.90 | 6.70 | |
| 01.07 Systolic blood pressure (mmHg) | ||||||
| Study ID | Exercise N | Exercise Mean | Exercise SD | Control N | Control Mean | Control SD |
| 11 | 127.00 | 9.96 | 10 | 127.00 | 12.64 | |
| 16 | 138.30 | 17.80 | 13 | 144.50 | 15.50 | |
| 24 | 138.00 | 16.00 | 25 | 144.00 | 14.00 | |
| Wing 1988: 2nd study | 13 | 130.00 | 18.05 | 15 | 135.00 | 23.22 |
| 01.08 Diastolic blood pressure (mmHg) | ||||||
| Study ID | Exercise N | Exercise Mean | Exercise SD | Control N | Control Mean | Control SD |
| 11 | 73.00 | 6.64 | 10 | 72.00 | 6.32 | |
| 16 | 73.60 | 8.80 | 13 | 74.10 | 6.40 | |
| Wing 1988: 2nd study | 13 | 83.00 | 7.22 | 15 | 85.00 | 15.48 |
| 01.09 Fasting plasma glucose concentration (mmol/litre) | ||||||
| Study ID | Exercise N | Exercise Mean | Exercise SD | Control N | Control Mean | Control SD |
| 9 | 11.40 | 2.40 | 9 | 11.00 | 3.00 | |
| 9 | 10.90 | 3.60 | 7 | 12.10 | 3.44 | |
| 11 | 9.40 | 2.66 | 10 | 9.80 | 4.11 | |
| 16 | 9.80 | 2.00 | 16 | 12.00 | 2.00 | |
| 10 | 9.50 | 1.58 | 11 | 8.60 | 1.66 | |
| 19 | 10.20 | 3.30 | 19 | 12.30 | 4.40 | |
| 13 | 10.50 | 4.40 | 12 | 11.20 | 2.20 | |
| 19 | 9.20 | 2.50 | 20 | 8.40 | 2.30 | |
| Wing 1988: 2nd study | 13 | 8.40 | 1.81 | 15 | 9.20 | 2.71 |
| 01.10 Insulin (fasting concentration) (pmol/litre) | ||||||
| Study ID | Exercise N | Exercise Mean | Exercise SD | Control N | Control Mean | Control SD |
| 9 | 21.10 | 12.30 | 9 | 30.90 | 22.50 | |
| 9 | 134.00 | 81.00 | 7 | 131.00 | 68.79 | |
| 11 | 63.10 | 41.83 | 10 | 93.80 | 39.82 | |
| 10 | 21.10 | 7.90 | 11 | 21.90 | 12.60 | |
| 13 | 15.40 | 10.80 | 12 | 15.50 | 8.20 | |
| 19 | 17.10 | 8.70 | 20 | 17.00 | 6.90 | |
| Wing 1988: 2nd study | 13 | 18.30 | 11.19 | 15 | 17.60 | 16.25 |
| 01.11 Body Mass Index (kg/m2) | ||||||
| Study ID | Exercise N | Exercise Mean | Exercise SD | Control N | Control Mean | Control SD |
| 9 | 31.00 | 3.00 | 7 | 30.00 | 5.29 | |
| 11 | 28.10 | 2.65 | 10 | 30.40 | 3.48 | |
| 24 | 28.90 | 3.80 | 25 | 29.80 | 3.70 | |
| 16 | 29.60 | 13.20 | 16 | 29.60 | 13.60 | |
| 10 | 30.60 | 1.90 | 11 | 30.00 | 5.31 | |
| 19 | 31.50 | 4.30 | 19 | 30.60 | 4.20 | |
| 19 | 30.60 | 5.40 | 20 | 29.40 | 3.80 |
Appendix 5. Original data (continued)
| Study ID / Outcome | Exercise N | Exercise Mean | Exercise SD | Control N | Control Mean | Control SD |
| 01.12 Total cholesterol (mmol/litre) | ||||||
| 16 | 4.60 | 0.80 | 16 | 4.60 | 0.80 | |
| 8 | 5.34 | 1.42 | 8 | 5.40 | 1.16 | |
| 19 | 5.60 | 1.00 | 19 | 6.00 | 1.00 | |
| 13 | 6.37 | 0.90 | 12 | 6.10 | 1.00 | |
| Wing 1988: 2nd study | 13 | 4.21 | 0.83 | 15 | 4.44 | 0.62 |
| 01.13 HDL‐cholesterol (mmol/litre) | ||||||
| Study ID | Exercise N | Exercise Mean | Exercise SD | Control N | Control Mean | Control SD |
| 16 | 1.10 | 0.40 | 16 | 1.00 | 0.40 | |
| 8 | 1.02 | 0.17 | 8 | 1.12 | 0.18 | |
| 19 | 1.10 | 0.30 | 19 | 1.10 | 0.30 | |
| 13 | 1.29 | 0.36 | 12 | 1.26 | 0.31 | |
| Wing 1988: 2nd study | 13 | 0.94 | 0.18 | 15 | 0.96 | 0.19 |
| 01.14 LDL‐cholesterol (mmol/litre) | ||||||
| Study ID | Exercise N | Exercise Mean | Exercise SD | Control N | Control Mean | Control SD |
| 16 | 2.50 | 0.80 | 16 | 2.40 | 0.80 | |
| 8 | 4.34 | 1.39 | 8 | 4.29 | 1.16 | |
| 13 | 4.29 | 0.87 | 12 | 4.11 | 0.90 | |
| 01.17 RFI (risk factor index = total cholesterol/HDL) | ||||||
| Study ID | Exercise N | Exercise Mean | Exercise SD | Control N | Control Mean | Control SD |
| 8 | 5.24 | 1.59 | 8 | 4.82 | 1.34 | |
| 19 | 5.09 | 1.30 | 19 | 5.45 | 1.30 | |
| 13 | 4.94 | 1.26 | 12 | 4.80 | 1.31 | |
| Wing 1988: 2nd study | 13 | 4.48 | 1.01 | 15 | 4.65 | 0.81 |
| 01.18 Fat free mass (kg) | ||||||
| Study ID | Exercise N | Exercise Mean | Exercise SD | Control N | Control Mean | Control SD |
| 9 | 76.90 | 3.30 | 9 | 70.60 | 9.00 | |
| 01.19 Insulin sensitivity (AUC insulinaemia) | ||||||
| Study ID | Exercise N | Exercise Mean | Exercise SD | Control N | Control Mean | Control SD |
| 19 | 400.00 | 212.00 | 20 | 269.00 | 131.00 | |
| 01.24 Fat mass (kg) | ||||||
| Study ID | Exercise N | Exercise Mean | Exercise SD | Control N | Control Mean | Control SD |
| 9 | 37.00 | 10.50 | 9 | 40.30 | 18.90 |

Comparison 1 Exercise vs no exercise, Outcome 1 Glycated haemoglobin (%).

Comparison 1 Exercise vs no exercise, Outcome 2 Visceral adipose tissue (cm2).

Comparison 1 Exercise vs no exercise, Outcome 3 Subcutaneous adipose tissue (cm2).

Comparison 1 Exercise vs no exercise, Outcome 4 Body Mass (kg).

Comparison 1 Exercise vs no exercise, Outcome 5 Triglycerides (mmol/litre).
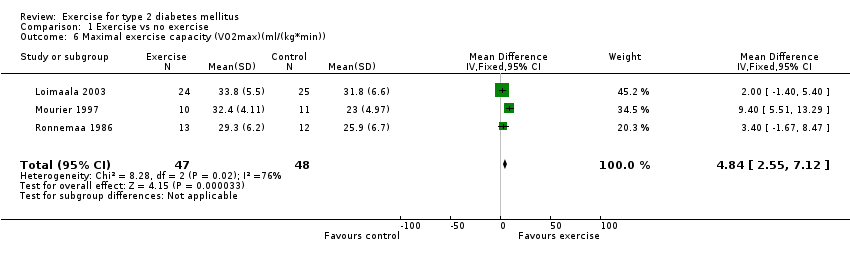
Comparison 1 Exercise vs no exercise, Outcome 6 Maximal exercise capacity (VO2max)(ml/(kg*min)).
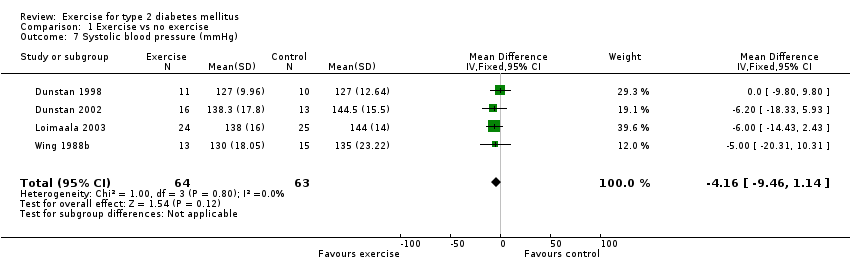
Comparison 1 Exercise vs no exercise, Outcome 7 Systolic blood pressure (mmHg).
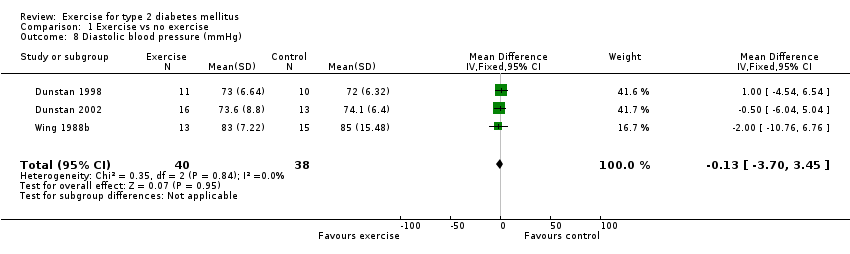
Comparison 1 Exercise vs no exercise, Outcome 8 Diastolic blood pressure (mmHg).

Comparison 1 Exercise vs no exercise, Outcome 9 Fasting plasma glucose concentration (mmol/L).

Comparison 1 Exercise vs no exercise, Outcome 10 Insulin (fasting concentration (pmol/litre).

Comparison 1 Exercise vs no exercise, Outcome 11 Body Mass index (kg/m2).

Comparison 1 Exercise vs no exercise, Outcome 12 Total cholesterol (mmol/l).
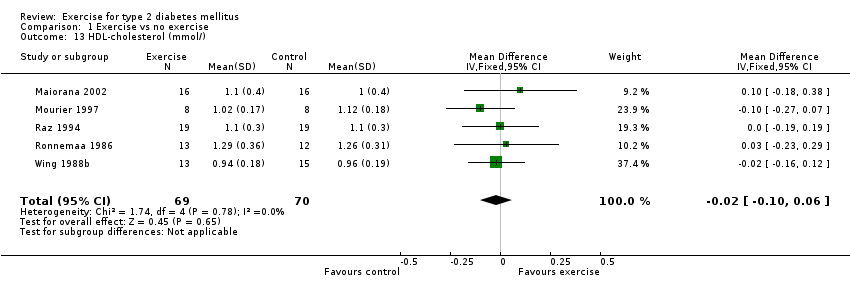
Comparison 1 Exercise vs no exercise, Outcome 13 HDL‐cholesterol (mmol/).

Comparison 1 Exercise vs no exercise, Outcome 14 LDL‐cholesterol (mmol/).
| Outcome or subgroup title | No. of studies | No. of participants | Statistical method | Effect size |
| 1 Glycated haemoglobin (%) Show forest plot | 13 | 361 | Mean Difference (IV, Fixed, 95% CI) | ‐0.62 [‐0.91, ‐0.33] |
| 2 Visceral adipose tissue (cm2) Show forest plot | 2 | 40 | Mean Difference (IV, Fixed, 95% CI) | ‐45.54 [‐63.76, ‐27.31] |
| 3 Subcutaneous adipose tissue (cm2) Show forest plot | 2 | Mean Difference (IV, Fixed, 95% CI) | Subtotals only | |
| 4 Body Mass (kg) Show forest plot | 10 | 248 | Mean Difference (IV, Fixed, 95% CI) | ‐0.04 [‐3.83, 3.76] |
| 5 Triglycerides (mmol/litre) Show forest plot | 5 | 139 | Mean Difference (IV, Fixed, 95% CI) | ‐0.25 [‐0.48, ‐0.02] |
| 6 Maximal exercise capacity (VO2max)(ml/(kg*min)) Show forest plot | 3 | 95 | Mean Difference (IV, Fixed, 95% CI) | 4.84 [2.55, 7.12] |
| 7 Systolic blood pressure (mmHg) Show forest plot | 4 | 127 | Mean Difference (IV, Fixed, 95% CI) | ‐4.16 [‐9.46, 1.14] |
| 8 Diastolic blood pressure (mmHg) Show forest plot | 3 | 78 | Mean Difference (IV, Fixed, 95% CI) | ‐0.13 [‐3.70, 3.45] |
| 9 Fasting plasma glucose concentration (mmol/L) Show forest plot | 9 | 238 | Mean Difference (IV, Fixed, 95% CI) | ‐0.45 [‐1.09, 0.18] |
| 10 Insulin (fasting concentration (pmol/litre) Show forest plot | 7 | 168 | Mean Difference (IV, Fixed, 95% CI) | ‐0.71 [‐4.13, 2.71] |
| 11 Body Mass index (kg/m2) Show forest plot | 7 | 216 | Mean Difference (IV, Fixed, 95% CI) | ‐0.21 [‐1.35, 0.93] |
| 12 Total cholesterol (mmol/l) Show forest plot | 5 | 139 | Mean Difference (IV, Fixed, 95% CI) | ‐0.11 [‐0.41, 0.18] |
| 13 HDL‐cholesterol (mmol/) Show forest plot | 5 | 139 | Mean Difference (IV, Fixed, 95% CI) | ‐0.02 [‐0.10, 0.06] |
| 14 LDL‐cholesterol (mmol/) Show forest plot | 3 | 73 | Mean Difference (IV, Fixed, 95% CI) | 0.12 [‐0.29, 0.53] |