Naftidrofuryl for dementia
Résumé scientifique
Contexte
La démence est une affection cérébrale qui se caractérise par la perte définitive des fonctions cognitives supérieures. Plusieurs traitements vasodilatateurs sont prescrits en cas de démence. Le naftidrofuryl fait partie de ces traitements qui est rapporté comme améliorant les symptômes cliniques de façon significative. L’efficacité et les éventuels effets indésirables du naftidrofuryl doivent faire l’objet d’une revue systématique et être analysés, afin d’éclairer la pratique clinique et de guider la recherche permanente de nouveaux schémas thérapeutiques
Objectifs
Évaluer l’efficacité et l’innocuité du naftidrofuryl pour le traitement de la démence.
Stratégie de recherche documentaire
Le 11 janvier 2011, nous avons effectué des recherches dans ALOIS : le registre spécialisé du groupe Cochrane sur la démence et les autres troubles cognitifs, en utilisant le terme : naftidrofuryl. ALOIS contient des documents relatifs aux essais cliniques issus des bases de données majeures de la santé (MEDLINE, EMBASE, PsycINFO, LILACS et CINAHL), des registres d’essais (comme ClinicalTrials.gov) et des sources de la littérature grise.
Critères de sélection
Les essais randomisés contrôlés par placebo, dans lesquels les patients atteints de démence ont été traités par naftidrofuryl, ont été considérés comme éligibles pour l’inclusion.
Recueil et analyse des données
Deux auteurs de la revue ont sélectionné de façon indépendante les essais à inclure, évalué leur qualité et extrait des données à l’aide de formulaires d’extraction de données. Les domaines évalués pour les risques de biais étaient la génération de séquence, l’assignation secrète, la mise en aveugle, les données incomplètes de critères de jugement et la notification sélective de résultats. Nous avons utilisé les rapports des cotes (RC) pour rapporter les données dichotomiques, et des différences moyennes (DM) et des différences moyennes standardisées (DMS) pour rapporter les données continues. Nous avons évalué l’hétérogénéité statistique à l’aide des statistiques 2.
Résultats principaux
Nous avons identifié neuf essais contrôlés randomisés portant sur 847 patients atteints de maladie d’Alzheimer, de démence vasculaire, de démence mixte, de démence sénile et de démence non spécifiée. Des effets bénéfiques ont été constatés au niveau des performances fonctionnelles et du comportement (points standardisés ‐1,04, IC à 95 % ‐1,73 à ‐0,35, P = 0,003) avec une hétérogénéité élevée (I2 = 54%), de l’humeur (points standardisés ‐0,80, IC à 95 % ‐1,26 à ‐0,34, P = 0,0006) chez les patients atteints de démence, et aussi au niveau des fonctions cognitives (points standardisés ‐0,36, IC à 95 % ‐0,71 à ‐0,02, P = 0,04). Toutefois, les mesures globales cliniques n’ont pas confirmé ces résultats. Le naftidrofuryl était bien toléré par les patients atteints de démence.
Conclusions des auteurs
L’administration orale de naftidrofuryl est bien tolérée par les patients atteints de démence. Des preuves de qualité médiocre montrent que le naftidrofuryl pourrait améliorer les performances fonctionnelles, le comportement, la cognition et l’humeur de ces personnes. Toutefois, les effets bénéfiques sur l’impression globale sont contradictoires et peu convaincants.
PICO
Résumé simplifié
Naftidrofuryl pour le traitement des personnes atteintes de démence
La démence se caractérise par une déficience chronique, globale et irréversible des fonctions cognitives, incluant la mémoire, la fonction exécutive et la personnalité. Elle influe sensiblement sur la qualité de vie du patient. Il a été suggéré que le naftidrofuryl serait un traitement contre la démence, qui permettrait d’augmenter l’alimentation en oxygène des tissus cérébraux. Des preuves de qualité médiocre montrent que le naftidrofuryl peut avoir des effets bénéfiques sur les performances fonctionnelles, le comportement, la cognition et l’humeur des patients atteints de démence. Toutefois, ces effets bénéfiques ne parviennent pas à se traduire en changements fiables cliniquement identifiables. Le naftidrofuryl administré par voie orale est bien toléré.
Authors' conclusions
Background
Dementia is characterized by chronic, global, non‐reversible impairment in cerebral function. It usually results in loss of memory (initially of recent events), loss of executive function (such as the ability to make decisions or sequence complex tasks), and changes in personality. Currently, 24.3 million people around the world are estimated to have dementia, with 4.6 million new cases of dementia every year (Ferri 2005). Alzheimer's disease and vascular dementia (including mixed dementia), two major subtypes, are each estimated to account for 35% to 50% of dementia, and Lewy body dementia is estimated to the account for up to 20% of dementia in the elderly, varying with geographical, cultural, and racial factors (Farrer 2001,Ikeda 2001,Lobo 2000,McKeith 2000,Skoog 1993,Van Duijn 1996). There are numerous other causes of dementia, all of which are relatively rare. The most commonly used criterion set for diagnosis of dementia is the DSM‐IV (Diagnostic and Statistical Manual for Mental Disorders, American Psychiatric Association). The effects of dementia are multidimensional with widespread implications for physical, mental and social functioning. Dementia greatly adds to the burden on carers, medical practitioners, health resources, and pressure on research to find effective treatments, not only in Europe or the industrialized countries (Grimley Evans 1997), but around the world: by 2040 it is projected that 71% of the 81.1 million people with dementia will be from developing countries (Ferri 2005).
Senile dementia of Alzheimer's type (SDAT), or Alzheimer's disease, is the most common subtype of dementia and its pathogenesis is being increasingly elucidated. The second most common type of dementia is vascular dementia, which is defined as a subtle, progressive decline in memory and cognitive functioning caused by chronic, reduced blood flow to the brain—usually as the result of a stroke or series of strokes (Roman 2003). However, a significant proportion of dementia is of mixed Alzheimer's and vascular type. Therefore, increasing or improving cerebral blood flow is one possible approach to treatment (at least of the symptoms).
A number of vasodilatory drug treatments are prescribed for dementia, and one of these is naftidrofuryl, or nafronyl (marketed by Lipha as Praxilene, also called Gevatran in some clinical trials, also currently marketed as Dusodril Retard by Merck ) which has been used in Europe since 1968. It is administered orally, with the usual dose being 100 to 200 mg three times a day for peripheral vascular disease and 100 mg three times a day for cerebral vascular disease. In 1999, of the total amount of Praxilene dispensed for all indications, 54.7% was used in France, 36.5% in other European countries, 1.3% in South America, 2.7% in Asia (outside Japan) and 4.8% in Africa, against a total of about 3.5 million prescriptions.
Naftidrofuryl is the acid oxalate of N‐diethylaminoethyl‐beta‐(naphthyl‐1)‐beta'‐tetra‐hydrofuryl‐isobutyrate. It acts on energetic metabolism in muscle and brain, mainly in conditions of hypoxia or total or partial ischaemias. The pharmacological effects of naftidrofuryl include increasing the availability of oxygen and energetic mediators in the tissues; reducing the rate of glycolysis and uptake of glucose from the blood; altering mitochondrial enzymatic activities; and decreasing acetylcholinesterase activity in hypoxia (Agnoli 1985). Side effects that have been observed include nausea, epigastric pain, rash, hepatitis, hepatic failure and following injection, hypotension, arrhythmias and convulsions.
A Cochrane systematic review of intravenous naftidrofuryl found no clear evidence that short‐term intravenous naftidrofuryl was of benefit for people with critical limb ischaemia, and the authors also point out that the treatment was withdrawn for peripheral arterial disease in 1995 because of reported side effects (Smith 2008). Moreover, Leonardi‐Bee 2007 found that there was not enough evidence to support the use of naftidrofuryl for patients with acute stroke. However, De Backer 2005 found naftidrofuryl did significantly improve walking distance for people with intermittent claudication. While the vasodilating action of the drug makes it a relatively uncontroversial treatment in peripheral vascular disease (notwithstanding side effects), it is felt that clinicians, policy makers and end‐users could make use of this third review of naftidrofuryl which seeks evidence of effect for its use in cognitive impairment (though not restricted to vascular dementia alone), and also intends to evaluate the side effects.
Objectives
The primary objective of this review is to determine whether naftidrofuryl is effective in the treatment of dementia. The secondary objective is to determine how safe it is to use.
Methods
Criteria for considering studies for this review
Types of studies
All randomised placebo‐controlled trials of naftidrofuryl for the treatment of dementia, were considered eligible for inclusion. We planned to use only data from the first period of any included cross‐over trials.
Types of participants
Studies whose participants have a primary diagnosis of dementia of any severity. We recognised that, given the vintage of some of the studies, current diagnostic criteria would not have been used. However, we considered that a study could be considered for inclusion if the participants were diagnosed as having dementia by the use of contemporaneous accepted criteria. We excluded trials in which participants do not exhibit features of cognitive impairment. We also excluded dementias of infective, toxic or traumatic aetiology.
Types of interventions
Naftidofuryl given by any route for more than one dose.
Types of outcome measures
Primary outcome measures
-
Clinical global impression.
-
Adverse events.
Secondary outcome measures
-
Functional performance (activities of daily living) and behavioural disturbances.
-
Mood.
-
Cognitive function.
-
Dependency.
-
Death.
-
Withdrawal from trial (due to adverse effects).
-
Quality of life.
-
Effect on carer.
A significant number of rating scales are used to assess outcomes within Mental Health. Scales vary in quality and many are poorly validated. We excluded trials in which outcomes were measured using unpublished rating scales or scales with no established reliability or validity in order to ensure the correctness and reliability of results.
Search methods for identification of studies
Electronic searches
We searched ALOIS (www.medicine.ox.ac.uk/alois) ‐ the Cochrane Dementia and Cognitive Improvement Group's (CDCIG) Specialized Register on 11 January 2011. The search term used was: naftidrofuryl. This term would capture the following terms: artocoron OR azunaftil OR "cerebral vasodilator" OR di‐actane OR dusodril OR esedril OR furans OR gevatran OR luctor OR naftodril OR nafronyl OR naftiratiopharm OR praxilene OR sodipryl OR stimlor OR vasolate.
ALOIS is maintained by the Trials Search Co‐ordinator of the CDCIG and contains studies in the areas of dementia prevention, dementia treatment and cognitive enhancement in healthy. The studies are identified from the following.
-
Monthly searches of a number of major healthcare databases: MEDLINE, EMBASE, CINAHL, PsycINFO and LILACS.
-
Monthly searches of a number of trial registers: ISRCTN; UMIN (Japan's Trial Register); the WHO portal (which covers ClinicalTrials.gov; ISRCTN; the Chinese Clinical Trials Register; the German Clinical Trials Register; the Iranian Registry of Clinical Trials and the Netherlands National Trials Register, plus others).
-
Quarterly search of The Cochrane Library's Central Register of Controlled Trials (CENTRAL).
-
Six‐monthly searches of a number of grey literature sources: ISI Web of Knowledge Conference Proceedings; Index to Theses; Australasian Digital Theses.
To view a list of all sources searched for ALOIS see About ALOIS on the ALOIS website.
Details of the search strategies used for the retrieval of reports of trials from the healthcare databases, CENTRAL and conference proceedings can be viewed in the ‘methods used in reviews’ section within the editorial information about the Dementia and Cognitive Improvement Group.
Additional searches were performed in many of the sources listed above to cover the timeframe from the last searches performed for ALOIS to ensure that the search for the review was as up‐to‐date and as comprehensive as possible. The search strategies used can be seen in Appendix 1.
The review authors searched the following databases in December 2007 using the terms 'naftidrofuryl', 'nafronyl ', and 'dementia'.
-
CBM (The Chinese Biomedical Database) (1977 to December 2007).
-
VIP Chinese Science and Technique Journals Database (1989 to December 2007).
-
China National Knowledge Infrastructure (CNKI) (1979 to December 2007).
-
The Chinese Clinical Trials Register (ChiCTR).
Searching other resources
We also attempted to contact experts in the field and the pharmaceutical company Lypha to identify any further trials. We also checked the reference lists of trials and relevant systematic reviews identified by the above methods.
In addition, the review authors contacted the first authors of studies to identify any unpublished studies. There were no language restrictions.
Data collection and analysis
Selection of studies
Two review authors (LD, ZH) independently scrutinised the title, abstract and keywords of every record retrieved to determine which studies required further assessment. We retrieved the full texts when the information given in the titles, abstracts and keywords suggested the following.
-
The study used naftidrofuryl as an intervention.
-
The study had a prospective design and a control group.
If there were any doubts regarding these criteria from scanning the titles and abstracts, we retrieved the full article for clarification. We resolved disagreement by discussion with a third review author (HS) if necessary. We contacted the authors of trials to provide missing data where appropriate.
Data extraction and management
Two review authors (HS, DL) independently extracted data concerning details of study population, intervention and outcomes using a standard data extraction form specifically adapted for this review. We resolved disagreements by discussion.
For dichotomous outcomes, we extracted the number of participants experiencing the event and the total number of participants in each arm of the trial. For continuous outcomes, we extracted the arithmetic means and standard deviation (SD) in each arm of the trial along with the total number in each group. If final means and SDs were not reported, we extracted the means and SD of change from baseline where available.
The baseline assessment was defined as the latest available assessment prior to randomisation, but no longer than two months prior. We included only 'last‐assessed' points in this systematic review. The short‐term outcome was defined as the assessment after one to six months follow‐up; we considered the assessment after more than six months follow‐up as a long‐term outcome.
Wherever possible, we used outcomes from the ITT population, and if not, then we extracted observed case or per‐protocol outcomes.
If we had found studies where a cross‐over design was used, we would only have used data from the first treatment phase after randomisation.
Assessment of risk of bias in included studies
Two review authors (LD, ZH) independently assessed the quality of the trials according to a modification of the quality criteria specified by the Cochrane Collaboration Handbook for Systematic Reviewers of Interventions (Higgins 2008). In particular, we assessed the following quality criteria.
-
Method of randomisation (truly or quasi‐randomised).
-
Adequate allocation concealment: adequate (e.g. by third party or sealed opaque envelopes); inadequate (e.g. open list of allocation codes); not clear (e.g. not stated, or 'envelopes' stated without further description).
-
Blinding of participants, personnel, and outcome assessors.
-
Incomplete outcome data: adequate (e.g. intention‐to‐treat (ITT) analysis where possible and exclusions were less than 5%); inadequate (e.g. no ITT analysis, or exclusions of more than 10%, or wide differences in exclusions between groups); not clear (e.g. ITT analysis with exclusions were less than 10%).
-
Selective outcome reporting.
A third review author (HS) reported and resolved any disagreement.
Measures of treatment effect
We expressed the results as odds ratios (OR) with 95% confidence intervals (CI) for dichotomous outcomes, and mean differences (MD) or standardized mean differences (SMD) with 95% CI for continuous outcomes. We used the MD when the pooled trials used the same rating scale or test, and the standardized mean difference (SMD), which was the absolute MD divided by the SD, when they used different rating scales or tests.
Unit of analysis issues
If there were multiple intervention groups in a study, we split the control group equally into multiple groups to match intervention groups.
Dealing with missing data
We contacted the authors of all trials with missing data by post or e‐mail. If there was no response, or the data were still unavailable, then we calculated missing SDs where possible from either the SE (Cucinotta 1987,Grossmann 1990,Saldmann 1991), or P values (Cohn 1984,Emeriau 2000). If no statistics allowing calculation of the SD were given, we described the original results in the text.
Assessment of heterogeneity
We carried out tests for heterogeneity using a Chi2 test with significance level set at P < 0.1. We used the I2 statistic to estimate how much of the variability in effect sizes across studies was due to heterogeneity, as a percentage; where < 25% was considered as low level heterogeneity, 25% to 50% as moderate, and > 50% as high level heterogeneity (Higgins 2003). If substantial heterogeneity (I2 greater than 50%) existed between studies for the primary outcome, we explored reasons for the heterogeneity, such as disease severity, dosage and duration of treatment, type of dementia using subgroup analyses. If it was not possible to perform a meta‐analysis, either due to too much heterogeneity (I2 > 80%) or where there was a lack of evidence, we summarized the data for each trial.
Assessment of reporting biases
We used funnel plots corresponding to meta‐analysis of the primary outcome to assess the potential for small study effects such as publication bias.
Data analysis
For studies with a similar type of participants, we performed a meta‐analysis to calculate a weighted treatment effect across trials using a fixed‐effect model, provided that there was no heterogeneity amongst studies. If heterogeneity was present, we used a random‐effects model.
When intervention effects were small (ORs close to one), or events were not particularly common and the studies had similar numbers in experimental and control groups, we used the Peto OR method.
Subgroup analysis and investigation of heterogeneity
Depending on availability of data, we planned to test additional hypotheses using the following subgroup analyses.
1. Subtype of disease
-
Alzheimer's disease.
-
Vascular dementia.
-
Mixed Alzheimer's disease and vascular dementia.
-
Unclassified or other dementia.
2. Duration of treatment
-
< 6 months.
-
≧ 6 months.
Sensitivity analysis
We planned to undertake sensitivity analyses excluding studies at high risk of bias, and excluding data calculated from SE and P values.
Results
Description of studies
See Characteristics of included studies, Characteristics of excluded studies, Characteristics of studies awaiting classification.
The CDCIG search in the Specialized register found 41 possibly relevant references. We retrieved two articles by searches in Chinese databases. After screening the titles and abstracts, we selected 28 study papers which potentially fulfilled our inclusion criteria. Of these 28 references, two studies (Meignan‐Debray 1987, Nakano 1986) are currently awaiting assessment until full texts can be retrieved. Moreover, there were four studies with two publication paper in different years (Branconnier 1977, Cucinotta 1987, Grossmann 1990, Möller 2001). Of the remaining 22 studies, we excluded 10 because they were not randomised (Bornstein 1993, Bouvier 1974, Brodie 1977, Cox 1975, Gerin 1974, Hausotter 1987, Judge 1972, Maury 1993, Robinson 1972, Roger 1986), and three because participants were not diagnosed as suffering from dementia (Agnoli 1985, Bargheon 1975, Israel 1989).
Study design
All of the nine included studies had been published and all, except one (Möller 2001) used a two‐arm parallel group design. Möller 2001 used a three‐arm parallel group design, comprising a control group (inactive vehicle), and two active treatment groups. One active treatment group received naftidrofuryl 600 mg/day and the other received 400 mg/day. Six studies were conducted in a single centre (Branconnier 1977, Cohn 1984, Cox 1981, Gottschalk 1980, Grossmann 1990, Saldmann 1991); one study used two centres (Cucinotta 1987), and the remaining two studies used multiple centres (Emeriau 2000, Möller 2001). A total of 847 participants were included in these trials. All reports were published between 1977 and 2001.
Participants
Four trials studied patients whose diagnosis was given only as senile dementia (Branconnier 1977, Cohn 1984, Cox 1981, Saldmann 1991), one addressed Alzheimer's disease (Cucinotta 1987), two dealt with vascular and mixed dementia (Emeriau 2000, Möller 2001), two involved more than two types of dementia above (Grossmann 1990, Möller 2001), and one did not specify the classification (Gottschalk 1980). Mean ages ranged from approximately 69 to 82 years, and approximately 60% of participants were female. Where severity of dementia was reported it involved 'mild' (Branconnier 1977, Cucinotta 1987), 'moderate' (Cohn 1984), 'mild to moderate' (Cox 1981, Emeriau 2000, Grossmann 1990, Saldmann 1991), 'moderate to severe' (Gottschalk 1980), and 'mild to severe' (Möller 2001).
The baseline characteristics of participants and the specific active treatment regimens in included studies are summarized in Table 1.
| Study | Number randomised | Diagnosis | Severity of disease | Mean age (SD) | % female | Active Rx | duration (months) |
| 60 | senile organic brain syndrome | mild | Active: 69.7 (6.2) Control: 68.5 (5.4) | 45.0 | 300 mg/day | 3 | |
| 75 | senile dementia | moderate | 75 | not reported | 400 mg/day | 3 | |
| 32 | senile dementia | mild to moderate | Active: 82.6 (5.7) Control: 80.9 (6.4) | 18.8 | 300 mg/day plus daily multi‐vitamin preparation and potassium 600mg t.i.d. | 2 | |
| 30 | SDAT | mild | Active: 82.6 (5.7) Control: 80.9 (6.4) | 66.7 | 600 mg/day | 12 | |
| 96 | VD and MD | mild to moderate | Active: 77 (5.7) Control: 76.5 (6.3) | 79.8 | 600 mg/day | 12 | |
| 38 | dementia | moderate to severe | 76 | 57.9 | 400 mg/day | 3 | |
| 60 | SDAT (47%) MID (24%) MD (29%) | mild to moderate | Active: 77.8 (5.3) Control: 77.3 (6.3) | 60.8 | 600 mg/day | 2 | |
| 378 | VD or MD | mild to severe | Active 1: 71.5 (7.7) Active 2: 70.6 (8.2) Control: 72 (8.0) | 54.6 | Active 1: 600 mg/day Active 2: 400 mg/day | 6 | |
| 78 | senile dementia | mild to moderate | Active: 77.1 (4.6) Control: 78.9 (5.4) | 84.8 | 400 mg/day | 3 |
Abbreviations: MD = mixed Alzheimer's disease and vascular dementia; MID = multi‐infarct dementia; Rx = treatment; SDAT= Senile Dementia of the Alzheimer Type; t.i.d. = three times daily; VD = vascular dementia.
Interventions
Doses of naftidrofuryl ranged from 300 mg/day to 600 mg/day. Treatment periods ranged from two months to 12 months. Naftidrofuryl was administered orally in all studies. All studies used matching placebos as the control treatment.
Outcome measures
Participants were treated for two to four months in six trials, for six months in one trial (Möller 2001), and for 12 months in two trials (Cucinotta 1987, Emeriau 2000). The majority of outcome measures used scales which measured more than one of our outcome domains. All outcomes identified in the trials are listed in Table 2. Instead of rating scores, Möller 2001 used response rate to analyse, which was defined as a success if final score ≤ baseline. The following published and validated scales have been extracted for analyses in this review:
| Study | SCAG/EACG | CGI | ADAS‐Cog | MMSE | NOSGER | SGRS | BDRS | CBRS | Others |
| √ | Neuropsychology test | ||||||||
| √ | |||||||||
| √ | |||||||||
| √ | GBS, HRSD | ||||||||
| √ | √ | ||||||||
| GCIS | |||||||||
| EST, Depressiveness Scale | |||||||||
| Psychometric tests | |||||||||
| √ | √ | √ | √ | ||||||
| √ | √ | Psychometric tests |
Abbreviations: ADAS‐Cog= The cognitive part of the Alzheimer's Disease Assessment Scale; BDRS= Blessed Dementia Rating Scale; CBRS= Crichton Behavioural Rating Scale; CGI= Clinical Global Impression; EACG= Echelle d'Appreciation Clinique en Geriatrie, French version of SCAG; EST= Erzigkeit's Short Syndrome test; HRSD= Hamilton Rating Scale for Depression; GBS= Gottfries‐Brane‐Steen Scale; GCIS= Gottschalk Cognitive Impairment Scale; MMSE= Mini Mental State Examination; NOSGER= Nurse's Observational Scale for Geriatric Patients; SCAG= Sandoz Clinical Assessment Geriatric Scale; SGRS= Stockton Geriatric Rating Scale;
(1) Quality of life: no included trials reported this outcome.
(2) Global impression
-
The Sandoz Clinical Assessment Geriatric Scale (SCAG) (Shader 1974) is a physician rating. It consists of 18 items and an overall impression (item 19), all rated on a seven‐point scale. There are five subscores: cognitive disturbances, disturbances in social behaviour, lack of drive, affective disturbances, somatic disturbances. Item 19 was used in Cohn 1984.
-
The Clinical Global Impression (CGI) (Guy 1976) is a global rating of all domains of a patient's current condition. It is a seven‐point scale, from one (very much improved) to seven (very much worse), four indicating no change. The assessment is conducted by the same clinician at both time points with input from relatives or carers. This rating scale was used in Branconnier 1977and Möller 2001.
(3) Functional performance and behavioural disturbances
-
Stockton Geriatric Rating Scale (SGRS) (Pichot 1970) consists of 32 items, each of which is given a score of zero = 'not present', one = 'moderate' or two = 'severe'. The items can be grouped to obtain the factors: disturbance of motivation, disturbance of social behaviour, need of care, and communication disturbances. The subscores of motivation and behavioural disturbances were used in Saldmann 1991.
-
Crichton Behavioural Rating Scale (CBRS) (Robinson 1961) was used to assess mental function, mood and activities of daily living. This rating scale was used in Cox 1981.
-
The French version of SCAG, Echelle d'Appreciation Clinique en Geriatrie (EACG) (Georges 1977), was used in Saldmann 1991 (subscores of behaviour disturbances).
(4) Mood disturbances
-
The French version of SCAG, Echelle d'Appreciation Clinique en Geriatrie (EACG) (Georges 1977), was used in Saldmann 1991 (subscores of emotional disturbances).
-
The Depressiveness Scale (Zerssen 1976) is a self‐rating technique for measuring depression. This rating scale was used in Grossmann 1990.
-
The Hamilton Rating Scale for Depression (HRSD) (Hamilton 1960), is a 21‐question multiple choice questionnaire, which rates the severity of symptoms observed in depression such as low mood, insomnia, agitation, anxiety and weight loss. This rating scale was used in Cucinotta 1987.
(5) Cognitive function
-
The cognitive part of the Alzheimer's Disease Assessment Scale (ADAS‐Cog) (Rosen 1984) comprises 11 individual tests, spoken language ability (zero to five), comprehension of spoken language (zero to five), recall of test instructions (zero to five), word finding difficulty (zero to five), following commands (zero to five), naming object (zero to five), construction drawing (zero to five), ideational praxis (zero to five), orientation (zero to eight), word recall (zero to 10) and word recognition (zero to 12). The total score ranges from zero to 70, the high score indicating greater impairment. This rating scale was used in Emeriau 2000 and Möller 2001.
-
The Mini Mental State Examination (MMSE) (Folstein 1975) was developed as a short test suitable for the elderly with dementia. It concentrates on the cognitive aspects of mental function, and the five sections cover orientation, immediate recall, attention and calculation, delayed recall and language. A maximum score of 30 indicates no impairment. This rating scale was used in Emeriau 2000.
-
Erzigkeit's Short Syndrome test (EST) (Erzigkeit 1977) includes nine subtests that measure psychomotor co‐ordination, attentiveness, immediate and delayed repetition, interference, speed and perception. This rating scale was used in Grossmann 1990.
-
The French version of SCAG, Echelle d'Appreciation Clinique en Geriatrie (EACG) (Georges 1977), was used in Saldmann 1991 (subscore of cognitive disturbances).
(6) Combination Scales
Several scales used in earlier studies combine elements that are now more commonly assessed using separate instruments. Such scales have been used as a different method from 'overall clinical impression' for the systematic global assessment of dementia. These combination scales typically have several subscales, the results of which are sometimes presented separately and can be included in meta‐analyses.
-
Gottfries‐Brane‐Steen Scale (GBS) (Gottfries 1982) is a 26‐item, physician‐assessed observer scale based on caregiver's information and an interview with the patient. It comprises three subscales: motor performance, intellectual and emotional capacity, and a group of six symptoms commonly observed in dementia. This rating scale was used in Cucinotta 1987.
-
Nurse's Observational Scale for Geriatric Patients (NOSGER) (Spiegel 1991) contains 30 items of behaviour, each rated in a five‐point scale according to frequency of occurrence. Item scores are summarized into six dimension scores (memory, instrumental activities of daily life, self‐care activities of daily living, mood, social behaviour, and disturbance behaviour). This rating scale was used in Möller 2001.
-
Blessed Dementia Rating Scale (BDRS) (Blessed 1968) has six sections: the first three measure changes in performance of everyday activities, habits, and personality, interests and drive as answered by the carer. Each section is scored zero (normal) to 28 (severe). The second three sections form the cognitive test, and information, memory and concentration are each assessed on a score of zero (complete failure) to 37 (normal). This rating scale was used in Cucinotta 1987.
-
The Sandoz Clinical Assessment Geriatric Scale (SCAG) (Shader 1974) is a physician rating. It consists of 18 items and an overall impression (item 19), all rated on a seven‐point format. There are five subscores: cognitive disturbances, disturbances in social behaviour, lack of drive, affective disturbances, somatic disturbances. The mean scores were reported in Cohn 1984 and response rates were stated in Möller 2001.
(7) Dependency: no included trials reported this outcome.
(8) Effect on carer: no included trials reported this outcome.
Risk of bias in included studies
The risk of bias in included studies is summarized in Figure 1 and Figure 2.

Methodological quality graph: review authors' judgements about each methodological quality item presented as percentages across all included studies.

Methodological quality summary: review authors' judgements about each methodological quality item for each included study.
Sequence generation
All of the nine included trials mentioned "random". However, only two of the trials used a previously drawn up randomised list (Cucinotta 1987, Möller 2001). The others did not specify the randomisation method used.
Allocation concealment
An adequate method of allocation concealment was reported in two trials (Cucinotta 1987, Möller 2001). The other trial reports did not give any details of allocation concealment. The Cucinotta 1987 study stated that the allocation of participants was on the basis of a randomisation list concealed from the researchers. The Möller 2001 study used a centralised allocation system.
Blinding
Seven of the trial reports simply mentioned "double‐blind" without further description. Cox 1981 and Möller 2001 gave details of how the blinding of participants and investigators was ensured.
Incomplete outcome data
Intention‐to‐treat (ITT) analyses were performed in four trials (Cucinotta 1987, Emeriau 2000, Grossmann 1990, Möller 2001). The other trials had withdrawals post randomisation and did not use ITT analysis. One study did not report the missing participants or withdrawals (Branconnier 1977). The reasons for withdrawal were not reported in three studies: Cohn 1984 (28 withdrawals, 37.3%), Cox 1981 (two withdrawals, 6.3%) and Cucinotta 1987 (one withdrawal, 3.3%). Twelve participants (31.6%) were withdrawn from the Gottschalk 1980 trial, either due to medical disorders (six participants), or due to drop‐out (six participants), and twelve participants (15.4%) withdrew whilst on treatment in the Saldmann 1991 trial (one died, three due to intercurrent concomitant disease, seven lost to follow‐up).
Selective reporting
Seven of the included studies were judged to show selective reporting due to failure to report complete outcome data (Branconnier 1977, Cohn 1984, Cucinotta 1987, Emeriau 2000, Gottschalk 1980, Grossmann 1990, Saldmann 1991). In Möller 2001, the continuous data of rating scales was transformed into a response rate to treatment, defined as a success if the final score was less than baseline. Only the remaining study (Cox 1981) reported all expected outcomes clearly, although the study protocol was not available. Moreover, for five studies it was possible to calculate the missing SDs from either SEs (Cucinotta 1987, Grossmann 1990, Saldmann 1991), or P values (Cohn 1984, Emeriau 2000). The results from Branconnier 1977 and Gottschalk 1980 are presented in the Effects of interventions section, but not included in the meta‐analysis because neither SDs nor P values were available.
In respect of tolerability, five included studies (Branconnier 1977, Cox 1981, Emeriau 2000, Grossmann 1990, Möller 2001) specified the number of adverse effects with clinical manifestation, so that they could be included in a meta‐analysis to address the occurrence of adverse effects. The Cohn 1984 study reported that the active group had a somewhat higher occurrence of gastrointestinal disorders, but without description of data. The Cucinotta 1987 trial stated that no undesired effects were observed, while the Gottschalk 1980 trial failed to give any description on adverse effects. Of those studies which reported reasons for withdrawal, none reported any withdrawals due to adverse effects. Only three studies (Emeriau 2000, Möller 2001, Saldmann 1991) mentioned the number of deaths.
Other potential sources of bias
Lipha Sante Pharmaceuticals were involved in three of the studies. One study declared that they provided funding for the trial (Emeriau 2000), and in the other two studies (Grossmann 1990, Möller 2001) members of the company's staff were co‐authors, although the extent of their involvement in the analyses and report‐writing was unclear.
Effects of interventions
The main analysis is presented in Section 1. In Section 2, results are divided by the subtypes of dementia. In sections 3, the results are presented under different duration of studies.
Section 1. Effect of naftidrofuryl on patients with dementia
We pooled all available data from nine trials into the analysis.
(1) Global Impression: There was a significant difference in the clinical impression of change, as measured by item 19 of SCAG, in favour of naftidrofuryl (MD 2.70 points, 95% CI 0.07 to 5.33, P =0.04) assessed by Cohn 1984. Moreover, there was a significant difference in the response rate of clinical impression, as measured by the CGI, in favour of naftidrofuryl (OR 1.83, 95% CI 1.16 to 2.91, P = 0.01) assessed by Möller 2001. However, the larger dose group (600 mg/day) in this trial produced a non‐significant finding in favour of naftidrofuryl (OR 1.62, 95% CI 0.85 to 3.10), while the lower dose group (400 mg/day) led to a positive result (OR 2.08, 95% CI 1.08 to 4.03). Since no available data were reported in Branconnier 1977, we have to present the conclusion of this study as "no significant differences were observed on the severity of illness, global improvement, or effectiveness index scores on the CGI".
(2) Adverse events (Figure 3): A pooled analysis of these results indicated no significant difference in the odds of adverse events in the naftidrofuryl group as compared with the placebo group (OR 1.00, 95% CI 0.63 to 1.60). No heterogeneity was detected between the studies (I2 = 0%).

Forest plot of comparison: 1 Naftidrofuryl vs. placebo for all included studies, outcome: 1.15 Adverse events.
(3) Functional performance and behaviour (Figure 4): Standardized mean differences were used here due to the different rating scales used. There was a significant difference in change of activities of daily living and behavioural disturbances, as assessed using CBRS (Cox 1981) and SGRS (Saldmann 1991), in favour of naftidrofuryl (‐1.04 standardized points, 95% CI ‐1.73 to ‐0.35, P = 0.003), with a high‐level of heterogeneity (I2 = 54%). The reason remained unclear. Both Cox 1981 and Saldmann 1991 studied mild to moderate senile dementia for two months 300 mg daily use, or three months 400 mg daily use, respectively. Interestingly, the larger the dose used, the smaller the effect was observed. Another clue was that daily multi‐vitamin preparation and potassium 600mg were given three times daily additionally to both groups in Cox 1981.

Forest plot of comparison: 1 Naftidrofuryl vs. placebo for all included studies, outcome: 1.3 Functional performance and behaviour: change from baseline.
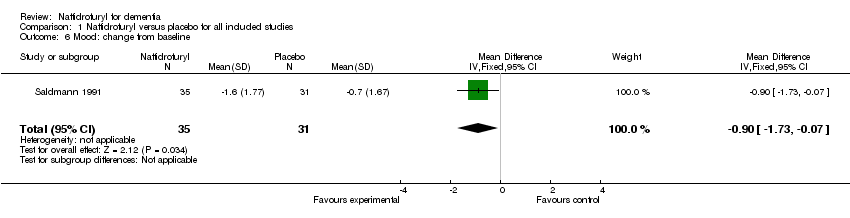
(4) Mood (Figure 5): Standardized mean differences were used here due to the different rating scales used. The patients' mood benefited from the use of naftidrofuryl (‐0.80 standardized points, 95% CI ‐1.26 to ‐0.34, P = 0.0006) with no discernible heterogeneity (I2 = 0%), as assessed on Depressive Scale (Grossmann 1990) and HRSD (Cucinotta 1987). Saldmann 1991 also found a similar result which assessed change from baseline of mood by EACG subscore (MD ‐0.90 points, 95% CI ‐1.73 to ‐0.07, P = 0.03).

Forest plot of comparison: 1 Naftidrofuryl vs. placebo for all included studies, outcome: 1.4 Mood.
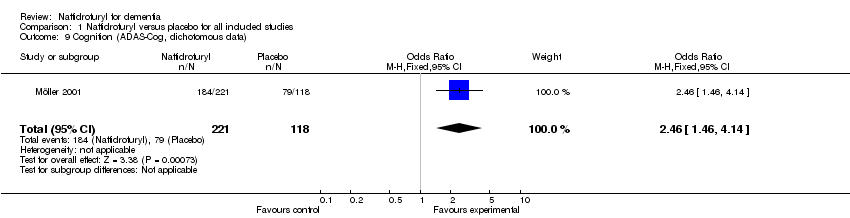
(5) Cognition: Standardized mean differences were used here due to the different rating scales used. The pooled analysis showed a significant improvement in favour of naftidrofuryl (‐0.36 standardized points, 95% CI ‐0.71 to ‐0.02, P = 0.04). No heterogeneity was detected between the studies (I2 = 0%). Moreover, change from baseline of cognition measured by EACG subscore found a significant difference in favour of naftidrofuryl (MD ‐1.45 points, 95% CI ‐2.15 to ‐0.75, P < 0.0001) in Saldmann 1991. Furthermore, the response rate of cognition measured by ADAS‐Cog also found a significant difference in favour of naftidrofuryl (OR 2.46, 95% CI 1.46 to 4.14, P = 0.0007) in Möller 2001. However, Gottschalk 1980 concluded that "No significant change occurred on the Gottschalk Cognitive Impairment Scale scores after 1 to 3 months on either Praxilene or placebo" without usable data.
(6) Combination scales: There was a significant difference in the change of behaviour, mood and cognition, as measured by SCAG, in favour of naftidrofuryl (MD 1.00 points, 95% CI 0.03 to 1.97, P = 0.04) assessed by Cohn 1984. Moreover, Möller 2001 found a significant difference between naftidrofuryl and placebo in functional performance, behaviour, mood and cognition covered by SCAG (OR 2.83, 95% CI 1.68 to 4.78, P < 0.0001). However, the analysis of Cucinotta 1987 found no difference between naftidrofuryl and placebo in functional performance and behaviour, mood and cognition as measured by both GBS (MD 1.40 points, 95% CI ‐9.29 to 12.09, P = 0.80) and BDRS (MD 0.90 points, 95% CI ‐1.47 to 3.27, P = 0.46). Additionally, NOSGER presented an non‐significant difference in favour of naftidrofuryl (OR 1.54, 95% CI 0.98 to 2.42, P = 0.06) in Möller 2001.
(7) Death (Figure 6): The analysis found no relationship between death and naftidrofuryl use (OR 1.13, 95% CI 0.34 to 3.72), with no discernible heterogeneity (I2 = 0%).
Section 2. Subgroup analysis of subtypes of dementia
2.1 Effect of naftidrofuryl on patients with Alzheimer's disease
Two trials were identified that studied the effect of naftidrofuryl on patients with mild Alzheimer's disease (Cucinotta 1987, Grossmann 1990).
(1) Adverse events: Only Grossmann 1990 described the number of adverse events that occurred. The result showed no significant difference in the odds of adverse events in the naftidrofuryl group as compared with the placebo group (OR 1.38, 95% CI 0.45 to 4.17).
(2) Mood: Patients taking naftidrofuryl had significantly less worsening of mood (‐0.82 standardized points, 95% CI ‐1.38 to ‐0.25, P = 0.004), as assessed on HRSD (Cucinotta 1987) and Depressiveness scale (Grossmann 1990).
(3) Cognition: There was no relationship between naftidrofuryl use and cognitive function (MD 0.30 points, 95% CI ‐3.99 to 4.59, P = 0.89), as measured by EST (Grossmann 1990).
(4) Combination scales: The analysis of Cucinotta 1987 found no difference between naftidrofuryl and placebo in functional performance and behaviour, mood and cognition as measured by both GBS (MD 1.40 points, 95% CI ‐9.29 to 12.09, P = 0.80) and BDRS (MD 0.90 points, 95% CI ‐1.47 to 3.27, P = 0.46).
2.2 Effect of naftidrofuryl on patients with vascular dementia and mixed dementia
Three trials studied the effect of naftidrofuryl on patients with mild to severe vascular dementia and mixed dementia (Emeriau 2000, Grossmann 1990, Möller 2001).
(1) Global Impression (Figure 8): There was a significant difference in favour of naftidrofuryl on response rate measured by CGI (OR 1.83, 95% CI 1.16 to 2.91, P = 0.01). The larger dose group (600 mg/day) produced an OR estimate of 1.62 (95% CI 0.85 to 3.10, P = 0.15), a non‐significant finding in favour of naftidrofuryl (Möller 2001).
(2) Adverse events (Figure 7): A pooled analysis of these results indicated no significant difference in the risk of adverse events in the naftidrofuryl group as compared with the placebo group (OR 0.85, 95% CI 0.49 to 1.45). No heterogeneity was detected between the studies (I2 = 0%).
(3) Mood: A significant difference was observed in the improvement of mood, as measured by the Depressive Scale, in favour of naftidrofuryl (MD ‐7.80 points, 95% CI ‐14.90 to ‐0.70, P = 0.03) assessed by Grossmann 1990.
(4) Cognition (Figure 6): A pooled analysis of two trials found patients taking naftidrofuryl had significantly less worsening of cognition (‐0.46 standardized points, 95% CI ‐0.84 to ‐0.08, P = 0.02), as assessed by ADAS‐Cog (Emeriau 2000) and EST (Grossmann 1990). No heterogeneity was detected between the studies (I2 = 0%). Moreover, Emeriau 2000 assessed improvement of cognition by MMSE found a significant difference in favour of naftidrofuryl (2.08 points, P = 0.008). In respect to response rate of cognition, naftidrofuryl had significantly improved cognitive function (OR 2.46, 95% CI 1.46 to 4.14, P = 0.0007), as measured by response rate of ADAS‐Cog in Möller 2001.

Forest plot of comparison: 3 Naftidrofuryl vs. placebo for vascular dementia and mixed dementia, outcome: 3.3 Cognition.
(5) Combination scales: Möller 2001 found a significant difference between naftidrofuryl and placebo in functional performance, behaviour, mood and cognition covered by SCAG (OR 2.83, 95% CI 1.68 to 4.78, P < 0.0001). However, NOSGER presented a different result (OR 1.54, 95% CI 0.98 to 2.41, P = 0.06).
(6) Death (Figure 10): The analysis found no relationship between death and naftidrofuryl use (OR 1.19, 95% CI 0.32 to 4.46).
2.3 Effect of naftidrofuryl on patients with unspecified dementia
Four trials were identified that compared the effect of naftidrofuryl and placebo in patients with mild to moderate unspecified senile dementia (Branconnier 1977, Cohn 1984, Cox 1981, Saldmann 1991). One trial addressed unspecified dementia with impaired cognitive functioning (Gottschalk 1980).
(1) Global Impression: There was a significant difference in the clinical impression of change, as measured by item 19 of SCAG, in favour of naftidrofuryl (MD 2.70 points, 95% CI 0.07 to 5.33, P = 0.04) assessed by Cohn 1984. Since no available data were reported in Branconnier 1977, we have to present the conclusion of this study as "no significant differences were observed on the severity of illness, global improvement, or effectiveness index scores on the CGI".
(2) Adverse events (Figure 11): Three studies (Branconnier 1977, Cox 1981, Saldmann 1991) described the number of adverse events that occurred. A pooled analysis of these results indicated no significant difference in the odds of adverse events in the naftidrofuryl group as compared with the placebo group (OR 3.31, 95% CI 0.72 to 15.31). No heterogeneity was detected between the studies (I2 = 0%).
(3) Functional performance and behaviour (Figure 4): Standardized mean differences were used here due to the different rating scales used. There was a significant difference in change of activities of daily living and behavioural disturbances, as assessed using CBRS (Cox 1981) and SGRS (Saldmann 1991), in favour of naftidrofuryl (‐1.04 standardized points, 95% CI ‐1.73 to ‐0.35, P = 0.003). However, high‐level heterogeneity was detected between the studies (I2 = 54%). The possible reason for high‐level heterogeneity has been mentioned above (Section 1 (4)).
(4) Mood: Saldmann 1991 assessed change of mood by EACG subscore and found a significant difference in favour of naftidrofuryl (MD ‐0.90 points, 95% CI ‐1.73 to ‐0.07, P = 0.03).
(5) Cognition: Gottschalk 1980 concluded that "No significant change occurred on the Gottschalk Cognitive Impairment Scale scores after 1 to 3 months on either Praxilene or placebo". However, change from baseline of cognition measured by EACG subscore found a significant difference in favour of naftidrofuryl (‐1.45 points, 95% CI ‐2.15 to ‐0.75, P < 0.0001) in Saldmann 1991.
(6) Combination scales: There was a significant difference in the change of behaviour, mood and cognition, as measured by SCAG, in favour of naftidrofuryl (MD 1.00 points, 95% CI 0.03 to 1.97, P = 0.04) assessed by Cohn 1984.
(7) Death: Only Saldmann 1991 reported the number of deaths in participants. The analysis found no relationship between death and naftidrofuryl use (OR 0.88, 95% CI 0.05 to 14.73).
Section 3. Subgroup analysis of duration of treatment
3.1 Effect of naftidrofuryl on patients with dementia: short‐term studies
Six trials were pooled in which patients were treated for less than six months (Branconnier 1977, Cohn 1984, Cox 1981, Gottschalk 1980, Grossmann 1990, Saldmann 1991). Since no available data were obtained from Gottschalk 1980, the original conclusions are presented in the following corresponding outcomes. All of the trials followed up patients for two to four months.
(1) Global Impression: There was a significant difference in the clinical impression of change, as measured by item 19 of SCAG, in favour of naftidrofuryl (MD 2.70 points, 95% CI 0.07 to 5.33, P = 0.04) assessed by Cohn 1984. Since no data were reported in Branconnier 1977, we have to present the conclusion of this study as "no significant differences were observed on the severity of illness, global improvement, or efficacy index scores on the CGI".
(2) Adverse events (Figure 12): Four studies (Branconnier 1977, Cox 1981, Grossmann 1990, Saldmann 1991) contributed to these results. A pooled analysis found no significant difference between naftidrofuryl and placebo (OR 1.90, 95% CI 0.78 to 4.59). No heterogeneity was detected between the studies (I2 = 0%).
(3) Functional performance and behaviour (Figure 4): Standardized mean differences were used here due to the different rating scales used. There was a significant difference in change of activities of daily living and behavioural disturbances, as assessed using CBRS (Cox 1981) and SGRS (Saldmann 1991), in favour of naftidrofuryl (‐1.04 standardized points, 95% CI ‐1.73 to ‐0.35, P = 0.003), with a high‐level heterogeneity (I2 = 54%). The possible reason for high‐level heterogeneity had been mentioned above (Section 1 (4)).
(4) Mood: Patients taking naftidrofuryl had significantly less worsening of mood (MD ‐5.50 points, 95% CI ‐9.82 to ‐1.18, P = 0.01), as assessed by the Depressive Scale (Grossmann 1990). Moreover, Saldmann 1991 assessed change of mood by EACG sub‐score and found a significant difference in favour of naftidrofuryl (MD ‐0.90 points, 95% CI ‐1.73 to ‐0.07, P = 0.03).
(5) Cognition: There was no relationship between naftidrofuryl use and cognitive function (MD ‐0.90 points, 95% CI ‐3.84 to 2.04, P = 0.55), as measured by EST (Grossmann 1990). Moreover, Gottschalk 1980 concluded that "No significant change occurred on the Gottschalk Cognitive Impairment Scale scores after 1 to 3 months on either Praxilene or placebo". However, change from baseline of cognition measured by EACG sub‐score found a significant difference in favour of naftidrofuryl (‐1.45 points, 95% CI ‐2.15 to ‐0.75, P < 0.0001) in Saldmann 1991.
(6) Combination scales: The analysis found a significant difference in the change of behaviour, mood and cognition, as measured by SCAG , in favour of naftidrofuryl (MD 1.00 points, 95% CI 0.03 to 1.97, P = 0.04) assessed by Cohn 1984.
(7) Death: Only Saldmann 1991 reported the number of deaths in participants. The analysis found no relationship between death and naftidrofuryl use (OR 0.88, 95% CI 0.05 to 14.73).
3.2 Effect of naftidrofuryl on patients with dementia: long‐term studies
Three trials were identified that treated patients for more than six months (Cucinotta 1987, Emeriau 2000, Möller 2001). Möller 2001 followed up patients for six months, while the other two studies followed up for 12 months.
(1) Global Impression: There was a significant difference in the response rate of clinical impression, as measured by the CGI, in favour of naftidrofuryl (OR 1.83, 95% CI 1.16 to 2.91, P = 0.01) assessed by Möller 2001. However, the larger dose group (600 mg/day) in this trial produced a non‐significant finding in favour of naftidrofuryl (OR 1.62, 95% CI 0.85 to 3.10), while the lower dose group (400 mg/day) led to a positive result (OR 2.08, 95% CI 1.08 to 4.03).
(2) Adverse events (Figure 13): Emeriau 2000 and Möller 2001 described the number of adverse events occurred. A pooled analysis of these results indicated no significant difference between naftidrofuryl and placebo (OR 0.76, 95% CI 0.43 to 1.34). No heterogeneity was detected between the studies (I2 = 0%).
(3) Mood: Patients taking naftidrofuryl had significantly less worsening of mood (MD ‐1.03 points, 95% CI ‐1.80 to ‐0.26, P = 0.009), as assessed on HRSD (Cucinotta 1987).
(4) Cognition: There was a significant difference in favour of naftidrofuryl use (MD ‐0.48 points, 95% CI ‐0.92 to ‐0.05, P = 0.03), as measured by ADAS‐Cog (Emeriau 2000). Moreover, the response rate of cognition measured by ADAS‐Cog also found a significant difference in favour of naftidrofuryl (OR 2.46, 95% CI 1.46 to 4.14, P = 0.0007) in Möller 2001. In addition, Emeriau 2000 assessed improvement of cognition by MMSE found a significant difference in favour of naftidrofuryl (2.08 points, P = 0.008).
(5) Combination scales : The analysis of Cucinotta 1987 found no difference between naftidrofuryl and placebo in functional performance and behaviour, mood and cognition as measured by both GBS (MD 1.40 points, 95% CI ‐9.29 to 12.09, P = 0.80) and BDRS (MD 0.90 points, 95% CI ‐1.47 to 3.27, P = 0.46). On the other hand, Möller 2001 found a significant difference between naftidrofuryl and placebo in functional performance, behaviour, mood and cognition measured by the response rate on SCAG (OR 2.83, 95% CI 1.68 to 4.78, P < 0.0001), but not on NOSGER (OR 1.54, 95% CI 0.98 to 2.42, P = 0.06).
(6) Death (Figure 14): Emeriau 2000 and Möller 2001 reported the number of deaths in participants. A pooled analysis found no relationship between death and naftidrofuryl use (OR 1.19, 95% CI 0.32 to 4.46).
Discussion
The results indicate a beneficial effect of naftidrofuryl on functional performance, behaviour, cognitive function, and mood disturbance in patients with dementia. However, there is little supporting evidence on clinical global impression. Cohn 1984 reported a positive result on this outcome, Branconnier 1977/1978 failed to report it and Möller 2000/2001 found a positive result confined to the lower dose group. Thus, it is hard to say whether or not the beneficial effects of naftidrofuryl on various symptom scales are reliably translated into clinically detectable changes.
Möller's study (Möller 2001) reporting a significant benefit of naftidrofuryl on global impression was conducted in patients with mild to severe vascular and mixed dementia. Because the positive result was confined to the lower dosage group, the results should be viewed with some caution. However, results on all other outcomes reported for patients with vascular and mixed dementia were also positive. For patients with unspecified senile dementia, the results also showed that functional performance, mood and behaviour of patients benefited from the use of naftidrofuryl, but no evidence of a benefit on cognitive function. One study (Cohn 1984) reported benefit on clinical global impression, but another study (Branconnier 1977) failed to report on this outcome. For Alzheimer's disease, a beneficial effect was found on mood on one scale in one trial; results on more global symptom scales were negative.
Dividing the studies by duration, the shorter studies suggest an early benefit on functional performance, cognition, behaviour and mood decline, while the pooled analysis of longer studies found a similar benefit on cognition and mood.
In respect of safety, there is some evidence that naftidrofuryl is well‐tolerated by patients with dementia. All pooled subgroup analysis showed that there did not seem to be a disproportionate number of serious adverse events or deaths in the naftidrofuryl group compared with the placebo group. Moreover, no included trials reported severe adverse effects due to treatment with naftidrofuryl, and two trials (Emeriau 2000, Möller 2000/2001) reported that no clinically significant abnormalities in laboratory test results were observed with a greater frequency in the naftidrofuryl group. However, Cohn 1984 reported that the naftidrofuryl group had a somewhat higher occurrence of gastrointestinal disorders, but without further details. All studies included in this review gave naftidrofuryl orally. Earlier systematic reviews reported that intravenous naftidrofuryl given to patients with critical limb ischaemia (Smith 2008) and acute stroke (Leonardi‐Bee 2007) might be associated with more adverse events, including severe adverse events, and De Backer 2005 found an increased risk of minor adverse events in patients with intermittent claudication taking naftidrofuryl orally (OR 1.99, 95% CI 0.96 to 4.11, P = 0.06).
The identified studies partially addressed the objectives of the review. First, the participants of most trials were restricted to unspecified or senile dementia. Severe Alzheimer's disease did not feature in the identified studies, and severe vascular and mixed dementia figured in a single trial (Möller 2001). Secondly, the design of included studies overlooks some important outcomes, for example quality of life, dependency and effect on carer. These outcomes should be explored in further studies in order to assess naftidrofuryl for dementia comprehensively.
Although 847 randomised participants were pooled into analysis, the overall body of evidence is impaired by the potentially large risk of bias of identified studies. The studies are diverse in terms of the diagnostic criteria, types of participants and the selection of outcomes. The studies used a variety of rating scales to assess the outcome of treatment, some of which are not in use today. Because most studies were conducted between 1980 and 1990, the methods of randomisation, allocation and blinding were not described in detail. Few studies performed an ITT analysis, and some had a large number lost to follow‐up (Cohn 1984, Gottschalk 1980). Moreover, only one trial (Cox 1981) provided the complete data as mean ± SD, while other studies either only reported the mean, or only presented P values from their own analysis.
In summary, the currently low‐quality evidence shows that naftidrofuryl may have benefits on performance, behaviour, cognition, and mood for patients with dementia. However, the evidence of benefit on global impression is very weak. Naftidrofuryl appears to be safe with no excess side effects compared with placebo.

Methodological quality graph: review authors' judgements about each methodological quality item presented as percentages across all included studies.

Methodological quality summary: review authors' judgements about each methodological quality item for each included study.

Forest plot of comparison: 1 Naftidrofuryl vs. placebo for all included studies, outcome: 1.15 Adverse events.

Forest plot of comparison: 1 Naftidrofuryl vs. placebo for all included studies, outcome: 1.3 Functional performance and behaviour: change from baseline.

Forest plot of comparison: 1 Naftidrofuryl vs. placebo for all included studies, outcome: 1.4 Mood.

Forest plot of comparison: 3 Naftidrofuryl vs. placebo for vascular dementia and mixed dementia, outcome: 3.3 Cognition.

Comparison 1 Naftidrofuryl versus placebo for all included studies, Outcome 1 Global impression (SCAG).

Comparison 1 Naftidrofuryl versus placebo for all included studies, Outcome 2 Global impression (CGI).

Comparison 1 Naftidrofuryl versus placebo for all included studies, Outcome 3 Adverse events.

Comparison 1 Naftidrofuryl versus placebo for all included studies, Outcome 4 Functional performance and behaviour.

Comparison 1 Naftidrofuryl versus placebo for all included studies, Outcome 5 Mood.
Comparison 1 Naftidrofuryl versus placebo for all included studies, Outcome 6 Mood: change from baseline.

Comparison 1 Naftidrofuryl versus placebo for all included studies, Outcome 7 Cognition.

Comparison 1 Naftidrofuryl versus placebo for all included studies, Outcome 8 Cognition: EACG, change from baseline.
Comparison 1 Naftidrofuryl versus placebo for all included studies, Outcome 9 Cognition (ADAS‐Cog, dichotomous data).

Comparison 1 Naftidrofuryl versus placebo for all included studies, Outcome 10 Combination scales: SCAG, change from baseline.

Comparison 1 Naftidrofuryl versus placebo for all included studies, Outcome 11 Combination scales: SCAG, dichotomous data.

Comparison 1 Naftidrofuryl versus placebo for all included studies, Outcome 12 Combination scales (GBS).

Comparison 1 Naftidrofuryl versus placebo for all included studies, Outcome 13 Combination scales (BDRS).

Comparison 1 Naftidrofuryl versus placebo for all included studies, Outcome 14 Combination scales: NOSGER, dichotomous data.

Comparison 1 Naftidrofuryl versus placebo for all included studies, Outcome 15 Death.

Comparison 2 Naftidrofuryl versus placebo for Alzheimer's disease, Outcome 1 Adverse events.

Comparison 2 Naftidrofuryl versus placebo for Alzheimer's disease, Outcome 2 Mood.

Comparison 2 Naftidrofuryl versus placebo for Alzheimer's disease, Outcome 3 Cognition (EST).

Comparison 2 Naftidrofuryl versus placebo for Alzheimer's disease, Outcome 4 Combination scales: GBS.

Comparison 2 Naftidrofuryl versus placebo for Alzheimer's disease, Outcome 5 Combination scales: BDRS.

Comparison 3 Naftidrofuryl versus placebo for vascular dementia and mixed dementia, Outcome 1 Global impression (CGI).

Comparison 3 Naftidrofuryl versus placebo for vascular dementia and mixed dementia, Outcome 2 Adverse events.

Comparison 3 Naftidrofuryl versus placebo for vascular dementia and mixed dementia, Outcome 3 Mood (Depressive scale).

Comparison 3 Naftidrofuryl versus placebo for vascular dementia and mixed dementia, Outcome 4 Cognition.

Comparison 3 Naftidrofuryl versus placebo for vascular dementia and mixed dementia, Outcome 5 Cognition: ADAS‐Cog, dichotomous data.

Comparison 3 Naftidrofuryl versus placebo for vascular dementia and mixed dementia, Outcome 6 Combination scales: NOSGER, dichotomous data.

Comparison 3 Naftidrofuryl versus placebo for vascular dementia and mixed dementia, Outcome 7 Combination scales: SCAG, dichotomous data.

Comparison 3 Naftidrofuryl versus placebo for vascular dementia and mixed dementia, Outcome 8 Death.

Comparison 4 Naftidrofuryl versus placebo for unspecified dementia, Outcome 1 Global impression: change from baseline.

Comparison 4 Naftidrofuryl versus placebo for unspecified dementia, Outcome 2 Adverse events.

Comparison 4 Naftidrofuryl versus placebo for unspecified dementia, Outcome 3 Functional performance and behaviour: change from baseline.

Comparison 4 Naftidrofuryl versus placebo for unspecified dementia, Outcome 4 Mood (EACG, change from baseline).

Comparison 4 Naftidrofuryl versus placebo for unspecified dementia, Outcome 5 Cognition (EACG, change from baseline).

Comparison 4 Naftidrofuryl versus placebo for unspecified dementia, Outcome 6 Combination scales (SCAG).

Comparison 4 Naftidrofuryl versus placebo for unspecified dementia, Outcome 7 Death.

Comparison 5 Naftidrofuryl versus placebo for dementia, all 2 to 3 months studies, Outcome 1 Global impression (SCAG).

Comparison 5 Naftidrofuryl versus placebo for dementia, all 2 to 3 months studies, Outcome 2 Adverse events.

Comparison 5 Naftidrofuryl versus placebo for dementia, all 2 to 3 months studies, Outcome 3 Functional performance and behaviour: change from baseline.

Comparison 5 Naftidrofuryl versus placebo for dementia, all 2 to 3 months studies, Outcome 4 Mood (Depressive scale).

Comparison 5 Naftidrofuryl versus placebo for dementia, all 2 to 3 months studies, Outcome 5 Mood (EACG, change from baseline).

Comparison 5 Naftidrofuryl versus placebo for dementia, all 2 to 3 months studies, Outcome 6 Cognition (EST).

Comparison 5 Naftidrofuryl versus placebo for dementia, all 2 to 3 months studies, Outcome 7 Cognition (EACG change from baseline).

Comparison 5 Naftidrofuryl versus placebo for dementia, all 2 to 3 months studies, Outcome 8 Combination scales (SCAG).

Comparison 5 Naftidrofuryl versus placebo for dementia, all 2 to 3 months studies, Outcome 9 Death.

Comparison 6 Naftidrofuryl versus placebo for dementia, all 6 to 12 months studies, Outcome 1 Global impression (CGI, continuous data).

Comparison 6 Naftidrofuryl versus placebo for dementia, all 6 to 12 months studies, Outcome 2 Adverse effects.

Comparison 6 Naftidrofuryl versus placebo for dementia, all 6 to 12 months studies, Outcome 3 Mood (HRSD).

Comparison 6 Naftidrofuryl versus placebo for dementia, all 6 to 12 months studies, Outcome 4 Cognition (ADAS‐Cog, continuous data).

Comparison 6 Naftidrofuryl versus placebo for dementia, all 6 to 12 months studies, Outcome 5 Cognition (ADAS‐Cog, dichotomous data).

Comparison 6 Naftidrofuryl versus placebo for dementia, all 6 to 12 months studies, Outcome 6 Combination scales: GBS.

Comparison 6 Naftidrofuryl versus placebo for dementia, all 6 to 12 months studies, Outcome 7 Combination scales: BDRS.

Comparison 6 Naftidrofuryl versus placebo for dementia, all 6 to 12 months studies, Outcome 8 Combination scales: SCAG, dichotomous data.

Comparison 6 Naftidrofuryl versus placebo for dementia, all 6 to 12 months studies, Outcome 9 Combination scales: NOSGER, dichotomous data.

Comparison 6 Naftidrofuryl versus placebo for dementia, all 6 to 12 months studies, Outcome 10 Death.
| Study | Number randomised | Diagnosis | Severity of disease | Mean age (SD) | % female | Active Rx | duration (months) |
| 60 | senile organic brain syndrome | mild | Active: 69.7 (6.2) Control: 68.5 (5.4) | 45.0 | 300 mg/day | 3 | |
| 75 | senile dementia | moderate | 75 | not reported | 400 mg/day | 3 | |
| 32 | senile dementia | mild to moderate | Active: 82.6 (5.7) Control: 80.9 (6.4) | 18.8 | 300 mg/day plus daily multi‐vitamin preparation and potassium 600mg t.i.d. | 2 | |
| 30 | SDAT | mild | Active: 82.6 (5.7) Control: 80.9 (6.4) | 66.7 | 600 mg/day | 12 | |
| 96 | VD and MD | mild to moderate | Active: 77 (5.7) Control: 76.5 (6.3) | 79.8 | 600 mg/day | 12 | |
| 38 | dementia | moderate to severe | 76 | 57.9 | 400 mg/day | 3 | |
| 60 | SDAT (47%) MID (24%) MD (29%) | mild to moderate | Active: 77.8 (5.3) Control: 77.3 (6.3) | 60.8 | 600 mg/day | 2 | |
| 378 | VD or MD | mild to severe | Active 1: 71.5 (7.7) Active 2: 70.6 (8.2) Control: 72 (8.0) | 54.6 | Active 1: 600 mg/day Active 2: 400 mg/day | 6 | |
| 78 | senile dementia | mild to moderate | Active: 77.1 (4.6) Control: 78.9 (5.4) | 84.8 | 400 mg/day | 3 | |
| Abbreviations: MD = mixed Alzheimer's disease and vascular dementia; MID = multi‐infarct dementia; Rx = treatment; SDAT= Senile Dementia of the Alzheimer Type; t.i.d. = three times daily; VD = vascular dementia. | |||||||
| Study | SCAG/EACG | CGI | ADAS‐Cog | MMSE | NOSGER | SGRS | BDRS | CBRS | Others |
| √ | Neuropsychology test | ||||||||
| √ | |||||||||
| √ | |||||||||
| √ | GBS, HRSD | ||||||||
| √ | √ | ||||||||
| GCIS | |||||||||
| EST, Depressiveness Scale | |||||||||
| Psychometric tests | |||||||||
| √ | √ | √ | √ | ||||||
| √ | √ | Psychometric tests | |||||||
| Abbreviations: ADAS‐Cog= The cognitive part of the Alzheimer's Disease Assessment Scale; BDRS= Blessed Dementia Rating Scale; CBRS= Crichton Behavioural Rating Scale; CGI= Clinical Global Impression; EACG= Echelle d'Appreciation Clinique en Geriatrie, French version of SCAG; EST= Erzigkeit's Short Syndrome test; HRSD= Hamilton Rating Scale for Depression; GBS= Gottfries‐Brane‐Steen Scale; GCIS= Gottschalk Cognitive Impairment Scale; MMSE= Mini Mental State Examination; NOSGER= Nurse's Observational Scale for Geriatric Patients; SCAG= Sandoz Clinical Assessment Geriatric Scale; SGRS= Stockton Geriatric Rating Scale; | |||||||||
| Outcome or subgroup title | No. of studies | No. of participants | Statistical method | Effect size |
| 1 Global impression (SCAG) Show forest plot | 1 | 47 | Mean Difference (IV, Fixed, 95% CI) | 2.7 [0.07, 5.33] |
| 2 Global impression (CGI) Show forest plot | 1 | 339 | Odds Ratio (M‐H, Fixed, 95% CI) | 1.83 [1.16, 2.91] |
| 3 Adverse events Show forest plot | 6 | 615 | Odds Ratio (M‐H, Fixed, 95% CI) | 1.00 [0.63, 1.60] |
| 4 Functional performance and behaviour Show forest plot | 2 | 96 | Std. Mean Difference (IV, Random, 95% CI) | ‐1.04 [‐1.73, ‐0.35] |
| 4.1 CBRS | 1 | 30 | Std. Mean Difference (IV, Random, 95% CI) | ‐1.47 [‐2.29, ‐0.65] |
| 4.2 SGRS | 1 | 66 | Std. Mean Difference (IV, Random, 95% CI) | ‐0.75 [‐1.25, ‐0.25] |
| 5 Mood Show forest plot | 2 | 81 | Std. Mean Difference (IV, Fixed, 95% CI) | ‐0.80 [‐1.26, ‐0.34] |
| 5.1 HRSD | 1 | 30 | Std. Mean Difference (IV, Fixed, 95% CI) | ‐1.03 [‐1.80, ‐0.26] |
| 5.2 Depressive Scale | 1 | 51 | Std. Mean Difference (IV, Fixed, 95% CI) | ‐0.67 [‐1.24, ‐0.10] |
| 6 Mood: change from baseline Show forest plot | 1 | 66 | Mean Difference (IV, Fixed, 95% CI) | ‐0.90 [‐1.73, ‐0.07] |
| 7 Cognition Show forest plot | 2 | 135 | Std. Mean Difference (IV, Random, 95% CI) | ‐0.36 [‐0.71, ‐0.02] |
| 7.1 ADAS‐Cog | 1 | 84 | Std. Mean Difference (IV, Random, 95% CI) | ‐0.48 [‐0.92, ‐0.05] |
| 7.2 EST | 1 | 51 | Std. Mean Difference (IV, Random, 95% CI) | ‐0.17 [‐0.72, 0.38] |
| 8 Cognition: EACG, change from baseline Show forest plot | 1 | 66 | Mean Difference (IV, Fixed, 95% CI) | ‐1.45 [‐2.15, ‐0.75] |
| 9 Cognition (ADAS‐Cog, dichotomous data) Show forest plot | 1 | 339 | Odds Ratio (M‐H, Fixed, 95% CI) | 2.46 [1.46, 4.14] |
| 10 Combination scales: SCAG, change from baseline Show forest plot | 1 | 47 | Mean Difference (IV, Fixed, 95% CI) | 1.00 [0.03, 1.97] |
| 11 Combination scales: SCAG, dichotomous data Show forest plot | 1 | 339 | Odds Ratio (M‐H, Fixed, 95% CI) | 2.83 [1.68, 4.78] |
| 12 Combination scales (GBS) Show forest plot | 1 | 30 | Mean Difference (IV, Fixed, 95% CI) | 1.40 [‐9.29, 12.09] |
| 13 Combination scales (BDRS) Show forest plot | 1 | 30 | Mean Difference (IV, Fixed, 95% CI) | 0.90 [‐1.47, 3.27] |
| 14 Combination scales: NOSGER, dichotomous data Show forest plot | 1 | 339 | Odds Ratio (M‐H, Fixed, 95% CI) | 1.54 [0.98, 2.42] |
| 15 Death Show forest plot | 3 | 499 | Odds Ratio (M‐H, Fixed, 95% CI) | 1.13 [0.34, 3.72] |
| Outcome or subgroup title | No. of studies | No. of participants | Statistical method | Effect size |
| 1 Adverse events Show forest plot | 1 | 60 | Odds Ratio (M‐H, Fixed, 95% CI) | 1.38 [0.45, 4.17] |
| 2 Mood Show forest plot | 2 | 54 | Std. Mean Difference (IV, Fixed, 95% CI) | ‐0.82 [‐1.38, ‐0.25] |
| 3 Cognition (EST) Show forest plot | 1 | 24 | Mean Difference (IV, Fixed, 95% CI) | 0.30 [‐3.99, 4.59] |
| 4 Combination scales: GBS Show forest plot | 1 | 30 | Mean Difference (IV, Fixed, 95% CI) | 1.40 [‐9.29, 12.09] |
| 5 Combination scales: BDRS Show forest plot | 1 | 30 | Mean Difference (IV, Fixed, 95% CI) | 0.90 [‐1.47, 3.27] |
| Outcome or subgroup title | No. of studies | No. of participants | Statistical method | Effect size |
| 1 Global impression (CGI) Show forest plot | 1 | 339 | Odds Ratio (M‐H, Fixed, 95% CI) | 1.83 [1.15, 2.91] |
| 1.1 400mg/day | 1 | 172 | Odds Ratio (M‐H, Fixed, 95% CI) | 2.08 [1.08, 4.03] |
| 1.2 600mg/day | 1 | 167 | Odds Ratio (M‐H, Fixed, 95% CI) | 1.62 [0.85, 3.10] |
| 2 Adverse events Show forest plot | 3 | 460 | Odds Ratio (M‐H, Fixed, 95% CI) | 0.85 [0.49, 1.45] |
| 3 Mood (Depressive scale) Show forest plot | 1 | 27 | Mean Difference (IV, Fixed, 95% CI) | ‐7.80 [‐14.90, ‐0.70] |
| 4 Cognition Show forest plot | 2 | 111 | Std. Mean Difference (IV, Fixed, 95% CI) | ‐0.46 [‐0.84, ‐0.08] |
| 4.1 ADAS‐Cog | 1 | 84 | Std. Mean Difference (IV, Fixed, 95% CI) | ‐0.48 [‐0.92, ‐0.05] |
| 4.2 EST | 1 | 27 | Std. Mean Difference (IV, Fixed, 95% CI) | ‐0.39 [‐1.15, 0.38] |
| 5 Cognition: ADAS‐Cog, dichotomous data Show forest plot | 1 | 278 | Odds Ratio (M‐H, Fixed, 95% CI) | 2.44 [1.36, 4.35] |
| 5.1 400mg/day | 1 | 140 | Odds Ratio (M‐H, Fixed, 95% CI) | 2.67 [1.16, 6.11] |
| 5.2 600mg/day | 1 | 138 | Odds Ratio (M‐H, Fixed, 95% CI) | 2.24 [0.99, 5.04] |
| 6 Combination scales: NOSGER, dichotomous data Show forest plot | 1 | 339 | Odds Ratio (M‐H, Fixed, 95% CI) | 1.54 [0.98, 2.41] |
| 6.1 400 mg/day | 1 | 172 | Odds Ratio (M‐H, Fixed, 95% CI) | 1.63 [0.86, 3.09] |
| 6.2 600 mg/day | 1 | 167 | Odds Ratio (M‐H, Fixed, 95% CI) | 1.45 [0.77, 2.74] |
| 7 Combination scales: SCAG, dichotomous data Show forest plot | 1 | 339 | Odds Ratio (M‐H, Fixed, 95% CI) | 2.83 [1.68, 4.78] |
| 7.1 400 mg/day | 1 | 172 | Odds Ratio (M‐H, Fixed, 95% CI) | 2.71 [1.29, 5.66] |
| 7.2 600 mg/day | 1 | 167 | Odds Ratio (M‐H, Fixed, 95% CI) | 2.96 [1.41, 6.22] |
| 8 Death Show forest plot | 2 | 433 | Odds Ratio (M‐H, Fixed, 95% CI) | 1.19 [0.32, 4.46] |
| Outcome or subgroup title | No. of studies | No. of participants | Statistical method | Effect size |
| 1 Global impression: change from baseline Show forest plot | 1 | 47 | Mean Difference (IV, Fixed, 95% CI) | 2.7 [0.07, 5.33] |
| 2 Adverse events Show forest plot | 3 | 122 | Odds Ratio (M‐H, Fixed, 95% CI) | 3.31 [0.72, 15.31] |
| 3 Functional performance and behaviour: change from baseline Show forest plot | 2 | 96 | Std. Mean Difference (IV, Random, 95% CI) | ‐1.04 [‐1.73, ‐0.35] |
| 3.1 CBRS | 1 | 30 | Std. Mean Difference (IV, Random, 95% CI) | ‐1.47 [‐2.29, ‐0.65] |
| 3.2 SGRS | 1 | 66 | Std. Mean Difference (IV, Random, 95% CI) | ‐0.75 [‐1.25, ‐0.25] |
| 4 Mood (EACG, change from baseline) Show forest plot | 1 | 66 | Mean Difference (IV, Fixed, 95% CI) | ‐0.90 [‐1.73, ‐0.07] |
| 5 Cognition (EACG, change from baseline) Show forest plot | 1 | 66 | Mean Difference (IV, Fixed, 95% CI) | ‐1.45 [‐2.15, ‐0.75] |
| 6 Combination scales (SCAG) Show forest plot | 1 | 47 | Mean Difference (IV, Fixed, 95% CI) | 1.00 [0.03, 1.97] |
| 7 Death Show forest plot | 1 | 66 | Odds Ratio (M‐H, Fixed, 95% CI) | 0.88 [0.05, 14.73] |
| Outcome or subgroup title | No. of studies | No. of participants | Statistical method | Effect size |
| 1 Global impression (SCAG) Show forest plot | 1 | 47 | Mean Difference (IV, Fixed, 95% CI) | 2.7 [0.07, 5.33] |
| 2 Adverse events Show forest plot | 4 | 182 | Odds Ratio (M‐H, Fixed, 95% CI) | 1.90 [0.78, 4.59] |
| 3 Functional performance and behaviour: change from baseline Show forest plot | 2 | 82 | Std. Mean Difference (IV, Fixed, 95% CI) | ‐0.81 [‐1.28, ‐0.34] |
| 3.1 CBRS | 1 | 16 | Std. Mean Difference (IV, Fixed, 95% CI) | ‐1.23 [‐2.58, 0.12] |
| 3.2 SGRS | 1 | 66 | Std. Mean Difference (IV, Fixed, 95% CI) | ‐0.75 [‐1.25, ‐0.25] |
| 4 Mood (Depressive scale) Show forest plot | 1 | 51 | Mean Difference (IV, Fixed, 95% CI) | ‐5.5 [‐9.82, ‐1.18] |
| 5 Mood (EACG, change from baseline) Show forest plot | 1 | 66 | Mean Difference (IV, Fixed, 95% CI) | ‐0.90 [‐1.73, ‐0.07] |
| 6 Cognition (EST) Show forest plot | 1 | 51 | Mean Difference (IV, Fixed, 95% CI) | ‐0.90 [‐3.84, 2.04] |
| 7 Cognition (EACG change from baseline) Show forest plot | 1 | 66 | Mean Difference (IV, Fixed, 95% CI) | ‐1.45 [‐2.15, ‐0.75] |
| 8 Combination scales (SCAG) Show forest plot | 1 | 47 | Mean Difference (IV, Fixed, 95% CI) | 1.00 [0.03, 1.97] |
| 9 Death Show forest plot | 1 | 66 | Odds Ratio (M‐H, Fixed, 95% CI) | 0.88 [0.05, 14.73] |
| Outcome or subgroup title | No. of studies | No. of participants | Statistical method | Effect size |
| 1 Global impression (CGI, continuous data) Show forest plot | 1 | 339 | Odds Ratio (M‐H, Fixed, 95% CI) | 1.83 [1.16, 2.91] |
| 2 Adverse effects Show forest plot | 2 | 433 | Odds Ratio (M‐H, Fixed, 95% CI) | 0.76 [0.43, 1.34] |
| 3 Mood (HRSD) Show forest plot | 1 | 30 | Std. Mean Difference (IV, Fixed, 95% CI) | ‐1.03 [‐1.80, ‐0.26] |
| 4 Cognition (ADAS‐Cog, continuous data) Show forest plot | 1 | 84 | Std. Mean Difference (IV, Fixed, 95% CI) | ‐0.48 [‐0.92, ‐0.05] |
| 5 Cognition (ADAS‐Cog, dichotomous data) Show forest plot | 1 | 339 | Odds Ratio (M‐H, Fixed, 95% CI) | 2.46 [1.46, 4.14] |
| 6 Combination scales: GBS Show forest plot | 1 | 30 | Mean Difference (IV, Fixed, 95% CI) | 1.40 [‐9.29, 12.09] |
| 7 Combination scales: BDRS Show forest plot | 1 | 30 | Mean Difference (IV, Fixed, 95% CI) | 0.90 [‐1.47, 3.27] |
| 8 Combination scales: SCAG, dichotomous data Show forest plot | 1 | 339 | Odds Ratio (M‐H, Fixed, 95% CI) | 2.83 [1.68, 4.78] |
| 9 Combination scales: NOSGER, dichotomous data Show forest plot | 1 | 339 | Odds Ratio (M‐H, Fixed, 95% CI) | 1.54 [0.98, 2.42] |
| 10 Death Show forest plot | 2 | 433 | Odds Ratio (M‐H, Fixed, 95% CI) | 1.19 [0.32, 4.46] |