Tratamientos orales a base de hierbas para la artrosis
Información
- DOI:
- https://doi.org/10.1002/14651858.CD002947.pub2Copiar DOI

- Base de datos:
-
- Cochrane Database of Systematic Reviews
- Versión publicada:
-
- 22 mayo 2014see what's new
- Tipo:
-
- Intervention
- Etapa:
-
- Review
- Grupo Editorial Cochrane:
-
Grupo Cochrane de Salud musculoesquelética
- Copyright:
-
- Copyright © 2016 The Cochrane Collaboration. Published by John Wiley & Sons, Ltd.
Cifras del artículo
Altmetric:
Citado por:
Autores
Contributions of authors
SC and MC contributed to the paper selection and data extraction. MC and SG completed the data analysis and interpretation, and wrote, checked, proof‐read, and approved the updated review.
Sources of support
Internal sources
-
Victoria University, Australia.
Victoria University provided one author with time release from normal duties (2004‐2009) for review training and to undertake this review.
-
University of Freiburg, Germany.
University of Freiburg provided one author with time release from normal duties to complete the review. A staff member of the Cochrane Centre Germany, based at the University of Frieburg, assisted with data extraction from German lanugage manucripts.
-
Australian Catholic University, Australia.
The Australian Catholic University provided one author with time release from normal duties (2010‐2011) to undertake this review. Librarians from the Australian Catholic University assisted with the acquisition of full manuscripts of studies included in this review.
-
University of the Sunshine Coast, Australia.
The University of the Sunshine Coast provided one author with time release from normal duties (2012) to complete this review.
External sources
-
National Center for Complementary and Alternative Medicine, USA.
This work was partially funded by Grant Number R24 AT001293 from the National Center for Complementary and Alternative Medicine (NCCAM). The contents of this systematic review are solely the responsibility of the authors and do not necessarily represent the official views of the NCCAM or the National Institutes of Health.
Declarations of interest
None known
Acknowledgements
The review authors would like to thank the Cochrane Musculoskeletal editorial team for their editorial suggestions.
Christine Little (CL) and Tessa Parsons (TP) authored the original review that formed the template for this updated version. CL contributed to paper selection for this review, and TP extracted data from some studies. We gratefully acknowledge their contributions to the foundational work for this review.
Charles Malemud edited portions of the Background and Discussion relevant to cytokine activity in osteoarthritis. Anette Blümle (AB) of the German Cochrane Centre, and Mason Leung, advised on the inclusion or exclusion of manuscripts in German and Chinese respectively. AB and Joel Gagnier (JG) contributed to data extraction from some studies. Rudolf Bauer gave advice on the inclusion of study medications and Ulf Müller‐Ladner on the interpretation of the study results with the proprietary ASU product. Renea Johnston, of the Cochrane Musculoskeletal Group, provided extensive feedback on the manuscript and assisted in calculation of numbers needed to treat (NNT). We thank these colleagues for their support and assistance in finalising this review.
Version history
| Published | Title | Stage | Authors | Version |
| 2014 May 22 | Oral herbal therapies for treating osteoarthritis | Review | Melainie Cameron, Sigrun Chrubasik | |
| 2000 Oct 23 | Herbal therapy for treating osteoarthritis | Review | Christine V Little, Tessa Parsons, Stuart Logan | |
Differences between protocol and review
For this review update, we expanded the inclusion criteria so studies that included an active control as well as placebo controls, unpublished reports of randomised controlled trials, and trials in any language were eligible for inclusion. Changes to the methods of quality assessment (replaced by assessment of 'risk of bias') and analysis and presentation of results are consistent with updated Cochrane Collaboration and Cochrane Musculoskeletal Group methods introduced since the original review. We restricted included studies to those investigations of interventions that strictly satisfied the WHO guidelines for herbal medicines. This updated review is limited to oral medicinal plant products. In the original review, studies of the same herbal therapy that used the same outcome measure were pooled regardless of the length of the intervention period. In this update, these data and comparisons are subgrouped according to intervention time, rather than pooled. The table of herbal interventions has been extensively revised so that it offers detailed information about the herbal medicines, including full botanical names, part/s of the plant used, details of extraction methods, drug:extract ratios, and active principles
Keywords
MeSH
Medical Subject Headings (MeSH) Keywords
Medical Subject Headings Check Words
Humans;
PICO
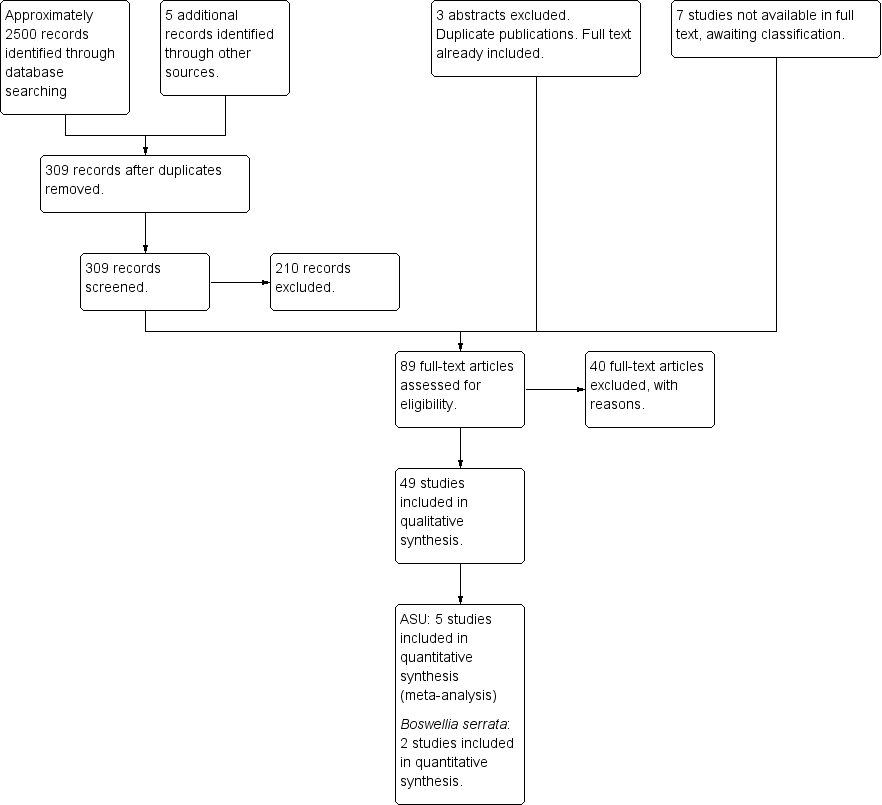
Study flow diagram.

Risk of bias summary: review authors' judgements about each risk of bias item for each included study.
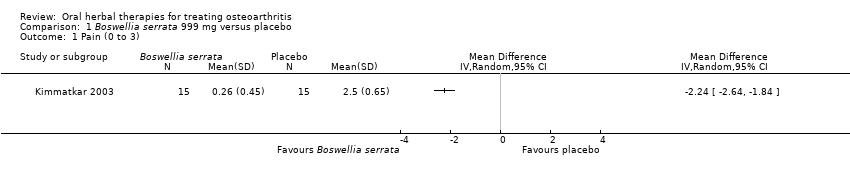
Comparison 1 Boswellia serrata 999 mg versus placebo, Outcome 1 Pain (0 to 3).

Comparison 1 Boswellia serrata 999 mg versus placebo, Outcome 2 Function: loss of function (0 to 3).

Comparison 1 Boswellia serrata 999 mg versus placebo, Outcome 3 Participants (n) reported adverse effects.
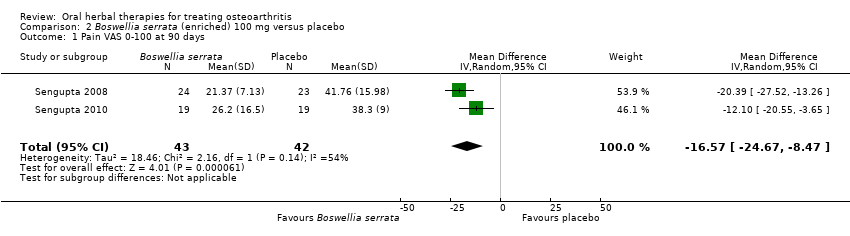
Comparison 2 Boswellia serrata (enriched) 100 mg versus placebo, Outcome 1 Pain VAS 0‐100 at 90 days.
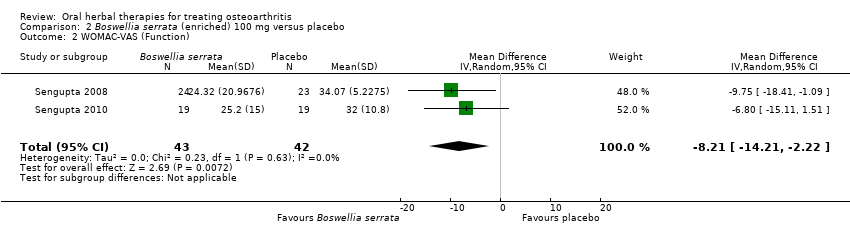
Comparison 2 Boswellia serrata (enriched) 100 mg versus placebo, Outcome 2 WOMAC‐VAS (Function).

Comparison 2 Boswellia serrata (enriched) 100 mg versus placebo, Outcome 3 Adverse event episodes (n) reported.

Comparison 3 Boswellia serrata (enriched) 250 mg versus placebo, Outcome 1 Pain VAS 0‐100 at 90 days.

Comparison 3 Boswellia serrata (enriched) 250 mg versus placebo, Outcome 2 WOMAC‐VAS (Function).
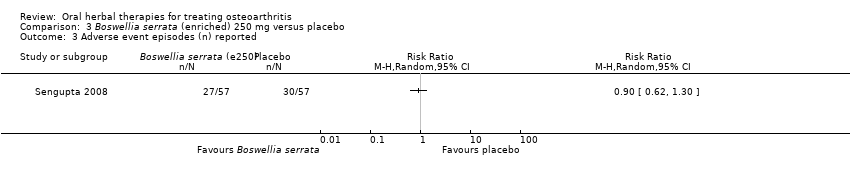
Comparison 3 Boswellia serrata (enriched) 250 mg versus placebo, Outcome 3 Adverse event episodes (n) reported.
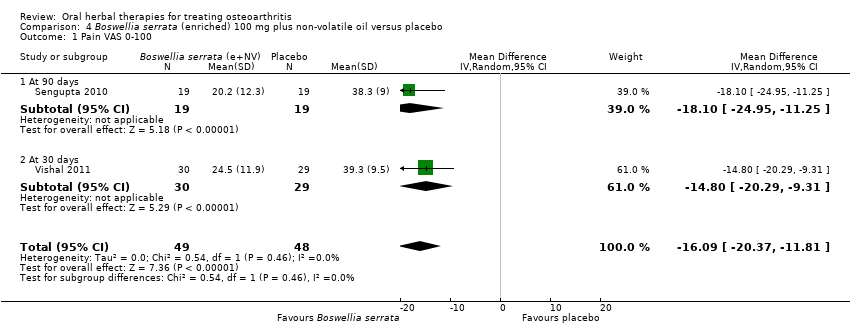
Comparison 4 Boswellia serrata (enriched) 100 mg plus non‐volatile oil versus placebo, Outcome 1 Pain VAS 0‐100.

Comparison 4 Boswellia serrata (enriched) 100 mg plus non‐volatile oil versus placebo, Outcome 2 WOMAC‐VAS (Function).
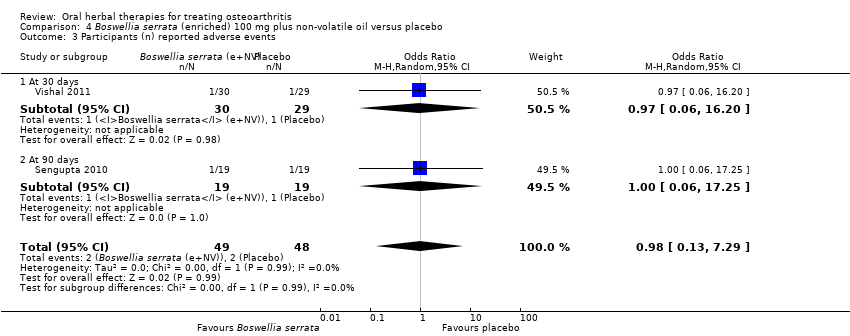
Comparison 4 Boswellia serrata (enriched) 100 mg plus non‐volatile oil versus placebo, Outcome 3 Participants (n) reported adverse events.
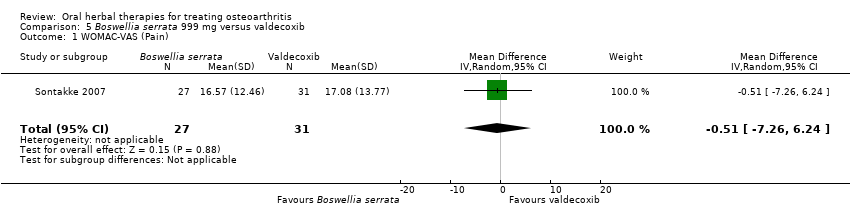
Comparison 5 Boswellia serrata 999 mg versus valdecoxib, Outcome 1 WOMAC‐VAS (Pain).

Comparison 5 Boswellia serrata 999 mg versus valdecoxib, Outcome 2 WOMAC‐VAS (Function).
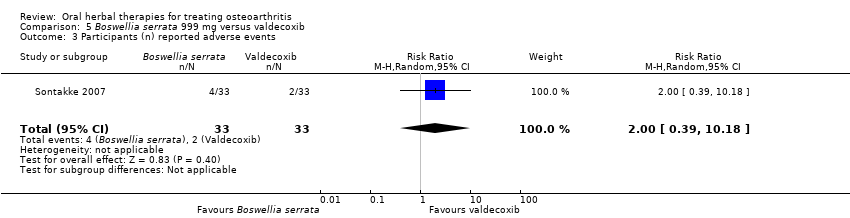
Comparison 5 Boswellia serrata 999 mg versus valdecoxib, Outcome 3 Participants (n) reported adverse events.
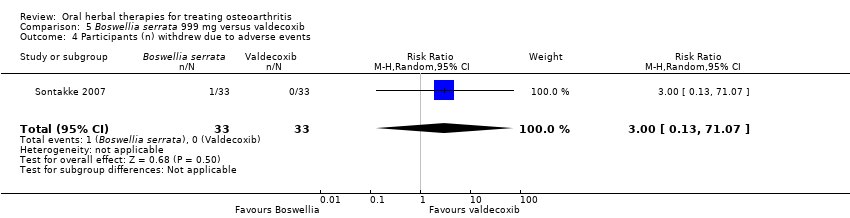
Comparison 5 Boswellia serrata 999 mg versus valdecoxib, Outcome 4 Participants (n) withdrew due to adverse events.

Comparison 6 Curcuma domestica versus ibuprofen, Outcome 1 Pain on walking NRS 0‐10.
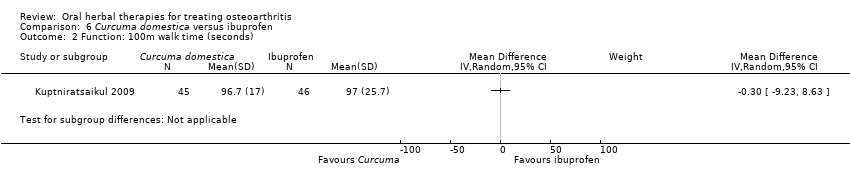
Comparison 6 Curcuma domestica versus ibuprofen, Outcome 2 Function: 100m walk time (seconds).

Comparison 6 Curcuma domestica versus ibuprofen, Outcome 3 Participants (n) reported adverse events.
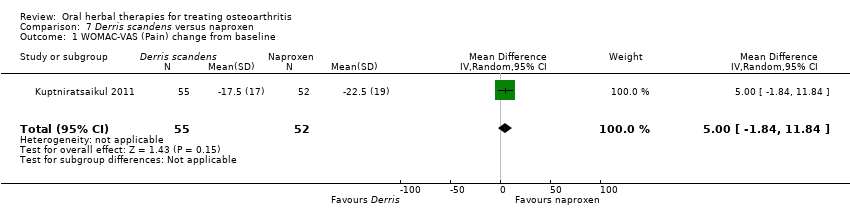
Comparison 7 Derris scandens versus naproxen, Outcome 1 WOMAC‐VAS (Pain) change from baseline.

Comparison 7 Derris scandens versus naproxen, Outcome 2 WOMAC‐VAS (Function) change from baseline.

Comparison 7 Derris scandens versus naproxen, Outcome 3 Participants (n) reported adverse events..

Comparison 8 Harpagophytum procumbens versus diacerhein, Outcome 1 Pain VAS 0‐100 change from baseline at 120 days.

Comparison 8 Harpagophytum procumbens versus diacerhein, Outcome 2 Participants (n) reported adverse events.
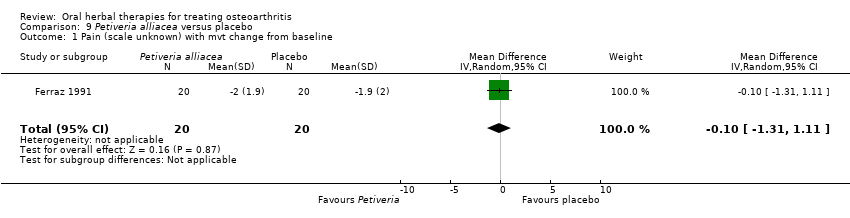
Comparison 9 Petiveria alliacea versus placebo, Outcome 1 Pain (scale unknown) with mvt change from baseline.

Comparison 9 Petiveria alliacea versus placebo, Outcome 2 Participants (n) reported adverse events.

Comparison 10 Pinus pinaster (Pycnogenol® 150 mg) versus placebo, Outcome 1 WOMAC‐VAS (Pain).

Comparison 10 Pinus pinaster (Pycnogenol® 150 mg) versus placebo, Outcome 2 WOMAC‐VAS (Function).
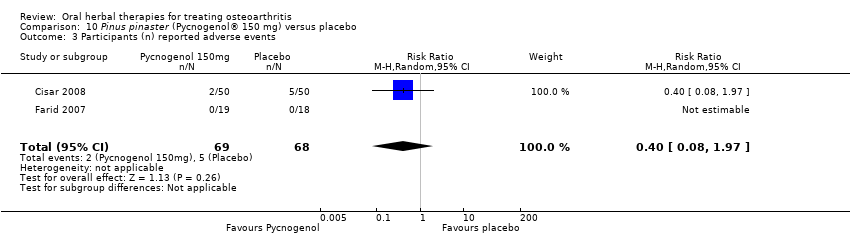
Comparison 10 Pinus pinaster (Pycnogenol® 150 mg) versus placebo, Outcome 3 Participants (n) reported adverse events.

Comparison 11 Pinus pinaster (Pycnogenol® 100 mg) versus placebo, Outcome 1 WOMAC 0‐4 (Pain).

Comparison 11 Pinus pinaster (Pycnogenol® 100 mg) versus placebo, Outcome 2 WOMAC 0‐4 (Function).

Comparison 12 Ricinus officinale versus placebo, Outcome 1 Participants (n) reported adverse events.
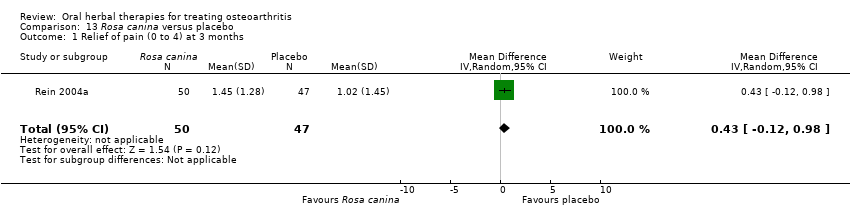
Comparison 13 Rosa canina versus placebo, Outcome 1 Relief of pain (0 to 4) at 3 months.

Comparison 13 Rosa canina versus placebo, Outcome 2 WOMAC‐VAS (Pain).

Comparison 13 Rosa canina versus placebo, Outcome 3 WOMAC‐VAS (Function).
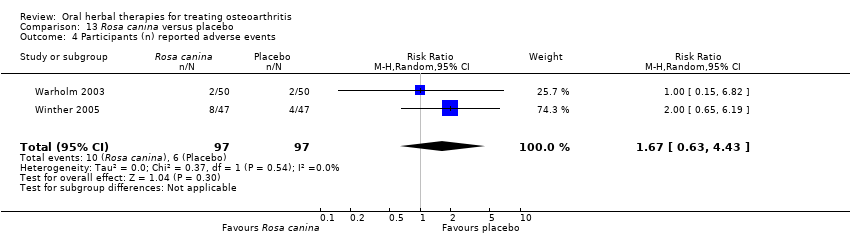
Comparison 13 Rosa canina versus placebo, Outcome 4 Participants (n) reported adverse events.
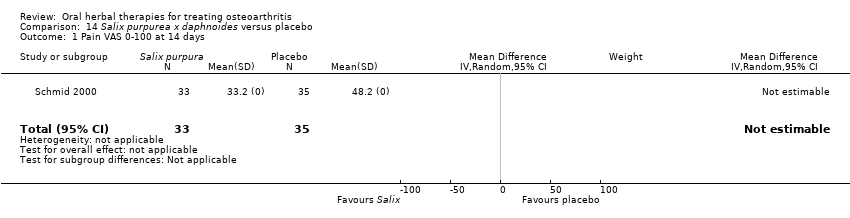
Comparison 14 Salix purpurea x daphnoides versus placebo, Outcome 1 Pain VAS 0‐100 at 14 days.

Comparison 14 Salix purpurea x daphnoides versus placebo, Outcome 2 Function VAS 0‐100 at 14 days.

Comparison 14 Salix purpurea x daphnoides versus placebo, Outcome 3 Participants (n) reported adverse events.

Comparison 15 Salix purpurea x daphnoides versus diclofenac, Outcome 1 WOMAC‐VAS (Pain).

Comparison 15 Salix purpurea x daphnoides versus diclofenac, Outcome 2 WOMAC‐VAS (Function).
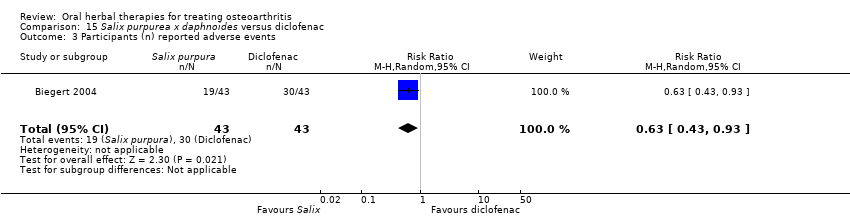
Comparison 15 Salix purpurea x daphnoides versus diclofenac, Outcome 3 Participants (n) reported adverse events.
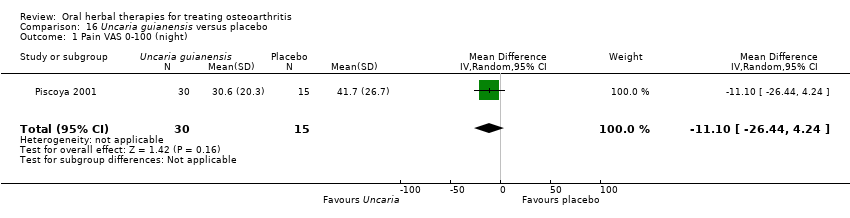
Comparison 16 Uncaria guianensis versus placebo, Outcome 1 Pain VAS 0‐100 (night).

Comparison 16 Uncaria guianensis versus placebo, Outcome 2 Participants (n) reported adverse events.

Comparison 17 Zingiber officinale (Zintona EC) versus placebo, Outcome 1 Pain VAS 0‐100 (movement).

Comparison 17 Zingiber officinale (Zintona EC) versus placebo, Outcome 2 Function (handicap) VAS 0‐100.
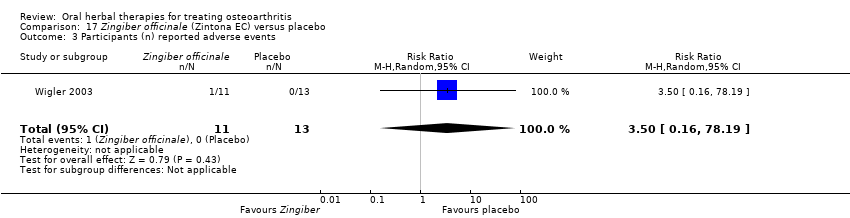
Comparison 17 Zingiber officinale (Zintona EC) versus placebo, Outcome 3 Participants (n) reported adverse events.

Comparison 18 Boswellia carteri + Curcuma longa versus placebo, Outcome 1 Function: pain free walking time (minutes).

Comparison 19 Persea gratissma + Glycine max (ASU 300 mg) versus placebo, Outcome 1 Pain VAS 0‐100.
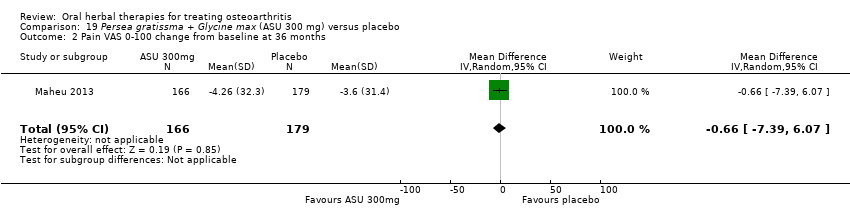
Comparison 19 Persea gratissma + Glycine max (ASU 300 mg) versus placebo, Outcome 2 Pain VAS 0‐100 change from baseline at 36 months.

Comparison 19 Persea gratissma + Glycine max (ASU 300 mg) versus placebo, Outcome 3 Pain VAS 0‐100 grouped by joint.
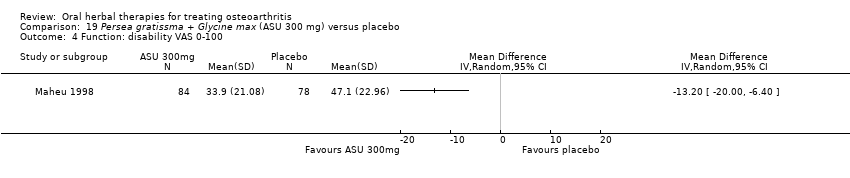
Comparison 19 Persea gratissma + Glycine max (ASU 300 mg) versus placebo, Outcome 4 Function: disability VAS 0‐100.
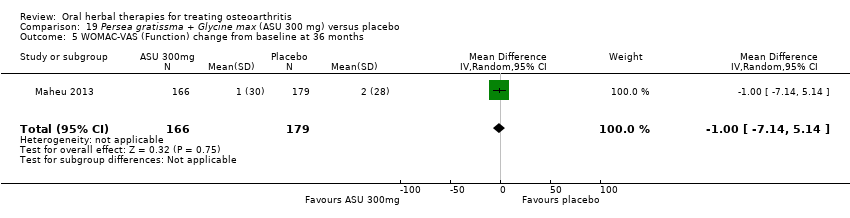
Comparison 19 Persea gratissma + Glycine max (ASU 300 mg) versus placebo, Outcome 5 WOMAC‐VAS (Function) change from baseline at 36 months.

Comparison 19 Persea gratissma + Glycine max (ASU 300 mg) versus placebo, Outcome 6 Lequesne algofunctional index.

Comparison 19 Persea gratissma + Glycine max (ASU 300 mg) versus placebo, Outcome 7 Function (various tools).

Comparison 19 Persea gratissma + Glycine max (ASU 300 mg) versus placebo, Outcome 8 Participants (n) reported adverse events.

Comparison 19 Persea gratissma + Glycine max (ASU 300 mg) versus placebo, Outcome 9 Participants (n) withdrew due to adverse events.
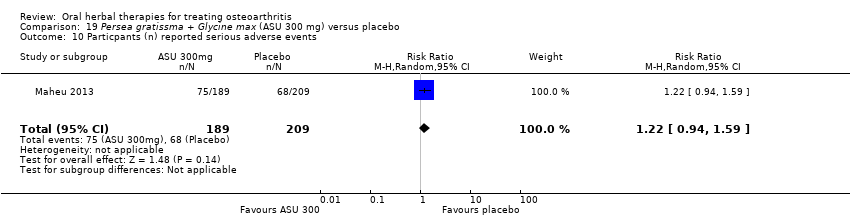
Comparison 19 Persea gratissma + Glycine max (ASU 300 mg) versus placebo, Outcome 10 Particpants (n) reported serious adverse events.

Comparison 19 Persea gratissma + Glycine max (ASU 300 mg) versus placebo, Outcome 11 JSW change from baseline.

Comparison 20 Persea gratissma + Glycine max (ASU 600 mg) versus placebo, Outcome 1 Pain VAS 0‐100.

Comparison 20 Persea gratissma + Glycine max (ASU 600 mg) versus placebo, Outcome 2 Lequesne algofunctional index.
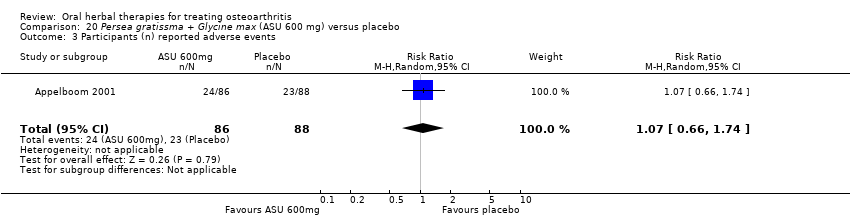
Comparison 20 Persea gratissma + Glycine max (ASU 600 mg) versus placebo, Outcome 3 Participants (n) reported adverse events.

Comparison 21 Persea gratissma + Glycine max (ASU 300 mg) versus chondroitin sulphate, Outcome 1 WOMAC‐VAS (Pain).

Comparison 21 Persea gratissma + Glycine max (ASU 300 mg) versus chondroitin sulphate, Outcome 2 WOMAC‐VAS (Function).

Comparison 21 Persea gratissma + Glycine max (ASU 300 mg) versus chondroitin sulphate, Outcome 3 Participants (n) reported adverse events.
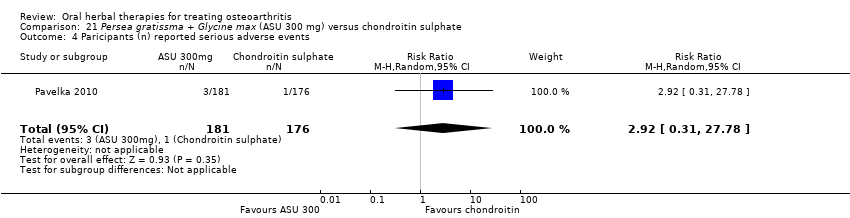
Comparison 21 Persea gratissma + Glycine max (ASU 300 mg) versus chondroitin sulphate, Outcome 4 Paricipants (n) reported serious adverse events.
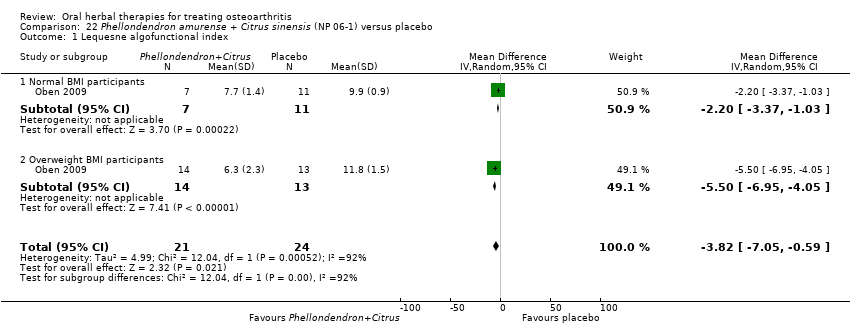
Comparison 22 Phellondendron amurense + Citrus sinensis (NP 06‐1) versus placebo, Outcome 1 Lequesne algofunctional index.

Comparison 23 Uncaria guianensis + Lepidium meyenii versus glucosamine sulphate, Outcome 1 Participants (n) reported adverse events.
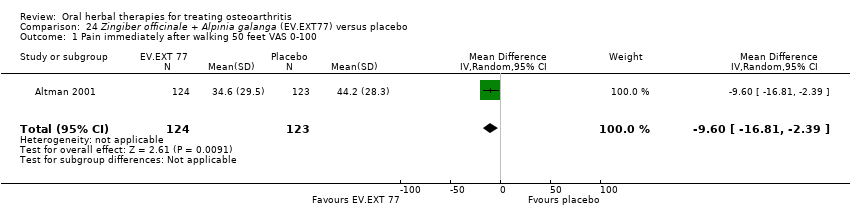
Comparison 24 Zingiber officinale + Alpinia galanga (EV.EXT77) versus placebo, Outcome 1 Pain immediately after walking 50 feet VAS 0‐100.

Comparison 24 Zingiber officinale + Alpinia galanga (EV.EXT77) versus placebo, Outcome 2 WOMAC‐VAS (Function).

Comparison 24 Zingiber officinale + Alpinia galanga (EV.EXT77) versus placebo, Outcome 3 Participants (n) reported adverse events.

Comparison 25 SKI306X versus placebo, Outcome 1 Pain VAS 0‐100 change from baseline.

Comparison 25 SKI306X versus placebo, Outcome 2 Lequesne algofunctional index change from baseline.

Comparison 25 SKI306X versus placebo, Outcome 3 Participants (n) reported adverse events.
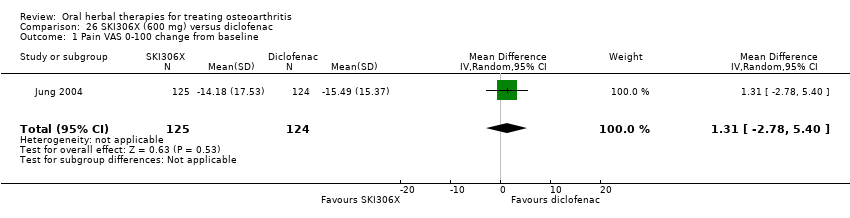
Comparison 26 SKI306X (600 mg) versus diclofenac, Outcome 1 Pain VAS 0‐100 change from baseline.

Comparison 26 SKI306X (600 mg) versus diclofenac, Outcome 2 Lequesne algofunctional index change from baseline.

Comparison 26 SKI306X (600 mg) versus diclofenac, Outcome 3 Participants (n) reported adverse events.

Comparison 27 Phytodolor N versus placebo, Outcome 1 Enduring pain (0 to 3).

Comparison 27 Phytodolor N versus placebo, Outcome 2 Function: mobility limitations (0 to 3).
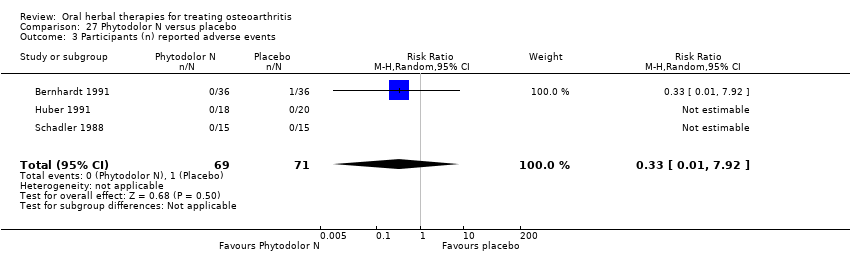
Comparison 27 Phytodolor N versus placebo, Outcome 3 Participants (n) reported adverse events.
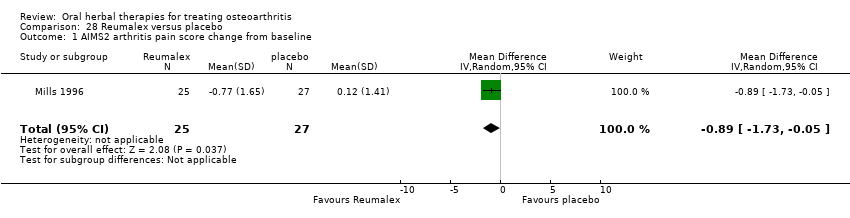
Comparison 28 Reumalex versus placebo, Outcome 1 AIMS2 arthritis pain score change from baseline.
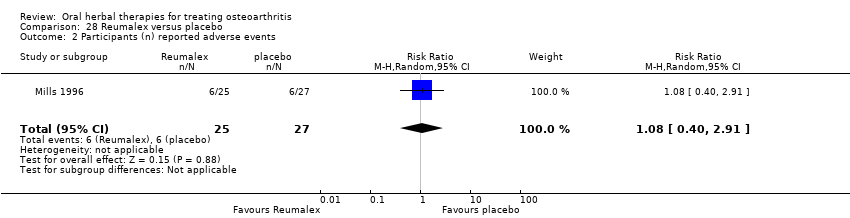
Comparison 28 Reumalex versus placebo, Outcome 2 Participants (n) reported adverse events.
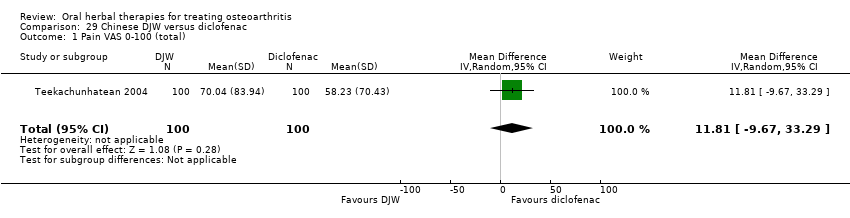
Comparison 29 Chinese DJW versus diclofenac, Outcome 1 Pain VAS 0‐100 (total).
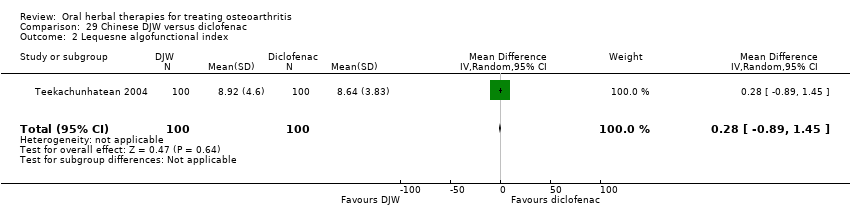
Comparison 29 Chinese DJW versus diclofenac, Outcome 2 Lequesne algofunctional index.

Comparison 29 Chinese DJW versus diclofenac, Outcome 3 Participants (n) reported adverse events.

Comparison 30 Chinese BNHS versus Chinese active control, Outcome 1 Pain VAS 0‐100 (walking).
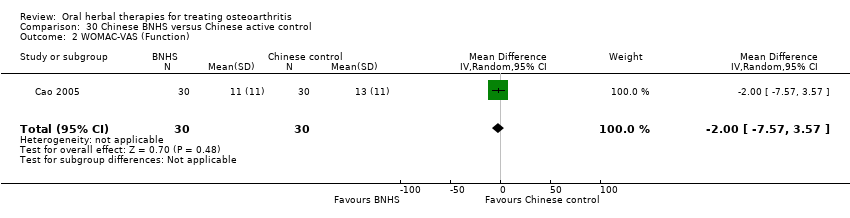
Comparison 30 Chinese BNHS versus Chinese active control, Outcome 2 WOMAC‐VAS (Function).
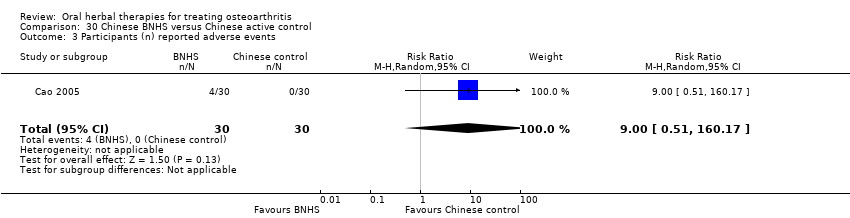
Comparison 30 Chinese BNHS versus Chinese active control, Outcome 3 Participants (n) reported adverse events.
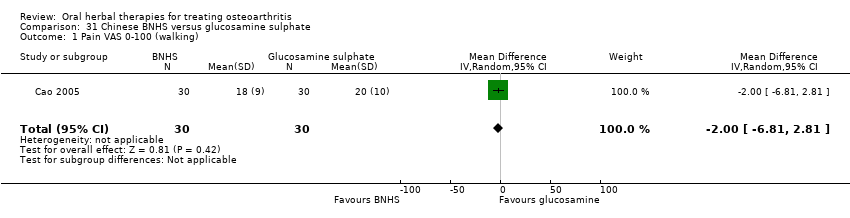
Comparison 31 Chinese BNHS versus glucosamine sulphate, Outcome 1 Pain VAS 0‐100 (walking).

Comparison 31 Chinese BNHS versus glucosamine sulphate, Outcome 2 WOMAC‐VAS (Function).

Comparison 31 Chinese BNHS versus glucosamine sulphate, Outcome 3 Participants (n) reported adverse events.

Comparison 32 Ayurvedic A to E versus placebo, Outcome 1 Adverse event episodes (n) reported.

Comparison 33 Ayurvedic Antarth versus placebo, Outcome 1 Pain VAS 0‐100.
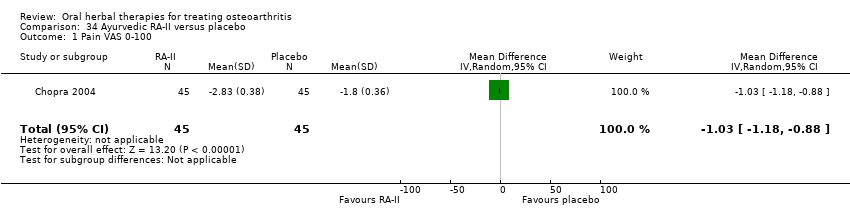
Comparison 34 Ayurvedic RA‐II versus placebo, Outcome 1 Pain VAS 0‐100.
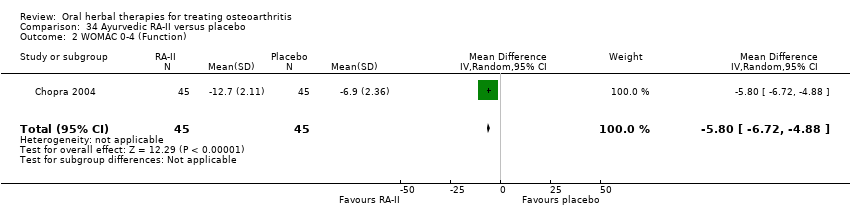
Comparison 34 Ayurvedic RA‐II versus placebo, Outcome 2 WOMAC 0‐4 (Function).
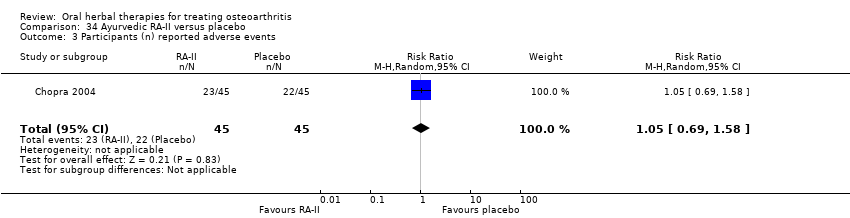
Comparison 34 Ayurvedic RA‐II versus placebo, Outcome 3 Participants (n) reported adverse events.

Comparison 35 Ayurvedic SGC versus glucosamine sulphate, Outcome 1 Pain VAS 0‐100 change from baseline.

Comparison 35 Ayurvedic SGC versus glucosamine sulphate, Outcome 2 WOMAC 0‐4 (Function) change from baseline.

Comparison 35 Ayurvedic SGC versus glucosamine sulphate, Outcome 3 Participants (n) reported adverse events.

Comparison 36 Ayurvedic SGC versus celecoxib, Outcome 1 Pain VAS 0‐100 change from baseline.

Comparison 36 Ayurvedic SGC versus celecoxib, Outcome 2 WOMAC 0‐4 (Function) change from baseline.

Comparison 36 Ayurvedic SGC versus celecoxib, Outcome 3 Participants (n) reported adverse events.
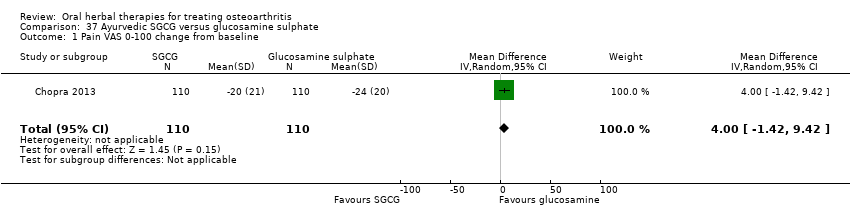
Comparison 37 Ayurvedic SGCG versus glucosamine sulphate, Outcome 1 Pain VAS 0‐100 change from baseline.
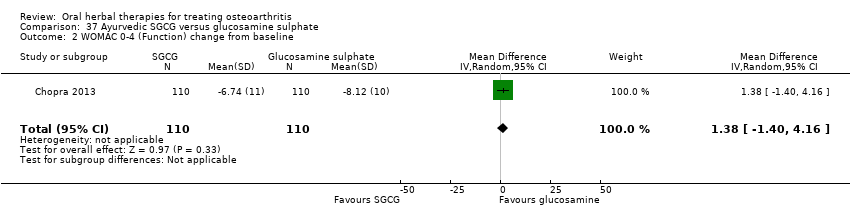
Comparison 37 Ayurvedic SGCG versus glucosamine sulphate, Outcome 2 WOMAC 0‐4 (Function) change from baseline.

Comparison 37 Ayurvedic SGCG versus glucosamine sulphate, Outcome 3 Participants (n) reported adverse events.

Comparison 38 Ayurvedic SGCG versus celecoxib, Outcome 1 Pain VAS 0‐100 change from baseline.

Comparison 38 Ayurvedic SGCG versus celecoxib, Outcome 2 WOMAC 0‐4 (Function) change from baseline.

Comparison 38 Ayurvedic SGCG versus celecoxib, Outcome 3 Participants (n) reported adverse events.
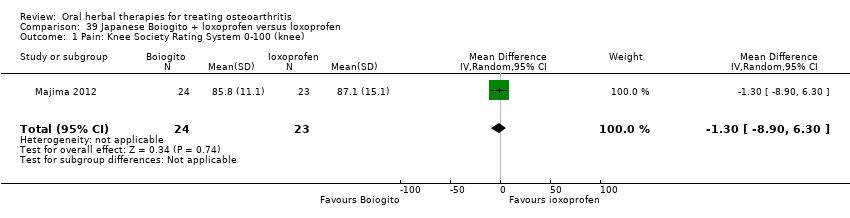
Comparison 39 Japanese Boiogito + loxoprofen versus loxoprofen, Outcome 1 Pain: Knee Society Rating System 0‐100 (knee).
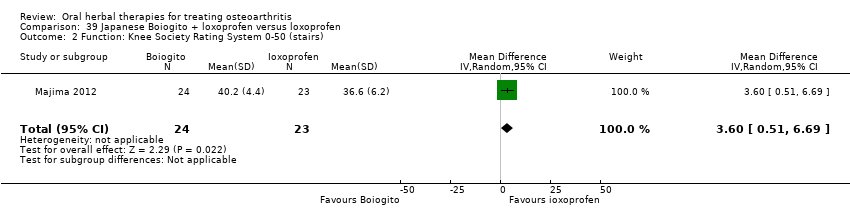
Comparison 39 Japanese Boiogito + loxoprofen versus loxoprofen, Outcome 2 Function: Knee Society Rating System 0‐50 (stairs).

Comparison 39 Japanese Boiogito + loxoprofen versus loxoprofen, Outcome 3 Participants (n) reported adverse events.
| Boswellia serrata for treating osteoarthritis | ||||||
| Patient or population: patients with treating osteoarthritis | ||||||
| Outcomes | Illustrative comparative risks* (95% CI) | Relative effect | No of Participants | Quality of the evidence | Comments | |
| Assumed risk | Corresponding risk | |||||
| Control | Boswellia serrata | |||||
| Pain | Mean pain in the control group at the end of treatment was 2.50 (0 to 3 scale). | Mean pain in the intervention groups was | ‐ | 30 | ⊕⊕⊝⊝ | Absolute improvement in pain was 56% (46% to 66%); Relative improvement in pain was 80% (66% to 94%)5; NNTB = 1 (95% CI 1 to 2). |
| Function | Mean disability in the control group at the end of treatment was 2.46 (0 to 3 scale). | Mean disability in the intervention groups was | ‐ | 30 | ⊕⊕⊝⊝ | Absolute improvement in function was 54% (44% to 64%); Relative improvement was 76% (62% to 90%)5; NNTB = 1 (95% CI 1 to 3). |
| Adverse events | No (n=0) participants in the control group reported adverse events. 0 per 1000 | Two (n=2) participants in the intervention group reported adverse events. 0 per 1000 | RR 5.00 | 30 | ⊕⊕⊝⊝ | Absolute risk of adverse events was 13% higher in the Boswellia serrata group (6% lower to 33% higher); Relative percentage change 400% worsening (74% to 9513% worsening); NNT n/a.6 |
| Adverse events Participants (n) withdrew due to adverse effects | See comment | See comment | Not estimable | 30 | See comment | Reported NIL withdrawals due to adverse events. |
| Adverse events Participants (n) reported serious adverse events | See comment | See comment | Not estimable | ‐ | See comment | Serious adverse events not reported as discrete outcome. |
| Radiographic joint changes | See comment | See comment | Not estimable | ‐ | See comment | Radiographic joint changes not measured. |
| Quality of life | See comment | See comment | Not estimable | ‐ | See comment | Quality of life not measured. |
| *The basis for the assumed risk (e.g. the median control group risk across studies) is provided in footnotes. The corresponding risk (and its 95% confidence interval) is based on the assumed risk in the comparison group and the relative effect of the intervention (and its 95% CI). | ||||||
| GRADE Working Group grades of evidence | ||||||
| 1 Criteria for diagnosis of OA not specified. 4 Downgrade estimate due to single study. 5 Control group baseline pain (SD) 2.80 (0.41), baseline disability 2.86 (0.35), from Kimmatkar 2003. 6 Number needed to treat (NNT) = not applicable (n/a) when result is not statistically significant. NNT for continuous outcomes calculated using Wells Calculator (CMSG editorial office). NNT for dichotomous outcomes calculated using Cates NNT calculator (http://www.nntonline.net/visualrx/). Assumed a minimal clinically important difference of 1 point of a 0 to 3 point scale (pain, function). | ||||||
| Boswellia serrata (enriched) 100 mg for treating osteoarthritis | ||||||
| Patient or population: patients with treating osteoarthritis | ||||||
| Outcomes | Illustrative comparative risks* (95% CI) | Relative effect | No of Participants | Quality of the evidence | Comments | |
| Assumed risk | Corresponding risk | |||||
| Control | Boswellia serrata (enriched) 100mg | |||||
| Pain Global pain VAS 0‐100 (higher scores mean worse) | Weighted mean pain in the control groups at the end of treatment was 40.02 (0 to 100 scale). | The weighted mean pain in the intervention groups was | ‐ | 85 | ⊕⊕⊕⊝ | Absolute improvement in pain was 17% (8% to 26%); Relative improvement in pain was 29% (15% to 43%)3; NNTB 2 (95% CI 1 to 6). |
| Function | Weighted mean disability in the control groups at the end of treatment was 33.13 (0 to 100 scale). | The weighted mean disability in the intervention groups was | ‐ | 85 | ⊕⊕⊕⊝ | Absolute improvement was 8% (14% to 2%); Relative improvement was 20% (5% to 34%)3; NNTB 4 (95% CI 2 to 18). |
| Adverse events | 625 per 1000 | 375 per 1000 | RR 0.60 | 96 | ⊕⊕⊕⊝ | Absolute risk of adverse events was 25% lower in the Boswellia serrata group (6% to 44% lower); Relative percentage change 40% improvement (61% improvement to 9% worsening); NNT = 4 (95% CI 3 to 22). |
| Adverse events Participants (n) withdrew due to adverse effects | See comment | See comment | Not estimable | 96 | See comment | Reported NIL withdrawals due to adverse events. |
| Adverse events Participants (n) reported serious adverse events | See comment | See comment | Not estimable | 96 | See comment | Reported NIL serious adverse events. |
| Radiographic joint changes | See comment | See comment | Not estimable | ‐ | See comment | Radiographic joint changes not measured. |
| Quality of life | See comment | See comment | Not estimable | ‐ | See comment | Quality of life not measured. |
| *The basis for the assumed risk (e.g. the median control group risk across studies) is provided in footnotes. The corresponding risk (and its 95% confidence interval) is based on the assumed risk in the comparison group and the relative effect of the intervention (and its 95% CI). | ||||||
| GRADE Working Group grades of evidence | ||||||
| 1Sengupta 2008, Sengupta 2010, Vishal 2011: WOMAC scores presented as subscale scores only. Overall WOMAC not reported. 2 Confirmatory study design: statistical power 80%, alpha set at 0.05, but downgraded due to potential imprecision due to small number of participants; and lower limit of 95% CI does not preclude clincially insignificant change 3 Control group baseline measures taken from Sengupta 2008, the study most heavily weighted in the meta‐analyses. Control group baseline pain (SD) 56.88 (12.04), baseline disability 41.3 (9.6). 4 Downgrade estimate due to potential imprecision, eg, small number of events and participants from a single study. 5 Number needed to treat (NNT) is not applicable (n/a) when result is not statistically significant. NNT for dichotomous outcomes calculated using Cates NNT calculator (http://www.nntonline.net/visualrx/); NNT for continuous outcomes calculated using Wells Calculator (CMSG editorial office). Assumed a minimal clinically important difference of 15 points on 0 to 100 mm pain scale, and 10 points on 0 to 100 mm function scale. | ||||||
| Boswellia serrata (enriched) 250mg for treating osteoarthritis | ||||||
| Patient or population: patients with treating osteoarthritis | ||||||
| Outcomes | Illustrative comparative risks* (95% CI) | Relative effect | No of Participants | Quality of the evidence | Comments | |
| Assumed risk | Corresponding risk | |||||
| Control | Boswellia serrata (enriched) 250mg | |||||
| Pain | Mean pain in the control group at the end of treatment was 41.76 (0 to 100 scale). | Mean pain in the intervention group was | ‐ | 47 | ⊕⊕⊕⊝ | Absolute improvement in pain was 28% (20% to 35%); Relative improvement in pain was 48% (36% to 61%)3 ; NNT = 1 (95% CI 1 to 2). |
| Function (higher scores mean worse) | Mean disability in the control group at the end of treatment was 34.07 (0 to 100 scale). | Mean disability in the intervention group was | ‐ | 47 | ⊕⊕⊕⊝ | Absolute improvement in disability was 17% (12% to 21%); Relative improvement in disability was 41% (30% to 51%)3; NNT = 1 (95% CI 1 to 2). |
| Adverse events | 526 per 1000 | 474 per 1000 | RR 0.90 | 114 | ⊕⊕⊕⊝ | Absolute risk of adverse events was 5% lower in the Boswellia serrata group (24% lower to 13% higher); Relative percentage change 10% improvement (38% improvement to 30% worsening); NNT n/a.4 |
| Adverse events Participants (n) withdrew due to adverse effects | See comment | See comment | Not estimable | 114 | See comment | Reported NIL withdrawals due to adverse events. |
| Adverse events Participants (n) reported serious adverse events | See comment | See comment | Not estimable | 114 | See comment | Reported NIL serious adverse events. |
| Radiographic joint changes | See comment | See comment | Not estimable | ‐ | See comment | Radiographic joint changes not measured. |
| Quality of life | See comment | See comment | Not estimable | ‐ | See comment | Quality of life not measured. |
| *The basis for the assumed risk (e.g. the median control group risk across studies) is provided in footnotes. The corresponding risk (and its 95% confidence interval) is based on the assumed risk in the comparison group and the relative effect of the intervention (and its 95% CI). | ||||||
| GRADE Working Group grades of evidence | ||||||
| 1Sengupta 2008: WOMAC scores presented as subscale scores only. Overall WOMAC not reported. 2 Downgrade estimate due to single study. 3 Control group baseline pain (SD) 56.88 (12.04), baseline disability 41.3 (9.6), from Sengupta 2008. 4 Number needed to treat (NNT) = not applicable (n/a) when result is not statistically significant. NNT for continuous outcomes calculated using Wells Calculator (CMSG editorial office). NNT for dichotomous outcomes calculated using Cates NNT calculator (http://www.nntonline.net/visualrx/). | ||||||
| Boswellia serrata (enriched) plus non‐volatile oil for treating osteoarthritis | ||||||
| Patient or population: patients with treating osteoarthritis | ||||||
| Outcomes | Illustrative comparative risks* (95% CI) | Relative effect | No of Participants | Quality of the evidence | Comments | |
| Assumed risk | Corresponding risk | |||||
| Control | Boswellia serrata (enriched) plus non‐volatile oil | |||||
| Pain | Weighted mean pain in the control groups at the end of treatment was 38.90 (0 to 100 scale). | Weighted mean pain in the intervention groups was | ‐ | 97 | ⊕⊕⊕⊝ | Absolute improvement in pain was 16% (12% to 20%); Relative improvement in pain was 34%(25% to 42%)3; NNTB 2 (1 to 4)4 |
| Function (higher scores mean worse) | Weighted mean disability in the control groups at the end of treatment was 34.90 (0 to 100 scale). | Weighted mean disability in the intervention groups was | ‐ | 97 | ⊕⊕⊕⊝ | Absolute improvement in disability was 15% (11% to 19%); Relative improvement in disability was 37% (27% to 47%)3; NNTB 2 (1 to 3). |
| Adverse events | 42 per 1000 | 41 per 1000 | RR 0.98 | 97 | ⊕⊕⊕⊝ | Absolute risk of adverse events was 0% lower in the Boswellia serrata group (8% lower to 8% higher); Relative percentage change 2% improvement (86% improvement to 569% worsening); NNT n/a.5 |
| Adverse events Participants (n) withdrew due to adverse effects | See comment | See comment | Not estimable | ‐ | See comment | Reported NIL withdrawals due to adverse events. |
| Adverse events Participants (n) reported serious adverse events | See comment | See comment | Not estimable | ‐ | See comment | Reported NIL serious adverse events. |
| Radiographic joint changes | See comment | See comment | Not estimable | ‐ | See comment | Radiographic joint changes not measured. |
| Quality of life | See comment | See comment | Not estimable | ‐ | See comment | Quality of life not measured. |
| *The basis for the assumed risk (e.g. the median control group risk across studies) is provided in footnotes. The corresponding risk (and its 95% confidence interval) is based on the assumed risk in the comparison group and the relative effect of the intervention (and its 95% CI). | ||||||
| GRADE Working Group grades of evidence | ||||||
| 1Vishal 2011: 30 day intervention. Sengupta 2010: 90 day intervention. 4 Number needed to treat to benefit (NNTB), and harm (NNTH) = not applicable (n/a) when result is not statistically significant. NNT for continuous outcomes calculated using Wells Calculator (CMSG editorial office). NNT for dichotomous outcomes calculated using Cates NNT calculator (http://www.nntonline.net/visualrx/). 5Sengupta 2010, Vishal 2011: WOMAC scores presented as subscale scores only. Overall WOMAC not reported. | ||||||
| Boswellia serrata compared to valdecoxib for treating osteoarthritis | ||||||
| Patient or population: patients with treating osteoarthritis | ||||||
| Outcomes | Illustrative comparative risks* (95% CI) | Relative effect | No of Participants | Quality of the evidence | Comments | |
| Assumed risk | Corresponding risk | |||||
| Valdecoxib | Boswellia serrata | |||||
| Pain (higher scores mean worse) | Mean pain in the valdecoxib group at the end of treatment was 17.08 (0 to 100 scale). | Mean pain in the intervention groups was | ‐ | 58 | ⊕⊝⊝⊝ | Absolute improvement in pain was 1% (7% improvement to 6% worsening); Relative improvement in pain was 1%4; NNT n/a.5 |
| Function Follow‐up: mean 6 months | Mean disability in the valdecoxib group at the end of treatment was 16.64 (0 to 100 scale). | Mean disability in the intervention groups was | ‐ | 58 | ⊕⊝⊝⊝ | Absolute worsening in disability was 3% (4% improvement to 9% worsening); Relative improvement in disability was 4%4; NNT n/a.5 |
| Adverse events | 61 per 1000 | 121 per 1000 | RR 2.0 | 66 | ⊕⊝⊝⊝ | Absolute risk of adverse events was 6% higher in the Boswellia serrata group (8% lower to 20% higher); Relative percentage change 100% worsening (61% improvement to 918% worsening); NNT n/a.5 |
| Adverse events Participants (n) withdrew due to adverse effects | RR 3.0 (0.13 to 71.07) | 66 | ⊕⊝⊝⊝ | Reported one (1) withdrawal possibly due to adverse events. Absolute risk of withdrawal due to adverse events was 3% higher in the Boswellia serrata group (5% lower to 11% higher); Relative percentage change 200% worsening (87% improvement to 7007% worsening); NNT n/a.5 | ||
| Adverse events Participants (n) reported serious adverse events | See comment | See comment | Not estimable | 66 | See comment | Reported NIL serious adverse events. |
| Radiographic joint changes | See comment | See comment | Not estimable | ‐ | See comment | Radiographic joint changes not measured. |
| Quality of life | See comment | See comment | Not estimable | ‐ | See comment | Quality of life not measured. |
| *The basis for the assumed risk (e.g. the median control group risk across studies) is provided in footnotes. The corresponding risk (and its 95% confidence interval) is based on the assumed risk in the comparison group and the relative effect of the intervention (and its 95% CI). | ||||||
| GRADE Working Group grades of evidence | ||||||
| 1 Open trial. Medication regimens differ between active control and intervention. 2 Downgrade estimate due to single study. Treatment effect crosses midline (no effect). 4 Baseline pain in valdecoxib group 49.2, baseline disability 51.6. Aggregate WOMAC scores converted to normalised scores for re‐analysis. 5 Number needed to treat (NNT) = not applicable (n/a) when result is not statistically significant. NNT for continuous outcomes calculated using Wells Calculator (CMSG editorial office). NNT for dichotomous outcomes calculated using Cates NNT calculator (http://www.nntonline.net/visualrx/). | ||||||
| Persea gratissma + Glycine max (ASU 300 mg) for treating osteoarthritis | ||||||
| Patient or population: patients with osteoarthritis | ||||||
| Outcomes | Illustrative comparative risks* (95% CI) | Relative effect | No of Participants | Quality of the evidence | Comments | |
| Assumed risk | Corresponding risk | |||||
| Control | Persea gratissma + Glycine max (ASU 300mg) | |||||
| Pain | Weighted mean pain in the control groups at end of treatment was 40.53 (0 to 100 scale). | Weighted mean pain in the intervention groups was | ‐ | 651 | ⊕⊕⊕⊝ | Absolute improvement in pain was 8% (1% to 16%); Relative improvement in pain was 15% (2% to 29%)2; NNTB 8 (4 to 77)3 |
| Function | Mean disability in the control group at end of treatment was 47.10 mm, on VAS 0 to 100 mm scale (higher scores mean worse)5. | Mean disability in the intervention groups was | ‐ | 642 | ⊕⊕⊕⊝ | SMD ‐0.42 (95% CI ‐0.73 to ‐0.11), in favour of ASU 300mg Absolute improvement in disability was 7% (2% to 12%); Relative improvement in disability was 13% (4% to 23%)7; NNTB 5 (3 to 19)3 |
| Adverse events | 510 per 1000 | 531 per 1000 | RR 1.04 | 1050 | ⊕⊕⊕⊝ | Absolute risk of adverse events is 2% higher in the ASU group (2% lower to 7% higher); Relative percentage change 4% worsening (9% improvement to 12% worsening); NNT n/a3 |
| Adverse events Participants (n) withdrew due to adverse effects | 148 per 1000 | 169 per 100 (108 to 267) | RR 1.14 (0.73 to 1.80) | 398 (1 study) | ⊕⊕⊕⊝ | Absolute risk of participants withdrawing due to adverse events in 2% higher in ASU group (5% lower to 9% higher); Relative percentage change 14% worsening (27% improvement to 90% worsening); NNT n/a.3,9 |
| Adverse events Participants (n) reported serious adverse events | 325 per 1000 | 397 per 1000 (306 to 517) | RR 1.22 (0.94 to 1.59) | 398 (1 study) | ⊕⊕⊕⊝ | Absolute risk of serious adverse events is 7% higher in the ASU group (2% lower to 17% higher); Relative percentage change 22% worsening (6% improvement to 59% worsening); NNT n/a.3,9 |
| Radiographic joint changes Change in Joint Space Width (JSW) from baseline (higher scores mean worse). Follow up: 24 to 36 months. | Weighted mean JSW change from baseline in the control groups at end of treatment was 0.65. | Mean JSW change from baseline in the intervention groups was 0.12 lower (0.43 lower to 0.19 higher) | ‐ | 453 (2 studies) | ⊕⊕⊕⊝ | Absolute change NNT n/a.3,9 |
| Quality of life | See comment | See comment | Not estimable | ‐ | See comment | Quality of life not measured. |
| *The basis for the assumed risk (e.g. the median control group risk across studies) is provided in footnotes. The corresponding risk (and its 95% confidence interval) is based on the assumed risk in the comparison group and the relative effect of the intervention (and its 95% CI). | ||||||
| GRADE Working Group grades of evidence | ||||||
| 1Downgrade due to heterogeneity, inconsistency 2 Calculations based on control group baseline pain measure taken from Blotman 1997, the most heavily weighted study in the meta‐analysis. Control group baseline mean (SD) pain 54.3 (11.9). 3 Number needed to treat to benefit (NNTB), or to harm (NNTH) = not applicable (n/a) when result is not statistically significant. NNT for dichotomous outcomes calculated using Cates NNT calculator (http://www.nntonline.net/visualrx/)NNT for continuous outcomes calculated using Wells Calculator (CMSG editorial office), assuming a minimal clinically important difference of 15 mm on a 0 to 100 mm pain scale, and 10 mm on a 0 to 100 mm function scale. 4 Multiple tools: Disability VAS reported in one study only (Maheu 1998); WOMAC change score reported in one study (Maheu 2013); Lequesne algofunctional index reported in four studies, but to avoid over‐reporting, data were extracted on this outcome from three studies only (Appelboom 2001, Blotman 1997, Lequesne 2002) 5 From Maheu 1998: follow‐up disability score in the control group 47.10 mm (VAS 0 to 100 mm scale) 6 Four trials pooled (Appelboom 2001, Blotman 1997, Lequesne 2002, Maheu 1998) using SMD, and re‐expressed as MD by multiplying the SMD (95% CI) by the baseline SD in the control group of Maheu 1998 (16.78). 7 Calculations based on data from Maheu 1998: control group baseline mean (SD) disability 52.5 (16.78), 0 to 100 mm VAS scale. 8 Downgrade estimate due to imprecision: few participants. 9 Treatment effect crosses midline (no effect). | ||||||
| Persea gratissma + Glycine max (ASU 600 mg) for treating osteoarthritis | ||||||
| Patient or population: patients with osteoarthritis | ||||||
| Outcomes | Illustrative comparative risks* (95% CI) | Relative effect | No of Participants | Quality of the evidence | Comments | |
| Assumed risk | Corresponding risk | |||||
| Control | Persea gratissma + Glycine max (ASU 600mg) | |||||
| Pain (higher scores mean worse) Follow up: 3 months | Mean pain in the control group at the end of treatment was 42.4 (0 to 100 scale). | Mean pain in the intervention group was | ‐ | 156 | ⊕⊕⊕⊝ | Absolute improvement in pain was 14% (21% to 8%); Relative improvement in pain was 26.5%2; NNT = |
| Function (higher scores mean worse) | Mean disability in the control group at the end of treatment was 7.8 (0 to 24 scale). | Mean disability in the intervention group was | ‐ | 156 | ⊕⊕⊕⊝ | Absolute improvement in disability was 1% (1% to 0%); Relative improvement in disability was 13.7%2; NNT = |
| Adverse events | 261 per 1000 | 278 per 1000 | RR 1.07 | 174 | ⊕⊕⊕⊝ | Absolute risk of adverse events is 2% higher in the ASU group (11% lower to 15% higher); Relative percentage change 7% worsening (34% improvement to 74% worsening); NNT n/a.3 |
| Adverse events Participants (n) withdrew due to adverse effects | See comment | See comment | Not estimable | 174 | See comment | Withdrawals due to adverse events not reported as a discrete outcome in ASU 600mg subgroup. |
| Adverse events Participants (n) reported serious adverse events | See comment | See comment | Not estimable | 174 | See comment | Serious adverse events not reported as a discrete outcome in ASU 600mg subgroup. |
| Radiographic joint changes | See comment | See comment | Not estimable | ‐ | See comment | Radiographic joint changes not measured. |
| Quality of life | See comment | See comment | Not estimable | ‐ | See comment | Quality of life not measured. |
| *The basis for the assumed risk (e.g. the median control group risk across studies) is provided in footnotes. The corresponding risk (and its 95% confidence interval) is based on the assumed risk in the comparison group and the relative effect of the intervention (and its 95% CI). | ||||||
| GRADE Working Group grades of evidence | ||||||
| 1 Single study. 2 Control group baseline mean (SD) pain 53.5 (13.9), baseline mean (SD) disability 9.5 (2.2), from Appelboom 2001. 3 Number needed to treat (NNT) = not applicable (n/a) when result is not statistically significant. NNT for continuous outcomes calculated using Wells Calculator (CMSG editorial office). NNT for dichotomous outcomes calculated using Cates NNT calculator (http://www.nntonline.net/visualrx/). | ||||||
| Persea gratissma + Glycine max (ASU 300 mg) compared to chondroitin sulphate for treating osteoarthritis | ||||||
| Patient or population: patients with osteoarthritis | ||||||
| Outcomes | Illustrative comparative risks* (95% CI) | Relative effect | No of Participants | Quality of the evidence | Comments | |
| Assumed risk | Corresponding risk | |||||
| Chondroitin sulphate | Persea gratissma + Glycine max (ASU 300mg) | |||||
| Pain (higher scores mean worse) | Mean pain in the chondroitin sulphate group at the end of treatment was 22.88 (0 to 100 scale). | The mean pain in the intervention group was | ‐ | 357 | ⊕⊕⊝⊝ | Absolute worsening of pain was 10% (10% improvement to 31% worsening); Relative worsening of pain was 3%3; NNT n/a.4 |
| Function (higher scores mean worse) | Mean function in the chondroitin sulphate group at the end of treatment was 25.14 (0 to 100 scale). | The mean disability in the intervention group was | ‐ | 357 | ⊕⊕⊝⊝ | Absolute worsening of disability was 28% (43% improvement to 98% worsening); Relative worsening of disability was 3%3; NNT n/a.4 |
| Adverse events | 244 per 1000 | 210 per 1000 | RR 0.86 | 357 | ⊕⊕⊝⊝ | Absolute risk of adverse events was 3% lower in the ASU group (12% lower to 5% higher); Relative percentage change 14% improvement (41% improvement to 26% worsening); NNT n/a.4 |
| Adverse events Participants (n) withdrew due to adverse effects | See comment | See comment | Not estimable | 357 | Withdrawals due to adverse events not reported as a discrete outcome. | |
| Adverse events Participants (n) reported serious adverse events | 6 per 1000 | 17 per 1000 (2 to 158) | RR 2.92 (0.31 to 27.78) | 357 | ⊕⊕⊝⊝ | Absolute risk of serious adverse events was 1% higher in the ASU group (1% lower to 3% higher); Relative percentage change 192% worsening (69% improvement to 2678% worsening); NNT n/a.4 |
| Radiographic joint changes | See comment | See comment | Not estimable | ‐ | See comment | Radiographic joint changes not measured. |
| Quality of life | See comment | See comment | Not estimable | ‐ | See comment | Quality of life not measured. |
| *The basis for the assumed risk (e.g. the median control group risk across studies) is provided in footnotes. The corresponding risk (and its 95% confidence interval) is based on the assumed risk in the comparison group and the relative effect of the intervention (and its 95% CI). | ||||||
| GRADE Working Group grades of evidence | ||||||
| 1 SIngle study. Treatment effect crosses midline (no effect). 2 Chondroitin sulfate might not be active control. Non‐inferiority hypothesis may be flawed. 3 Chrondroitin sulfate group baseline pain 49.08, baseline disability 49.07. Aggregate WOMAC scores converted to normalised scores for re‐analysis. 4 Number needed to treat (NNT) = not applicable (n/a) when result is not statistically significant. NNT for continuous outcomes calculated using Wells Calculator (CMSG editorial office). NNT for dichotomous outcomes calculated using Cates NNT calculator (http://www.nntonline.net/visualrx/). | ||||||
| PLANT | MEDICINAL PRODUCT | DOSE | MARKER | |||||
| Botanical name | Part/s | Tradename | Preparation | Drug:Extract | mg/day | Constituent marker | Quantity of marker | References |
| Medicinal products from single plants | ||||||||
| Boswellia serrata | gum resin | CapWokvelTM | extraction solvent not stated | not stated | 999 | boswellic acid (total organic acids 65%) | 40% | |
| 5‐Loxin | 100 or 250 | AKBA | 30% | |||||
| Aflapin | 100 | AKBA + non‐volatile oil | 20% | |||||
| Curcuma domestica | root | study medication | ethanolic extract | not stated | curcumoids | 500mg | ||
| Derris scandens | stem | study medication | ethanolic (50%) extract | not stated | 800 | genistein derivatve | not stated | |
| Garcinia kola | seed | study medication | freeze‐dried aqueous extract | not stated | 400 | not stated | ||
| Harpagophytum procumbens | root | Arthrotabs | aqueous extract | 1.5‐2.5:1 | 2400 | harpagoside1 | 30 mg | |
| Flexiloges | ethanolic (60%) extract | 4.5‐5.5:1 | 960 | <30 mg | ||||
| Harpadol | cryoground powder | 2610 | 60 mg | |||||
| Petiveria alliacea | herb | Tipi tea | aqueous extract | 9g / 600 ml | 600 ml | not stated | ||
| Pinus pinaster (synonym Pinus maritima) | bark | Pycnogenol® | polyphenol concentrate | 150 | proanthocyanidins | 45 (90%) | ||
| 100 | not stated | |||||||
| 150 | 70% | |||||||
| Ricinus officinalis | seed | study medication | oil | not stated | 2,7 ml | ricinoleic acid | not stated | |
| Rosa canina lito | rose hip and seed | Hyben Vital or Litozin | powder | 5000 | galactolipid | 1.5mg | ||
| Salix daphnoides | bark | study medication | ethanolic (70%) extract | 8‐14:1 | 1573 | salicin | 240 mg | |
| Salix pupurea x daphnoides | bark | study medication | ethanolic (70%) extract2 | 10‐20:1 | 1360 | salicin | 240 mg | |
| Uncaria guianensis | bark | study medication | freeze‐dried aqueous extract | not stated | 100 | not stated | ||
| Vitellaria paradoxa | seed | study medication | patented extract | not stated | 2250 | triterpenes | 75% | |
| Zingiber officinale3 | root | EV.EXT 33 | acetone extract3 | 20:1 | 510 | not stated | ||
| Zingiber officinale | root | Zintona EC | CO2 extract | not stated | 1000 | gingerol | 40 mg | |
| Medicinal products from two plants | ||||||||
| Boswellia carteri + Curcuma longa | gum + root | study medication | extract, solvent not stated | not stated | not stated | boswellic acid | 37.5% | |
| Persea gratissma (P) + Glycine max (G) | oils | Piascledine 300 | unsaponifiable fraction 1/3 P;2/3 G | 300 or 600 | not stated | Appelboom 2001, Blotman 1997, Lequesne 2002, Maheu 1998, Maheu 2013. | ||
| Phellondenron amurense + Citrus sinensis | bark peel | NP 06‐1 | extract, solvent not stated | not stated | 370 mixture | berberine polymethoxylated flavones | 50% 30% | |
| Uncaria guianensis + Lepidium meyenii | bark | Reparagen® | freeze‐dried aqueous extract | not stated | 1500 300 | not stated | ||
| Zingiber officinale + Alpinia galanga | root | EV.EXT 77 | acetone extract3 | 20:1 | not stated | not stated | ||
| Medicinal products from three or more plants | ||||||||
| Clematis mandshurica + Prunella vulgaris + Trichosanthes kirilowii | root, flower, root; 1:1:2 | SKI306X | ethanol 30% extracts, thereafter butanol extraction | 7:1 | 600‐1800 | oleanolic acid 4%, rosmarinic acids 0.2%, ursolic acids 0.5%, hydroxybenzoic acid 0.03%, | ||
| Fraxinus excelsior | bark | Phytodolor | fresh plant ethanolic (45,6%) extract | 3:1:1 | 5‐8 ml | total flavonoids | 0.34 ‐ 0.56 mg | |
| salicyl alcohol | 0.48 ‐ 0.8 mg | |||||||
| Solidago virgaurea | herb | isofraxidin | 0.67 ‐ 1.1 mg | |||||
| Populus tremula | bark and leaf | salicin | 4.8 ‐ 8 mg | |||||
| Salix alba | bark | Reumalex | powder | 200 | salicin | 40‐80mg | ||
| Guaiacun officinale | resin | powder | 80 | |||||
| Cimicifuga racemosa | root | powder | 70 | |||||
| Smilax (species not stated) | root | extract, solvent not stated | 4:1 | 50 | ||||
| Populus (species not stated) | bark | extract, solvent not stated | 7:1 | 34 | ||||
| Chinese mixture4 | herb | Duhuo Jisheng Wan | powder | 3 x 3 g | not stated | |||
| Paeoniae alba | root | Chinese mixture: Blood nourishing, hard softening (BNHS) | extract, solvent not stated | not stated | 3150 | paconiflorin | not stated | |
| Gentiana macrophylla | gentianine | |||||||
| Glycyrrhiza (species not stated) | not stated | |||||||
| Auryvedic formaulae5 | powder | not stated | 1000 | total gingerols | not stated | |||
| Zingiber officinale | rhizome | component of formulae A, B, C, D, and E | ||||||
| Tinospora cordifolia | stem | component of formulae A, B, C, D, and E | aqueous extract | 220 | tinosporosides | not stated | ||
| Withania somnifera | root | component of formulae B and E | aqueous extract | 600 | total withanolides | not stated | ||
| Emblica officinale | fruit | component of formulae C | aqueous extract | 500 | tannins galic acid | not stated | ||
| Tribulus terrestris | fruit | component of formulae A and B | aqueous extract | 216 | total saponins | not stated | ||
| Ayuvedic formula6 | Antarth3 (for sandhigata vata) | not stated | not stated | not stated | not stated | |||
| Ayuvedic formula | RA‐11 | not stated | not stated | not stated | not stated | |||
| Ayuvedic formula | SGC | |||||||
| Ayuvedic | SGCG | |||||||
| Japanese mixture7 | Boiogito | not stated | not stated | 7.5g | not stated | not stated | ||
| 1. Harpagoside content estimated indirectly and approximately from iridoid glycoside content in daily dose of raw material (Sporer 1999). 2. Ethanolic extract stated in unpublished thesis but not in published paper (Schmid 1998b). 3. Information provided by manufacturer but not reported in paper. 4. Chinese herbal medicine contains 7.75% each of: radix angelicae pubescentiis, radix gentianae macrophyllae, cortex eucommiae, radix achyranthis bidentatae, radix angelicae sinensis, herba taxilli, radix rehmanniae preparata, rhizoma chuanxiong, cortex cinnamomi, radix ledebouriellae. 5% each of: radix paeoniae alba, radix codonopis, radix glycyrrhizae, poria. 2.5% herba asari. 5. All Ayurvedic formulae A‐E contain Zingiber officinale (dried rhizome powder, total gingerols as marker), and Tinospora cordifolia (dried stem aqueous extract, marker tinosporosides). Some formulae also included Emblica officinale, Withania somnifera, or Tribulus terrestris. Drug:extract ratio and marker content not stated. 6. Ayurvedic phytomedicine Antarth contains Boswellia serrata, Commiphora mukul, Curcuma longa and Vitex negundo, Alpinia galangal, Withania somnifera, Tribulus terrestris, and Tinospora cordifolia. 7. Japanese herbal medicine Boiogito contains Sinomenium acutum, Astragalus (species not stated) root, Atractylodes lancea rhizome, Jujube (probably Ziziphus zizyphus), Glycyrrhiza (species not stated), and ginger (species not stated, probably Zingiber officinale). | ||||||||
| Outcome or subgroup title | No. of studies | No. of participants | Statistical method | Effect size |
| 1 Pain (0 to 3) Show forest plot | 1 | Mean Difference (IV, Random, 95% CI) | Totals not selected | |
| 2 Function: loss of function (0 to 3) Show forest plot | 1 | Mean Difference (IV, Random, 95% CI) | Totals not selected | |
| 3 Participants (n) reported adverse effects Show forest plot | 1 | Risk Ratio (M‐H, Random, 95% CI) | Totals not selected | |
| Outcome or subgroup title | No. of studies | No. of participants | Statistical method | Effect size |
| 1 Pain VAS 0‐100 at 90 days Show forest plot | 2 | 85 | Mean Difference (IV, Random, 95% CI) | ‐16.57 [‐24.67, ‐8.47] |
| 2 WOMAC‐VAS (Function) Show forest plot | 2 | 85 | Mean Difference (IV, Random, 95% CI) | ‐8.21 [‐14.21, ‐2.22] |
| 3 Adverse event episodes (n) reported Show forest plot | 1 | Risk Ratio (M‐H, Random, 95% CI) | Totals not selected | |
| Outcome or subgroup title | No. of studies | No. of participants | Statistical method | Effect size |
| 1 Pain VAS 0‐100 at 90 days Show forest plot | 1 | Mean Difference (IV, Random, 95% CI) | Totals not selected | |
| 2 WOMAC‐VAS (Function) Show forest plot | 1 | Mean Difference (IV, Random, 95% CI) | Totals not selected | |
| 3 Adverse event episodes (n) reported Show forest plot | 1 | Risk Ratio (M‐H, Random, 95% CI) | Totals not selected | |
| Outcome or subgroup title | No. of studies | No. of participants | Statistical method | Effect size |
| 1 Pain VAS 0‐100 Show forest plot | 2 | 97 | Mean Difference (IV, Random, 95% CI) | ‐16.09 [‐20.37, ‐11.81] |
| 1.1 At 90 days | 1 | 38 | Mean Difference (IV, Random, 95% CI) | ‐18.10 [‐24.95, ‐11.25] |
| 1.2 At 30 days | 1 | 59 | Mean Difference (IV, Random, 95% CI) | ‐14.80 [‐20.29, ‐9.31] |
| 2 WOMAC‐VAS (Function) Show forest plot | 2 | 97 | Mean Difference (IV, Random, 95% CI) | ‐15.01 [‐19.21, ‐10.81] |
| 2.1 At 30 days | 1 | 59 | Mean Difference (IV, Random, 95% CI) | ‐14.30 [‐20.07, ‐8.53] |
| 2.2 At 90 days | 1 | 38 | Mean Difference (IV, Random, 95% CI) | ‐15.8 [‐21.92, ‐9.68] |
| 3 Participants (n) reported adverse events Show forest plot | 2 | 97 | Odds Ratio (M‐H, Random, 95% CI) | 0.98 [0.13, 7.29] |
| 3.1 At 30 days | 1 | 59 | Odds Ratio (M‐H, Random, 95% CI) | 0.97 [0.06, 16.20] |
| 3.2 At 90 days | 1 | 38 | Odds Ratio (M‐H, Random, 95% CI) | 1.0 [0.06, 17.25] |
| Outcome or subgroup title | No. of studies | No. of participants | Statistical method | Effect size |
| 1 WOMAC‐VAS (Pain) Show forest plot | 1 | 58 | Mean Difference (IV, Random, 95% CI) | ‐0.51 [‐7.26, 6.24] |
| 2 WOMAC‐VAS (Function) Show forest plot | 1 | 58 | Mean Difference (IV, Random, 95% CI) | 2.49 [‐4.07, 9.05] |
| 3 Participants (n) reported adverse events Show forest plot | 1 | 66 | Risk Ratio (M‐H, Random, 95% CI) | 2.0 [0.39, 10.18] |
| 4 Participants (n) withdrew due to adverse events Show forest plot | 1 | 66 | Risk Ratio (M‐H, Random, 95% CI) | 3.0 [0.13, 71.07] |
| Outcome or subgroup title | No. of studies | No. of participants | Statistical method | Effect size |
| 1 Pain on walking NRS 0‐10 Show forest plot | 1 | Mean Difference (IV, Random, 95% CI) | Subtotals only | |
| 2 Function: 100m walk time (seconds) Show forest plot | 1 | Mean Difference (IV, Random, 95% CI) | Subtotals only | |
| 3 Participants (n) reported adverse events Show forest plot | 1 | 100 | Risk Ratio (M‐H, Random, 95% CI) | 0.75 [0.46, 1.25] |
| Outcome or subgroup title | No. of studies | No. of participants | Statistical method | Effect size |
| 1 WOMAC‐VAS (Pain) change from baseline Show forest plot | 1 | 107 | Mean Difference (IV, Random, 95% CI) | 5.0 [‐1.84, 11.84] |
| 2 WOMAC‐VAS (Function) change from baseline Show forest plot | 1 | 107 | Mean Difference (IV, Random, 95% CI) | 5.10 [‐0.13, 10.33] |
| 3 Participants (n) reported adverse events. Show forest plot | 1 | 125 | Risk Ratio (M‐H, Random, 95% CI) | 0.75 [0.49, 1.15] |
| Outcome or subgroup title | No. of studies | No. of participants | Statistical method | Effect size |
| 1 Pain VAS 0‐100 change from baseline at 120 days Show forest plot | 1 | 92 | Mean Difference (IV, Random, 95% CI) | ‐5.10 [‐6.52, ‐3.68] |
| 2 Participants (n) reported adverse events Show forest plot | 1 | 92 | Risk Ratio (M‐H, Random, 95% CI) | 0.4 [0.21, 0.75] |
| Outcome or subgroup title | No. of studies | No. of participants | Statistical method | Effect size |
| 1 Pain (scale unknown) with mvt change from baseline Show forest plot | 1 | 40 | Mean Difference (IV, Random, 95% CI) | ‐0.10 [‐1.31, 1.11] |
| 2 Participants (n) reported adverse events Show forest plot | 1 | 40 | Risk Ratio (M‐H, Random, 95% CI) | 1.5 [0.28, 8.04] |
| Outcome or subgroup title | No. of studies | No. of participants | Statistical method | Effect size |
| 1 WOMAC‐VAS (Pain) Show forest plot | 1 | 37 | Mean Difference (IV, Random, 95% CI) | ‐142.0 [‐199.55, ‐84.45] |
| 2 WOMAC‐VAS (Function) Show forest plot | 1 | 37 | Mean Difference (IV, Random, 95% CI) | ‐529.0 [‐741.59, ‐316.41] |
| 3 Participants (n) reported adverse events Show forest plot | 2 | 137 | Risk Ratio (M‐H, Random, 95% CI) | 0.40 [0.08, 1.97] |
| Outcome or subgroup title | No. of studies | No. of participants | Statistical method | Effect size |
| 1 WOMAC 0‐4 (Pain) Show forest plot | 1 | 156 | Mean Difference (IV, Random, 95% CI) | ‐7.50 [‐8.43, ‐6.57] |
| 2 WOMAC 0‐4 (Function) Show forest plot | 1 | 156 | Mean Difference (IV, Random, 95% CI) | ‐29.3 [‐30.99, ‐27.61] |
| Outcome or subgroup title | No. of studies | No. of participants | Statistical method | Effect size |
| 1 Participants (n) reported adverse events Show forest plot | 1 | 100 | Risk Ratio (M‐H, Random, 95% CI) | 0.04 [0.00, 0.66] |
| Outcome or subgroup title | No. of studies | No. of participants | Statistical method | Effect size |
| 1 Relief of pain (0 to 4) at 3 months Show forest plot | 1 | 97 | Mean Difference (IV, Random, 95% CI) | 0.43 [‐0.12, 0.98] |
| 2 WOMAC‐VAS (Pain) Show forest plot | 1 | 94 | Mean Difference (IV, Random, 95% CI) | ‐2.5 [‐10.20, 5.20] |
| 3 WOMAC‐VAS (Function) Show forest plot | 1 | 94 | Mean Difference (IV, Random, 95% CI) | ‐1.20 [‐8.98, 6.58] |
| 4 Participants (n) reported adverse events Show forest plot | 2 | 194 | Risk Ratio (M‐H, Random, 95% CI) | 1.67 [0.63, 4.43] |
| Outcome or subgroup title | No. of studies | No. of participants | Statistical method | Effect size |
| 1 Pain VAS 0‐100 at 14 days Show forest plot | 1 | 68 | Mean Difference (IV, Random, 95% CI) | 0.0 [0.0, 0.0] |
| 2 Function VAS 0‐100 at 14 days Show forest plot | 1 | 68 | Mean Difference (IV, Random, 95% CI) | 0.0 [0.0, 0.0] |
| 3 Participants (n) reported adverse events Show forest plot | 1 | 84 | Risk Ratio (M‐H, Random, 95% CI) | 0.91 [0.57, 1.43] |
| Outcome or subgroup title | No. of studies | No. of participants | Statistical method | Effect size |
| 1 WOMAC‐VAS (Pain) Show forest plot | 1 | Mean Difference (IV, Random, 95% CI) | Subtotals only | |
| 1.1 At 14 days | 1 | 86 | Mean Difference (IV, Random, 95% CI) | 0.0 [0.0, 0.0] |
| 1.2 At 42 days | 1 | 86 | Mean Difference (IV, Random, 95% CI) | 15.0 [5.91, 24.09] |
| 2 WOMAC‐VAS (Function) Show forest plot | 1 | Mean Difference (IV, Random, 95% CI) | Subtotals only | |
| 2.1 At 14 days | 1 | 86 | Mean Difference (IV, Random, 95% CI) | 0.0 [0.0, 0.0] |
| 2.2 At 42 days | 1 | 86 | Mean Difference (IV, Random, 95% CI) | 12.0 [2.70, 21.30] |
| 3 Participants (n) reported adverse events Show forest plot | 1 | 86 | Risk Ratio (M‐H, Random, 95% CI) | 0.63 [0.43, 0.93] |
| Outcome or subgroup title | No. of studies | No. of participants | Statistical method | Effect size |
| 1 Pain VAS 0‐100 (night) Show forest plot | 1 | 45 | Mean Difference (IV, Random, 95% CI) | ‐11.10 [‐26.44, 4.24] |
| 2 Participants (n) reported adverse events Show forest plot | 1 | 45 | Risk Ratio (M‐H, Random, 95% CI) | 1.67 [0.54, 5.17] |
| Outcome or subgroup title | No. of studies | No. of participants | Statistical method | Effect size |
| 1 Pain VAS 0‐100 (movement) Show forest plot | 1 | 24 | Mean Difference (IV, Random, 95% CI) | ‐9.0 [‐31.12, 13.12] |
| 2 Function (handicap) VAS 0‐100 Show forest plot | 1 | 24 | Mean Difference (IV, Random, 95% CI) | ‐6.0 [‐27.25, 15.25] |
| 3 Participants (n) reported adverse events Show forest plot | 1 | 24 | Risk Ratio (M‐H, Random, 95% CI) | 3.5 [0.16, 78.19] |
| Outcome or subgroup title | No. of studies | No. of participants | Statistical method | Effect size |
| 1 Function: pain free walking time (minutes) Show forest plot | 1 | Mean Difference (IV, Random, 95% CI) | Totals not selected | |
| 1.1 At 1 month | 1 | Mean Difference (IV, Random, 95% CI) | 0.0 [0.0, 0.0] | |
| 1.2 At 2 months | 1 | Mean Difference (IV, Random, 95% CI) | 0.0 [0.0, 0.0] | |
| 1.3 At 3 months | 1 | Mean Difference (IV, Random, 95% CI) | 0.0 [0.0, 0.0] | |
| Outcome or subgroup title | No. of studies | No. of participants | Statistical method | Effect size |
| 1 Pain VAS 0‐100 Show forest plot | 4 | 651 | Mean Difference (IV, Random, 95% CI) | ‐8.47 [‐15.90, ‐1.04] |
| 1.1 At 3 months | 2 | 326 | Mean Difference (IV, Random, 95% CI) | ‐11.90 [‐23.95, 0.15] |
| 1.2 At 6 months | 1 | 162 | Mean Difference (IV, Random, 95% CI) | ‐10.40 [‐17.20, ‐3.60] |
| 1.3 At 12 months | 1 | 163 | Mean Difference (IV, Random, 95% CI) | 1.0 [‐6.58, 8.58] |
| 2 Pain VAS 0‐100 change from baseline at 36 months Show forest plot | 1 | 345 | Mean Difference (IV, Random, 95% CI) | ‐0.66 [‐7.39, 6.07] |
| 3 Pain VAS 0‐100 grouped by joint Show forest plot | 1 | 324 | Mean Difference (IV, Random, 95% CI) | ‐9.06 [‐15.24, ‐2.88] |
| 3.1 VAS (hip OA) | 1 | 162 | Mean Difference (IV, Random, 95% CI) | ‐13.80 [‐25.22, ‐2.38] |
| 3.2 VAS (knee OA) | 1 | 162 | Mean Difference (IV, Random, 95% CI) | ‐7.10 [‐14.45, 0.25] |
| 4 Function: disability VAS 0‐100 Show forest plot | 1 | Mean Difference (IV, Random, 95% CI) | Totals not selected | |
| 5 WOMAC‐VAS (Function) change from baseline at 36 months Show forest plot | 1 | 345 | Mean Difference (IV, Random, 95% CI) | ‐1.0 [‐7.14, 5.14] |
| 6 Lequesne algofunctional index Show forest plot | 3 | 480 | Mean Difference (IV, Random, 95% CI) | ‐1.17 [‐2.54, 0.20] |
| 6.1 At 3 months | 2 | 317 | Mean Difference (IV, Random, 95% CI) | ‐1.80 [‐2.68, ‐0.92] |
| 6.2 At 12 months | 1 | 163 | Mean Difference (IV, Random, 95% CI) | 0.10 [‐0.78, 0.98] |
| 7 Function (various tools) Show forest plot | 4 | 642 | Std. Mean Difference (IV, Random, 95% CI) | ‐0.42 [‐0.73, ‐0.11] |
| 8 Participants (n) reported adverse events Show forest plot | 5 | 1050 | Risk Ratio (M‐H, Random, 95% CI) | 1.04 [0.97, 1.12] |
| 9 Participants (n) withdrew due to adverse events Show forest plot | 1 | 398 | Risk Ratio (M‐H, Random, 95% CI) | 1.14 [0.73, 1.80] |
| 10 Particpants (n) reported serious adverse events Show forest plot | 1 | 398 | Risk Ratio (M‐H, Random, 95% CI) | 1.22 [0.94, 1.59] |
| 11 JSW change from baseline Show forest plot | 2 | 453 | Mean Difference (IV, Random, 95% CI) | ‐0.12 [‐0.43, 0.19] |
| 11.1 < median group, at 24 months | 1 | 55 | Mean Difference (IV, Random, 95% CI) | ‐0.43 [‐0.73, ‐0.13] |
| 11.2 > median group, at 24 months | 1 | 53 | Mean Difference (IV, Random, 95% CI) | 0.16 [‐0.31, 0.63] |
| 11.3 At 36 months | 1 | 345 | Mean Difference (IV, Random, 95% CI) | ‐0.03 [‐0.22, 0.16] |
| Outcome or subgroup title | No. of studies | No. of participants | Statistical method | Effect size |
| 1 Pain VAS 0‐100 Show forest plot | 1 | 156 | Mean Difference (IV, Random, 95% CI) | ‐14.2 [‐20.82, ‐7.58] |
| 2 Lequesne algofunctional index Show forest plot | 1 | 156 | Mean Difference (IV, Random, 95% CI) | ‐1.30 [‐2.38, ‐0.22] |
| 3 Participants (n) reported adverse events Show forest plot | 1 | 174 | Risk Ratio (M‐H, Random, 95% CI) | 1.07 [0.66, 1.74] |
| Outcome or subgroup title | No. of studies | No. of participants | Statistical method | Effect size |
| 1 WOMAC‐VAS (Pain) Show forest plot | 1 | Mean Difference (IV, Random, 95% CI) | Totals not selected | |
| 2 WOMAC‐VAS (Function) Show forest plot | 1 | Mean Difference (IV, Random, 95% CI) | Totals not selected | |
| 3 Participants (n) reported adverse events Show forest plot | 1 | 357 | Risk Ratio (M‐H, Random, 95% CI) | 0.86 [0.59, 1.26] |
| 4 Paricipants (n) reported serious adverse events Show forest plot | 1 | 357 | Risk Ratio (M‐H, Random, 95% CI) | 2.92 [0.31, 27.78] |
| Outcome or subgroup title | No. of studies | No. of participants | Statistical method | Effect size |
| 1 Lequesne algofunctional index Show forest plot | 1 | 45 | Mean Difference (IV, Random, 95% CI) | ‐3.82 [‐7.05, ‐0.59] |
| 1.1 Normal BMI participants | 1 | 18 | Mean Difference (IV, Random, 95% CI) | ‐2.2 [‐3.37, ‐1.03] |
| 1.2 Overweight BMI participants | 1 | 27 | Mean Difference (IV, Random, 95% CI) | ‐5.50 [‐6.95, ‐4.05] |
| Outcome or subgroup title | No. of studies | No. of participants | Statistical method | Effect size |
| 1 Participants (n) reported adverse events Show forest plot | 1 | 95 | Risk Ratio (M‐H, Random, 95% CI) | 0.77 [0.18, 3.24] |
| Outcome or subgroup title | No. of studies | No. of participants | Statistical method | Effect size |
| 1 Pain immediately after walking 50 feet VAS 0‐100 Show forest plot | 1 | 247 | Mean Difference (IV, Random, 95% CI) | ‐9.60 [‐16.81, ‐2.39] |
| 2 WOMAC‐VAS (Function) Show forest plot | 1 | Mean Difference (IV, Random, 95% CI) | Totals not selected | |
| 3 Participants (n) reported adverse events Show forest plot | 1 | Risk Ratio (M‐H, Random, 95% CI) | Totals not selected | |
| Outcome or subgroup title | No. of studies | No. of participants | Statistical method | Effect size |
| 1 Pain VAS 0‐100 change from baseline Show forest plot | 1 | Mean Difference (IV, Random, 95% CI) | Subtotals only | |
| 1.1 Low dose (600mg) SKI306X | 1 | 47 | Mean Difference (IV, Random, 95% CI) | ‐16.1 [‐25.19, ‐7.01] |
| 1.2 Medium dose (1200mg) SKI306X | 1 | 46 | Mean Difference (IV, Random, 95% CI) | ‐14.5 [‐23.04, ‐5.96] |
| 1.3 High dose (1800mg) SKI306X | 1 | 46 | Mean Difference (IV, Random, 95% CI) | ‐22.3 [‐31.82, ‐12.78] |
| 2 Lequesne algofunctional index change from baseline Show forest plot | 1 | 139 | Mean Difference (IV, Random, 95% CI) | ‐2.73 [‐3.71, ‐1.74] |
| 2.1 Low dose (600mg) SKI306X | 1 | 47 | Mean Difference (IV, Random, 95% CI) | ‐2.40 [‐4.05, ‐0.75] |
| 2.2 Medium dose (1200mg) SKI306X | 1 | 46 | Mean Difference (IV, Random, 95% CI) | ‐2.8 [‐4.62, ‐0.98] |
| 2.3 High dose (1800mg) SKI306X | 1 | 46 | Mean Difference (IV, Random, 95% CI) | ‐3.0 [‐4.68, ‐1.32] |
| 3 Participants (n) reported adverse events Show forest plot | 2 | 139 | Risk Ratio (M‐H, Random, 95% CI) | 0.93 [0.49, 1.79] |
| 3.1 Low dose (600mg) SKI306X | 1 | 47 | Risk Ratio (M‐H, Random, 95% CI) | 0.96 [0.32, 2.88] |
| 3.2 Medium dose (1200mg) SKI306X | 1 | 46 | Risk Ratio (M‐H, Random, 95% CI) | 1.2 [0.43, 3.38] |
| 3.3 High dose (1800mmg) SKI306X | 1 | 46 | Risk Ratio (M‐H, Random, 95% CI) | 0.6 [0.16, 2.22] |
| Outcome or subgroup title | No. of studies | No. of participants | Statistical method | Effect size |
| 1 Pain VAS 0‐100 change from baseline Show forest plot | 1 | 249 | Mean Difference (IV, Random, 95% CI) | 1.31 [‐2.78, 5.40] |
| 2 Lequesne algofunctional index change from baseline Show forest plot | 1 | 249 | Mean Difference (IV, Random, 95% CI) | 0.77 [0.10, 1.44] |
| 3 Participants (n) reported adverse events Show forest plot | 1 | 249 | Risk Ratio (M‐H, Random, 95% CI) | 0.61 [0.38, 0.97] |
| Outcome or subgroup title | No. of studies | No. of participants | Statistical method | Effect size |
| 1 Enduring pain (0 to 3) Show forest plot | 1 | 72 | Mean Difference (IV, Random, 95% CI) | 0.0 [0.0, 0.0] |
| 2 Function: mobility limitations (0 to 3) Show forest plot | 1 | 72 | Mean Difference (IV, Random, 95% CI) | 0.0 [0.0, 0.0] |
| 3 Participants (n) reported adverse events Show forest plot | 3 | 140 | Risk Ratio (M‐H, Random, 95% CI) | 0.33 [0.01, 7.92] |
| Outcome or subgroup title | No. of studies | No. of participants | Statistical method | Effect size |
| 1 AIMS2 arthritis pain score change from baseline Show forest plot | 1 | 52 | Mean Difference (IV, Random, 95% CI) | ‐0.89 [‐1.73, ‐0.05] |
| 2 Participants (n) reported adverse events Show forest plot | 1 | 52 | Risk Ratio (M‐H, Random, 95% CI) | 1.08 [0.40, 2.91] |
| Outcome or subgroup title | No. of studies | No. of participants | Statistical method | Effect size |
| 1 Pain VAS 0‐100 (total) Show forest plot | 1 | 200 | Mean Difference (IV, Random, 95% CI) | 11.81 [‐9.67, 33.29] |
| 2 Lequesne algofunctional index Show forest plot | 1 | 200 | Mean Difference (IV, Random, 95% CI) | 0.28 [‐0.89, 1.45] |
| 3 Participants (n) reported adverse events Show forest plot | 1 | 200 | Risk Ratio (M‐H, Random, 95% CI) | 1.04 [0.66, 1.63] |
| Outcome or subgroup title | No. of studies | No. of participants | Statistical method | Effect size |
| 1 Pain VAS 0‐100 (walking) Show forest plot | 1 | 60 | Mean Difference (IV, Random, 95% CI) | 2.0 [‐7.12, 11.12] |
| 2 WOMAC‐VAS (Function) Show forest plot | 1 | 60 | Mean Difference (IV, Random, 95% CI) | ‐2.0 [‐7.57, 3.57] |
| 3 Participants (n) reported adverse events Show forest plot | 1 | 60 | Risk Ratio (M‐H, Random, 95% CI) | 9.00 [0.51, 160.17] |
| Outcome or subgroup title | No. of studies | No. of participants | Statistical method | Effect size |
| 1 Pain VAS 0‐100 (walking) Show forest plot | 1 | 60 | Mean Difference (IV, Random, 95% CI) | ‐2.0 [‐6.81, 2.81] |
| 2 WOMAC‐VAS (Function) Show forest plot | 1 | 60 | Mean Difference (IV, Random, 95% CI) | 0.0 [‐2.53, 2.53] |
| 3 Participants (n) reported adverse events Show forest plot | 1 | 60 | Risk Ratio (M‐H, Random, 95% CI) | 9.00 [0.51, 160.17] |
| Outcome or subgroup title | No. of studies | No. of participants | Statistical method | Effect size |
| 1 Adverse event episodes (n) reported Show forest plot | 1 | 454 | Risk Ratio (M‐H, Random, 95% CI) | 0.95 [0.71, 1.28] |
| 1.1 Formula A versus placebo | 1 | 90 | Risk Ratio (M‐H, Random, 95% CI) | 0.96 [0.63, 1.45] |
| 1.2 Formula B versus placebo | 1 | 108 | Risk Ratio (M‐H, Random, 95% CI) | 1.35 [0.92, 1.98] |
| 1.3 Formula C versus placebo | 1 | 82 | Risk Ratio (M‐H, Random, 95% CI) | 0.78 [0.50, 1.21] |
| 1.4 Formula D versus placebo | 1 | 72 | Risk Ratio (M‐H, Random, 95% CI) | 0.57 [0.34, 0.93] |
| 1.5 Formula E versus placebo | 1 | 102 | Risk Ratio (M‐H, Random, 95% CI) | 1.22 [0.82, 1.80] |
| Outcome or subgroup title | No. of studies | No. of participants | Statistical method | Effect size |
| 1 Pain VAS 0‐100 Show forest plot | 1 | 88 | Mean Difference (IV, Random, 95% CI) | ‐1.0 [‐9.79, 7.79] |
| Outcome or subgroup title | No. of studies | No. of participants | Statistical method | Effect size |
| 1 Pain VAS 0‐100 Show forest plot | 1 | 90 | Mean Difference (IV, Random, 95% CI) | ‐1.03 [‐1.18, ‐0.88] |
| 2 WOMAC 0‐4 (Function) Show forest plot | 1 | 90 | Mean Difference (IV, Random, 95% CI) | ‐5.80 [‐6.72, ‐4.88] |
| 3 Participants (n) reported adverse events Show forest plot | 1 | 90 | Risk Ratio (M‐H, Random, 95% CI) | 1.05 [0.69, 1.58] |
| Outcome or subgroup title | No. of studies | No. of participants | Statistical method | Effect size |
| 1 Pain VAS 0‐100 change from baseline Show forest plot | 1 | 220 | Mean Difference (IV, Random, 95% CI) | 3.0 [‐3.28, 9.28] |
| 2 WOMAC 0‐4 (Function) change from baseline Show forest plot | 1 | 220 | Mean Difference (IV, Random, 95% CI) | 2.0 [‐0.72, 4.72] |
| 3 Participants (n) reported adverse events Show forest plot | 1 | 210 | Odds Ratio (M‐H, Random, 95% CI) | 1.04 [0.58, 1.86] |
| Outcome or subgroup title | No. of studies | No. of participants | Statistical method | Effect size |
| 1 Pain VAS 0‐100 change from baseline Show forest plot | 1 | 220 | Mean Difference (IV, Random, 95% CI) | ‐3.0 [‐8.98, 2.98] |
| 2 WOMAC 0‐4 (Function) change from baseline Show forest plot | 1 | 220 | Mean Difference (IV, Random, 95% CI) | 1.0 [‐1.60, 3.60] |
| 3 Participants (n) reported adverse events Show forest plot | 1 | 207 | Odds Ratio (M‐H, Random, 95% CI) | 1.00 [0.56, 1.79] |
| Outcome or subgroup title | No. of studies | No. of participants | Statistical method | Effect size |
| 1 Pain VAS 0‐100 change from baseline Show forest plot | 1 | 220 | Mean Difference (IV, Random, 95% CI) | 4.0 [‐1.42, 9.42] |
| 2 WOMAC 0‐4 (Function) change from baseline Show forest plot | 1 | 220 | Mean Difference (IV, Random, 95% CI) | 1.38 [‐1.40, 4.16] |
| 3 Participants (n) reported adverse events Show forest plot | 1 | 211 | Odds Ratio (M‐H, Random, 95% CI) | 0.85 [0.47, 1.54] |
| Outcome or subgroup title | No. of studies | No. of participants | Statistical method | Effect size |
| 1 Pain VAS 0‐100 change from baseline Show forest plot | 1 | 220 | Mean Difference (IV, Random, 95% CI) | ‐2.0 [‐7.42, 3.42] |
| 2 WOMAC 0‐4 (Function) change from baseline Show forest plot | 1 | 220 | Mean Difference (IV, Random, 95% CI) | 0.19 [‐2.59, 2.97] |
| 3 Participants (n) reported adverse events Show forest plot | 1 | 208 | Odds Ratio (M‐H, Random, 95% CI) | 0.82 [0.45, 1.48] |
| Outcome or subgroup title | No. of studies | No. of participants | Statistical method | Effect size |
| 1 Pain: Knee Society Rating System 0‐100 (knee) Show forest plot | 1 | 47 | Mean Difference (IV, Random, 95% CI) | ‐1.30 [‐8.90, 6.30] |
| 2 Function: Knee Society Rating System 0‐50 (stairs) Show forest plot | 1 | 47 | Mean Difference (IV, Random, 95% CI) | 3.60 [0.51, 6.69] |
| 3 Participants (n) reported adverse events Show forest plot | 1 | 47 | Risk Ratio (M‐H, Random, 95% CI) | 2.88 [0.12, 67.29] |