Tratamientos orales a base de hierbas para la artrosis
Resumen
Antecedentes
Para el tratamiento de la artrosis se utilizan productos medicinales a base de hierbas por vía oral. Aunque sus mecanismos de acción aún no se han dilucidado con todo detalle, las interacciones con los mediadores inflamatorios comunes justifican su uso para tratar las dolencias relacionadas con la artrosis.
Objetivos
Actualizar una revisión Cochrane anterior para evaluar los efectos beneficiosos y perjudiciales de los productos medicinales orales a base de hierbas en el tratamiento de la artrosis.
Métodos de búsqueda
Se realizaron búsquedas en las bases de datos electrónicas (CENTRAL, MEDLINE, EMBASE, AMED, CINAHL, ISI Web of Science, Plataforma de registros internacionales de ensayos clínicos de la Organización Mundial de la Salud) hasta el 29 de agosto de 2013 sin restricciones de idioma, así como en las listas de referencias de los ensayos identificados.
Criterios de selección
Se incluyeron los ensayos controlados aleatorizados de intervenciones a base de hierbas consumidas por vía oral en comparación con placebo o controles activos en personas con artrosis. Las intervenciones a base de hierbas incluían cualquier preparación con hierbas, pero excluían la homeopatía o los productos de aromaterapia, o cualquier preparación de origen sintético.
Obtención y análisis de los datos
Dos autores utilizaron métodos estándar para la selección de los ensayos y la extracción de los datos, y evaluaron la calidad del conjunto de evidencia mediante el método GRADE para los desenlaces principales (dolor, funcionalidad, cambios articulares radiográficos, calidad de vida, retiros debidos a eventos adversos, eventos adversos totales y eventos adversos graves).
Resultados principales
Se incluyeron 49 estudios controlados aleatorizados (33 intervenciones, 5980 participantes). Diecisiete estudios de diseño confirmatorio (tamaños muestrales y del efecto preespecificados) tenían en su mayoría un riesgo de sesgo moderado. Los 32 estudios restantes de diseño exploratorio tenían un mayor riesgo de sesgo. Debido a las diferentes intervenciones, los metanálisis se limitaron a los productos de Boswellia serrata (una sola hierba) y a los insaponificables de aguacate y soja (ASU) (combinación de dos hierbas).
Se incluyeron cinco estudios de tres extractos diferentes de Boswellia serrata. Evidencia de calidad moderada de dos estudios (85 participantes) indicó que el tratamiento de 90 días con 100 mg de extracto enriquecido de Boswellia serrata mejoró los síntomas en comparación con el placebo. El dolor medio fue de 40 puntos en una escala EAV de 0 a 100 puntos (0 es ningún dolor) con placebo, la Boswellia serrata enriquecida redujo el dolor en una media de 17 puntos (intervalo de confianza [IC] del 95%: 8 a 26); número necesario a tratar para un desenlace beneficioso adicional (NNTB) 2; los IC del 95% no excluyeron una reducción clínicamente significativa de 15 puntos en el dolor. La funcionalidad física fue de 33 puntos en la subescala de 0 a 100 puntos del Western Ontario and McMaster Universities Osteoarthritis Index (WOMAC) (0 es ninguna pérdida de funcionalidad) con placebo, la Boswellia serrata enriquecida mejoró la funcionalidad en 8 puntos (IC del 95%: 2 a 14); NNTB 4. Asumiendo una diferencia mínima clínicamente importante de 10 puntos, no se puede excluir un efecto beneficioso clínicamente importante en algunas personas. Evidencia de calidad moderada (un estudio, 96 participantes) indicó que los eventos adversos probablemente se redujeron con la Boswellia serrata enriquecida (18/48 eventos versus 30/48 eventos con placebo; riesgo relativo [RR] 0,60; IC del 95%: 0,39 a 0,92). Los posibles efectos beneficiosos de otros extractos de Boswellia serrata sobre el placebo se confirmaron mediante evidencia de calidad moderada proveniente de dos estudios (97 participantes) de Boswellia serrata (enriquecida) 100 mg más aceite no volátil, y evidencia de calidad baja proveniente de pequeños estudios individuales con una dosis diaria de 999 mg de extracto de Boswellia serrata y una dosis diaria de 250 mg de Boswellia serrata enriquecida. No está claro si una dosis diaria de 99 mg de Boswellia serrata tiene beneficios sobre el valdecoxib debido a la evidencia de calidad muy baja proveniente de un único estudio pequeño. No se sabe con certeza si hubo un aumento en el riesgo de eventos adversos o retiros con el extracto de Boswellia serrata debido al informe variable de los resultados entre los estudios. Los estudios no informaron eventos adversos graves. No se midió la calidad de vida ni los cambios articulares radiográficos.
Seis estudios examinaron el producto de ASU Piasclidine®. Evidencia de calidad moderada proveniente de cuatro estudios (651 participantes) indicó que ASU 300 mg produjo una mejoría pequeña y clínicamente cuestionable en los síntomas, y probablemente no aumentó los eventos adversos en comparación con placebo después de tres a 12 meses de tratamiento. La media de dolor con placebo fue 40,5 puntos en una escala EAV de 0 a 100 (0 es ningún dolor), ASU 300 mg redujo el dolor en una media de 8,5 puntos (IC del 95%: 1 a 16 puntos); NNTB 8. ASU 300 mg mejoró la funcionalidad (diferencia de medias estandarizada [DME] ‐0,42; IC del 95%: ‐0,73 a ‐0,11). La funcionalidad se estimó en 47 mm (escala de 0 a 100 mm, donde 0 es ninguna pérdida de funcionalidad) con placebo, ASU 300 mg mejoró la funcionalidad en una media de 7 mm (IC del 95%: 2 a 12 mm); NNTB 5 (3 a 19). No hubo diferencias en los eventos adversos (cinco estudios, 1050 participantes) entre ASU (53%) y placebo (51%) (RR 1,04; IC del 95%: 0,97 a 1,12); los retiros debido a eventos adversos (un estudio, 398 participantes) entre ASU (17%) y placebo (15%) (RR 1,14; IC del 95%: 0,73 a 1,80); o los eventos adversos graves (un estudio, 398 participantes) entre ASU (40%) y placebo (33%) (RR 1,22; IC del 95%: 0,94 a 1,59). Los cambios articulares radiográficos, medidos como cambio en la anchura del espacio articular en dos estudios (453 participantes) no difirieron entre el tratamiento con ASU 300 mg (‐0,53 mm) y placebo (‐0,65 mm); diferencia de medias de ‐0,12 (IC del 95%: ‐0,43 a 0,19). Evidencia de calidad moderada de un único estudio (156 participantes) confirmó los posibles efectos beneficiosos de ASU 600 mg sobre el placebo, sin un aumento de los eventos adversos. Evidencia de calidad baja (un estudio, 357 participantes) indicó que es posible que no haya diferencias en los síntomas o los eventos adversos entre ASU 300 mg y el sulfato de condroitrina. No se midió la calidad de vida.
Todas las demás intervenciones a base de hierbas se investigaron en estudios individuales, lo que limita las conclusiones. No se notificaron efectos secundarios graves relacionados con ningún producto a base de hierbas.
Conclusiones de los autores
La evidencia del producto patentado de ASU Piasclidine® en el tratamiento de los síntomas de la artrosis parece moderada para su uso a corto plazo, pero los estudios a más largo plazo y frente a un control aparentemente activo son menos convincentes. Varios otros productos de hierbas medicinales, incluyendo los extractos de Boswellia serrata, cuentan con evidencia de calidad moderada de tendencias hacia efectos beneficiosos que justifican estudios de investigación adicionales considerando el hecho de que el riesgo de eventos adversos parece bajo.
No hay evidencia de que Piasclidine® mejore significativamente la estructura de la articulación, y hay evidencia limitada de que evita el estrechamiento del espacio articular. Los cambios estructurales no se probaron con otra intervención a base de hierbas.
Se necesitan más estudios de investigación para determinar las dosis diarias óptimas que produzcan efectos clínicos beneficios sin eventos adversos.
PICOs
Resumen en términos sencillos
Tratamientos orales a base de hierbas para la artrosis
Antecedentes: ¿qué es la artrosis y qué es el tratamiento a base de hierbas?
La artrosis es una enfermedad de las articulaciones (habitualmente rodillas, caderas, manos). Cuando las articulaciones pierden cartílago, el hueso crece para intentar reparar el daño. Sin embargo, en lugar de mejorar las cosas, el hueso crece de forma anormal y empeora las cosas. Por ejemplo, el hueso se puede deformar y hacer que la articulación sea dolorosa y limite el movimiento. La artrosis puede afectar la funcionalidad física, especialmente la capacidad de utilizar las articulaciones.
Los medicamentos a base de hierbas se definen como productos medicinales acabados y etiquetados que contienen como ingredientes activos partes aéreas o subterráneas de plantas u otros materiales vegetales, o combinaciones de los mismos, ya sea en estado bruto o como preparaciones a base de hierbas (por ejemplo, extractos, aceites, tinturas).
Características de los estudios
Este resumen de una actualización de una revisión Cochrane presenta lo que se sabe de los estudios de investigación sobre los efectos de los tratamientos a base de hierbas consumidos por vía oral por las personas con artrosis. Después de buscar todos los estudios pertinentes hasta agosto de 2013, se incluyeron 45 estudios nuevos desde la última revisión, lo que da un total de 49 estudios (sobre 33 intervenciones a base de hierbas) que incluyeron 5980 participantes, la mayoría con artrosis sintomática leve a moderada de la rodilla o la cadera. Se compararon 33 productos de plantas medicinales diferentes con controles con placebo o con intervenciones activas y muchas comparaciones tenían estudios únicos; por lo tanto, esta revisión se ha limitado al informe de los resultados de estudios múltiples de productos de Boswellia serrata (una sola hierba) y de los insaponificables de aguacate y soja (ASU) (combinación de dos hierbas).
Resultados clave
Boswellia serrata
Dolor en una escala de 0 a 100 puntos (las puntuaciones más bajas significan menor dolor):
‐ las personas que utilizaron 100 mg de extracto enriquecido de Boswellia serrata calificaron su dolor 17 puntos menor (rango: 8 a 26 puntos menor) (17% de mejoría absoluta) a los 90 días en comparación con el placebo;
‐ las personas que utilizaron el extracto enriquecido de Boswellia serrata 100 mg calificaron su dolor en 23 puntos;
‐ las personas que utilizaron una preparación placebo calificaron su dolor en 40 puntos.
Funcionalidad física en una escala de 0 a 100 puntos (las puntuaciones más bajas significan una mejor funcionalidad física):
‐ las personas que utilizaron 100 mg de extracto enriquecido de Boswellia serrata calificaron su funcionalidad física 8 puntos mejor (de 2 a 14 puntos mejor) en una escala de 100 puntos (8% de mejoría absoluta) a los 90 días en comparación con el placebo;
‐ las personas que utilizaron 100 mg de extracto enriquecido de Boswellia serrata calificaron su funcionalidad física en 25 puntos;
‐ las personas que utilizaron el placebo calificaron su funcionalidad física en 33 puntos.
Producto insaponificable de aguacate y soja (ASU) Piascledine®
Dolor en una escala de 0 a 100 puntos (las puntuaciones más bajas significan menos dolor):
‐ las personas que utilizaron ASU 300 mg calificaron su dolor como 8 puntos menor (de 1 a 16 puntos menor) en una escala de 100 puntos (una mejoría absoluta del 8%) de tres a 12 meses en comparación con el placebo;
‐ las personas que utilizaron ASU 300 mg calificaron su dolor en 33 puntos;
‐ las personas que utilizaron el placebo calificaron su dolor en 41 puntos.
Funcionalidad física en una escala de 0 a 100 mm (las puntuaciones más bajas significan una mejor funcionalidad física):
‐ las personas que utilizaron ASU 300 mg calificaron su funcionalidad física 7 mm mejor (de 2 a 12 mm mejor) en una escala de 100 mm (7% de mejoría absoluta) entre los tres y los 12 meses en comparación con el placebo;
‐ las personas que utilizaron ASU 300 mg calificaron su funcionalidad física como 40 mm;
‐ las personas que utilizaron el placebo calificaron su funcionalidad física de 47 mm.
Calidad de la evidencia
Hay evidencia de calidad moderada de que en las personas con artrosis la Boswellia serrata mejoró ligeramente el dolor y la funcionalidad. Estudios de investigación adicionales podrían modificar las estimaciones.
Existe evidencia de calidad moderada de que es probable que los insaponificables de aguacate y soja (ASU) mejoraran ligeramente el dolor y la funcionalidad, pero podrían no preservar el espacio articular. Estudios de investigación adicionales podrían modificar las estimaciones.
No se sabe con certeza si otros productos orales a base de hierbas mejoran el dolor o la funcionalidad de la artrosis, o ralentizan la progresión del daño en la estructura articular, ya que la evidencia disponibles se limita a estudios individuales o a estudios que no se pueden agrupar, y algunos de estos estudios son de calidad baja o muy baja. No se midió la calidad de vida.
Los tratamientos a base de hierbas pueden causar efectos secundarios, pero no se sabe si existe un mayor riesgo de que se produzcan.
Authors' conclusions
Summary of findings
| Boswellia serrata for treating osteoarthritis | ||||||
| Patient or population: patients with treating osteoarthritis | ||||||
| Outcomes | Illustrative comparative risks* (95% CI) | Relative effect | No of Participants | Quality of the evidence | Comments | |
| Assumed risk | Corresponding risk | |||||
| Control | Boswellia serrata | |||||
| Pain | Mean pain in the control group at the end of treatment was 2.50 (0 to 3 scale). | Mean pain in the intervention groups was | ‐ | 30 | ⊕⊕⊝⊝ | Absolute improvement in pain was 56% (46% to 66%); Relative improvement in pain was 80% (66% to 94%)5; NNTB = 1 (95% CI 1 to 2). |
| Function | Mean disability in the control group at the end of treatment was 2.46 (0 to 3 scale). | Mean disability in the intervention groups was | ‐ | 30 | ⊕⊕⊝⊝ | Absolute improvement in function was 54% (44% to 64%); Relative improvement was 76% (62% to 90%)5; NNTB = 1 (95% CI 1 to 3). |
| Adverse events | No (n=0) participants in the control group reported adverse events. 0 per 1000 | Two (n=2) participants in the intervention group reported adverse events. 0 per 1000 | RR 5.00 | 30 | ⊕⊕⊝⊝ | Absolute risk of adverse events was 13% higher in the Boswellia serrata group (6% lower to 33% higher); Relative percentage change 400% worsening (74% to 9513% worsening); NNT n/a.6 |
| Adverse events Participants (n) withdrew due to adverse effects | See comment | See comment | Not estimable | 30 | See comment | Reported NIL withdrawals due to adverse events. |
| Adverse events Participants (n) reported serious adverse events | See comment | See comment | Not estimable | ‐ | See comment | Serious adverse events not reported as discrete outcome. |
| Radiographic joint changes | See comment | See comment | Not estimable | ‐ | See comment | Radiographic joint changes not measured. |
| Quality of life | See comment | See comment | Not estimable | ‐ | See comment | Quality of life not measured. |
| *The basis for the assumed risk (e.g. the median control group risk across studies) is provided in footnotes. The corresponding risk (and its 95% confidence interval) is based on the assumed risk in the comparison group and the relative effect of the intervention (and its 95% CI). | ||||||
| GRADE Working Group grades of evidence | ||||||
| 1 Criteria for diagnosis of OA not specified. 4 Downgrade estimate due to single study. 5 Control group baseline pain (SD) 2.80 (0.41), baseline disability 2.86 (0.35), from Kimmatkar 2003. 6 Number needed to treat (NNT) = not applicable (n/a) when result is not statistically significant. NNT for continuous outcomes calculated using Wells Calculator (CMSG editorial office). NNT for dichotomous outcomes calculated using Cates NNT calculator (http://www.nntonline.net/visualrx/). Assumed a minimal clinically important difference of 1 point of a 0 to 3 point scale (pain, function). | ||||||
| Boswellia serrata (enriched) 100 mg for treating osteoarthritis | ||||||
| Patient or population: patients with treating osteoarthritis | ||||||
| Outcomes | Illustrative comparative risks* (95% CI) | Relative effect | No of Participants | Quality of the evidence | Comments | |
| Assumed risk | Corresponding risk | |||||
| Control | Boswellia serrata (enriched) 100mg | |||||
| Pain Global pain VAS 0‐100 (higher scores mean worse) | Weighted mean pain in the control groups at the end of treatment was 40.02 (0 to 100 scale). | The weighted mean pain in the intervention groups was | ‐ | 85 | ⊕⊕⊕⊝ | Absolute improvement in pain was 17% (8% to 26%); Relative improvement in pain was 29% (15% to 43%)3; NNTB 2 (95% CI 1 to 6). |
| Function | Weighted mean disability in the control groups at the end of treatment was 33.13 (0 to 100 scale). | The weighted mean disability in the intervention groups was | ‐ | 85 | ⊕⊕⊕⊝ | Absolute improvement was 8% (14% to 2%); Relative improvement was 20% (5% to 34%)3; NNTB 4 (95% CI 2 to 18). |
| Adverse events | 625 per 1000 | 375 per 1000 | RR 0.60 | 96 | ⊕⊕⊕⊝ | Absolute risk of adverse events was 25% lower in the Boswellia serrata group (6% to 44% lower); Relative percentage change 40% improvement (61% improvement to 9% worsening); NNT = 4 (95% CI 3 to 22). |
| Adverse events Participants (n) withdrew due to adverse effects | See comment | See comment | Not estimable | 96 | See comment | Reported NIL withdrawals due to adverse events. |
| Adverse events Participants (n) reported serious adverse events | See comment | See comment | Not estimable | 96 | See comment | Reported NIL serious adverse events. |
| Radiographic joint changes | See comment | See comment | Not estimable | ‐ | See comment | Radiographic joint changes not measured. |
| Quality of life | See comment | See comment | Not estimable | ‐ | See comment | Quality of life not measured. |
| *The basis for the assumed risk (e.g. the median control group risk across studies) is provided in footnotes. The corresponding risk (and its 95% confidence interval) is based on the assumed risk in the comparison group and the relative effect of the intervention (and its 95% CI). | ||||||
| GRADE Working Group grades of evidence | ||||||
| 1Sengupta 2008, Sengupta 2010, Vishal 2011: WOMAC scores presented as subscale scores only. Overall WOMAC not reported. 2 Confirmatory study design: statistical power 80%, alpha set at 0.05, but downgraded due to potential imprecision due to small number of participants; and lower limit of 95% CI does not preclude clincially insignificant change 3 Control group baseline measures taken from Sengupta 2008, the study most heavily weighted in the meta‐analyses. Control group baseline pain (SD) 56.88 (12.04), baseline disability 41.3 (9.6). 4 Downgrade estimate due to potential imprecision, eg, small number of events and participants from a single study. 5 Number needed to treat (NNT) is not applicable (n/a) when result is not statistically significant. NNT for dichotomous outcomes calculated using Cates NNT calculator (http://www.nntonline.net/visualrx/); NNT for continuous outcomes calculated using Wells Calculator (CMSG editorial office). Assumed a minimal clinically important difference of 15 points on 0 to 100 mm pain scale, and 10 points on 0 to 100 mm function scale. | ||||||
| Boswellia serrata (enriched) 250mg for treating osteoarthritis | ||||||
| Patient or population: patients with treating osteoarthritis | ||||||
| Outcomes | Illustrative comparative risks* (95% CI) | Relative effect | No of Participants | Quality of the evidence | Comments | |
| Assumed risk | Corresponding risk | |||||
| Control | Boswellia serrata (enriched) 250mg | |||||
| Pain | Mean pain in the control group at the end of treatment was 41.76 (0 to 100 scale). | Mean pain in the intervention group was | ‐ | 47 | ⊕⊕⊕⊝ | Absolute improvement in pain was 28% (20% to 35%); Relative improvement in pain was 48% (36% to 61%)3 ; NNT = 1 (95% CI 1 to 2). |
| Function (higher scores mean worse) | Mean disability in the control group at the end of treatment was 34.07 (0 to 100 scale). | Mean disability in the intervention group was | ‐ | 47 | ⊕⊕⊕⊝ | Absolute improvement in disability was 17% (12% to 21%); Relative improvement in disability was 41% (30% to 51%)3; NNT = 1 (95% CI 1 to 2). |
| Adverse events | 526 per 1000 | 474 per 1000 | RR 0.90 | 114 | ⊕⊕⊕⊝ | Absolute risk of adverse events was 5% lower in the Boswellia serrata group (24% lower to 13% higher); Relative percentage change 10% improvement (38% improvement to 30% worsening); NNT n/a.4 |
| Adverse events Participants (n) withdrew due to adverse effects | See comment | See comment | Not estimable | 114 | See comment | Reported NIL withdrawals due to adverse events. |
| Adverse events Participants (n) reported serious adverse events | See comment | See comment | Not estimable | 114 | See comment | Reported NIL serious adverse events. |
| Radiographic joint changes | See comment | See comment | Not estimable | ‐ | See comment | Radiographic joint changes not measured. |
| Quality of life | See comment | See comment | Not estimable | ‐ | See comment | Quality of life not measured. |
| *The basis for the assumed risk (e.g. the median control group risk across studies) is provided in footnotes. The corresponding risk (and its 95% confidence interval) is based on the assumed risk in the comparison group and the relative effect of the intervention (and its 95% CI). | ||||||
| GRADE Working Group grades of evidence | ||||||
| 1Sengupta 2008: WOMAC scores presented as subscale scores only. Overall WOMAC not reported. 2 Downgrade estimate due to single study. 3 Control group baseline pain (SD) 56.88 (12.04), baseline disability 41.3 (9.6), from Sengupta 2008. 4 Number needed to treat (NNT) = not applicable (n/a) when result is not statistically significant. NNT for continuous outcomes calculated using Wells Calculator (CMSG editorial office). NNT for dichotomous outcomes calculated using Cates NNT calculator (http://www.nntonline.net/visualrx/). | ||||||
| Boswellia serrata (enriched) plus non‐volatile oil for treating osteoarthritis | ||||||
| Patient or population: patients with treating osteoarthritis | ||||||
| Outcomes | Illustrative comparative risks* (95% CI) | Relative effect | No of Participants | Quality of the evidence | Comments | |
| Assumed risk | Corresponding risk | |||||
| Control | Boswellia serrata (enriched) plus non‐volatile oil | |||||
| Pain | Weighted mean pain in the control groups at the end of treatment was 38.90 (0 to 100 scale). | Weighted mean pain in the intervention groups was | ‐ | 97 | ⊕⊕⊕⊝ | Absolute improvement in pain was 16% (12% to 20%); Relative improvement in pain was 34%(25% to 42%)3; NNTB 2 (1 to 4)4 |
| Function (higher scores mean worse) | Weighted mean disability in the control groups at the end of treatment was 34.90 (0 to 100 scale). | Weighted mean disability in the intervention groups was | ‐ | 97 | ⊕⊕⊕⊝ | Absolute improvement in disability was 15% (11% to 19%); Relative improvement in disability was 37% (27% to 47%)3; NNTB 2 (1 to 3). |
| Adverse events | 42 per 1000 | 41 per 1000 | RR 0.98 | 97 | ⊕⊕⊕⊝ | Absolute risk of adverse events was 0% lower in the Boswellia serrata group (8% lower to 8% higher); Relative percentage change 2% improvement (86% improvement to 569% worsening); NNT n/a.5 |
| Adverse events Participants (n) withdrew due to adverse effects | See comment | See comment | Not estimable | ‐ | See comment | Reported NIL withdrawals due to adverse events. |
| Adverse events Participants (n) reported serious adverse events | See comment | See comment | Not estimable | ‐ | See comment | Reported NIL serious adverse events. |
| Radiographic joint changes | See comment | See comment | Not estimable | ‐ | See comment | Radiographic joint changes not measured. |
| Quality of life | See comment | See comment | Not estimable | ‐ | See comment | Quality of life not measured. |
| *The basis for the assumed risk (e.g. the median control group risk across studies) is provided in footnotes. The corresponding risk (and its 95% confidence interval) is based on the assumed risk in the comparison group and the relative effect of the intervention (and its 95% CI). | ||||||
| GRADE Working Group grades of evidence | ||||||
| 1Vishal 2011: 30 day intervention. Sengupta 2010: 90 day intervention. 4 Number needed to treat to benefit (NNTB), and harm (NNTH) = not applicable (n/a) when result is not statistically significant. NNT for continuous outcomes calculated using Wells Calculator (CMSG editorial office). NNT for dichotomous outcomes calculated using Cates NNT calculator (http://www.nntonline.net/visualrx/). 5Sengupta 2010, Vishal 2011: WOMAC scores presented as subscale scores only. Overall WOMAC not reported. | ||||||
| Boswellia serrata compared to valdecoxib for treating osteoarthritis | ||||||
| Patient or population: patients with treating osteoarthritis | ||||||
| Outcomes | Illustrative comparative risks* (95% CI) | Relative effect | No of Participants | Quality of the evidence | Comments | |
| Assumed risk | Corresponding risk | |||||
| Valdecoxib | Boswellia serrata | |||||
| Pain (higher scores mean worse) | Mean pain in the valdecoxib group at the end of treatment was 17.08 (0 to 100 scale). | Mean pain in the intervention groups was | ‐ | 58 | ⊕⊝⊝⊝ | Absolute improvement in pain was 1% (7% improvement to 6% worsening); Relative improvement in pain was 1%4; NNT n/a.5 |
| Function Follow‐up: mean 6 months | Mean disability in the valdecoxib group at the end of treatment was 16.64 (0 to 100 scale). | Mean disability in the intervention groups was | ‐ | 58 | ⊕⊝⊝⊝ | Absolute worsening in disability was 3% (4% improvement to 9% worsening); Relative improvement in disability was 4%4; NNT n/a.5 |
| Adverse events | 61 per 1000 | 121 per 1000 | RR 2.0 | 66 | ⊕⊝⊝⊝ | Absolute risk of adverse events was 6% higher in the Boswellia serrata group (8% lower to 20% higher); Relative percentage change 100% worsening (61% improvement to 918% worsening); NNT n/a.5 |
| Adverse events Participants (n) withdrew due to adverse effects | RR 3.0 (0.13 to 71.07) | 66 | ⊕⊝⊝⊝ | Reported one (1) withdrawal possibly due to adverse events. Absolute risk of withdrawal due to adverse events was 3% higher in the Boswellia serrata group (5% lower to 11% higher); Relative percentage change 200% worsening (87% improvement to 7007% worsening); NNT n/a.5 | ||
| Adverse events Participants (n) reported serious adverse events | See comment | See comment | Not estimable | 66 | See comment | Reported NIL serious adverse events. |
| Radiographic joint changes | See comment | See comment | Not estimable | ‐ | See comment | Radiographic joint changes not measured. |
| Quality of life | See comment | See comment | Not estimable | ‐ | See comment | Quality of life not measured. |
| *The basis for the assumed risk (e.g. the median control group risk across studies) is provided in footnotes. The corresponding risk (and its 95% confidence interval) is based on the assumed risk in the comparison group and the relative effect of the intervention (and its 95% CI). | ||||||
| GRADE Working Group grades of evidence | ||||||
| 1 Open trial. Medication regimens differ between active control and intervention. 2 Downgrade estimate due to single study. Treatment effect crosses midline (no effect). 4 Baseline pain in valdecoxib group 49.2, baseline disability 51.6. Aggregate WOMAC scores converted to normalised scores for re‐analysis. 5 Number needed to treat (NNT) = not applicable (n/a) when result is not statistically significant. NNT for continuous outcomes calculated using Wells Calculator (CMSG editorial office). NNT for dichotomous outcomes calculated using Cates NNT calculator (http://www.nntonline.net/visualrx/). | ||||||
| Persea gratissma + Glycine max (ASU 300 mg) for treating osteoarthritis | ||||||
| Patient or population: patients with osteoarthritis | ||||||
| Outcomes | Illustrative comparative risks* (95% CI) | Relative effect | No of Participants | Quality of the evidence | Comments | |
| Assumed risk | Corresponding risk | |||||
| Control | Persea gratissma + Glycine max (ASU 300mg) | |||||
| Pain | Weighted mean pain in the control groups at end of treatment was 40.53 (0 to 100 scale). | Weighted mean pain in the intervention groups was | ‐ | 651 | ⊕⊕⊕⊝ | Absolute improvement in pain was 8% (1% to 16%); Relative improvement in pain was 15% (2% to 29%)2; NNTB 8 (4 to 77)3 |
| Function | Mean disability in the control group at end of treatment was 47.10 mm, on VAS 0 to 100 mm scale (higher scores mean worse)5. | Mean disability in the intervention groups was | ‐ | 642 | ⊕⊕⊕⊝ | SMD ‐0.42 (95% CI ‐0.73 to ‐0.11), in favour of ASU 300mg Absolute improvement in disability was 7% (2% to 12%); Relative improvement in disability was 13% (4% to 23%)7; NNTB 5 (3 to 19)3 |
| Adverse events | 510 per 1000 | 531 per 1000 | RR 1.04 | 1050 | ⊕⊕⊕⊝ | Absolute risk of adverse events is 2% higher in the ASU group (2% lower to 7% higher); Relative percentage change 4% worsening (9% improvement to 12% worsening); NNT n/a3 |
| Adverse events Participants (n) withdrew due to adverse effects | 148 per 1000 | 169 per 100 (108 to 267) | RR 1.14 (0.73 to 1.80) | 398 (1 study) | ⊕⊕⊕⊝ | Absolute risk of participants withdrawing due to adverse events in 2% higher in ASU group (5% lower to 9% higher); Relative percentage change 14% worsening (27% improvement to 90% worsening); NNT n/a.3,9 |
| Adverse events Participants (n) reported serious adverse events | 325 per 1000 | 397 per 1000 (306 to 517) | RR 1.22 (0.94 to 1.59) | 398 (1 study) | ⊕⊕⊕⊝ | Absolute risk of serious adverse events is 7% higher in the ASU group (2% lower to 17% higher); Relative percentage change 22% worsening (6% improvement to 59% worsening); NNT n/a.3,9 |
| Radiographic joint changes Change in Joint Space Width (JSW) from baseline (higher scores mean worse). Follow up: 24 to 36 months. | Weighted mean JSW change from baseline in the control groups at end of treatment was 0.65. | Mean JSW change from baseline in the intervention groups was 0.12 lower (0.43 lower to 0.19 higher) | ‐ | 453 (2 studies) | ⊕⊕⊕⊝ | Absolute change NNT n/a.3,9 |
| Quality of life | See comment | See comment | Not estimable | ‐ | See comment | Quality of life not measured. |
| *The basis for the assumed risk (e.g. the median control group risk across studies) is provided in footnotes. The corresponding risk (and its 95% confidence interval) is based on the assumed risk in the comparison group and the relative effect of the intervention (and its 95% CI). | ||||||
| GRADE Working Group grades of evidence | ||||||
| 1Downgrade due to heterogeneity, inconsistency 2 Calculations based on control group baseline pain measure taken from Blotman 1997, the most heavily weighted study in the meta‐analysis. Control group baseline mean (SD) pain 54.3 (11.9). 3 Number needed to treat to benefit (NNTB), or to harm (NNTH) = not applicable (n/a) when result is not statistically significant. NNT for dichotomous outcomes calculated using Cates NNT calculator (http://www.nntonline.net/visualrx/)NNT for continuous outcomes calculated using Wells Calculator (CMSG editorial office), assuming a minimal clinically important difference of 15 mm on a 0 to 100 mm pain scale, and 10 mm on a 0 to 100 mm function scale. 4 Multiple tools: Disability VAS reported in one study only (Maheu 1998); WOMAC change score reported in one study (Maheu 2013); Lequesne algofunctional index reported in four studies, but to avoid over‐reporting, data were extracted on this outcome from three studies only (Appelboom 2001, Blotman 1997, Lequesne 2002) 5 From Maheu 1998: follow‐up disability score in the control group 47.10 mm (VAS 0 to 100 mm scale) 6 Four trials pooled (Appelboom 2001, Blotman 1997, Lequesne 2002, Maheu 1998) using SMD, and re‐expressed as MD by multiplying the SMD (95% CI) by the baseline SD in the control group of Maheu 1998 (16.78). 7 Calculations based on data from Maheu 1998: control group baseline mean (SD) disability 52.5 (16.78), 0 to 100 mm VAS scale. 8 Downgrade estimate due to imprecision: few participants. 9 Treatment effect crosses midline (no effect). | ||||||
| Persea gratissma + Glycine max (ASU 600 mg) for treating osteoarthritis | ||||||
| Patient or population: patients with osteoarthritis | ||||||
| Outcomes | Illustrative comparative risks* (95% CI) | Relative effect | No of Participants | Quality of the evidence | Comments | |
| Assumed risk | Corresponding risk | |||||
| Control | Persea gratissma + Glycine max (ASU 600mg) | |||||
| Pain (higher scores mean worse) Follow up: 3 months | Mean pain in the control group at the end of treatment was 42.4 (0 to 100 scale). | Mean pain in the intervention group was | ‐ | 156 | ⊕⊕⊕⊝ | Absolute improvement in pain was 14% (21% to 8%); Relative improvement in pain was 26.5%2; NNT = |
| Function (higher scores mean worse) | Mean disability in the control group at the end of treatment was 7.8 (0 to 24 scale). | Mean disability in the intervention group was | ‐ | 156 | ⊕⊕⊕⊝ | Absolute improvement in disability was 1% (1% to 0%); Relative improvement in disability was 13.7%2; NNT = |
| Adverse events | 261 per 1000 | 278 per 1000 | RR 1.07 | 174 | ⊕⊕⊕⊝ | Absolute risk of adverse events is 2% higher in the ASU group (11% lower to 15% higher); Relative percentage change 7% worsening (34% improvement to 74% worsening); NNT n/a.3 |
| Adverse events Participants (n) withdrew due to adverse effects | See comment | See comment | Not estimable | 174 | See comment | Withdrawals due to adverse events not reported as a discrete outcome in ASU 600mg subgroup. |
| Adverse events Participants (n) reported serious adverse events | See comment | See comment | Not estimable | 174 | See comment | Serious adverse events not reported as a discrete outcome in ASU 600mg subgroup. |
| Radiographic joint changes | See comment | See comment | Not estimable | ‐ | See comment | Radiographic joint changes not measured. |
| Quality of life | See comment | See comment | Not estimable | ‐ | See comment | Quality of life not measured. |
| *The basis for the assumed risk (e.g. the median control group risk across studies) is provided in footnotes. The corresponding risk (and its 95% confidence interval) is based on the assumed risk in the comparison group and the relative effect of the intervention (and its 95% CI). | ||||||
| GRADE Working Group grades of evidence | ||||||
| 1 Single study. 2 Control group baseline mean (SD) pain 53.5 (13.9), baseline mean (SD) disability 9.5 (2.2), from Appelboom 2001. 3 Number needed to treat (NNT) = not applicable (n/a) when result is not statistically significant. NNT for continuous outcomes calculated using Wells Calculator (CMSG editorial office). NNT for dichotomous outcomes calculated using Cates NNT calculator (http://www.nntonline.net/visualrx/). | ||||||
| Persea gratissma + Glycine max (ASU 300 mg) compared to chondroitin sulphate for treating osteoarthritis | ||||||
| Patient or population: patients with osteoarthritis | ||||||
| Outcomes | Illustrative comparative risks* (95% CI) | Relative effect | No of Participants | Quality of the evidence | Comments | |
| Assumed risk | Corresponding risk | |||||
| Chondroitin sulphate | Persea gratissma + Glycine max (ASU 300mg) | |||||
| Pain (higher scores mean worse) | Mean pain in the chondroitin sulphate group at the end of treatment was 22.88 (0 to 100 scale). | The mean pain in the intervention group was | ‐ | 357 | ⊕⊕⊝⊝ | Absolute worsening of pain was 10% (10% improvement to 31% worsening); Relative worsening of pain was 3%3; NNT n/a.4 |
| Function (higher scores mean worse) | Mean function in the chondroitin sulphate group at the end of treatment was 25.14 (0 to 100 scale). | The mean disability in the intervention group was | ‐ | 357 | ⊕⊕⊝⊝ | Absolute worsening of disability was 28% (43% improvement to 98% worsening); Relative worsening of disability was 3%3; NNT n/a.4 |
| Adverse events | 244 per 1000 | 210 per 1000 | RR 0.86 | 357 | ⊕⊕⊝⊝ | Absolute risk of adverse events was 3% lower in the ASU group (12% lower to 5% higher); Relative percentage change 14% improvement (41% improvement to 26% worsening); NNT n/a.4 |
| Adverse events Participants (n) withdrew due to adverse effects | See comment | See comment | Not estimable | 357 | Withdrawals due to adverse events not reported as a discrete outcome. | |
| Adverse events Participants (n) reported serious adverse events | 6 per 1000 | 17 per 1000 (2 to 158) | RR 2.92 (0.31 to 27.78) | 357 | ⊕⊕⊝⊝ | Absolute risk of serious adverse events was 1% higher in the ASU group (1% lower to 3% higher); Relative percentage change 192% worsening (69% improvement to 2678% worsening); NNT n/a.4 |
| Radiographic joint changes | See comment | See comment | Not estimable | ‐ | See comment | Radiographic joint changes not measured. |
| Quality of life | See comment | See comment | Not estimable | ‐ | See comment | Quality of life not measured. |
| *The basis for the assumed risk (e.g. the median control group risk across studies) is provided in footnotes. The corresponding risk (and its 95% confidence interval) is based on the assumed risk in the comparison group and the relative effect of the intervention (and its 95% CI). | ||||||
| GRADE Working Group grades of evidence | ||||||
| 1 SIngle study. Treatment effect crosses midline (no effect). 2 Chondroitin sulfate might not be active control. Non‐inferiority hypothesis may be flawed. 3 Chrondroitin sulfate group baseline pain 49.08, baseline disability 49.07. Aggregate WOMAC scores converted to normalised scores for re‐analysis. 4 Number needed to treat (NNT) = not applicable (n/a) when result is not statistically significant. NNT for continuous outcomes calculated using Wells Calculator (CMSG editorial office). NNT for dichotomous outcomes calculated using Cates NNT calculator (http://www.nntonline.net/visualrx/). | ||||||
Background
Oral herbal therapies for treating osteoarthritis
Herbal medicines have a long tradition in the treatment of osteoarthritis. Although the mechanism of action of oral medicinal plant products has not been fully elucidated, experimental studies indicate interactions with mediators of inflammation and cartilage destruction, providing a rational basis for the putative effectiveness of oral medicinal plant products in alleviating osteoarthritis. This review is an update of an earlier review from 2000. Four of the studies in the original review and 45 new studies are included in this review, evaluating the effects of 33 different oral medicinal plants or combinations of plants from Europe, Africa, Asia, and the Americas. The review shows that oral medicinal plant products may improve osteoarthritic complaints, but multiple studies providing moderate to high evidence of effectiveness are only available for proprietary products from avocado‐soyabean unsaponifiables (ASU) and Boswellia serrata. For the other medicinal plant products the quality and quantity of the studies are insufficient to draw definitive conclusions on effectiveness. Although the included studies did not report serious adverse events related to the products, safety data are limited.
Herbal medicinal products are used in a variety of forms for the treatment of osteoarthritis (OA) worldwide. Although their mechanisms of action have not yet been elucidated in full detail, interactions with mediators of inflammation and cartilage destruction provide a rationale for using them to treat OA complaints (Cameron 2009). The knowledge on herbal medicine gleaned over centuries of medicinal use is collated in textbooks and monographs (for example the German Commission E monographs (Blumenthal 1998)). All include empirical knowledge. The more recent Western monographs also include information on animal studies and clinical trials, for example the monographs of the European Scientific Cooperative on Phytotherapy (ESCOP 2003; ESCOP 2009), the monographs of the American Herbal Pharmacopeia (www.herbal‐ahp.org), and the World Health Organization (WHO) monographs on selected medicinal plants (http://apps.who.int/medicinedocs/en/d/Js2200e/). Whereas the ESCOP and American and WHO monographs are not official, they provide scientific information on the safety, efficacy, and quality of medicinal plants and provide recommendations for their use in clinical practice (for example the doses, types of preparation). In contrast, the European Medicines Agency (EMA) monographs (www.ema.europa.eu/ema/index.jsp?curl=search.jsp&q=Herbal+monographs&btnG=Search&mid=WC0b01ac05800240cf) serve as guidance for application dossiers to obtain marketing authorizations by the regulatory authorities of the individual countries in the European Union. These monographs, however, have not used an evidence‐based approach.
Description of the condition
Lawrence and Felson (Lawrence 2008) estimated that among US adults, nearly 27 million had clinical OA in 2005 (up from the estimate of 21 million for 1995). OA is characterized by degeneration of the joints. Any joint of the body can be affected, but the most prominent joints include the hips, knees, and hands. Women are affected with OA more often than men and the prevalence increases with increasing age. Overweight and heavy physical work may explain OA in some cases, but non‐mechanical factors and genetic disposition are involved as well (van den Berg 2011; Zhang 2010a). Primary OA has to be distinguished from secondary OA that is induced, for example, by traumatic events and endocrine or metabolic disorders. Both primary and secondary forms result in impaired quality of life due to pain and physical disability (Schmitz 2010).
Description of the intervention
For the purpose of this review we have adopted the WHO guidelines (www.who.int/medicines/areas/traditional/definitions/en/) for the definition of medicinal plant products, that is, "Herbal medicines include herbs, herbal materials, herbal preparations and finished herbal products, that contain as active ingredients parts of plants, or other plant materials, or combinations.
-
Herbs: crude plant material such as leaves, flowers, fruit, seed, stems, wood, bark, roots, rhizomes or other plant parts, which may be entire, fragmented or powdered.
-
Herbal materials: in addition to herbs, fresh juices, gums, fixed oils, essential oils, resins and dry powders of herbs. In some countries, these materials may be processed by various local procedures, such as steaming, roasting, or stir‐baking with honey, alcoholic beverages or other materials.
-
Herbal preparations: the basis for finished herbal products and may include comminuted or powdered herbal materials, or extracts, tinctures and fatty oils of herbal materials. They are produced by extraction, fractionation, purification, concentration, or other physical or biological processes. They also include preparations made by steeping or heating herbal materials in alcoholic beverages and/or honey, or in other materials.
-
Finished herbal products: herbal preparations made from one or more herbs. If more than one herb is used, the term mixture herbal product can also be used. Finished herbal products and mixture herbal products may contain excipients in addition to the active ingredients. However, finished products or mixture products to which chemically defined active substances have been added, including synthetic compounds and/or isolated constituents from herbal materials, are not considered to be herbal."
The WHO also notes that "in some traditions, materials of inorganic or animal origin may also be present", however, in this review we have applied the strict definition and excluded herbal products combined with non‐herbal materials (http://apps.who.int/medicinedocs/en/d/Jh2945e/4.html).
How the intervention might work
There is evidence that pro‐inflammatory cytokines play a significant role in the pathogenesis of OA, in which articular cartilage, subchondral bone, and synovial membrane are involved. Cytokines including interleukin‐1 (IL‐1), tumour necrosis factor α (TNFα), IL‐6, and members of the IL‐6 protein superfamily including adiponectin, oncostatin M, and pre‐B cell colony enhancing factor (also known as visfatin), IL‐7, IL‐17, and IL‐18 can promote articular cartilage extracellular matrix protein degradation or synergize with other cytokines to amplify and accelerate cartilage destruction. Attempts to modify the progression of human OA in well designed, controlled clinical trials with an IL‐1 receptor antagonist protein (IRAP) have not been successful (Malemud 2010). Anabolic cytokines (also termed growth factors), including transforming growth factor‐beta (TGF‐β), insulin‐like growth factor‐1 (IGF‐1), and fibroblast growth factor‐2 (FGF‐2), have been characterized as potential chondroprotective agents (Malemud 2010). Both aging and the OA process itself induce deranged TGF‐β receptor expression, causing a shift to dominant usage of activin receptor‐like kinase‐1 (ALK‐1) instead of ALK‐5, and resulting in a TGF‐β mediated catabolic pathway (van den Berg 2011).
Recently, other cytokines were also identified as being involved in the progressive breakdown of articular cartilage. Transcription factor hypoxia‐inducible factor‐2α (HIF‐2α), which is highly enhanced in OA cartilage, has been shown to activate catabolic metalloproteinases (MMP) including MMP‐13. In addition, HIF‐2α suppresses chondrocyte autophagy, promoting chondrocyte apoptosis. MMP‐13 production is also activated via the chondrocyte discoidin domain receptor (DDR‐2) through interaction with denatured collagen type II. The latter might occur in a proteoglycan depleted pericellular matrix where DDR‐2 expression is enhanced, such as in OA cartilage. A disintegrin and metalloproteinase with thrombospondin motifs (ADAMTS‐5) was identified to stimulate proteoglycan loss by interacting with transmembrane proteoglycan syndecan‐4. Furthermore, the alarmins (also know as myeloid‐related proteins), calcium binding proteins S100A8 and S100A9, were identified as catabolic mediators (van den Berg 2011). An improved understanding of the balance between pro‐inflammatory, anabolic, and catabolic cytokines may eventually result in the commercial development of disease‐modifying OA drugs (Malemud 2010).
Inflammation and imbalance in complex cytokine interactions cause morphological OA changes at the molecular level. Medicinal plant products may inhibit inflammatory mediators and interact with various cytokines, at least under experimental conditions (Cameron 2009). The mechanism of action of the oral herbal medicines is likely to be broader than that of non‐steroidal anti‐inflammatory drugs. Some studies in animals indicate a promising cartilage‐protective effect for some of the oral medicinal plant products, including Piascledine® containing ASU (Mazieres 1993), the Harpagophytum extract FB9195 (Chrubasik 2006; Hadhyiski 2006), and a Chinese herbal mixture SKI306X® (Choi 2002). In a later, long term confirmatory study in humans, Piascledine® showed no effect on joint space loss (Lequesne 2002). It remains to be demonstrated whether the experimental observations of promising effects on surrogate markers of cartilage destruction by medicinal plant products are of clinical relevance.
Why it is important to do this review
Medicinal plant preparations are part of the armamentarium of traditional treatments for people with OA. This review is important to summarise the evidence of effectiveness of medicinal plant products used orally for OA, and to update the information on these products. We have undertaken this research to investigate the effectiveness and adverse side effects of these products so that people with OA and their healthcare providers may make more informed decisions about the usefulness of these interventions.
In the previous Cochrane review on herbal medicines for OA, oral and topical herbal medicines were considered together. When the update of this review became particularly large, a separation of topical and oral medicinal plant products seemed advisable because: (a) only oral products are purported to have any effect on joint structure, (b) topical herbal medicines may act as counter‐irritants via the skin (for example nettle, peppermint, Capsicum), and (c) some products cannot be administered orally due to systemic toxicity (Arnica, comfrey).
Objectives
To update an existing Cochrane systematic review to assess the benefits and harms of oral medicinal plant products in treating OA. Data were added from relevant randomised controlled trials published in the period from January 2000 to August 2013.
Methods
Criteria for considering studies for this review
Types of studies
All randomised controlled (placebo or active control) parallel and crossover trials examining the effects of oral herbal interventions for treating OA.
Types of participants
All persons diagnosed with OA according to the American College of Rheumatology (ACR) criteria (Altman 1986; Altman 1990; Altman 1991) or the equivalent European League Against Rheumatism (EULAR) criteria (Zhang 2009; Zhang 2010a; Zhang 2010b). Studies with samples defined according to vague descriptions (for example 'joint pain') were not considered. Studies with participant samples defined according to incomplete or partial ACR and EULAR criteria were included, and notes were provided to identify possible weaknesses in sample selection in these studies.
Types of interventions
Any orally consumed herbal intervention compared with an inert (placebo) or active control was included. Herbal interventions included any plant preparation (whole, powder, extract, standardised mixture) but excluded homeopathy or aromatherapy products, or any preparation of synthetic origin.
In the methods published for the original review, herbal therapies used in conjunction with other treatments or combined with a non‐herbal substance were also to be included if the effect of the non‐herbal intervention was consistent among all groups and quantifiable such that the effect of the herbal intervention could be determined. In this review, however, we have confined interventions to those that comply with the WHO definition of 'herbal' (www.who.int/medicines/areas/traditional/definitions/en/). Accordingly, extracted single compounds, synthetic reproductions of naturally occurring compounds, and herbal therapies combined with non‐herbal substances are no longer herbal treatments. This definition is important because non‐herbal substances may interact with herbs and change their effects, potency, and safety profile. Even if the non‐herbal substance occurs in the same concentration in the placebo control (as is the case in one excluded study, Park 2009), the intervention‐control comparison is not valid because the non‐herbal substance may interact uniquely with the herbs (for example enhanced absorption of ingredients) and not with the placebo.
Types of outcome measures
The main outcome measures considered were consistent with those used across Cochrane Musculoskeletal Group systematic reviews of interventions for OA: pain, function, adverse events, joint structure changes, and quality of life (Altman 1996; Pham 2004).
To assess the benefits of treatment:
-
pain, measured on a visual analogue scale (VAS) (0 to 100), Western Ontario and McMaster Universities Osteoarthritis Index (WOMAC) pain subscale (0 to 4, or VAS 0 to 100), numerical rating scale (0 to 3), or other pain scales;
-
physical function, measured by a VAS (0 to 100), WOMAC function subscale (0 to 4, or VAS 0 to 100), algofunctional index (0 to 3), time to perform functional tasks, or other validated functional scales.
To assess the safety of treatment:
-
number of participants reporting any adverse event.
Minor outcomes included:
-
withdrawals due to adverse events;
-
serious adverse events;
-
radiographic joint changes measured as minimum joint space width;
-
quality of life measured by the Short Form‐36 (SF‐36) or other validated scales.
We extracted data from the last time point in each trial. Because most interventions were not purported to be structure modifying, we also extracted data from earlier time points in some studies to allow data pooling with trials of shorter duration.
We included the following outcomes in the summary of findings tables, derived from the list of outcomes recommended by the Cochrane Musculoskeletal Group (CMSG) for inclusion in reviews of interventions for osteoarthritis: pain; function; number of participants experiencing any adverse event; withdrawals due to adverse events; serious adverse events; radiographic joint structure; and quality of life.
We did not extract data for re‐analysis on any other outcome measures, such as swelling, use of rescue medications, or blood markers although these data were included in many of the included studies.
Search methods for identification of studies
Electronic searches
For this review update we searched the following electronic databases from the date of the last search in the previously published version of the review (to November 2008) and updated the search again on 21 May 2009, 14 December 2010, 16 May 2011, 12 December 2011, 15 June 2012, 25 and 27 February 2013, 15 March 2013, 7 May 2013, and finally on 29 August 2013:
-
Cochrane Central Register of Controlled Trials (CENTRAL), part of The Cochrane Library (accessed 29 August 2013);
-
DARE, part of The Cochrane Library (accessed 29 August 2013);
-
MEDLINE (via Ovid) (2000 to 29 August 2013);
-
MEDLINE (Ovid MEDLINE® In‐Process & Other Non‐Indexed Citations) (to 29 August 2013);
-
EMBASE (via Ovid) (2000 to 29 August 2013);
-
CINAHL (via Ovid) (2000 to Week 5 2008); via EBSCOhost (2008 to 29 August 2013);
-
AMED (via Ovid) (1985 to 29 August 2013);
-
ISI Web of Knowledge (2000 to 29 August 2013);
-
Dissertation Abstracts, ProQuest (2000 to 29 August 2013);
-
WHO International Clinical Trials Registry Platform (apps.who.int/trialsearch) (accessed 29 August 2013).
Thesaurus and free text searches appropriate to each database, which combined terms describing osteoarthritis and terms describing herbal medicine, were performed. No methodological filter was applied and the search was not limited by language.
The full search strategies for each database are outlined in Appendix 1.
Searching other resources
We searched reference lists of included trials for any other potential studies. Unpublished research reports and theses (grey literature) were sought directly from pharmaceutical companies (Steigerwald Pharmaceuticals) (Bernhardt 1991; Huber 1991; Schadler 1988) and university libraries (Guyader 1984).
Data collection and analysis
Selection of studies
This review was an update of a previous review. Two authors of the original review (CL, TP) and two other colleagues (JG, AB) made some contributions to this review and are acknowledged here as investigators. Because these investigators did not contribute to the totality of the review, they are identified in the Acknowledgements rather than listed as authors of this review.
All titles and abstracts identified from electronic databases and other searches were independently examined by three investigators (MC, SC, CL). The full manuscript was retrieved for each record that had the possibility of meeting the review criteria.
Three review authors (MC, SC, CL) independently assessed the eligibility of retrieved studies for the review according to the inclusion criteria.
Data extraction and management
Data were extracted from each eligible study by two review authors acting independently. Because of the length of time taken to complete this review and the associated review of topical medicinal plant products for OA, the large number of studies included in this update, and the inclusion of studies in languages other than English, five investigators (MC, SC, AB, JG, TP) contributed to the data extraction.
Two review authors (MC, SC) independently extracted the following data from the included trials and entered the data in RevMan 5:
1) trial characteristics including size and location of the trial, and source of funding;
2) characteristics of the study population including age; and characteristics of the disease including diagnostic criteria and disease duration;
3) characteristics of the therapy in all trial arms including type and dose of therapy;
4) risk of bias domains as outlined in 'Assessment of risk of bias in included studies', below;
5) outcome measures, as the mean and standard deviation for continuous outcomes, and number of events for dichotomous outcomes (as outlined in Types of outcome measures).
If data on more than one pain scale were provided for a trial, we referred to a previously described hierarchy of pain‐related outcomes (Juni 2006; Reichenbach 2007) and extracted data on the pain scale that was highest on the following list:
-
global pain;
-
pain on walking;
-
WOMAC pain subscore;
-
composite pain scores other than WOMAC;
-
pain with activities other than walking;
-
rest pain or pain during the night;
-
WOMAC global algofunctional score;
-
Lequesne osteoarthritis index global score;
-
other algofunctional scale;
-
patient's global assessment;
-
physician's global assessment.
If data on more than one function scale were provided for a trial, we extracted data according to the hierarchy:
-
global disability score;
-
walking disability;
-
WOMAC disability subscore;
-
composite disability scores other than WOMAC;
-
disability other than walking;
-
WOMAC global scale;
-
Lequesne osteoarthritis index global score;
-
other algofunctional scale;
-
patient’s global assessment;
-
physician’s global assessment.
If data on more than one quality of life scale were provided for a trial, we extracted data according to the hierarchy:
-
SF‐36;
-
EuroQoL;
-
Sickness Impact Profile (SIP);
-
Nottingham Health Profile (NHP).
To avoid multiple outcome reporting in the review, we adopted the following rules to extract data.
-
Where outcomes were reported at several time points, we extracted the measure at the end of the intervention as the main outcome. Studies of similar duration were analysed using end of intervention data only. We also extracted data at interim time points and reported these data for completeness but did not include them in meta‐analyses.
-
Where trial authors reported both final values and change from baseline values for the same outcome, we extracted the final values.
-
Where trial authors reported data analysed based on the intention‐to‐treat (ITT) sample and another sample (e.g. per protocol, as‐treated), we extracted ITT‐analysed data.
-
For crossover trials, data were extracted only up to the point of crossover given the potential for carry‐over effects of these particular interventions and to bias the treatment effect following crossover.
Adverse events were measured as the number of patients experiencing any adverse event, patients who were withdrawn or dropped out because of adverse events, and patients experiencing any serious adverse events. Serious adverse events were defined as events resulting in in‐patient hospitalisation, prolongation of hospitalisation, persistent or significant disability, congenital abnormality or birth defect of offspring, life‐threatening events, or death.
If additional data were required, we contacted the trial authors to obtain these data. Some data were converted to normalised scales prior to extraction and reporting. Where data were imputed or calculated (for example standard deviations calculated from standard errors, P values, or confidence intervals; imputed from graphs; or from the standard deviations in other trials) we reported these adjustments (see Characteristics of included studies). Any disagreements were resolved by consensus.
Assessment of risk of bias in included studies
Two review investigators (MC, SC) independently assessed the risk of bias of each included trial against the key criteria: random sequence generation; allocation concealment; blinding of participants, personnel and outcome assessors; incomplete outcome data; selective outcome reporting; and other sources of bias in accordance with methods recommended by The Cochrane Collaboration (Higgins 2011). Each of these criteria were explicitly judged as: (a) low, (b) unclear (either lack of information or uncertainty over the potential for bias), or (c) high risk of bias. Potential disagreements were discussed and resolved by referring to the original protocol and, if necessary, arbitration by member(s) of the editorial group.
Measures of treatment effect
When possible, the analyses were based on ITT data (outcomes provided for every randomised participant) from the individual trials. For each trial, we presented outcome data as point estimates with the mean and standard deviation for continuous outcomes and risk ratio (RR) with corresponding 95% confidence interval for dichotomous outcomes. Where possible, for continuous outcomes we extracted the end of treatment scores rather than change from baseline scores. For continuous data, results were presented as mean differences (MD) and 95% confidence intervals (CI). We had planned that when different scales were used to measure the same outcome or concept, standardised mean difference (SMD) would be used. This was applicable to one analysis (ASU 300 mg versus placebo) for function. Outcomes pooled using SMD were re‐expressed as a mean difference by multiplying the SMD by a representative control group baseline standard deviation from one trial using a familiar instrument.
Unit of analysis issues
Where a study was defined as a crossover trial, data were extracted only up to the point of crossover, given the potential for carry‐over effects of these particular interventions to bias the treatment effect following crossover.
Dealing with missing data
For dichotomous outcomes we used the number randomised as the denominator, making the assumption that any participants missing at the end of treatment did not have a positive outcome. For continuous outcomes with no standard deviation reported, we calculated standard deviations (SD), if possible, from standard errors (SEM), P values, or CIs. For four studies we converted the VAS data from a 10 cm scale to a 100 mm scale (Chopra 2013; Gupta 2011; Kuptniratsaikul 2011; Piscoya 2001), and for three studies we converted SEM to SD (Huber 1991; Maheu 2013; Piscoya 2001).
If no measures of variance were reported and the SD could not be calculated, we had planned to impute SDs from other studies in the same meta‐analysis, using the average of the other SDs that were available, provided only a small proportion of studies comprising the meta‐analysis had missing data. This imputation of missing data was not required for any of the meta‐analyses.
We contacted trial authors to obtain details of methods that were missing from the trial reports. Details of author responses, as well as data conversion and imputation, are explained in characteristics of included studies and the associated table (see table Characteristics of included studies).
Assessment of heterogeneity
We assessed included trials for clinical homogeneity in terms of participants, interventions, and comparators. For studies judged as clinically homogenous, we quantified the possible magnitude of inconsistency (that is heterogeneity) across studies using the I2 statistic with a rough guide to interpretation as follows: 0% to 40% might not be important; 30% to 60% might represent moderate heterogeneity; 50% to 90% may represent substantial heterogeneity; 75% to 100% considerable heterogeneity (Deeks 2011).
Assessment of reporting biases
To examine the possibility of publication bias, we planned to construct funnel plots if at least 10 studies were available for the meta analysis of a primary outcome, however we identified too few trials for this analysis.
We planned to assess the presence of small study bias in the overall meta‐analysis by checking if the random‐effects model estimate of the intervention effect was more beneficial than the fixed‐effect model estimate, but again there were too few trials for this analysis.
Data synthesis
As far as data extraction was possible, descriptive results were reported for all included studies. We pooled data from clinically homogenous trials; that is with the same interventions, doses, comparators, and outcomes. Where we could not combine data, we have summarised the effect estimates and 95% CIs of each trial narratively. Meta‐analyses are reported for multiple studies of ASU and Boswellia serrata only, using the random‐effects model, based on the assumption that clinical and methodological heterogeneity was likely.
Summary of findings
See: 'Summary of findings' tables.
The main results (pain, function, joint structure, adverse events, withdrawals due to adverse events, serious adverse events, quality of life) of the review are presented in summary of findings tables (Schunemann 2011a; Schunemann 2011b). The overall grading of the evidence using the GRADE approach, classifying the evidence for each herbal intervention as: (a) high, (b) moderate, (c) low, or (d) very low, is included as an indication of our confidence in the results of the studies.
Continuous outcomes pooled using SMDs were re‐expressed as MD by multiplying the SMD by a representative control group baseline SD from a trial using a familiar instrument (Schunemann 2011b).
In the comments column of the summary of findings table we reported the absolute per cent difference, the relative per cent change from baseline, and the number needed to treat (NNT); NNT was reported only when the outcome showed a statistically significant difference).
For dichotomous outcomes, such as adverse events, the NNT was calculated from the control group event rate and the relative risk (RR) using the Visual Rx NNT calculator (Cates 2008). The NNT for continuous measures was calculated using the Wells calculator (available at the CMSG Editorial office, http://musculoskeletal.cochrane.org/).
For dichotomous outcomes, the absolute risk difference was calculated from the risk difference statistic in RevMan and the result expressed as a percentage. For continuous outcomes, the absolute benefit or change was calculated as the improvement in the intervention group minus the improvement in the control group, in the original units.
The relative per cent change for dichotomous data was calculated as the RR ‐ 1 and expressed as a percentage. For continuous outcomes, the relative difference in the change from baseline was calculated as the absolute benefit divided by the baseline mean of the control group.
Subgroup analysis and investigation of heterogeneity
In order to explain the heterogeneity between the results of the included studies, we have included some subgroup analyses by type and length of intervention.
Data from studies of ASU compared with placebo have been subgrouped according to dose (300 mg or 600 mg) and length of intervention (three, six, or 36 months) (Appelboom 2001; Blotman 1997; Maheu 1998; Maheu 2013), or in the case of one study planned over two years but not reported the data available after 12 months of intervention (Lequesne 2002).
Data from studies of Boswellia serrata extracts have been subgrouped by proprietary product because although these products all contain Boswellia serrata extract we cannot be certain that the active principles are identical (Kimmatkar 2003; Sengupta 2008; Sengupta 2010; Sontakke 2007; Vishal 2011).
There were insufficient data available on most oral herbal products to justify subgroup analyses.
Sensitivity analysis
We planned a sensitivity analysis to investigate the robustness of the treatment effect on pain and function relative to allocation concealment and participant blinding, by removing the trials that reported inadequate or unclear allocation concealment and lack of participant blinding from the meta‐analysis to see if this changed the overall treatment effect. There were insufficient data to perform these analyses.
Results
Description of studies
See: Characteristics of included studies.
See: Characteristics of excluded studies.
Note: proprietary names underlined; botanical names are set in italics.
Forty‐nine randomised controlled studies involving 5980 patients with OA met the inclusion criteria for this review (45 studies were identified for this review update and four studies were included in the original review).
Most of the studies were of parallel design, with two groups comparing a herbal intervention to a placebo (inert) control only (n = 28). A further seven studies compared herbal interventions to both active and placebo controls in three (or more) arm designs (Adegbehingbe 2008; Bernhardt 1991; Biegert 2004; Bliddal 2000; Chopra 2011; Piscoya 2001; Teekachunhatean 2004). One study included a non‐intervention control in a third arm comparison against a herbal intervention and placebo (Badria 2002). Thirteen studies were head‐to‐head comparisons between herbal products and active controls (Cao 2005; Chopra 2013; Jung 2004; Kuptniratsaikul 2009; Kuptniratsaikul 2011; Leblan 2000; Majima 2012; Medhi 2009; Mehta 2007; Pavelka 2010; Sengupta 2008; Sengupta 2010; Sontakke 2007).
All studies including active controls used a non‐inferiority design, however in five of these studies we queried the activity of the comparator agent (Cao 2005; Chopra 2011; Chopra 2013; Mehta 2007; Pavelka 2010).
Only seven studies used true crossover designs (Bliddal 2000; Ferraz 1991; Kimmatkar 2003; Rein 2004a; Schadler 1988; Wigler 2003; Winther 2005), versus placebo, and one of these studies included a third arm against an active control (Bliddal 2000). One study was described as a crossover trial but the methodology and reported results indicated that this study was conducted as a parallel trial (Badria 2002), and in this review this study was classified as a parallel design.
Eighteen studies were of confirmatory design (Altman 2001; Appelboom 2001; Belcaro 2008; Biegert 2004; Blotman 1997; Chopra 2004; Chopra 2013; Jung 2001; Jung 2004; Kuptniratsaikul 2009; Kuptniratsaikul 2011; Leblan 2000; Lequesne 2002; Maheu 1998; Maheu 2013; Pavelka 2010; Sengupta 2008; Sengupta 2010), that is effect size was estimated a priori, statistical power and alpha level were set, and sample size recruitment undertaken according to these calculations. The remaining 32 studies were of exploratory design and were generally of poorer methodological quality.
Results of the search
This review was formed from the division of a broader review of herbal therapies for the treatment of OA. In the original review both topical and oral medicinal plant products were considered. The search strategy for this updated review was structured from the protocol used in the original review. The searches for this review update have been repeated several times since 2005. It is not possible, therefore, to give a precise account of the search results as the number of records identified from all searches.
A full search was completed before the current review was divided into two parts (December 2011). In that full search of all databases we identified, after the removal of duplicates, 288 abstracts on topical or oral herbal medicines in the treatment of OA.
In recent repeat searches (June 2012, February 2013, May 2013, August 2013) we identified approximately 2500 citations, reduced to 309 citations after removal of duplicates from previous searches, and from these titles and abstracts we sought 99 items in full. Three studies published as abstracts only were excluded because they were identified as duplicate publications of full text manuscripts already included in this review. A further seven studies currently obtained only in abstract form are awaiting classification should full text reports become available. See Figure 1 for our best estimate of results from the searches.
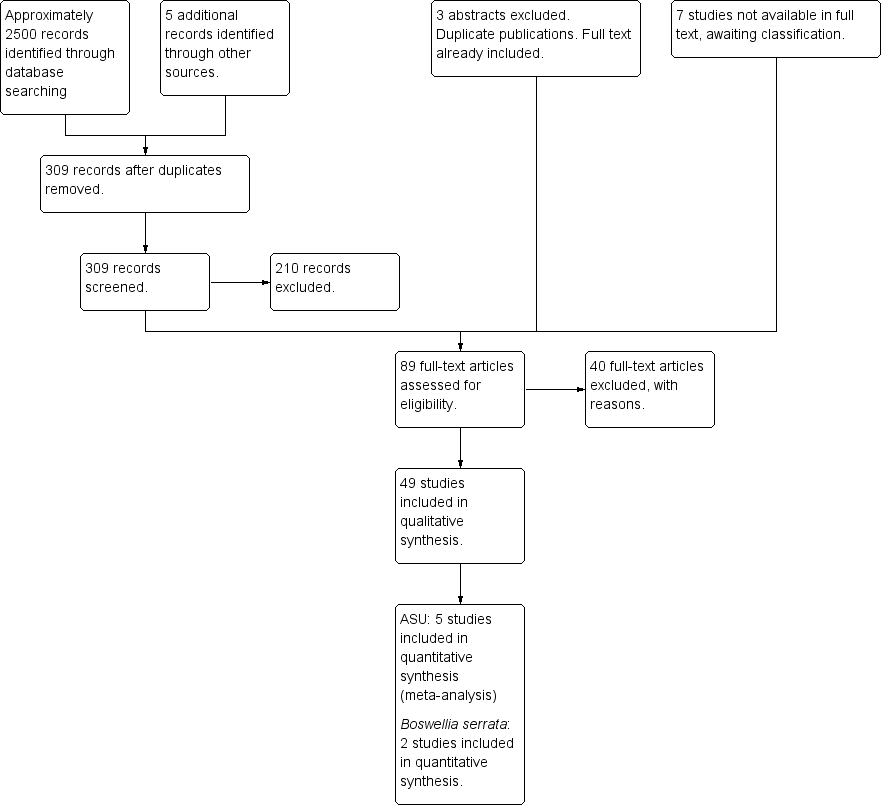
Study flow diagram.
A total of 45 new studies, including four studies published between 1988 and 1997 that had been overlooked in the previous review (Bernhardt 1991; Huber 1991; Schadler 1988; Schmelz 1997), were identified for inclusion in the updated review (Adegbehingbe 2008; Altman 2001; Appelboom 2001; Badria 2002; Belcaro 2008; Biegert 2004; Biller 2002; Bliddal 2000; Cao 2005; Cheras 2010; Chopra 2004; Chopra 2011; Chopra 2013; Cisar 2008; Farid 2007; Frerick 2001; Gupta 2011; Jung 2001; Jung 2004; Kimmatkar 2003; Kuptniratsaikul 2009; Kuptniratsaikul 2011; Leblan 2000; Lequesne 2002; Maheu 2013; Majima 2012; Medhi 2009; Mehta 2007; Oben 2009; Pavelka 2010; Piscoya 2001; Rein 2004a; Schmid 2000; Sengupta 2008; Sengupta 2010; Sontakke 2007; Teekachunhatean 2004; Vishal 2011; Warholm 2003; Wigler 2003; Winther 2005). These new studies were added to the four studies of oral herbal products included in the original review (Blotman 1997; Ferraz 1991; Maheu 1998; Mills 1996).
Included studies
See: Characteristics of included studies.
Thirty‐three different medicinal plant products were tested in the included studies. Products were compared with placebo, active, and non‐intervention controls. Due to differing study protocols and different herbal interventions, meta‐analyses were restricted to data from multiple studies of proprietary products from avocado‐soyabean unsaponifiables (ASU) and Boswellia serrata.
Monoherbal products studied were medicinal plant products derived from Boswellia serrata (gum resin extracts), Curcuma domestica (ethanolic root extract), the Malay jewel vine (Derris scandens) (ethanolic stem extract), Garcinia kola (crude seed), devil's claw (Harpagophytum procumbens) (aqueous or etholic extractions or crude powdered plant material), Petiveria alliacea (tipi tea) (aqueous extract), Pinus pinaster (polyphenol concentrate from pine bark), Rosa canina lito (crude plant material from fruit and seed), Salix pupurea +daphnoides (ethanolic bark extract), Uncaria guianensis (aqueous bark extract), Vitellaria paradoxa (patented seed extract), and Zingiber officinale (acetone or carbon dioxide extracts).
Mixtures of two herbal preparations included medicinal products from Boswellia carteri (gum resin extract) and Curcuma longa (root extract), Persea gratissma (unsaponifiables) and Glycine max (unsaponifiables), Phellondenron amurense (bark extract) and Citrus sinensis (peel extract), Uncaria guianensis andLepidium meyenii (aqueous bark extracts), and a combination of root extracts of two ginger species (Zingiber officinalis and Alpinia galanga (also known as Thai ginger)).
Polyherbal preparations included two European mixtures, Phytodolor N® and Reumalex®; a Korean mixture SKI306X®; 10 Ayurvedic formulae: RA‐11®, Antarth, shunthi‐guduchi (SGC), shunthi‐guduchi with guggal (SGCG), and five formulae known only as A, B, C, D, or E; two Chinese herbal mixtures: Duhuo Jisheng Wan and blood‐nourishing, hard‐softening (BNHS); and a Japanese herbal mixture called Boiogito.
See Table 1 for preparation details of all products.
| PLANT | MEDICINAL PRODUCT | DOSE | MARKER | |||||
| Botanical name | Part/s | Tradename | Preparation | Drug:Extract | mg/day | Constituent marker | Quantity of marker | References |
| Medicinal products from single plants | ||||||||
| Boswellia serrata | gum resin | CapWokvelTM | extraction solvent not stated | not stated | 999 | boswellic acid (total organic acids 65%) | 40% | |
| 5‐Loxin | 100 or 250 | AKBA | 30% | |||||
| Aflapin | 100 | AKBA + non‐volatile oil | 20% | |||||
| Curcuma domestica | root | study medication | ethanolic extract | not stated | curcumoids | 500mg | ||
| Derris scandens | stem | study medication | ethanolic (50%) extract | not stated | 800 | genistein derivatve | not stated | |
| Garcinia kola | seed | study medication | freeze‐dried aqueous extract | not stated | 400 | not stated | ||
| Harpagophytum procumbens | root | Arthrotabs | aqueous extract | 1.5‐2.5:1 | 2400 | harpagoside1 | 30 mg | |
| Flexiloges | ethanolic (60%) extract | 4.5‐5.5:1 | 960 | <30 mg | ||||
| Harpadol | cryoground powder | 2610 | 60 mg | |||||
| Petiveria alliacea | herb | Tipi tea | aqueous extract | 9g / 600 ml | 600 ml | not stated | ||
| Pinus pinaster (synonym Pinus maritima) | bark | Pycnogenol® | polyphenol concentrate | 150 | proanthocyanidins | 45 (90%) | ||
| 100 | not stated | |||||||
| 150 | 70% | |||||||
| Ricinus officinalis | seed | study medication | oil | not stated | 2,7 ml | ricinoleic acid | not stated | |
| Rosa canina lito | rose hip and seed | Hyben Vital or Litozin | powder | 5000 | galactolipid | 1.5mg | ||
| Salix daphnoides | bark | study medication | ethanolic (70%) extract | 8‐14:1 | 1573 | salicin | 240 mg | |
| Salix pupurea x daphnoides | bark | study medication | ethanolic (70%) extract2 | 10‐20:1 | 1360 | salicin | 240 mg | |
| Uncaria guianensis | bark | study medication | freeze‐dried aqueous extract | not stated | 100 | not stated | ||
| Vitellaria paradoxa | seed | study medication | patented extract | not stated | 2250 | triterpenes | 75% | |
| Zingiber officinale3 | root | EV.EXT 33 | acetone extract3 | 20:1 | 510 | not stated | ||
| Zingiber officinale | root | Zintona EC | CO2 extract | not stated | 1000 | gingerol | 40 mg | |
| Medicinal products from two plants | ||||||||
| Boswellia carteri + Curcuma longa | gum + root | study medication | extract, solvent not stated | not stated | not stated | boswellic acid | 37.5% | |
| Persea gratissma (P) + Glycine max (G) | oils | Piascledine 300 | unsaponifiable fraction 1/3 P;2/3 G | 300 or 600 | not stated | Appelboom 2001, Blotman 1997, Lequesne 2002, Maheu 1998, Maheu 2013. | ||
| Phellondenron amurense + Citrus sinensis | bark peel | NP 06‐1 | extract, solvent not stated | not stated | 370 mixture | berberine polymethoxylated flavones | 50% 30% | |
| Uncaria guianensis + Lepidium meyenii | bark | Reparagen® | freeze‐dried aqueous extract | not stated | 1500 300 | not stated | ||
| Zingiber officinale + Alpinia galanga | root | EV.EXT 77 | acetone extract3 | 20:1 | not stated | not stated | ||
| Medicinal products from three or more plants | ||||||||
| Clematis mandshurica + Prunella vulgaris + Trichosanthes kirilowii | root, flower, root; 1:1:2 | SKI306X | ethanol 30% extracts, thereafter butanol extraction | 7:1 | 600‐1800 | oleanolic acid 4%, rosmarinic acids 0.2%, ursolic acids 0.5%, hydroxybenzoic acid 0.03%, | ||
| Fraxinus excelsior | bark | Phytodolor | fresh plant ethanolic (45,6%) extract | 3:1:1 | 5‐8 ml | total flavonoids | 0.34 ‐ 0.56 mg | |
| salicyl alcohol | 0.48 ‐ 0.8 mg | |||||||
| Solidago virgaurea | herb | isofraxidin | 0.67 ‐ 1.1 mg | |||||
| Populus tremula | bark and leaf | salicin | 4.8 ‐ 8 mg | |||||
| Salix alba | bark | Reumalex | powder | 200 | salicin | 40‐80mg | ||
| Guaiacun officinale | resin | powder | 80 | |||||
| Cimicifuga racemosa | root | powder | 70 | |||||
| Smilax (species not stated) | root | extract, solvent not stated | 4:1 | 50 | ||||
| Populus (species not stated) | bark | extract, solvent not stated | 7:1 | 34 | ||||
| Chinese mixture4 | herb | Duhuo Jisheng Wan | powder | 3 x 3 g | not stated | |||
| Paeoniae alba | root | Chinese mixture: Blood nourishing, hard softening (BNHS) | extract, solvent not stated | not stated | 3150 | paconiflorin | not stated | |
| Gentiana macrophylla | gentianine | |||||||
| Glycyrrhiza (species not stated) | not stated | |||||||
| Auryvedic formaulae5 | powder | not stated | 1000 | total gingerols | not stated | |||
| Zingiber officinale | rhizome | component of formulae A, B, C, D, and E | ||||||
| Tinospora cordifolia | stem | component of formulae A, B, C, D, and E | aqueous extract | 220 | tinosporosides | not stated | ||
| Withania somnifera | root | component of formulae B and E | aqueous extract | 600 | total withanolides | not stated | ||
| Emblica officinale | fruit | component of formulae C | aqueous extract | 500 | tannins galic acid | not stated | ||
| Tribulus terrestris | fruit | component of formulae A and B | aqueous extract | 216 | total saponins | not stated | ||
| Ayuvedic formula6 | Antarth3 (for sandhigata vata) | not stated | not stated | not stated | not stated | |||
| Ayuvedic formula | RA‐11 | not stated | not stated | not stated | not stated | |||
| Ayuvedic formula | SGC | |||||||
| Ayuvedic | SGCG | |||||||
| Japanese mixture7 | Boiogito | not stated | not stated | 7.5g | not stated | not stated | ||
1. Harpagoside content estimated indirectly and approximately from iridoid glycoside content in daily dose of raw material (Sporer 1999).
2. Ethanolic extract stated in unpublished thesis but not in published paper (Schmid 1998b).
3. Information provided by manufacturer but not reported in paper.
4. Chinese herbal medicine contains 7.75% each of: radix angelicae pubescentiis, radix gentianae macrophyllae, cortex eucommiae, radix achyranthis bidentatae, radix angelicae sinensis, herba taxilli, radix rehmanniae preparata, rhizoma chuanxiong, cortex cinnamomi, radix ledebouriellae. 5% each of: radix paeoniae alba, radix codonopis, radix glycyrrhizae, poria. 2.5% herba asari.
5. All Ayurvedic formulae A‐E contain Zingiber officinale (dried rhizome powder, total gingerols as marker), and Tinospora cordifolia (dried stem aqueous extract, marker tinosporosides). Some formulae also included Emblica officinale, Withania somnifera, or Tribulus terrestris. Drug:extract ratio and marker content not stated.
6. Ayurvedic phytomedicine Antarth contains Boswellia serrata, Commiphora mukul, Curcuma longa and Vitex negundo, Alpinia galangal, Withania somnifera, Tribulus terrestris, and Tinospora cordifolia.
7. Japanese herbal medicine Boiogito contains Sinomenium acutum, Astragalus (species not stated) root, Atractylodes lancea rhizome, Jujube (probably Ziziphus zizyphus), Glycyrrhiza (species not stated), and ginger (species not stated, probably Zingiber officinale).
A wide range of outcome measures were used and the reporting of measures differed among studies, limiting the utility of some studies for meta‐analysis. All VAS were 100 mm lines with anchor points identified as 0 (nil symptom) and 100 (worst possible symptom), but in four studies the VAS scores were reported on a centimetre scale in the range 0 to 10 cm (Chopra 2013; Gupta 2011; Kuptniratsaikul 2011; Piscoya 2001). For ease of comparison between trials we converted all VAS data to the 0 to 100 mm scale.
Several studies used the WOMAC, but this index may be used with two possible scoring methods: a battery of 0 to 4 Likert scales, or a battery of 100 mm VAS. Typically the Likert scale scores are presented as aggregate scores (sums) for each of the three subscales (pain subscore range 0 to 20, stiffness subscore range 0 to 8, physical function subscore range 0 to 68), whereas the VAS may be aggregated (pain subscore range 0 to 500, stiffness subscore range 0 to 200, physical function subscore range 0 to 1700) or converted to normalised units (means) for each subscale (all subscales scored 0 to 100). Although both scoring systems are acceptable for clinical and research use, there is no agreed conversion ratio between them so studies using the differing systems are not comparable. Also, in a few studies although standardised measures such as the WOMAC were used the data were reported in atypical forms that required some conversion or estimation before they could be included in these analyses. Specific details of all data conversions are included in the Characteristics of included studies.
Excluded studies
See: Characteristics of excluded studies.
Reasons for excluding studies were: (a) not a randomised controlled trial (Grahame 1981; Guyader 1984; Kagore 2011; Linsheng 1997; Loew 1996; Mishra and Singh 2003; Myers 2010; Saley 1987; Srivastava 1989; Wang 1985; Wegener 2003; Xu 2005; Yuelong 2011; Zell 1993), (b) review or discussion paper (Anonymous 1993; Brien 2006; Chrubasik 1998; Dharmananda 1985; Falch 1997; Gendo 1997; Kielczynski 1997; Long 2001; Reuss 1981), (c) not a herbal intervention (Belcaro 2010; Levy 2009; Park 2009), (d) unable to identify the herbal components of the intervention (Jacquet 2009; Kulkarni 1991), (e) individualised treatments thus not a standardised herbal intervention (Fang 2008; Hamblin 2008), (f) mixed sample and unable to extract data for participants with OA only (Biswas 1998; Du 2006; Lechner 2011; Schaffner 1997), (g) duplicate publication or part thereof (Chantre 2000; Lung 2004; Rein 2004b; Schmid 2001; Winther 2004), (h) abstract publication only (Biswas 1997; Schmid 1998a), or (i) did not include functional or clinical outcomes (Zeng 2008). Subanalyses of two studies (Jung 2004; Rein 2004a) were identified in other publications (Lung 2004; Rein 2004b; Winther 2004) and were excluded from this review to avoid repetition of data. In the original review, one study was classified as pending assessment subject to full translation of the texts (Loew 1996), but in this update language was no barrier to inclusion and this study was excluded on other grounds.
Risk of bias in included studies
See: Characteristics of included studies, 'Risk of bias' tables.
The risk of bias of each study was assessed independently by two review authors according to the criteria described in the methods (Higgins 2011; Schunemann 2011a). Quality of the included studies was variable and should be taken into account when interpreting results. See Figure 2 for a summary of the risk of bias assessment. Only three studies adequately met all six validity criteria and thus were at minimal risk of bias (Altman 2001; Lequesne 2002; Pavelka 2010).

Risk of bias summary: review authors' judgements about each risk of bias item for each included study.
Although not directly measures of bias, we considered if authors reported that they had obtained ethics committee approval, clinical trials registration, or complied with the Declaration of Helsinki and International Conference on Harmonisation of Technical Requirements for Registration of Pharmaceuticals in Human Use Good Clinical Practice (ICH GCP) guidelines. Further, we considered that risk of bias could be assumed to be low if these oversights implied that a risk of bias was reduced. For example, the ICH GCP guidelines were recommended in Germany, France, Great Britain, and Scandanavia from 1986 onwards, therefore we have assumed that Human Research Ethics committee approvals granted for studies after this time, in these countries, necessitated compliance with the guidelines regarding randomisation, allocation concealment, and blinding of participants and assessors. In 1989, these guidelines were recommended across the European Community (EC) as it was then constituted. Again, we have assumed that from this date studies with ethics committee approval, conducted in EC countries, have complied with these guidelines. In 1996, compliance with the ICH CGP guidelines was required under German law governing clinical trials.
The ICH GCP guidelines are now adopted by the WHO and most countries, including many developing countries, are listed as following these guidelines. Formally constituted human research ethics committees are charged with ensuring that clinical trials are conducted in compliance with these guidelines and associated regional legislation. Six studies reported some form of board approval or review but did not specify that the board was a formally constituted human research ethics committee nor reported compliance with relevant guidelines or legislation (Maheu 1998; Majima 2012; Oben 2009; Sengupta 2008; Sengupta 2010; Vishal 2011). Nine studies did not report any form of ethical oversight or compliance with research design guidelines (ICH GCP guidelines or Declaration of Helsinki) (Badria 2002; Bernhardt 1991; Chopra 2004; Ferraz 1991; Huber 1991; Kimmatkar 2003; Schadler 1988; Schmelz 1997; Warholm 2003).
Allocation
We attributed low risk of bias to 28 studies that fully described an appropriate process of generating a randomisation schedule (Adegbehingbe 2008; Altman 2001; Belcaro 2008; Bernhardt 1991; Biegert 2004; Bliddal 2000; Blotman 1997; Cheras 2010; Chopra 2004; Chopra 2013; Jung 2004; Kimmatkar 2003; Kuptniratsaikul 2011; Lequesne 2002; Maheu 1998; Maheu 2013; Mehta 2007; Oben 2009; Pavelka 2010; Rein 2004a; Schmid 2000; Sengupta 2008; Sengupta 2010; Sontakke 2007; Vishal 2011; Warholm 2003; Wigler 2003; Winther 2005). We also attributed low risk of bias to two studies that reported compliance with the ICH GCP guidelines but did not fully describe the randomisation processes because in these studies adequate randomisation processes could be inferred (see Other potential sources of bias) (Biller 2002; Frerick 2001).
A further 13 studies were described as randomised but the method of randomisation was not reported (Appelboom 2001; Badria 2002; Cao 2005; Cisar 2008; Farid 2007; Ferraz 1991; Gupta 2011; Jung 2001; Majima 2012; Medhi 2009; Piscoya 2001; Schadler 1988; Schmelz 1997; Teekachunhatean 2004). In another two studies randomisation was reported in insufficient detail to allow replication of the method (Kuptniratsaikul 2009; Leblan 2000), and in a further two studies the methods could be more accurately described as quasi‐randomisation (Chopra 2011; Mills 1996). We classified each of these studies as having unclear risk of bias due to randomisation procedures. One study was not randomised (Huber 1991) and has been classified as having high risk of bias.
Allocation concealment was poorly described in most studies. Allocation concealment was assessed according to the Cochrane format, as described in the methods (Higgins 2011). We attributed low risk of bias to three studies (Adegbehingbe 2008; Maheu 1998; Maheu 2013) in which allocation concealment was explicitly reported, and the 20 studies in which it could reasonably be inferred from the description of methods (Altman 2001; Belcaro 2008; Bernhardt 1991; Biegert 2004; Biller 2002; Bliddal 2000; Cao 2005; Cheras 2010; Chopra 2004; Chopra 2013; Frerick 2001; Kimmatkar 2003; Lequesne 2002; Pavelka 2010; Rein 2004a; Schmid 2000; Sengupta 2010; Vishal 2011; Wigler 2003; Winther 2005). One study reported that allocation was not concealed, neither from participants nor the research assistant (Kuptniratsaikul 2011). This study has been classified as having a high risk of bias.
Allocation concealment could not be determined in any other study; neither could failure to conceal allocation be determined. These studies have been classified as having unclear risk of bias for this domain.
Blinding
Low risk of bias has been attributed to 33 studies in which the herbal products and placebo or active controls could not be distinguished by colour, size, smell, shape, packaging, or treatment regimen (Adegbehingbe 2008; Altman 2001; Belcaro 2008; Biegert 2004; Biller 2002; Bliddal 2000; Blotman 1997; Cisar 2008; Chopra 2004; Chopra 2011; Chopra 2013; Farid 2007; Frerick 2001; Gupta 2011; Jung 2004; Kimmatkar 2003; Leblan 2000; Lequesne 2002; Maheu 1998; Maheu 2013; Mehta 2007; Mills 1996; Pavelka 2010; Oben 2009; Rein 2004a; Schmid 2000; Sengupta 2008; Sengupta 2010; Teekachunhatean 2004; Vishal 2011; Warholm 2003; Wigler 2003; Winther 2005).
In a small number of studies (n = 9), the method of blinding was inadequately described and no reference to governing guidelines made (see Other potential sources of bias). Although we considered it highly likely that these studies were sufficiently blinded, we downgraded the risk of blinding to unclear (Appelboom 2001; Badria 2002; Bernhardt 1991; Cao 2005; Ferraz 1991; Huber 1991; Jung 2001; Medhi 2009; Schadler 1988). Risk of bias has been downgraded to high in studies that were open label, single blinded, or where interventions could be clearly distinguished (Kuptniratsaikul 2009; Kuptniratsaikul 2011; Majima 2012; Sontakke 2007).
In some studies where allocation concealment was inadequately described (see Allocation (selection bias)) it was unclear whether clinical examiners were blinded to treatment (detection bias). We have classified these studies as having unclear risk of bias in the blinding domain.
Incomplete outcome data
Low risk of bias has been assigned to 28 studies in which participant withdrawals were fully reported and analyses conducted according to an ITT model. in these studies methods for replacing missing data were fully reported (Altman 2001; Appelboom 2001; Bernhardt 1991; Biegert 2004; Cao 2005; Chopra 2011; Chopra 2013; Cisar 2008; Farid 2007; Frerick 2001; Jung 2001; Jung 2004; Kimmatkar 2003; Leblan 2000; Lequesne 2002; Maheu 1998; Maheu 2013; Mehta 2007; Mills 1996; Pavelka 2010; Rein 2004a; Schadler 1988; Schmelz 1997; Schmid 2000; Teekachunhatean 2004; Warholm 2003; Wigler 2003; Winther 2005). Unclear risk of attrition bias has been attributed to 17 studies in which withdrawals were reported but not considered in the analyses (per protocol analysis only) (Adegbehingbe 2008; Belcaro 2008; Bliddal 2000; Blotman 1997; Chopra 2004; Huber 1991; Gupta 2011; Kuptniratsaikul 2009; Kuptniratsaikul 2011; Majima 2012; Medhi 2009; Oben 2009; Piscoya 2001; Sengupta 2008; Sontakke 2007; Sengupta 2010; Vishal 2011). Studies that neither reported participant withdrawals nor applied any method for replacement of missing data were ascribed a high risk of attrition bias.
Selective reporting
Some studies adopted validated measures but outcome data were reported as non‐standardised scores (VAS 0 to 10 instead of 0 to 100, paracetamol in tablets rather than milligrams). We converted these data to standardised forms prior to re‐analysis and have noted these data conversions in this section of the risk of bias tables but not attributed any increased risk.
In three studies we identified errors in data during conversion and have downgraded these studies to unclear risk (Huber 1991; Kuptniratsaikul 2011; Piscoya 2001).
We have downgraded to unclear risk of bias 12 studies in which data were insufficiently reported to allow extraction for re‐analysis (Adegbehingbe 2008; Belcaro 2008; Biegert 2004; Cheras 2010; Chopra 2011; Frerick 2001; Huber 1991; Kuptniratsaikul 2011; Medhi 2009; Mehta 2007; Piscoya 2001; Schmelz 1997).
Examples of selective reporting included providing mean scores only (omission of SDs) at some or all time points, or reporting data spread as standard errors of measure (SEM) rather than SDs. Similarly, data reported only as group change scores, percentages, or raw scores without measures of data spread, and data presented in graphical form only, were inadequate for re‐analysis. In some cases we were able to calculate the unreported data (for example convert SEM to SD), however we considered that the classification of unclear risk of bias should still be applied to this selective reporting (Huber 1991; Maheu 2013; Piscoya 2001).
A few studies were particularly poorly reported and have been classified as having high risk of bias for this criterion. Examples of very poor reporting included omission of key demographic data (for example age, gender, concomitant disease) and failure to report reasons for withdrawals or adverse events (that is a safety concern). In one study that was described as a crossover design with three arms (intervention, placebo control, and non‐intervention control) data were reported from the intervention and placebo control groups only, and no data were reported after the apparent crossover (Badria 2002). We cannot be certain whether the reporting bias in this study occurred in the description of the research design or reporting of the results. We have treated this study as a two group parallel design and classified it as having a high risk of reporting bias.
In some studies reporting bias was difficult to identify. Omission of details may not be apparent if consistent throughout the report. For example, in one study of pine bark extract the outcome data were reported at 90 days only (Belcaro 2008) whereas in the other two studies of this product the outcome data were reported at more frequent intervals (Cisar 2008; Farid 2007). We considered it unlikely that the former study was planned as a simple pre‐post analysis over such a wide treatment period and questioned whether mid‐point data may have been omitted from the report.
Other potential sources of bias
Selection bias due to diagnostic criteria (see Allocation (selection bias)) is reported under the heading of 'other bias' in the risk of bias tables.
We attributed low risk of bias to studies that recruited and assessed participants consistently with the ACR and EULAR criteria, obtained ethics committee approval, had clinical trials registration, used validated outcome measures, and reported compliance with the Declaration of Helsinki and ICH GCP guidelines. Further, we considered that risk of bias could be assumed to be low if satisfying one of these conditions implied the satisfaction of another. For example, the ICH GCP guidelines were recommended in Germany, France, Great Britain, and Scandanavia from 1986 onwards, therefore we have assumed that Human Research Ethics committee approvals granted after this time for studies in these countries necessitated compliance with the guidelines. In 1989, these guidelines were recommended across the European Community (EC) as it was then constituted. Again, we have assumed that from this date studies with ethics committee approval and conducted in EC countries have complied with these guidelines regarding randomisation, allocation concealment, and blinding of participants and assessors.
In 1996, compliance with the ICH CGP guidelines was required under German law governing clinical trials. The ICH GCP guidelines are now adopted by the WHO and most countries, including many developing countries, are listed as following these guidelines. Formally constituted human research ethics committees are charged with ensuring that clinical trials are conducted in compliance with these guidelines and associated regional legislation. We have classified as low risk all studies that reported either compliance with ICH GCP guidelines or ethics committee approval, or both.
Unclear risk of bias has been attributed to six studies that reported some form of board approval or review but did not specify that the board was a formally constituted human research ethics committee nor reported compliance with relevant guidelines or legislation (Maheu 1998; Majima 2012; Oben 2009; Sengupta 2008; Sengupta 2010; Vishal 2011). High risk of bias has been attributed to the nine studies that did not report any form of ethical oversight or compliance with research design guidelines (ICH GCP guidelines or Declaration of Helsinki) (Badria 2002; Bernhardt 1991; Chopra 2004; Ferraz 1991; Huber 1991; Kimmatkar 2003; Schadler 1988; Schmelz 1997; Warholm 2003).
Effects of interventions
See: Summary of findings for the main comparisonBoswellia serrata for treating osteoarthritis; Summary of findings 2Boswellia serrata (enriched) 100 mg for treating osteoarthritis; Summary of findings 3Boswellia serrata (enriched) 250 mg for treating osteoarthritis; Summary of findings 4Boswellia serrata (enriched) plus non‐volatile oil for treating osteoarthritis; Summary of findings 5Boswellia serrata compared to valdecoxib for treating osteoarthritis; Summary of findings 6Persea gratissma + Glycine max (ASU 300 mg) for treating osteoarthritis; Summary of findings 7Persea gratissma + Glycine max (ASU 600 mg) for treating osteoarthritis; Summary of findings 8Persea gratissma + Glycine max (ASU 300 mg) compared to chondroitin sulphate for treating osteoarthritis
See: 'Additional tables', Table 1: Herbal medicinal products used for the treatment of OA.
Results are listed below, grouped by the intervention in alphabetical order. Medicinal products from single plants are listed first, by botanical name, followed by products formed from two plants, followed by herbal mixtures from three or more plants. For consistency and ease of reading this same order of presentation was used in Table 1: Herbal medicinal products used for the treatment of OA.
Medicinal products from single plants
Boswellia serrata versus placebo
Boswellia serrata extracts have been subgrouped by proprietary products because we cannot be certain that the active principle in each product is identical.
One study investigated the proprietary Boswellia product CapWokvel®. The extract of Boswellia serrata was compared with placebo in 30 participants with OA in a crossover trial of two periods of eight weeks intervention separated by a three week washout period (Kimmatkar 2003). In this review, data have been extracted for the first arm of the trial only and may be considered as from an eight week parallel group trial. Pain and function (loss of movement) were rated using a 0 to 3 scale (0 = absent, 1 = mild, 2 = moderate, 3 = severe), and statistically significant improvements in favour of the Boswellia serrata group were reported over the eight weeks of intervention (pain: MD ‐2.45, 95% CI ‐2.85 to ‐2.23, P < 0.01; Analysis 1.1; function: MD ‐2.16, 95% CI ‐2.56 to ‐1.76, P < 0.01; Analysis 1.2).
Two studies investigated the proprietary Boswellia serrata product 5‐Loxin®. Both studies were undertaken by the same author team and were of similar design, suitable for pooling. Both studies involved three parallel groups, two intervention groups and one placebo control, over 12 weeks. The earlier study by Sengupta 2008 was a dose‐finding study comparing high (250 mg/day) and low (100 mg/day) doses. Participants who took 250 mg of 5‐Loxin reported less pain (Analysis 3.1) and better function (Analysis 3.2) than participants who took the placebo. The risk of adverse events did not meaningfully differ between groups (5‐Loxin 27/57 events, placebo 30/57 events; RR 0.90, 95% CI 0.62 to 1.30). The higher dose of 5‐Loxin did not produce significantly greater clinical outcomes than the 100 mg dose.
In the subsequent study (Sengupta 2010), 100 mg of 5‐Loxin® was compared with 100 mg/day of an alternative Boswellia serrata product. Meta‐analysis of the data from the two 100 mg 5‐Loxin® groups in both studies showed that 90 days treatment with this product produced improvements over placebo in pain (MD ‐16.94, 95% CI ‐22.39 to ‐11.50; Analysis 2.1) and function (MD ‐9.62, 95% CI ‐11.35 to ‐7.89; Analysis 2.2). Also, the risk of adverse events appeared lower in the 5‐Loxin group than in the placebo group (5‐Loxin 18/48 events, placebo 30/48 events; RR 0.60, 95% CI 0.39 to 0.92; Analysis 2.3).
Two studies investigated the proprietary Boswellia serrata product Aflapin® (Sengupta 2010; Vishal 2011). In the three way comparison of Aflapin® and 5‐Loxin® against placebo in 60 patients over 90 days, both treatment groups reported significantly greater improvements in pain (Analysis 4.1) and function (Analysis 4.2) than did the placebo group, and Aflapin® consistently outperformed 5‐Loxin® (Sengupta 2010). This study was conducted using an ANOVA model and results of the three groups were presented as a series of student's t‐tests; multivariate analysis would be required to confidently account for any chance effect from multiple two group comparisons. Data were extracted from the Aflapin® group in this study and subgrouped but not meta‐analysed with data from an additional study (Vishal 2011), a two parallel group test against placebo in patients with OA over 30 days, because of the substantial difference in length of intervention between these studies (30 days, Vishal 2011; 90 days, Sengupta 2010). Viewing these studies together, trends of effectiveness of Aflapin® to reduce pain (30 days: MD ‐14.80, 95% CI ‐20.29 to ‐9.31; 90 days: MD ‐18.10, CI ‐24.95 to ‐11.25; Analysis 4.1) and increase function (30 days: MD ‐14.30, 95% CI ‐20.70 to ‐8.53; 90 days: MD ‐15.80, 95% CI ‐21.92 to ‐9.68; Analysis 4.2). The risk of participants reporting adverse events did not differ between Aflapin® and the placebo groups after 30 or 90 days of intervention (30 days: Aflapin® 1/30, placebo 1/29; RR 0.97, 95% CI 0.06 to 14.74; 90 days: Aflapin® 1/19, placebo 1/19; RR 1.00, 95% CI 0.07 to 14.85; Analysis 4.3).
Boswellia serrata versus cyclo‐oxygenase‐II (COX‐II) inhibitor anti‐inflammatory drugs
A single study compared theBoswellia serrata extract Cap Wovkel against the COX‐II inhibitor anti‐inflammatory drug valdecoxib in 66 participants over six months. Although follow‐up was continued for an additional month, we extracted all data at the end of the intervention period. Although the authors reported that results favoured the intervention, re‐analysis of the data indicated that results slightly favoured the intervention for WOMAC pain subscale scores only (Analysis 5.1). Results favoured control on all other outcomes, including function (Analysis 5.2). Fewer participants in the valdecoxib group reported adverse events, thus the risk of adverse events appeared greater in the Boswellia serrata group (Cap Wovkel 4/33, valdecoxib 2/33; RR 2.00, 95% CI 0.39 to 10.18; Analysis 5.3).
Curcuma domestica versus NSAIDs
A single study (107 participants recruited) compared six weeks intervention with an ethanolic root extract from Curcuma domestica against ibuprofen in a randomised, active control, parallel trial. Particpants within both groups showed statistically significant mean improvements in all outcomes over time at all time points (two, four, and six weeks). Between‐group differences were not significant (Analysis 6.1; Analysis 6.2) suggesting that Curcuma domestica has comparable efficacy to ibuprofen in the treatment of osteoarthritic pain and pain‐related functional impairments.
Derris scandens versus NSAIDs
An ethanolic extract from the stem of Derris scandens was tested in a head‐to‐head comparison with naproxen in a two group parallel trial over four weeks in people with OA of the knee (Kuptniratsaikul 2011). Outcomes were reported using the WOMAC‐VAS, but on a 10 cm scale. We extracted these data and converted them to normalised scores (range 0 to 100), and in so doing identified an error in one of the CIs. We contacted the authors who confirmed our correction. Our re‐analysis supported the authors' conclusions that the effectiveness of Derris scandens was not significantly different from naproxen in improving OA pain (MD 5.00, 95% CI ‐1.84 to 11.84; Analysis 7.1) and physical function (MD 5.11, 95% CI ‐0.13 to 10.33; Analysis 7.2), but that the mean differences and CIs may be larger than originally reported. Also, of particular importance in comparisons against non‐steroidal anti‐inflammatory drugs (NSAIDs) Derris scandens showed a favourable adverse events profile: fewer participants in the Derris scandens group reported adverse events (Derris scandens 22/63, naproxen 29/62) and the risk of an adverse event occurring in that group was markedly lower than in the naproxen group (RR 0.75, 95% CI 0.49 to 1.15; Analysis 7.3).
Garcinia kola
The crude seed of Garcinia kola was compared over six weeks to two NSAIDs, naproxen and celecoxib, as well as a placebo control in a four group parallel trial of 143 patients with OA of the knee (Adegbehingbe 2008). Results favoured all active interventions over placebo for reductions in pain and function. These outcomes appeared to have been measured using two independent WOMAC subscales with differing reporting and scoring formats: pain was measured using the WOMAC‐VAS, and function using the WOMAC 0 to 4. Data were reported as change scores, percentages, CIs, and P values, insufficient for extraction in this review. Comparing efficacy of the active agents, pain relief appeared to have been most rapid and persistent in the celecoxib group, and most delayed and least persistent in the Garcinia kola group.
Harpagophytum procumbens (Devil's claw)
Four studies investigated three different products from the roots of Harpagophytum procumbens. Three studies compared two different extracts to placebo in trials completed by 174 participants (Biller 2002; Frerick 2001; Schmelz 1997). One study (92 participants) compared cryoground root powder to the weak NSAID diacerhein (Leblan 2000).
In the studies using the ethanolic Harpagophytum extract Flexiloges®, no improvement in WOMAC pain scores was found (Biller 2002; Frerick 2001). These authors provided post hoc definitions of improvement that favoured the intervention. 'Responders' to treatment were defined as participants whose WOMAC pain scores did not increase by more than 20%, either with (Frerick 2001) or without (Biller 2002) additional rescue medication (up to 4000 mg ibuprofen) in weeks 17 to 20 of the study. These definitions of response were inconsistent with the American College of Rheumatology (ACR) criteria for response, and data derived from these measures have not been reproduced in this review.
In contrast, the aqueous Harpagophytum extract Arthrotabs® showed favourable effects on OA pain measured using a 0 to 4 categorical rating scale, but these data were also insufficiently reported (Schmelz 1997).
The Harpagophytum powder Harpadol® was not inferior to diacerhein in reducing pain, as measured using a 100 mm VAS (Analysis 1.1) (Leblan 2000). This study constituted moderate evidence that four months daily use of 2610 mg of Harpagophytum procumbens powder was not significantly different from 100 mg diacerhein, producing comparable improvements in pain. In this same study participants in the Harpagophytum group used fewer NSAIDS (diclofenac) and analgesics (acetominophen supplemented by caffeine) at all time points (30, 60, and 120 days) than did participants in the diacerhein group. Due to differences in the protocols and outcome measures these studies were not suitable for data pooling.
Petiveria alliacea (tipi tea)
Overall, the study of tipi tea (Ferraz 1991) was inadequately reported, although it should be noted that the study was published only in the form of a letter. Attempts to obtain a report of the study in greater detail were not successful. Data reported in this study were not adequate for re‐analysis but were reported descriptively for the sake of completeness. Participants receiving tipi tea and participants receiving placebo tea both showed some improvement although no significant differences were found between the two groups. The study was small (n = 20, crossover design) and provided little detail with regard to inclusion criteria. Pain scales against which the outcomes were quantified were not disclosed. Five participants, three during use of the placebo tea and two during use of the tipi tea, reported mild adverse effects. Two participants failed to complete the trial but the reasons for their withdrawal were not explained.
Pinus pinaster (synonymPinus maritima)
Although the pine bark extract Pycnogenol® was investigated in three studies (293 participants) the data could not be pooled despite all studies returning results that favoured the intervention over placebo. The two smaller, earlier studies used identical doses of Pycnogenol® (150 mg daily) over the same intervention period (three months) but the content of the marker substance in the daily dose differed considerably. Moreover, the reported pain and physical function data used two different forms of outcome measure, the VAS 0 to 100 mm items of the WOMAC (Farid 2007) and the 0 to 4 grading (Cisar 2008). Unlike another Cochrane review exclusively on this product, in which results of these two studies were pooled (Schoonees 2012), we have reported data from these studies independently. Data in one study were reported graphically (Cisar 2008), which was insufficient to allow extraction for re‐analysis without a considerable margin for error. Results from the other study demonstrated improvements in pain (Analysis 10.1) and physical function (Analysis 10.2) for the Pycnogenol® group over the placebo, but the small sample size (n = 37) of this study was noted as caution against generalisation of these results.
The more recent, larger study used a confirmatory design and reported outcome data using the WOMAC 0 to 4 (Belcaro 2008). Despite positive outcomes from this study the data could not be pooled with the earlier studies because a smaller dose of pine bark extract (100 mg daily) with an undeclared content of marker substance in the daily dose was used in the confirmatory study. Results from this study also favoured pine bark extract over placebo for improvements in pain (Analysis 11.1) and physical function (Analysis 11.2). Observed together, these three studies provided modest evidence that pine bark extract was effective in reducing pain and improving physical function in people with OA even at daily doses as low as 100 mg.
Ricinus officinalis (castor oil)
Castor seed oil was compared to diclofenac (NSAID) in 110 patients with probable OA of the knee in a parallel trial over four weeks (Medhi 2009). Pain was reported on a 100 mm VAS. Results of this exploratory study were insufficiently reported to allow extraction and re‐analysis. Results favoured diclofenac over Rinicus officinalis for improvement in pain, although pain decreased in both the intervention and active control groups over time. The adverse event profile markedly favoured castor oil over placebo (Analysis 12.1), however it was unclear whether pain (possibly due to untreated OA) was included among the adverse events reported in the placebo group.
Rosa canina lito (rose hip)
Three studies (306 participants) compared daily doses of 5 g of a rose hip and seed powder (Rosae caninae pseudofructus cum fructibus powder) to placebo. Two studies reported reductions in OA pain on a standardised five point scale (0 to 4: 0 = no relief, 4 = almost total relief) (Rein 2004a; Warholm 2003) and the third used the WOMAC‐VAS (Winther 2005). Although the WOMAC‐VAS included a pain subscale, these pain data were not pooled. The data in one study were insufficiently reported to allow extraction for re‐analysis (Warholm 2003) and the remaining two studies used differing outcome measures to report pain (Rein 2004a; Winther 2005). Also, the periods of intervention differed between studies: three months (Rein 2004a; Winther 2005), and four months (Warholm 2003).
Previously it has been suggested that it was likely that some participants may have been in common between the Rein 2004a and Winther 2005 reports such that pooling data from these studies would double count some individuals (Vlachojannis 2009), but correspondence with the study authors confirmed that the data were not transferred between these studies (Winther, personal communication, 21 September 2011). In this review we have treated these reports as independent studies.
These studies constituted modest and somewhat conflicting evidence that daily consumption of 5 g of Rosa canina lito powder produced improvements in OA pain superior to placebo (Analysis 13.1).
Salix daphnoides or Salix pupurea x daphnoides (willow)
Two studies (205 participants recruited) of willow bark preparations returned differing results (Biegert 2004; Schmid 2000). One study compared an ethanolic bark extract of Salix daphnoides, equivalent to 240 mg salicin, to placebo and active (100 mg diclofenac) controls in parallel groups over six weeks to determine that although slightly more effective than placebo, willow bark was less effective than diclofenac in reducing OA pain measured using the WOMAC pain scale (Biegert 2004). In this study similar numbers and severities of adverse events were reported for both the willow bark and ibuprofen interventions.
Another study compared the same daily dose of Salix purpurea x daphnoides ethanolic bark extract to placebo and reported improvements in WOMAC pain scores after two weeks of intervention (Schmid 2000).
Although these products have different names, both are drawn from the subspecies daphnoides (subspecies of Salix purpurea) and may be considered together, however data from these studies were not suitable for meta‐analysis because the authors did not report measures of variance (SD) for mean scores at the 14 day time point. In this review mean WOMAC pain and function scores were reported for a descriptive comparison (Analysis 14.1; Analysis 14.2; Analysis 15.1; Analysis 15.2).
The risk of participants reporting adverse events was not significantly different between Salix extract and placebo (Salix 19/43, placebo 20/41; RR 0.91, 95% CI 0.57 to 1.43; Analysis 14.3), but when compared against diclofenac the adverse events profile of Salix daphnoides was favourable (Salix 19/43, diclofenac 30/43; RR 0.63, 95% CI 0.43 to 0.93; Analysis 15.3).
Uncaria guianensis (cat's claw)
In a 4 week, parallel group trial comparing aqueous bark extract of Uncaria guianensis with placebo (Piscoya 2001) participants using cat's claw reported a statistically significant reduction in pain with activity within the first week of treatment (P < 0.01). The same pattern of improvements were seen in physicians' and patients' global assessments of disease activity. These improvements were maintained throughout the four week trial, but data from these measures were not reported in sufficient detail to allow re‐analysis in this review. In contrast, reduction in night pain (MD ‐11.10, 95% CI ‐26.4 to 4.24, Analysis 16.1) was not statistically significant although changes on this measure somewhat favoured cat's claw over placebo.
Vitellaria paradoxa (shea)
A patented seed extract of Vitellaria paradoxa, the African shea tree, was tested against placebo in a single centre, two group parallel trial for 89 patients with OA of the hip or knee (Cheras 2010). Clinical outcomes were measured using the WOMAC and the Comprehensive Osteoarthritis Test (COAT). Results were equivocal on all clinical outcomes, and none of these data were reported in sufficient detail to allow extraction. The authors focused their report on improvements in biomarkers, which were not of importance in this review.
Zingiber officinale (ginger)
Data from three studies of ginger could not be pooled because the ginger preparations were dissimilar, including acetone extract (Bliddal 2000), carbon dioxide extract (Wigler 2003), and a mixture of two ginger species (Altman 2001).
A crossover trial of Zintona EC, a standardised carbon dioxide extract containing Zingiber officinale (also known as Chinese ginger), with placebo reported results in favour of the intervention on measures of pain on movement and function (handicap), using the 100 mm VAS for these domains from the Hebrew version of the WOMAC (Wigler 2003) (Analysis 17.1; Analysis 17.2). The first arm of the crossover included 24 participants; one participant in the ginger group reported an adverse effect with the intervention (heartburn) (ginger 1/12, placebo 0/12; RR 3.05, 95% CI 0.16 to 78.19; Analysis 17.3).
Another study compared a 510 mg daily dose of standardised acetone extract of Zingiber officinale (EV.EXT 33) with 1200 mg ibuprofen and both tablet and capsule placebos in a crossover trial in 67 participants (56 completed) and reported results in favour of ibuprofen for measures of pain (100 mm VAS), Lequesne algofunctional index, and use of NSAIDS (Bliddal 2000). Data reporting in this study was insufficient to allow extraction for re‐analysis.
Medicinal products from two plants
Boswellia carteri andCurcuma longa
Although the authors described this study as a crossover trial, their reporting of the research method was consistent with a two group parallel trial of a Boswellia‐curcuma mixture compared with placebo over three months of intervention among people with OA (Badria 2002). Minutes of pain free walking time, considered in this review as a measure of function, were recorded in each group after one, two, and three months of intervention. At each time point the placebo group reported a shorter mean pain free walking time, and at two and three months the differences between the placebo and intervention groups on this measure were statistically significant (one month: MD 2.5, 95% CI ‐0.07 to 5.07, P = 0.06; two months: MD 4.00, 95% CI 1.31 to 6.69, P = 0.004; 3 months: MD 3.5, 95% CI 0.65 to 6.35, P = 0.02; Analysis 18.1), but none of these measures were adjusted for baseline scores.
For measures of pain on passive movement and pain on active movement, group means and mean changes from baseline were calculated from frequency tables reported in the paper (Badria 2002). No measures of data spread were reported and SDs could not be calculated from the data provided.
Persea gratissma and Glycine max (avocado‐soyabean unsaponifiables (ASUs)) versus placebo
The avocado‐soyabean unsaponifiable (ASU) product Piascledine® was investigated in six studies; in five studies ASU was compared with placebo (Appelboom 2001; Blotman 1997; Lequesne 2002; Maheu 1998; Maheu 2013) and in a sixth study ASU was tested head‐to‐head against a 1200 mg daily dose of chondroitin sulphate (Pavelka 2010). When compared against chondroitin sulphate, ASU was not inferior on any outcome (Analysis 21.1; Analysis 21.2; Analysis 21.3).
On the basis of two studies (Blotman 1997; Maheu 1998) the original review concluded that the evidence for ASU in the treatment of OA was convincing (Little 2000). A further study supported this conclusion (Appelboom 2001). Another study of Piascledine® over two years did not reveal any differences between groups, neither in the primary outcome measure of joint space width nor in clinical parameters including pain, function, and NSAID consumption (Lequesne 2002). A further study over three years (36 months) showed no differences between the ASU and placebo groups on any clinical or functional outcomes, but radiological assessment of joint space width revealed that 20% fewer participants in the ASU group showed progressive narrowing of joint space width (Maheu 2013).
Each of the five placebo‐controlled studies used a daily dose of 300 mg Piascledine®, and one study included an additional group that received 600 mg daily (Appelboom 2001). A total of 1008 participants with OA completed these trials. In one study a subgroup of patients with OA of the hip and of the knee were identified and analysed independently (Maheu 1998). Pooling of results for NSAID consumption measured as diclofenac equivalents, pain measured using a 100 mm VAS, and Lequesne functional index indicated that these studies were highly hetergeneous, returning an I2 of approximately 80% for the meta‐analysis of each of these outcome measures. Although the longer trials returned results that conflicted with the shorter trials, they were designed to investigate structural joint changes as the primary outcome and clinical outcomes were of secondary importance (Lequesne 2002; Maheu 2013). Lequesne and colleagues reported that they were surprised by the lack of symptomatic improvements among participants in the Piascledine® group and were unable to explain why this trial was markedly different to those of other well designed trials of Piascledine® in patients with OA (Lequesne 2002). Rather than present a single meta‐analysis, we subgrouped these studies according to the dose of Piascledine® and the length of the intervention period.
Pain
In two studies (326 participants) pain was measured on a 100 mm VAS after three months of 300 mg Piascledine® daily (Appelboom 2001; Blotman 1997). Using a random‐effects model the pooled results were a MD of ‐11.90 (95% CI ‐23.95 to 0.15; Analysis 19.1). Results after six months of treatment with 300 mg daily also favoured Piascledine® (MD ‐10.40, 95% CI ‐17.20 to ‐3.60) (Maheu 1998) but after 12 months the results indicated no superior performance compared with placebo (MD 1.00, 95% CI ‐6.58 to 8.58) (Lequesne 2002).
Results from the one study (156 participants) that included a 600 mg daily dose were consistent in favour of Piascledine® (MD ‐14.20, 95% CI ‐20.82 to ‐7.58; Analysis 20.1) (Appelboom 2001).
Results after 36 months of treatment were reported as changes from baseline rather than absolute scores (Maheu 2013). Because of the considerable difference in length of intervention, these results have not been meta‐analysed with the results from shorter duration studies. In this study of 399 participants there was no significant difference in pain reduction between the ASU and placebo groups (MD ‐0.66, 95% CI ‐7.39 to 6.07; Analysis 19.2).
Results also differed somewhat according to pain location. Maheu 1998 reported greater improvement amongst participants with OA of the hip (MD ‐13.80, 95% CI ‐25.22 to ‐2.38) compared with those with OA of the knee (MD ‐7.10, 95% CI ‐14.45 to 0.25; Analysis 19.3), but in both subgroup analyses the CIs overlapped the midline indicating inconclusive results.
Physical function
The Lequesne algofunctional index was used as a measure of overall physical function in all studies, but these data were extracted from three studies only (Appelboom 2001; Blotman 1997; Lequesne 2002) because the other studies also reported function using outcome measures prioritised over Lequesne by the Cochrane Musculoskeletal Review Group. Again, results differed according to the length of intervention. Results after three months of treatment with either 300 mg or 600 mg Piascledine® daily favoured use of this intervention for improvements in function (300 mg: MD ‐1.80, 95% CI ‐2.68 to ‐0.92; Analysis 19.6; 600 mg: MD ‐1.30, 95% CI ‐2.38 to ‐0.22; Analysis 20.2). After 12 months of treatment with the 300 mg dose the MD for function was 0.10 (95% CI ‐0.78 to 0.98; Analysis 19.6). In one study functional disability was also measured with a 100 mm VAS; participants taking 300 mg Piascledine® daily reported improvement compared with participants taking placebo after six months of treatment (MD ‐13.20, 95% CI ‐20.00 to ‐6.40; Analysis 19.4) (Maheu 1998). In another study the WOMAC functional scale was used as a key outcome after 36 months of treatment (Maheu 2013). Results in this study showed a MD of ‐1.00 (95% CI ‐7.14 to 5.14; Analysis 19.5).
For the four studies that measured function at the end of treatment ASU 300 mg improved function (SMD ‐0.42, 95% CI ‐0.73 to ‐0.11; I2 = 74%; Analysis 19.7). Re‐expressed, this translates to a mean reduction in functional disability of 7 mm (‐5 mm to ‐12 mm) on a 0 to 100 mm VAS disability scale (0 is best score). The high heterogeneity was accounted for by the result from Lequesne 2002, the 12 month study which showed no effect of ASU 300 mg compared with placebo.
Overall there was moderate evidence that three or six months of daily use of 300 mg of Piascledine® afforded statistically significant improvements in pain (100 mm VAS) and physical function (Lequesne algofunctional index) but these improvements did not persist in longer studies. Despite multiple studies with adequate sample sizes, the evidence was graded as moderate because allocation concealment was unreported (unclear) in each of the studies showing these improvements. In all other ways, these studies were well designed, and the consistent results across three studies were convincing.
Joint space width
Joint space width was reported in only two of the six studies of ASU (Lequesne 2002; Maheu 2013). In a study of 108 participants over 24 months between group differences were identified only when the participants were subgrouped into those with below median and above median joint space width (JSW) scores at baseline (Analysis 19.11). The below median JSW subgroup who consumed ASU showed significantly less reduction in joint space width (that is preservation of joint space) compared with participants who consumed placebo (MD ‐0.43, 95% CI ‐0.73 to ‐0.13), but changes in JSW from baseline were not significantly different between the placebo and intervention groups in the above median JSW subgroup (MD 0.16, 95% CI ‐0.31 to 0.63) (Lequesne 2002). After 36 months there was no significant difference in changes in JSW from baseline between the ASU and placebo groups (MD ‐0.03, 95% CI ‐0.22 to 0.16).
In the longest term study participants were identified as 'progressors' if they showed a JSW reduction of greater than or equal to 0.5 mm over three years (Maheu 2013). In the ASU group 40.4% of participants were identified as progressors compared with 50.3% of participants in the placebo group. These data were insufficiently reported for extraction and re‐analysis.
Adverse events
The number of participants who reported adverse events was reported per group in each study. In two studies more participants in the placebo groups reported adverse events (Blotman 1997; Lequesne 2002), and in the other two studies more participants in the 300 mg ASU groups reported adverse events (Appelboom 2001; Maheu 1998). When these data were meta‐analysed for the 300 mg dose of ASU there was a negligible difference in the odds of a participant in either the placebo or intervention group reporting an adverse event (ASU 267/521, placebo 270/529; RR 1.04, 95% CI 0.97 to 1.12; Analysis 19.8). These studies together constituted high level evidence that participants taking 300 mg of ASU daily experienced no greater odds of adverse events than did participants taking a placebo preparation.
Phellondendron amurense and Citrus sinensis (NP 06‐1)
The medicinal plant product NP 06‐1 is a mixture of Phellondenron amurense bark extract and Citrus sinensis peel extract. Oben 2009 and colleagues tested this product against placebo in a four group parallel study of 80 patients with OA of the knee over eight weeks. Two groups (one intervention and one control) included participants of normal body weight; the other two groups included overweight participants. Results in both the normal weight and overweight participants favoured NP 06‐1 over placebo for improvement of knee function as measured using the Lequesne algofunctional index (MD ‐3.82, 95% CI ‐7.05 to ‐0.59; Analysis 22.1). NP 06‐1 contains berberine, which may have contributed to weight loss in the overweight participants.
Uncaria guianensis and Lepidium meyenii (Reparagen®)
Reparagen® is a mixture of aqueous bark extracts of Uncaria guianensis and Lepidium meyenii. It was tested against glucosamine sulphate in a two group parallel trial in 95 patients with OA of the knee (Mehta 2007). Results from this trial suggested that Reparagen® was not significantly different from glucosamine sulphate for the remediation of OA pain. These results were insufficiently reported to allow data extraction for re‐analysis. The adverse event profile of Reparagen® appeared favourable (Analysis 23.1).
Zingiber officinale and Alpinia galanga
A standardised extract (EV.EXT 77) of ginger (Zingiber officinale) and galangal (Alpina officinale, also known as Thai ginger) was compared with placebo in 261 people with OA of the knee (Altman 2001). Significant improvements in favour of ginger were reported for pain (100 mm VAS) after walking 50 feet (MD ‐9.60, 95% CI ‐16.81 to ‐2.39, P = 0.009; Analysis 24.1). Also, improvements in all components of the WOMAC score were reported in favour of the ginger group over placebo. These improvements were statistically significant for the WOMAC stiffness score and the WOMAC total score but not for the pain and function domains of the WOMAC that were considered in this review.
Medicinal products from three or more plants
Korean herbal mixture: SKI306X®
Two studies compared the Korean herbal preparation SKI306X® to placebo (Jung 2001) or diclofenac controls (Jung 2004). The earlier study (139 participants) was undertaken to determine the dose and safety profile of the intervention. The latter study (249 participants) was conducted to determine clinical efficacy. In the earlier study, daily doses of 200 mg, 400 mg, and 600 mg were compared with placebo and outcomes measured using a pain VAS and Lesquesne index. Meta‐analyses of these results (pooling doses) demonstrated consistent effects in favour of SKI306X® for reducing pain (MD ‐17.36, 95% CI ‐22.57 to ‐12.15; Analysis 25.1) and improving physical function (MD ‐2.73, 95% CI ‐3.71 to ‐1.74; Analysis 25.2). Effect sizes for these outcomes did not show a consistent linear relationship to dose. There was moderate evidence that, regardless of dose (600 mg, 1200 mg, 1800 mg), four weeks daily use of SKI306X® produced statistically significant improvements in the pain VAS and Lequesne algofunctional index compared to placebo.
The number of participants who reported adverse events was reported per group, and more participants receiving 400 mg SKI306X® reported adverse events than did participants in any other group. When each of the intervention subgroups was compared with the placebo group the risk ratios (RR) differed between comparisons, but for each subgroup the risk of participants reporting adverse events was not clearly greater in the placebo or intervention groups. When these data were meta‐analysed, there was negligible difference in the risk of a participant in either the placebo or SKI306X group reporting an adverse event (overall SKI306X 14/70, placebo 15/69; RR 0.93, 95% CI 0.49 to 1.79; Analysis 25.3).
In a follow‐up study, a daily dose of 600 mg SKI306X® was compared with 100 mg diclofenac. Results favoured diclofenac for the same outcome measures of 100 mm VAS for pain (MD 1.31, 95% CI ‐2.78 to 5.40; Analysis 26.1) and Lequesne's algofunctional index (MD 0.77, 95% CI 0.10 to 1.44; Analysis 26.2). Statistically significant changes in these measures were seen within both groups over time. Between‐group differences in physical function were statistically significant (P = 0.02) but differences in self‐reported pain were not (P = 0.53). This study constituted moderate evidence that daily use of 600 mg of SKI306X over four weeks produced improvements in pain (100 mm VAS) that were not statistically significantly different from 100 mg diclofenac. When compared against diclofenac, 600 mg SKI306X appeared to have a favourable adverse event risk profile (SKI306X 22/125, diclofenac 36/124; RR 0.61, 95% CI 0.38 to 0.97; Analysis 26.3).
Phytodolor®N
Three studies compared Phytodolor®N (prepared from ash bark, aspen leaf, aspen bark, golden rod herb; for details see table) to placebo or active control (piroxicam) in 176 participants and reported results in favour of Phytodolor®N for reduced use of NSAIDs (diclofenac) and improvement in range of motion as measured by finger to ground distance in lumbar flexion (Bernhardt 1991; Huber 1991; Schadler 1988). Finger to ground distance is one of the methods used to quantify the Schober test (lumbar spine flexion in standing) and is a measure of physical function that is more commonly used in the assessment of people with low back pain than with OA. It is probably a meaningful measure of physical function in participants with OA of the lumbar spine but none of these studies were limited to participants with spinal OA.
These studies could be viewed with some skepticism because they were undertaken by the manufacturer (Steigerwald Pharmaceuticals). One of these studies was a crossover design with intervention periods of seven days duration and used a dose of Phytodolor®N 33% greater than that used in the two other studies (Schadler 1988). The other two studies were of parallel design, one of three weeks intervention with measures at weekly intervals (Huber 1991) and the other of four weeks intervention with measures at baseline and weeks one, two, and four (Bernhardt 1991). Because doses of Phytodolor®N and some of the measures differed among trials, and because most of the data from these studies were reported as composite statistics (Chi2, P values), data could not be pooled for meta‐analyses. In this review all available mean data were reported for descriptive comparison (Analysis 27.1; Analysis 27.2; Analysis 27.3). For one study, group means and mean changes from baseline were calculated from frequency tables reported in the paper (Bernhardt 1991). SDs could not be calculated from the data provided.
Reumalex®
A self‐prescribed dose ("2 tablets at a time") of the herbal mixture Reumalex® was compared with placebo over two months of treatment. Both patients with rheumatoid arthritis and OA were recruited for this study. Separate data for the OA subgroup were provided for the primary outcomes of the AIMS 2 pain score and modified Ritchie index (Mills 1996). At the end of the treatment period the mean reduction in AIMS 2 pain score was greater in the Reumalex® group (MD ‐0.89, 95% CI ‐1.73 to ‐0.05; Analysis 28.1).
Four participants withdrew from each of the placebo and intervention groups due to side effects, and a further five (Reumalex® n = 2, placebo n = 3) complained of exacerbation of symptoms, but it was unclear how many of these participants were people with OA (RR 1.08, 95% CI 0.40 to 2.91; Analysis 28.2).
Chinese herbal mixture: Duhuo Jisheng Wan
The Chinese herbal mixture Duhuo Jisheng Wan (DJW) was tested in a head‐to‐head comparison against diclofenac sodium over four weeks intervention (following one week run‐in) in patients with unilateral or bilateral OA of the knee (Teekachunhatean 2004). Pain and stiffness across a range of conditions were measured using a battery of VAS. The Lequesne algofunctional index was used to capture joint function data. DJW appeared to be as effective as diclofenac in reducing joint pain (Analysis 29.1) and improving function (Analysis 29.2). Unfortunately, the risk of adverse events associated with DJW were also comparable to diclofenac (DJW 28/100, diclofenac 27/100; RR 1.04, 95% CI 0.66 to 1.63; Analysis 29.3). This toxicity profile, combined with the fact that DJW was administered as an 18 capsule per day dose, meant that it was unlikely to gain credence as a viable alternative to NSAIDs.
Chinese herbal mixture: blood‐nourishing, hard‐softening
The Chinese mixture for blood‐nourishing and hard‐softening (BNHS) is an extract from the root of Paeoniae alba, Gentiana macrophylla, and Glycyrrhiza (species not stated, possibly uralensis). This product was tested against two active controls (western medicine control: glucosamine sulphate, Chinese medicine control: counter osteophyte herbal mixture) although the activity of the controls was not demonstrated in the paper and may be questionable. Although Cao and colleagues reported this investigation as one study it was really two distinct clinical trials run simultaneously over four weeks in different hospitals (Cao 2005). Sixty participants (30 at each site) were randomised to receive BNHS capsules and 30 participants were randomised to receive one of the two active control drugs. Data from the two trials were presented independently.
When compared with glucosamine sulphate, BNHS capsules produced slightly superior improvements in VAS measures of pain on walking (MD ‐2.00, 95% CI ‐6.81 to 2.81; Analysis 31.1) but no mean improvements in WOMAC function (MD 0.00, 95% CI ‐2.53 to 2.53; Analysis 31.2). No adverse events were reported in this trial.
In comparison with the alternate Chinese herbal mixture counter osteophytes, BNHS capsules produced a slight mean increase in pain on walking (MD 2.00, 95% CI ‐7.12 to 11.12; Analysis 30.1) and slight improvement in physical function (MD ‐2.00, 95% CI ‐7.57 to 3.57; Analysis 30.2). Four participants in this trial reported adverse events with use of BNHS. No participants reported adverse events associated with use of the alternative Chinese mixture. Because the sample size was small, and all adverse events occurred in one group, the risk of adverse events associated with BNHS appeared considerable in this trial (RNHS 4/30, Chinese control 0/30; RR 9.00, 95% CI 0.51 to 160.17; Analysis 30.3) but this result may be viewed with some skepticism considering that no participants in the other trial reported any adverse events with BNHS capsule use.
Ayurvedic formulae
Three studies investigated seven Ayurvedic formulae. Two studies investigated formulae available as proprietary products: Antarth® (Gupta 2011) and RA‐II® (Chopra 2004). The third study compared five Ayurvedic formulae formed from combinations of five plant extracts (Chopra 2011) (for details see table). Because none of the Ayurvedic formulae were the same these studies were not suitable for pooling and are described independently.
Ayurvedic formulae: A, B, C, D and E
Five Ayurvedic formulae formed from five herbal ingredients in varying combinations were tested against each other and against placebo in a six group trial over 16 weeks in 245 patients with OA of the knee (Chopra 2011). Pain was measured on a 0 to 10 VAS and physical function was measured using the Indian version of the WOMAC 0 to 4. Results of this exploratory study were not reported in full detail to allow extraction and re‐analysis. Generally results were equivocal on most outcomes. This study may have been underpowered to detect changes in a six group comparison (35 participants per group). The adverse event profile was noteworthy: participants who received formula D showed markedly greater odds of reporting adverse events (Analysis 32.1).
Ayurvedic formula: Antarth
Antarth was compared against placebo in a two group parallel trial over 12 weeks in 90 patients with OA of the knee (Gupta 2011). Pain was measured on a 0 to 10 cm VAS, which we converted to a 0 to 100 mm scale during data extraction. Results slightly favoured Antarth over placebo for the reduction of pain in OA (Analysis 33.1) but should be interpreted with caution because this exploratory study may have been underpowdered to detect clinical effects of Antarth.
Ayurvedic formula: RA‐11
RA‐11 was tested against placebo in a two group parallel trial over 32 weeks in 90 people with OA of the knee (Chopra 2004). Pain, stiffness, and physical function were measured using the Indian modification of the WOMAC 0 to 4. Because the study was fully powered, with 45 participants in each group, and rescue medication was not permitted this study was well designed to capture data on the pain reducing effects of RA‐11. An ITT model was applied to the analyses and missing data were replaced by the last observation carried forward method. Three participants were removed from the trial by the investigators due to "efficacy failure". Forcibly withdrawing participants with worsening pain and carrying forward data from the last observation of these participants may have somewhat exaggerated the effects of of RA‐11 on pain. Results favoured RA‐11 over placebo for improvements in pain (Analysis 34.1) and function (Analysis 34.2).
Ayurvedic formulae: SGC and SGCG
Ayurvedic formulae SGC and SGCG were tested against glucosamine sulphate and celecoxib in a four parallel group trial over 24 weeks (Chopra 2013). On measures of pain (VAS 0 to 100), function (WOMAC function), and with regard to participants reporting adverse events, both Auryvedic formulae were comparable to both glucosamine sulphate and celecoxib.
Japanese herbal mixture: Boiogito
The Japanese herbal mixture Boiogito was compared head‐to‐head with loxoprofen for the management of knee pain and effusion in a small (n = 50) exploratory study over 12 weeks. Participants who took Boiogito reported slightly better Knee Society Rating System knee scores, including less joint effusion, than participants who took loxoprofen, but the results did not differ significantly between groups (MD ‐1.30, 95% CI ‐8.90 to 6.30; Analysis 39.1). On the other hand participants who took loxoprofen reported slightly greater functional capacity on the stair climbing component of the Knee Society Rating System (MD 3.60, 95% CI 0.51 to 6.69; Analysis 39.2) and no adverse events. One participant using Boiogito reported an adverse event (Boiogito 1/24, loxoprofen 0/23; RR 2.88, 95% CI 0.12 to 67.29; Analysis 39.3).
Discussion
Summary of main results
Thirty‐one medicinal plant products from single plant parts (Boswellia serrata, Curcuma domestica Derris scandens, Garcinia kola, Harpagophytum procumbens, Petiveria alliacea, Pinus pinaster, Rosa canina lito, Salix pupurea+daphnoides, Uncaria guianensis, Vitellaria paradoxa and Zingiber officinale); five mixtures of two herbal preparations (Boswellia carteri and Curcuma longa, Persea gratissma and Glycine max, Phellondenron amurense and Citrus sinensis, Uncaria guianensis andLepidium meyenii, and Zingiber officinalis and Alpinia galanga) and the polyherbal preparations Phytodolor®N, Reumalex®, SKI306X®, Chinese herbal mixtures Duhuo Jisheng Wan and blood‐nourishing, hard‐softening, Ayurvedic formulae RA‐11, A, B, C, D, E, and Antarth, and Japanese herbal mixture Boiogito were compared in 47 studies against placebo (n = 38), active control (n = 19), and no intervention (n = 1). Due to the differing study protocols (different outcome measures and times of outcome assessments) and medicinal plant products employed, pooling of data was only possible for the proprietary products avocado‐soybean unsaponifiables (ASU) and Boswellia serrata.
Despite the great number of clinical trials carried out, reliable data could only be achieved for the ASU product Piascledine®. The pooled data of three studies with a confirmatory study design showed OA improvements, but another definitive study over two years failed to demonstrate effectiveness except in a subgroup of people with less severe complaints. The most recent comparison of Piascledine® and chondroitin sulphate showed that the ASU product was not inferior to the slow‐acting anti‐arthritic substance for which effectiveness within six months is controversial (Lee 2010; Reichenbach 2007; Wandel 2010). Also, the most recent placebo‐controlled study lasting three years failed to show any benefit for ASU in clinical outcome measures including the WOMAC index. The study was planned to confirm slower radiographic progression in symptomatic hip OA (Maheu 2013) but only 20% fewer progressors were identified in the post hoc analysis, with progressors defined as patients with joint width space loss > ‐0.5 mm.
Of the five studies that investigated three different extracts from Boswellia serrata gum resin, pooled data from two studies indicated OA improvement for the Boswellia product 5‐Loxin®. The remaining 38 studies showed unproven benefit in the alleviation of OA for the herbal medicinal products investigated, which originated from Africa, Asia, Europe, India, and the Americas. Serious adverse events were not reported for any of the medicinal plant products.
Overall completeness and applicability of evidence
Evidence from studies that recruited patients with diagnoses of OA confirmed according to ACR or EULAR criteria may be directly applied to clinical practice. In some studies diagnostic criteria applied at recruitment were not labelled as ACR or EULAR criteria but were described in sufficient detail to be confident that they were fully consistent with the recommendations of these authorities. In six studies, however, ACR and EULAR criteria were not fully considered and these studies have been downgraded to unclear risk of selection bias (Huber 1991; Jung 2001; Majima 2012; Medhi 2009; Schadler 1988; Warholm 2003). The applicability of evidence from these studies to clinical practice is also unclear. In another five studies selection was so broad as to almost certainly have included recruitment of participants with conditions other than OA (Badria 2002; Bernhardt 1991; Ferraz 1991; Kimmatkar 2003; Schmelz 1997). These studies are classified as having high risk of bias and evidence from these studies may be of questionable use in clinical practice.
The WHO recommends that the manufacturing procedure of medicinal plant products should be described in detail (for example if other substances are added during manufacture in order to adjust the plant preparation to a certain level of active or characteristic constituents or for any other purpose). A method for identification and, where possible, assay of the plant preparation should be added. If identification of the active principle is not possible it should be sufficient to identify a characteristic ingredient or mixture of ingredients (for example the 'chromatographic fingerprint') to ensure consistent quality of the preparation in order to be able to re‐do the study with an essentially similar product (having a comparable active principle, see below).
The active principle of a medicinal plant product is the sum of all ingredients that produce the medicinal action. The active principle has not been fully been identified for any of the anti‐inflammatory acting herbal medicinal products. Co‐active ingredients include flavonoids (Acacia catechu, Citrus sinensis, Curcuma species,Derris scandens, Garcinia kola,Harpagophytum procumbens, Petiveria alliacea, Phytodolor®N, Rosa canina, Salix species, Scutellaria baicalensis,Zingiber species), unsaturated fatty acids (Piascledine®, Ricinus officinalis, Rosa canina, SKI306X®, Vitellaria paradoxa), alkaloids (Acacia catechu (tryptamine derivatives), Garcinia kola,Lepidium meyenii (lepidiline), Phellondenron amurense (berberine), Symphytum officinale, Uncaria species) and in particular polyphenols (Acacia catechu, Citrus sinensis,Pines pinaster,Rosa canina), iridoid glycosides calculated as harpagoside (Harpagophytum procumbens), gingerols (Zingiber species), boswellic acids (Boswellia species), curcurminoids (Curcuma longa), or mustard glycosides (Lepidium meyenii). Mixtures of two or more herbal preparations form a new entity with their characteristic active principle being different from that of the single medicinal plant products, as are the actions and adverse events. If herbal extracts are combined the superiority of the mixture over the individual herbal preparation has to be established in vitro, in animal experiments, and in human pharmacological studies in order to demonstrate the superior effect and the safety.
The minimum information given for a medicinal plant product in an article should include the plant part, the brand name (if the preparation has not been solely prepared for the study), the excipient added in the case of extracts and the drug extract ratio if no crude plant material is used. The daily dosage of the 'native' plant preparation should be stated otherwise the extract dose may also contain additives (Chrubasik 1996). Although not requested by regulatory authorities, it is desirable to know the content of at least one characteristic marker substance (if possibly a co‐active ingredient). Only few studies provided all this information (Table 1). The results of studies with insufficient declared characteristics are only attributable to the particular product used in the study and cannot be transferred to other medicinal products from this plant material unless bioequivalence of the products has been demonstrated (Chrubasik 2003).
Salicin, the characteristic ingredient of Salix species, is an ineffective pro‐drug. However, during absorption salicin is metabolized into co‐active salicylic acid derivatives. Surprisingly, the amount of salicylic acid produced from a daily dose of Salix bark extract containing 240 mg of salicin corresponds to an aspirin dose of only 100 mg, a cardioprotective rather than an anti‐inflammatory dose (Schmid 2000). This Salix extract dose, however, cannot be used to replace aspirin as a blood thinner because it has been shown not to have a major impact on blood clotting (Krivoy 2001). It is implausible that the regulatory authority EMA has restricted the use of willow bark preparations to four weeks (Vlachojannis 2013) in light of the fact that NSAIDs in current use, with a higher risk benefit ratio than willow extract, are used for longer treatment durations, for example up to 138 weeks (Reginister 2007). Acute toxicity studies in rats could not determine a lethal dose of willow bark extract even in doses 200 times the experimental level (Glinko 1998). Data on chronic toxicity are still lacking (EMA 2009; ESCOP 2003;). Possible interactions with natural or synthetic blood thinners need to be elucidated, especially if higher doses of willow bark extract (with 360 mg or 480 mg salicin per day) are employed. A life‐threatening anaphylactic reaction was observed in a patient with a history of allergy to salicylates (Boullata 2003). Known salicylate allergy is therefore a contra‐indication for the use of willow bark preparations.
The clinical studies investigating medicinal products from Harpagophytum procumbens included a cryoground powder, an aqueous and an ethanolic extract. The extracts contained only half the amount of harpagoside in the daily dosage than what would be expected after complete extraction and if no additives were added. The ethanolic extracts were incompletely extracted (Sporer 1999) and the aqueous extract contained additives (Chrubasik 1996). According to the European Pharmacopoeia it is required that the starting material for Harpagophytum products contains a minimum of 1.2% of harpagoside. Since the daily dose of extracts should be prepared from 4.5 to 9 g of crude plant material, the daily dosage would provide 50 to 100 mg of harpagoside or more (European Medicines Agency (EMA) monographs). Thus, of the four studies investigating Harpagophytum products only one has used an appropriate dose.
In general, the daily dosages of medicinal products are based on information from monographs or textbooks and are not the result of dose‐finding studies. It seems likely that an increase in dose might improve the clinical effect. This was shown for aqueous Harpagophytum and ethanolic Salix extracts in a patient population suffering from acute exacerbations of chronic low back pain (Chrubasik 1999; Chrubasik 2000). However, for some medicinal products a ceiling effect was demonstrated. For example, a 600 mg dose of Piascledine® per day was not more effective than a half dose (Appelboom 2001), and 600 mg or 400 mg of the herbal mixture SKI306X® was not more effective than 200 mg per day (Jung 2001), or 250 mg of the proprietary Boswellia serrata extract 5‐Loxin® was not more effective than 100 mg per day (Sengupta 2010). The first medical report on the use of dried and powdered willow bark dates back to 1763 (Stone 1763). The empirically chosen daily dose (up to 24 g) might have contained up to 1000 mg of salicin as the crude plant material generally contains about 4% salicin. Higher doses than that used in the study by Biegert 2004 may reliably improve OA complaints. Future studies are required to identify the optimum daily doses of medicinal products.
Unsaturated fatty acids contribute to the anti‐inflammatory effect of some medicinal plant products (Appelboom 2001; Blotman 1997; Cameron 2011; Jäger 2007; Jäger 2008; Wenzig 2008). It seems likely that castor seed oil may improve OA complaints. Because a dose‐finding study has not been undertaken, and high doses of castor oil produce unpleasant laxative effects, we question whether higher doses of castor oil are likely to be tolerated by people with OA.
The net benefit of an intervention may be defined as the magnitude of benefit minus the magnitude of harm (ICH 2004). Benefit and harm are not always measurable in standardised effect size units, complicating the calculation of net effect. However, the point remains that for each of the herbal medicines where clinical benefit is reported, clinical harm (adverse events, toxicity) must be considered in making an overall judgement of the usefulness of the intervention. Among the non‐herbal medications commonly used to treat OA, NSAIDs in particular are associated with frequent and sometimes severe side effects (Gabriel 1991), particularly gastrointestinal complications including dyspepsia, perforations, ulcers, and bleeds (Ofman 2002; Ofman 2003), which add considerable cost to the usual care of people with OA (Smalley 1996). In theory, ginger and Curcuma products might go along with an increased risk of stomach bleeding, however this has not been sufficiently evaluated (www.ema.europa.eu/docs/en_GB/document_library/Herbal_‐_Community_herbal_monograph/2011/09/WC500112680.pdf'; www.ema.europa.eu/docs/en_GB/document_library/Herbal_‐_Community_herbal_monograph/2010/02/WC500070703.pdf). In fact, no serious adverse events were reported with any herbal intervention in the included studies. It appears that the benefit risk ratio of medicinal plant products is superior to that of NSAIDs. A recent pharmacovigilance analysis revealed 117 reported adverse events, mostly cutaneous, hepatic and gastrointestinal disorders, associated with the intake of Piascledine®. Although the incidence of adverse events seems to be 'very rare', in light of the fact that the product is widely prescribed in France there is concern regarding possible under‐reporting of adverse events (Olivier 2010) (www.drugcite.com/?q=PIASCLEDINE&s=&a=).
A systematic review of adverse events is available for Harpagophytum procumbens that includes 28 clinical studies (mostly observational) reporting on 6892 patients who consumed Harpagophytum extract for up to one year. In none of the double blind studies was the incidence of adverse events higher during treatment with Harpagophytum than during placebo treatment. Minor adverse events (AE) were described across 20 studies in 138 of 4274 Harpagophytum consumers. This corresponds to an overall adverse event rate of around 3% for Harpagophytum preparations with a maximum of 100 mg harpagoside as the daily dosage (Vlachojannis 2008). Some of the adverse events, particularly minor gastrointestinal complaints and allergies, were probably related to Harpagophytum. Three studies on preclinical toxicity indicated very low acute toxicity (ESCOP 2003). Data on chronic toxicity, including mutagenicity, carcinogenicity, teratogenicity, and embryogenicity, were not found (ESCOP 2003). For most medicinal plant products preclinical data are not available, and only some of them report on their AE profiles (Basch 2004; Chrubasik 2005; ESCOP 2003; ESCOP 2009; Krishnaraju 2010; Schoonees 2012; Stohs 2011; Valerio 2005; www.herbal‐ahp.org, http://apps.who.int/medicinedocs/en/d/Js2200e/). It is thus recommended to do safety pharmacological studies according to published guidelines (www.fda.gov/cder/guidance/index.htm, www.emea.europa.eu/pdfs/human/ich/030095en.pdf) for the individual medicinal plant products. If a carcinogenic effect is assumed, carcinogenicity studies are also mandatory (www.ich.org/LOB/media/MEDIA489.pdf). If the guidelines of good manufacturing practice including those for the starting material (www.api‐conference.org/pa4.cgi?src=eca_news_data.htm&nr=488&show=daten/news/GMP_News_488.htm&id=S11510781142) are considered, contamination of medicinal products with other herbal medicines, pesticides, heavy metals, or drugs can be ruled out.
The adverse effect quota and profile for Phytodolor®N appear to be better than for NSAIDs. Gastrointestinal complaints were most frequently reported (2.6%), and occasionally allergic skin reactions have occurred. Some adverse effects are partly due to the alcohol content of Phytodolor®N (45.6% vol, 0.7 g per 40 drops), which poses a health risk to children and to adults with liver disease, alcoholism, epilepsy, or brain damage. Caution is advised during pregnancy or lactation and for drivers and individuals who operate machines, even though no impairment of consciousness or reactivity is expected to occur with 0.7 g of alcohol per dose. Studies on mutagenicity, teratogenicity, and toxicity in the parent animals and their progeny gave no evidence for any toxic effects arising from the intake of the combination during pregnancy and the lactation period (Gundermann 2001).
Quality of the evidence
Generally the studies included in this review are of lower quality than desired, but we stress that these studies represent the current best quality evidence for the effectiveness of oral medicinal plant interventions in the treatment of OA. Poorer quality studies with non‐randomised, uncontrolled designs were excluded (for example Guyader 1984; Myers 2010; Rosen 2013). We excluded clinical trials of products that are not strictly herbal so as to avoid misinterpretation of the results of these studies in herbal medicine practice (for example Belcaro 2010; Jacquet 2009; Kulkarni 1991; Levy 2009). We note that more recent studies typically have higher quality reporting than older studies, and commend researchers in this field for the improvement of research design and reporting.
There is moderate‐quality evidence that in people with OA, Boswellia serrata slightly improved pain and function. The evidence was downgraded to moderate as there is a potential for imprecision due to the small number of participants contributing to these outcomes. There is moderate‐quality evidence that avocado‐soybean unsaponifiables (ASU) probably improved pain and function slightly but may not preserve joint space. Evidence was downgraded due to inconsistency across results, or imprecision. Further research may change our estimates of the size of effects, and the precision around estimates.
We are uncertain whether other oral herbal products improve OA pain or function, or slow progression of joint structure damage because the evidence available is limited to single studies only, or studies providing data that cannot be pooled. Some of these studies are of low to very low quality, and some important outcome measures (eg: quality of life, joint space width) were omitted.
Potential biases in the review process
Incomplete reporting in some studies may have led us to undervalue the evidence of effectiveness, because we made strict judgements of methodological quality on the basis of reporting. On the other hand, incomplete reporting may be indicative of bias in studies such that incompletely reported trials may overestimate the treatment effects, thus we stand by our strict, conservative judgements (Higgins 2011). For example, in countries in which the ICH guidelines are implemented in law, Human Research Ethics Committees would approve a clinical trial protocol only if it accords with the ICH good clinical practice consolidated guidelines (ICH 2004). Randomisation, blinding, masking of outcome assessment, and allocation concealment will probably have been adequately conducted even if the study was simply reported as "randomised and double‐blind". To allow full and accurate assessment of future studies, we recommend that authors conform to the Consolidated Standards of Reporting Trials (CONSORT) (Begg 1996; Moher 2001).
Studies fail for a variety of reasons and, although venturing into conjecture, we consider that groups may have differed at baseline according to some parameters that were not measured, but may have influenced the primary outcome measures. For example, baseline data in the Lequesne 2002 study did not include details of the quantity of NSAIDs consumed or use of opioids for pain. Neither was anything reported about the mood state of the participants, which may also have influenced pain measures. Joint space loss was significantly reduced in patients with mild OA possibly indicating that early use of ASU may act preventively, but this suggestion needs to be confirmed in a follow‐up study. Concerns regarding baseline differences between groups are amplified for studies with inadequate or unclear methods of randomisation and allocation concealment.
Many studies, although well designed, were probably underpowered and the lack of evidence of effect may be due to Type II error. Trends to effectiveness may be suggested from underpowered studies if improvements can be calculated and reported as effect sizes.
Glucosamine sulphate and chondroitin sulphate were used as active controls in some studies (Cao 2005; Chopra 2013; Mehta 2007; Pavelka 2010) but we question this assumption. Several recent systematic reviews suggest that chondroitin sulphate has negligible effect on OA pain (Reichenbach 2007; Wandel 2010) and a small but significant protective effect against joint space narrowing (Lee 2010). Glucosamine sulphate does not act on pain pathways or mediators. Glucosamine is an amino acid that may enhance cartilage repair and, due to this reparative process, pain may reduce in people with OA but typically these changes take six to 12 weeks to occur and effect sizes are not large (Lee 2010; Reichenbach 2007). In a meta‐analysis of 10 large randomised controlled trials of glucosamine, chondroitin, or the two in combination on joint pain and on radiological progression of disease in OA of the hip or knee Wandel and colleagues determined that glucosamine use produced a mean reduction in pain of 4 mm on a 100 mm VAS, an effect that did not exceed a minimum clinically important difference (Wandel 2010).
We attempted to minimise bias in this review through transparent and thorough methods. We adopted a broad search strategy without language restrictions. We attempted to include grey literature by seeking manufacturers' reports, theses and unpublished reports as well as searching electronic databases. We removed duplicate publications from our analysis and reported fully our reasons for excluding or not assessing any trials. We conducted independent data extraction, in duplicate, of all included studies. Despite these strategies the review may be subject to some bias, particularly our personal biases due to our clinical practice experiences in arthritis care (MC) and herbal medicine (SC).
Agreements and disagreements with other studies or reviews
This review is the update of a Cochrane review (Little 2000), which we divided into two parts. For completeness, the updated review of topical herbal medicines for the treatment of OA (Cameron 2013) should be read in conjunction with this updated review.
The results of this review are largely consistent with the findings of earlier reviews that included meta‐analyses of trials of ASU (Cameron 2007; Cameron 2009; Christensen 2008a; Little 2000), which showed that this combination of two herbs shows benefits for OA pain and function in the short term. The addition of larger and longer term studies to these meta‐analyses suggests that the effects of ASU on pain and function are not sustained over longer periods of two to three years, and that the effects of ASU on joint structure are small at best (Lequesne 2002; Maheu 2013).
In people with low back pain the ethanolic Salix bark extract in two doses demonstrated a dose‐dependent effect superior to placebo (Chrubasik 2000), and was not inferior to the synthetic rofecoxib (Chrubasik 2001). In one of the two studies included in this review, a comparable dose of Salix extract failed to produce a significant effect in patients with OA, while the control group responded favourably to treatment with diclofenac (Biegert 2004). It may well be that a higher Salix extract dose might have relieved OA patients' pain; empirically, higher willow bark extract doses have been used for the treatment of pain since the middle ages (Vlachojannis 2009).
This review is also largely consistent with a previous systematic review and meta‐analysis of randomised controlled trials of Rosa canina for OA (Christensen 2008b). The same three studies are included in both reviews. Unlike Christensen and colleagues we did not pool pain scores for meta‐analysis because different outcome measures were used across two of the three trials (Rein 2004a; Winther 2005), and in the third study pain data were reported insufficiently for data extraction and re‐analysis (Warholm 2003). We concur with Christensen and colleagues that Rosa canina probably reduces pain in OA but we recommend that this purported effect be thoroughly tested in a sufficiently powered randomised controlled trial using standardised outcome measures.
This review differs somewhat from an earlier Cochrane review exclusively on pine bark extract (Schoonees 2012). We identified and included the studies from the Schoonees and colleagues' review but we have reported data from these studies independently rather than pooling them for meta‐analysis because different outcome measures (WOMAC‐VAS (Farid 2007) and WOMAC 0 to 4 (Cisar 2008)) were used across the studies, and data in one study were reported graphically (Cisar 2008), insufficient to allow extraction for re‐analysis.
This review is compromised by many poorly designed clinical trials that were underpowered and inadequately blinded. Herbal medicine is not a field known for the widespread adoption of evidence‐based practice, however, in light of the low quality body of evidence in oral herbal treatment for OA, practitioners might continue to ignore the research and do what they 'have always done'. Even small effect sizes may represent clinically meaningful improvements, particularly if these small effects represent improvements in a common condition with a substantial population burden of disease (for example OA). In light of the fact that serious adverse events related to any of the medicinal plant products were not observed, physicians and patients should not be discouraged in using herbal medicines at all. In this section, therefore, we have chosen to address some of the common biases in herbal medicine as well as in this review.
Risk of bias summary: review authors' judgements about each risk of bias item for each included study.

Comparison 1 Boswellia serrata 999 mg versus placebo, Outcome 1 Pain (0 to 3).

Comparison 1 Boswellia serrata 999 mg versus placebo, Outcome 2 Function: loss of function (0 to 3).

Comparison 1 Boswellia serrata 999 mg versus placebo, Outcome 3 Participants (n) reported adverse effects.

Comparison 2 Boswellia serrata (enriched) 100 mg versus placebo, Outcome 1 Pain VAS 0‐100 at 90 days.

Comparison 2 Boswellia serrata (enriched) 100 mg versus placebo, Outcome 2 WOMAC‐VAS (Function).

Comparison 2 Boswellia serrata (enriched) 100 mg versus placebo, Outcome 3 Adverse event episodes (n) reported.
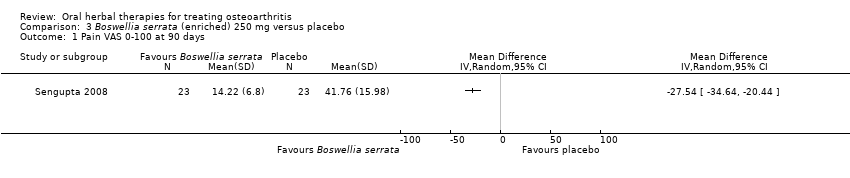
Comparison 3 Boswellia serrata (enriched) 250 mg versus placebo, Outcome 1 Pain VAS 0‐100 at 90 days.
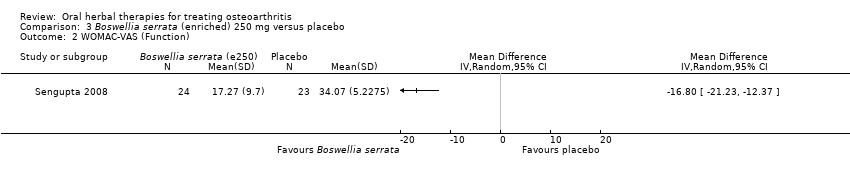
Comparison 3 Boswellia serrata (enriched) 250 mg versus placebo, Outcome 2 WOMAC‐VAS (Function).
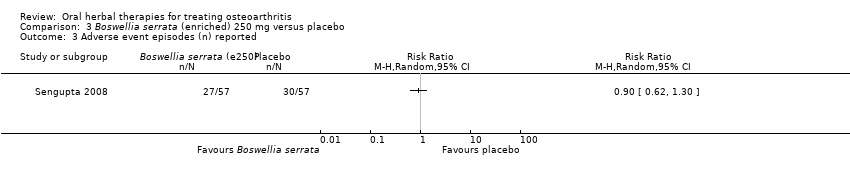
Comparison 3 Boswellia serrata (enriched) 250 mg versus placebo, Outcome 3 Adverse event episodes (n) reported.

Comparison 4 Boswellia serrata (enriched) 100 mg plus non‐volatile oil versus placebo, Outcome 1 Pain VAS 0‐100.
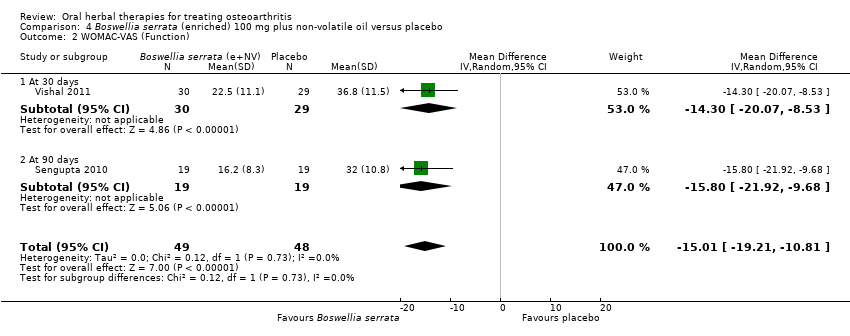
Comparison 4 Boswellia serrata (enriched) 100 mg plus non‐volatile oil versus placebo, Outcome 2 WOMAC‐VAS (Function).
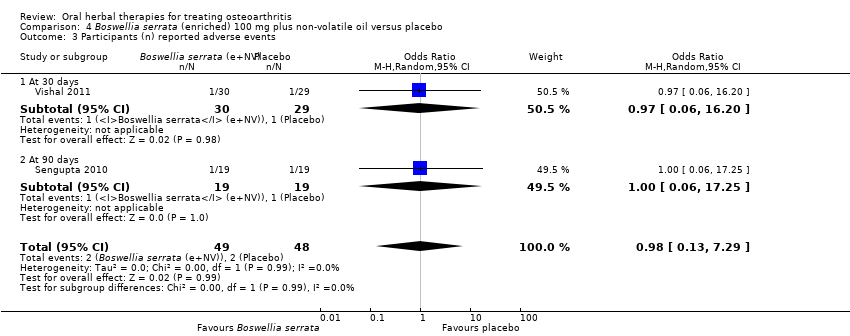
Comparison 4 Boswellia serrata (enriched) 100 mg plus non‐volatile oil versus placebo, Outcome 3 Participants (n) reported adverse events.
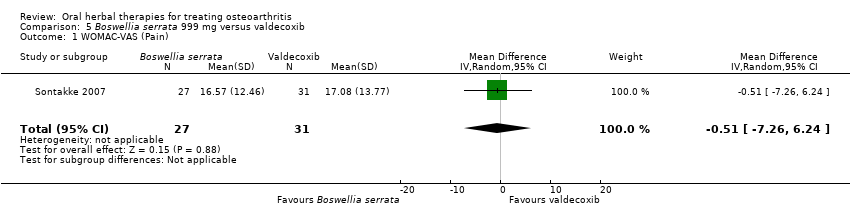
Comparison 5 Boswellia serrata 999 mg versus valdecoxib, Outcome 1 WOMAC‐VAS (Pain).
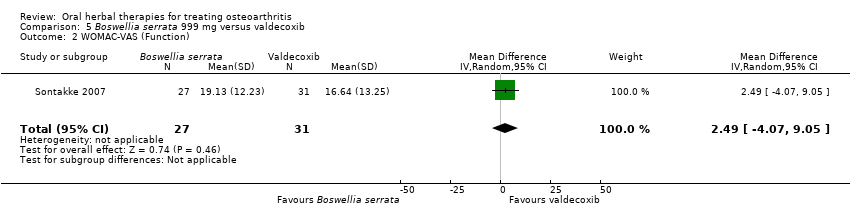
Comparison 5 Boswellia serrata 999 mg versus valdecoxib, Outcome 2 WOMAC‐VAS (Function).

Comparison 5 Boswellia serrata 999 mg versus valdecoxib, Outcome 3 Participants (n) reported adverse events.

Comparison 5 Boswellia serrata 999 mg versus valdecoxib, Outcome 4 Participants (n) withdrew due to adverse events.

Comparison 6 Curcuma domestica versus ibuprofen, Outcome 1 Pain on walking NRS 0‐10.
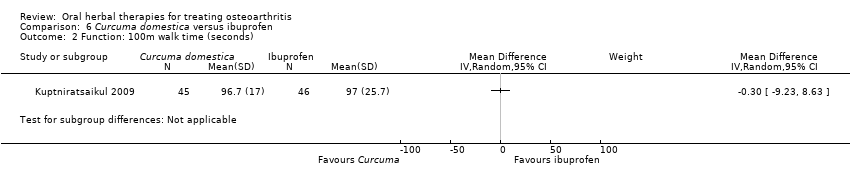
Comparison 6 Curcuma domestica versus ibuprofen, Outcome 2 Function: 100m walk time (seconds).

Comparison 6 Curcuma domestica versus ibuprofen, Outcome 3 Participants (n) reported adverse events.
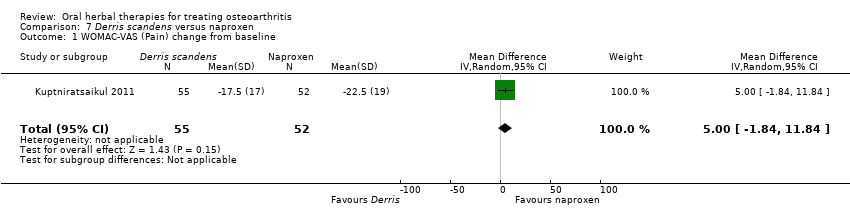
Comparison 7 Derris scandens versus naproxen, Outcome 1 WOMAC‐VAS (Pain) change from baseline.

Comparison 7 Derris scandens versus naproxen, Outcome 2 WOMAC‐VAS (Function) change from baseline.

Comparison 7 Derris scandens versus naproxen, Outcome 3 Participants (n) reported adverse events..
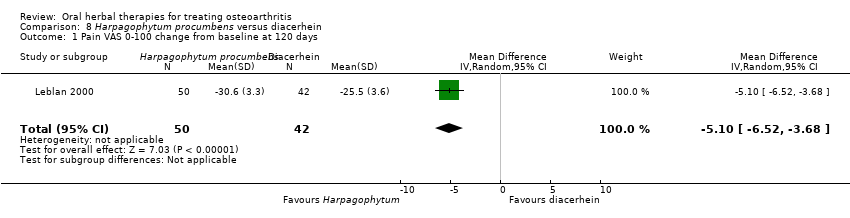
Comparison 8 Harpagophytum procumbens versus diacerhein, Outcome 1 Pain VAS 0‐100 change from baseline at 120 days.
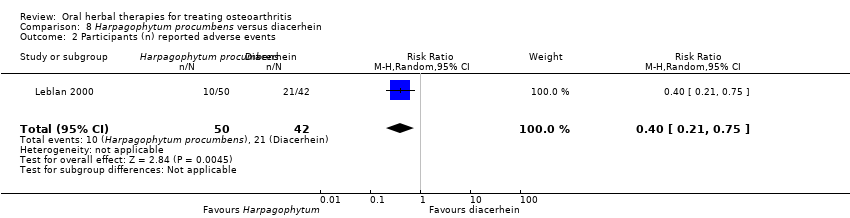
Comparison 8 Harpagophytum procumbens versus diacerhein, Outcome 2 Participants (n) reported adverse events.

Comparison 9 Petiveria alliacea versus placebo, Outcome 1 Pain (scale unknown) with mvt change from baseline.

Comparison 9 Petiveria alliacea versus placebo, Outcome 2 Participants (n) reported adverse events.

Comparison 10 Pinus pinaster (Pycnogenol® 150 mg) versus placebo, Outcome 1 WOMAC‐VAS (Pain).
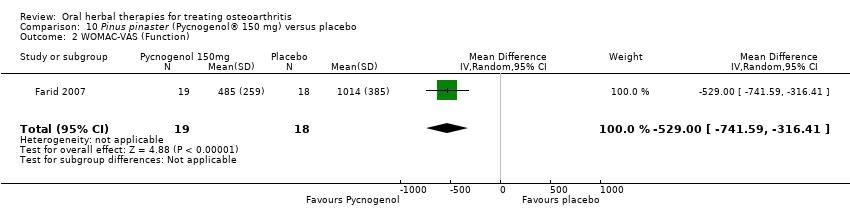
Comparison 10 Pinus pinaster (Pycnogenol® 150 mg) versus placebo, Outcome 2 WOMAC‐VAS (Function).

Comparison 10 Pinus pinaster (Pycnogenol® 150 mg) versus placebo, Outcome 3 Participants (n) reported adverse events.
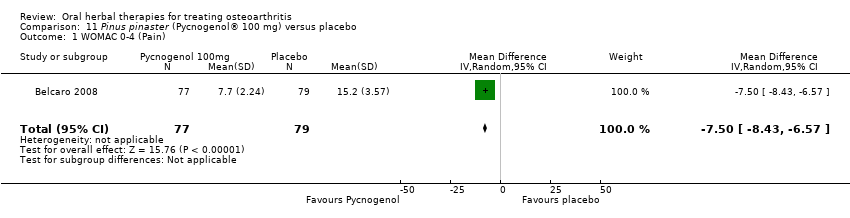
Comparison 11 Pinus pinaster (Pycnogenol® 100 mg) versus placebo, Outcome 1 WOMAC 0‐4 (Pain).

Comparison 11 Pinus pinaster (Pycnogenol® 100 mg) versus placebo, Outcome 2 WOMAC 0‐4 (Function).

Comparison 12 Ricinus officinale versus placebo, Outcome 1 Participants (n) reported adverse events.
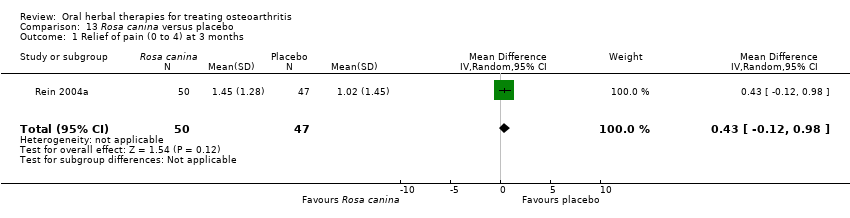
Comparison 13 Rosa canina versus placebo, Outcome 1 Relief of pain (0 to 4) at 3 months.

Comparison 13 Rosa canina versus placebo, Outcome 2 WOMAC‐VAS (Pain).

Comparison 13 Rosa canina versus placebo, Outcome 3 WOMAC‐VAS (Function).
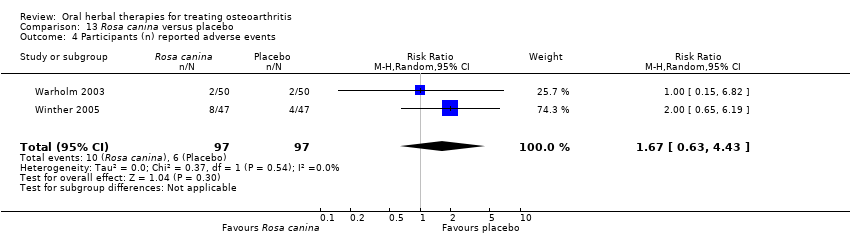
Comparison 13 Rosa canina versus placebo, Outcome 4 Participants (n) reported adverse events.
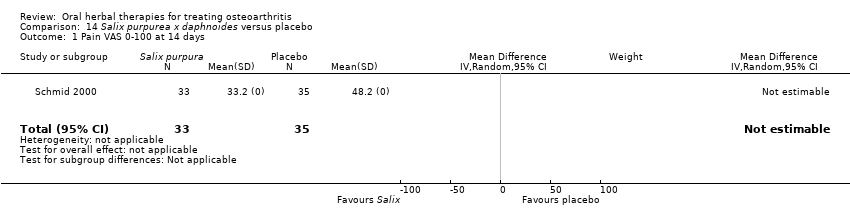
Comparison 14 Salix purpurea x daphnoides versus placebo, Outcome 1 Pain VAS 0‐100 at 14 days.

Comparison 14 Salix purpurea x daphnoides versus placebo, Outcome 2 Function VAS 0‐100 at 14 days.

Comparison 14 Salix purpurea x daphnoides versus placebo, Outcome 3 Participants (n) reported adverse events.

Comparison 15 Salix purpurea x daphnoides versus diclofenac, Outcome 1 WOMAC‐VAS (Pain).
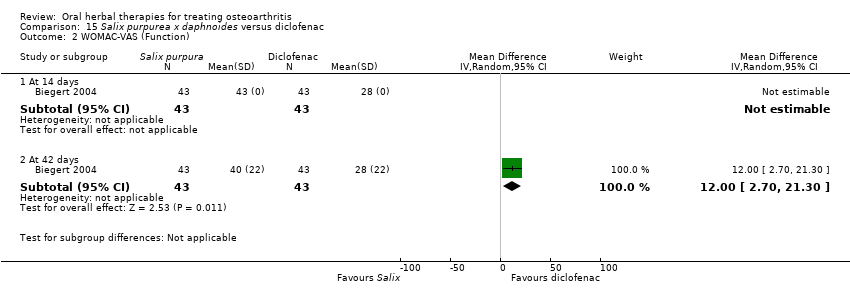
Comparison 15 Salix purpurea x daphnoides versus diclofenac, Outcome 2 WOMAC‐VAS (Function).

Comparison 15 Salix purpurea x daphnoides versus diclofenac, Outcome 3 Participants (n) reported adverse events.

Comparison 16 Uncaria guianensis versus placebo, Outcome 1 Pain VAS 0‐100 (night).

Comparison 16 Uncaria guianensis versus placebo, Outcome 2 Participants (n) reported adverse events.

Comparison 17 Zingiber officinale (Zintona EC) versus placebo, Outcome 1 Pain VAS 0‐100 (movement).

Comparison 17 Zingiber officinale (Zintona EC) versus placebo, Outcome 2 Function (handicap) VAS 0‐100.
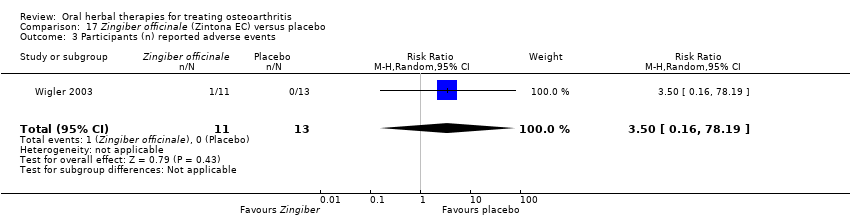
Comparison 17 Zingiber officinale (Zintona EC) versus placebo, Outcome 3 Participants (n) reported adverse events.
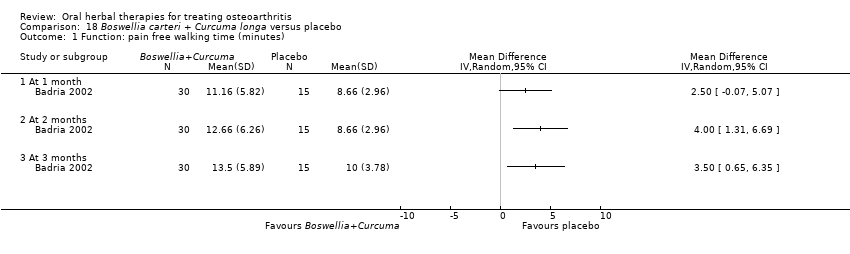
Comparison 18 Boswellia carteri + Curcuma longa versus placebo, Outcome 1 Function: pain free walking time (minutes).
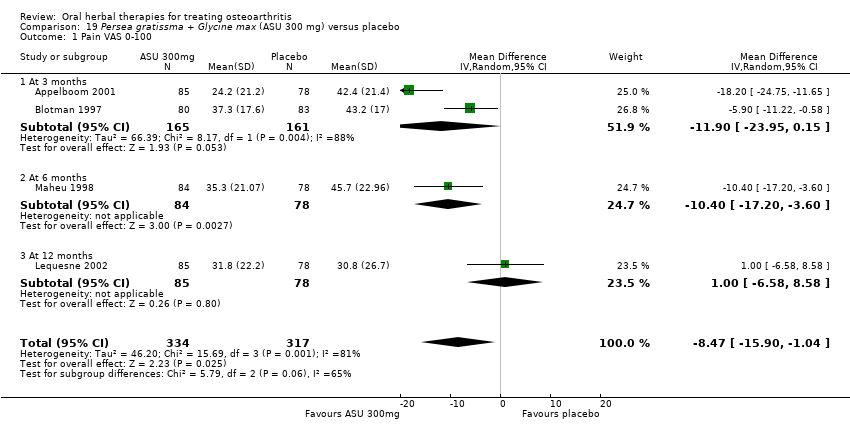
Comparison 19 Persea gratissma + Glycine max (ASU 300 mg) versus placebo, Outcome 1 Pain VAS 0‐100.
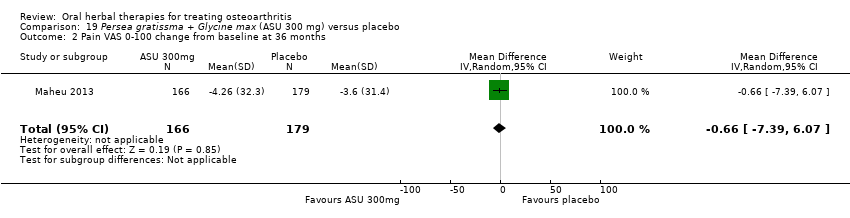
Comparison 19 Persea gratissma + Glycine max (ASU 300 mg) versus placebo, Outcome 2 Pain VAS 0‐100 change from baseline at 36 months.
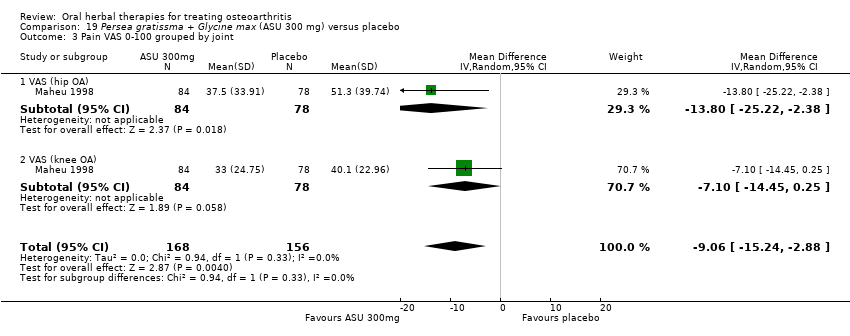
Comparison 19 Persea gratissma + Glycine max (ASU 300 mg) versus placebo, Outcome 3 Pain VAS 0‐100 grouped by joint.

Comparison 19 Persea gratissma + Glycine max (ASU 300 mg) versus placebo, Outcome 4 Function: disability VAS 0‐100.

Comparison 19 Persea gratissma + Glycine max (ASU 300 mg) versus placebo, Outcome 5 WOMAC‐VAS (Function) change from baseline at 36 months.

Comparison 19 Persea gratissma + Glycine max (ASU 300 mg) versus placebo, Outcome 6 Lequesne algofunctional index.

Comparison 19 Persea gratissma + Glycine max (ASU 300 mg) versus placebo, Outcome 7 Function (various tools).
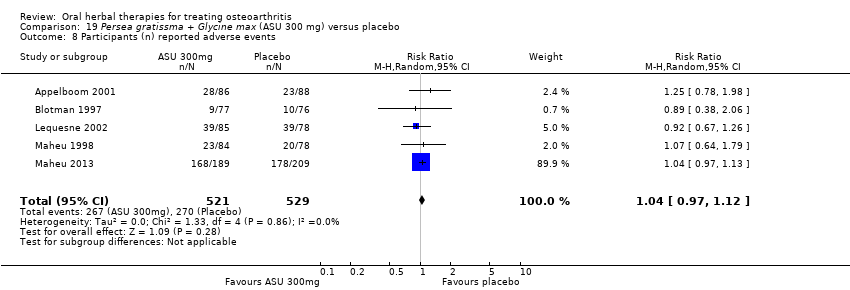
Comparison 19 Persea gratissma + Glycine max (ASU 300 mg) versus placebo, Outcome 8 Participants (n) reported adverse events.
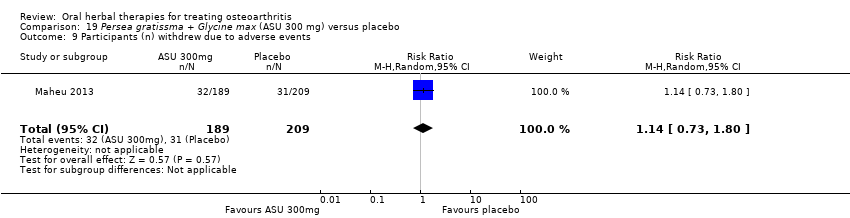
Comparison 19 Persea gratissma + Glycine max (ASU 300 mg) versus placebo, Outcome 9 Participants (n) withdrew due to adverse events.
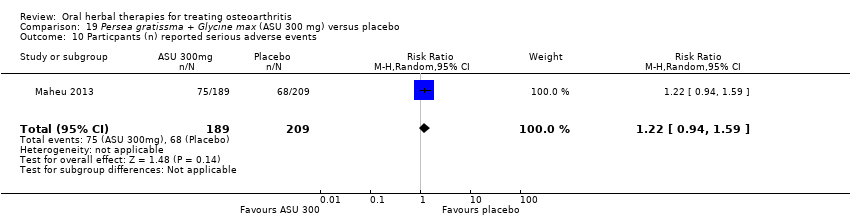
Comparison 19 Persea gratissma + Glycine max (ASU 300 mg) versus placebo, Outcome 10 Particpants (n) reported serious adverse events.

Comparison 19 Persea gratissma + Glycine max (ASU 300 mg) versus placebo, Outcome 11 JSW change from baseline.

Comparison 20 Persea gratissma + Glycine max (ASU 600 mg) versus placebo, Outcome 1 Pain VAS 0‐100.

Comparison 20 Persea gratissma + Glycine max (ASU 600 mg) versus placebo, Outcome 2 Lequesne algofunctional index.

Comparison 20 Persea gratissma + Glycine max (ASU 600 mg) versus placebo, Outcome 3 Participants (n) reported adverse events.

Comparison 21 Persea gratissma + Glycine max (ASU 300 mg) versus chondroitin sulphate, Outcome 1 WOMAC‐VAS (Pain).
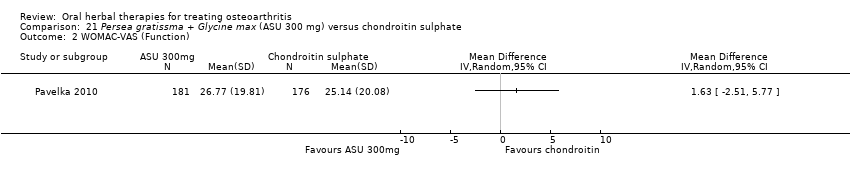
Comparison 21 Persea gratissma + Glycine max (ASU 300 mg) versus chondroitin sulphate, Outcome 2 WOMAC‐VAS (Function).
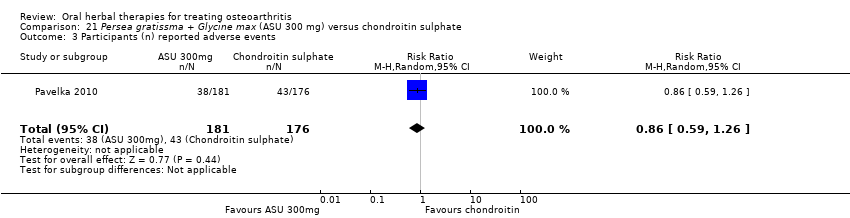
Comparison 21 Persea gratissma + Glycine max (ASU 300 mg) versus chondroitin sulphate, Outcome 3 Participants (n) reported adverse events.

Comparison 21 Persea gratissma + Glycine max (ASU 300 mg) versus chondroitin sulphate, Outcome 4 Paricipants (n) reported serious adverse events.
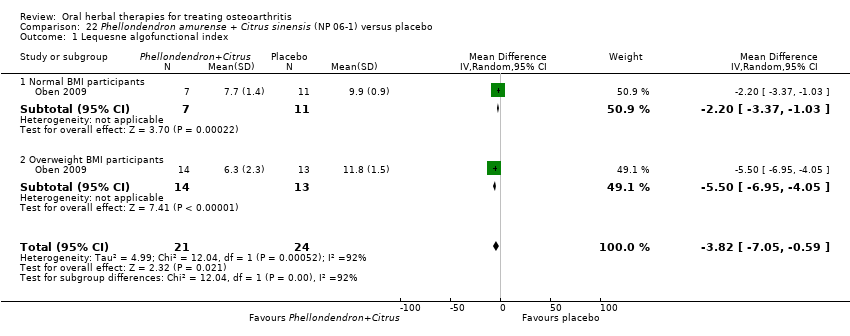
Comparison 22 Phellondendron amurense + Citrus sinensis (NP 06‐1) versus placebo, Outcome 1 Lequesne algofunctional index.

Comparison 23 Uncaria guianensis + Lepidium meyenii versus glucosamine sulphate, Outcome 1 Participants (n) reported adverse events.

Comparison 24 Zingiber officinale + Alpinia galanga (EV.EXT77) versus placebo, Outcome 1 Pain immediately after walking 50 feet VAS 0‐100.

Comparison 24 Zingiber officinale + Alpinia galanga (EV.EXT77) versus placebo, Outcome 2 WOMAC‐VAS (Function).
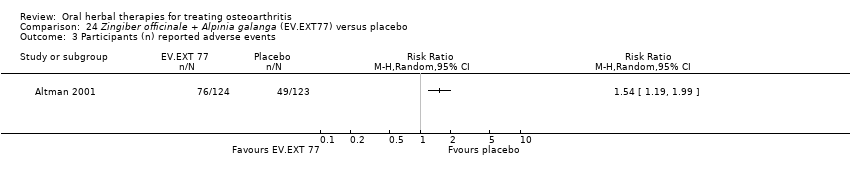
Comparison 24 Zingiber officinale + Alpinia galanga (EV.EXT77) versus placebo, Outcome 3 Participants (n) reported adverse events.
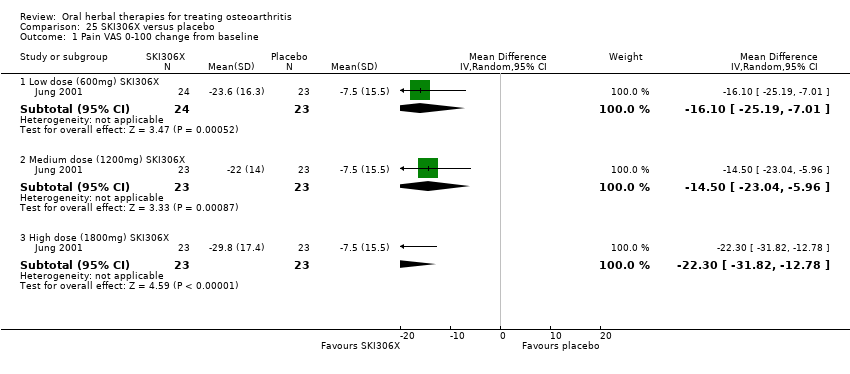
Comparison 25 SKI306X versus placebo, Outcome 1 Pain VAS 0‐100 change from baseline.
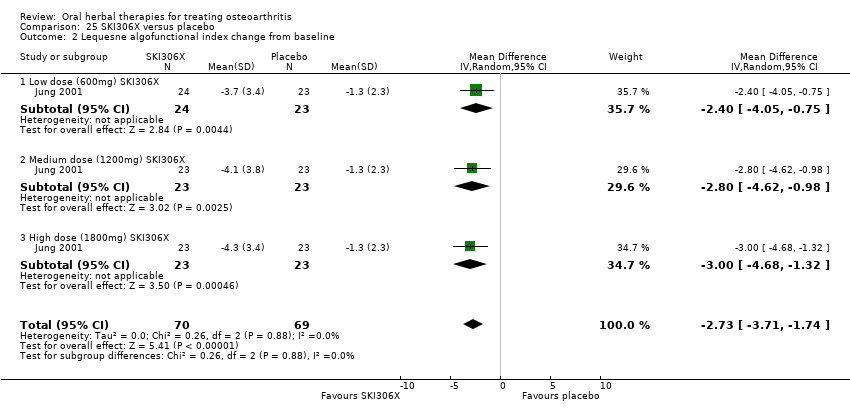
Comparison 25 SKI306X versus placebo, Outcome 2 Lequesne algofunctional index change from baseline.
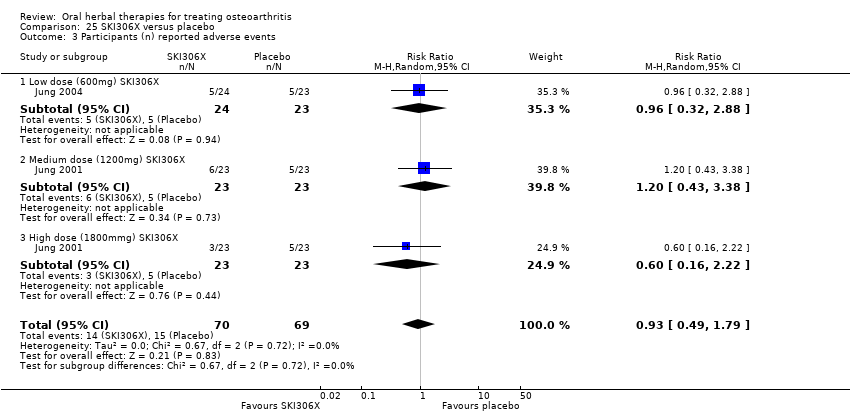
Comparison 25 SKI306X versus placebo, Outcome 3 Participants (n) reported adverse events.
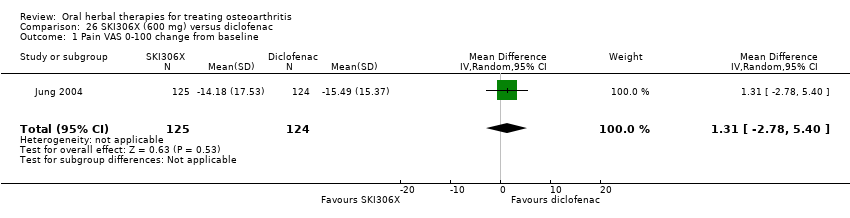
Comparison 26 SKI306X (600 mg) versus diclofenac, Outcome 1 Pain VAS 0‐100 change from baseline.

Comparison 26 SKI306X (600 mg) versus diclofenac, Outcome 2 Lequesne algofunctional index change from baseline.
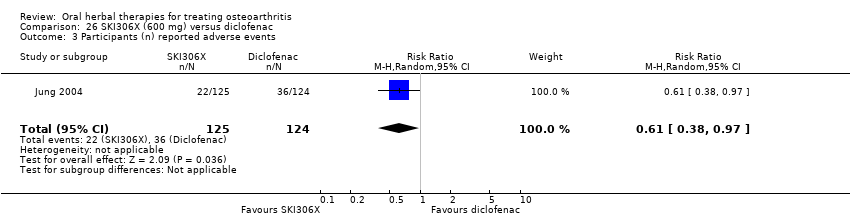
Comparison 26 SKI306X (600 mg) versus diclofenac, Outcome 3 Participants (n) reported adverse events.

Comparison 27 Phytodolor N versus placebo, Outcome 1 Enduring pain (0 to 3).

Comparison 27 Phytodolor N versus placebo, Outcome 2 Function: mobility limitations (0 to 3).

Comparison 27 Phytodolor N versus placebo, Outcome 3 Participants (n) reported adverse events.
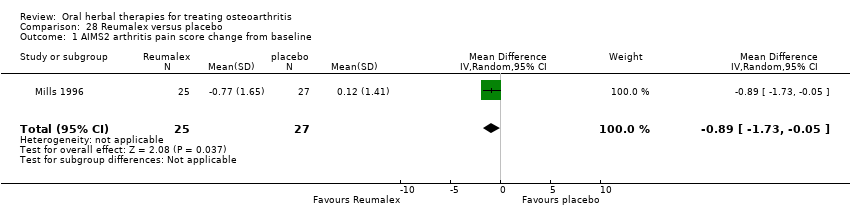
Comparison 28 Reumalex versus placebo, Outcome 1 AIMS2 arthritis pain score change from baseline.

Comparison 28 Reumalex versus placebo, Outcome 2 Participants (n) reported adverse events.

Comparison 29 Chinese DJW versus diclofenac, Outcome 1 Pain VAS 0‐100 (total).
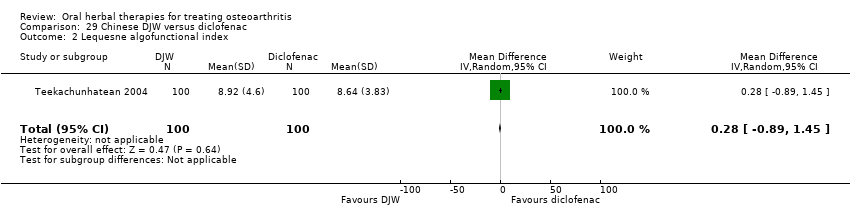
Comparison 29 Chinese DJW versus diclofenac, Outcome 2 Lequesne algofunctional index.

Comparison 29 Chinese DJW versus diclofenac, Outcome 3 Participants (n) reported adverse events.

Comparison 30 Chinese BNHS versus Chinese active control, Outcome 1 Pain VAS 0‐100 (walking).
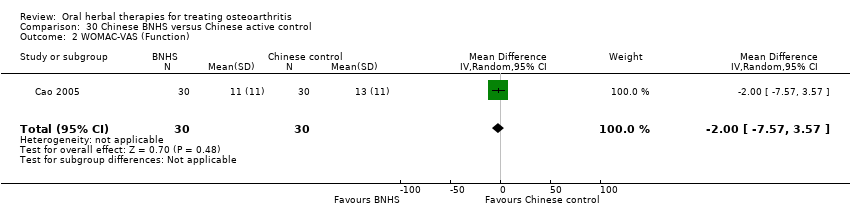
Comparison 30 Chinese BNHS versus Chinese active control, Outcome 2 WOMAC‐VAS (Function).

Comparison 30 Chinese BNHS versus Chinese active control, Outcome 3 Participants (n) reported adverse events.

Comparison 31 Chinese BNHS versus glucosamine sulphate, Outcome 1 Pain VAS 0‐100 (walking).
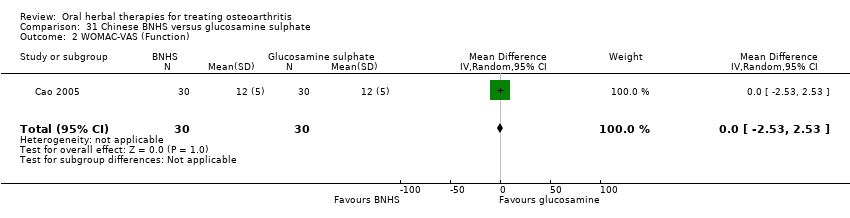
Comparison 31 Chinese BNHS versus glucosamine sulphate, Outcome 2 WOMAC‐VAS (Function).

Comparison 31 Chinese BNHS versus glucosamine sulphate, Outcome 3 Participants (n) reported adverse events.
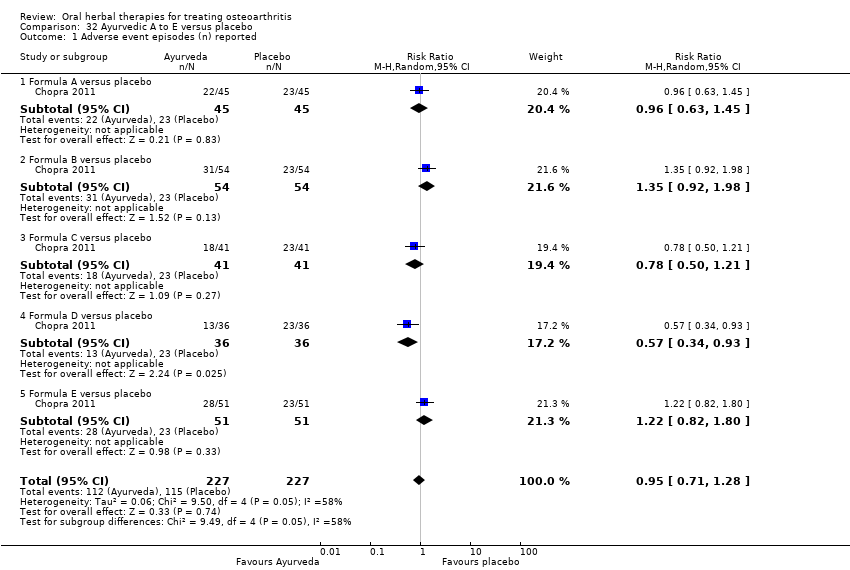
Comparison 32 Ayurvedic A to E versus placebo, Outcome 1 Adverse event episodes (n) reported.

Comparison 33 Ayurvedic Antarth versus placebo, Outcome 1 Pain VAS 0‐100.

Comparison 34 Ayurvedic RA‐II versus placebo, Outcome 1 Pain VAS 0‐100.

Comparison 34 Ayurvedic RA‐II versus placebo, Outcome 2 WOMAC 0‐4 (Function).

Comparison 34 Ayurvedic RA‐II versus placebo, Outcome 3 Participants (n) reported adverse events.
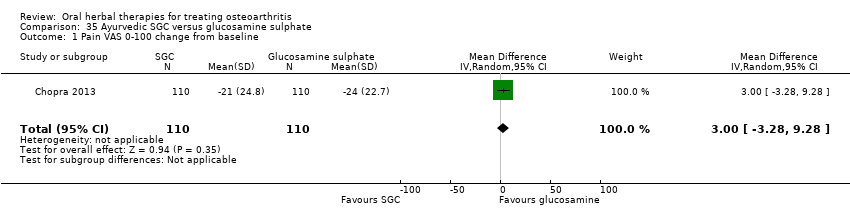
Comparison 35 Ayurvedic SGC versus glucosamine sulphate, Outcome 1 Pain VAS 0‐100 change from baseline.
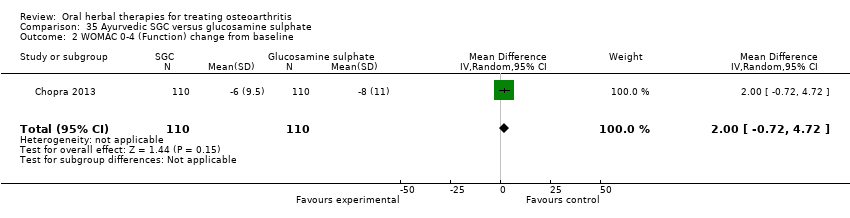
Comparison 35 Ayurvedic SGC versus glucosamine sulphate, Outcome 2 WOMAC 0‐4 (Function) change from baseline.

Comparison 35 Ayurvedic SGC versus glucosamine sulphate, Outcome 3 Participants (n) reported adverse events.

Comparison 36 Ayurvedic SGC versus celecoxib, Outcome 1 Pain VAS 0‐100 change from baseline.

Comparison 36 Ayurvedic SGC versus celecoxib, Outcome 2 WOMAC 0‐4 (Function) change from baseline.
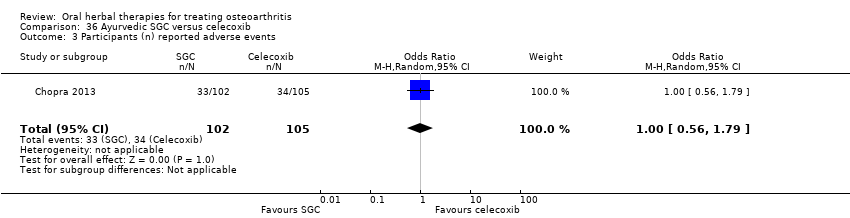
Comparison 36 Ayurvedic SGC versus celecoxib, Outcome 3 Participants (n) reported adverse events.

Comparison 37 Ayurvedic SGCG versus glucosamine sulphate, Outcome 1 Pain VAS 0‐100 change from baseline.

Comparison 37 Ayurvedic SGCG versus glucosamine sulphate, Outcome 2 WOMAC 0‐4 (Function) change from baseline.

Comparison 37 Ayurvedic SGCG versus glucosamine sulphate, Outcome 3 Participants (n) reported adverse events.

Comparison 38 Ayurvedic SGCG versus celecoxib, Outcome 1 Pain VAS 0‐100 change from baseline.
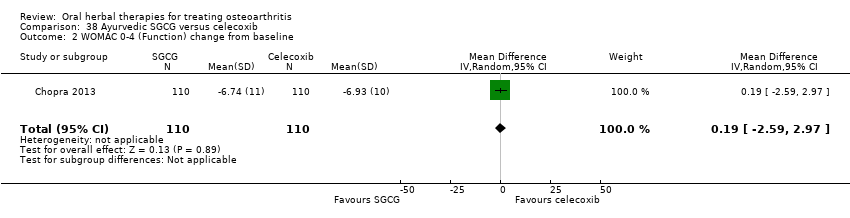
Comparison 38 Ayurvedic SGCG versus celecoxib, Outcome 2 WOMAC 0‐4 (Function) change from baseline.

Comparison 38 Ayurvedic SGCG versus celecoxib, Outcome 3 Participants (n) reported adverse events.

Comparison 39 Japanese Boiogito + loxoprofen versus loxoprofen, Outcome 1 Pain: Knee Society Rating System 0‐100 (knee).

Comparison 39 Japanese Boiogito + loxoprofen versus loxoprofen, Outcome 2 Function: Knee Society Rating System 0‐50 (stairs).

Comparison 39 Japanese Boiogito + loxoprofen versus loxoprofen, Outcome 3 Participants (n) reported adverse events.
| Boswellia serrata for treating osteoarthritis | ||||||
| Patient or population: patients with treating osteoarthritis | ||||||
| Outcomes | Illustrative comparative risks* (95% CI) | Relative effect | No of Participants | Quality of the evidence | Comments | |
| Assumed risk | Corresponding risk | |||||
| Control | Boswellia serrata | |||||
| Pain | Mean pain in the control group at the end of treatment was 2.50 (0 to 3 scale). | Mean pain in the intervention groups was | ‐ | 30 | ⊕⊕⊝⊝ | Absolute improvement in pain was 56% (46% to 66%); Relative improvement in pain was 80% (66% to 94%)5; NNTB = 1 (95% CI 1 to 2). |
| Function | Mean disability in the control group at the end of treatment was 2.46 (0 to 3 scale). | Mean disability in the intervention groups was | ‐ | 30 | ⊕⊕⊝⊝ | Absolute improvement in function was 54% (44% to 64%); Relative improvement was 76% (62% to 90%)5; NNTB = 1 (95% CI 1 to 3). |
| Adverse events | No (n=0) participants in the control group reported adverse events. 0 per 1000 | Two (n=2) participants in the intervention group reported adverse events. 0 per 1000 | RR 5.00 | 30 | ⊕⊕⊝⊝ | Absolute risk of adverse events was 13% higher in the Boswellia serrata group (6% lower to 33% higher); Relative percentage change 400% worsening (74% to 9513% worsening); NNT n/a.6 |
| Adverse events Participants (n) withdrew due to adverse effects | See comment | See comment | Not estimable | 30 | See comment | Reported NIL withdrawals due to adverse events. |
| Adverse events Participants (n) reported serious adverse events | See comment | See comment | Not estimable | ‐ | See comment | Serious adverse events not reported as discrete outcome. |
| Radiographic joint changes | See comment | See comment | Not estimable | ‐ | See comment | Radiographic joint changes not measured. |
| Quality of life | See comment | See comment | Not estimable | ‐ | See comment | Quality of life not measured. |
| *The basis for the assumed risk (e.g. the median control group risk across studies) is provided in footnotes. The corresponding risk (and its 95% confidence interval) is based on the assumed risk in the comparison group and the relative effect of the intervention (and its 95% CI). | ||||||
| GRADE Working Group grades of evidence | ||||||
| 1 Criteria for diagnosis of OA not specified. 4 Downgrade estimate due to single study. 5 Control group baseline pain (SD) 2.80 (0.41), baseline disability 2.86 (0.35), from Kimmatkar 2003. 6 Number needed to treat (NNT) = not applicable (n/a) when result is not statistically significant. NNT for continuous outcomes calculated using Wells Calculator (CMSG editorial office). NNT for dichotomous outcomes calculated using Cates NNT calculator (http://www.nntonline.net/visualrx/). Assumed a minimal clinically important difference of 1 point of a 0 to 3 point scale (pain, function). | ||||||
| Boswellia serrata (enriched) 100 mg for treating osteoarthritis | ||||||
| Patient or population: patients with treating osteoarthritis | ||||||
| Outcomes | Illustrative comparative risks* (95% CI) | Relative effect | No of Participants | Quality of the evidence | Comments | |
| Assumed risk | Corresponding risk | |||||
| Control | Boswellia serrata (enriched) 100mg | |||||
| Pain Global pain VAS 0‐100 (higher scores mean worse) | Weighted mean pain in the control groups at the end of treatment was 40.02 (0 to 100 scale). | The weighted mean pain in the intervention groups was | ‐ | 85 | ⊕⊕⊕⊝ | Absolute improvement in pain was 17% (8% to 26%); Relative improvement in pain was 29% (15% to 43%)3; NNTB 2 (95% CI 1 to 6). |
| Function | Weighted mean disability in the control groups at the end of treatment was 33.13 (0 to 100 scale). | The weighted mean disability in the intervention groups was | ‐ | 85 | ⊕⊕⊕⊝ | Absolute improvement was 8% (14% to 2%); Relative improvement was 20% (5% to 34%)3; NNTB 4 (95% CI 2 to 18). |
| Adverse events | 625 per 1000 | 375 per 1000 | RR 0.60 | 96 | ⊕⊕⊕⊝ | Absolute risk of adverse events was 25% lower in the Boswellia serrata group (6% to 44% lower); Relative percentage change 40% improvement (61% improvement to 9% worsening); NNT = 4 (95% CI 3 to 22). |
| Adverse events Participants (n) withdrew due to adverse effects | See comment | See comment | Not estimable | 96 | See comment | Reported NIL withdrawals due to adverse events. |
| Adverse events Participants (n) reported serious adverse events | See comment | See comment | Not estimable | 96 | See comment | Reported NIL serious adverse events. |
| Radiographic joint changes | See comment | See comment | Not estimable | ‐ | See comment | Radiographic joint changes not measured. |
| Quality of life | See comment | See comment | Not estimable | ‐ | See comment | Quality of life not measured. |
| *The basis for the assumed risk (e.g. the median control group risk across studies) is provided in footnotes. The corresponding risk (and its 95% confidence interval) is based on the assumed risk in the comparison group and the relative effect of the intervention (and its 95% CI). | ||||||
| GRADE Working Group grades of evidence | ||||||
| 1Sengupta 2008, Sengupta 2010, Vishal 2011: WOMAC scores presented as subscale scores only. Overall WOMAC not reported. 2 Confirmatory study design: statistical power 80%, alpha set at 0.05, but downgraded due to potential imprecision due to small number of participants; and lower limit of 95% CI does not preclude clincially insignificant change 3 Control group baseline measures taken from Sengupta 2008, the study most heavily weighted in the meta‐analyses. Control group baseline pain (SD) 56.88 (12.04), baseline disability 41.3 (9.6). 4 Downgrade estimate due to potential imprecision, eg, small number of events and participants from a single study. 5 Number needed to treat (NNT) is not applicable (n/a) when result is not statistically significant. NNT for dichotomous outcomes calculated using Cates NNT calculator (http://www.nntonline.net/visualrx/); NNT for continuous outcomes calculated using Wells Calculator (CMSG editorial office). Assumed a minimal clinically important difference of 15 points on 0 to 100 mm pain scale, and 10 points on 0 to 100 mm function scale. | ||||||
| Boswellia serrata (enriched) 250mg for treating osteoarthritis | ||||||
| Patient or population: patients with treating osteoarthritis | ||||||
| Outcomes | Illustrative comparative risks* (95% CI) | Relative effect | No of Participants | Quality of the evidence | Comments | |
| Assumed risk | Corresponding risk | |||||
| Control | Boswellia serrata (enriched) 250mg | |||||
| Pain | Mean pain in the control group at the end of treatment was 41.76 (0 to 100 scale). | Mean pain in the intervention group was | ‐ | 47 | ⊕⊕⊕⊝ | Absolute improvement in pain was 28% (20% to 35%); Relative improvement in pain was 48% (36% to 61%)3 ; NNT = 1 (95% CI 1 to 2). |
| Function (higher scores mean worse) | Mean disability in the control group at the end of treatment was 34.07 (0 to 100 scale). | Mean disability in the intervention group was | ‐ | 47 | ⊕⊕⊕⊝ | Absolute improvement in disability was 17% (12% to 21%); Relative improvement in disability was 41% (30% to 51%)3; NNT = 1 (95% CI 1 to 2). |
| Adverse events | 526 per 1000 | 474 per 1000 | RR 0.90 | 114 | ⊕⊕⊕⊝ | Absolute risk of adverse events was 5% lower in the Boswellia serrata group (24% lower to 13% higher); Relative percentage change 10% improvement (38% improvement to 30% worsening); NNT n/a.4 |
| Adverse events Participants (n) withdrew due to adverse effects | See comment | See comment | Not estimable | 114 | See comment | Reported NIL withdrawals due to adverse events. |
| Adverse events Participants (n) reported serious adverse events | See comment | See comment | Not estimable | 114 | See comment | Reported NIL serious adverse events. |
| Radiographic joint changes | See comment | See comment | Not estimable | ‐ | See comment | Radiographic joint changes not measured. |
| Quality of life | See comment | See comment | Not estimable | ‐ | See comment | Quality of life not measured. |
| *The basis for the assumed risk (e.g. the median control group risk across studies) is provided in footnotes. The corresponding risk (and its 95% confidence interval) is based on the assumed risk in the comparison group and the relative effect of the intervention (and its 95% CI). | ||||||
| GRADE Working Group grades of evidence | ||||||
| 1Sengupta 2008: WOMAC scores presented as subscale scores only. Overall WOMAC not reported. 2 Downgrade estimate due to single study. 3 Control group baseline pain (SD) 56.88 (12.04), baseline disability 41.3 (9.6), from Sengupta 2008. 4 Number needed to treat (NNT) = not applicable (n/a) when result is not statistically significant. NNT for continuous outcomes calculated using Wells Calculator (CMSG editorial office). NNT for dichotomous outcomes calculated using Cates NNT calculator (http://www.nntonline.net/visualrx/). | ||||||
| Boswellia serrata (enriched) plus non‐volatile oil for treating osteoarthritis | ||||||
| Patient or population: patients with treating osteoarthritis | ||||||
| Outcomes | Illustrative comparative risks* (95% CI) | Relative effect | No of Participants | Quality of the evidence | Comments | |
| Assumed risk | Corresponding risk | |||||
| Control | Boswellia serrata (enriched) plus non‐volatile oil | |||||
| Pain | Weighted mean pain in the control groups at the end of treatment was 38.90 (0 to 100 scale). | Weighted mean pain in the intervention groups was | ‐ | 97 | ⊕⊕⊕⊝ | Absolute improvement in pain was 16% (12% to 20%); Relative improvement in pain was 34%(25% to 42%)3; NNTB 2 (1 to 4)4 |
| Function (higher scores mean worse) | Weighted mean disability in the control groups at the end of treatment was 34.90 (0 to 100 scale). | Weighted mean disability in the intervention groups was | ‐ | 97 | ⊕⊕⊕⊝ | Absolute improvement in disability was 15% (11% to 19%); Relative improvement in disability was 37% (27% to 47%)3; NNTB 2 (1 to 3). |
| Adverse events | 42 per 1000 | 41 per 1000 | RR 0.98 | 97 | ⊕⊕⊕⊝ | Absolute risk of adverse events was 0% lower in the Boswellia serrata group (8% lower to 8% higher); Relative percentage change 2% improvement (86% improvement to 569% worsening); NNT n/a.5 |
| Adverse events Participants (n) withdrew due to adverse effects | See comment | See comment | Not estimable | ‐ | See comment | Reported NIL withdrawals due to adverse events. |
| Adverse events Participants (n) reported serious adverse events | See comment | See comment | Not estimable | ‐ | See comment | Reported NIL serious adverse events. |
| Radiographic joint changes | See comment | See comment | Not estimable | ‐ | See comment | Radiographic joint changes not measured. |
| Quality of life | See comment | See comment | Not estimable | ‐ | See comment | Quality of life not measured. |
| *The basis for the assumed risk (e.g. the median control group risk across studies) is provided in footnotes. The corresponding risk (and its 95% confidence interval) is based on the assumed risk in the comparison group and the relative effect of the intervention (and its 95% CI). | ||||||
| GRADE Working Group grades of evidence | ||||||
| 1Vishal 2011: 30 day intervention. Sengupta 2010: 90 day intervention. 4 Number needed to treat to benefit (NNTB), and harm (NNTH) = not applicable (n/a) when result is not statistically significant. NNT for continuous outcomes calculated using Wells Calculator (CMSG editorial office). NNT for dichotomous outcomes calculated using Cates NNT calculator (http://www.nntonline.net/visualrx/). 5Sengupta 2010, Vishal 2011: WOMAC scores presented as subscale scores only. Overall WOMAC not reported. | ||||||
| Boswellia serrata compared to valdecoxib for treating osteoarthritis | ||||||
| Patient or population: patients with treating osteoarthritis | ||||||
| Outcomes | Illustrative comparative risks* (95% CI) | Relative effect | No of Participants | Quality of the evidence | Comments | |
| Assumed risk | Corresponding risk | |||||
| Valdecoxib | Boswellia serrata | |||||
| Pain (higher scores mean worse) | Mean pain in the valdecoxib group at the end of treatment was 17.08 (0 to 100 scale). | Mean pain in the intervention groups was | ‐ | 58 | ⊕⊝⊝⊝ | Absolute improvement in pain was 1% (7% improvement to 6% worsening); Relative improvement in pain was 1%4; NNT n/a.5 |
| Function Follow‐up: mean 6 months | Mean disability in the valdecoxib group at the end of treatment was 16.64 (0 to 100 scale). | Mean disability in the intervention groups was | ‐ | 58 | ⊕⊝⊝⊝ | Absolute worsening in disability was 3% (4% improvement to 9% worsening); Relative improvement in disability was 4%4; NNT n/a.5 |
| Adverse events | 61 per 1000 | 121 per 1000 | RR 2.0 | 66 | ⊕⊝⊝⊝ | Absolute risk of adverse events was 6% higher in the Boswellia serrata group (8% lower to 20% higher); Relative percentage change 100% worsening (61% improvement to 918% worsening); NNT n/a.5 |
| Adverse events Participants (n) withdrew due to adverse effects | RR 3.0 (0.13 to 71.07) | 66 | ⊕⊝⊝⊝ | Reported one (1) withdrawal possibly due to adverse events. Absolute risk of withdrawal due to adverse events was 3% higher in the Boswellia serrata group (5% lower to 11% higher); Relative percentage change 200% worsening (87% improvement to 7007% worsening); NNT n/a.5 | ||
| Adverse events Participants (n) reported serious adverse events | See comment | See comment | Not estimable | 66 | See comment | Reported NIL serious adverse events. |
| Radiographic joint changes | See comment | See comment | Not estimable | ‐ | See comment | Radiographic joint changes not measured. |
| Quality of life | See comment | See comment | Not estimable | ‐ | See comment | Quality of life not measured. |
| *The basis for the assumed risk (e.g. the median control group risk across studies) is provided in footnotes. The corresponding risk (and its 95% confidence interval) is based on the assumed risk in the comparison group and the relative effect of the intervention (and its 95% CI). | ||||||
| GRADE Working Group grades of evidence | ||||||
| 1 Open trial. Medication regimens differ between active control and intervention. 2 Downgrade estimate due to single study. Treatment effect crosses midline (no effect). 4 Baseline pain in valdecoxib group 49.2, baseline disability 51.6. Aggregate WOMAC scores converted to normalised scores for re‐analysis. 5 Number needed to treat (NNT) = not applicable (n/a) when result is not statistically significant. NNT for continuous outcomes calculated using Wells Calculator (CMSG editorial office). NNT for dichotomous outcomes calculated using Cates NNT calculator (http://www.nntonline.net/visualrx/). | ||||||
| Persea gratissma + Glycine max (ASU 300 mg) for treating osteoarthritis | ||||||
| Patient or population: patients with osteoarthritis | ||||||
| Outcomes | Illustrative comparative risks* (95% CI) | Relative effect | No of Participants | Quality of the evidence | Comments | |
| Assumed risk | Corresponding risk | |||||
| Control | Persea gratissma + Glycine max (ASU 300mg) | |||||
| Pain | Weighted mean pain in the control groups at end of treatment was 40.53 (0 to 100 scale). | Weighted mean pain in the intervention groups was | ‐ | 651 | ⊕⊕⊕⊝ | Absolute improvement in pain was 8% (1% to 16%); Relative improvement in pain was 15% (2% to 29%)2; NNTB 8 (4 to 77)3 |
| Function | Mean disability in the control group at end of treatment was 47.10 mm, on VAS 0 to 100 mm scale (higher scores mean worse)5. | Mean disability in the intervention groups was | ‐ | 642 | ⊕⊕⊕⊝ | SMD ‐0.42 (95% CI ‐0.73 to ‐0.11), in favour of ASU 300mg Absolute improvement in disability was 7% (2% to 12%); Relative improvement in disability was 13% (4% to 23%)7; NNTB 5 (3 to 19)3 |
| Adverse events | 510 per 1000 | 531 per 1000 | RR 1.04 | 1050 | ⊕⊕⊕⊝ | Absolute risk of adverse events is 2% higher in the ASU group (2% lower to 7% higher); Relative percentage change 4% worsening (9% improvement to 12% worsening); NNT n/a3 |
| Adverse events Participants (n) withdrew due to adverse effects | 148 per 1000 | 169 per 100 (108 to 267) | RR 1.14 (0.73 to 1.80) | 398 (1 study) | ⊕⊕⊕⊝ | Absolute risk of participants withdrawing due to adverse events in 2% higher in ASU group (5% lower to 9% higher); Relative percentage change 14% worsening (27% improvement to 90% worsening); NNT n/a.3,9 |
| Adverse events Participants (n) reported serious adverse events | 325 per 1000 | 397 per 1000 (306 to 517) | RR 1.22 (0.94 to 1.59) | 398 (1 study) | ⊕⊕⊕⊝ | Absolute risk of serious adverse events is 7% higher in the ASU group (2% lower to 17% higher); Relative percentage change 22% worsening (6% improvement to 59% worsening); NNT n/a.3,9 |
| Radiographic joint changes Change in Joint Space Width (JSW) from baseline (higher scores mean worse). Follow up: 24 to 36 months. | Weighted mean JSW change from baseline in the control groups at end of treatment was 0.65. | Mean JSW change from baseline in the intervention groups was 0.12 lower (0.43 lower to 0.19 higher) | ‐ | 453 (2 studies) | ⊕⊕⊕⊝ | Absolute change NNT n/a.3,9 |
| Quality of life | See comment | See comment | Not estimable | ‐ | See comment | Quality of life not measured. |
| *The basis for the assumed risk (e.g. the median control group risk across studies) is provided in footnotes. The corresponding risk (and its 95% confidence interval) is based on the assumed risk in the comparison group and the relative effect of the intervention (and its 95% CI). | ||||||
| GRADE Working Group grades of evidence | ||||||
| 1Downgrade due to heterogeneity, inconsistency 2 Calculations based on control group baseline pain measure taken from Blotman 1997, the most heavily weighted study in the meta‐analysis. Control group baseline mean (SD) pain 54.3 (11.9). 3 Number needed to treat to benefit (NNTB), or to harm (NNTH) = not applicable (n/a) when result is not statistically significant. NNT for dichotomous outcomes calculated using Cates NNT calculator (http://www.nntonline.net/visualrx/)NNT for continuous outcomes calculated using Wells Calculator (CMSG editorial office), assuming a minimal clinically important difference of 15 mm on a 0 to 100 mm pain scale, and 10 mm on a 0 to 100 mm function scale. 4 Multiple tools: Disability VAS reported in one study only (Maheu 1998); WOMAC change score reported in one study (Maheu 2013); Lequesne algofunctional index reported in four studies, but to avoid over‐reporting, data were extracted on this outcome from three studies only (Appelboom 2001, Blotman 1997, Lequesne 2002) 5 From Maheu 1998: follow‐up disability score in the control group 47.10 mm (VAS 0 to 100 mm scale) 6 Four trials pooled (Appelboom 2001, Blotman 1997, Lequesne 2002, Maheu 1998) using SMD, and re‐expressed as MD by multiplying the SMD (95% CI) by the baseline SD in the control group of Maheu 1998 (16.78). 7 Calculations based on data from Maheu 1998: control group baseline mean (SD) disability 52.5 (16.78), 0 to 100 mm VAS scale. 8 Downgrade estimate due to imprecision: few participants. 9 Treatment effect crosses midline (no effect). | ||||||
| Persea gratissma + Glycine max (ASU 600 mg) for treating osteoarthritis | ||||||
| Patient or population: patients with osteoarthritis | ||||||
| Outcomes | Illustrative comparative risks* (95% CI) | Relative effect | No of Participants | Quality of the evidence | Comments | |
| Assumed risk | Corresponding risk | |||||
| Control | Persea gratissma + Glycine max (ASU 600mg) | |||||
| Pain (higher scores mean worse) Follow up: 3 months | Mean pain in the control group at the end of treatment was 42.4 (0 to 100 scale). | Mean pain in the intervention group was | ‐ | 156 | ⊕⊕⊕⊝ | Absolute improvement in pain was 14% (21% to 8%); Relative improvement in pain was 26.5%2; NNT = |
| Function (higher scores mean worse) | Mean disability in the control group at the end of treatment was 7.8 (0 to 24 scale). | Mean disability in the intervention group was | ‐ | 156 | ⊕⊕⊕⊝ | Absolute improvement in disability was 1% (1% to 0%); Relative improvement in disability was 13.7%2; NNT = |
| Adverse events | 261 per 1000 | 278 per 1000 | RR 1.07 | 174 | ⊕⊕⊕⊝ | Absolute risk of adverse events is 2% higher in the ASU group (11% lower to 15% higher); Relative percentage change 7% worsening (34% improvement to 74% worsening); NNT n/a.3 |
| Adverse events Participants (n) withdrew due to adverse effects | See comment | See comment | Not estimable | 174 | See comment | Withdrawals due to adverse events not reported as a discrete outcome in ASU 600mg subgroup. |
| Adverse events Participants (n) reported serious adverse events | See comment | See comment | Not estimable | 174 | See comment | Serious adverse events not reported as a discrete outcome in ASU 600mg subgroup. |
| Radiographic joint changes | See comment | See comment | Not estimable | ‐ | See comment | Radiographic joint changes not measured. |
| Quality of life | See comment | See comment | Not estimable | ‐ | See comment | Quality of life not measured. |
| *The basis for the assumed risk (e.g. the median control group risk across studies) is provided in footnotes. The corresponding risk (and its 95% confidence interval) is based on the assumed risk in the comparison group and the relative effect of the intervention (and its 95% CI). | ||||||
| GRADE Working Group grades of evidence | ||||||
| 1 Single study. 2 Control group baseline mean (SD) pain 53.5 (13.9), baseline mean (SD) disability 9.5 (2.2), from Appelboom 2001. 3 Number needed to treat (NNT) = not applicable (n/a) when result is not statistically significant. NNT for continuous outcomes calculated using Wells Calculator (CMSG editorial office). NNT for dichotomous outcomes calculated using Cates NNT calculator (http://www.nntonline.net/visualrx/). | ||||||
| Persea gratissma + Glycine max (ASU 300 mg) compared to chondroitin sulphate for treating osteoarthritis | ||||||
| Patient or population: patients with osteoarthritis | ||||||
| Outcomes | Illustrative comparative risks* (95% CI) | Relative effect | No of Participants | Quality of the evidence | Comments | |
| Assumed risk | Corresponding risk | |||||
| Chondroitin sulphate | Persea gratissma + Glycine max (ASU 300mg) | |||||
| Pain (higher scores mean worse) | Mean pain in the chondroitin sulphate group at the end of treatment was 22.88 (0 to 100 scale). | The mean pain in the intervention group was | ‐ | 357 | ⊕⊕⊝⊝ | Absolute worsening of pain was 10% (10% improvement to 31% worsening); Relative worsening of pain was 3%3; NNT n/a.4 |
| Function (higher scores mean worse) | Mean function in the chondroitin sulphate group at the end of treatment was 25.14 (0 to 100 scale). | The mean disability in the intervention group was | ‐ | 357 | ⊕⊕⊝⊝ | Absolute worsening of disability was 28% (43% improvement to 98% worsening); Relative worsening of disability was 3%3; NNT n/a.4 |
| Adverse events | 244 per 1000 | 210 per 1000 | RR 0.86 | 357 | ⊕⊕⊝⊝ | Absolute risk of adverse events was 3% lower in the ASU group (12% lower to 5% higher); Relative percentage change 14% improvement (41% improvement to 26% worsening); NNT n/a.4 |
| Adverse events Participants (n) withdrew due to adverse effects | See comment | See comment | Not estimable | 357 | Withdrawals due to adverse events not reported as a discrete outcome. | |
| Adverse events Participants (n) reported serious adverse events | 6 per 1000 | 17 per 1000 (2 to 158) | RR 2.92 (0.31 to 27.78) | 357 | ⊕⊕⊝⊝ | Absolute risk of serious adverse events was 1% higher in the ASU group (1% lower to 3% higher); Relative percentage change 192% worsening (69% improvement to 2678% worsening); NNT n/a.4 |
| Radiographic joint changes | See comment | See comment | Not estimable | ‐ | See comment | Radiographic joint changes not measured. |
| Quality of life | See comment | See comment | Not estimable | ‐ | See comment | Quality of life not measured. |
| *The basis for the assumed risk (e.g. the median control group risk across studies) is provided in footnotes. The corresponding risk (and its 95% confidence interval) is based on the assumed risk in the comparison group and the relative effect of the intervention (and its 95% CI). | ||||||
| GRADE Working Group grades of evidence | ||||||
| 1 SIngle study. Treatment effect crosses midline (no effect). 2 Chondroitin sulfate might not be active control. Non‐inferiority hypothesis may be flawed. 3 Chrondroitin sulfate group baseline pain 49.08, baseline disability 49.07. Aggregate WOMAC scores converted to normalised scores for re‐analysis. 4 Number needed to treat (NNT) = not applicable (n/a) when result is not statistically significant. NNT for continuous outcomes calculated using Wells Calculator (CMSG editorial office). NNT for dichotomous outcomes calculated using Cates NNT calculator (http://www.nntonline.net/visualrx/). | ||||||
| PLANT | MEDICINAL PRODUCT | DOSE | MARKER | |||||
| Botanical name | Part/s | Tradename | Preparation | Drug:Extract | mg/day | Constituent marker | Quantity of marker | References |
| Medicinal products from single plants | ||||||||
| Boswellia serrata | gum resin | CapWokvelTM | extraction solvent not stated | not stated | 999 | boswellic acid (total organic acids 65%) | 40% | |
| 5‐Loxin | 100 or 250 | AKBA | 30% | |||||
| Aflapin | 100 | AKBA + non‐volatile oil | 20% | |||||
| Curcuma domestica | root | study medication | ethanolic extract | not stated | curcumoids | 500mg | ||
| Derris scandens | stem | study medication | ethanolic (50%) extract | not stated | 800 | genistein derivatve | not stated | |
| Garcinia kola | seed | study medication | freeze‐dried aqueous extract | not stated | 400 | not stated | ||
| Harpagophytum procumbens | root | Arthrotabs | aqueous extract | 1.5‐2.5:1 | 2400 | harpagoside1 | 30 mg | |
| Flexiloges | ethanolic (60%) extract | 4.5‐5.5:1 | 960 | <30 mg | ||||
| Harpadol | cryoground powder | 2610 | 60 mg | |||||
| Petiveria alliacea | herb | Tipi tea | aqueous extract | 9g / 600 ml | 600 ml | not stated | ||
| Pinus pinaster (synonym Pinus maritima) | bark | Pycnogenol® | polyphenol concentrate | 150 | proanthocyanidins | 45 (90%) | ||
| 100 | not stated | |||||||
| 150 | 70% | |||||||
| Ricinus officinalis | seed | study medication | oil | not stated | 2,7 ml | ricinoleic acid | not stated | |
| Rosa canina lito | rose hip and seed | Hyben Vital or Litozin | powder | 5000 | galactolipid | 1.5mg | ||
| Salix daphnoides | bark | study medication | ethanolic (70%) extract | 8‐14:1 | 1573 | salicin | 240 mg | |
| Salix pupurea x daphnoides | bark | study medication | ethanolic (70%) extract2 | 10‐20:1 | 1360 | salicin | 240 mg | |
| Uncaria guianensis | bark | study medication | freeze‐dried aqueous extract | not stated | 100 | not stated | ||
| Vitellaria paradoxa | seed | study medication | patented extract | not stated | 2250 | triterpenes | 75% | |
| Zingiber officinale3 | root | EV.EXT 33 | acetone extract3 | 20:1 | 510 | not stated | ||
| Zingiber officinale | root | Zintona EC | CO2 extract | not stated | 1000 | gingerol | 40 mg | |
| Medicinal products from two plants | ||||||||
| Boswellia carteri + Curcuma longa | gum + root | study medication | extract, solvent not stated | not stated | not stated | boswellic acid | 37.5% | |
| Persea gratissma (P) + Glycine max (G) | oils | Piascledine 300 | unsaponifiable fraction 1/3 P;2/3 G | 300 or 600 | not stated | Appelboom 2001, Blotman 1997, Lequesne 2002, Maheu 1998, Maheu 2013. | ||
| Phellondenron amurense + Citrus sinensis | bark peel | NP 06‐1 | extract, solvent not stated | not stated | 370 mixture | berberine polymethoxylated flavones | 50% 30% | |
| Uncaria guianensis + Lepidium meyenii | bark | Reparagen® | freeze‐dried aqueous extract | not stated | 1500 300 | not stated | ||
| Zingiber officinale + Alpinia galanga | root | EV.EXT 77 | acetone extract3 | 20:1 | not stated | not stated | ||
| Medicinal products from three or more plants | ||||||||
| Clematis mandshurica + Prunella vulgaris + Trichosanthes kirilowii | root, flower, root; 1:1:2 | SKI306X | ethanol 30% extracts, thereafter butanol extraction | 7:1 | 600‐1800 | oleanolic acid 4%, rosmarinic acids 0.2%, ursolic acids 0.5%, hydroxybenzoic acid 0.03%, | ||
| Fraxinus excelsior | bark | Phytodolor | fresh plant ethanolic (45,6%) extract | 3:1:1 | 5‐8 ml | total flavonoids | 0.34 ‐ 0.56 mg | |
| salicyl alcohol | 0.48 ‐ 0.8 mg | |||||||
| Solidago virgaurea | herb | isofraxidin | 0.67 ‐ 1.1 mg | |||||
| Populus tremula | bark and leaf | salicin | 4.8 ‐ 8 mg | |||||
| Salix alba | bark | Reumalex | powder | 200 | salicin | 40‐80mg | ||
| Guaiacun officinale | resin | powder | 80 | |||||
| Cimicifuga racemosa | root | powder | 70 | |||||
| Smilax (species not stated) | root | extract, solvent not stated | 4:1 | 50 | ||||
| Populus (species not stated) | bark | extract, solvent not stated | 7:1 | 34 | ||||
| Chinese mixture4 | herb | Duhuo Jisheng Wan | powder | 3 x 3 g | not stated | |||
| Paeoniae alba | root | Chinese mixture: Blood nourishing, hard softening (BNHS) | extract, solvent not stated | not stated | 3150 | paconiflorin | not stated | |
| Gentiana macrophylla | gentianine | |||||||
| Glycyrrhiza (species not stated) | not stated | |||||||
| Auryvedic formaulae5 | powder | not stated | 1000 | total gingerols | not stated | |||
| Zingiber officinale | rhizome | component of formulae A, B, C, D, and E | ||||||
| Tinospora cordifolia | stem | component of formulae A, B, C, D, and E | aqueous extract | 220 | tinosporosides | not stated | ||
| Withania somnifera | root | component of formulae B and E | aqueous extract | 600 | total withanolides | not stated | ||
| Emblica officinale | fruit | component of formulae C | aqueous extract | 500 | tannins galic acid | not stated | ||
| Tribulus terrestris | fruit | component of formulae A and B | aqueous extract | 216 | total saponins | not stated | ||
| Ayuvedic formula6 | Antarth3 (for sandhigata vata) | not stated | not stated | not stated | not stated | |||
| Ayuvedic formula | RA‐11 | not stated | not stated | not stated | not stated | |||
| Ayuvedic formula | SGC | |||||||
| Ayuvedic | SGCG | |||||||
| Japanese mixture7 | Boiogito | not stated | not stated | 7.5g | not stated | not stated | ||
| 1. Harpagoside content estimated indirectly and approximately from iridoid glycoside content in daily dose of raw material (Sporer 1999). 2. Ethanolic extract stated in unpublished thesis but not in published paper (Schmid 1998b). 3. Information provided by manufacturer but not reported in paper. 4. Chinese herbal medicine contains 7.75% each of: radix angelicae pubescentiis, radix gentianae macrophyllae, cortex eucommiae, radix achyranthis bidentatae, radix angelicae sinensis, herba taxilli, radix rehmanniae preparata, rhizoma chuanxiong, cortex cinnamomi, radix ledebouriellae. 5% each of: radix paeoniae alba, radix codonopis, radix glycyrrhizae, poria. 2.5% herba asari. 5. All Ayurvedic formulae A‐E contain Zingiber officinale (dried rhizome powder, total gingerols as marker), and Tinospora cordifolia (dried stem aqueous extract, marker tinosporosides). Some formulae also included Emblica officinale, Withania somnifera, or Tribulus terrestris. Drug:extract ratio and marker content not stated. 6. Ayurvedic phytomedicine Antarth contains Boswellia serrata, Commiphora mukul, Curcuma longa and Vitex negundo, Alpinia galangal, Withania somnifera, Tribulus terrestris, and Tinospora cordifolia. 7. Japanese herbal medicine Boiogito contains Sinomenium acutum, Astragalus (species not stated) root, Atractylodes lancea rhizome, Jujube (probably Ziziphus zizyphus), Glycyrrhiza (species not stated), and ginger (species not stated, probably Zingiber officinale). | ||||||||
| Outcome or subgroup title | No. of studies | No. of participants | Statistical method | Effect size |
| 1 Pain (0 to 3) Show forest plot | 1 | Mean Difference (IV, Random, 95% CI) | Totals not selected | |
| 2 Function: loss of function (0 to 3) Show forest plot | 1 | Mean Difference (IV, Random, 95% CI) | Totals not selected | |
| 3 Participants (n) reported adverse effects Show forest plot | 1 | Risk Ratio (M‐H, Random, 95% CI) | Totals not selected | |
| Outcome or subgroup title | No. of studies | No. of participants | Statistical method | Effect size |
| 1 Pain VAS 0‐100 at 90 days Show forest plot | 2 | 85 | Mean Difference (IV, Random, 95% CI) | ‐16.57 [‐24.67, ‐8.47] |
| 2 WOMAC‐VAS (Function) Show forest plot | 2 | 85 | Mean Difference (IV, Random, 95% CI) | ‐8.21 [‐14.21, ‐2.22] |
| 3 Adverse event episodes (n) reported Show forest plot | 1 | Risk Ratio (M‐H, Random, 95% CI) | Totals not selected | |
| Outcome or subgroup title | No. of studies | No. of participants | Statistical method | Effect size |
| 1 Pain VAS 0‐100 at 90 days Show forest plot | 1 | Mean Difference (IV, Random, 95% CI) | Totals not selected | |
| 2 WOMAC‐VAS (Function) Show forest plot | 1 | Mean Difference (IV, Random, 95% CI) | Totals not selected | |
| 3 Adverse event episodes (n) reported Show forest plot | 1 | Risk Ratio (M‐H, Random, 95% CI) | Totals not selected | |
| Outcome or subgroup title | No. of studies | No. of participants | Statistical method | Effect size |
| 1 Pain VAS 0‐100 Show forest plot | 2 | 97 | Mean Difference (IV, Random, 95% CI) | ‐16.09 [‐20.37, ‐11.81] |
| 1.1 At 90 days | 1 | 38 | Mean Difference (IV, Random, 95% CI) | ‐18.10 [‐24.95, ‐11.25] |
| 1.2 At 30 days | 1 | 59 | Mean Difference (IV, Random, 95% CI) | ‐14.80 [‐20.29, ‐9.31] |
| 2 WOMAC‐VAS (Function) Show forest plot | 2 | 97 | Mean Difference (IV, Random, 95% CI) | ‐15.01 [‐19.21, ‐10.81] |
| 2.1 At 30 days | 1 | 59 | Mean Difference (IV, Random, 95% CI) | ‐14.30 [‐20.07, ‐8.53] |
| 2.2 At 90 days | 1 | 38 | Mean Difference (IV, Random, 95% CI) | ‐15.8 [‐21.92, ‐9.68] |
| 3 Participants (n) reported adverse events Show forest plot | 2 | 97 | Odds Ratio (M‐H, Random, 95% CI) | 0.98 [0.13, 7.29] |
| 3.1 At 30 days | 1 | 59 | Odds Ratio (M‐H, Random, 95% CI) | 0.97 [0.06, 16.20] |
| 3.2 At 90 days | 1 | 38 | Odds Ratio (M‐H, Random, 95% CI) | 1.0 [0.06, 17.25] |
| Outcome or subgroup title | No. of studies | No. of participants | Statistical method | Effect size |
| 1 WOMAC‐VAS (Pain) Show forest plot | 1 | 58 | Mean Difference (IV, Random, 95% CI) | ‐0.51 [‐7.26, 6.24] |
| 2 WOMAC‐VAS (Function) Show forest plot | 1 | 58 | Mean Difference (IV, Random, 95% CI) | 2.49 [‐4.07, 9.05] |
| 3 Participants (n) reported adverse events Show forest plot | 1 | 66 | Risk Ratio (M‐H, Random, 95% CI) | 2.0 [0.39, 10.18] |
| 4 Participants (n) withdrew due to adverse events Show forest plot | 1 | 66 | Risk Ratio (M‐H, Random, 95% CI) | 3.0 [0.13, 71.07] |
| Outcome or subgroup title | No. of studies | No. of participants | Statistical method | Effect size |
| 1 Pain on walking NRS 0‐10 Show forest plot | 1 | Mean Difference (IV, Random, 95% CI) | Subtotals only | |
| 2 Function: 100m walk time (seconds) Show forest plot | 1 | Mean Difference (IV, Random, 95% CI) | Subtotals only | |
| 3 Participants (n) reported adverse events Show forest plot | 1 | 100 | Risk Ratio (M‐H, Random, 95% CI) | 0.75 [0.46, 1.25] |
| Outcome or subgroup title | No. of studies | No. of participants | Statistical method | Effect size |
| 1 WOMAC‐VAS (Pain) change from baseline Show forest plot | 1 | 107 | Mean Difference (IV, Random, 95% CI) | 5.0 [‐1.84, 11.84] |
| 2 WOMAC‐VAS (Function) change from baseline Show forest plot | 1 | 107 | Mean Difference (IV, Random, 95% CI) | 5.10 [‐0.13, 10.33] |
| 3 Participants (n) reported adverse events. Show forest plot | 1 | 125 | Risk Ratio (M‐H, Random, 95% CI) | 0.75 [0.49, 1.15] |
| Outcome or subgroup title | No. of studies | No. of participants | Statistical method | Effect size |
| 1 Pain VAS 0‐100 change from baseline at 120 days Show forest plot | 1 | 92 | Mean Difference (IV, Random, 95% CI) | ‐5.10 [‐6.52, ‐3.68] |
| 2 Participants (n) reported adverse events Show forest plot | 1 | 92 | Risk Ratio (M‐H, Random, 95% CI) | 0.4 [0.21, 0.75] |
| Outcome or subgroup title | No. of studies | No. of participants | Statistical method | Effect size |
| 1 Pain (scale unknown) with mvt change from baseline Show forest plot | 1 | 40 | Mean Difference (IV, Random, 95% CI) | ‐0.10 [‐1.31, 1.11] |
| 2 Participants (n) reported adverse events Show forest plot | 1 | 40 | Risk Ratio (M‐H, Random, 95% CI) | 1.5 [0.28, 8.04] |
| Outcome or subgroup title | No. of studies | No. of participants | Statistical method | Effect size |
| 1 WOMAC‐VAS (Pain) Show forest plot | 1 | 37 | Mean Difference (IV, Random, 95% CI) | ‐142.0 [‐199.55, ‐84.45] |
| 2 WOMAC‐VAS (Function) Show forest plot | 1 | 37 | Mean Difference (IV, Random, 95% CI) | ‐529.0 [‐741.59, ‐316.41] |
| 3 Participants (n) reported adverse events Show forest plot | 2 | 137 | Risk Ratio (M‐H, Random, 95% CI) | 0.40 [0.08, 1.97] |
| Outcome or subgroup title | No. of studies | No. of participants | Statistical method | Effect size |
| 1 WOMAC 0‐4 (Pain) Show forest plot | 1 | 156 | Mean Difference (IV, Random, 95% CI) | ‐7.50 [‐8.43, ‐6.57] |
| 2 WOMAC 0‐4 (Function) Show forest plot | 1 | 156 | Mean Difference (IV, Random, 95% CI) | ‐29.3 [‐30.99, ‐27.61] |
| Outcome or subgroup title | No. of studies | No. of participants | Statistical method | Effect size |
| 1 Participants (n) reported adverse events Show forest plot | 1 | 100 | Risk Ratio (M‐H, Random, 95% CI) | 0.04 [0.00, 0.66] |
| Outcome or subgroup title | No. of studies | No. of participants | Statistical method | Effect size |
| 1 Relief of pain (0 to 4) at 3 months Show forest plot | 1 | 97 | Mean Difference (IV, Random, 95% CI) | 0.43 [‐0.12, 0.98] |
| 2 WOMAC‐VAS (Pain) Show forest plot | 1 | 94 | Mean Difference (IV, Random, 95% CI) | ‐2.5 [‐10.20, 5.20] |
| 3 WOMAC‐VAS (Function) Show forest plot | 1 | 94 | Mean Difference (IV, Random, 95% CI) | ‐1.20 [‐8.98, 6.58] |
| 4 Participants (n) reported adverse events Show forest plot | 2 | 194 | Risk Ratio (M‐H, Random, 95% CI) | 1.67 [0.63, 4.43] |
| Outcome or subgroup title | No. of studies | No. of participants | Statistical method | Effect size |
| 1 Pain VAS 0‐100 at 14 days Show forest plot | 1 | 68 | Mean Difference (IV, Random, 95% CI) | 0.0 [0.0, 0.0] |
| 2 Function VAS 0‐100 at 14 days Show forest plot | 1 | 68 | Mean Difference (IV, Random, 95% CI) | 0.0 [0.0, 0.0] |
| 3 Participants (n) reported adverse events Show forest plot | 1 | 84 | Risk Ratio (M‐H, Random, 95% CI) | 0.91 [0.57, 1.43] |
| Outcome or subgroup title | No. of studies | No. of participants | Statistical method | Effect size |
| 1 WOMAC‐VAS (Pain) Show forest plot | 1 | Mean Difference (IV, Random, 95% CI) | Subtotals only | |
| 1.1 At 14 days | 1 | 86 | Mean Difference (IV, Random, 95% CI) | 0.0 [0.0, 0.0] |
| 1.2 At 42 days | 1 | 86 | Mean Difference (IV, Random, 95% CI) | 15.0 [5.91, 24.09] |
| 2 WOMAC‐VAS (Function) Show forest plot | 1 | Mean Difference (IV, Random, 95% CI) | Subtotals only | |
| 2.1 At 14 days | 1 | 86 | Mean Difference (IV, Random, 95% CI) | 0.0 [0.0, 0.0] |
| 2.2 At 42 days | 1 | 86 | Mean Difference (IV, Random, 95% CI) | 12.0 [2.70, 21.30] |
| 3 Participants (n) reported adverse events Show forest plot | 1 | 86 | Risk Ratio (M‐H, Random, 95% CI) | 0.63 [0.43, 0.93] |
| Outcome or subgroup title | No. of studies | No. of participants | Statistical method | Effect size |
| 1 Pain VAS 0‐100 (night) Show forest plot | 1 | 45 | Mean Difference (IV, Random, 95% CI) | ‐11.10 [‐26.44, 4.24] |
| 2 Participants (n) reported adverse events Show forest plot | 1 | 45 | Risk Ratio (M‐H, Random, 95% CI) | 1.67 [0.54, 5.17] |
| Outcome or subgroup title | No. of studies | No. of participants | Statistical method | Effect size |
| 1 Pain VAS 0‐100 (movement) Show forest plot | 1 | 24 | Mean Difference (IV, Random, 95% CI) | ‐9.0 [‐31.12, 13.12] |
| 2 Function (handicap) VAS 0‐100 Show forest plot | 1 | 24 | Mean Difference (IV, Random, 95% CI) | ‐6.0 [‐27.25, 15.25] |
| 3 Participants (n) reported adverse events Show forest plot | 1 | 24 | Risk Ratio (M‐H, Random, 95% CI) | 3.5 [0.16, 78.19] |
| Outcome or subgroup title | No. of studies | No. of participants | Statistical method | Effect size |
| 1 Function: pain free walking time (minutes) Show forest plot | 1 | Mean Difference (IV, Random, 95% CI) | Totals not selected | |
| 1.1 At 1 month | 1 | Mean Difference (IV, Random, 95% CI) | 0.0 [0.0, 0.0] | |
| 1.2 At 2 months | 1 | Mean Difference (IV, Random, 95% CI) | 0.0 [0.0, 0.0] | |
| 1.3 At 3 months | 1 | Mean Difference (IV, Random, 95% CI) | 0.0 [0.0, 0.0] | |
| Outcome or subgroup title | No. of studies | No. of participants | Statistical method | Effect size |
| 1 Pain VAS 0‐100 Show forest plot | 4 | 651 | Mean Difference (IV, Random, 95% CI) | ‐8.47 [‐15.90, ‐1.04] |
| 1.1 At 3 months | 2 | 326 | Mean Difference (IV, Random, 95% CI) | ‐11.90 [‐23.95, 0.15] |
| 1.2 At 6 months | 1 | 162 | Mean Difference (IV, Random, 95% CI) | ‐10.40 [‐17.20, ‐3.60] |
| 1.3 At 12 months | 1 | 163 | Mean Difference (IV, Random, 95% CI) | 1.0 [‐6.58, 8.58] |
| 2 Pain VAS 0‐100 change from baseline at 36 months Show forest plot | 1 | 345 | Mean Difference (IV, Random, 95% CI) | ‐0.66 [‐7.39, 6.07] |
| 3 Pain VAS 0‐100 grouped by joint Show forest plot | 1 | 324 | Mean Difference (IV, Random, 95% CI) | ‐9.06 [‐15.24, ‐2.88] |
| 3.1 VAS (hip OA) | 1 | 162 | Mean Difference (IV, Random, 95% CI) | ‐13.80 [‐25.22, ‐2.38] |
| 3.2 VAS (knee OA) | 1 | 162 | Mean Difference (IV, Random, 95% CI) | ‐7.10 [‐14.45, 0.25] |
| 4 Function: disability VAS 0‐100 Show forest plot | 1 | Mean Difference (IV, Random, 95% CI) | Totals not selected | |
| 5 WOMAC‐VAS (Function) change from baseline at 36 months Show forest plot | 1 | 345 | Mean Difference (IV, Random, 95% CI) | ‐1.0 [‐7.14, 5.14] |
| 6 Lequesne algofunctional index Show forest plot | 3 | 480 | Mean Difference (IV, Random, 95% CI) | ‐1.17 [‐2.54, 0.20] |
| 6.1 At 3 months | 2 | 317 | Mean Difference (IV, Random, 95% CI) | ‐1.80 [‐2.68, ‐0.92] |
| 6.2 At 12 months | 1 | 163 | Mean Difference (IV, Random, 95% CI) | 0.10 [‐0.78, 0.98] |
| 7 Function (various tools) Show forest plot | 4 | 642 | Std. Mean Difference (IV, Random, 95% CI) | ‐0.42 [‐0.73, ‐0.11] |
| 8 Participants (n) reported adverse events Show forest plot | 5 | 1050 | Risk Ratio (M‐H, Random, 95% CI) | 1.04 [0.97, 1.12] |
| 9 Participants (n) withdrew due to adverse events Show forest plot | 1 | 398 | Risk Ratio (M‐H, Random, 95% CI) | 1.14 [0.73, 1.80] |
| 10 Particpants (n) reported serious adverse events Show forest plot | 1 | 398 | Risk Ratio (M‐H, Random, 95% CI) | 1.22 [0.94, 1.59] |
| 11 JSW change from baseline Show forest plot | 2 | 453 | Mean Difference (IV, Random, 95% CI) | ‐0.12 [‐0.43, 0.19] |
| 11.1 < median group, at 24 months | 1 | 55 | Mean Difference (IV, Random, 95% CI) | ‐0.43 [‐0.73, ‐0.13] |
| 11.2 > median group, at 24 months | 1 | 53 | Mean Difference (IV, Random, 95% CI) | 0.16 [‐0.31, 0.63] |
| 11.3 At 36 months | 1 | 345 | Mean Difference (IV, Random, 95% CI) | ‐0.03 [‐0.22, 0.16] |
| Outcome or subgroup title | No. of studies | No. of participants | Statistical method | Effect size |
| 1 Pain VAS 0‐100 Show forest plot | 1 | 156 | Mean Difference (IV, Random, 95% CI) | ‐14.2 [‐20.82, ‐7.58] |
| 2 Lequesne algofunctional index Show forest plot | 1 | 156 | Mean Difference (IV, Random, 95% CI) | ‐1.30 [‐2.38, ‐0.22] |
| 3 Participants (n) reported adverse events Show forest plot | 1 | 174 | Risk Ratio (M‐H, Random, 95% CI) | 1.07 [0.66, 1.74] |
| Outcome or subgroup title | No. of studies | No. of participants | Statistical method | Effect size |
| 1 WOMAC‐VAS (Pain) Show forest plot | 1 | Mean Difference (IV, Random, 95% CI) | Totals not selected | |
| 2 WOMAC‐VAS (Function) Show forest plot | 1 | Mean Difference (IV, Random, 95% CI) | Totals not selected | |
| 3 Participants (n) reported adverse events Show forest plot | 1 | 357 | Risk Ratio (M‐H, Random, 95% CI) | 0.86 [0.59, 1.26] |
| 4 Paricipants (n) reported serious adverse events Show forest plot | 1 | 357 | Risk Ratio (M‐H, Random, 95% CI) | 2.92 [0.31, 27.78] |
| Outcome or subgroup title | No. of studies | No. of participants | Statistical method | Effect size |
| 1 Lequesne algofunctional index Show forest plot | 1 | 45 | Mean Difference (IV, Random, 95% CI) | ‐3.82 [‐7.05, ‐0.59] |
| 1.1 Normal BMI participants | 1 | 18 | Mean Difference (IV, Random, 95% CI) | ‐2.2 [‐3.37, ‐1.03] |
| 1.2 Overweight BMI participants | 1 | 27 | Mean Difference (IV, Random, 95% CI) | ‐5.50 [‐6.95, ‐4.05] |
| Outcome or subgroup title | No. of studies | No. of participants | Statistical method | Effect size |
| 1 Participants (n) reported adverse events Show forest plot | 1 | 95 | Risk Ratio (M‐H, Random, 95% CI) | 0.77 [0.18, 3.24] |
| Outcome or subgroup title | No. of studies | No. of participants | Statistical method | Effect size |
| 1 Pain immediately after walking 50 feet VAS 0‐100 Show forest plot | 1 | 247 | Mean Difference (IV, Random, 95% CI) | ‐9.60 [‐16.81, ‐2.39] |
| 2 WOMAC‐VAS (Function) Show forest plot | 1 | Mean Difference (IV, Random, 95% CI) | Totals not selected | |
| 3 Participants (n) reported adverse events Show forest plot | 1 | Risk Ratio (M‐H, Random, 95% CI) | Totals not selected | |
| Outcome or subgroup title | No. of studies | No. of participants | Statistical method | Effect size |
| 1 Pain VAS 0‐100 change from baseline Show forest plot | 1 | Mean Difference (IV, Random, 95% CI) | Subtotals only | |
| 1.1 Low dose (600mg) SKI306X | 1 | 47 | Mean Difference (IV, Random, 95% CI) | ‐16.1 [‐25.19, ‐7.01] |
| 1.2 Medium dose (1200mg) SKI306X | 1 | 46 | Mean Difference (IV, Random, 95% CI) | ‐14.5 [‐23.04, ‐5.96] |
| 1.3 High dose (1800mg) SKI306X | 1 | 46 | Mean Difference (IV, Random, 95% CI) | ‐22.3 [‐31.82, ‐12.78] |
| 2 Lequesne algofunctional index change from baseline Show forest plot | 1 | 139 | Mean Difference (IV, Random, 95% CI) | ‐2.73 [‐3.71, ‐1.74] |
| 2.1 Low dose (600mg) SKI306X | 1 | 47 | Mean Difference (IV, Random, 95% CI) | ‐2.40 [‐4.05, ‐0.75] |
| 2.2 Medium dose (1200mg) SKI306X | 1 | 46 | Mean Difference (IV, Random, 95% CI) | ‐2.8 [‐4.62, ‐0.98] |
| 2.3 High dose (1800mg) SKI306X | 1 | 46 | Mean Difference (IV, Random, 95% CI) | ‐3.0 [‐4.68, ‐1.32] |
| 3 Participants (n) reported adverse events Show forest plot | 2 | 139 | Risk Ratio (M‐H, Random, 95% CI) | 0.93 [0.49, 1.79] |
| 3.1 Low dose (600mg) SKI306X | 1 | 47 | Risk Ratio (M‐H, Random, 95% CI) | 0.96 [0.32, 2.88] |
| 3.2 Medium dose (1200mg) SKI306X | 1 | 46 | Risk Ratio (M‐H, Random, 95% CI) | 1.2 [0.43, 3.38] |
| 3.3 High dose (1800mmg) SKI306X | 1 | 46 | Risk Ratio (M‐H, Random, 95% CI) | 0.6 [0.16, 2.22] |
| Outcome or subgroup title | No. of studies | No. of participants | Statistical method | Effect size |
| 1 Pain VAS 0‐100 change from baseline Show forest plot | 1 | 249 | Mean Difference (IV, Random, 95% CI) | 1.31 [‐2.78, 5.40] |
| 2 Lequesne algofunctional index change from baseline Show forest plot | 1 | 249 | Mean Difference (IV, Random, 95% CI) | 0.77 [0.10, 1.44] |
| 3 Participants (n) reported adverse events Show forest plot | 1 | 249 | Risk Ratio (M‐H, Random, 95% CI) | 0.61 [0.38, 0.97] |
| Outcome or subgroup title | No. of studies | No. of participants | Statistical method | Effect size |
| 1 Enduring pain (0 to 3) Show forest plot | 1 | 72 | Mean Difference (IV, Random, 95% CI) | 0.0 [0.0, 0.0] |
| 2 Function: mobility limitations (0 to 3) Show forest plot | 1 | 72 | Mean Difference (IV, Random, 95% CI) | 0.0 [0.0, 0.0] |
| 3 Participants (n) reported adverse events Show forest plot | 3 | 140 | Risk Ratio (M‐H, Random, 95% CI) | 0.33 [0.01, 7.92] |
| Outcome or subgroup title | No. of studies | No. of participants | Statistical method | Effect size |
| 1 AIMS2 arthritis pain score change from baseline Show forest plot | 1 | 52 | Mean Difference (IV, Random, 95% CI) | ‐0.89 [‐1.73, ‐0.05] |
| 2 Participants (n) reported adverse events Show forest plot | 1 | 52 | Risk Ratio (M‐H, Random, 95% CI) | 1.08 [0.40, 2.91] |
| Outcome or subgroup title | No. of studies | No. of participants | Statistical method | Effect size |
| 1 Pain VAS 0‐100 (total) Show forest plot | 1 | 200 | Mean Difference (IV, Random, 95% CI) | 11.81 [‐9.67, 33.29] |
| 2 Lequesne algofunctional index Show forest plot | 1 | 200 | Mean Difference (IV, Random, 95% CI) | 0.28 [‐0.89, 1.45] |
| 3 Participants (n) reported adverse events Show forest plot | 1 | 200 | Risk Ratio (M‐H, Random, 95% CI) | 1.04 [0.66, 1.63] |
| Outcome or subgroup title | No. of studies | No. of participants | Statistical method | Effect size |
| 1 Pain VAS 0‐100 (walking) Show forest plot | 1 | 60 | Mean Difference (IV, Random, 95% CI) | 2.0 [‐7.12, 11.12] |
| 2 WOMAC‐VAS (Function) Show forest plot | 1 | 60 | Mean Difference (IV, Random, 95% CI) | ‐2.0 [‐7.57, 3.57] |
| 3 Participants (n) reported adverse events Show forest plot | 1 | 60 | Risk Ratio (M‐H, Random, 95% CI) | 9.00 [0.51, 160.17] |
| Outcome or subgroup title | No. of studies | No. of participants | Statistical method | Effect size |
| 1 Pain VAS 0‐100 (walking) Show forest plot | 1 | 60 | Mean Difference (IV, Random, 95% CI) | ‐2.0 [‐6.81, 2.81] |
| 2 WOMAC‐VAS (Function) Show forest plot | 1 | 60 | Mean Difference (IV, Random, 95% CI) | 0.0 [‐2.53, 2.53] |
| 3 Participants (n) reported adverse events Show forest plot | 1 | 60 | Risk Ratio (M‐H, Random, 95% CI) | 9.00 [0.51, 160.17] |
| Outcome or subgroup title | No. of studies | No. of participants | Statistical method | Effect size |
| 1 Adverse event episodes (n) reported Show forest plot | 1 | 454 | Risk Ratio (M‐H, Random, 95% CI) | 0.95 [0.71, 1.28] |
| 1.1 Formula A versus placebo | 1 | 90 | Risk Ratio (M‐H, Random, 95% CI) | 0.96 [0.63, 1.45] |
| 1.2 Formula B versus placebo | 1 | 108 | Risk Ratio (M‐H, Random, 95% CI) | 1.35 [0.92, 1.98] |
| 1.3 Formula C versus placebo | 1 | 82 | Risk Ratio (M‐H, Random, 95% CI) | 0.78 [0.50, 1.21] |
| 1.4 Formula D versus placebo | 1 | 72 | Risk Ratio (M‐H, Random, 95% CI) | 0.57 [0.34, 0.93] |
| 1.5 Formula E versus placebo | 1 | 102 | Risk Ratio (M‐H, Random, 95% CI) | 1.22 [0.82, 1.80] |
| Outcome or subgroup title | No. of studies | No. of participants | Statistical method | Effect size |
| 1 Pain VAS 0‐100 Show forest plot | 1 | 88 | Mean Difference (IV, Random, 95% CI) | ‐1.0 [‐9.79, 7.79] |
| Outcome or subgroup title | No. of studies | No. of participants | Statistical method | Effect size |
| 1 Pain VAS 0‐100 Show forest plot | 1 | 90 | Mean Difference (IV, Random, 95% CI) | ‐1.03 [‐1.18, ‐0.88] |
| 2 WOMAC 0‐4 (Function) Show forest plot | 1 | 90 | Mean Difference (IV, Random, 95% CI) | ‐5.80 [‐6.72, ‐4.88] |
| 3 Participants (n) reported adverse events Show forest plot | 1 | 90 | Risk Ratio (M‐H, Random, 95% CI) | 1.05 [0.69, 1.58] |
| Outcome or subgroup title | No. of studies | No. of participants | Statistical method | Effect size |
| 1 Pain VAS 0‐100 change from baseline Show forest plot | 1 | 220 | Mean Difference (IV, Random, 95% CI) | 3.0 [‐3.28, 9.28] |
| 2 WOMAC 0‐4 (Function) change from baseline Show forest plot | 1 | 220 | Mean Difference (IV, Random, 95% CI) | 2.0 [‐0.72, 4.72] |
| 3 Participants (n) reported adverse events Show forest plot | 1 | 210 | Odds Ratio (M‐H, Random, 95% CI) | 1.04 [0.58, 1.86] |
| Outcome or subgroup title | No. of studies | No. of participants | Statistical method | Effect size |
| 1 Pain VAS 0‐100 change from baseline Show forest plot | 1 | 220 | Mean Difference (IV, Random, 95% CI) | ‐3.0 [‐8.98, 2.98] |
| 2 WOMAC 0‐4 (Function) change from baseline Show forest plot | 1 | 220 | Mean Difference (IV, Random, 95% CI) | 1.0 [‐1.60, 3.60] |
| 3 Participants (n) reported adverse events Show forest plot | 1 | 207 | Odds Ratio (M‐H, Random, 95% CI) | 1.00 [0.56, 1.79] |
| Outcome or subgroup title | No. of studies | No. of participants | Statistical method | Effect size |
| 1 Pain VAS 0‐100 change from baseline Show forest plot | 1 | 220 | Mean Difference (IV, Random, 95% CI) | 4.0 [‐1.42, 9.42] |
| 2 WOMAC 0‐4 (Function) change from baseline Show forest plot | 1 | 220 | Mean Difference (IV, Random, 95% CI) | 1.38 [‐1.40, 4.16] |
| 3 Participants (n) reported adverse events Show forest plot | 1 | 211 | Odds Ratio (M‐H, Random, 95% CI) | 0.85 [0.47, 1.54] |
| Outcome or subgroup title | No. of studies | No. of participants | Statistical method | Effect size |
| 1 Pain VAS 0‐100 change from baseline Show forest plot | 1 | 220 | Mean Difference (IV, Random, 95% CI) | ‐2.0 [‐7.42, 3.42] |
| 2 WOMAC 0‐4 (Function) change from baseline Show forest plot | 1 | 220 | Mean Difference (IV, Random, 95% CI) | 0.19 [‐2.59, 2.97] |
| 3 Participants (n) reported adverse events Show forest plot | 1 | 208 | Odds Ratio (M‐H, Random, 95% CI) | 0.82 [0.45, 1.48] |
| Outcome or subgroup title | No. of studies | No. of participants | Statistical method | Effect size |
| 1 Pain: Knee Society Rating System 0‐100 (knee) Show forest plot | 1 | 47 | Mean Difference (IV, Random, 95% CI) | ‐1.30 [‐8.90, 6.30] |
| 2 Function: Knee Society Rating System 0‐50 (stairs) Show forest plot | 1 | 47 | Mean Difference (IV, Random, 95% CI) | 3.60 [0.51, 6.69] |
| 3 Participants (n) reported adverse events Show forest plot | 1 | 47 | Risk Ratio (M‐H, Random, 95% CI) | 2.88 [0.12, 67.29] |