Tratamientos orales a base de hierbas para la artrosis
References
Referencias de los estudios incluidos en esta revisión
Referencias de los estudios excluidos de esta revisión
Referencias de los estudios en espera de evaluación
Referencias adicionales
Referencias de otras versiones publicadas de esta revisión
Characteristics of studies
Characteristics of included studies [ordered by study ID]
Jump to:
| Methods | Randomised, double‐blind, placebo and active controls, 4 parallel groups, single centre study. Duration 6 weeks | |
| Participants | Randomised n=143, Completed n=84. Mean age: placebo control 53.2 yrs, active control 1 (naproxen 1000mg) 51.0 yrs, active control 2 (Celebrex 400mg) 52.5 yrs, intervention 54.1 yrs. M:F placebo control 7:14, active control A 6:15, active control B 6:15, intervention 5:16. Inclusion: primary or secondary OA knee (ACR criteria), pain at rest VAS 0‐100 >45mm at baseline | |
| Interventions | Tradename not provided: Garcinia kola 400mg (2 x 200mg), tablets Active control A: naproxen 1000mg (2 x 500mg), tablets Active control B: celecoxib (Celebrex) 400mg (2 x 200mg), tablets Placebo control: ascorbic acid 200mg (2 x 100g), tablets | |
| Outcomes | WOMAC‐VAS (Pain), WOMAC 0‐4 (Function), walking distance, time to pain relief | |
| Notes | Exploratory study design; power, effect, and sample size not determined a priori. Reported ethics committee approval. Results favour intervention and active controls over placebo. Reductions in pain were not significantly different between Garcinia kola and the active controls, although onset of pain relief was most rapid and most persistent in the celebrex group. | |
| Risk of bias | ||
| Bias | Authors' judgement | Support for judgement |
| Random sequence generation (selection bias) | Low risk | Randomised in blocks of four within each stratum, using computer generated random number sequences |
| Allocation concealment (selection bias) | Low risk | Adequate allocation concealment: Medications prepared by nursing staff, administered by blinded senior orthopaedic registrar |
| Blinding (performance bias and detection bias) | Low risk | Active intervention, placebo, and active controls not distinguished by look, taste, smell, packaging, or medication regimen. Baseline and outcome assessor blinded to allocations |
| Incomplete outcome data (attrition bias) | Unclear risk | Reported withdrawals (low risk) Per protocol analysis only (unclear risk) |
| Selective reporting (reporting bias) | Unclear risk | Outcome data reported as change scores, percentages, confidence intervals, and P values only, insufficient for extraction (unclear risk). WOMAC subscales for pain and physical function used independently, and in different forms (VAS and 0‐4). Reported adverse events (low risk) |
| Other bias | Low risk | Diagnosis and assessment consistent with ACR criteria |
| Methods | Randomised, double‐blind, placebo control, 2 parallel groups, 10 centre study. Duration 12 weeks | |
| Participants | Randomised n=261, Completed n=247. Mean age 65 yrs. M:F 37:63. Inclusion: OA knee stage II‐IV (ACR criteria), knee pain on standing 40‐90mm on VAS 100mm | |
| Interventions | EV.EXT 77: mixture of Zingiber officinale (ginger) and Alpina galanga (galangal) extracts, 510mg (2 x 255mg), capsules Placebo control: coconut oil, capsules Rescue medication permitted: acetominophen, up to 4000mg (4 x 2 x 500mg) daily PRN Concurrent medication permitted: aspirin, up to 325mg daily for anticoagulation | |
| Outcomes | Pain on standing, pain walking 50ft, WOMAC‐VAS (normalised units), SF‐12, patient global 1‐5 | |
| Notes | Confirmatory study design; statistical power not reported, but post‐hoc calculation of power based on sample size and design indicates adequate power to detect medium to large effects (if d=0.5, then P=0.97). Reported compliance with ICH GCP guidelines and ethics committee approval. Results favour intervention. | |
| Risk of bias | ||
| Bias | Authors' judgement | Support for judgement |
| Random sequence generation (selection bias) | Low risk | Randomised to one of two groups using a computer generated random number sequence |
| Allocation concealment (selection bias) | Low risk | Adequate allocation concealment can be inferred: "both the investigators and the patients were blinded to treatment assignment" |
| Blinding (performance bias and detection bias) | Low risk | Active intervention and placebo not distinguished by look, taste, smell, packaging, or medication regimen |
| Incomplete outcome data (attrition bias) | Low risk | Reported withdrawals Included intention‐to‐treat analysis |
| Selective reporting (reporting bias) | Low risk | Reported adverse events |
| Other bias | Low risk | Diagnosis and assessment consistent with ACR criteria |
| Methods | Randomised, double‐blind, placebo control, 3 parallel groups, multicentre study. Duration 90 days (˜12 weeks) | |
| Participants | Randomised n=260, Completed n=206. Age range 45‐80 yrs. M:F 55:205. Inclusion: OA knee (ACR criteria), VAS 0‐100 pain on standing 40‐90mm, baseline analgesia 90‐110mg diclofenac equivalents | |
| Interventions | Piascledine 300*: Persa gratissma and Glycine max, avocado / soyabean unsaponifiables, 300mg / 600mg, OD, tablets Placebo control: ingredients not reported | |
| Outcomes | NSAID use (diclofenac equivalents), days without NSAIDs, pain VAS 0‐100, Lesquesne index, patient efficacy assessment, clinician efficacy assessment, adverse events | |
| Notes | Confirmatory study; statistical power not reported, but post‐hoc calculation of power based on sample size and design indicates adequate power to detect medium to large effects (if Cohen's f=0.25, then P=0.90). Reported ethics committee approval. Results favour intervention. | |
| Risk of bias | ||
| Bias | Authors' judgement | Support for judgement |
| Random sequence generation (selection bias) | Unclear risk | Described as randomised, method not reported |
| Allocation concealment (selection bias) | Unclear risk | Allocation concealment not reported |
| Blinding (performance bias and detection bias) | Unclear risk | Described as double‐blind, method not reported |
| Incomplete outcome data (attrition bias) | Low risk | Reported withdrawals Included per protocol and intention‐to‐treat analyses |
| Selective reporting (reporting bias) | Low risk | Reported adverse events |
| Other bias | Low risk | Diagnosis and assessment consistent with ACR criteria |
| Methods | Randomised, double‐blind, placebo control, 3 parallel groups (intervention, placebo control, non‐intervention control). Erroneously described as "cross‐over trial". Duration 3 months (˜12 weeks) | |
| Participants | Randomised n=60; intervention n=30, placebo n=15, non‐intervention control n=15. Age and gender data not reported. Inclusion: OA knee (criteria not specified) | |
| Interventions | Tradename not provided. Boswellia‐curcuma extract mixture, 1500mg (3 x 500mg), capsules Placebo control: ingredients not reported | |
| Outcomes | Nocturnal pain, pain with active movement 0‐3, pain with passive movement 0‐3, tenderness 0‐3, knee effusion 0‐3, pain‐free walking time minutes, antioxidant enzyme SOD, free radical damage markers NO, nitrate, nitrite, and CD, CD4 | |
| Notes | Exploratory study design; power, effect, and sample size not determined a priori. Did not report ethical oversight or compliance with guidelines. Results favour intervention. | |
| Risk of bias | ||
| Bias | Authors' judgement | Support for judgement |
| Random sequence generation (selection bias) | Unclear risk | Described as randomised, method not reported. Group sizes dissimilar and likely to have been determined a priori |
| Allocation concealment (selection bias) | Unclear risk | Allocation concealment not reported |
| Blinding (performance bias and detection bias) | Unclear risk | Described as double‐blind, method not reported |
| Incomplete outcome data (attrition bias) | High risk | Withdrawals not reported. Age and gender data not reported |
| Selective reporting (reporting bias) | High risk | Described as a crossover trial, but method of crossover and data from second arm not reported. Considered as a parallel trial for this review (high risk) Adverse events not reported (high risk) Conclusion not supported by data: Reported efficacy and tolerability of boswellia‐curcumin as superior to diclofenac, but this trial did not include diclofenac as an active control (high risk) |
| Other bias | High risk | Diagnosis of OA not established at baseline (high risk) Unvalidated outcome measures (unclear risk) |
| Methods | Randomised, double‐blind, placebo control, 2 parallel group study. Duration 3 months (˜12 weeks) | |
| Participants | Randomised n=156; intervention n=77, control n=79. Completed n=143. Mean age: control 47.8 yrs, intervention 48.6 yrs. M:F: control 39:40, intervention 39:38. Inclusion: OA knee (radiographic criteria) | |
| Interventions | Pycnogenol®: Pinus pinaster, pine bark extract, 100mg (2 x 50mg), tablets Placebo control: ingredients not reported, tablets | |
| Outcomes | WOMAC 0‐4, mobility (treadmill walking) | |
| Notes | Confirmatory study design; statistical power 80%, alpha set at 0.05. Reported ethics committee approval and compliance with Declaration of Helsinki. Results favour intervention. | |
| Risk of bias | ||
| Bias | Authors' judgement | Support for judgement |
| Random sequence generation (selection bias) | Low risk | Participants allocated to treatment groups using randomisation by block allocation sequences created from a computer generated random number sequence |
| Allocation concealment (selection bias) | Low risk | Adequate allocation concealment can be inferred1 |
| Blinding (performance bias and detection bias) | Low risk | Described as double‐blind. Active intervention and placebo not distinguished by look, taste, smell or packaging |
| Incomplete outcome data (attrition bias) | Unclear risk | Reported withdrawals (low risk) Unclear whether analysis is per protocol or intention‐to‐treat (unclear risk) |
| Selective reporting (reporting bias) | Unclear risk | Adverse events reported generally, but not individually (unclear risk) Reported WOMAC subscale scores but no standard deviations: standard deviations computed from item scores for extraction and re‐analysis (unclear risk) |
| Other bias | Unclear risk | Diagnosis and assessment based on radiographic criteria only (unclear risk) |
| Methods | Randomised, double‐blind, placebo control, active control (unblinded), 3 parallel groups. Duration 4 weeks | |
| Participants | Randomised n=108; intervention n=36, placebo n=36, piroxicam n=36. Completed n=108. Mean age 52 yrs. M:F 22:50. Inclusion: OA (criteria not specified), acute or recurrent degenerative arthritic complaints | |
| Interventions | PhytodolorRN: standardised extract mixture of ash bark, aspen leaf, aspen bark, golden rod herb, 3 x 30 drops, tincture Active control: piroxicam (Feldene 20), 20mg, OD Placebo control: ingredients not reported Concurrent treatment permitted: balneology (thermal baths), and physiotherapy | |
| Outcomes | Pain with movement 0‐3, enduring pain 0‐3, mobility impairment 0‐3, finger‐ground distance, grip strength, PGA 0‐6, patient perception efficacy 0‐3 | |
| Notes | Exploratory study design; power, effect, and sample size not determined a priori. Did not report ethical oversight or compliance with guidelines. Results favour intervention. Some outcome measures (eg: finger‐ground distance) are non‐specific and may be of limited use in rheumatological assessment. | |
| Risk of bias | ||
| Bias | Authors' judgement | Support for judgement |
| Random sequence generation (selection bias) | Low risk | Randomised to one of three groups using a table of random numbers |
| Allocation concealment (selection bias) | Unclear risk | Allocation concealment not reported |
| Blinding (performance bias and detection bias) | Unclear risk | Described as double‐blind. In PhytodolorRN and placebo groups, active intervention and placebo not distinguished by look, taste, smell or packaging (low risk) Piroxicam group not blinded (unclear risk) |
| Incomplete outcome data (attrition bias) | Low risk | Reported no withdrawals (low risk) Intention‐to‐treat analysis can be assumed |
| Selective reporting (reporting bias) | Unclear risk | Most outcome data reported as change scores, percentages, graphs and p values only, insufficient for extraction (unclear risk) Reported adverse events (low risk) |
| Other bias | High risk | Diagnosis not based on ACR criteria. Non‐homogenous sample (any degenerative arthropathy, any site) (high risk) Unvalidated outcome measures (unclear risk) |
| Methods | Randomised, double‐blind, placebo control, active control, 3 parallel groups. Duration 6 weeks | |
| Participants | Randomised n=127, Completed n=106. Mean age 62 yrs. M:F 53:74. Inclusion: OA knee or hip (ACR criteria), WOMAC >30mm, aspirin 100mg/d | |
| Interventions | Assalix*: Salix daphnoides cortex (willow bark), ethanolic extract, 1572.96mg (2 x 2 x 393.24mg, equivalent to 240mg salicin), tablets Active control: diclofenac, 100mg (2 x 2 x 25mg), tablets Placebo control: ingredients not reported, tablets | |
| Outcomes | WOMAC‐VAS (normalised units), SF‐36, patient efficacy assessment VAS 0‐100, physician efficacy assessment VAS 0‐100, HAQ‐DI (German) | |
| Notes | Confirmatory study; statistical power 80%, alpha set at 0.05 (2 tailed). Reported compliance with ICH GCP guidelines and the Declaration of Helsinki. Results equivocal. | |
| Risk of bias | ||
| Bias | Authors' judgement | Support for judgement |
| Random sequence generation (selection bias) | Low risk | Randomised to one of three groups using a computer generated random number sequence |
| Allocation concealment (selection bias) | Low risk | Adequate allocation concealment can be inferred1. Authors contacted for confirmation, but details of allocation concealment not provided |
| Blinding (performance bias and detection bias) | Low risk | Described as double‐blind. Active interventions and placebo not distinguished by look, taste, smell, packaging, or medication regimen |
| Incomplete outcome data (attrition bias) | Low risk | Reported withdrawals. Included intention‐to‐treat and per protocol analyses |
| Selective reporting (reporting bias) | Unclear risk | Mid‐point data reported as mean scores only (no standard deviations), therefore not adequate for extraction and re‐analysis (unclear risk) Reported adverse events (low risk) |
| Other bias | Low risk | Diagnosis and assessment consistent with ACR criteria |
| Methods | Randomised, double‐blind, placebo control, 2 parallel groups. Duration 20 weeks | |
| Participants | Randomised n=78, Completed n=77. Age and gender data not reported. Inclusion: OA knee (ACR criteria) | |
| Interventions | LoHar 45 flexi‐loges®*: Harpagophytum procumbens (devil's claw), ethanolic extract, 960mg, tablets Placebo control: ingredients not reported | |
| Outcomes | WOMAC‐VAS (German version). Post hoc "responders” to treatment were defined as participants whose WOMAC pain scores increased by not more than 20% without additional rescue medication in weeks 17‐20 | |
| Notes | Exploratory study design; power, effect, and sample size not determined a priori. Reported compliance with ICH GCP guidelines. Results equivocal: no improvement on primary outcome measure (WOMAC). | |
| Risk of bias | ||
| Bias | Authors' judgement | Support for judgement |
| Random sequence generation (selection bias) | Low risk | Described as randomised, method not reported1. Authors contacted: provided full details of computer generated randomisation sequence |
| Allocation concealment (selection bias) | Low risk | Adequate allocation concealment can be inferred1. Authors contacted for confirmation, but details of allocation concealment not provided |
| Blinding (performance bias and detection bias) | Low risk | Described as double‐blind. Active intervention and placebo not distinguished by look, taste, smell or packaging |
| Incomplete outcome data (attrition bias) | High risk | Brief report. Full report not available (high risk) Reported withdrawals (low risk) Unclear whether analysis is per protocol or intention‐to‐treat analysis (unclear risk) |
| Selective reporting (reporting bias) | High risk | Age and gender data not reported (high risk) Reasons for withdrawal (ie: adverse events) not reported (unclear risk) Outcome data reported as percentages only, insufficient for extraction (unclear risk) Results showed no improvement on planned primary outcome measure (WOMAC). Alternate outcome measure and definition of improvement constructed post hoc |
| Other bias | Unclear risk | Diagnosis consistent with ACR criteria (low risk) Post‐hoc created outcome measure is unvalidated (unclear risk) |
| Methods | Randomised, double‐blind, placebo control, active control, 3 group crossover. Duration 12 weeks (1 week washout followed by 3 weeks intervention) | |
| Participants | Randomised n=67, Completed n=56. Mean age 66 yrs, range 24‐87 yrs. M:F 15:41. Inclusion: OA hip or knee, radiologically verified Kellgren grade I‐IV, VAS 0‐100 pain on mvt >30mm | |
| Interventions | Eurovita.EXT 33: Zingiber officinale (Chinese ginger) extract, 510mg (3 x 170mg), capsules Active control: ibuprofen, 400mg, tablets Placebo control: ingredients not reported, capsules and tablets Rescue medicine permitted: paracetamol (acetominophen), 3000mg daily, PRN | |
| Outcomes | Pain VAS 0‐100, Lequesne index, range of motion (hip or knee), acetominophen use, investigator treatment preference, daily pain diary (4 point Likert scale) | |
| Notes | Exploratory study design; power, effect, and sample size not determined a priori. Reported ethics committee approval and compliance with ICH GCP guidelines. Results favour ibuprofen over ginger, ginger over placebo. | |
| Risk of bias | ||
| Bias | Authors' judgement | Support for judgement |
| Random sequence generation (selection bias) | Low risk | Described as randomised, method of randomisation incompletely reported1. Reported as randomised in blocks of six to one of three groups, with further randomisation of treatment sequence within blocks. Authors contacted for confirmation, but further details not provided |
| Allocation concealment (selection bias) | Low risk | Adequate allocation concealment can be inferred1. Authors contacted for confirmation, but details of allocation concealment not provided |
| Blinding (performance bias and detection bias) | Low risk | Described as double‐blind. Double‐dummy method, placebo controls for both intervention and active controls. Active interventions and placebos not distinguished by look, taste, smell or packaging |
| Incomplete outcome data (attrition bias) | Unclear risk | Reported withdrawals (low risk) Included per‐protocol analysis only (unclear risk) |
| Selective reporting (reporting bias) | Low risk | Reported adverse events. Discussed intervention safety (low risk) |
| Other bias | Low risk | Diagnosis and assessment consistent with ACR criteria |
| Methods | Randomised, double‐blind, placebo control, 2 parallel groups, multicentre (n not specified). Duration 90 days (˜12 weeks) | |
| Participants | Completed n=163. Mean age 63 yrs. M:F 55:108. Inclusion: OA knee (n=101) or hip (n=62) (ACR criteria), Kellgren grade IB‐III, pain requiring NSAIDs for 3 months | |
| Interventions | Piascledine 300*: Persa gratissma and Glycine max, avocado / soyabean unsaponifiables, 300mg / 600mg, OD, tablets Placebo control: ingredients not reported Rescue medication permitted: one of 7 predefined NSAIDs taken by all participants for first 45 days. Resumption of same NSAID allowed during second 45 days | |
| Outcomes | Resumption of NSAIDS, time off NSAIDS, NSAID use (diclofenac equivalents), Lequesne index, pain VAS 0‐100, patient global 0‐4, physician global 0‐4 | |
| Notes | Confirmatory study design, power 80%, alpha 0.05. Reported compliance with Helsinki Declaration and ethics committee approval. Results favour intervention for reduced use of NSAIDs, but pain scores are similar in the two groups. | |
| Risk of bias | ||
| Bias | Authors' judgement | Support for judgement |
| Random sequence generation (selection bias) | Low risk | Described as randomised, in blocks of four, stratified according to site of arthritis (hip or knee), to one of two groups, using a table of random numbers |
| Allocation concealment (selection bias) | Unclear risk | Allocation concealment not reported |
| Blinding (performance bias and detection bias) | Low risk | Described as double‐blind. Active intervention and placebo not distinguished by look, taste, smell or packaging |
| Incomplete outcome data (attrition bias) | Unclear risk | Reported withdrawals (low risk) Included per protocol analysis only (unclear risk) |
| Selective reporting (reporting bias) | Low risk | Reported adverse events |
| Other bias | Low risk | Diagnosis and assessment consistent with ACR criteria |
| Methods | Randomised, unblinded, active control, 2 parallel groups, two centres. Duration 4 weeks | |
| Participants | Randomised n=120, intervention (n=60; n=30 at x centres), Chinese control n=30, Western control n=30. Completed n=116. Inclusion: OA knee (ACR criteria), at least 5 days on NSAIDs, adverse events with NSAIDs, pain with walking at least 20mm (VAS 0‐100) in the previous 48h | |
| Interventions | Tradename not provided. Chinese herbal mixture (blood‐nourishing, hard‐softening; BNHS), 3150mg Active control (Chinese): Chinese mixture to counter osteophytes, 5250mg, capsules Active control (Western): Viatril‐s 2250mg (crystalline glucosamine sulphate 1884mg equivalent to glucosamine sulphate 1500mg, sodium chloride 384mg) Rescue medication permitted: paracetamol (acetominophen), up to 4000mg daily, PRN; and aspirin, up to 100mg daily in a stable dose | |
| Outcomes | WOMAC‐VAS (normalised scores), pain during walking 0‐100 VAS, patient global 0‐4, physician global 0‐4 | |
| Notes | Exploratory study design; power, effect, and sample size not determined a priori. Reported ethics committee approval and compliance with ICH GCP guidelines. Improvements occured in all groups over time. Results indicate that BNHS is not inferior to counter osteophyte Chinese mixture or Viatril‐s. | |
| Risk of bias | ||
| Bias | Authors' judgement | Support for judgement |
| Random sequence generation (selection bias) | Unclear risk | Described as randomised, method inadequately reported: "sealed envelope method" |
| Allocation concealment (selection bias) | Low risk | Allocation concealment can be inferred: "sealed envelope method" |
| Blinding (performance bias and detection bias) | Unclear risk | Described as blinded, method inadequately reported |
| Incomplete outcome data (attrition bias) | Low risk | Reported withdrawals Included intention‐to‐treat analysis |
| Selective reporting (reporting bias) | Low risk | Reported adverse events (low risk) |
| Other bias | Low risk | Diagnosis and assessment consistent with ACR criteria |
| Methods | Ramdonised, double‐blind, placebo control, 2 parallel groups, single centre. Duration 18 weeks (3 weeks washout, 15 weeks trial) | |
| Participants | Completed n=89, intervention n=39, control n=50. OA hip or OA knee (ACR criteria), overall WOMAC score=30 at baseline | |
| Interventions | SheaFlex70: Vitellaria paradoxia, 100% sheabutter extract with 75% triterpene esters, 2250mg (3 x 750mg), capsules Placebo control: 100% canola oil, 2250mg (3 x 750mg), capsules | |
| Outcomes | WOMAC, Comprehensive Osteoarthritis Test (COAT) | |
| Notes | Exploratory study design; power, effect, and sample size not determined a priori. Reported ethics committee approval and clinical trials registration (ACTRN12606000162516). Results equivocal on clinical outcomes. Changes in WOMAC scores were not significant either within or between groups. Significant decrease in COAT pain subscale score within the shea group over time was not significantly different from this outcome in the control group at the end of the trial. Significant differences in some inflammatory markers were reported, but are not of relevance to this review. | |
| Risk of bias | ||
| Bias | Authors' judgement | Support for judgement |
| Random sequence generation (selection bias) | Low risk | Randomised to one of two groups using a computer generated random number sequence |
| Allocation concealment (selection bias) | Low risk | Allocation "held by a third party to the investigator and trial sponsor" |
| Blinding (performance bias and detection bias) | Low risk | Active intervention, placebo, and active controls not distinguished by look, taste, smell, packaging, or medication regimen |
| Incomplete outcome data (attrition bias) | High risk | Withdrawals not reported (high risk) Per‐protocol analysis only (unclear risk) |
| Selective reporting (reporting bias) | High risk | Clinical outcome data reported as percentages and P values (non‐significant) only, insufficient for extraction (unclear risk) Adverse events not reported (high risk) |
| Other bias | Low risk | Diagnosis and assessment consistent with ACR criteria |
| Methods | Randomised, double‐blind, placebo control, 2 parallel groups. Duration 32 weeks | |
| Participants | Randomised n=90, intervention n=45, control n=45. Midpoint (16 weeks) n=78. Completed n=62, intervention n=31, control n=31. Age 35+ years. OA knee (ACR criteria). Stable NSAIDs for 1 month at baseline. Not pregnant | |
| Interventions | RA‐11: Ayurvedic medication, 2 capsules Placebo control: ingredients not reported Rescue medication not permitted Concurrent medication permitted: stable medication for concomitant diseases | |
| Outcomes | WOMAC 0‐4 (Asian ‐ Indian modification), VAS 0‐100, 50 feet walk time (seconds), physician global assessment 0‐4, patient global assessment 0‐4, early morning stiffness (minutes), knee swelling 0‐3 | |
| Notes | Confirmatory study design, power 80%, alpha 0.05 (2 tailed). Did not report ethical oversight or compliance with guidelines. Results favour intervention. | |
| Risk of bias | ||
| Bias | Authors' judgement | Support for judgement |
| Random sequence generation (selection bias) | Low risk | Described as randomised: "...assigned to the active or placebo groups as per a predetermined computer generated randomisation schedule..." |
| Allocation concealment (selection bias) | Low risk | Adequate allocation concealment can be inferred: "A sealed copy of the randomization code was kept with the sponsor and the chief investigator but was not revealed to the subjects or the clinical staff until completion of the study." |
| Blinding (performance bias and detection bias) | Low risk | Active intervention and placebo not distinguished by look, taste, smell, packaging, or medication regimen |
| Incomplete outcome data (attrition bias) | Unclear risk | Reported withdrawals. Included intention‐to‐treat analysis. Last observation carried forward to replace missing data (low risk) Three participants were withdrawn by the investigators due to "efficacy failure", which may confound results (unclear risk) |
| Selective reporting (reporting bias) | Low risk | Pre‐determined levels of improvement (MCID) (low risk) Reported adverse events. Two participants in intervention group died, but these deaths were attributed to concomitant cardiovascular disease |
| Other bias | Low risk | Diagnosis consistent with ACR criteria (low risk) |
| Methods | Randomised, double‐blind, placebo and active control, 7 parallel groups, multicentre (n not specified). Duration 16 weeks | |
| Participants | Randomised n=245, all groups n=35. Completed n=202. Data available for analysis n=236. Mean age: placebo control 54 yrs, active control 54.2 yrs, intervention A 57.5 yrs, intervention B 56.6 yrs, intervention C 56.8 yrs, intervention D 56.2 yrs, intervention E 56.2 yrs. M:F not reported. Inclusion: OA knee (ACR criteria with lower age limit reduced to 40 years) | |
| Interventions | Tradenames not provided. five Ayurvedic formulations containing Zingiber officinale and Tinospora cordifolia and combinations ofEmblica officinale, Withania somnifera, or Tribulus terrestris, variable doses (4 x approx 500mg), capsules Active control: glucosamine sulphate, 1000mg (4 x 250mg). Capsule mass approx 500mg Placebo control: charcoal and synthetic ginger essence, 2000mg (4 x 500mg), capsules Rescue medication permitted: paracetamol (acetominophen), 2000mg (4 x 500mg) PRN | |
| Outcomes | Pain on weightbearing VAS 0‐10, WOMAC 0‐4 (Indian version), paracetamol use | |
| Notes | Exploratory study design; power, effect, and sample size not determined a priori. Reported ethics committee approval. Results equivocal for primary outcomes. Trend to favour intervention C for pain relief, paracetamol use, and knee function | |
| Risk of bias | ||
| Bias | Authors' judgement | Support for judgement |
| Random sequence generation (selection bias) | Unclear risk | Described as randomised, but participants allocated directly to groups on order of enrolment into the trial (quasi‐randomised) |
| Allocation concealment (selection bias) | Unclear risk | Allocation concealment not reported |
| Blinding (performance bias and detection bias) | Low risk | Described as double‐blind. Active interventions, active control, and placebo not distinguished by look, taste, smell or packaging |
| Incomplete outcome data (attrition bias) | Low risk | Reported withdrawals. Included intention‐to‐treat analysis |
| Selective reporting (reporting bias) | Unclear risk | Outcome data reported as change scores and percentages only, insufficient for extraction (unclear risk) Reported adverse events (low risk) |
| Other bias | Low risk | Diagnosis / assessment consistent with ACR criteria Synthetic ginger extract in placebo may not be inert |
| Methods | Randomised, double‐blind, active control, multicentre (n=3), 4 parallel groups. Duration 24 weeks (+2 to 5 days washout for participants using NSAIDs) | |
| Participants | Randomised n=440, intervention SGC n=110, intervention SGCG n=110, active control celecoxib n=110, active control glucosamine n=110. Completed n=314, SGC n=75, SGCG n=75, celecoxib n=78, glucosamine n=86. Age range 40‐70 years. Inclusion: OA knee (ACR criteria with modified age range), unilateral or bilateral knee OA, baseline VAS 0‐100 (pain on weightbearing) >54mm. Not pregnant or lactating, not taking medications likely to influence pain / functional outcomes, no known GIT bleeding | |
| Interventions | Tradename not provided. Standardised Ayurvedic formulation (shunthi‐guduchi, SGCG), 2400mg (2 x 400mg, TID), capsules Tradename not provided. Standardised Ayurvedic formulation (shunthi‐guduchi with guggal, SGCG), 2400mg (2 x 400mg, TID), capsules Active control A: celecoxib, 200mg (2 x 33.3mg, TID), capsules Active control B: glucosamine sulphate, 2000mg (2 x 333mg, TID), capsules Rescue medication permitted: 500mg acetominophen (paracetamol), PRN | |
| Outcomes | Pain on weightbearing VAS 0‐10, WOMAC 0‐4 (Indian version for hip and knee; pain and function subscales only), patient global 1‐5, physical global 1‐5, HAQ | |
| Notes | Confirmatory study; statistical power 80%, alpha set at 0.05 (2 tailed). Reported compliance with ICH GCP guidelines, and Declaration of Helsinki. Reported clinical trial registration (CTRI/2008/091/000063). Results for Ayurvedic interventions show equivalent outcomes in pain and function to glucosamine sulphate and celecoxib, but the more participants in the Ayurvedic group reported (unexpected) adverse events. | |
| Risk of bias | ||
| Bias | Authors' judgement | Support for judgement |
| Random sequence generation (selection bias) | Low risk | Randomised in order of enrolment in the trial. "The study biostatistician (S.S.) used a standard software program to generate a randomized schedule of permuted block randomization with block size 4 for blinded (coded) drug allotment." |
| Allocation concealment (selection bias) | Unclear risk | Allocation concealment not reported |
| Blinding (performance bias and detection bias) | Low risk | Described as double‐blind. Active interventions, active control, and placebo not distinguished by look, taste, smell or packaging |
| Incomplete outcome data (attrition bias) | Low risk | Reported withdrawals Included both intention‐to‐treat and per protocol analyses |
| Selective reporting (reporting bias) | Low risk | Outcome data reported as means and confidence intervals only, standard deviations computed for extraction and re‐analysis Pain VAS 0‐10 converted to 100mm scale for data extraction and re‐analysis Reported adverse events |
| Other bias | Low risk | Diagnosis/assessment consistent with ACR criteria Active control B, glucosamine sulphate, is not an analgesic, and may be a poor choice of control in a trial using pain as a primary outcome measure |
| Methods | Randomised, double‐blind, placebo control, 2 parallel groups. Duration 12 weeks intervention, plus 2 weeks washout/follow‐up | |
| Participants | Randomised n=100, Completed intervention n=90, Completed washout n=81. Mean age 54 yrs. M:F control 18:32, intervention 14:36. Inclusion: OA knee (ACR criteria), Kellgren grade I or II, mild‐moderate pain in target knee for at least 3 months, morning stiffness, knee crepitus, age > 25 years. Female participants not pregnant, nor planning pregnancy for > 12 months post study | |
| Interventions | Pycnogenol®: Pinus pinaster, pine bark extract with 90% proanthocyanines, 150mg (3 x 50mg), in 50mg doses TID with meals, tablets Placebo control: ingredients not reported, tablets Concurrent medication permitted: stable NSAIDs and analgesics | |
| Outcomes | WOMAC 0‐4 (Slovak version), Pain VAS 0‐100 | |
| Notes | Exploratory study design; power, effect, and sample size not determined a priori. Reported ethics committee approval. Results favour intervention. | |
| Risk of bias | ||
| Bias | Authors' judgement | Support for judgement |
| Random sequence generation (selection bias) | Unclear risk | Described as randomised, method not reported |
| Allocation concealment (selection bias) | Unclear risk | Allocation concealment not reported |
| Blinding (performance bias and detection bias) | Low risk | Described as double‐blind. Active intervention and placebo not distinguished by look, taste, smell, packaging, or medication regimen |
| Incomplete outcome data (attrition bias) | Low risk | Reported withdrawals Included intention‐to‐treat analysis |
| Selective reporting (reporting bias) | Low risk | Reported adverse events (low risk) |
| Other bias | Low risk | Diagnosis and assessment consistent with ACR criteria |
| Methods | Randomised, double‐blind, placebo control, 2 parallel groups. Duration 3 months (˜12 weeks) | |
| Participants | Randomised n=37; intervention n=19, control n=18. Completed n=35. Mean age: control 48.9 yrs, intervention 47.5yrs. M:F: control 1:17, intervention 2:18. Inclusion: OA knee (ACR criteria) | |
| Interventions | Pycnogenol®: Pinus pinaster, pine bark extract with 70% proanthocyanines, 150mg (3 x 50mg), tablets Placebo control: "inactive ingredient", ingredients not report, tablets | |
| Outcomes | WOMAC‐VAS (aggregated scores), NSAID/COX‐2 inhibitor use | |
| Notes | Exploratory study design; power, effect, and sample size not determined a priori. Reported ethics committee approval. Results favour intervention. | |
| Risk of bias | ||
| Bias | Authors' judgement | Support for judgement |
| Random sequence generation (selection bias) | Unclear risk | Described as randomised, method not reported |
| Allocation concealment (selection bias) | Unclear risk | Adequate concealment not reported |
| Blinding (performance bias and detection bias) | Low risk | Described as double‐blind. Active intervention and placebo not distinguished by look, taste, smell or packaging |
| Incomplete outcome data (attrition bias) | Low risk | Reported withdrawals. Reported identical per‐protocol and intention‐to‐treat analyses |
| Selective reporting (reporting bias) | Unclear risk | Reported no adverse events (low risk) |
| Other bias | Low risk | Diagnosis / assessment based on ACR criteria |
| Methods | Randomised, double‐blind, placebo control, 2 group crossover. Duration 3 weeks (2 x 1 week crossover, 1 week washout) | |
| Participants | Randomised n=22, Completed n=20. Mean age 62 yrs, range 47‐78 yrs. Inclusion: OA hip or knee, clinical and radiographic verification (criteria not specified) | |
| Interventions | Tipi tea: Petiveria alliacea, aqueous extract, 3 x 200ml tea (equivalent to 9gm tipi) Placebo control: Sape, Imperata exaltata (dose not specified) | |
| Outcomes | Pain (scale not reported) at rest, pain with mvt, pain at night, 15 metre walking time, MACTAR patient preference questionnaire | |
| Notes | Exploratory study design; power, effect, and sample size not determined a priori. Did not report ethical oversight or compliance with guidelines. Results equivocal. | |
| Risk of bias | ||
| Bias | Authors' judgement | Support for judgement |
| Random sequence generation (selection bias) | Unclear risk | Described as randomised, method not reported |
| Allocation concealment (selection bias) | Unclear risk | Allocation concealment not reported |
| Blinding (performance bias and detection bias) | Unclear risk | Described as double‐blind, method not reported |
| Incomplete outcome data (attrition bias) | High risk | Brief report. Full report not available (high risk) Reported withdrawals (low risk) |
| Selective reporting (reporting bias) | Low risk | Reported adverse events (low risk) |
| Other bias | High risk | Criteria for diagnosis of OA not specified (high risk) Financial and in kind support not reported |
| Methods | Randomised, double‐blind, placebo control, 2 parallel groups. Duration 20 weeks | |
| Participants | Randomised n=46; intervention n=24, control n=22. Completed n=41, intevention n=21, control n=20. Mean age: intervention 58 yrs, control 61 yrs. Gender data not reported. Inclusion: OA hip (ACR criteria) | |
| Interventions | LoHar‐45 flexi‐loges®: Harpagophytum procumbens (devil's claw), 960mg, ethanolic extract, tablets Placebo control: ingredients not reported | |
| Outcomes | WOMAC‐VAS (German version). Post hoc "responders” to treatment were defined as participants whose WOMAC pain scores did not increase by more than 20% in weeks 17 to 20 of the study | |
| Notes | Exploratory study design; power, effect, and sample size not determined a priori. Reported compliance with ICH GCP guidelines. Results equivocal: no improvement on primary outcome measure (WOMAC). | |
| Risk of bias | ||
| Bias | Authors' judgement | Support for judgement |
| Random sequence generation (selection bias) | Low risk | Described as randomised, method not reported1. Authors contacted: provided full details of computer generated randomisation sequence |
| Allocation concealment (selection bias) | Low risk | Allocation concealment not reported1. Authors contacted for confirmation, but details of allocation concealment not provided |
| Blinding (performance bias and detection bias) | Low risk | Described as double‐blind. Active intervention and placebo not distinguished by look, taste, smell or packaging |
| Incomplete outcome data (attrition bias) | Low risk | Reported withdrawals. Reported intention‐to‐treat analysis |
| Selective reporting (reporting bias) | High risk | Reasons for withdrawals and adverse events not reported (high risk) Outcome data reported as change scores, percentages, and bar charts only, insufficient for extraction (unclear risk) Results show no improvement on planned primary outcome measure (WOMAC). Alternate outcome measure and definition of improvement constructed post hoc (high risk) |
| Other bias | Unclear risk | Diagnosis consistent with ACR criteria (low risk) Post‐hoc created outcome measure not validated (unclear risk) |
| Methods | Randomised, double‐blind, placebo control, 2 parallel groups, multicentre (n=3). Duration 3 months (˜12 weeks) | |
| Participants | Randomised n=90. Completed n=88; intervention n=44, control n=44. Inclusion: OA knee (knee pain, swelling, stiffness, tenderness, age 45+ years, one or more radiological signs) | |
| Interventions | Antarth, Ayurvedic phytomedicine (mixture), dose not stated, 2 x BID, capsules Placebo control: ingredients not reports, capsules Rescue medication permitted: diclofenac sodium, up to 50mg BID; ranitidine up to 150mg OD | |
| Outcomes | Pain VAS 0‐10, pain walking 0‐4, pain squatting 0‐4, pain crossing legs 0‐4, pain climbing stairs 0‐4, physician global (descriptive), patient global (descriptive), rescue medication use | |
| Notes | Exploratory study design; power, effect, and sample size not determined a priori. Reported ethics committee approval. Results slightly favour intervention. Participants receiving Antarth used less rescue medication and may be more satisfied than participants receiving placebo. | |
| Risk of bias | ||
| Bias | Authors' judgement | Support for judgement |
| Random sequence generation (selection bias) | Unclear risk | Described as randomised, method not reported |
| Allocation concealment (selection bias) | Unclear risk | Allocation concealment not reported |
| Blinding (performance bias and detection bias) | Low risk | Described as double‐blind. Active intervention and placebo control not distinguished by look, taste, smell, packaging, or medication regimen |
| Incomplete outcome data (attrition bias) | Unclear risk | Reported withdrawals (low risk) Per‐protocol analysis only (unclear risk) |
| Selective reporting (reporting bias) | Low risk | Outcome data reported as VAS 0‐10, converted to 100mm scale for data extraction (low risk) Reported no adverse events (low risk) |
| Other bias | Unclear risk | Diagnosis not consistent with ACR criteria, but likely to be OA (unclear risk) |
| Methods | Double‐blind, placebo control, 2 parallel groups. Duration 3 weeks | |
| Participants | Recruited n=40, Completed n=38. Age range 50‐80 yrs. M:F 4:24. Inclusion: OA (criteria not specified), at least one indication for treatment with antirheumatics | |
| Interventions | PhytodolorRN: standardised extract mixture of ash bark, aspen leaf, aspen bark, golden rod herb, 3 x 30 drops, tincture Placebo control: ingredients not reported | |
| Outcomes | Rescue medication use, joint size, maximum ROM, pain at rest, pain with mvt, pressure pain, finger‐ground distance (spine only), Schober index, percussion pain, serum biochemistry | |
| Notes | Exploratory study design; power, effect, and sample size not determined a priori. Did not report ethical oversight or compliance with guidelines. Results favour intervention. Some outcome measures (eg: Schober index) are non‐specific and may be of limited use in rheumatological assessment. | |
| Risk of bias | ||
| Bias | Authors' judgement | Support for judgement |
| Random sequence generation (selection bias) | High risk | Not randomised |
| Allocation concealment (selection bias) | Unclear risk | Allocation concealment not reported |
| Blinding (performance bias and detection bias) | Unclear risk | Described as double‐blind, method not reported. In other studies of PhytodolorRN, active intervention and placebo not distinguished by look, taste, smell or packaging |
| Incomplete outcome data (attrition bias) | Unclear risk | Reported withdrawals (low risk) Per‐protocol analysis only (unclear risk) |
| Selective reporting (reporting bias) | High risk | Outcome data variances reported as standard error of measurement (SEM). When converted to standard deviation (SD), data are skewed, violating an assumption of the inferential analyses (unclear risk) Adverse events not reported (high risk) |
| Other bias | Unclear risk | Criteria for diagnosis of OA not specified (unclear risk) Unvalidated outcome measures (unclear risk) |
| Methods | Randomised, double‐blind, placebo control, 4 parallel groups, multicentre (n=2). Duration 4 weeks | |
| Participants | Randomised n=96, Completed n=93. Mean age 58 yrs. M:F 9:84. Inclusion: OA knee, clinical and radiographic verification (criteria not specified), pain VAS 0‐100 >35mm | |
| Interventions | SKI306X: standardised extract mixture of Clematis mandshurica, Prunella vulgaris, Trichosanthes kirilowii, 600mg (3 x 200mg), 1200mg (3 x 400mg), 1800mg (3 x 600mg), tablets Placebo control: ingredients not reported, tablets | |
| Outcomes | Pain VAS 0‐100, Lequesne index, patient opinion of efficacy 1‐5, investigator opinion of efficacy 1‐5, tolerability, serum biochemistry, heamatology, urinanalysis | |
| Notes | Confirmatory study design, but statistical power not reported. Reported compliance with Helsinki Declaration and ethics committee approval. Results favour intervention. | |
| Risk of bias | ||
| Bias | Authors' judgement | Support for judgement |
| Random sequence generation (selection bias) | Unclear risk | Described as randomised, method not reported |
| Allocation concealment (selection bias) | Unclear risk | Allocation concealment not reported |
| Blinding (performance bias and detection bias) | Unclear risk | Described as double‐blind, method incompletely reported. Assume active intervention and placebo not distinguished by look, taste, smell or packaging |
| Incomplete outcome data (attrition bias) | Low risk | Reported withdrawals |
| Selective reporting (reporting bias) | Low risk | Reported adverse events. Discussed intervention safety |
| Other bias | Unclear risk | Criteria for diagnosis of OA not specified, clinical and radiographic verification (unclear risk) |
| Methods | Randomised, double‐blind, active control, 2 parallel groups. Duration 4 weeks | |
| Participants | Randomised n=249, Completed n=214. Mean age 60 yrs. M:F 18:231. Inclusion: OA knee (ACR criteria), pain VAS 0‐100 >35mm | |
| Interventions | SKI306X: standardised extract mixture of Clematis mandshurica, Prunella vulgaris, Trichosanthes kirilowii, 600mg (3 x 200mg), tablets Active control: diclofenac SR, 100mg OD, tablets Placebo controls: ingredients not reported, tablets (double dummy) Concurrent medication permitted: medications for conditions unrelated to OA, if known not to interact with either study medications | |
| Outcomes | Pain VAS 0‐100, Lequesne, patient global 1‐5, physician global 1‐5, tolerability, serum biochemistry, haematology, urinanalysis | |
| Notes | Confirmatory study design, statistical power 80%, alpha 0.05.Reported compliance with the Declaration of Helsinki and institutional review board oversight. Results equivocal: SKI306X equally effective as diclofenac on pain, Lequesne index, patient and physician global scores. Participants using SKI306X reported fewer adverse events. | |
| Risk of bias | ||
| Bias | Authors' judgement | Support for judgement |
| Random sequence generation (selection bias) | Low risk | Randomised in blocks of four or six to one of two groups using a computer generated random number sequence |
| Allocation concealment (selection bias) | Unclear risk | Allocation concealment not reported |
| Blinding (performance bias and detection bias) | Low risk | Described as double‐blind. Double‐dummy method, placebo controls for both intervention and active controls. Active interventions and placebo not distinguished by look, taste, smell or packaging |
| Incomplete outcome data (attrition bias) | Low risk | Reported withdrawals Included per‐protocol and intention‐to‐treat analyses |
| Selective reporting (reporting bias) | Low risk | Reported adverse events. Discussed intervention safety |
| Other bias | Low risk | Diagnosis / assessment consistent with ACR criteria (low) |
| Methods | Randomised, double‐blind, placebo control, crossover. Duration 19 weeks (2 x 8 weeks intervention + 3 week washout) | |
| Participants | Randomised n=30, Completed n=30. No withdrawals. Mean age 59 yrs, range 45‐72 yrs. M:F 12:18. Inclusion: OA knee, clinical and radiographic verification (criteria not specified), currently using physiotherapy and NSAIDs | |
| Interventions | Cap Wokvel™: Boswellia serrata (Gajabhakshya) extract with 40% boswellic acid, 1000mg (3 x 333mg), capsules Placebo control: starch powder, capsules | |
| Outcomes | Joint pain 0‐3, loss of function 0‐3, swelling 0‐3 | |
| Notes | Exploratory study design; power, effect, and sample size not determined a priori. Did not report ethical oversight or compliance with guidelines. Reported that study formed part of an academic coursework requirement. Results favour intervention. | |
| Risk of bias | ||
| Bias | Authors' judgement | Support for judgement |
| Random sequence generation (selection bias) | Low risk | Randomised to one of two groups using a computer generated random number sequence |
| Allocation concealment (selection bias) | Low risk | Adequate allocation concealment can be inferred: "The clinical orthopedic investigator and the patients were blind for the interventions" |
| Blinding (performance bias and detection bias) | Low risk | Described as double‐blind. Active intervention and placebo not distinguished by look, taste, smell or packaging or medication regimen |
| Incomplete outcome data (attrition bias) | Low risk | Reported 100% compliance, no withdrawals |
| Selective reporting (reporting bias) | Low risk | Reported adverse events (low risk) |
| Other bias | Unclear risk | Criteria for diagnosis of OA not specified: "clinoradiographic verification" (unclear risk) |
| Methods | Randomised, single blind, active control, 2 parallel groups. Duration 6 weeks | |
| Participants | Randomised n=107, Completed n=91. Mean age intervention 61.4 yrs, active control 60.0 yrs. Primary OA knee (ACR criteria) | |
| Interventions | Tradename not provided.Curcuma domestica extract, 2000mg (4 x 500mg) with 1000mg curcuminoids, capsules Active control: ibuprofen, 800mg (2 x 400mg), method of administration not reported | |
| Outcomes | Pain on level walking NRS 0‐10, pain on stair climbing NRS 0‐10, 100m walk (seconds), stair climb and descent (seconds) | |
| Notes | Confirmatory study design, power 80%, alpha 0.05. Reported ethics committee approval. Efficacy of Curcuma domestica is not significantly different from active control (ibuprofen). | |
| Risk of bias | ||
| Bias | Authors' judgement | Support for judgement |
| Random sequence generation (selection bias) | Unclear risk | Described as randomised, method of randomisation incompletely reported. Reported as "a computer randomisation code kept by a research assistant" |
| Allocation concealment (selection bias) | Unclear risk | Allocation concealment not reported |
| Blinding (performance bias and detection bias) | High risk | Blinding incomplete: research assistant not blind to allocation, and medication regimens differ between active control and intervention |
| Incomplete outcome data (attrition bias) | Unclear risk | Reported withdrawals (low risk) Per‐protocol analysis only (unclear risk) |
| Selective reporting (reporting bias) | Low risk | Reported adverse events (low risk) |
| Other bias | Unclear risk | Diagnosis consistent with ACR criteria (low risk) Outcome assessments not validated measures (unclear risk) |
| Methods | Randomised, single blind, active control, 2 parallel groups. Duration 4 weeks | |
| Participants | Randomised n=125; intervention n=63, control n=62. Completed n=107; intervention n=55, control n=52. Inclusion: primary OA knee (ACR criteria) | |
| Interventions | Tradename not provided. Derris scandens extract, 800mg (400mg BID) Active control: naproxen, 500mg (250mg BID) | |
| Outcomes | WOMAC‐VAS (10cm normalised scores), 6 minute walk, patient global (categorical 1‐6), patient satisfaction (categorical 1‐6) | |
| Notes | Confirmatory study design; power 80%, alpha 0.05. Reported ethics committee approval. Efficacy of Derris scandens is not significantly different from active control (naproxen). | |
| Risk of bias | ||
| Bias | Authors' judgement | Support for judgement |
| Random sequence generation (selection bias) | Low risk | Randomisation according to computer generated randomisation code |
| Allocation concealment (selection bias) | High risk | Allocation not concealed from participants or research assistant |
| Blinding (performance bias and detection bias) | High risk | Blinding incomplete: research assistant not blind to allocation, and interventions may be distinguishable between active control and intervention. interventions distinguishable |
| Incomplete outcome data (attrition bias) | Unclear risk | Reported withdrawals (low risk) Per‐protocol analysis only (unclear risk) |
| Selective reporting (reporting bias) | Unclear risk | Outcome data WOMAC‐VAS converted to 100mm scale for data extraction. Error identified during data extraction (unclear risk). Reported adverse events (low risk) |
| Other bias | Low risk | Diagnosis / assessment consistent with ACR criteria Reported financial and in kind support, declared no competing financial interests |
| Methods | Randomised, double blind, active control, 2 parallel groups, multicentre (n=30 rheumatology practices). Duration 4 months (˜20 weeks) | |
| Participants | Randomised n=122, Completed n=92. Mean age 61 yrs. M:F 45:77. Inclusion: primary OA knee or hip (ACR criteria), Kellgren stage I‐III | |
| Interventions | Harpadol®: Harpagophytum procumbens (devil's claw), freeze‐ground powder, 2610 mg (6 x 435mg), equivalent to 60mg harpagoside, capsules. Active control: diacerhein, 100mg (2 x 50mg), capsules Placebo controls: ingredients not reports, capsules (double dummy) Rescue medication permitted: acetaminophen‐caffeine OD PRN, followed by diclofenac 150mg (3 x 50mg) PRN | |
| Outcomes | Pain VAS 0‐100, disability VAS 0‐100, Lequesne index, rescue medication use, patient global, investigator treatment preference | |
| Notes | Confirmatory study; statistical power 90%, alpha 0.05 (1 tailed). Reported compliance with Declaration of Helsinki and ethics committee approval. Results indicate Harpagophytum equally effective as diacerhein on pain, function, and Lequesne index. Participants using Harpagophytum used less rescue medication (acetaminophen‐caffeine or diclofenac) and reported significantly fewer adverse effects. | |
| Risk of bias | ||
| Bias | Authors' judgement | Support for judgement |
| Random sequence generation (selection bias) | Unclear risk | Described as randomised, method of randomisation incompletely reported. Reported as randomised in blocks of four patients at each study centre |
| Allocation concealment (selection bias) | Unclear risk | Allocation concealment not reported |
| Blinding (performance bias and detection bias) | Low risk | Described as double‐blind. Double‐dummy method, placebo controls for both intervention and active controls. Active interventions and placebos not distinguished by look, taste, smell, packaging, or medication regimen |
| Incomplete outcome data (attrition bias) | Low risk | Reported withdrawals. Included per‐protocol and intention‐to‐treat analyses. Missing data replaced using the last observation carried forward method |
| Selective reporting (reporting bias) | Low risk | Reported adverse events. Discussed intervention safety |
| Other bias | Low risk | Diagnosis/assessment consistent with ACR criteria |
| Methods | Randomised, placebo control, 2 parallel groups, multicentre (50 rheumatology practices). Duration 2 years (˜104 weeks) | |
| Participants | Randomised n=163, Completed n=96, Returned 2 radiographs n=108. Mean age 63 years. M:F 102:61. Inclusion: OA hip (ACR criteria), Kellgren stage I‐III, joint space narrowing >1mm, Lequesne index >4 | |
| Interventions | Piascledine 300: Persa gratissma and Glycine max (avocado‐soyabean unsaponifiables), 300mg, capsules Placebo control: ingredients not reported, capsules Rescue medication permitted: NSAIDs measured in diclofenac equivalents, and analgesics (not specified), PRN Concurrent medication permitted: all concomitant medications for medical diseases | |
| Outcomes | Joint space width, Lequesne index, global pain VAS 0‐100, NSAID use (diclofenac equivalents), patient global (verbal 7 point scale), investigator global (verbal 4 point scale), days of sick leave, n participants requiring hip replacements | |
| Notes | Confirmatory study; statistical power 80%, alpha 0.05. Reported ethics committee approval. Results equivocal; results favour intervention in subgroup of participants with advanced joint space narrowing. | |
| Risk of bias | ||
| Bias | Authors' judgement | Support for judgement |
| Random sequence generation (selection bias) | Low risk | Randomised in blocks of four, to one of two groups, by an independent statistical unit |
| Allocation concealment (selection bias) | Low risk | Adequate allocation concealment can be inferred1 |
| Blinding (performance bias and detection bias) | Low risk | Active intervention and placebo not distinguished by look, taste, smell or packaging |
| Incomplete outcome data (attrition bias) | Low risk | Reported withdrawals. Included per‐protocol and intention‐to‐treat analyses |
| Selective reporting (reporting bias) | Low risk | Reported adverse events. Discussed intervention safety |
| Other bias | Low risk | Diagnosis / assessment consistent with ACR criteria (ie: EULAR criteria) |
| Methods | Randomised, double‐blind, placebo control, 2 parallel groups, multicentre (n not specified). Duration 8.5 months (˜34 weeks); 15 day washout, 6 month intervention (˜24 weeks), 2 month follow‐up | |
| Participants | Randomised n=164, Completed n=144. Mean age 64 yrs. M:F 46:118. Inclusion: OA knee or hip (ACR criteria), Kellgren stage IB‐III, active OA for 6 months, regular pain for 3 months | |
| Interventions | Piascledine 300: Persa gratissma and Glycine max (avocado‐soyabean unsaponifiables), 300mg, capsules Placebo control: ingredients not reported, capsules Rescue medication permitted: analgesics PRN, up to 1 intra‐articular injection of corticosteroid "if absolutely necessary" | |
| Outcomes | Lequesne index, pain VAS 0‐100, disability VAS 0‐100, number of participants using NSAIDs | |
| Notes | Confirmatory study design; statistical power 90%, alpha 0.05. Reported review board approval, but unclear whether a formally constituted HREC approved the study protocol. Results favour intervention. | |
| Risk of bias | ||
| Bias | Authors' judgement | Support for judgement |
| Random sequence generation (selection bias) | Low risk | Randomised in blocks of four, to one of two groups, using a table of random numbers |
| Allocation concealment (selection bias) | Low risk | Adequate. Allocation completed by an independent statistician |
| Blinding (performance bias and detection bias) | Low risk | Active intervention and placebo not distinguished by look, taste, smell, or packaging |
| Incomplete outcome data (attrition bias) | Low risk | Reported withdrawals. Included per‐protocol and intention‐to‐treat analyses |
| Selective reporting (reporting bias) | Low risk | Reported adverse events. Discussed intervention safety |
| Other bias | Low risk | Diagnosis / assessment consistent with ACR criteria (low risk) |
| Methods | Randomised, double‐blind, placebo control, 2 parallel groups, multicentre (n=122; 52 rheumatology clinics, 70 general practices). Duration 3 years | |
| Participants | Randomised n=399, Completed n=345. Mean age 62 yrs. M:F 46:54. Inclusion: OA hip (ACR criteria), joint space width (JSW) 1‐4mm, Lequesne index 3‐10 (scale 0‐24), pain for at least 1 year. Most symptomatic hip selected as target joint | |
| Interventions | Piascledine 300: Persa gratissma and Glycine max (avocado/soyabean unsaponifiables), 300mg, capsules Placebo control: ingredients not reported, capsules Rescue medication permitted: analgesics or NSAIDs PRN recorded in self‐report diary | |
| Outcomes | Change in joint space width (JSW; narrowest point on pelvis / hip AP view), WOMAC‐VAS, Lequesne index (normalised 0‐100) | |
| Notes | Confirmatory study design; planned recruitment n=380 for statistical power 90%, alpha 0.05; actual power exceeded 75%. Reported ethics committee approval. Results equivocal for clinical outcomes. Fewer participants (20%) in the intervention group showed progression of joint space narrowing. | |
| Risk of bias | ||
| Bias | Authors' judgement | Support for judgement |
| Random sequence generation (selection bias) | Low risk | Described as randomised: "Randomisation...by blocks of two for each stratum defined by baseline JSW" |
| Allocation concealment (selection bias) | Low risk | Adequate allocation concealment can be inferred: "Randomisation list established by an independent company" |
| Blinding (performance bias and detection bias) | Low risk | Active intervention and placebo not distinguished by look, taste, smell, packaging, or medication regimen |
| Incomplete outcome data (attrition bias) | Low risk | Reported withdrawals. Included per‐protocol and intention‐to‐treat analyses |
| Selective reporting (reporting bias) | Unclear risk | Variances reported as standard error of measurement (SEM). When converted to standard deviation (SD), data are not normally distributed, violating an assumption of the inferential analyses (unclear risk) Change in JSW reported as joint loss in mm. Negative scores converted to positive for reanalysis so that higher scores mean worse (low risk). Reported adverse events. Discussed intervention safety (low risk) |
| Other bias | Low risk | Diagnosis / assessment consistent with ACR criteria |
| Methods | Randomised, unblinded, adjunct to active treatment, 2 parallel groups. Duration 12 weeks | |
| Participants | Randomised n=50; intervention n=25, control n=25. Inclusion: primary knee OA (criteria not specified) with joint effusion | |
| Interventions | Boiogito: Japanese herbal mixture containing extract of Sinomenium acutum, Astragalus, Atractylodes Lancea, Jujube, Glycyrrhiza, ginger, 7.5g (2.5g TID); and loxoprofen 60mg (20mg TID) Control: loxoprofen 60mg (20mg TID) Boiogito provided as adjunct therapy to loxoprofen | |
| Outcomes | Knee Society Rating System, SF‐36, joint effusion (joint puncture) | |
| Notes | Exploratory study design; power, effect, and sample size not determined a priori. Reported institutional review board oversight, but unclear whether a formally consistuted Human Research Ethics Committee approved the research design. Improvement in pain and function occured in both groups over time. Interventiong roup showed reduction in joint effusion as well as other measures. | |
| Risk of bias | ||
| Bias | Authors' judgement | Support for judgement |
| Random sequence generation (selection bias) | Unclear risk | Described as randomised, method not reported |
| Allocation concealment (selection bias) | Unclear risk | Allocation concealment not reported |
| Blinding (performance bias and detection bias) | High risk | Open trial. Medication regimens differ between active control and intervention |
| Incomplete outcome data (attrition bias) | Unclear risk | Reported withdrawals (low risk) Per‐protocol analysis only (unclear risk) |
| Selective reporting (reporting bias) | Low risk | Reported adverse events |
| Other bias | Unclear risk | Criteria for diagnosis of OA not specified (unclear risk) |
| Methods | Randomised, double‐blind, active control, 2 parallel groups. Duration 4 weeks | |
| Participants | Randomised n=110; intervention n=55, control n=55. Completed n=100; intervention n=50, control n=50. Age 40+ years. OA knee (not ACR criteria), knee pain, knee swelling | |
| Interventions | Tradename not provided. Ricinus officinalis. Castor oil, 2.7ml (3 x 0.9ml), capsule Active control: diclofenac sodium, 150mg (3 x 50mg), capsule Concurrent intervention permitted: all participants encouraged to have physiotherapy | |
| Outcomes | Pain VAS 0‐100 | |
| Notes | Exploratory study design; power, effect, and sample size not determined a priori. Reported ethics committee approval. Results favour diclofenac over castor oil for improvement in osteoarthritic knee pain. Pain improved in both intervention and active control groups, but improvement was greater in the diclofenac group. | |
| Risk of bias | ||
| Bias | Authors' judgement | Support for judgement |
| Random sequence generation (selection bias) | Unclear risk | Described as randomised, method not reported |
| Allocation concealment (selection bias) | Unclear risk | Allocation concealment not reported. Participants "selected from outpatients" may imply that allocation was unconcealed, or that participation in the study was not voluntary (unclear risk) |
| Blinding (performance bias and detection bias) | Unclear risk | Described as double‐blind, method incompletely reported. Assume active intervention and placebo not distinguished by look, taste, smell or packaging |
| Incomplete outcome data (attrition bias) | Unclear risk | Reported withdrawals (low risk) Per‐protocol analysis only (unclear risk) Five participants withdrew due to "efficacy failure", which may confound results |
| Selective reporting (reporting bias) | Unclear risk | Clinical outcome data reported as percentages and P values only, insufficient for extraction (unclear risk) Reported adverse events (low risk) |
| Other bias | Unclear risk | Diagnosis / assessment not consistent with ACR criteria (unclear risk) |
| Methods | Randomised, double blind, active control (glucosamine sulfate), 2 parallel groups. Duration 8 weeks | |
| Participants | Randomised n=95; intervention n=48, control n=47. Completed n=79; intervention n=41, control n=38. Mean age: control 55.1 yrs, intevention 51.9 yrs. OA knee (ACR criteria), Kellgren II or III, function VAS 0‐100 between 40mm and 80mm at baseline | |
| Interventions | Reparagen®: combination of Uncaria guianensis (cat's claw; 300mg) and Lepidium meyenii (1500mg), 1800mg (2 x 2 x 450mg) Active control: glucosamine sulfate, 1500mg (2 x 2 x 375mg), capsules Rescue medication permitted: paracetamol (acetaminophen), up to 1500mg (3 x 500mg) per day in weeks 1‐4, 1000mg (2 x 500mg) per day in weeks 5‐8 | |
| Outcomes | WOMAC 0‐4, pain VAS 0‐100, rescue medication use | |
| Notes | Exploratory study design; power, effect, and sample size not determined a priori. Reported compliance with Helsinki Declaration and ethics committee approval. Reported clinical trials registration (ISRCTN25438351). Efficacy of Reparagen® is not significantly different from glucosamine sulfate. | |
| Risk of bias | ||
| Bias | Authors' judgement | Support for judgement |
| Random sequence generation (selection bias) | Low risk | Used a fixed allocation randomisation procedure |
| Allocation concealment (selection bias) | Unclear risk | Allocation concealment not reported |
| Blinding (performance bias and detection bias) | Low risk | Intervention and active control not distinguished by look, taste, smell, packaging, or medication regimen |
| Incomplete outcome data (attrition bias) | Low risk | Reported withdrawals. Included intention‐to‐treat analysis |
| Selective reporting (reporting bias) | Unclear risk | Outcome data reported as change scores, percentages, graphs, and p values only, insufficient for extraction (unclear risk) Reported adverse events (low risk) |
| Other bias | Low risk | Diagnosis/assessment consistent with ACR criteria |
| Methods | Randomised, double‐blind, placebo control, 2 parallel groups. Duration 2 months (˜8 weeks) | |
| Participants | Randomised n=82 (all participants, OA and RA), Completed n=52 (plus RA n=20). Mean age (all participants, OA and RA) 62 yrs. Gender data not reported. Inclusion: Self‐identified arthritis pain, subsequently assessed by rheumatologist (ACR criteria), AIMS2 pain score of at least 3, not using prescribed salicylates, NSAIDs, or analgesics | |
| Interventions | Reumalex: polyherbal mixture including extracts of willow bark, guaiacum resin, black cohosh, sarsparilla, and poplar bark, 2 "at a time", tablets. Placebo control: calcium phosphate, tablets Concurrent medication permitted: stable self‐prescribed analgesics | |
| Outcomes | Pain AIMS 2, modified Ritchie index, analgesic use (diary) | |
| Notes | Exploratory study design; power, effect, and sample size not determined a priori. Reported ethics committee approval. Results equivocal; medium effect size improvements in pain, but no reduction in analgesic use. | |
| Risk of bias | ||
| Bias | Authors' judgement | Support for judgement |
| Random sequence generation (selection bias) | Unclear risk | Described as randomised, but participants allocated directly to groups on order of enrolment into the trial (quasi‐randomised): "Assigned by accession to pre‐set lists of allocations randomised for equalisation in every ten, and after stratification by clinical condition, to one of two groups" |
| Allocation concealment (selection bias) | Unclear risk | Allocation concealment not reported |
| Blinding (performance bias and detection bias) | Low risk | Described as double‐blind. Active interventions, active control, and placebo not distinguished by look, taste, smell or packaging |
| Incomplete outcome data (attrition bias) | Low risk | Reported withdrawals (low risk) Per‐protocol analysis only (unclear risk) |
| Selective reporting (reporting bias) | Low risk | Reported adverse events (low risk) |
| Other bias | Low risk | Diagnosis/assessment consistent with ACR criteria |
| Methods | Randomised, double blind, placebo control, 4 parallel groups (2 x normal weight patients, 2 x overweight patients). Duration 8 weeks | |
| Participants | Randomised n=80, Completed n=45. Age range 25‐60 yrs (mean age not reported). Gender data not reported. OA knee (ACR criteria) in adults of normal weight and overweight | |
| Interventions | NP 06‐1: mixture of Phellodendron amurense tree bark extract with 50% berberine and Citrus sinensis peel extract a minimum of 30% polymethoxylated flavones, 1480mg (2 x 2 x 370mg), capsules Placebo control: ingredients not reported, capsules | |
| Outcomes | Lequesne index, BMI, CRP, ESR | |
| Notes | Exploratory study design; power, effect, and sample size not determined a priori. Reported university oversight, but unclear whether a formally consistuted human research ethics committee approved the research design. Results favour intervention. In the overweight intervention group, weight loss during the intervention period may have contributed to improvement. | |
| Risk of bias | ||
| Bias | Authors' judgement | Support for judgement |
| Random sequence generation (selection bias) | Low risk | Random number sequence |
| Allocation concealment (selection bias) | Unclear risk | Allocation concealment not reported |
| Blinding (performance bias and detection bias) | Low risk | Active intervention and placebo not distinguished by look, taste, smell, packaging, or medication regimen |
| Incomplete outcome data (attrition bias) | Unclear risk | Reported withdrawals (low risk) Per protocol analysis only (unclear risk) |
| Selective reporting (reporting bias) | Unclear risk | Incompletely reported adverse events |
| Other bias | Unclear risk | Diagnosis / assessment consistent with ACR criteria (low risk) Possible confounder: the berberine component of the intervention may have contributed to weight loss |
| Methods | Randomised, double blind, active control, 2 parallel groups, multicentre (26 centres in 5 countries). Duration 8 months (6 months intervention, 2 months follow up) | |
| Participants | Randomised n=361; intervention n=183, control n=178. Completed n=263; intervention n=142, control n=121. Included in ITT analyses n=357, intervention n=181, control n=176. Age 45+ years (range not reported). M:F 62:299. OA knee (ACR criteria) | |
| Interventions | Piascledine 300: Persa gratissma and Glycine max (avocado‐soyabean unsaponifiables), 300mg, capsules Active control: chondroitin sulphate, 1200mg (3 x 400mg), capsules Placebo control: ingredients not reported, capsules Rescue medication permitted: paracetamol (acetominophen), dose not reported | |
| Outcomes | WOMAC‐VAS (aggregated scores), pain with active movement VAS 0‐100, pain at rest VAS 0‐100, Lequesne index (0‐24), use of rescue medication | |
| Notes | Confirmatory study; statistical power 80%, alpha 0.05. Reported ethics committee application (approval not specified), and compliance with ICH GCP guidelines. WOMAC aggregated scores converted to normalised scores for data extraction and re‐analysis. Results show that ASU is not inferior to chondroitin sulphate on any outcome. | |
| Risk of bias | ||
| Bias | Authors' judgement | Support for judgement |
| Random sequence generation (selection bias) | Low risk | Described as randomised, method of randomisation incompletely reported1. "Randomisation to the two treatment groups was performed using the computer program Rancode 1.0". Author contacted: provided full details of computer generated randomisation |
| Allocation concealment (selection bias) | Low risk | Adequate allocation concealment can be inferred1. Author contacted: confirmed allocation concealment using single sealed opaque envelopes |
| Blinding (performance bias and detection bias) | Low risk | Described as double‐blind. Double‐dummy method, placebo controls for both intervention and active controls. Active interventions and placebos not distinguished by look, taste, smell or packaging |
| Incomplete outcome data (attrition bias) | Low risk | Reported withdrawals. Included intention‐to‐treat analysis |
| Selective reporting (reporting bias) | Low risk | Reported adverse events. Discussed intervention safety |
| Other bias | Low risk | Diagnosis/assessment consistent with ACR criteria |
| Methods | Randomised, placebo control, 2 parallel groups, multicentre study. Duration 4 weeks | |
| Participants | Randomised n=45, Completed n=45. Reported no withdrawals. Assume that group sizes were allocated a priori; intervention n=30, control n=15. Mean age 60 yrs, range 45‐75 yrs. All male. Inclusion: OA knee (ACR criteria), Kellgren stage II‐III, pain most days of the month, NSAIDs for 3 months | |
| Interventions | Tradename not provided. Uncaria guianensis (cat's claw), aqueous extract, freeze‐dried, 100mg, tablets Placebo control: ingredient not reported, "same excipient but without cat's claw", tablets | |
| Outcomes | Pain at rest VAS 0‐10, pain at night VAS 0‐10, tenderness 0‐3, global tolerance 0‐4, blood variables | |
| Notes | Exploratory study design; power, effect, and sample size not determined a priori. Reported compliance with Declaration of Helsinki. Results favour intervention. | |
| Risk of bias | ||
| Bias | Authors' judgement | Support for judgement |
| Random sequence generation (selection bias) | Unclear risk | Described as randomised, method not reported. Assume that group sizes were allocated a priori |
| Allocation concealment (selection bias) | Unclear risk | Allocation concealment not reported |
| Blinding (performance bias and detection bias) | Low risk | Active intervention and placebo not distinguished by look, taste, smell or packaging |
| Incomplete outcome data (attrition bias) | Low risk | Reported 100% compliance, no withdrawals (intervention over 4 weeks) (low risk) Per‐protocol analysis (unclear risk) |
| Selective reporting (reporting bias) | Unclear risk | Outcome measure VAS 0‐10 converted to 100mm scale for data extraction (low risk) Variances reported as standard error of measurement (SEM). When converted to standard deviation (SD), data are skewed, violating an assumption of the inferential analyses (unclear risk) Reported adverse events (low risk) |
| Other bias | Low risk | Diagnosis / assessment consistent with ACR criteria |
| Methods | Randomised, placebo control, 2 group crossover. Duration 6.5 months; 14 days run‐in, 2 x 3 months (˜12 weeks) intervention, no washout period) | |
| Participants | Randomised n=112, Completed stage 1 n=97, Completed stage 2 n=85. Mean age 67 yrs. M:F 41:71. Inclusion: primary OA hip, knee, hand, shoulder, or neck, radiographic verification (criteria not specified), mild to moderate pain | |
| Interventions | Hyben Vital: Rosa canina lito (rosehip and seed), 5000mg (2 x 5 x 500mg) equivalent to 1.5mg galactolipid, capsules Placebo control: ingredients not reported, capsules Rescue medication permitted: self‐prescribed analgesics, measured in paracetamol equivalents Concurrent medication permitted: stable prescribed NSAIDs | |
| Outcomes | Pain change 0‐4, rescue medication use (paracetamol equivalents), joint stiffness change 0‐4, point in time severity of pain, joint stiffness, wellbeing diary (mood, energy, sleep), patient treatment preference | |
| Notes | Exploratory study design; power, effect, and sample size not determined a priori. Reported ethics committee approval. Results moderately favour intervention. Evidence of carry‐over effect in the group receiving the intervention prior to the placebo. | |
| Risk of bias | ||
| Bias | Authors' judgement | Support for judgement |
| Random sequence generation (selection bias) | Low risk | Randomised in blocks of four, to one of two groups, using a computer generated allocation schedule |
| Allocation concealment (selection bias) | Low risk | Adequate allocation concealment can be inferred1 |
| Blinding (performance bias and detection bias) | Low risk | Active intervention and placebo not distinguished by look, taste, smell, or packaging |
| Incomplete outcome data (attrition bias) | Low risk | Reported withdrawals Included per‐protocol and intention‐to‐treat analyses |
| Selective reporting (reporting bias) | Unclear risk | Reported adverse events (low risk) Subgroup analyses published separately (unclear risk) |
| Other bias | High risk | Criteria for diagnosis of OA not specified (high risk) |
| Methods | Randomised, double blind, placebo control, 2 group crossover. Duration 14 days (˜2 weeks); 2 x 7 days (˜1 week) intervention, no washout period | |
| Participants | Randomised n=30, Completed n=30. Mean age 66 yrs, range 45‐81 yrs. M:F 7:23. Inclusion: OA knee, hip, thumb, shoulder (criteria not specified) | |
| Interventions | PhytodolorRN: standardised extract mixture of ash bark, aspen leaf, aspen bark, golden rod herb, 3 x 40 drops, tincture Placebo control: ingredients not reported | |
| Outcomes | Diclofenac use, pain at rest 0‐3, pressure pain 0‐3, pain with mvt 0‐3, mobility impairment (scale not reported) | |
| Notes | Exploratory study design; power, effect, and sample size not determined a priori. Did not report ethical oversight or compliance with guidelines. Results favour intervention (reduced used of diclofenac only, results equivocal for other outcomes). | |
| Risk of bias | ||
| Bias | Authors' judgement | Support for judgement |
| Random sequence generation (selection bias) | Unclear risk | Described as randomised, method not reported |
| Allocation concealment (selection bias) | Unclear risk | Allocation concealment not reported |
| Blinding (performance bias and detection bias) | Unclear risk | Described as double blind, method not reported. In other studies of PhytodolorRN, active intervention and placebo not distinguished by look, taste, smell or packaging |
| Incomplete outcome data (attrition bias) | Low risk | Reported 100% compliance, no withdrawals: likely in intervention over 7 days Intention‐to‐treat analysis can be assumed |
| Selective reporting (reporting bias) | Unclear risk | Reported adverse events (low risk) |
| Other bias | Unclear risk | Criteria for diagnosis of OA not specified (unclear risk) |
| Methods | Randomised, placebo control, 2 parallel groups. Duration 30 days (˜4 weeks) | |
| Participants | Randomised n=56, Completed n=56. Age and gender data not reported. Inclusion: OA spine (criteria not specified), acute exacerbations | |
| Interventions | Arthrotabs®: Harpagophytum procumbens (devil's claw), aqueous extract, 4290mg (2 x 3 x 715mg), tablets Placebo control: ingredients not reported | |
| Outcomes | Pain 0‐4 | |
| Notes | Exploratory study design; power, effect, and sample size not determined a priori. Did not report ethical oversight or compliance with guidelines. Results favour intervention. | |
| Risk of bias | ||
| Bias | Authors' judgement | Support for judgement |
| Random sequence generation (selection bias) | Unclear risk | Described as randomised, method not reported |
| Allocation concealment (selection bias) | Unclear risk | Allocation concealment not reported |
| Blinding (performance bias and detection bias) | Unclear risk | Described as double blind, method not reported |
| Incomplete outcome data (attrition bias) | Low risk | Reported 100% compliance, no withdrawals |
| Selective reporting (reporting bias) | Unclear risk | Outcome data reported as percentages and bar charts only, insufficient for extraction (unclear risk) Reported adverse events (low risk) |
| Other bias | High risk | Criteria for diagnosis of OA not specified (high risk) Unvalidated outcome measure (unclear risk) |
| Methods | Randomised, placebo control, 2 parallel, stratified groups. Duration 2 weeks | |
| Participants | Randomised n=78, Completed n=68. Mean age 53 yrs. M:F 59:19. Inclusion: OA hip or knee (ACR criteria), clinical, radiographic and laboratory verification | |
| Interventions | Tradename not provided. Salix purpurea x daphnoides cortex (willow bark) extract, 1360mg (2 x 2 x 340mg, equivalent to 240mg salicin), tablets Placebo control: cellulose and lactose, tablets | |
| Outcomes | WOMAC, patient global, physician global, haematology, urinanalysis | |
| Notes | Exploratory study design; power, effect, and sample size not determined a priori. Reported ethics committee approval and compliance with ICH GCP guidelines. Results favour intervention. | |
| Risk of bias | ||
| Bias | Authors' judgement | Support for judgement |
| Random sequence generation (selection bias) | Low risk | Randomised in blocks of four, using a computer generated random number sequence |
| Allocation concealment (selection bias) | Low risk | Adequate allocation concealment can be inferred1. Authors contacted for confirmation, but details of allocation concealment not provided |
| Blinding (performance bias and detection bias) | Low risk | Active intervention and placebo not distinguished by look, taste, smell, or packaging |
| Incomplete outcome data (attrition bias) | Low risk | Reported withdrawals. Included per‐protocol and intention‐to‐treat analyses |
| Selective reporting (reporting bias) | Low risk | Reported adverse events. Discussed intervention safety (low risk) |
| Other bias | Low risk | Diagnosis/assessment consistent with ACR criteria |
| Methods | Randomised, double blind, placebo control, 3 parallel groups (2 x intervention). Duration 90 days (˜12 weeks) | |
| Participants | Randomised n=75, Completed n=70, intervention low dose (100mg/day 5‐Loxin) n=24, intervention high dose (250mg/day 5‐Loxin) n=23, control n=23 Mean age: control 52.4 yrs, intervention low dose 52.3 yrs, intervention high dose 53.2 yrs. M:F intervention low dose 7:17, intervention high dose 8:15, control 5:18. OA knee (ACR criteria), must report pain with movement VAS 0‐100 between 40mm and 70mm and Lequesne index > 7 points at baseline | |
| Interventions | 5‐Loxin®: extract of Boswellia serrata with 30% 3‐O‐acetyl‐11‐keto‐beta‐boswellic acid, low dose 100mg (2 x 50mg), high dose 250mg (5 x 50mg), capsules Placebo control: rice bran, capsules Rescue medication permitted: ibuprofen, up to 1200mg (3 x 400mg) PRN | |
| Outcomes | VAS, Lequesne index, WOMAC | |
| Notes | Confirmatory study design: statistical power 80%, alpha set at 0.05 ( 2 tailed). Reported institutional review board oversight, but unclear whether a formally constituted HREC approved the research design. Reported clinical trails registration (ISRCTN05212803). Results favour intervention. | |
| Risk of bias | ||
| Bias | Authors' judgement | Support for judgement |
| Random sequence generation (selection bias) | Low risk | Computer generated randomisation table |
| Allocation concealment (selection bias) | Unclear risk | Allocation concealment not reported |
| Blinding (performance bias and detection bias) | Low risk | Active intervention and placebo not distinguished by look, taste, smell, packaging, or medication regimen |
| Incomplete outcome data (attrition bias) | Unclear risk | Reported withdrawals (low risk) Per protocol analysis only (unclear risk) |
| Selective reporting (reporting bias) | Unclear risk | Reported adverse events Standard errors of measure erroneously labelled as standard deviations for some outcome data (WOMAC function subscale). Errors corrected during data extraction for re‐analysis (Analysis 2.2, Analysis 3.2) |
| Other bias | Unclear risk | Diagnosis/assessment consistent with ACR crtieria (low risk) Non‐comparable groups: Intervention low‐dose group reported markedly greater pain (WOMAC subscale) than the other groups at baseline (unclear risk) |
| Methods | Randomised, placebo control, 3 parallel groups (2 active products derived from the same herb), single centre trial. Duration 90 days (˜12 weeks) | |
| Participants | Randomised n=60, Completed n=57, intervention A (100mg/day 5‐Loxin) n=19, intervention B (100mg/day Aflapin) n=19, control n=19. Mean age: intervention A 51.6 yrs, intervention B 53.2 yrs, control 52.4 yrs. M:F intervention A 3:16, intervention B 7:12, control 9:10. OA knee (ACR criteria), regular NSAID or acetominophen use for pain, must report pain VAS 0‐100 between 40mm and 70mm and Lequesne index > 7 points at baseline after regular medication washout | |
| Interventions | 5‐Loxin®: extract of Boswellia serrata with 30% 3‐O‐acetyl‐11‐keto‐beta‐boswellic acid 100mg (2 x 50mg), capsules Aflapin®: extract ofBoswellia serrata, enriched with 30% 3‐O‐acetyl‐11‐keto‐beta‐boswellic acid, and non‐volatile Boswellia serrata oil, 100mg (2 x 50mg), capsules Placebo control: ingredients not reported, "filled with a suitable excipient", capsules Rescue medication permitted: ibuprofen, up to 1200mg (3 x 400mg) PRN | |
| Outcomes | Pain VAS 0‐100, Lequesne index, WOMAC‐VAS (normalised units) pain, stiffness, physical function subscales | |
| Notes | Confirmatory study design; statistical power 80%, alpha set at 0.05 (2 tailed). Reported institutional review board oversight, but unclear whether a formally constituted human research ethics committee approved the research design. Reported clinical trials registration (ISRCTN80793440). Results favour Aflapin over 5‐Loxin, and both products over placebo. | |
| Risk of bias | ||
| Bias | Authors' judgement | Support for judgement |
| Random sequence generation (selection bias) | Low risk | Computer generated randomisation table |
| Allocation concealment (selection bias) | Low risk | Adequate allocation concealment can be inferred: "The clinical trial pharmacist and statistician ensured that treatment codes remained confidential" |
| Blinding (performance bias and detection bias) | Low risk | Active intervention and placebo not distinguished by look, taste, smell, packaging, or medication regimen |
| Incomplete outcome data (attrition bias) | Unclear risk | Reported withdrawals (low risk) Per‐protocol analysis only (unclear risk) |
| Selective reporting (reporting bias) | Low risk | Reported adverse events |
| Other bias | Low risk | Diagnosis/assessment consistent with ACR criteria (low risk) |
| Methods | Randomised, unblinded, active control (valdecoxib), 2 parallel groups. Duration 7 months; 6 months (˜24 weeks) intervention, plus 1 month follow‐up | |
| Participants | Randomised n=66; intervention n=33, control n=33. Completed n=57; intervention n=31, control n=27. Age 40‐70 years. OA knee (ACR criteria). Not pregnant or lactating | |
| Interventions | Cap Wovkel™: containing Boswellia serrata extract with 65% organic acids, 999mg (3 x 333mg), capsules Active control: valdecoxib, 10mg OD, tablets Rescue medication permitted: ibuprofen, up to 1200mg (400mg TID), PRN | |
| Outcomes | WOMAC‐VAS (aggregated scores) | |
| Notes | Exploratory study design; power, effect, and sample size not determined a priori. Reported university oversight, but unclear whether a formally constituted HREC approved the research design. WOMAC aggregated scores converted to normalised VAS 0‐100 scale during data extraction for re‐analysis. Results reported to favour intervention, but re‐analysis of data indicates that results slightly favour intervention for WOMAC pain subscale scores only. Results favour control on all other outcomes. | |
| Risk of bias | ||
| Bias | Authors' judgement | Support for judgement |
| Random sequence generation (selection bias) | Low risk | Randomised using an independent computerised system: "The patients were randomly allocated by SAS for Windows..." |
| Allocation concealment (selection bias) | High risk | Open trial. Allocation not concealed |
| Blinding (performance bias and detection bias) | High risk | Open trial. Medication regimens differ between active control and intervention |
| Incomplete outcome data (attrition bias) | Unclear risk | Reported withdrawals (low risk) Per‐protocol analysis only (unclear risk) |
| Selective reporting (reporting bias) | Low risk | Reported adverse events and rescue medication use |
| Other bias | Low risk | Diagnosis / assessment consistent with ACR criteria |
| Methods | Randomised, double blind, active control, 2 parallel groups. Duration 5 weeks; 1 week run‐in, 4 weeks intervention | |
| Participants | Randomised n=200, Completed n=188. Mean age 62 yrs. M:F 41:159. Inclusion: OA knee unilateral or bilateral (ACR criteria), Kellgren stage II‐IV | |
| Interventions | Duhuo Jisheng Wan (DJW): herbal mixture containing angelica root and mulberry mistletoe, 9000mg (6 x 3 x 500mg), capsules Active control: diclofenac sodium (Voltaren), 75mg (3 x 25mg), tablets packed in capsules Placebo controls: cane sugar, tablets packed in capsules, and capsules | |
| Outcomes | Battery of pain VAS 0‐100 (night pain, pain with standing, pain with movement, pain with stair climbing, resting pain, total pain), battery of stiffness VAS 0‐100 (morning stiffness, stiffness at rest, total stiffness), Lequesne index, time to climb 10 stairs, patient opinion of improvement VAS 0‐100, investigator opinion of improvement VAS 0‐100 | |
| Notes | Exploratory study design; power, effect, and sample size not determined a priori. Reported ethics committee approval and compliance with Declaration of Helsinki. Reported clinical trials registration (ISRCTN70292892). DJW equally effective as diclofenac on pain, stiffness, and Lequesne index. Participants using DJW reported improvements after a longer period of intervention that participants using diclofenac. Toxicity profiles of interventions are approximately equal. DJW is a large dose (9g, administered as 18 capsules per day) which may be a barrier to long‐term clinical compliance. | |
| Risk of bias | ||
| Bias | Authors' judgement | Support for judgement |
| Random sequence generation (selection bias) | Unclear risk | Described as randomised, method not reported. Baseline parameters compared for significant differences |
| Allocation concealment (selection bias) | Unclear risk | Allocation concealment not reported |
| Blinding (performance bias and detection bias) | Low risk | Described as double‐blind. Double‐dummy method, placebo controls for both intervention and active controls. Active interventions and placebos not distinguished by look, taste, smell or packaging |
| Incomplete outcome data (attrition bias) | Low risk | Reported withdrawals. Included intention‐to‐treat analysis |
| Selective reporting (reporting bias) | Low risk | Reported adverse events. Discussed intervention safety |
| Other bias | Low risk | Diagnosis / assessment consistent with ACR criteria |
| Methods | Randomised, double blind, placebo control, 2 parallel groups. Duration 30 days (˜5 weeks) | |
| Participants | Randomised n=60; intervention n=30, control n=30. Completed n=59; intervention n=30, control n=29. Age 40‐80 years. OA knee (ACR criteria), most painful knee VAS >40mm, Lequesne index >7 | |
| Interventions | Aflapin®: extract ofBoswellia serrata with 30% 3‐O‐acetyl‐11‐keto‐beta‐boswellic acid and non‐volatile Boswellia serrata oil, 100mg (2 x 50mg), capsules. Placebo control: ingredients not reported, "similar organoleptic properties", capsules Rescue medication permitted: ibuprofen, up to 1200mg (3 x 400mg) PRN | |
| Outcomes | VAS, Lequesne index, WOMAC‐VAS (normalised units), pain, stiffness, physical function subscales | |
| Notes | Exploratory study design; power, effect, and sample size not determined a priori. Reported institutional review board oversight, but unclear whether a formally constituted HREC approved the research design. Reported clinical trials registration (ISRCTN69643551). Results favour intervention. | |
| Risk of bias | ||
| Bias | Authors' judgement | Support for judgement |
| Random sequence generation (selection bias) | Low risk | Computer generated randomisation schedule |
| Allocation concealment (selection bias) | Low risk | Adequate allocation concealment can be inferred: "Randomization codes were secured confidentially by the clinical trial pharmacist and statistician" |
| Blinding (performance bias and detection bias) | Low risk | Described as double‐blind. Active intervention and placebo not distinguished by look, taste, smell, packaging, or medication regimen |
| Incomplete outcome data (attrition bias) | Unclear risk | Reported withdrawals (low risk) Per‐protocol analysis only (unclear risk) |
| Selective reporting (reporting bias) | Low risk | Reported adverse events |
| Other bias | Low risk | Diagnosis / assessment consistent with ACR criteria |
| Methods | Randomised, placebo control, 2 parallel groups. Duration 4 months (˜20 weeks) | |
| Participants | Randomised n=100; intervention n=50, control n=50. Completed n=96; intervention n= 48, control n=48. Mean age 65 yrs. M:F 35:65. Inclusion: OA hip or knee, radiographic verification (criteria not specified) | |
| Interventions | Hyben Vital: Rosa canina lito (rosehip and seed), 5000mg (2 x 5 x 500mg), equivalent to 1.5mg galactolipid, capsules Placebo control: ingredients not reported, capsules | |
| Outcomes | Active and passive range of motion (goniometer), activities of daily living VAS 0‐10, pain relief 0‐4, NSAID use | |
| Notes | Exploratory study design; power, effect, and sample size not determined a priori. Did not report ethical oversight or compliance with guidelines. Results favour intervention for some ranges of motion and pain, but are less convincing for activities of daily living. | |
| Risk of bias | ||
| Bias | Authors' judgement | Support for judgement |
| Random sequence generation (selection bias) | Low risk | Randomised using an independent computerised system |
| Allocation concealment (selection bias) | Unclear risk | Allocation concealment not reported |
| Blinding (performance bias and detection bias) | Low risk | Active intervention and placebo not distinguished by look, taste, smell, packaging, or medication regimen |
| Incomplete outcome data (attrition bias) | Low risk | Reported withdrawals. Included intention‐to‐treat and per protocol analyses |
| Selective reporting (reporting bias) | Unclear risk | Pain data reported as percentages and graphs only, insufficient for data extraction (unclear risk) Reported adverse events (low risk) |
| Other bias | Unclear risk | Criteria for diagnosis of OA not specified, radiographic verification only (unclear risk) |
| Methods | Randomised, double blind, placebo control, 2 group crossover. Duration 48.5 weeks; 4 days run‐in, 2 x 12 weeks crossover, 24 weeks open follow‐up | |
| Participants | Randomised n=29, Completed stage 1 n=24, Completed stage 2 n=20, Completed stage 3 (open trial) n=17. Mean age 62 yrs, range 42‐85 yrs Inclusion: OA knee (ACR criteria), Kellgren II‐IV, pain VAS 0‐100 >35mm. Not pregnant or lactating | |
| Interventions | Zintona EC: Zingiber officinale (ginger) extract, 1000mg (4 x 250mg), equivalent to 40mg gingerol, capsules. Capsule contains 10mg gingerol absorbed on maltodextrin Placebo control: maltodextrin only | |
| Outcomes | WOMAC (Hebrew), knee circumference | |
| Notes | Exploratory study design; power, effect, and sample size not determined a priori. Reported ethics committee approval. Results equivocal in stage 1. Results in stage 2 and stage 3 favour intervention. | |
| Risk of bias | ||
| Bias | Authors' judgement | Support for judgement |
| Random sequence generation (selection bias) | Low risk | Randomised to one of two groups using a computer generated random number sequence |
| Allocation concealment (selection bias) | Low risk | Adequate allocation concealment can be inferred: "Both patients and investigators were blinded to treatment assignment" |
| Blinding (performance bias and detection bias) | Low risk | Active intervention and placebo not distinguished by look, taste, smell, packaging, or medication regimen |
| Incomplete outcome data (attrition bias) | Low risk | Reported withdrawals. Included intention‐to‐treat analysis (success versus failure) |
| Selective reporting (reporting bias) | Unclear risk | Outcome data reported as means and confidence intervals. Standard deviations calculated for data extraction (unclear risk) Reported adverse events |
| Other bias | Low risk | Diagnosis / assessment consistent with ACR criteria |
| Methods | Randomised, placebo control, 2 group crossover. Duration 6.5 months; 14 days run‐in, 2 x 3 months (˜12 weeks) intervention, no washout period | |
| Participants | Randomised n=94, Completed stage 1 n=94, Completed stage 2 n=80. Mean age 66 yrs. M:F 40:54. Inclusion: aged 35+ years, primary OA hip or knee, radiographic verification (ACR criteria), mild to moderate pain | |
| Interventions | LitoZin: Rosa canina lito (rosehip and seed), 5000mg (2 x 5 x 500mg), equivalent to 1.5mg galactolipid, capsules Placebo control: ingredients not reported, "inactive powder of similar taste, smell, and colour", capsules | |
| Outcomes | WOMAC‐VAS | |
| Notes | Exploratory study design; power, effect, and sample size not determined a priori. Reported ethics committee approval. Results moderately favour intervention. Evidence of carryover effect in the group receiving the intervention prior to the placebo. | |
| Risk of bias | ||
| Bias | Authors' judgement | Support for judgement |
| Random sequence generation (selection bias) | Low risk | Randomised in blocks of four, to one of two groups, using a computer generated allocation schedule |
| Allocation concealment (selection bias) | Low risk | Adequate allocation concealment can be inferred1 |
| Blinding (performance bias and detection bias) | Low risk | Active intervention and placebo not distinguished by look, taste, smell, or packaging |
| Incomplete outcome data (attrition bias) | Low risk | Reported withdrawals. Included intention‐to‐treat analysis |
| Selective reporting (reporting bias) | Unclear risk | Reported adverse events (low risk) Subgroup analyses published separately (unclear risk) |
| Other bias | Low risk | Diagnosis / assessment consistent with ACR criteria |
Unless otherwise stated, all oral medications are reported as total daily doses, which may have been administered in single or divided doses.
Unless subscales are named, outcome measures (eg: WOMAC, HAQ, COAT) were used in entirety. Unless specified, all outcome measures were administered, scored, and scaled according to Osteoarthritis Research Society International (OARSI) standards.
1. Reported compliance with ICH GCP guidelines (ICH 2004) anchored in European law, or ethics committee oversight that would require the same, so adequate randomisation, allocation concealment, and blinding can be assumed.
2. Indicates that the tradename was not provided in the manuscript, but has been determined through communication with the manufacturing company noted in the acknowledgements.
Characteristics of excluded studies [ordered by study ID]
Jump to:
| Study | Reason for exclusion |
| Discussion paper | |
| Intervention included extracted or synthetic curcumin and another synthetic compound from soy lecithin (isolated compounds), therefore not herbal as per WHO definition | |
| Abstract only. Unable to identify individual herbal interventions. Ingredients not listed in sufficient detail to allow replication of the study | |
| Mixed sample, including people with rheumatoid arthritis and non‐specific arthritis. Unable to extract data on OA only | |
| Review paper | |
| Repeat publication of Leblan 2000 | |
| Review paper | |
| Discussion paper | |
| Mixed sample, including people with "rheumatism due to blockage of cold and damp". Unable to extract data on OA only | |
| Discussion paper | |
| Individualised treatments, not a standardised dose, therefore, considered as a case series rather than RCT. Metabolic outcomes only. No functional or clinical outcomes | |
| Discussion paper | |
| Not RCT | |
| Case series, not RCT. Used inappropriate statistical analyses | |
| Individualised treatments, not a standardised plant product or dose, therefore, a case series rather than RCT. Abstract only available from CENTRAL. Cannot locate full manuscript | |
| Intervention not purely herbal. Unable to identify effects of herbal intervention alone | |
| Case study | |
| Discussion paper | |
| Intervention not purely herbal. Unable to identify effects of herbal interventions alone. Ingredients not listed in sufficient detail to allow replication of the study | |
| Individualised treatments, not a standardised plant product or dose, therefore, considered as a case series rather than RCT | |
| Intervention (Limbrel) included extracted biacalin and catechin (flavanoids, isolated compounds), therefore not herbal as per WHO definition. According to the manufacturer, "each capsule of Limbrel also contains 50 mg of citrated zinc bisglycinate, which provides 10 mg of elemental zinc", a potentially active substance (http://www.limbrel.com/limbrel.php). Study is only repeatable using the proprietary product | |
| Not RCT | |
| Not RCT. Primary measures not consistent with the topic of this review | |
| Review paper | |
| Repeat analysis (safety data only) of Jung 2004 | |
| Not RCT (single group trial). Author list in indexed citation differs from actual publication | |
| Not RCT (open label, uncontrolled study) | |
| Intervention included magnesium (mineral), therefore not herbal as per WHO definition. Magnesium is a potentially active substance that may alter the active principle of the herbal extracts, unless it has been demonstrated that they are essentially similar | |
| Abstract only. Subgroup analysis of Rein 2004a | |
| Discussion paper | |
| Not RCT. Open‐label, uncontrolled, cohort (single group) study | |
| Not RCT | |
| Not RCT | |
| Mixed sample, including people with back pain not due to osteoarthritis. Unable to extract data on OA only | |
| Abstract only. Abstract to Schmid 2000 and Schmid 2001 | |
| Repeat publication of Schmid 2000 | |
| Not RCT | |
| Not RCT | |
| Not RCT | |
| Abstract only. Subgroup analysis of Rein 2004a | |
| Not RCT (case series) | |
| Not RCT (protocol for RCT) | |
| Not RCT | |
| Metabolic outcomes only. No functional or clinical outcomes |
Characteristics of studies awaiting assessment [ordered by study ID]
Jump to:
| Methods | RCT, 2 parallel groups. Duration: 4 weeks |
| Participants | n=96 (intervention n=48, active control n=48) |
| Interventions | Intervention: Bushen Huoxue Qubi decoction (ingredients unknown), one bag/day Active control: diacerein (50 mg Bid, Po) and celecoxib (0.2 Qd, Po) |
| Outcomes | VAS (outcome and scale unknown), WOMAC, relative viscosity, aggregation index and IL‐1beta, NO, iNOS, LPO, SOD in serum, adverse events |
| Notes | Abstract only available. China Journal of Chinese materia medica indexed, but not held in known collections. Full manuscript sought in hard copy via inter‐library loan. |
| Methods | RCT, multicentre (n=2; USA and Hong Kong), 2 parallel groups. Duration: 8 weeks |
| Participants | n=92 (USA n=53, Hong Kong n=39) |
| Interventions | Intervention: Hou‐Lou‐Xiao‐Ling Dan 5,180 mg/day (15 capsules in 3 divided doses) Control: placebo (ingredients unknown), dose matched to intervention |
| Outcomes | WOMAC, patient global, patient global assessment of response to therapy |
| Notes | Abstract only available. Abstracts from the annual ACR meeting are published in Arthritis and Rheumatism. This study will be classified if a full manuscript published. |
| Methods | RCT, 3 parallel groups |
| Participants | n=160 (A: intervention n=76, B: active control n=42, C: intervention plus active control n=46) |
| Interventions | Intervention: wangbi (ingredients and dose unknown) Active control: voltaren (dose unknown) |
| Outcomes | Morning stiffness, joint tenderness, swelling, pain, functional activities, adverse reactions (outcome measures unknown). Results favour combination therapy |
| Notes | Abstract only available. Chinese Journal of Intergrated Traditional and Western medicine indexed, but not held in known collections. Full manuscript sought in hard copy via inter‐library loan. |
| Methods | RCT |
| Participants | n=86. 4 groups: manipulation plus pyrola (n=22), manipulation (n=22), pyrola compound traditional Chinese medicine (n=22), and self‐exercise (n=20) |
| Interventions | The manipulation group: Prone position, rolling manipulation to the affected thigh for 5 minutes, mainly the Weizhong and Weiyang of the fossa poplitea and the posterolateral part of the leg; Supine position, rolling manipulation for 5 minutes to affected side of quadriceps femoris and superior part of the whirbone; Alternately manipulation of pressing‐kneading, flicking‐poking and digital‐pressing to Dubi, xiyan, Yanglingquan, Heding, Xiyangguan and Liangqiu; Rotating of the knee joint cooperated by the passive stretch, flexion, inward and lateral rotation; At last, spreading some ointment of Chinese holly leaf on the affected knee joint and scrubbing until give the patient a warm sensation. The treatment was done three times weekly for 4 weeks. Pyrola group: The patients were treated with Chinese herbs orally (modified pyrola compound traditional Chinese medicine) twice a day with water for weeks. Manipulation plus pyrola group: Patients were treated by Chinese herb orally besides the manipulation with the same processes as the manipulation group for 4 weeks. Self‐exercise group: Patients were told to do exercise themselves such as stretching exercises, active and passive range‐of‐motion exercises, strengthening exercises and so on for 4 weeks. |
| Outcomes | WOMAC 0‐100, 20m walk time |
| Notes | Abstract only available. Chinese Journal of Clinical Rehabilitation not indexed. Full manuscript sought in hard copy via inter‐library loan. |
| Methods | RCT |
| Participants | n=88 (intervention n=44, control n=44) |
| Interventions | Intervention: diclofenac 75mg/day with 1000mg/day curcumin (Curcuma longa extract) Active control: diclofenac 75mg/day with placebo (unknown) |
| Outcomes | Pain VAS, KOOS. Results equivocal |
| Notes | Abstract only available. Journal of the Medical Association of Thailand indexed, but not held in known collections. Full manuscript sought in hard copy via inter‐library loan. |
| Methods | RCT |
| Participants | n=90 (intervention n=45, control n=45) |
| Interventions | Intervention: gubitong decoction (dose and ingredients unknown) Control: glucosamine sulfate 1500mg/day (3 x 500mg) |
| Outcomes | WOMAC, symptom VAS. Results equivocal: statistically significant improvement in treatment and control groups |
| Notes | Abstract only available. Chinese Journal of Integrative Medicine not indexed. Full manuscript sought in hard copy via inter‐library loan. |
| Methods | RCT |
| Participants | n=88 (intervention n=44, control n=44) |
| Interventions | Intervention: Bushen Quhan Tongluo herbs by orally or externally washing Bushen Quhan. Tongluo: Hutaorou (12 g), Buguzhi (12 g), Chaoduzhong (12 g), Shudi (15 g), Dahuixiang (9 g), Luoshiteng (15 g), Zhichuanwu (9 g), Sanqi (6 g), Wugong (3 g), Jixieteng (15 g). The prescription for external washing: Tuogucao (40 g), Danggui (15 g), Sumu (15 g), Shengdahuang (15 g), Shengnanxing (10 g), Ruxiang (10 g), Meyao (10 g), Bingpian (3 g). Oral administration: The medicine shall be taken with water of 37 degrees C one dose a day. Patients in the control group were given sulfated glucosamine (Weiguli Capsule. Each capsule contains 314 mg of sulfated glucosamine crystal, which is equal to 250 mg of sulfated glucosamine) two capsules a time and 3 times a day as well as piroxicam (Yantong Xikang Pill) once a day and 20 mg each time. Patients in both groups were administrated for 12 weeks |
| Outcomes | WOMAC |
| Notes | Abstract only available. Chinese Journal of Clinical Rehabilitation not indexed. Full manuscript sought in hard copy via inter‐library loan. Unable to distinguish oral administration internvention group from topical administration intervention group results from abstract alone. |
Data and analyses
| Outcome or subgroup title | No. of studies | No. of participants | Statistical method | Effect size |
| 1 Pain (0 to 3) Show forest plot | 1 | Mean Difference (IV, Random, 95% CI) | Totals not selected | |
| Analysis 1.1  Comparison 1 Boswellia serrata 999 mg versus placebo, Outcome 1 Pain (0 to 3). | ||||
| 2 Function: loss of function (0 to 3) Show forest plot | 1 | Mean Difference (IV, Random, 95% CI) | Totals not selected | |
| Analysis 1.2  Comparison 1 Boswellia serrata 999 mg versus placebo, Outcome 2 Function: loss of function (0 to 3). | ||||
| 3 Participants (n) reported adverse effects Show forest plot | 1 | Risk Ratio (M‐H, Random, 95% CI) | Totals not selected | |
| Analysis 1.3  Comparison 1 Boswellia serrata 999 mg versus placebo, Outcome 3 Participants (n) reported adverse effects. | ||||
| Outcome or subgroup title | No. of studies | No. of participants | Statistical method | Effect size |
| 1 Pain VAS 0‐100 at 90 days Show forest plot | 2 | 85 | Mean Difference (IV, Random, 95% CI) | ‐16.57 [‐24.67, ‐8.47] |
| Analysis 2.1  Comparison 2 Boswellia serrata (enriched) 100 mg versus placebo, Outcome 1 Pain VAS 0‐100 at 90 days. | ||||
| 2 WOMAC‐VAS (Function) Show forest plot | 2 | 85 | Mean Difference (IV, Random, 95% CI) | ‐8.21 [‐14.21, ‐2.22] |
| Analysis 2.2  Comparison 2 Boswellia serrata (enriched) 100 mg versus placebo, Outcome 2 WOMAC‐VAS (Function). | ||||
| 3 Adverse event episodes (n) reported Show forest plot | 1 | Risk Ratio (M‐H, Random, 95% CI) | Totals not selected | |
| Analysis 2.3  Comparison 2 Boswellia serrata (enriched) 100 mg versus placebo, Outcome 3 Adverse event episodes (n) reported. | ||||
| Outcome or subgroup title | No. of studies | No. of participants | Statistical method | Effect size |
| 1 Pain VAS 0‐100 at 90 days Show forest plot | 1 | Mean Difference (IV, Random, 95% CI) | Totals not selected | |
| Analysis 3.1 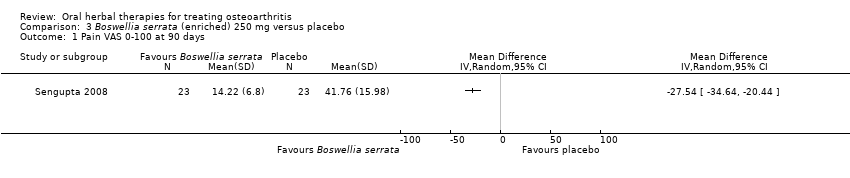 Comparison 3 Boswellia serrata (enriched) 250 mg versus placebo, Outcome 1 Pain VAS 0‐100 at 90 days. | ||||
| 2 WOMAC‐VAS (Function) Show forest plot | 1 | Mean Difference (IV, Random, 95% CI) | Totals not selected | |
| Analysis 3.2 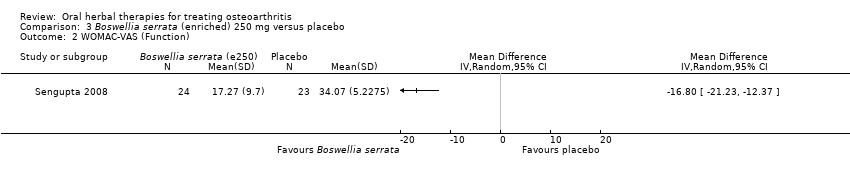 Comparison 3 Boswellia serrata (enriched) 250 mg versus placebo, Outcome 2 WOMAC‐VAS (Function). | ||||
| 3 Adverse event episodes (n) reported Show forest plot | 1 | Risk Ratio (M‐H, Random, 95% CI) | Totals not selected | |
| Analysis 3.3 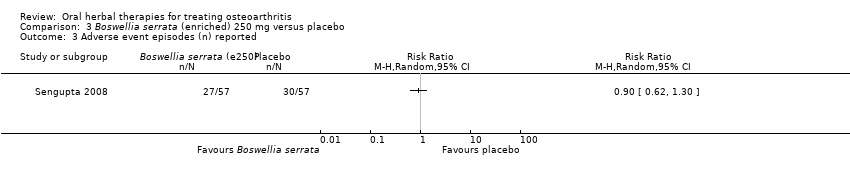 Comparison 3 Boswellia serrata (enriched) 250 mg versus placebo, Outcome 3 Adverse event episodes (n) reported. | ||||
| Outcome or subgroup title | No. of studies | No. of participants | Statistical method | Effect size |
| 1 Pain VAS 0‐100 Show forest plot | 2 | 97 | Mean Difference (IV, Random, 95% CI) | ‐16.09 [‐20.37, ‐11.81] |
| Analysis 4.1  Comparison 4 Boswellia serrata (enriched) 100 mg plus non‐volatile oil versus placebo, Outcome 1 Pain VAS 0‐100. | ||||
| 1.1 At 90 days | 1 | 38 | Mean Difference (IV, Random, 95% CI) | ‐18.10 [‐24.95, ‐11.25] |
| 1.2 At 30 days | 1 | 59 | Mean Difference (IV, Random, 95% CI) | ‐14.80 [‐20.29, ‐9.31] |
| 2 WOMAC‐VAS (Function) Show forest plot | 2 | 97 | Mean Difference (IV, Random, 95% CI) | ‐15.01 [‐19.21, ‐10.81] |
| Analysis 4.2 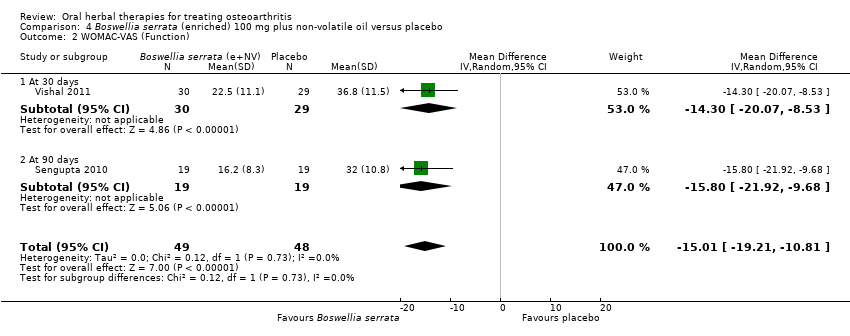 Comparison 4 Boswellia serrata (enriched) 100 mg plus non‐volatile oil versus placebo, Outcome 2 WOMAC‐VAS (Function). | ||||
| 2.1 At 30 days | 1 | 59 | Mean Difference (IV, Random, 95% CI) | ‐14.30 [‐20.07, ‐8.53] |
| 2.2 At 90 days | 1 | 38 | Mean Difference (IV, Random, 95% CI) | ‐15.8 [‐21.92, ‐9.68] |
| 3 Participants (n) reported adverse events Show forest plot | 2 | 97 | Odds Ratio (M‐H, Random, 95% CI) | 0.98 [0.13, 7.29] |
| Analysis 4.3 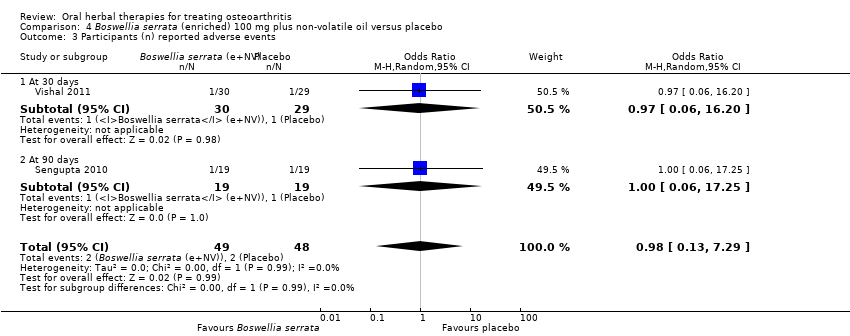 Comparison 4 Boswellia serrata (enriched) 100 mg plus non‐volatile oil versus placebo, Outcome 3 Participants (n) reported adverse events. | ||||
| 3.1 At 30 days | 1 | 59 | Odds Ratio (M‐H, Random, 95% CI) | 0.97 [0.06, 16.20] |
| 3.2 At 90 days | 1 | 38 | Odds Ratio (M‐H, Random, 95% CI) | 1.0 [0.06, 17.25] |
| Outcome or subgroup title | No. of studies | No. of participants | Statistical method | Effect size |
| 1 WOMAC‐VAS (Pain) Show forest plot | 1 | 58 | Mean Difference (IV, Random, 95% CI) | ‐0.51 [‐7.26, 6.24] |
| Analysis 5.1 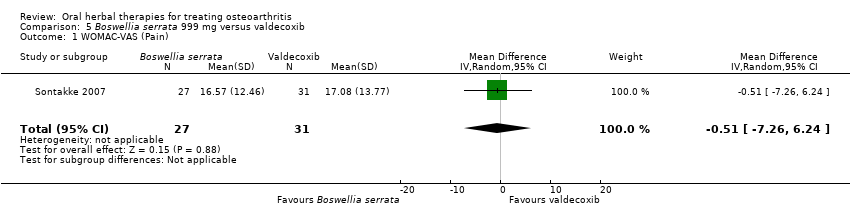 Comparison 5 Boswellia serrata 999 mg versus valdecoxib, Outcome 1 WOMAC‐VAS (Pain). | ||||
| 2 WOMAC‐VAS (Function) Show forest plot | 1 | 58 | Mean Difference (IV, Random, 95% CI) | 2.49 [‐4.07, 9.05] |
| Analysis 5.2 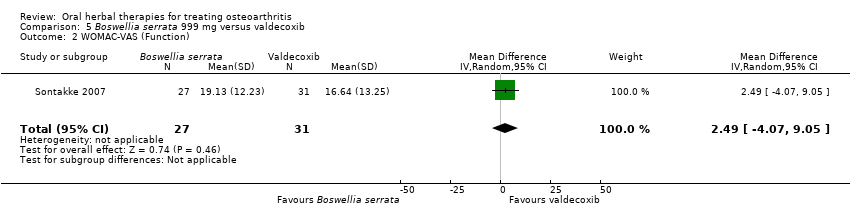 Comparison 5 Boswellia serrata 999 mg versus valdecoxib, Outcome 2 WOMAC‐VAS (Function). | ||||
| 3 Participants (n) reported adverse events Show forest plot | 1 | 66 | Risk Ratio (M‐H, Random, 95% CI) | 2.0 [0.39, 10.18] |
| Analysis 5.3  Comparison 5 Boswellia serrata 999 mg versus valdecoxib, Outcome 3 Participants (n) reported adverse events. | ||||
| 4 Participants (n) withdrew due to adverse events Show forest plot | 1 | 66 | Risk Ratio (M‐H, Random, 95% CI) | 3.0 [0.13, 71.07] |
| Analysis 5.4  Comparison 5 Boswellia serrata 999 mg versus valdecoxib, Outcome 4 Participants (n) withdrew due to adverse events. | ||||
| Outcome or subgroup title | No. of studies | No. of participants | Statistical method | Effect size |
| 1 Pain on walking NRS 0‐10 Show forest plot | 1 | Mean Difference (IV, Random, 95% CI) | Subtotals only | |
| Analysis 6.1  Comparison 6 Curcuma domestica versus ibuprofen, Outcome 1 Pain on walking NRS 0‐10. | ||||
| 2 Function: 100m walk time (seconds) Show forest plot | 1 | Mean Difference (IV, Random, 95% CI) | Subtotals only | |
| Analysis 6.2 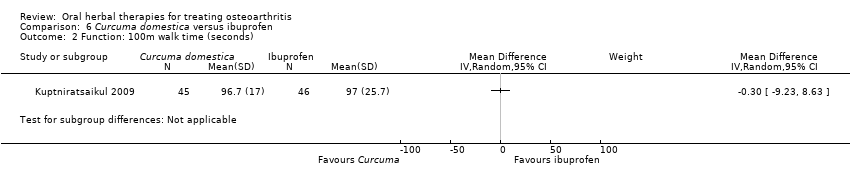 Comparison 6 Curcuma domestica versus ibuprofen, Outcome 2 Function: 100m walk time (seconds). | ||||
| 3 Participants (n) reported adverse events Show forest plot | 1 | 100 | Risk Ratio (M‐H, Random, 95% CI) | 0.75 [0.46, 1.25] |
| Analysis 6.3  Comparison 6 Curcuma domestica versus ibuprofen, Outcome 3 Participants (n) reported adverse events. | ||||
| Outcome or subgroup title | No. of studies | No. of participants | Statistical method | Effect size |
| 1 WOMAC‐VAS (Pain) change from baseline Show forest plot | 1 | 107 | Mean Difference (IV, Random, 95% CI) | 5.0 [‐1.84, 11.84] |
| Analysis 7.1 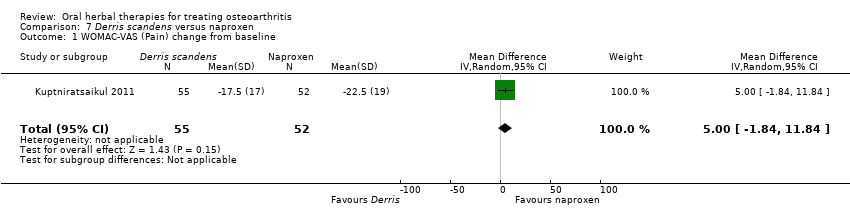 Comparison 7 Derris scandens versus naproxen, Outcome 1 WOMAC‐VAS (Pain) change from baseline. | ||||
| 2 WOMAC‐VAS (Function) change from baseline Show forest plot | 1 | 107 | Mean Difference (IV, Random, 95% CI) | 5.10 [‐0.13, 10.33] |
| Analysis 7.2  Comparison 7 Derris scandens versus naproxen, Outcome 2 WOMAC‐VAS (Function) change from baseline. | ||||
| 3 Participants (n) reported adverse events. Show forest plot | 1 | 125 | Risk Ratio (M‐H, Random, 95% CI) | 0.75 [0.49, 1.15] |
| Analysis 7.3  Comparison 7 Derris scandens versus naproxen, Outcome 3 Participants (n) reported adverse events.. | ||||
| Outcome or subgroup title | No. of studies | No. of participants | Statistical method | Effect size |
| 1 Pain VAS 0‐100 change from baseline at 120 days Show forest plot | 1 | 92 | Mean Difference (IV, Random, 95% CI) | ‐5.10 [‐6.52, ‐3.68] |
| Analysis 8.1 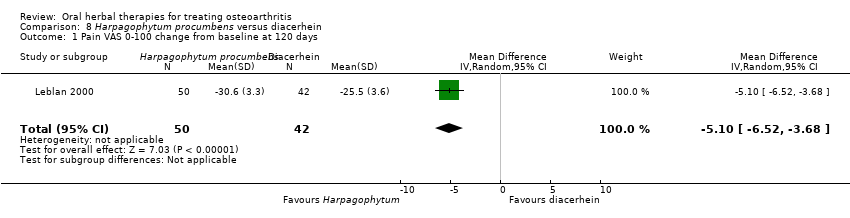 Comparison 8 Harpagophytum procumbens versus diacerhein, Outcome 1 Pain VAS 0‐100 change from baseline at 120 days. | ||||
| 2 Participants (n) reported adverse events Show forest plot | 1 | 92 | Risk Ratio (M‐H, Random, 95% CI) | 0.4 [0.21, 0.75] |
| Analysis 8.2 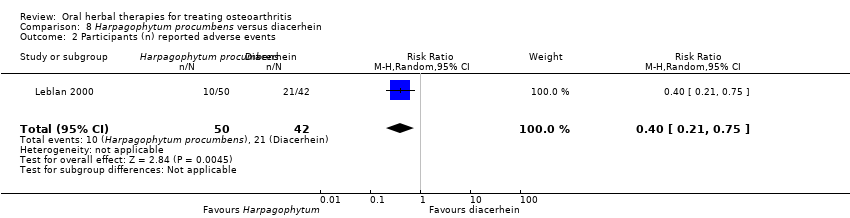 Comparison 8 Harpagophytum procumbens versus diacerhein, Outcome 2 Participants (n) reported adverse events. | ||||
| Outcome or subgroup title | No. of studies | No. of participants | Statistical method | Effect size |
| 1 Pain (scale unknown) with mvt change from baseline Show forest plot | 1 | 40 | Mean Difference (IV, Random, 95% CI) | ‐0.10 [‐1.31, 1.11] |
| Analysis 9.1  Comparison 9 Petiveria alliacea versus placebo, Outcome 1 Pain (scale unknown) with mvt change from baseline. | ||||
| 2 Participants (n) reported adverse events Show forest plot | 1 | 40 | Risk Ratio (M‐H, Random, 95% CI) | 1.5 [0.28, 8.04] |
| Analysis 9.2  Comparison 9 Petiveria alliacea versus placebo, Outcome 2 Participants (n) reported adverse events. | ||||
| Outcome or subgroup title | No. of studies | No. of participants | Statistical method | Effect size |
| 1 WOMAC‐VAS (Pain) Show forest plot | 1 | 37 | Mean Difference (IV, Random, 95% CI) | ‐142.0 [‐199.55, ‐84.45] |
| Analysis 10.1  Comparison 10 Pinus pinaster (Pycnogenol® 150 mg) versus placebo, Outcome 1 WOMAC‐VAS (Pain). | ||||
| 2 WOMAC‐VAS (Function) Show forest plot | 1 | 37 | Mean Difference (IV, Random, 95% CI) | ‐529.0 [‐741.59, ‐316.41] |
| Analysis 10.2 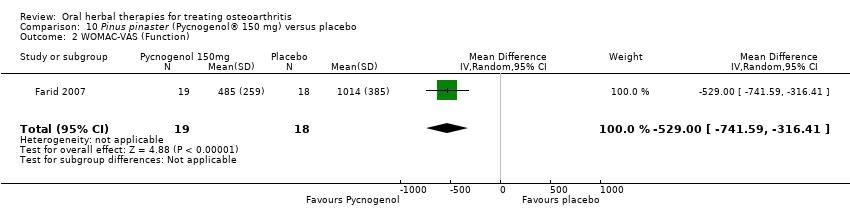 Comparison 10 Pinus pinaster (Pycnogenol® 150 mg) versus placebo, Outcome 2 WOMAC‐VAS (Function). | ||||
| 3 Participants (n) reported adverse events Show forest plot | 2 | 137 | Risk Ratio (M‐H, Random, 95% CI) | 0.40 [0.08, 1.97] |
| Analysis 10.3  Comparison 10 Pinus pinaster (Pycnogenol® 150 mg) versus placebo, Outcome 3 Participants (n) reported adverse events. | ||||
| Outcome or subgroup title | No. of studies | No. of participants | Statistical method | Effect size |
| 1 WOMAC 0‐4 (Pain) Show forest plot | 1 | 156 | Mean Difference (IV, Random, 95% CI) | ‐7.50 [‐8.43, ‐6.57] |
| Analysis 11.1 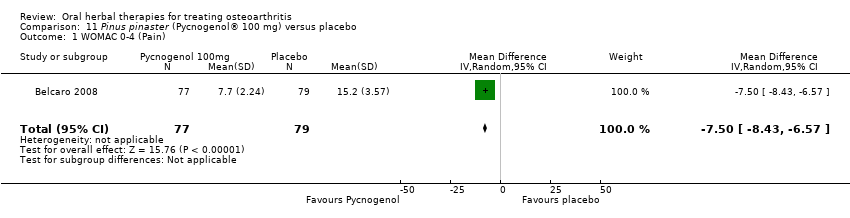 Comparison 11 Pinus pinaster (Pycnogenol® 100 mg) versus placebo, Outcome 1 WOMAC 0‐4 (Pain). | ||||
| 2 WOMAC 0‐4 (Function) Show forest plot | 1 | 156 | Mean Difference (IV, Random, 95% CI) | ‐29.3 [‐30.99, ‐27.61] |
| Analysis 11.2  Comparison 11 Pinus pinaster (Pycnogenol® 100 mg) versus placebo, Outcome 2 WOMAC 0‐4 (Function). | ||||
| Outcome or subgroup title | No. of studies | No. of participants | Statistical method | Effect size |
| 1 Participants (n) reported adverse events Show forest plot | 1 | 100 | Risk Ratio (M‐H, Random, 95% CI) | 0.04 [0.00, 0.66] |
| Analysis 12.1  Comparison 12 Ricinus officinale versus placebo, Outcome 1 Participants (n) reported adverse events. | ||||
| Outcome or subgroup title | No. of studies | No. of participants | Statistical method | Effect size |
| 1 Relief of pain (0 to 4) at 3 months Show forest plot | 1 | 97 | Mean Difference (IV, Random, 95% CI) | 0.43 [‐0.12, 0.98] |
| Analysis 13.1 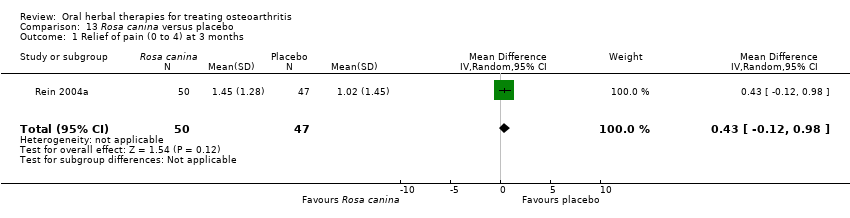 Comparison 13 Rosa canina versus placebo, Outcome 1 Relief of pain (0 to 4) at 3 months. | ||||
| 2 WOMAC‐VAS (Pain) Show forest plot | 1 | 94 | Mean Difference (IV, Random, 95% CI) | ‐2.5 [‐10.20, 5.20] |
| Analysis 13.2  Comparison 13 Rosa canina versus placebo, Outcome 2 WOMAC‐VAS (Pain). | ||||
| 3 WOMAC‐VAS (Function) Show forest plot | 1 | 94 | Mean Difference (IV, Random, 95% CI) | ‐1.20 [‐8.98, 6.58] |
| Analysis 13.3  Comparison 13 Rosa canina versus placebo, Outcome 3 WOMAC‐VAS (Function). | ||||
| 4 Participants (n) reported adverse events Show forest plot | 2 | 194 | Risk Ratio (M‐H, Random, 95% CI) | 1.67 [0.63, 4.43] |
| Analysis 13.4 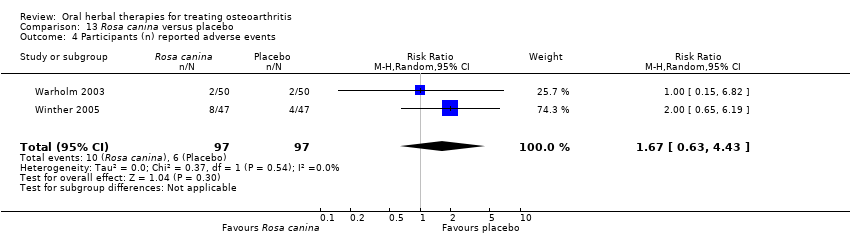 Comparison 13 Rosa canina versus placebo, Outcome 4 Participants (n) reported adverse events. | ||||
| Outcome or subgroup title | No. of studies | No. of participants | Statistical method | Effect size |
| 1 Pain VAS 0‐100 at 14 days Show forest plot | 1 | 68 | Mean Difference (IV, Random, 95% CI) | 0.0 [0.0, 0.0] |
| Analysis 14.1 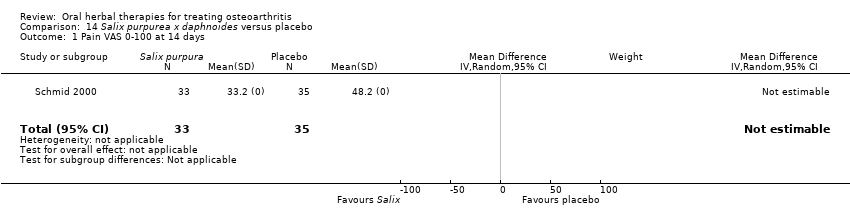 Comparison 14 Salix purpurea x daphnoides versus placebo, Outcome 1 Pain VAS 0‐100 at 14 days. | ||||
| 2 Function VAS 0‐100 at 14 days Show forest plot | 1 | 68 | Mean Difference (IV, Random, 95% CI) | 0.0 [0.0, 0.0] |
| Analysis 14.2  Comparison 14 Salix purpurea x daphnoides versus placebo, Outcome 2 Function VAS 0‐100 at 14 days. | ||||
| 3 Participants (n) reported adverse events Show forest plot | 1 | 84 | Risk Ratio (M‐H, Random, 95% CI) | 0.91 [0.57, 1.43] |
| Analysis 14.3  Comparison 14 Salix purpurea x daphnoides versus placebo, Outcome 3 Participants (n) reported adverse events. | ||||
| Outcome or subgroup title | No. of studies | No. of participants | Statistical method | Effect size |
| 1 WOMAC‐VAS (Pain) Show forest plot | 1 | Mean Difference (IV, Random, 95% CI) | Subtotals only | |
| Analysis 15.1  Comparison 15 Salix purpurea x daphnoides versus diclofenac, Outcome 1 WOMAC‐VAS (Pain). | ||||
| 1.1 At 14 days | 1 | 86 | Mean Difference (IV, Random, 95% CI) | 0.0 [0.0, 0.0] |
| 1.2 At 42 days | 1 | 86 | Mean Difference (IV, Random, 95% CI) | 15.0 [5.91, 24.09] |
| 2 WOMAC‐VAS (Function) Show forest plot | 1 | Mean Difference (IV, Random, 95% CI) | Subtotals only | |
| Analysis 15.2 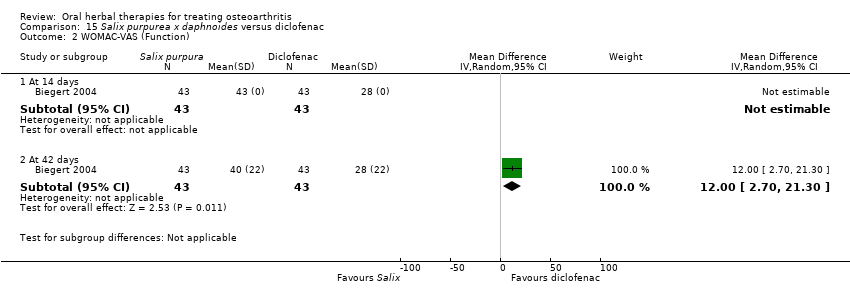 Comparison 15 Salix purpurea x daphnoides versus diclofenac, Outcome 2 WOMAC‐VAS (Function). | ||||
| 2.1 At 14 days | 1 | 86 | Mean Difference (IV, Random, 95% CI) | 0.0 [0.0, 0.0] |
| 2.2 At 42 days | 1 | 86 | Mean Difference (IV, Random, 95% CI) | 12.0 [2.70, 21.30] |
| 3 Participants (n) reported adverse events Show forest plot | 1 | 86 | Risk Ratio (M‐H, Random, 95% CI) | 0.63 [0.43, 0.93] |
| Analysis 15.3  Comparison 15 Salix purpurea x daphnoides versus diclofenac, Outcome 3 Participants (n) reported adverse events. | ||||
| Outcome or subgroup title | No. of studies | No. of participants | Statistical method | Effect size |
| 1 Pain VAS 0‐100 (night) Show forest plot | 1 | 45 | Mean Difference (IV, Random, 95% CI) | ‐11.10 [‐26.44, 4.24] |
| Analysis 16.1  Comparison 16 Uncaria guianensis versus placebo, Outcome 1 Pain VAS 0‐100 (night). | ||||
| 2 Participants (n) reported adverse events Show forest plot | 1 | 45 | Risk Ratio (M‐H, Random, 95% CI) | 1.67 [0.54, 5.17] |
| Analysis 16.2  Comparison 16 Uncaria guianensis versus placebo, Outcome 2 Participants (n) reported adverse events. | ||||
| Outcome or subgroup title | No. of studies | No. of participants | Statistical method | Effect size |
| 1 Pain VAS 0‐100 (movement) Show forest plot | 1 | 24 | Mean Difference (IV, Random, 95% CI) | ‐9.0 [‐31.12, 13.12] |
| Analysis 17.1  Comparison 17 Zingiber officinale (Zintona EC) versus placebo, Outcome 1 Pain VAS 0‐100 (movement). | ||||
| 2 Function (handicap) VAS 0‐100 Show forest plot | 1 | 24 | Mean Difference (IV, Random, 95% CI) | ‐6.0 [‐27.25, 15.25] |
| Analysis 17.2  Comparison 17 Zingiber officinale (Zintona EC) versus placebo, Outcome 2 Function (handicap) VAS 0‐100. | ||||
| 3 Participants (n) reported adverse events Show forest plot | 1 | 24 | Risk Ratio (M‐H, Random, 95% CI) | 3.5 [0.16, 78.19] |
| Analysis 17.3 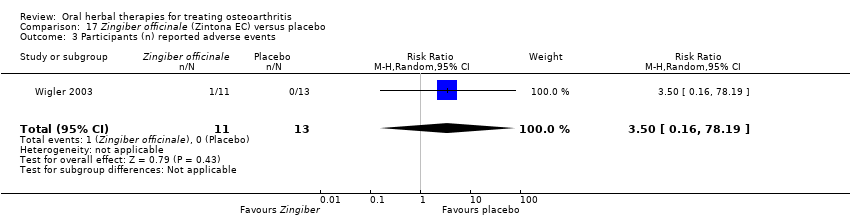 Comparison 17 Zingiber officinale (Zintona EC) versus placebo, Outcome 3 Participants (n) reported adverse events. | ||||
| Outcome or subgroup title | No. of studies | No. of participants | Statistical method | Effect size |
| 1 Function: pain free walking time (minutes) Show forest plot | 1 | Mean Difference (IV, Random, 95% CI) | Totals not selected | |
| Analysis 18.1 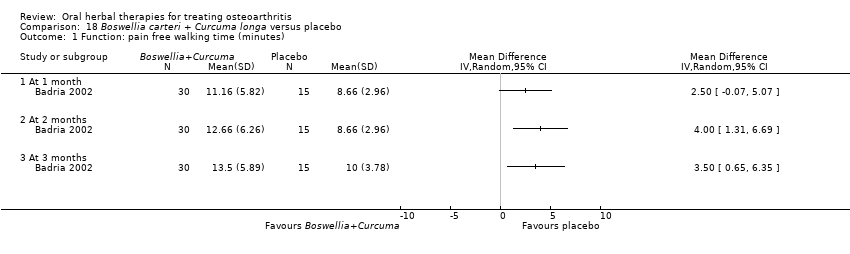 Comparison 18 Boswellia carteri + Curcuma longa versus placebo, Outcome 1 Function: pain free walking time (minutes). | ||||
| 1.1 At 1 month | 1 | Mean Difference (IV, Random, 95% CI) | 0.0 [0.0, 0.0] | |
| 1.2 At 2 months | 1 | Mean Difference (IV, Random, 95% CI) | 0.0 [0.0, 0.0] | |
| 1.3 At 3 months | 1 | Mean Difference (IV, Random, 95% CI) | 0.0 [0.0, 0.0] | |
| Outcome or subgroup title | No. of studies | No. of participants | Statistical method | Effect size |
| 1 Pain VAS 0‐100 Show forest plot | 4 | 651 | Mean Difference (IV, Random, 95% CI) | ‐8.47 [‐15.90, ‐1.04] |
| Analysis 19.1 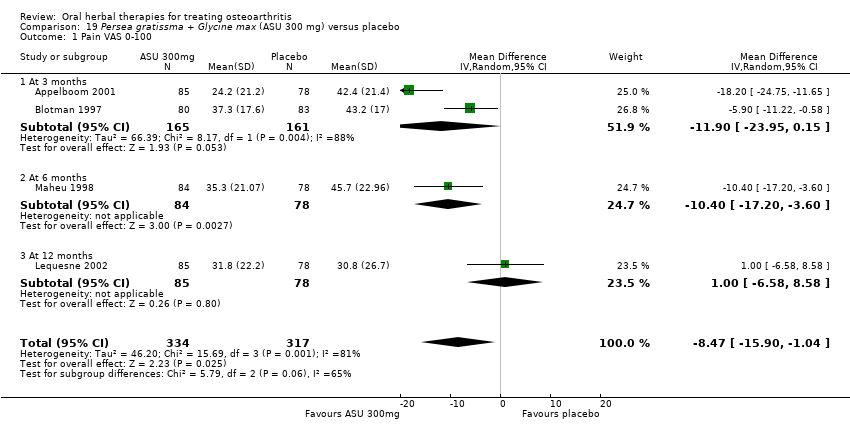 Comparison 19 Persea gratissma + Glycine max (ASU 300 mg) versus placebo, Outcome 1 Pain VAS 0‐100. | ||||
| 1.1 At 3 months | 2 | 326 | Mean Difference (IV, Random, 95% CI) | ‐11.90 [‐23.95, 0.15] |
| 1.2 At 6 months | 1 | 162 | Mean Difference (IV, Random, 95% CI) | ‐10.40 [‐17.20, ‐3.60] |
| 1.3 At 12 months | 1 | 163 | Mean Difference (IV, Random, 95% CI) | 1.0 [‐6.58, 8.58] |
| 2 Pain VAS 0‐100 change from baseline at 36 months Show forest plot | 1 | 345 | Mean Difference (IV, Random, 95% CI) | ‐0.66 [‐7.39, 6.07] |
| Analysis 19.2 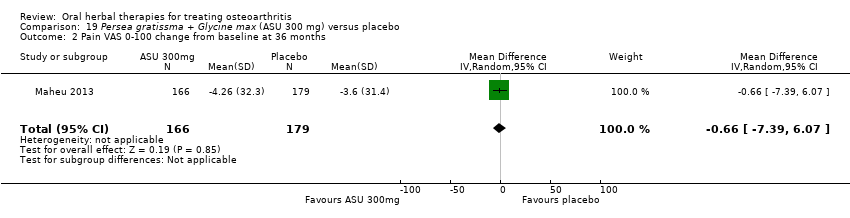 Comparison 19 Persea gratissma + Glycine max (ASU 300 mg) versus placebo, Outcome 2 Pain VAS 0‐100 change from baseline at 36 months. | ||||
| 3 Pain VAS 0‐100 grouped by joint Show forest plot | 1 | 324 | Mean Difference (IV, Random, 95% CI) | ‐9.06 [‐15.24, ‐2.88] |
| Analysis 19.3 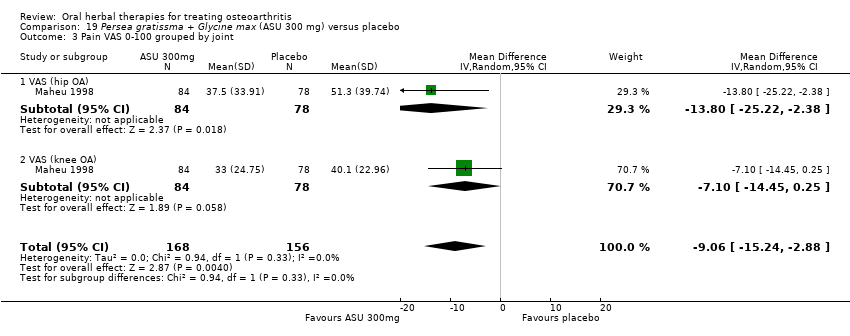 Comparison 19 Persea gratissma + Glycine max (ASU 300 mg) versus placebo, Outcome 3 Pain VAS 0‐100 grouped by joint. | ||||
| 3.1 VAS (hip OA) | 1 | 162 | Mean Difference (IV, Random, 95% CI) | ‐13.80 [‐25.22, ‐2.38] |
| 3.2 VAS (knee OA) | 1 | 162 | Mean Difference (IV, Random, 95% CI) | ‐7.10 [‐14.45, 0.25] |
| 4 Function: disability VAS 0‐100 Show forest plot | 1 | Mean Difference (IV, Random, 95% CI) | Totals not selected | |
| Analysis 19.4  Comparison 19 Persea gratissma + Glycine max (ASU 300 mg) versus placebo, Outcome 4 Function: disability VAS 0‐100. | ||||
| 5 WOMAC‐VAS (Function) change from baseline at 36 months Show forest plot | 1 | 345 | Mean Difference (IV, Random, 95% CI) | ‐1.0 [‐7.14, 5.14] |
| Analysis 19.5  Comparison 19 Persea gratissma + Glycine max (ASU 300 mg) versus placebo, Outcome 5 WOMAC‐VAS (Function) change from baseline at 36 months. | ||||
| 6 Lequesne algofunctional index Show forest plot | 3 | 480 | Mean Difference (IV, Random, 95% CI) | ‐1.17 [‐2.54, 0.20] |
| Analysis 19.6  Comparison 19 Persea gratissma + Glycine max (ASU 300 mg) versus placebo, Outcome 6 Lequesne algofunctional index. | ||||
| 6.1 At 3 months | 2 | 317 | Mean Difference (IV, Random, 95% CI) | ‐1.80 [‐2.68, ‐0.92] |
| 6.2 At 12 months | 1 | 163 | Mean Difference (IV, Random, 95% CI) | 0.10 [‐0.78, 0.98] |
| 7 Function (various tools) Show forest plot | 4 | 642 | Std. Mean Difference (IV, Random, 95% CI) | ‐0.42 [‐0.73, ‐0.11] |
| Analysis 19.7  Comparison 19 Persea gratissma + Glycine max (ASU 300 mg) versus placebo, Outcome 7 Function (various tools). | ||||
| 8 Participants (n) reported adverse events Show forest plot | 5 | 1050 | Risk Ratio (M‐H, Random, 95% CI) | 1.04 [0.97, 1.12] |
| Analysis 19.8 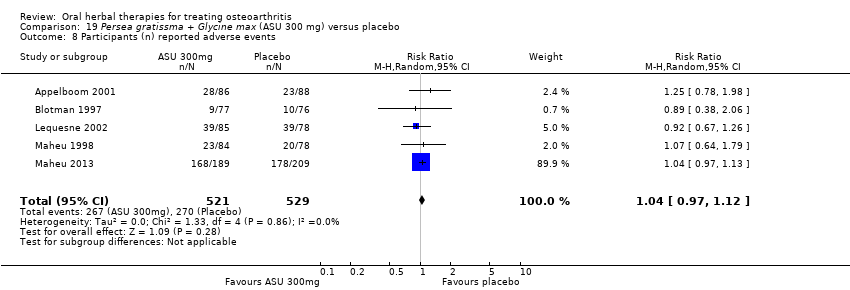 Comparison 19 Persea gratissma + Glycine max (ASU 300 mg) versus placebo, Outcome 8 Participants (n) reported adverse events. | ||||
| 9 Participants (n) withdrew due to adverse events Show forest plot | 1 | 398 | Risk Ratio (M‐H, Random, 95% CI) | 1.14 [0.73, 1.80] |
| Analysis 19.9 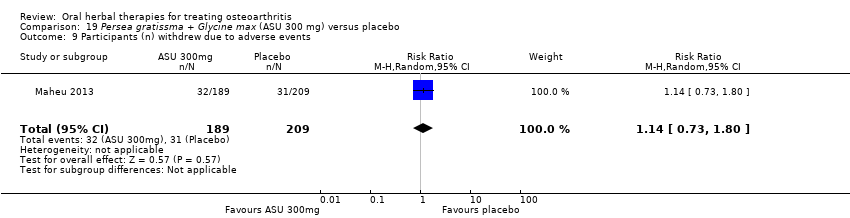 Comparison 19 Persea gratissma + Glycine max (ASU 300 mg) versus placebo, Outcome 9 Participants (n) withdrew due to adverse events. | ||||
| 10 Particpants (n) reported serious adverse events Show forest plot | 1 | 398 | Risk Ratio (M‐H, Random, 95% CI) | 1.22 [0.94, 1.59] |
| Analysis 19.10 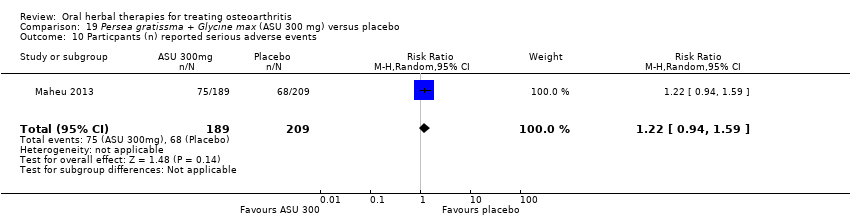 Comparison 19 Persea gratissma + Glycine max (ASU 300 mg) versus placebo, Outcome 10 Particpants (n) reported serious adverse events. | ||||
| 11 JSW change from baseline Show forest plot | 2 | 453 | Mean Difference (IV, Random, 95% CI) | ‐0.12 [‐0.43, 0.19] |
| Analysis 19.11  Comparison 19 Persea gratissma + Glycine max (ASU 300 mg) versus placebo, Outcome 11 JSW change from baseline. | ||||
| 11.1 < median group, at 24 months | 1 | 55 | Mean Difference (IV, Random, 95% CI) | ‐0.43 [‐0.73, ‐0.13] |
| 11.2 > median group, at 24 months | 1 | 53 | Mean Difference (IV, Random, 95% CI) | 0.16 [‐0.31, 0.63] |
| 11.3 At 36 months | 1 | 345 | Mean Difference (IV, Random, 95% CI) | ‐0.03 [‐0.22, 0.16] |
| Outcome or subgroup title | No. of studies | No. of participants | Statistical method | Effect size |
| 1 Pain VAS 0‐100 Show forest plot | 1 | 156 | Mean Difference (IV, Random, 95% CI) | ‐14.2 [‐20.82, ‐7.58] |
| Analysis 20.1  Comparison 20 Persea gratissma + Glycine max (ASU 600 mg) versus placebo, Outcome 1 Pain VAS 0‐100. | ||||
| 2 Lequesne algofunctional index Show forest plot | 1 | 156 | Mean Difference (IV, Random, 95% CI) | ‐1.30 [‐2.38, ‐0.22] |
| Analysis 20.2  Comparison 20 Persea gratissma + Glycine max (ASU 600 mg) versus placebo, Outcome 2 Lequesne algofunctional index. | ||||
| 3 Participants (n) reported adverse events Show forest plot | 1 | 174 | Risk Ratio (M‐H, Random, 95% CI) | 1.07 [0.66, 1.74] |
| Analysis 20.3  Comparison 20 Persea gratissma + Glycine max (ASU 600 mg) versus placebo, Outcome 3 Participants (n) reported adverse events. | ||||
| Outcome or subgroup title | No. of studies | No. of participants | Statistical method | Effect size |
| 1 WOMAC‐VAS (Pain) Show forest plot | 1 | Mean Difference (IV, Random, 95% CI) | Totals not selected | |
| Analysis 21.1  Comparison 21 Persea gratissma + Glycine max (ASU 300 mg) versus chondroitin sulphate, Outcome 1 WOMAC‐VAS (Pain). | ||||
| 2 WOMAC‐VAS (Function) Show forest plot | 1 | Mean Difference (IV, Random, 95% CI) | Totals not selected | |
| Analysis 21.2 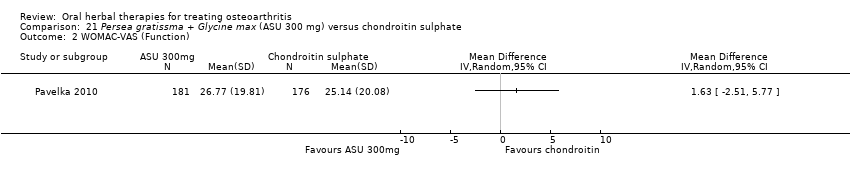 Comparison 21 Persea gratissma + Glycine max (ASU 300 mg) versus chondroitin sulphate, Outcome 2 WOMAC‐VAS (Function). | ||||
| 3 Participants (n) reported adverse events Show forest plot | 1 | 357 | Risk Ratio (M‐H, Random, 95% CI) | 0.86 [0.59, 1.26] |
| Analysis 21.3 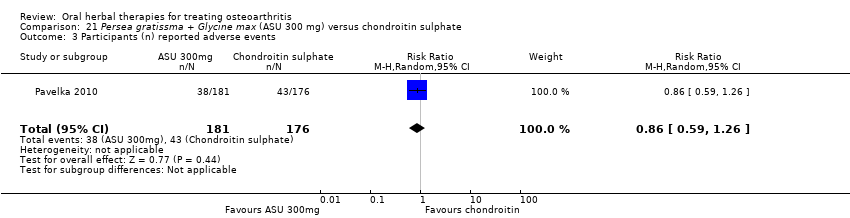 Comparison 21 Persea gratissma + Glycine max (ASU 300 mg) versus chondroitin sulphate, Outcome 3 Participants (n) reported adverse events. | ||||
| 4 Paricipants (n) reported serious adverse events Show forest plot | 1 | 357 | Risk Ratio (M‐H, Random, 95% CI) | 2.92 [0.31, 27.78] |
| Analysis 21.4  Comparison 21 Persea gratissma + Glycine max (ASU 300 mg) versus chondroitin sulphate, Outcome 4 Paricipants (n) reported serious adverse events. | ||||
| Outcome or subgroup title | No. of studies | No. of participants | Statistical method | Effect size |
| 1 Lequesne algofunctional index Show forest plot | 1 | 45 | Mean Difference (IV, Random, 95% CI) | ‐3.82 [‐7.05, ‐0.59] |
| Analysis 22.1 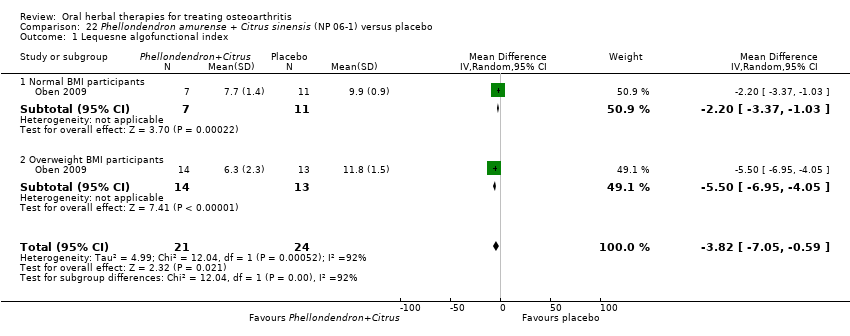 Comparison 22 Phellondendron amurense + Citrus sinensis (NP 06‐1) versus placebo, Outcome 1 Lequesne algofunctional index. | ||||
| 1.1 Normal BMI participants | 1 | 18 | Mean Difference (IV, Random, 95% CI) | ‐2.2 [‐3.37, ‐1.03] |
| 1.2 Overweight BMI participants | 1 | 27 | Mean Difference (IV, Random, 95% CI) | ‐5.50 [‐6.95, ‐4.05] |
| Outcome or subgroup title | No. of studies | No. of participants | Statistical method | Effect size |
| 1 Participants (n) reported adverse events Show forest plot | 1 | 95 | Risk Ratio (M‐H, Random, 95% CI) | 0.77 [0.18, 3.24] |
| Analysis 23.1  Comparison 23 Uncaria guianensis + Lepidium meyenii versus glucosamine sulphate, Outcome 1 Participants (n) reported adverse events. | ||||
| Outcome or subgroup title | No. of studies | No. of participants | Statistical method | Effect size |
| 1 Pain immediately after walking 50 feet VAS 0‐100 Show forest plot | 1 | 247 | Mean Difference (IV, Random, 95% CI) | ‐9.60 [‐16.81, ‐2.39] |
| Analysis 24.1  Comparison 24 Zingiber officinale + Alpinia galanga (EV.EXT77) versus placebo, Outcome 1 Pain immediately after walking 50 feet VAS 0‐100. | ||||
| 2 WOMAC‐VAS (Function) Show forest plot | 1 | Mean Difference (IV, Random, 95% CI) | Totals not selected | |
| Analysis 24.2  Comparison 24 Zingiber officinale + Alpinia galanga (EV.EXT77) versus placebo, Outcome 2 WOMAC‐VAS (Function). | ||||
| 3 Participants (n) reported adverse events Show forest plot | 1 | Risk Ratio (M‐H, Random, 95% CI) | Totals not selected | |
| Analysis 24.3 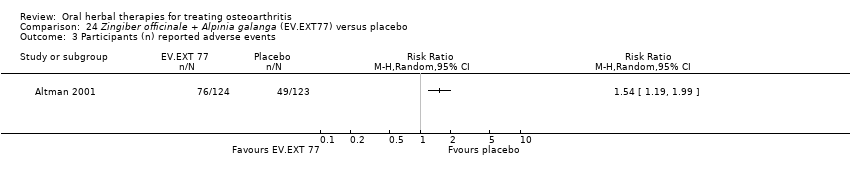 Comparison 24 Zingiber officinale + Alpinia galanga (EV.EXT77) versus placebo, Outcome 3 Participants (n) reported adverse events. | ||||
| Outcome or subgroup title | No. of studies | No. of participants | Statistical method | Effect size |
| 1 Pain VAS 0‐100 change from baseline Show forest plot | 1 | Mean Difference (IV, Random, 95% CI) | Subtotals only | |
| Analysis 25.1 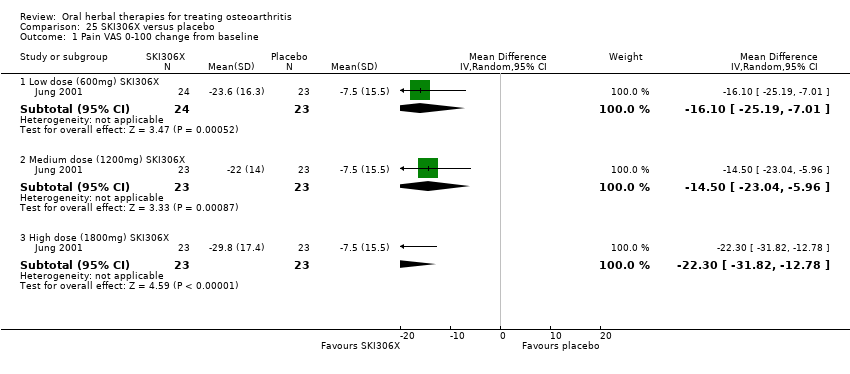 Comparison 25 SKI306X versus placebo, Outcome 1 Pain VAS 0‐100 change from baseline. | ||||
| 1.1 Low dose (600mg) SKI306X | 1 | 47 | Mean Difference (IV, Random, 95% CI) | ‐16.1 [‐25.19, ‐7.01] |
| 1.2 Medium dose (1200mg) SKI306X | 1 | 46 | Mean Difference (IV, Random, 95% CI) | ‐14.5 [‐23.04, ‐5.96] |
| 1.3 High dose (1800mg) SKI306X | 1 | 46 | Mean Difference (IV, Random, 95% CI) | ‐22.3 [‐31.82, ‐12.78] |
| 2 Lequesne algofunctional index change from baseline Show forest plot | 1 | 139 | Mean Difference (IV, Random, 95% CI) | ‐2.73 [‐3.71, ‐1.74] |
| Analysis 25.2 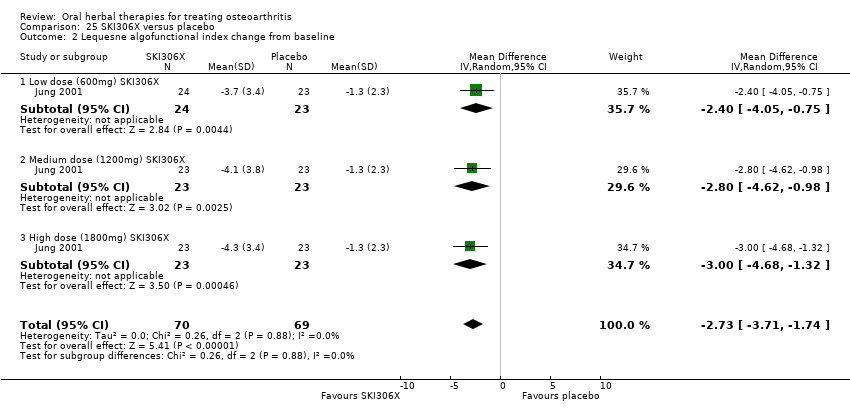 Comparison 25 SKI306X versus placebo, Outcome 2 Lequesne algofunctional index change from baseline. | ||||
| 2.1 Low dose (600mg) SKI306X | 1 | 47 | Mean Difference (IV, Random, 95% CI) | ‐2.40 [‐4.05, ‐0.75] |
| 2.2 Medium dose (1200mg) SKI306X | 1 | 46 | Mean Difference (IV, Random, 95% CI) | ‐2.8 [‐4.62, ‐0.98] |
| 2.3 High dose (1800mg) SKI306X | 1 | 46 | Mean Difference (IV, Random, 95% CI) | ‐3.0 [‐4.68, ‐1.32] |
| 3 Participants (n) reported adverse events Show forest plot | 2 | 139 | Risk Ratio (M‐H, Random, 95% CI) | 0.93 [0.49, 1.79] |
| Analysis 25.3 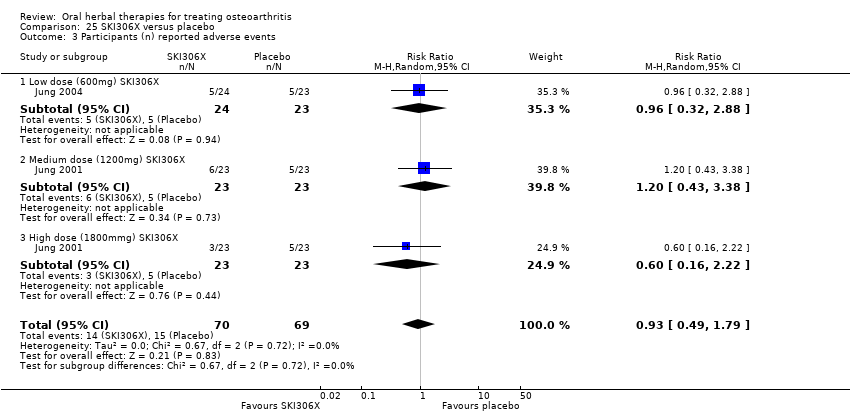 Comparison 25 SKI306X versus placebo, Outcome 3 Participants (n) reported adverse events. | ||||
| 3.1 Low dose (600mg) SKI306X | 1 | 47 | Risk Ratio (M‐H, Random, 95% CI) | 0.96 [0.32, 2.88] |
| 3.2 Medium dose (1200mg) SKI306X | 1 | 46 | Risk Ratio (M‐H, Random, 95% CI) | 1.2 [0.43, 3.38] |
| 3.3 High dose (1800mmg) SKI306X | 1 | 46 | Risk Ratio (M‐H, Random, 95% CI) | 0.6 [0.16, 2.22] |
| Outcome or subgroup title | No. of studies | No. of participants | Statistical method | Effect size |
| 1 Pain VAS 0‐100 change from baseline Show forest plot | 1 | 249 | Mean Difference (IV, Random, 95% CI) | 1.31 [‐2.78, 5.40] |
| Analysis 26.1 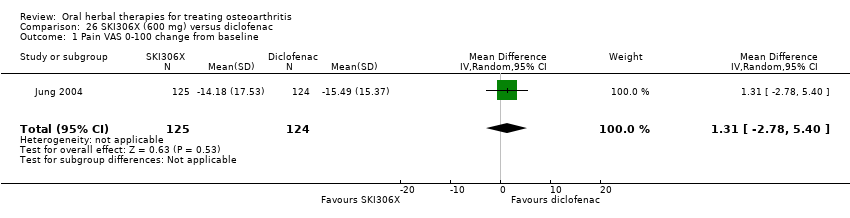 Comparison 26 SKI306X (600 mg) versus diclofenac, Outcome 1 Pain VAS 0‐100 change from baseline. | ||||
| 2 Lequesne algofunctional index change from baseline Show forest plot | 1 | 249 | Mean Difference (IV, Random, 95% CI) | 0.77 [0.10, 1.44] |
| Analysis 26.2  Comparison 26 SKI306X (600 mg) versus diclofenac, Outcome 2 Lequesne algofunctional index change from baseline. | ||||
| 3 Participants (n) reported adverse events Show forest plot | 1 | 249 | Risk Ratio (M‐H, Random, 95% CI) | 0.61 [0.38, 0.97] |
| Analysis 26.3 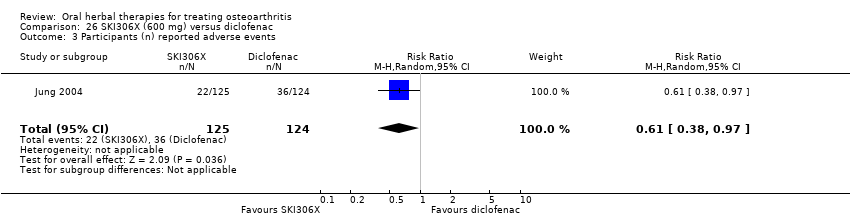 Comparison 26 SKI306X (600 mg) versus diclofenac, Outcome 3 Participants (n) reported adverse events. | ||||
| Outcome or subgroup title | No. of studies | No. of participants | Statistical method | Effect size |
| 1 Enduring pain (0 to 3) Show forest plot | 1 | 72 | Mean Difference (IV, Random, 95% CI) | 0.0 [0.0, 0.0] |
| Analysis 27.1  Comparison 27 Phytodolor N versus placebo, Outcome 1 Enduring pain (0 to 3). | ||||
| 2 Function: mobility limitations (0 to 3) Show forest plot | 1 | 72 | Mean Difference (IV, Random, 95% CI) | 0.0 [0.0, 0.0] |
| Analysis 27.2  Comparison 27 Phytodolor N versus placebo, Outcome 2 Function: mobility limitations (0 to 3). | ||||
| 3 Participants (n) reported adverse events Show forest plot | 3 | 140 | Risk Ratio (M‐H, Random, 95% CI) | 0.33 [0.01, 7.92] |
| Analysis 27.3  Comparison 27 Phytodolor N versus placebo, Outcome 3 Participants (n) reported adverse events. | ||||
| Outcome or subgroup title | No. of studies | No. of participants | Statistical method | Effect size |
| 1 AIMS2 arthritis pain score change from baseline Show forest plot | 1 | 52 | Mean Difference (IV, Random, 95% CI) | ‐0.89 [‐1.73, ‐0.05] |
| Analysis 28.1 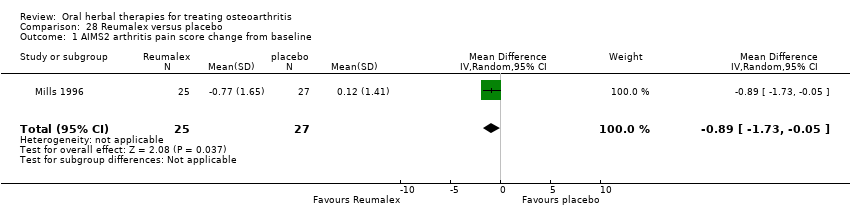 Comparison 28 Reumalex versus placebo, Outcome 1 AIMS2 arthritis pain score change from baseline. | ||||
| 2 Participants (n) reported adverse events Show forest plot | 1 | 52 | Risk Ratio (M‐H, Random, 95% CI) | 1.08 [0.40, 2.91] |
| Analysis 28.2  Comparison 28 Reumalex versus placebo, Outcome 2 Participants (n) reported adverse events. | ||||
| Outcome or subgroup title | No. of studies | No. of participants | Statistical method | Effect size |
| 1 Pain VAS 0‐100 (total) Show forest plot | 1 | 200 | Mean Difference (IV, Random, 95% CI) | 11.81 [‐9.67, 33.29] |
| Analysis 29.1  Comparison 29 Chinese DJW versus diclofenac, Outcome 1 Pain VAS 0‐100 (total). | ||||
| 2 Lequesne algofunctional index Show forest plot | 1 | 200 | Mean Difference (IV, Random, 95% CI) | 0.28 [‐0.89, 1.45] |
| Analysis 29.2 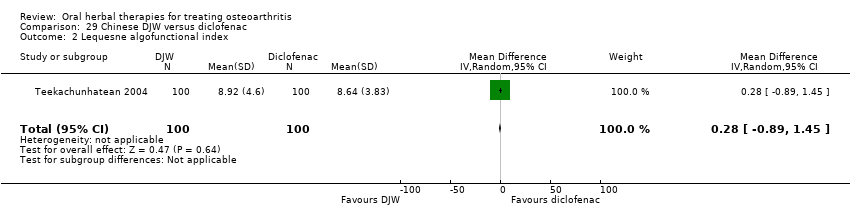 Comparison 29 Chinese DJW versus diclofenac, Outcome 2 Lequesne algofunctional index. | ||||
| 3 Participants (n) reported adverse events Show forest plot | 1 | 200 | Risk Ratio (M‐H, Random, 95% CI) | 1.04 [0.66, 1.63] |
| Analysis 29.3  Comparison 29 Chinese DJW versus diclofenac, Outcome 3 Participants (n) reported adverse events. | ||||
| Outcome or subgroup title | No. of studies | No. of participants | Statistical method | Effect size |
| 1 Pain VAS 0‐100 (walking) Show forest plot | 1 | 60 | Mean Difference (IV, Random, 95% CI) | 2.0 [‐7.12, 11.12] |
| Analysis 30.1  Comparison 30 Chinese BNHS versus Chinese active control, Outcome 1 Pain VAS 0‐100 (walking). | ||||
| 2 WOMAC‐VAS (Function) Show forest plot | 1 | 60 | Mean Difference (IV, Random, 95% CI) | ‐2.0 [‐7.57, 3.57] |
| Analysis 30.2 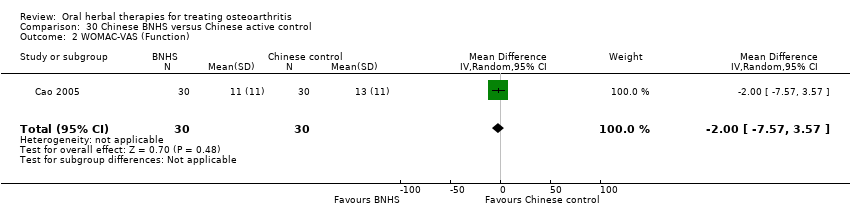 Comparison 30 Chinese BNHS versus Chinese active control, Outcome 2 WOMAC‐VAS (Function). | ||||
| 3 Participants (n) reported adverse events Show forest plot | 1 | 60 | Risk Ratio (M‐H, Random, 95% CI) | 9.00 [0.51, 160.17] |
| Analysis 30.3  Comparison 30 Chinese BNHS versus Chinese active control, Outcome 3 Participants (n) reported adverse events. | ||||
| Outcome or subgroup title | No. of studies | No. of participants | Statistical method | Effect size |
| 1 Pain VAS 0‐100 (walking) Show forest plot | 1 | 60 | Mean Difference (IV, Random, 95% CI) | ‐2.0 [‐6.81, 2.81] |
| Analysis 31.1  Comparison 31 Chinese BNHS versus glucosamine sulphate, Outcome 1 Pain VAS 0‐100 (walking). | ||||
| 2 WOMAC‐VAS (Function) Show forest plot | 1 | 60 | Mean Difference (IV, Random, 95% CI) | 0.0 [‐2.53, 2.53] |
| Analysis 31.2 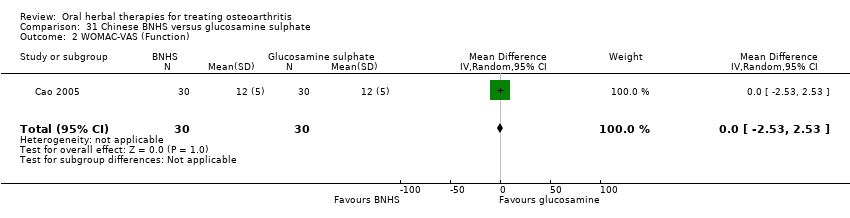 Comparison 31 Chinese BNHS versus glucosamine sulphate, Outcome 2 WOMAC‐VAS (Function). | ||||
| 3 Participants (n) reported adverse events Show forest plot | 1 | 60 | Risk Ratio (M‐H, Random, 95% CI) | 9.00 [0.51, 160.17] |
| Analysis 31.3  Comparison 31 Chinese BNHS versus glucosamine sulphate, Outcome 3 Participants (n) reported adverse events. | ||||
| Outcome or subgroup title | No. of studies | No. of participants | Statistical method | Effect size |
| 1 Adverse event episodes (n) reported Show forest plot | 1 | 454 | Risk Ratio (M‐H, Random, 95% CI) | 0.95 [0.71, 1.28] |
| Analysis 32.1 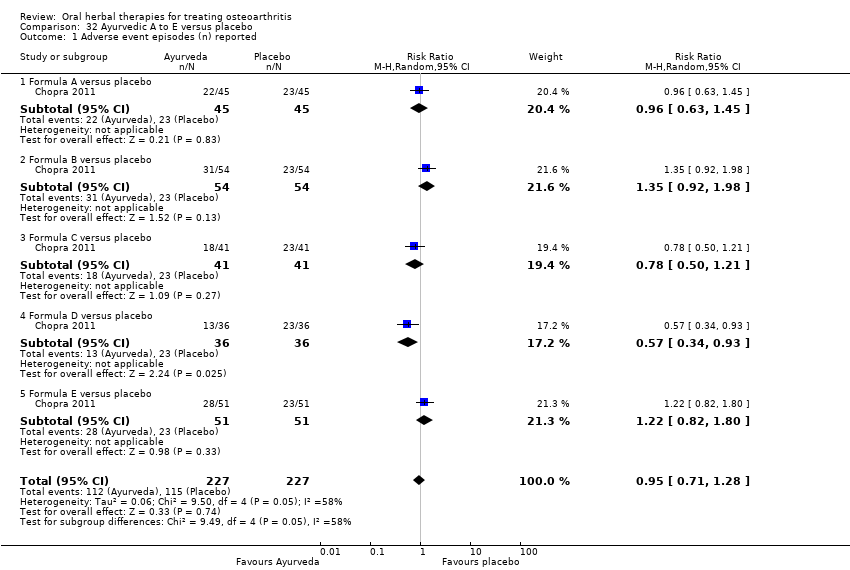 Comparison 32 Ayurvedic A to E versus placebo, Outcome 1 Adverse event episodes (n) reported. | ||||
| 1.1 Formula A versus placebo | 1 | 90 | Risk Ratio (M‐H, Random, 95% CI) | 0.96 [0.63, 1.45] |
| 1.2 Formula B versus placebo | 1 | 108 | Risk Ratio (M‐H, Random, 95% CI) | 1.35 [0.92, 1.98] |
| 1.3 Formula C versus placebo | 1 | 82 | Risk Ratio (M‐H, Random, 95% CI) | 0.78 [0.50, 1.21] |
| 1.4 Formula D versus placebo | 1 | 72 | Risk Ratio (M‐H, Random, 95% CI) | 0.57 [0.34, 0.93] |
| 1.5 Formula E versus placebo | 1 | 102 | Risk Ratio (M‐H, Random, 95% CI) | 1.22 [0.82, 1.80] |
| Outcome or subgroup title | No. of studies | No. of participants | Statistical method | Effect size |
| 1 Pain VAS 0‐100 Show forest plot | 1 | 88 | Mean Difference (IV, Random, 95% CI) | ‐1.0 [‐9.79, 7.79] |
| Analysis 33.1  Comparison 33 Ayurvedic Antarth versus placebo, Outcome 1 Pain VAS 0‐100. | ||||
| Outcome or subgroup title | No. of studies | No. of participants | Statistical method | Effect size |
| 1 Pain VAS 0‐100 Show forest plot | 1 | 90 | Mean Difference (IV, Random, 95% CI) | ‐1.03 [‐1.18, ‐0.88] |
| Analysis 34.1  Comparison 34 Ayurvedic RA‐II versus placebo, Outcome 1 Pain VAS 0‐100. | ||||
| 2 WOMAC 0‐4 (Function) Show forest plot | 1 | 90 | Mean Difference (IV, Random, 95% CI) | ‐5.80 [‐6.72, ‐4.88] |
| Analysis 34.2  Comparison 34 Ayurvedic RA‐II versus placebo, Outcome 2 WOMAC 0‐4 (Function). | ||||
| 3 Participants (n) reported adverse events Show forest plot | 1 | 90 | Risk Ratio (M‐H, Random, 95% CI) | 1.05 [0.69, 1.58] |
| Analysis 34.3  Comparison 34 Ayurvedic RA‐II versus placebo, Outcome 3 Participants (n) reported adverse events. | ||||
| Outcome or subgroup title | No. of studies | No. of participants | Statistical method | Effect size |
| 1 Pain VAS 0‐100 change from baseline Show forest plot | 1 | 220 | Mean Difference (IV, Random, 95% CI) | 3.0 [‐3.28, 9.28] |
| Analysis 35.1 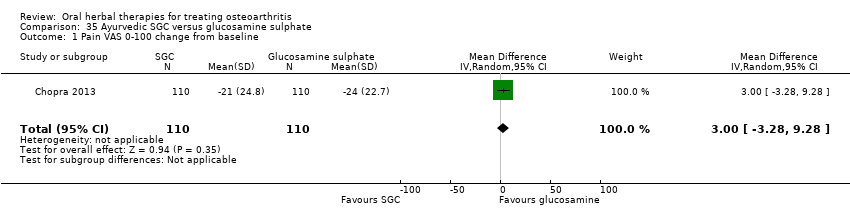 Comparison 35 Ayurvedic SGC versus glucosamine sulphate, Outcome 1 Pain VAS 0‐100 change from baseline. | ||||
| 2 WOMAC 0‐4 (Function) change from baseline Show forest plot | 1 | 220 | Mean Difference (IV, Random, 95% CI) | 2.0 [‐0.72, 4.72] |
| Analysis 35.2 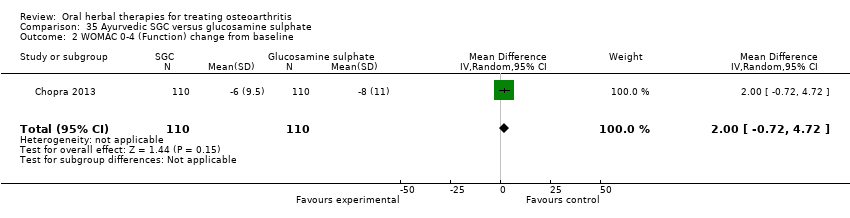 Comparison 35 Ayurvedic SGC versus glucosamine sulphate, Outcome 2 WOMAC 0‐4 (Function) change from baseline. | ||||
| 3 Participants (n) reported adverse events Show forest plot | 1 | 210 | Odds Ratio (M‐H, Random, 95% CI) | 1.04 [0.58, 1.86] |
| Analysis 35.3  Comparison 35 Ayurvedic SGC versus glucosamine sulphate, Outcome 3 Participants (n) reported adverse events. | ||||
| Outcome or subgroup title | No. of studies | No. of participants | Statistical method | Effect size |
| 1 Pain VAS 0‐100 change from baseline Show forest plot | 1 | 220 | Mean Difference (IV, Random, 95% CI) | ‐3.0 [‐8.98, 2.98] |
| Analysis 36.1  Comparison 36 Ayurvedic SGC versus celecoxib, Outcome 1 Pain VAS 0‐100 change from baseline. | ||||
| 2 WOMAC 0‐4 (Function) change from baseline Show forest plot | 1 | 220 | Mean Difference (IV, Random, 95% CI) | 1.0 [‐1.60, 3.60] |
| Analysis 36.2  Comparison 36 Ayurvedic SGC versus celecoxib, Outcome 2 WOMAC 0‐4 (Function) change from baseline. | ||||
| 3 Participants (n) reported adverse events Show forest plot | 1 | 207 | Odds Ratio (M‐H, Random, 95% CI) | 1.00 [0.56, 1.79] |
| Analysis 36.3 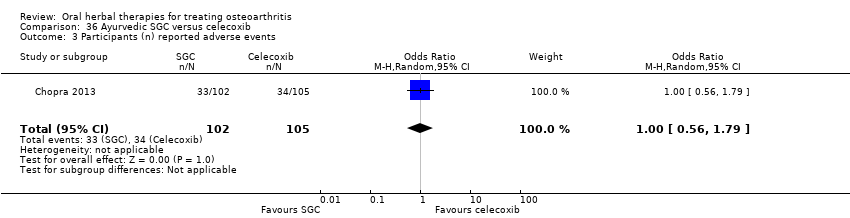 Comparison 36 Ayurvedic SGC versus celecoxib, Outcome 3 Participants (n) reported adverse events. | ||||
| Outcome or subgroup title | No. of studies | No. of participants | Statistical method | Effect size |
| 1 Pain VAS 0‐100 change from baseline Show forest plot | 1 | 220 | Mean Difference (IV, Random, 95% CI) | 4.0 [‐1.42, 9.42] |
| Analysis 37.1  Comparison 37 Ayurvedic SGCG versus glucosamine sulphate, Outcome 1 Pain VAS 0‐100 change from baseline. | ||||
| 2 WOMAC 0‐4 (Function) change from baseline Show forest plot | 1 | 220 | Mean Difference (IV, Random, 95% CI) | 1.38 [‐1.40, 4.16] |
| Analysis 37.2  Comparison 37 Ayurvedic SGCG versus glucosamine sulphate, Outcome 2 WOMAC 0‐4 (Function) change from baseline. | ||||
| 3 Participants (n) reported adverse events Show forest plot | 1 | 211 | Odds Ratio (M‐H, Random, 95% CI) | 0.85 [0.47, 1.54] |
| Analysis 37.3  Comparison 37 Ayurvedic SGCG versus glucosamine sulphate, Outcome 3 Participants (n) reported adverse events. | ||||
| Outcome or subgroup title | No. of studies | No. of participants | Statistical method | Effect size |
| 1 Pain VAS 0‐100 change from baseline Show forest plot | 1 | 220 | Mean Difference (IV, Random, 95% CI) | ‐2.0 [‐7.42, 3.42] |
| Analysis 38.1  Comparison 38 Ayurvedic SGCG versus celecoxib, Outcome 1 Pain VAS 0‐100 change from baseline. | ||||
| 2 WOMAC 0‐4 (Function) change from baseline Show forest plot | 1 | 220 | Mean Difference (IV, Random, 95% CI) | 0.19 [‐2.59, 2.97] |
| Analysis 38.2 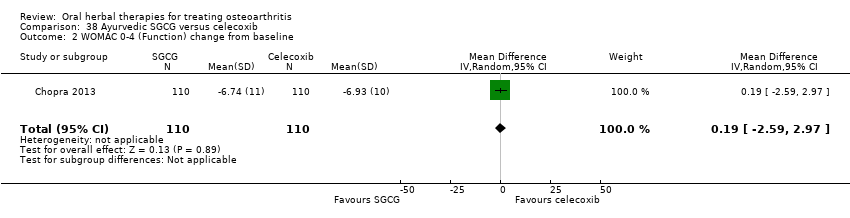 Comparison 38 Ayurvedic SGCG versus celecoxib, Outcome 2 WOMAC 0‐4 (Function) change from baseline. | ||||
| 3 Participants (n) reported adverse events Show forest plot | 1 | 208 | Odds Ratio (M‐H, Random, 95% CI) | 0.82 [0.45, 1.48] |
| Analysis 38.3  Comparison 38 Ayurvedic SGCG versus celecoxib, Outcome 3 Participants (n) reported adverse events. | ||||
| Outcome or subgroup title | No. of studies | No. of participants | Statistical method | Effect size |
| 1 Pain: Knee Society Rating System 0‐100 (knee) Show forest plot | 1 | 47 | Mean Difference (IV, Random, 95% CI) | ‐1.30 [‐8.90, 6.30] |
| Analysis 39.1  Comparison 39 Japanese Boiogito + loxoprofen versus loxoprofen, Outcome 1 Pain: Knee Society Rating System 0‐100 (knee). | ||||
| 2 Function: Knee Society Rating System 0‐50 (stairs) Show forest plot | 1 | 47 | Mean Difference (IV, Random, 95% CI) | 3.60 [0.51, 6.69] |
| Analysis 39.2  Comparison 39 Japanese Boiogito + loxoprofen versus loxoprofen, Outcome 2 Function: Knee Society Rating System 0‐50 (stairs). | ||||
| 3 Participants (n) reported adverse events Show forest plot | 1 | 47 | Risk Ratio (M‐H, Random, 95% CI) | 2.88 [0.12, 67.29] |
| Analysis 39.3  Comparison 39 Japanese Boiogito + loxoprofen versus loxoprofen, Outcome 3 Participants (n) reported adverse events. | ||||
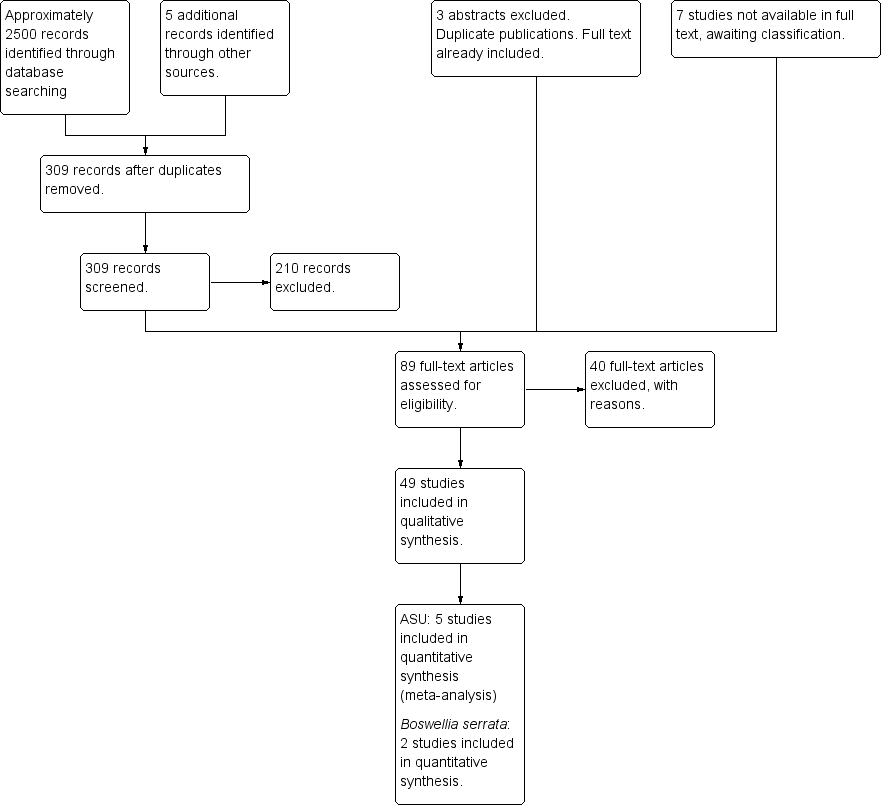

Risk of bias summary: review authors' judgements about each risk of bias item for each included study.
Comparison 1 Boswellia serrata 999 mg versus placebo, Outcome 1 Pain (0 to 3).
Comparison 1 Boswellia serrata 999 mg versus placebo, Outcome 2 Function: loss of function (0 to 3).
Comparison 1 Boswellia serrata 999 mg versus placebo, Outcome 3 Participants (n) reported adverse effects.
Comparison 2 Boswellia serrata (enriched) 100 mg versus placebo, Outcome 1 Pain VAS 0‐100 at 90 days.
Comparison 2 Boswellia serrata (enriched) 100 mg versus placebo, Outcome 2 WOMAC‐VAS (Function).
Comparison 2 Boswellia serrata (enriched) 100 mg versus placebo, Outcome 3 Adverse event episodes (n) reported.
Comparison 3 Boswellia serrata (enriched) 250 mg versus placebo, Outcome 1 Pain VAS 0‐100 at 90 days.
Comparison 3 Boswellia serrata (enriched) 250 mg versus placebo, Outcome 2 WOMAC‐VAS (Function).
Comparison 3 Boswellia serrata (enriched) 250 mg versus placebo, Outcome 3 Adverse event episodes (n) reported.
Comparison 4 Boswellia serrata (enriched) 100 mg plus non‐volatile oil versus placebo, Outcome 1 Pain VAS 0‐100.
Comparison 4 Boswellia serrata (enriched) 100 mg plus non‐volatile oil versus placebo, Outcome 2 WOMAC‐VAS (Function).
Comparison 4 Boswellia serrata (enriched) 100 mg plus non‐volatile oil versus placebo, Outcome 3 Participants (n) reported adverse events.
Comparison 5 Boswellia serrata 999 mg versus valdecoxib, Outcome 1 WOMAC‐VAS (Pain).
Comparison 5 Boswellia serrata 999 mg versus valdecoxib, Outcome 2 WOMAC‐VAS (Function).
Comparison 5 Boswellia serrata 999 mg versus valdecoxib, Outcome 3 Participants (n) reported adverse events.
Comparison 5 Boswellia serrata 999 mg versus valdecoxib, Outcome 4 Participants (n) withdrew due to adverse events.
Comparison 6 Curcuma domestica versus ibuprofen, Outcome 1 Pain on walking NRS 0‐10.
Comparison 6 Curcuma domestica versus ibuprofen, Outcome 2 Function: 100m walk time (seconds).
Comparison 6 Curcuma domestica versus ibuprofen, Outcome 3 Participants (n) reported adverse events.
Comparison 7 Derris scandens versus naproxen, Outcome 1 WOMAC‐VAS (Pain) change from baseline.
Comparison 7 Derris scandens versus naproxen, Outcome 2 WOMAC‐VAS (Function) change from baseline.
Comparison 7 Derris scandens versus naproxen, Outcome 3 Participants (n) reported adverse events..
Comparison 8 Harpagophytum procumbens versus diacerhein, Outcome 1 Pain VAS 0‐100 change from baseline at 120 days.
Comparison 8 Harpagophytum procumbens versus diacerhein, Outcome 2 Participants (n) reported adverse events.
Comparison 9 Petiveria alliacea versus placebo, Outcome 1 Pain (scale unknown) with mvt change from baseline.
Comparison 9 Petiveria alliacea versus placebo, Outcome 2 Participants (n) reported adverse events.
Comparison 10 Pinus pinaster (Pycnogenol® 150 mg) versus placebo, Outcome 1 WOMAC‐VAS (Pain).
Comparison 10 Pinus pinaster (Pycnogenol® 150 mg) versus placebo, Outcome 2 WOMAC‐VAS (Function).
Comparison 10 Pinus pinaster (Pycnogenol® 150 mg) versus placebo, Outcome 3 Participants (n) reported adverse events.
Comparison 11 Pinus pinaster (Pycnogenol® 100 mg) versus placebo, Outcome 1 WOMAC 0‐4 (Pain).
Comparison 11 Pinus pinaster (Pycnogenol® 100 mg) versus placebo, Outcome 2 WOMAC 0‐4 (Function).
Comparison 12 Ricinus officinale versus placebo, Outcome 1 Participants (n) reported adverse events.
Comparison 13 Rosa canina versus placebo, Outcome 1 Relief of pain (0 to 4) at 3 months.
Comparison 13 Rosa canina versus placebo, Outcome 2 WOMAC‐VAS (Pain).
Comparison 13 Rosa canina versus placebo, Outcome 3 WOMAC‐VAS (Function).
Comparison 13 Rosa canina versus placebo, Outcome 4 Participants (n) reported adverse events.
Comparison 14 Salix purpurea x daphnoides versus placebo, Outcome 1 Pain VAS 0‐100 at 14 days.
Comparison 14 Salix purpurea x daphnoides versus placebo, Outcome 2 Function VAS 0‐100 at 14 days.
Comparison 14 Salix purpurea x daphnoides versus placebo, Outcome 3 Participants (n) reported adverse events.
Comparison 15 Salix purpurea x daphnoides versus diclofenac, Outcome 1 WOMAC‐VAS (Pain).
Comparison 15 Salix purpurea x daphnoides versus diclofenac, Outcome 2 WOMAC‐VAS (Function).
Comparison 15 Salix purpurea x daphnoides versus diclofenac, Outcome 3 Participants (n) reported adverse events.
Comparison 16 Uncaria guianensis versus placebo, Outcome 1 Pain VAS 0‐100 (night).
Comparison 16 Uncaria guianensis versus placebo, Outcome 2 Participants (n) reported adverse events.
Comparison 17 Zingiber officinale (Zintona EC) versus placebo, Outcome 1 Pain VAS 0‐100 (movement).
Comparison 17 Zingiber officinale (Zintona EC) versus placebo, Outcome 2 Function (handicap) VAS 0‐100.
Comparison 17 Zingiber officinale (Zintona EC) versus placebo, Outcome 3 Participants (n) reported adverse events.
Comparison 18 Boswellia carteri + Curcuma longa versus placebo, Outcome 1 Function: pain free walking time (minutes).
Comparison 19 Persea gratissma + Glycine max (ASU 300 mg) versus placebo, Outcome 1 Pain VAS 0‐100.
Comparison 19 Persea gratissma + Glycine max (ASU 300 mg) versus placebo, Outcome 2 Pain VAS 0‐100 change from baseline at 36 months.
Comparison 19 Persea gratissma + Glycine max (ASU 300 mg) versus placebo, Outcome 3 Pain VAS 0‐100 grouped by joint.
Comparison 19 Persea gratissma + Glycine max (ASU 300 mg) versus placebo, Outcome 4 Function: disability VAS 0‐100.
Comparison 19 Persea gratissma + Glycine max (ASU 300 mg) versus placebo, Outcome 5 WOMAC‐VAS (Function) change from baseline at 36 months.
Comparison 19 Persea gratissma + Glycine max (ASU 300 mg) versus placebo, Outcome 6 Lequesne algofunctional index.
Comparison 19 Persea gratissma + Glycine max (ASU 300 mg) versus placebo, Outcome 7 Function (various tools).
Comparison 19 Persea gratissma + Glycine max (ASU 300 mg) versus placebo, Outcome 8 Participants (n) reported adverse events.
Comparison 19 Persea gratissma + Glycine max (ASU 300 mg) versus placebo, Outcome 9 Participants (n) withdrew due to adverse events.
Comparison 19 Persea gratissma + Glycine max (ASU 300 mg) versus placebo, Outcome 10 Particpants (n) reported serious adverse events.
Comparison 19 Persea gratissma + Glycine max (ASU 300 mg) versus placebo, Outcome 11 JSW change from baseline.
Comparison 20 Persea gratissma + Glycine max (ASU 600 mg) versus placebo, Outcome 1 Pain VAS 0‐100.
Comparison 20 Persea gratissma + Glycine max (ASU 600 mg) versus placebo, Outcome 2 Lequesne algofunctional index.
Comparison 20 Persea gratissma + Glycine max (ASU 600 mg) versus placebo, Outcome 3 Participants (n) reported adverse events.
Comparison 21 Persea gratissma + Glycine max (ASU 300 mg) versus chondroitin sulphate, Outcome 1 WOMAC‐VAS (Pain).
Comparison 21 Persea gratissma + Glycine max (ASU 300 mg) versus chondroitin sulphate, Outcome 2 WOMAC‐VAS (Function).
Comparison 21 Persea gratissma + Glycine max (ASU 300 mg) versus chondroitin sulphate, Outcome 3 Participants (n) reported adverse events.
Comparison 21 Persea gratissma + Glycine max (ASU 300 mg) versus chondroitin sulphate, Outcome 4 Paricipants (n) reported serious adverse events.
Comparison 22 Phellondendron amurense + Citrus sinensis (NP 06‐1) versus placebo, Outcome 1 Lequesne algofunctional index.
Comparison 23 Uncaria guianensis + Lepidium meyenii versus glucosamine sulphate, Outcome 1 Participants (n) reported adverse events.
Comparison 24 Zingiber officinale + Alpinia galanga (EV.EXT77) versus placebo, Outcome 1 Pain immediately after walking 50 feet VAS 0‐100.
Comparison 24 Zingiber officinale + Alpinia galanga (EV.EXT77) versus placebo, Outcome 2 WOMAC‐VAS (Function).
Comparison 24 Zingiber officinale + Alpinia galanga (EV.EXT77) versus placebo, Outcome 3 Participants (n) reported adverse events.
Comparison 25 SKI306X versus placebo, Outcome 1 Pain VAS 0‐100 change from baseline.
Comparison 25 SKI306X versus placebo, Outcome 2 Lequesne algofunctional index change from baseline.
Comparison 25 SKI306X versus placebo, Outcome 3 Participants (n) reported adverse events.
Comparison 26 SKI306X (600 mg) versus diclofenac, Outcome 1 Pain VAS 0‐100 change from baseline.
Comparison 26 SKI306X (600 mg) versus diclofenac, Outcome 2 Lequesne algofunctional index change from baseline.
Comparison 26 SKI306X (600 mg) versus diclofenac, Outcome 3 Participants (n) reported adverse events.
Comparison 27 Phytodolor N versus placebo, Outcome 1 Enduring pain (0 to 3).
Comparison 27 Phytodolor N versus placebo, Outcome 2 Function: mobility limitations (0 to 3).
Comparison 27 Phytodolor N versus placebo, Outcome 3 Participants (n) reported adverse events.
Comparison 28 Reumalex versus placebo, Outcome 1 AIMS2 arthritis pain score change from baseline.
Comparison 28 Reumalex versus placebo, Outcome 2 Participants (n) reported adverse events.
Comparison 29 Chinese DJW versus diclofenac, Outcome 1 Pain VAS 0‐100 (total).
Comparison 29 Chinese DJW versus diclofenac, Outcome 2 Lequesne algofunctional index.
Comparison 29 Chinese DJW versus diclofenac, Outcome 3 Participants (n) reported adverse events.
Comparison 30 Chinese BNHS versus Chinese active control, Outcome 1 Pain VAS 0‐100 (walking).
Comparison 30 Chinese BNHS versus Chinese active control, Outcome 2 WOMAC‐VAS (Function).
Comparison 30 Chinese BNHS versus Chinese active control, Outcome 3 Participants (n) reported adverse events.
Comparison 31 Chinese BNHS versus glucosamine sulphate, Outcome 1 Pain VAS 0‐100 (walking).
Comparison 31 Chinese BNHS versus glucosamine sulphate, Outcome 2 WOMAC‐VAS (Function).
Comparison 31 Chinese BNHS versus glucosamine sulphate, Outcome 3 Participants (n) reported adverse events.
Comparison 32 Ayurvedic A to E versus placebo, Outcome 1 Adverse event episodes (n) reported.
Comparison 33 Ayurvedic Antarth versus placebo, Outcome 1 Pain VAS 0‐100.
Comparison 34 Ayurvedic RA‐II versus placebo, Outcome 1 Pain VAS 0‐100.
Comparison 34 Ayurvedic RA‐II versus placebo, Outcome 2 WOMAC 0‐4 (Function).
Comparison 34 Ayurvedic RA‐II versus placebo, Outcome 3 Participants (n) reported adverse events.
Comparison 35 Ayurvedic SGC versus glucosamine sulphate, Outcome 1 Pain VAS 0‐100 change from baseline.
Comparison 35 Ayurvedic SGC versus glucosamine sulphate, Outcome 2 WOMAC 0‐4 (Function) change from baseline.
Comparison 35 Ayurvedic SGC versus glucosamine sulphate, Outcome 3 Participants (n) reported adverse events.
Comparison 36 Ayurvedic SGC versus celecoxib, Outcome 1 Pain VAS 0‐100 change from baseline.
Comparison 36 Ayurvedic SGC versus celecoxib, Outcome 2 WOMAC 0‐4 (Function) change from baseline.
Comparison 36 Ayurvedic SGC versus celecoxib, Outcome 3 Participants (n) reported adverse events.
Comparison 37 Ayurvedic SGCG versus glucosamine sulphate, Outcome 1 Pain VAS 0‐100 change from baseline.
Comparison 37 Ayurvedic SGCG versus glucosamine sulphate, Outcome 2 WOMAC 0‐4 (Function) change from baseline.
Comparison 37 Ayurvedic SGCG versus glucosamine sulphate, Outcome 3 Participants (n) reported adverse events.
Comparison 38 Ayurvedic SGCG versus celecoxib, Outcome 1 Pain VAS 0‐100 change from baseline.
Comparison 38 Ayurvedic SGCG versus celecoxib, Outcome 2 WOMAC 0‐4 (Function) change from baseline.
Comparison 38 Ayurvedic SGCG versus celecoxib, Outcome 3 Participants (n) reported adverse events.
Comparison 39 Japanese Boiogito + loxoprofen versus loxoprofen, Outcome 1 Pain: Knee Society Rating System 0‐100 (knee).
Comparison 39 Japanese Boiogito + loxoprofen versus loxoprofen, Outcome 2 Function: Knee Society Rating System 0‐50 (stairs).
Comparison 39 Japanese Boiogito + loxoprofen versus loxoprofen, Outcome 3 Participants (n) reported adverse events.
| Boswellia serrata for treating osteoarthritis | ||||||
| Patient or population: patients with treating osteoarthritis | ||||||
| Outcomes | Illustrative comparative risks* (95% CI) | Relative effect | No of Participants | Quality of the evidence | Comments | |
| Assumed risk | Corresponding risk | |||||
| Control | Boswellia serrata | |||||
| Pain | Mean pain in the control group at the end of treatment was 2.50 (0 to 3 scale). | Mean pain in the intervention groups was | ‐ | 30 | ⊕⊕⊝⊝ | Absolute improvement in pain was 56% (46% to 66%); Relative improvement in pain was 80% (66% to 94%)5; NNTB = 1 (95% CI 1 to 2). |
| Function | Mean disability in the control group at the end of treatment was 2.46 (0 to 3 scale). | Mean disability in the intervention groups was | ‐ | 30 | ⊕⊕⊝⊝ | Absolute improvement in function was 54% (44% to 64%); Relative improvement was 76% (62% to 90%)5; NNTB = 1 (95% CI 1 to 3). |
| Adverse events | No (n=0) participants in the control group reported adverse events. 0 per 1000 | Two (n=2) participants in the intervention group reported adverse events. 0 per 1000 | RR 5.00 | 30 | ⊕⊕⊝⊝ | Absolute risk of adverse events was 13% higher in the Boswellia serrata group (6% lower to 33% higher); Relative percentage change 400% worsening (74% to 9513% worsening); NNT n/a.6 |
| Adverse events Participants (n) withdrew due to adverse effects | See comment | See comment | Not estimable | 30 | See comment | Reported NIL withdrawals due to adverse events. |
| Adverse events Participants (n) reported serious adverse events | See comment | See comment | Not estimable | ‐ | See comment | Serious adverse events not reported as discrete outcome. |
| Radiographic joint changes | See comment | See comment | Not estimable | ‐ | See comment | Radiographic joint changes not measured. |
| Quality of life | See comment | See comment | Not estimable | ‐ | See comment | Quality of life not measured. |
| *The basis for the assumed risk (e.g. the median control group risk across studies) is provided in footnotes. The corresponding risk (and its 95% confidence interval) is based on the assumed risk in the comparison group and the relative effect of the intervention (and its 95% CI). | ||||||
| GRADE Working Group grades of evidence | ||||||
| 1 Criteria for diagnosis of OA not specified. 4 Downgrade estimate due to single study. 5 Control group baseline pain (SD) 2.80 (0.41), baseline disability 2.86 (0.35), from Kimmatkar 2003. 6 Number needed to treat (NNT) = not applicable (n/a) when result is not statistically significant. NNT for continuous outcomes calculated using Wells Calculator (CMSG editorial office). NNT for dichotomous outcomes calculated using Cates NNT calculator (http://www.nntonline.net/visualrx/). Assumed a minimal clinically important difference of 1 point of a 0 to 3 point scale (pain, function). | ||||||
| Boswellia serrata (enriched) 100 mg for treating osteoarthritis | ||||||
| Patient or population: patients with treating osteoarthritis | ||||||
| Outcomes | Illustrative comparative risks* (95% CI) | Relative effect | No of Participants | Quality of the evidence | Comments | |
| Assumed risk | Corresponding risk | |||||
| Control | Boswellia serrata (enriched) 100mg | |||||
| Pain Global pain VAS 0‐100 (higher scores mean worse) | Weighted mean pain in the control groups at the end of treatment was 40.02 (0 to 100 scale). | The weighted mean pain in the intervention groups was | ‐ | 85 | ⊕⊕⊕⊝ | Absolute improvement in pain was 17% (8% to 26%); Relative improvement in pain was 29% (15% to 43%)3; NNTB 2 (95% CI 1 to 6). |
| Function | Weighted mean disability in the control groups at the end of treatment was 33.13 (0 to 100 scale). | The weighted mean disability in the intervention groups was | ‐ | 85 | ⊕⊕⊕⊝ | Absolute improvement was 8% (14% to 2%); Relative improvement was 20% (5% to 34%)3; NNTB 4 (95% CI 2 to 18). |
| Adverse events | 625 per 1000 | 375 per 1000 | RR 0.60 | 96 | ⊕⊕⊕⊝ | Absolute risk of adverse events was 25% lower in the Boswellia serrata group (6% to 44% lower); Relative percentage change 40% improvement (61% improvement to 9% worsening); NNT = 4 (95% CI 3 to 22). |
| Adverse events Participants (n) withdrew due to adverse effects | See comment | See comment | Not estimable | 96 | See comment | Reported NIL withdrawals due to adverse events. |
| Adverse events Participants (n) reported serious adverse events | See comment | See comment | Not estimable | 96 | See comment | Reported NIL serious adverse events. |
| Radiographic joint changes | See comment | See comment | Not estimable | ‐ | See comment | Radiographic joint changes not measured. |
| Quality of life | See comment | See comment | Not estimable | ‐ | See comment | Quality of life not measured. |
| *The basis for the assumed risk (e.g. the median control group risk across studies) is provided in footnotes. The corresponding risk (and its 95% confidence interval) is based on the assumed risk in the comparison group and the relative effect of the intervention (and its 95% CI). | ||||||
| GRADE Working Group grades of evidence | ||||||
| 1Sengupta 2008, Sengupta 2010, Vishal 2011: WOMAC scores presented as subscale scores only. Overall WOMAC not reported. 2 Confirmatory study design: statistical power 80%, alpha set at 0.05, but downgraded due to potential imprecision due to small number of participants; and lower limit of 95% CI does not preclude clincially insignificant change 3 Control group baseline measures taken from Sengupta 2008, the study most heavily weighted in the meta‐analyses. Control group baseline pain (SD) 56.88 (12.04), baseline disability 41.3 (9.6). 4 Downgrade estimate due to potential imprecision, eg, small number of events and participants from a single study. 5 Number needed to treat (NNT) is not applicable (n/a) when result is not statistically significant. NNT for dichotomous outcomes calculated using Cates NNT calculator (http://www.nntonline.net/visualrx/); NNT for continuous outcomes calculated using Wells Calculator (CMSG editorial office). Assumed a minimal clinically important difference of 15 points on 0 to 100 mm pain scale, and 10 points on 0 to 100 mm function scale. | ||||||
| Boswellia serrata (enriched) 250mg for treating osteoarthritis | ||||||
| Patient or population: patients with treating osteoarthritis | ||||||
| Outcomes | Illustrative comparative risks* (95% CI) | Relative effect | No of Participants | Quality of the evidence | Comments | |
| Assumed risk | Corresponding risk | |||||
| Control | Boswellia serrata (enriched) 250mg | |||||
| Pain | Mean pain in the control group at the end of treatment was 41.76 (0 to 100 scale). | Mean pain in the intervention group was | ‐ | 47 | ⊕⊕⊕⊝ | Absolute improvement in pain was 28% (20% to 35%); Relative improvement in pain was 48% (36% to 61%)3 ; NNT = 1 (95% CI 1 to 2). |
| Function (higher scores mean worse) | Mean disability in the control group at the end of treatment was 34.07 (0 to 100 scale). | Mean disability in the intervention group was | ‐ | 47 | ⊕⊕⊕⊝ | Absolute improvement in disability was 17% (12% to 21%); Relative improvement in disability was 41% (30% to 51%)3; NNT = 1 (95% CI 1 to 2). |
| Adverse events | 526 per 1000 | 474 per 1000 | RR 0.90 | 114 | ⊕⊕⊕⊝ | Absolute risk of adverse events was 5% lower in the Boswellia serrata group (24% lower to 13% higher); Relative percentage change 10% improvement (38% improvement to 30% worsening); NNT n/a.4 |
| Adverse events Participants (n) withdrew due to adverse effects | See comment | See comment | Not estimable | 114 | See comment | Reported NIL withdrawals due to adverse events. |
| Adverse events Participants (n) reported serious adverse events | See comment | See comment | Not estimable | 114 | See comment | Reported NIL serious adverse events. |
| Radiographic joint changes | See comment | See comment | Not estimable | ‐ | See comment | Radiographic joint changes not measured. |
| Quality of life | See comment | See comment | Not estimable | ‐ | See comment | Quality of life not measured. |
| *The basis for the assumed risk (e.g. the median control group risk across studies) is provided in footnotes. The corresponding risk (and its 95% confidence interval) is based on the assumed risk in the comparison group and the relative effect of the intervention (and its 95% CI). | ||||||
| GRADE Working Group grades of evidence | ||||||
| 1Sengupta 2008: WOMAC scores presented as subscale scores only. Overall WOMAC not reported. 2 Downgrade estimate due to single study. 3 Control group baseline pain (SD) 56.88 (12.04), baseline disability 41.3 (9.6), from Sengupta 2008. 4 Number needed to treat (NNT) = not applicable (n/a) when result is not statistically significant. NNT for continuous outcomes calculated using Wells Calculator (CMSG editorial office). NNT for dichotomous outcomes calculated using Cates NNT calculator (http://www.nntonline.net/visualrx/). | ||||||
| Boswellia serrata (enriched) plus non‐volatile oil for treating osteoarthritis | ||||||
| Patient or population: patients with treating osteoarthritis | ||||||
| Outcomes | Illustrative comparative risks* (95% CI) | Relative effect | No of Participants | Quality of the evidence | Comments | |
| Assumed risk | Corresponding risk | |||||
| Control | Boswellia serrata (enriched) plus non‐volatile oil | |||||
| Pain | Weighted mean pain in the control groups at the end of treatment was 38.90 (0 to 100 scale). | Weighted mean pain in the intervention groups was | ‐ | 97 | ⊕⊕⊕⊝ | Absolute improvement in pain was 16% (12% to 20%); Relative improvement in pain was 34%(25% to 42%)3; NNTB 2 (1 to 4)4 |
| Function (higher scores mean worse) | Weighted mean disability in the control groups at the end of treatment was 34.90 (0 to 100 scale). | Weighted mean disability in the intervention groups was | ‐ | 97 | ⊕⊕⊕⊝ | Absolute improvement in disability was 15% (11% to 19%); Relative improvement in disability was 37% (27% to 47%)3; NNTB 2 (1 to 3). |
| Adverse events | 42 per 1000 | 41 per 1000 | RR 0.98 | 97 | ⊕⊕⊕⊝ | Absolute risk of adverse events was 0% lower in the Boswellia serrata group (8% lower to 8% higher); Relative percentage change 2% improvement (86% improvement to 569% worsening); NNT n/a.5 |
| Adverse events Participants (n) withdrew due to adverse effects | See comment | See comment | Not estimable | ‐ | See comment | Reported NIL withdrawals due to adverse events. |
| Adverse events Participants (n) reported serious adverse events | See comment | See comment | Not estimable | ‐ | See comment | Reported NIL serious adverse events. |
| Radiographic joint changes | See comment | See comment | Not estimable | ‐ | See comment | Radiographic joint changes not measured. |
| Quality of life | See comment | See comment | Not estimable | ‐ | See comment | Quality of life not measured. |
| *The basis for the assumed risk (e.g. the median control group risk across studies) is provided in footnotes. The corresponding risk (and its 95% confidence interval) is based on the assumed risk in the comparison group and the relative effect of the intervention (and its 95% CI). | ||||||
| GRADE Working Group grades of evidence | ||||||
| 1Vishal 2011: 30 day intervention. Sengupta 2010: 90 day intervention. 4 Number needed to treat to benefit (NNTB), and harm (NNTH) = not applicable (n/a) when result is not statistically significant. NNT for continuous outcomes calculated using Wells Calculator (CMSG editorial office). NNT for dichotomous outcomes calculated using Cates NNT calculator (http://www.nntonline.net/visualrx/). 5Sengupta 2010, Vishal 2011: WOMAC scores presented as subscale scores only. Overall WOMAC not reported. | ||||||
| Boswellia serrata compared to valdecoxib for treating osteoarthritis | ||||||
| Patient or population: patients with treating osteoarthritis | ||||||
| Outcomes | Illustrative comparative risks* (95% CI) | Relative effect | No of Participants | Quality of the evidence | Comments | |
| Assumed risk | Corresponding risk | |||||
| Valdecoxib | Boswellia serrata | |||||
| Pain (higher scores mean worse) | Mean pain in the valdecoxib group at the end of treatment was 17.08 (0 to 100 scale). | Mean pain in the intervention groups was | ‐ | 58 | ⊕⊝⊝⊝ | Absolute improvement in pain was 1% (7% improvement to 6% worsening); Relative improvement in pain was 1%4; NNT n/a.5 |
| Function Follow‐up: mean 6 months | Mean disability in the valdecoxib group at the end of treatment was 16.64 (0 to 100 scale). | Mean disability in the intervention groups was | ‐ | 58 | ⊕⊝⊝⊝ | Absolute worsening in disability was 3% (4% improvement to 9% worsening); Relative improvement in disability was 4%4; NNT n/a.5 |
| Adverse events | 61 per 1000 | 121 per 1000 | RR 2.0 | 66 | ⊕⊝⊝⊝ | Absolute risk of adverse events was 6% higher in the Boswellia serrata group (8% lower to 20% higher); Relative percentage change 100% worsening (61% improvement to 918% worsening); NNT n/a.5 |
| Adverse events Participants (n) withdrew due to adverse effects | RR 3.0 (0.13 to 71.07) | 66 | ⊕⊝⊝⊝ | Reported one (1) withdrawal possibly due to adverse events. Absolute risk of withdrawal due to adverse events was 3% higher in the Boswellia serrata group (5% lower to 11% higher); Relative percentage change 200% worsening (87% improvement to 7007% worsening); NNT n/a.5 | ||
| Adverse events Participants (n) reported serious adverse events | See comment | See comment | Not estimable | 66 | See comment | Reported NIL serious adverse events. |
| Radiographic joint changes | See comment | See comment | Not estimable | ‐ | See comment | Radiographic joint changes not measured. |
| Quality of life | See comment | See comment | Not estimable | ‐ | See comment | Quality of life not measured. |
| *The basis for the assumed risk (e.g. the median control group risk across studies) is provided in footnotes. The corresponding risk (and its 95% confidence interval) is based on the assumed risk in the comparison group and the relative effect of the intervention (and its 95% CI). | ||||||
| GRADE Working Group grades of evidence | ||||||
| 1 Open trial. Medication regimens differ between active control and intervention. 2 Downgrade estimate due to single study. Treatment effect crosses midline (no effect). 4 Baseline pain in valdecoxib group 49.2, baseline disability 51.6. Aggregate WOMAC scores converted to normalised scores for re‐analysis. 5 Number needed to treat (NNT) = not applicable (n/a) when result is not statistically significant. NNT for continuous outcomes calculated using Wells Calculator (CMSG editorial office). NNT for dichotomous outcomes calculated using Cates NNT calculator (http://www.nntonline.net/visualrx/). | ||||||
| Persea gratissma + Glycine max (ASU 300 mg) for treating osteoarthritis | ||||||
| Patient or population: patients with osteoarthritis | ||||||
| Outcomes | Illustrative comparative risks* (95% CI) | Relative effect | No of Participants | Quality of the evidence | Comments | |
| Assumed risk | Corresponding risk | |||||
| Control | Persea gratissma + Glycine max (ASU 300mg) | |||||
| Pain | Weighted mean pain in the control groups at end of treatment was 40.53 (0 to 100 scale). | Weighted mean pain in the intervention groups was | ‐ | 651 | ⊕⊕⊕⊝ | Absolute improvement in pain was 8% (1% to 16%); Relative improvement in pain was 15% (2% to 29%)2; NNTB 8 (4 to 77)3 |
| Function | Mean disability in the control group at end of treatment was 47.10 mm, on VAS 0 to 100 mm scale (higher scores mean worse)5. | Mean disability in the intervention groups was | ‐ | 642 | ⊕⊕⊕⊝ | SMD ‐0.42 (95% CI ‐0.73 to ‐0.11), in favour of ASU 300mg Absolute improvement in disability was 7% (2% to 12%); Relative improvement in disability was 13% (4% to 23%)7; NNTB 5 (3 to 19)3 |
| Adverse events | 510 per 1000 | 531 per 1000 | RR 1.04 | 1050 | ⊕⊕⊕⊝ | Absolute risk of adverse events is 2% higher in the ASU group (2% lower to 7% higher); Relative percentage change 4% worsening (9% improvement to 12% worsening); NNT n/a3 |
| Adverse events Participants (n) withdrew due to adverse effects | 148 per 1000 | 169 per 100 (108 to 267) | RR 1.14 (0.73 to 1.80) | 398 (1 study) | ⊕⊕⊕⊝ | Absolute risk of participants withdrawing due to adverse events in 2% higher in ASU group (5% lower to 9% higher); Relative percentage change 14% worsening (27% improvement to 90% worsening); NNT n/a.3,9 |
| Adverse events Participants (n) reported serious adverse events | 325 per 1000 | 397 per 1000 (306 to 517) | RR 1.22 (0.94 to 1.59) | 398 (1 study) | ⊕⊕⊕⊝ | Absolute risk of serious adverse events is 7% higher in the ASU group (2% lower to 17% higher); Relative percentage change 22% worsening (6% improvement to 59% worsening); NNT n/a.3,9 |
| Radiographic joint changes Change in Joint Space Width (JSW) from baseline (higher scores mean worse). Follow up: 24 to 36 months. | Weighted mean JSW change from baseline in the control groups at end of treatment was 0.65. | Mean JSW change from baseline in the intervention groups was 0.12 lower (0.43 lower to 0.19 higher) | ‐ | 453 (2 studies) | ⊕⊕⊕⊝ | Absolute change NNT n/a.3,9 |
| Quality of life | See comment | See comment | Not estimable | ‐ | See comment | Quality of life not measured. |
| *The basis for the assumed risk (e.g. the median control group risk across studies) is provided in footnotes. The corresponding risk (and its 95% confidence interval) is based on the assumed risk in the comparison group and the relative effect of the intervention (and its 95% CI). | ||||||
| GRADE Working Group grades of evidence | ||||||
| 1Downgrade due to heterogeneity, inconsistency 2 Calculations based on control group baseline pain measure taken from Blotman 1997, the most heavily weighted study in the meta‐analysis. Control group baseline mean (SD) pain 54.3 (11.9). 3 Number needed to treat to benefit (NNTB), or to harm (NNTH) = not applicable (n/a) when result is not statistically significant. NNT for dichotomous outcomes calculated using Cates NNT calculator (http://www.nntonline.net/visualrx/)NNT for continuous outcomes calculated using Wells Calculator (CMSG editorial office), assuming a minimal clinically important difference of 15 mm on a 0 to 100 mm pain scale, and 10 mm on a 0 to 100 mm function scale. 4 Multiple tools: Disability VAS reported in one study only (Maheu 1998); WOMAC change score reported in one study (Maheu 2013); Lequesne algofunctional index reported in four studies, but to avoid over‐reporting, data were extracted on this outcome from three studies only (Appelboom 2001, Blotman 1997, Lequesne 2002) 5 From Maheu 1998: follow‐up disability score in the control group 47.10 mm (VAS 0 to 100 mm scale) 6 Four trials pooled (Appelboom 2001, Blotman 1997, Lequesne 2002, Maheu 1998) using SMD, and re‐expressed as MD by multiplying the SMD (95% CI) by the baseline SD in the control group of Maheu 1998 (16.78). 7 Calculations based on data from Maheu 1998: control group baseline mean (SD) disability 52.5 (16.78), 0 to 100 mm VAS scale. 8 Downgrade estimate due to imprecision: few participants. 9 Treatment effect crosses midline (no effect). | ||||||
| Persea gratissma + Glycine max (ASU 600 mg) for treating osteoarthritis | ||||||
| Patient or population: patients with osteoarthritis | ||||||
| Outcomes | Illustrative comparative risks* (95% CI) | Relative effect | No of Participants | Quality of the evidence | Comments | |
| Assumed risk | Corresponding risk | |||||
| Control | Persea gratissma + Glycine max (ASU 600mg) | |||||
| Pain (higher scores mean worse) Follow up: 3 months | Mean pain in the control group at the end of treatment was 42.4 (0 to 100 scale). | Mean pain in the intervention group was | ‐ | 156 | ⊕⊕⊕⊝ | Absolute improvement in pain was 14% (21% to 8%); Relative improvement in pain was 26.5%2; NNT = |
| Function (higher scores mean worse) | Mean disability in the control group at the end of treatment was 7.8 (0 to 24 scale). | Mean disability in the intervention group was | ‐ | 156 | ⊕⊕⊕⊝ | Absolute improvement in disability was 1% (1% to 0%); Relative improvement in disability was 13.7%2; NNT = |
| Adverse events | 261 per 1000 | 278 per 1000 | RR 1.07 | 174 | ⊕⊕⊕⊝ | Absolute risk of adverse events is 2% higher in the ASU group (11% lower to 15% higher); Relative percentage change 7% worsening (34% improvement to 74% worsening); NNT n/a.3 |
| Adverse events Participants (n) withdrew due to adverse effects | See comment | See comment | Not estimable | 174 | See comment | Withdrawals due to adverse events not reported as a discrete outcome in ASU 600mg subgroup. |
| Adverse events Participants (n) reported serious adverse events | See comment | See comment | Not estimable | 174 | See comment | Serious adverse events not reported as a discrete outcome in ASU 600mg subgroup. |
| Radiographic joint changes | See comment | See comment | Not estimable | ‐ | See comment | Radiographic joint changes not measured. |
| Quality of life | See comment | See comment | Not estimable | ‐ | See comment | Quality of life not measured. |
| *The basis for the assumed risk (e.g. the median control group risk across studies) is provided in footnotes. The corresponding risk (and its 95% confidence interval) is based on the assumed risk in the comparison group and the relative effect of the intervention (and its 95% CI). | ||||||
| GRADE Working Group grades of evidence | ||||||
| 1 Single study. 2 Control group baseline mean (SD) pain 53.5 (13.9), baseline mean (SD) disability 9.5 (2.2), from Appelboom 2001. 3 Number needed to treat (NNT) = not applicable (n/a) when result is not statistically significant. NNT for continuous outcomes calculated using Wells Calculator (CMSG editorial office). NNT for dichotomous outcomes calculated using Cates NNT calculator (http://www.nntonline.net/visualrx/). | ||||||
| Persea gratissma + Glycine max (ASU 300 mg) compared to chondroitin sulphate for treating osteoarthritis | ||||||
| Patient or population: patients with osteoarthritis | ||||||
| Outcomes | Illustrative comparative risks* (95% CI) | Relative effect | No of Participants | Quality of the evidence | Comments | |
| Assumed risk | Corresponding risk | |||||
| Chondroitin sulphate | Persea gratissma + Glycine max (ASU 300mg) | |||||
| Pain (higher scores mean worse) | Mean pain in the chondroitin sulphate group at the end of treatment was 22.88 (0 to 100 scale). | The mean pain in the intervention group was | ‐ | 357 | ⊕⊕⊝⊝ | Absolute worsening of pain was 10% (10% improvement to 31% worsening); Relative worsening of pain was 3%3; NNT n/a.4 |
| Function (higher scores mean worse) | Mean function in the chondroitin sulphate group at the end of treatment was 25.14 (0 to 100 scale). | The mean disability in the intervention group was | ‐ | 357 | ⊕⊕⊝⊝ | Absolute worsening of disability was 28% (43% improvement to 98% worsening); Relative worsening of disability was 3%3; NNT n/a.4 |
| Adverse events | 244 per 1000 | 210 per 1000 | RR 0.86 | 357 | ⊕⊕⊝⊝ | Absolute risk of adverse events was 3% lower in the ASU group (12% lower to 5% higher); Relative percentage change 14% improvement (41% improvement to 26% worsening); NNT n/a.4 |
| Adverse events Participants (n) withdrew due to adverse effects | See comment | See comment | Not estimable | 357 | Withdrawals due to adverse events not reported as a discrete outcome. | |
| Adverse events Participants (n) reported serious adverse events | 6 per 1000 | 17 per 1000 (2 to 158) | RR 2.92 (0.31 to 27.78) | 357 | ⊕⊕⊝⊝ | Absolute risk of serious adverse events was 1% higher in the ASU group (1% lower to 3% higher); Relative percentage change 192% worsening (69% improvement to 2678% worsening); NNT n/a.4 |
| Radiographic joint changes | See comment | See comment | Not estimable | ‐ | See comment | Radiographic joint changes not measured. |
| Quality of life | See comment | See comment | Not estimable | ‐ | See comment | Quality of life not measured. |
| *The basis for the assumed risk (e.g. the median control group risk across studies) is provided in footnotes. The corresponding risk (and its 95% confidence interval) is based on the assumed risk in the comparison group and the relative effect of the intervention (and its 95% CI). | ||||||
| GRADE Working Group grades of evidence | ||||||
| 1 SIngle study. Treatment effect crosses midline (no effect). 2 Chondroitin sulfate might not be active control. Non‐inferiority hypothesis may be flawed. 3 Chrondroitin sulfate group baseline pain 49.08, baseline disability 49.07. Aggregate WOMAC scores converted to normalised scores for re‐analysis. 4 Number needed to treat (NNT) = not applicable (n/a) when result is not statistically significant. NNT for continuous outcomes calculated using Wells Calculator (CMSG editorial office). NNT for dichotomous outcomes calculated using Cates NNT calculator (http://www.nntonline.net/visualrx/). | ||||||
| PLANT | MEDICINAL PRODUCT | DOSE | MARKER | |||||
| Botanical name | Part/s | Tradename | Preparation | Drug:Extract | mg/day | Constituent marker | Quantity of marker | References |
| Medicinal products from single plants | ||||||||
| Boswellia serrata | gum resin | CapWokvelTM | extraction solvent not stated | not stated | 999 | boswellic acid (total organic acids 65%) | 40% | |
| 5‐Loxin | 100 or 250 | AKBA | 30% | |||||
| Aflapin | 100 | AKBA + non‐volatile oil | 20% | |||||
| Curcuma domestica | root | study medication | ethanolic extract | not stated | curcumoids | 500mg | ||
| Derris scandens | stem | study medication | ethanolic (50%) extract | not stated | 800 | genistein derivatve | not stated | |
| Garcinia kola | seed | study medication | freeze‐dried aqueous extract | not stated | 400 | not stated | ||
| Harpagophytum procumbens | root | Arthrotabs | aqueous extract | 1.5‐2.5:1 | 2400 | harpagoside1 | 30 mg | |
| Flexiloges | ethanolic (60%) extract | 4.5‐5.5:1 | 960 | <30 mg | ||||
| Harpadol | cryoground powder | 2610 | 60 mg | |||||
| Petiveria alliacea | herb | Tipi tea | aqueous extract | 9g / 600 ml | 600 ml | not stated | ||
| Pinus pinaster (synonym Pinus maritima) | bark | Pycnogenol® | polyphenol concentrate | 150 | proanthocyanidins | 45 (90%) | ||
| 100 | not stated | |||||||
| 150 | 70% | |||||||
| Ricinus officinalis | seed | study medication | oil | not stated | 2,7 ml | ricinoleic acid | not stated | |
| Rosa canina lito | rose hip and seed | Hyben Vital or Litozin | powder | 5000 | galactolipid | 1.5mg | ||
| Salix daphnoides | bark | study medication | ethanolic (70%) extract | 8‐14:1 | 1573 | salicin | 240 mg | |
| Salix pupurea x daphnoides | bark | study medication | ethanolic (70%) extract2 | 10‐20:1 | 1360 | salicin | 240 mg | |
| Uncaria guianensis | bark | study medication | freeze‐dried aqueous extract | not stated | 100 | not stated | ||
| Vitellaria paradoxa | seed | study medication | patented extract | not stated | 2250 | triterpenes | 75% | |
| Zingiber officinale3 | root | EV.EXT 33 | acetone extract3 | 20:1 | 510 | not stated | ||
| Zingiber officinale | root | Zintona EC | CO2 extract | not stated | 1000 | gingerol | 40 mg | |
| Medicinal products from two plants | ||||||||
| Boswellia carteri + Curcuma longa | gum + root | study medication | extract, solvent not stated | not stated | not stated | boswellic acid | 37.5% | |
| Persea gratissma (P) + Glycine max (G) | oils | Piascledine 300 | unsaponifiable fraction 1/3 P;2/3 G | 300 or 600 | not stated | Appelboom 2001, Blotman 1997, Lequesne 2002, Maheu 1998, Maheu 2013. | ||
| Phellondenron amurense + Citrus sinensis | bark peel | NP 06‐1 | extract, solvent not stated | not stated | 370 mixture | berberine polymethoxylated flavones | 50% 30% | |
| Uncaria guianensis + Lepidium meyenii | bark | Reparagen® | freeze‐dried aqueous extract | not stated | 1500 300 | not stated | ||
| Zingiber officinale + Alpinia galanga | root | EV.EXT 77 | acetone extract3 | 20:1 | not stated | not stated | ||
| Medicinal products from three or more plants | ||||||||
| Clematis mandshurica + Prunella vulgaris + Trichosanthes kirilowii | root, flower, root; 1:1:2 | SKI306X | ethanol 30% extracts, thereafter butanol extraction | 7:1 | 600‐1800 | oleanolic acid 4%, rosmarinic acids 0.2%, ursolic acids 0.5%, hydroxybenzoic acid 0.03%, | ||
| Fraxinus excelsior | bark | Phytodolor | fresh plant ethanolic (45,6%) extract | 3:1:1 | 5‐8 ml | total flavonoids | 0.34 ‐ 0.56 mg | |
| salicyl alcohol | 0.48 ‐ 0.8 mg | |||||||
| Solidago virgaurea | herb | isofraxidin | 0.67 ‐ 1.1 mg | |||||
| Populus tremula | bark and leaf | salicin | 4.8 ‐ 8 mg | |||||
| Salix alba | bark | Reumalex | powder | 200 | salicin | 40‐80mg | ||
| Guaiacun officinale | resin | powder | 80 | |||||
| Cimicifuga racemosa | root | powder | 70 | |||||
| Smilax (species not stated) | root | extract, solvent not stated | 4:1 | 50 | ||||
| Populus (species not stated) | bark | extract, solvent not stated | 7:1 | 34 | ||||
| Chinese mixture4 | herb | Duhuo Jisheng Wan | powder | 3 x 3 g | not stated | |||
| Paeoniae alba | root | Chinese mixture: Blood nourishing, hard softening (BNHS) | extract, solvent not stated | not stated | 3150 | paconiflorin | not stated | |
| Gentiana macrophylla | gentianine | |||||||
| Glycyrrhiza (species not stated) | not stated | |||||||
| Auryvedic formaulae5 | powder | not stated | 1000 | total gingerols | not stated | |||
| Zingiber officinale | rhizome | component of formulae A, B, C, D, and E | ||||||
| Tinospora cordifolia | stem | component of formulae A, B, C, D, and E | aqueous extract | 220 | tinosporosides | not stated | ||
| Withania somnifera | root | component of formulae B and E | aqueous extract | 600 | total withanolides | not stated | ||
| Emblica officinale | fruit | component of formulae C | aqueous extract | 500 | tannins galic acid | not stated | ||
| Tribulus terrestris | fruit | component of formulae A and B | aqueous extract | 216 | total saponins | not stated | ||
| Ayuvedic formula6 | Antarth3 (for sandhigata vata) | not stated | not stated | not stated | not stated | |||
| Ayuvedic formula | RA‐11 | not stated | not stated | not stated | not stated | |||
| Ayuvedic formula | SGC | |||||||
| Ayuvedic | SGCG | |||||||
| Japanese mixture7 | Boiogito | not stated | not stated | 7.5g | not stated | not stated | ||
| 1. Harpagoside content estimated indirectly and approximately from iridoid glycoside content in daily dose of raw material (Sporer 1999). 2. Ethanolic extract stated in unpublished thesis but not in published paper (Schmid 1998b). 3. Information provided by manufacturer but not reported in paper. 4. Chinese herbal medicine contains 7.75% each of: radix angelicae pubescentiis, radix gentianae macrophyllae, cortex eucommiae, radix achyranthis bidentatae, radix angelicae sinensis, herba taxilli, radix rehmanniae preparata, rhizoma chuanxiong, cortex cinnamomi, radix ledebouriellae. 5% each of: radix paeoniae alba, radix codonopis, radix glycyrrhizae, poria. 2.5% herba asari. 5. All Ayurvedic formulae A‐E contain Zingiber officinale (dried rhizome powder, total gingerols as marker), and Tinospora cordifolia (dried stem aqueous extract, marker tinosporosides). Some formulae also included Emblica officinale, Withania somnifera, or Tribulus terrestris. Drug:extract ratio and marker content not stated. 6. Ayurvedic phytomedicine Antarth contains Boswellia serrata, Commiphora mukul, Curcuma longa and Vitex negundo, Alpinia galangal, Withania somnifera, Tribulus terrestris, and Tinospora cordifolia. 7. Japanese herbal medicine Boiogito contains Sinomenium acutum, Astragalus (species not stated) root, Atractylodes lancea rhizome, Jujube (probably Ziziphus zizyphus), Glycyrrhiza (species not stated), and ginger (species not stated, probably Zingiber officinale). | ||||||||
| Outcome or subgroup title | No. of studies | No. of participants | Statistical method | Effect size |
| 1 Pain (0 to 3) Show forest plot | 1 | Mean Difference (IV, Random, 95% CI) | Totals not selected | |
| 2 Function: loss of function (0 to 3) Show forest plot | 1 | Mean Difference (IV, Random, 95% CI) | Totals not selected | |
| 3 Participants (n) reported adverse effects Show forest plot | 1 | Risk Ratio (M‐H, Random, 95% CI) | Totals not selected | |
| Outcome or subgroup title | No. of studies | No. of participants | Statistical method | Effect size |
| 1 Pain VAS 0‐100 at 90 days Show forest plot | 2 | 85 | Mean Difference (IV, Random, 95% CI) | ‐16.57 [‐24.67, ‐8.47] |
| 2 WOMAC‐VAS (Function) Show forest plot | 2 | 85 | Mean Difference (IV, Random, 95% CI) | ‐8.21 [‐14.21, ‐2.22] |
| 3 Adverse event episodes (n) reported Show forest plot | 1 | Risk Ratio (M‐H, Random, 95% CI) | Totals not selected | |
| Outcome or subgroup title | No. of studies | No. of participants | Statistical method | Effect size |
| 1 Pain VAS 0‐100 at 90 days Show forest plot | 1 | Mean Difference (IV, Random, 95% CI) | Totals not selected | |
| 2 WOMAC‐VAS (Function) Show forest plot | 1 | Mean Difference (IV, Random, 95% CI) | Totals not selected | |
| 3 Adverse event episodes (n) reported Show forest plot | 1 | Risk Ratio (M‐H, Random, 95% CI) | Totals not selected | |
| Outcome or subgroup title | No. of studies | No. of participants | Statistical method | Effect size |
| 1 Pain VAS 0‐100 Show forest plot | 2 | 97 | Mean Difference (IV, Random, 95% CI) | ‐16.09 [‐20.37, ‐11.81] |
| 1.1 At 90 days | 1 | 38 | Mean Difference (IV, Random, 95% CI) | ‐18.10 [‐24.95, ‐11.25] |
| 1.2 At 30 days | 1 | 59 | Mean Difference (IV, Random, 95% CI) | ‐14.80 [‐20.29, ‐9.31] |
| 2 WOMAC‐VAS (Function) Show forest plot | 2 | 97 | Mean Difference (IV, Random, 95% CI) | ‐15.01 [‐19.21, ‐10.81] |
| 2.1 At 30 days | 1 | 59 | Mean Difference (IV, Random, 95% CI) | ‐14.30 [‐20.07, ‐8.53] |
| 2.2 At 90 days | 1 | 38 | Mean Difference (IV, Random, 95% CI) | ‐15.8 [‐21.92, ‐9.68] |
| 3 Participants (n) reported adverse events Show forest plot | 2 | 97 | Odds Ratio (M‐H, Random, 95% CI) | 0.98 [0.13, 7.29] |
| 3.1 At 30 days | 1 | 59 | Odds Ratio (M‐H, Random, 95% CI) | 0.97 [0.06, 16.20] |
| 3.2 At 90 days | 1 | 38 | Odds Ratio (M‐H, Random, 95% CI) | 1.0 [0.06, 17.25] |
| Outcome or subgroup title | No. of studies | No. of participants | Statistical method | Effect size |
| 1 WOMAC‐VAS (Pain) Show forest plot | 1 | 58 | Mean Difference (IV, Random, 95% CI) | ‐0.51 [‐7.26, 6.24] |
| 2 WOMAC‐VAS (Function) Show forest plot | 1 | 58 | Mean Difference (IV, Random, 95% CI) | 2.49 [‐4.07, 9.05] |
| 3 Participants (n) reported adverse events Show forest plot | 1 | 66 | Risk Ratio (M‐H, Random, 95% CI) | 2.0 [0.39, 10.18] |
| 4 Participants (n) withdrew due to adverse events Show forest plot | 1 | 66 | Risk Ratio (M‐H, Random, 95% CI) | 3.0 [0.13, 71.07] |
| Outcome or subgroup title | No. of studies | No. of participants | Statistical method | Effect size |
| 1 Pain on walking NRS 0‐10 Show forest plot | 1 | Mean Difference (IV, Random, 95% CI) | Subtotals only | |
| 2 Function: 100m walk time (seconds) Show forest plot | 1 | Mean Difference (IV, Random, 95% CI) | Subtotals only | |
| 3 Participants (n) reported adverse events Show forest plot | 1 | 100 | Risk Ratio (M‐H, Random, 95% CI) | 0.75 [0.46, 1.25] |
| Outcome or subgroup title | No. of studies | No. of participants | Statistical method | Effect size |
| 1 WOMAC‐VAS (Pain) change from baseline Show forest plot | 1 | 107 | Mean Difference (IV, Random, 95% CI) | 5.0 [‐1.84, 11.84] |
| 2 WOMAC‐VAS (Function) change from baseline Show forest plot | 1 | 107 | Mean Difference (IV, Random, 95% CI) | 5.10 [‐0.13, 10.33] |
| 3 Participants (n) reported adverse events. Show forest plot | 1 | 125 | Risk Ratio (M‐H, Random, 95% CI) | 0.75 [0.49, 1.15] |
| Outcome or subgroup title | No. of studies | No. of participants | Statistical method | Effect size |
| 1 Pain VAS 0‐100 change from baseline at 120 days Show forest plot | 1 | 92 | Mean Difference (IV, Random, 95% CI) | ‐5.10 [‐6.52, ‐3.68] |
| 2 Participants (n) reported adverse events Show forest plot | 1 | 92 | Risk Ratio (M‐H, Random, 95% CI) | 0.4 [0.21, 0.75] |
| Outcome or subgroup title | No. of studies | No. of participants | Statistical method | Effect size |
| 1 Pain (scale unknown) with mvt change from baseline Show forest plot | 1 | 40 | Mean Difference (IV, Random, 95% CI) | ‐0.10 [‐1.31, 1.11] |
| 2 Participants (n) reported adverse events Show forest plot | 1 | 40 | Risk Ratio (M‐H, Random, 95% CI) | 1.5 [0.28, 8.04] |
| Outcome or subgroup title | No. of studies | No. of participants | Statistical method | Effect size |
| 1 WOMAC‐VAS (Pain) Show forest plot | 1 | 37 | Mean Difference (IV, Random, 95% CI) | ‐142.0 [‐199.55, ‐84.45] |
| 2 WOMAC‐VAS (Function) Show forest plot | 1 | 37 | Mean Difference (IV, Random, 95% CI) | ‐529.0 [‐741.59, ‐316.41] |
| 3 Participants (n) reported adverse events Show forest plot | 2 | 137 | Risk Ratio (M‐H, Random, 95% CI) | 0.40 [0.08, 1.97] |
| Outcome or subgroup title | No. of studies | No. of participants | Statistical method | Effect size |
| 1 WOMAC 0‐4 (Pain) Show forest plot | 1 | 156 | Mean Difference (IV, Random, 95% CI) | ‐7.50 [‐8.43, ‐6.57] |
| 2 WOMAC 0‐4 (Function) Show forest plot | 1 | 156 | Mean Difference (IV, Random, 95% CI) | ‐29.3 [‐30.99, ‐27.61] |
| Outcome or subgroup title | No. of studies | No. of participants | Statistical method | Effect size |
| 1 Participants (n) reported adverse events Show forest plot | 1 | 100 | Risk Ratio (M‐H, Random, 95% CI) | 0.04 [0.00, 0.66] |
| Outcome or subgroup title | No. of studies | No. of participants | Statistical method | Effect size |
| 1 Relief of pain (0 to 4) at 3 months Show forest plot | 1 | 97 | Mean Difference (IV, Random, 95% CI) | 0.43 [‐0.12, 0.98] |
| 2 WOMAC‐VAS (Pain) Show forest plot | 1 | 94 | Mean Difference (IV, Random, 95% CI) | ‐2.5 [‐10.20, 5.20] |
| 3 WOMAC‐VAS (Function) Show forest plot | 1 | 94 | Mean Difference (IV, Random, 95% CI) | ‐1.20 [‐8.98, 6.58] |
| 4 Participants (n) reported adverse events Show forest plot | 2 | 194 | Risk Ratio (M‐H, Random, 95% CI) | 1.67 [0.63, 4.43] |
| Outcome or subgroup title | No. of studies | No. of participants | Statistical method | Effect size |
| 1 Pain VAS 0‐100 at 14 days Show forest plot | 1 | 68 | Mean Difference (IV, Random, 95% CI) | 0.0 [0.0, 0.0] |
| 2 Function VAS 0‐100 at 14 days Show forest plot | 1 | 68 | Mean Difference (IV, Random, 95% CI) | 0.0 [0.0, 0.0] |
| 3 Participants (n) reported adverse events Show forest plot | 1 | 84 | Risk Ratio (M‐H, Random, 95% CI) | 0.91 [0.57, 1.43] |
| Outcome or subgroup title | No. of studies | No. of participants | Statistical method | Effect size |
| 1 WOMAC‐VAS (Pain) Show forest plot | 1 | Mean Difference (IV, Random, 95% CI) | Subtotals only | |
| 1.1 At 14 days | 1 | 86 | Mean Difference (IV, Random, 95% CI) | 0.0 [0.0, 0.0] |
| 1.2 At 42 days | 1 | 86 | Mean Difference (IV, Random, 95% CI) | 15.0 [5.91, 24.09] |
| 2 WOMAC‐VAS (Function) Show forest plot | 1 | Mean Difference (IV, Random, 95% CI) | Subtotals only | |
| 2.1 At 14 days | 1 | 86 | Mean Difference (IV, Random, 95% CI) | 0.0 [0.0, 0.0] |
| 2.2 At 42 days | 1 | 86 | Mean Difference (IV, Random, 95% CI) | 12.0 [2.70, 21.30] |
| 3 Participants (n) reported adverse events Show forest plot | 1 | 86 | Risk Ratio (M‐H, Random, 95% CI) | 0.63 [0.43, 0.93] |
| Outcome or subgroup title | No. of studies | No. of participants | Statistical method | Effect size |
| 1 Pain VAS 0‐100 (night) Show forest plot | 1 | 45 | Mean Difference (IV, Random, 95% CI) | ‐11.10 [‐26.44, 4.24] |
| 2 Participants (n) reported adverse events Show forest plot | 1 | 45 | Risk Ratio (M‐H, Random, 95% CI) | 1.67 [0.54, 5.17] |
| Outcome or subgroup title | No. of studies | No. of participants | Statistical method | Effect size |
| 1 Pain VAS 0‐100 (movement) Show forest plot | 1 | 24 | Mean Difference (IV, Random, 95% CI) | ‐9.0 [‐31.12, 13.12] |
| 2 Function (handicap) VAS 0‐100 Show forest plot | 1 | 24 | Mean Difference (IV, Random, 95% CI) | ‐6.0 [‐27.25, 15.25] |
| 3 Participants (n) reported adverse events Show forest plot | 1 | 24 | Risk Ratio (M‐H, Random, 95% CI) | 3.5 [0.16, 78.19] |
| Outcome or subgroup title | No. of studies | No. of participants | Statistical method | Effect size |
| 1 Function: pain free walking time (minutes) Show forest plot | 1 | Mean Difference (IV, Random, 95% CI) | Totals not selected | |
| 1.1 At 1 month | 1 | Mean Difference (IV, Random, 95% CI) | 0.0 [0.0, 0.0] | |
| 1.2 At 2 months | 1 | Mean Difference (IV, Random, 95% CI) | 0.0 [0.0, 0.0] | |
| 1.3 At 3 months | 1 | Mean Difference (IV, Random, 95% CI) | 0.0 [0.0, 0.0] | |
| Outcome or subgroup title | No. of studies | No. of participants | Statistical method | Effect size |
| 1 Pain VAS 0‐100 Show forest plot | 4 | 651 | Mean Difference (IV, Random, 95% CI) | ‐8.47 [‐15.90, ‐1.04] |
| 1.1 At 3 months | 2 | 326 | Mean Difference (IV, Random, 95% CI) | ‐11.90 [‐23.95, 0.15] |
| 1.2 At 6 months | 1 | 162 | Mean Difference (IV, Random, 95% CI) | ‐10.40 [‐17.20, ‐3.60] |
| 1.3 At 12 months | 1 | 163 | Mean Difference (IV, Random, 95% CI) | 1.0 [‐6.58, 8.58] |
| 2 Pain VAS 0‐100 change from baseline at 36 months Show forest plot | 1 | 345 | Mean Difference (IV, Random, 95% CI) | ‐0.66 [‐7.39, 6.07] |
| 3 Pain VAS 0‐100 grouped by joint Show forest plot | 1 | 324 | Mean Difference (IV, Random, 95% CI) | ‐9.06 [‐15.24, ‐2.88] |
| 3.1 VAS (hip OA) | 1 | 162 | Mean Difference (IV, Random, 95% CI) | ‐13.80 [‐25.22, ‐2.38] |
| 3.2 VAS (knee OA) | 1 | 162 | Mean Difference (IV, Random, 95% CI) | ‐7.10 [‐14.45, 0.25] |
| 4 Function: disability VAS 0‐100 Show forest plot | 1 | Mean Difference (IV, Random, 95% CI) | Totals not selected | |
| 5 WOMAC‐VAS (Function) change from baseline at 36 months Show forest plot | 1 | 345 | Mean Difference (IV, Random, 95% CI) | ‐1.0 [‐7.14, 5.14] |
| 6 Lequesne algofunctional index Show forest plot | 3 | 480 | Mean Difference (IV, Random, 95% CI) | ‐1.17 [‐2.54, 0.20] |
| 6.1 At 3 months | 2 | 317 | Mean Difference (IV, Random, 95% CI) | ‐1.80 [‐2.68, ‐0.92] |
| 6.2 At 12 months | 1 | 163 | Mean Difference (IV, Random, 95% CI) | 0.10 [‐0.78, 0.98] |
| 7 Function (various tools) Show forest plot | 4 | 642 | Std. Mean Difference (IV, Random, 95% CI) | ‐0.42 [‐0.73, ‐0.11] |
| 8 Participants (n) reported adverse events Show forest plot | 5 | 1050 | Risk Ratio (M‐H, Random, 95% CI) | 1.04 [0.97, 1.12] |
| 9 Participants (n) withdrew due to adverse events Show forest plot | 1 | 398 | Risk Ratio (M‐H, Random, 95% CI) | 1.14 [0.73, 1.80] |
| 10 Particpants (n) reported serious adverse events Show forest plot | 1 | 398 | Risk Ratio (M‐H, Random, 95% CI) | 1.22 [0.94, 1.59] |
| 11 JSW change from baseline Show forest plot | 2 | 453 | Mean Difference (IV, Random, 95% CI) | ‐0.12 [‐0.43, 0.19] |
| 11.1 < median group, at 24 months | 1 | 55 | Mean Difference (IV, Random, 95% CI) | ‐0.43 [‐0.73, ‐0.13] |
| 11.2 > median group, at 24 months | 1 | 53 | Mean Difference (IV, Random, 95% CI) | 0.16 [‐0.31, 0.63] |
| 11.3 At 36 months | 1 | 345 | Mean Difference (IV, Random, 95% CI) | ‐0.03 [‐0.22, 0.16] |
| Outcome or subgroup title | No. of studies | No. of participants | Statistical method | Effect size |
| 1 Pain VAS 0‐100 Show forest plot | 1 | 156 | Mean Difference (IV, Random, 95% CI) | ‐14.2 [‐20.82, ‐7.58] |
| 2 Lequesne algofunctional index Show forest plot | 1 | 156 | Mean Difference (IV, Random, 95% CI) | ‐1.30 [‐2.38, ‐0.22] |
| 3 Participants (n) reported adverse events Show forest plot | 1 | 174 | Risk Ratio (M‐H, Random, 95% CI) | 1.07 [0.66, 1.74] |
| Outcome or subgroup title | No. of studies | No. of participants | Statistical method | Effect size |
| 1 WOMAC‐VAS (Pain) Show forest plot | 1 | Mean Difference (IV, Random, 95% CI) | Totals not selected | |
| 2 WOMAC‐VAS (Function) Show forest plot | 1 | Mean Difference (IV, Random, 95% CI) | Totals not selected | |
| 3 Participants (n) reported adverse events Show forest plot | 1 | 357 | Risk Ratio (M‐H, Random, 95% CI) | 0.86 [0.59, 1.26] |
| 4 Paricipants (n) reported serious adverse events Show forest plot | 1 | 357 | Risk Ratio (M‐H, Random, 95% CI) | 2.92 [0.31, 27.78] |
| Outcome or subgroup title | No. of studies | No. of participants | Statistical method | Effect size |
| 1 Lequesne algofunctional index Show forest plot | 1 | 45 | Mean Difference (IV, Random, 95% CI) | ‐3.82 [‐7.05, ‐0.59] |
| 1.1 Normal BMI participants | 1 | 18 | Mean Difference (IV, Random, 95% CI) | ‐2.2 [‐3.37, ‐1.03] |
| 1.2 Overweight BMI participants | 1 | 27 | Mean Difference (IV, Random, 95% CI) | ‐5.50 [‐6.95, ‐4.05] |
| Outcome or subgroup title | No. of studies | No. of participants | Statistical method | Effect size |
| 1 Participants (n) reported adverse events Show forest plot | 1 | 95 | Risk Ratio (M‐H, Random, 95% CI) | 0.77 [0.18, 3.24] |
| Outcome or subgroup title | No. of studies | No. of participants | Statistical method | Effect size |
| 1 Pain immediately after walking 50 feet VAS 0‐100 Show forest plot | 1 | 247 | Mean Difference (IV, Random, 95% CI) | ‐9.60 [‐16.81, ‐2.39] |
| 2 WOMAC‐VAS (Function) Show forest plot | 1 | Mean Difference (IV, Random, 95% CI) | Totals not selected | |
| 3 Participants (n) reported adverse events Show forest plot | 1 | Risk Ratio (M‐H, Random, 95% CI) | Totals not selected | |
| Outcome or subgroup title | No. of studies | No. of participants | Statistical method | Effect size |
| 1 Pain VAS 0‐100 change from baseline Show forest plot | 1 | Mean Difference (IV, Random, 95% CI) | Subtotals only | |
| 1.1 Low dose (600mg) SKI306X | 1 | 47 | Mean Difference (IV, Random, 95% CI) | ‐16.1 [‐25.19, ‐7.01] |
| 1.2 Medium dose (1200mg) SKI306X | 1 | 46 | Mean Difference (IV, Random, 95% CI) | ‐14.5 [‐23.04, ‐5.96] |
| 1.3 High dose (1800mg) SKI306X | 1 | 46 | Mean Difference (IV, Random, 95% CI) | ‐22.3 [‐31.82, ‐12.78] |
| 2 Lequesne algofunctional index change from baseline Show forest plot | 1 | 139 | Mean Difference (IV, Random, 95% CI) | ‐2.73 [‐3.71, ‐1.74] |
| 2.1 Low dose (600mg) SKI306X | 1 | 47 | Mean Difference (IV, Random, 95% CI) | ‐2.40 [‐4.05, ‐0.75] |
| 2.2 Medium dose (1200mg) SKI306X | 1 | 46 | Mean Difference (IV, Random, 95% CI) | ‐2.8 [‐4.62, ‐0.98] |
| 2.3 High dose (1800mg) SKI306X | 1 | 46 | Mean Difference (IV, Random, 95% CI) | ‐3.0 [‐4.68, ‐1.32] |
| 3 Participants (n) reported adverse events Show forest plot | 2 | 139 | Risk Ratio (M‐H, Random, 95% CI) | 0.93 [0.49, 1.79] |
| 3.1 Low dose (600mg) SKI306X | 1 | 47 | Risk Ratio (M‐H, Random, 95% CI) | 0.96 [0.32, 2.88] |
| 3.2 Medium dose (1200mg) SKI306X | 1 | 46 | Risk Ratio (M‐H, Random, 95% CI) | 1.2 [0.43, 3.38] |
| 3.3 High dose (1800mmg) SKI306X | 1 | 46 | Risk Ratio (M‐H, Random, 95% CI) | 0.6 [0.16, 2.22] |
| Outcome or subgroup title | No. of studies | No. of participants | Statistical method | Effect size |
| 1 Pain VAS 0‐100 change from baseline Show forest plot | 1 | 249 | Mean Difference (IV, Random, 95% CI) | 1.31 [‐2.78, 5.40] |
| 2 Lequesne algofunctional index change from baseline Show forest plot | 1 | 249 | Mean Difference (IV, Random, 95% CI) | 0.77 [0.10, 1.44] |
| 3 Participants (n) reported adverse events Show forest plot | 1 | 249 | Risk Ratio (M‐H, Random, 95% CI) | 0.61 [0.38, 0.97] |
| Outcome or subgroup title | No. of studies | No. of participants | Statistical method | Effect size |
| 1 Enduring pain (0 to 3) Show forest plot | 1 | 72 | Mean Difference (IV, Random, 95% CI) | 0.0 [0.0, 0.0] |
| 2 Function: mobility limitations (0 to 3) Show forest plot | 1 | 72 | Mean Difference (IV, Random, 95% CI) | 0.0 [0.0, 0.0] |
| 3 Participants (n) reported adverse events Show forest plot | 3 | 140 | Risk Ratio (M‐H, Random, 95% CI) | 0.33 [0.01, 7.92] |
| Outcome or subgroup title | No. of studies | No. of participants | Statistical method | Effect size |
| 1 AIMS2 arthritis pain score change from baseline Show forest plot | 1 | 52 | Mean Difference (IV, Random, 95% CI) | ‐0.89 [‐1.73, ‐0.05] |
| 2 Participants (n) reported adverse events Show forest plot | 1 | 52 | Risk Ratio (M‐H, Random, 95% CI) | 1.08 [0.40, 2.91] |
| Outcome or subgroup title | No. of studies | No. of participants | Statistical method | Effect size |
| 1 Pain VAS 0‐100 (total) Show forest plot | 1 | 200 | Mean Difference (IV, Random, 95% CI) | 11.81 [‐9.67, 33.29] |
| 2 Lequesne algofunctional index Show forest plot | 1 | 200 | Mean Difference (IV, Random, 95% CI) | 0.28 [‐0.89, 1.45] |
| 3 Participants (n) reported adverse events Show forest plot | 1 | 200 | Risk Ratio (M‐H, Random, 95% CI) | 1.04 [0.66, 1.63] |
| Outcome or subgroup title | No. of studies | No. of participants | Statistical method | Effect size |
| 1 Pain VAS 0‐100 (walking) Show forest plot | 1 | 60 | Mean Difference (IV, Random, 95% CI) | 2.0 [‐7.12, 11.12] |
| 2 WOMAC‐VAS (Function) Show forest plot | 1 | 60 | Mean Difference (IV, Random, 95% CI) | ‐2.0 [‐7.57, 3.57] |
| 3 Participants (n) reported adverse events Show forest plot | 1 | 60 | Risk Ratio (M‐H, Random, 95% CI) | 9.00 [0.51, 160.17] |
| Outcome or subgroup title | No. of studies | No. of participants | Statistical method | Effect size |
| 1 Pain VAS 0‐100 (walking) Show forest plot | 1 | 60 | Mean Difference (IV, Random, 95% CI) | ‐2.0 [‐6.81, 2.81] |
| 2 WOMAC‐VAS (Function) Show forest plot | 1 | 60 | Mean Difference (IV, Random, 95% CI) | 0.0 [‐2.53, 2.53] |
| 3 Participants (n) reported adverse events Show forest plot | 1 | 60 | Risk Ratio (M‐H, Random, 95% CI) | 9.00 [0.51, 160.17] |
| Outcome or subgroup title | No. of studies | No. of participants | Statistical method | Effect size |
| 1 Adverse event episodes (n) reported Show forest plot | 1 | 454 | Risk Ratio (M‐H, Random, 95% CI) | 0.95 [0.71, 1.28] |
| 1.1 Formula A versus placebo | 1 | 90 | Risk Ratio (M‐H, Random, 95% CI) | 0.96 [0.63, 1.45] |
| 1.2 Formula B versus placebo | 1 | 108 | Risk Ratio (M‐H, Random, 95% CI) | 1.35 [0.92, 1.98] |
| 1.3 Formula C versus placebo | 1 | 82 | Risk Ratio (M‐H, Random, 95% CI) | 0.78 [0.50, 1.21] |
| 1.4 Formula D versus placebo | 1 | 72 | Risk Ratio (M‐H, Random, 95% CI) | 0.57 [0.34, 0.93] |
| 1.5 Formula E versus placebo | 1 | 102 | Risk Ratio (M‐H, Random, 95% CI) | 1.22 [0.82, 1.80] |
| Outcome or subgroup title | No. of studies | No. of participants | Statistical method | Effect size |
| 1 Pain VAS 0‐100 Show forest plot | 1 | 88 | Mean Difference (IV, Random, 95% CI) | ‐1.0 [‐9.79, 7.79] |
| Outcome or subgroup title | No. of studies | No. of participants | Statistical method | Effect size |
| 1 Pain VAS 0‐100 Show forest plot | 1 | 90 | Mean Difference (IV, Random, 95% CI) | ‐1.03 [‐1.18, ‐0.88] |
| 2 WOMAC 0‐4 (Function) Show forest plot | 1 | 90 | Mean Difference (IV, Random, 95% CI) | ‐5.80 [‐6.72, ‐4.88] |
| 3 Participants (n) reported adverse events Show forest plot | 1 | 90 | Risk Ratio (M‐H, Random, 95% CI) | 1.05 [0.69, 1.58] |
| Outcome or subgroup title | No. of studies | No. of participants | Statistical method | Effect size |
| 1 Pain VAS 0‐100 change from baseline Show forest plot | 1 | 220 | Mean Difference (IV, Random, 95% CI) | 3.0 [‐3.28, 9.28] |
| 2 WOMAC 0‐4 (Function) change from baseline Show forest plot | 1 | 220 | Mean Difference (IV, Random, 95% CI) | 2.0 [‐0.72, 4.72] |
| 3 Participants (n) reported adverse events Show forest plot | 1 | 210 | Odds Ratio (M‐H, Random, 95% CI) | 1.04 [0.58, 1.86] |
| Outcome or subgroup title | No. of studies | No. of participants | Statistical method | Effect size |
| 1 Pain VAS 0‐100 change from baseline Show forest plot | 1 | 220 | Mean Difference (IV, Random, 95% CI) | ‐3.0 [‐8.98, 2.98] |
| 2 WOMAC 0‐4 (Function) change from baseline Show forest plot | 1 | 220 | Mean Difference (IV, Random, 95% CI) | 1.0 [‐1.60, 3.60] |
| 3 Participants (n) reported adverse events Show forest plot | 1 | 207 | Odds Ratio (M‐H, Random, 95% CI) | 1.00 [0.56, 1.79] |
| Outcome or subgroup title | No. of studies | No. of participants | Statistical method | Effect size |
| 1 Pain VAS 0‐100 change from baseline Show forest plot | 1 | 220 | Mean Difference (IV, Random, 95% CI) | 4.0 [‐1.42, 9.42] |
| 2 WOMAC 0‐4 (Function) change from baseline Show forest plot | 1 | 220 | Mean Difference (IV, Random, 95% CI) | 1.38 [‐1.40, 4.16] |
| 3 Participants (n) reported adverse events Show forest plot | 1 | 211 | Odds Ratio (M‐H, Random, 95% CI) | 0.85 [0.47, 1.54] |
| Outcome or subgroup title | No. of studies | No. of participants | Statistical method | Effect size |
| 1 Pain VAS 0‐100 change from baseline Show forest plot | 1 | 220 | Mean Difference (IV, Random, 95% CI) | ‐2.0 [‐7.42, 3.42] |
| 2 WOMAC 0‐4 (Function) change from baseline Show forest plot | 1 | 220 | Mean Difference (IV, Random, 95% CI) | 0.19 [‐2.59, 2.97] |
| 3 Participants (n) reported adverse events Show forest plot | 1 | 208 | Odds Ratio (M‐H, Random, 95% CI) | 0.82 [0.45, 1.48] |
| Outcome or subgroup title | No. of studies | No. of participants | Statistical method | Effect size |
| 1 Pain: Knee Society Rating System 0‐100 (knee) Show forest plot | 1 | 47 | Mean Difference (IV, Random, 95% CI) | ‐1.30 [‐8.90, 6.30] |
| 2 Function: Knee Society Rating System 0‐50 (stairs) Show forest plot | 1 | 47 | Mean Difference (IV, Random, 95% CI) | 3.60 [0.51, 6.69] |
| 3 Participants (n) reported adverse events Show forest plot | 1 | 47 | Risk Ratio (M‐H, Random, 95% CI) | 2.88 [0.12, 67.29] |