| Study ID | EXP ‐ treadmill | EXP ‐ support | EXP ‐ duration | EXP ‐ frequency | EXP ‐ N weeks | CTL ‐ intervent. | CTL ‐ duration | CTL ‐ frequency | CTL ‐ N weeks |
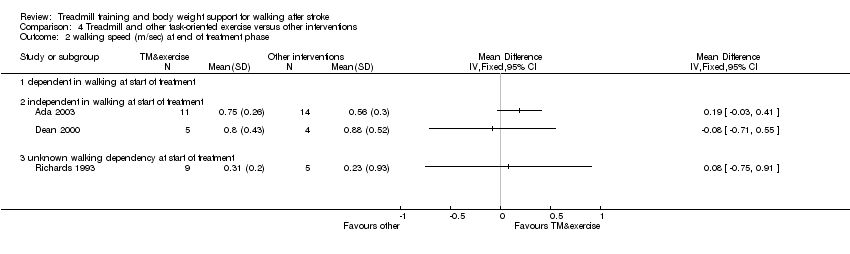
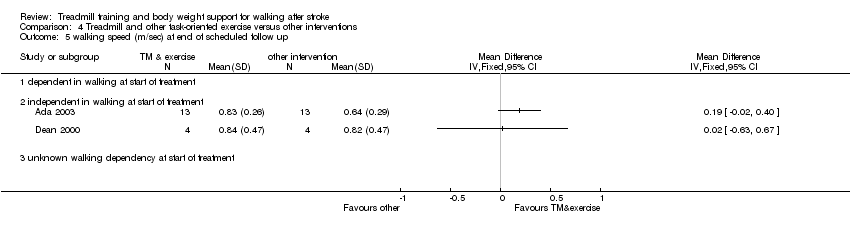
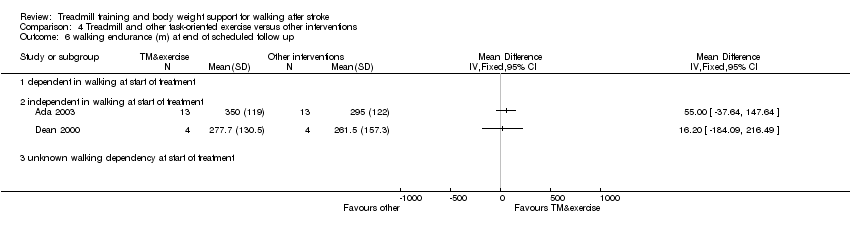
| Ada 2003 | Gradually increased on an individual basis starting from 0.7 m/sec at the start of the first session and finishing at 1.1 m/sec at the end of the last session, on average | BWS ‐ no;
HAND SUPPORT ‐ yes, use of hand rails if required;
ASSISTANCE FROM THERAPIST ‐ only if required, 2 subjects needed slight help with stepping through for the first 2 weeks | 30 minutes (24, 21, 18 and 15 minutes in treadmill training in the first, second, third and fourth training weeks, respectively) | 3 times per week | 4 weeks | Sham (task orientated home program with an intensity insufficient to produce an effect, plus telephone follow up once each week) | 30 minutes | 3 times per week (plus encouraged to walk every day) | 4 weeks |
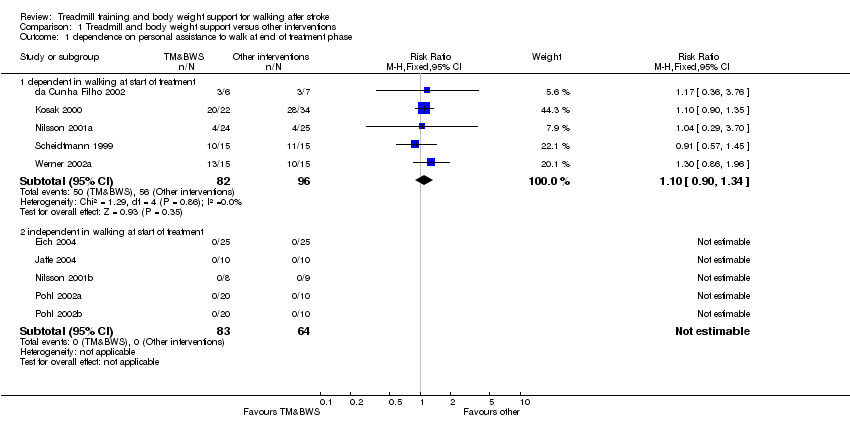
| da Cunha Filho 2002 | Gradually increased in increments of 0.01 m/sec, starting at 0.01 m/sec | BWS ‐ yes, starting at 30% body weight and progressively decreased to 0%;
HAND SUPPORT ‐ not reported;
ASSISTANCE FROM THERAPIST ‐ not reported | 20 minutes | 5 times per week | 2 to 3 weeks | Task orientated gait training | 20 minutes | 5 times per week | 2 to 3 weeks |
| Dean 2000 | Gradually increased on an individual basis | BWS ‐ no;
HAND SUPPORT ‐ not reported;
ASSISTANCE FROM THERAPIST ‐ not reported | 60 minutes (5 minutes in treadmill training) | 3 times per week | 4 weeks | Sham (task oriented upper limb training) | 60 minutes | 3 times per week | 4 weeks |
| Eich 2004 | Speed and inclination increased on an individual basis to achieve a training heart rate.
Mean speed increased from 0.35 m/sec (SD 0.11) in week 1 to 0.64 m/sec (SD 0.15) in week 6.
In week 1 only 1/25 participants had an inclination of 4 degrees, this increased to 25/25 participants in week 6 with a mean inclination of 6.2 degrees | BWS ‐ yes, the harness was always secured and body weight was minimally supported (0 to 15%) according to participant need;
HAND SUPPORT ‐ not reported;
ASSISTANCE FROM THERAPIST ‐ yes, to set the paretic leg, weight shift and hip extension if required | 30 minutes | 5 times per week | 6 weeks | Non‐task orientated (neurophysiological) | 30 minutes | 5 times per week | 6 weeks |
| Jaffe 2004 | Comfortable walking speed (speed not reported), speed was not progressed | BWS ‐ yes, harness used to prevent falls only;
HAND SUPPORT ‐ yes, use of hand rails if required;
ASSISTANCE FROM THERAPIST ‐ no | 60 minutes | 3 times per week | 2 weeks | Task orientated (overground obstacle training) | 60 minutes | 3 times per week | 2 weeks |
| Kosak 2000 | Gradually increased from 0.22 to 0.89 m/sec, as tolerated | BWS ‐ yes, starting at 30% body weight and progressively decreased to 0% or eliminated;
HAND SUPPORT ‐ yes, use of hand rails if required;
ASSISTANCE FROM THERAPIST ‐ yes, assisted with swing phase, foot placement and weight shift if required | 45 minutes | 5 times per week | 2 to 3 weeks | Non‐task orientated (orthopaedic) | 45 minutes | 5 times per week | 2 to 3 weeks |
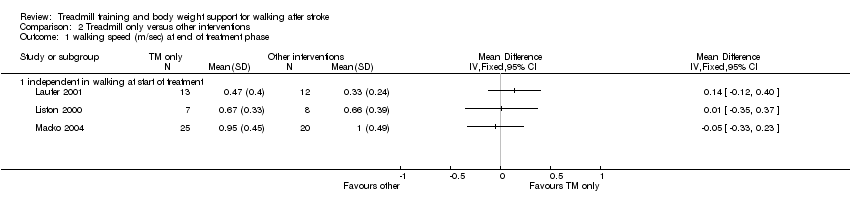
| Laufer 2001 | Comfortable walking speed, speed used and progression not reported | BWS ‐ no;
HAND SUPPORT ‐ yes, use of hand rails if required;
ASSISTANCE FROM THERAPIST ‐ yes, assisted with swing phase and trunk alignment | 8 to 20 minutes | 5 times per week | 3 weeks | Task orientated | 8 to 20 minutes | 5 times per week | 3 weeks |
| Liston 2000 | Speed used and progression not reported | BWS ‐ no;
HAND SUPPORT ‐ not reported;
ASSISTANCE FROM THERAPIST ‐ not reported | 60 minutes | 3 times per week | 4 weeks | Task orientated | 60 minutes | 3 times per week | 4 weeks |
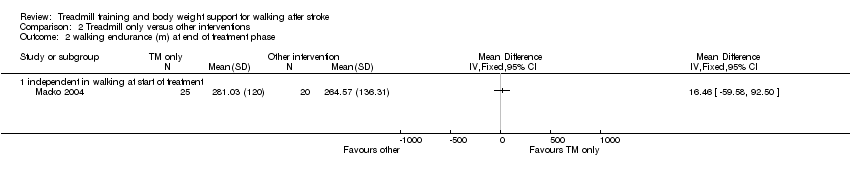
| Macko 2004 | Increased from a mean of 0.48 (SE 0.30) m/sec at baseline to 0.75 (SE 0.30) m/sec at treatment end on an individual basis to achieve a target aerobic intensity of 60‐70% heart rate reserve (treadmill slope increased from 0% at baseline to 2.2% (SE 2.2) at treatment end) | BWS ‐ no;
HAND SUPPORT ‐ yes, use of handrails if required;
ASSISTANCE FROM THERAPIST ‐ not reported | 40 minutes (including 5 minutes warm up and 5 minutes cool down)
increased duration at target intensity from a mean of 12 (SE 6) minutes at baseline to 31 (SE 10) minutes at treatment end | 3 times per week | 6 months | Task orientated | 40 minutes | 3 times per week | 6 months |
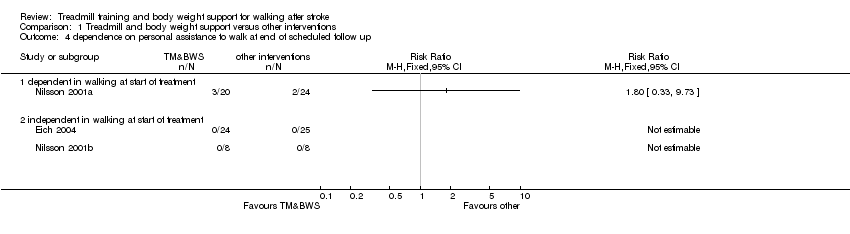
| Nilsson 2001 | Gradually increased from 0.0 to 2.0 m/sec on an individual basis | BWS ‐ yes, starting at 100% body weight and decreased to 0%;
HAND SUPPORT ‐ yes, use of a cross bar if required;
ASSISTANCE FROM THERAPIST ‐ yes, assisted with swing phase, hip and knee extension during stance phase, and weight shift if required | 30 minutes | 5 times per week | 9 to 10 weeks | Task orientated | 30 minutes | 5 times per week | 9 to 10 weeks |
| Pohl 2002 | Speed dependent treadmill training (EXP 1) ‐ aggressive increase in speed starting from the highest speed the participant could walk at without stumbling and increasing at 10% increments of this speed several times within a session. The average treadmill speed increased from 0.68 m/sec (SD 0.34) at the start of training to 2.05 m/sec (SD 0.71) at the end of training;
limited progressive treadmill training (EXP 2) ‐ gradually increased in increments of 5% of the initial maximum walking speed each week. The average treadmill speed increased from 0.66 m/sec (SD 0.39) at the start of training to 0.79 m/sec (SD 0.47) at the end of training | Speed dependent treadmill training:
BWS ‐ yes, no more than 10% body weight for the first 3 training sessions only (participants always wore an unweighted harness);
HAND SUPPORT ‐ not reported;
ASSISTANCE FROM THERAPIST ‐ no
Limited progressive treadmill training:
BWS ‐ yes, no more than 10% body weight for the first 3 training sessions only;
HAND SUPPORT ‐ not reported;
ASSISTANCE FROM THERAPIST ‐ yes, assisted with the walking cycle | 30 minutes | 3 times per week | 4 weeks | Non‐task orientated (neurophysiological) | 45 minutes | 3 times per week | 4 weeks |
| Richards 1993 | Speed used and progression not reported | BWS ‐ no;
HAND SUPPORT ‐ not reported;
ASSISTANCE FROM THERAPIST ‐ not reported | 105 minutes (about 35 minutes in TM training) | 5 times per week | 5 weeks | Non‐task orientated (neurophysiological) | 105 minutes | 5 times per week | 5 weeks |
| Scheidtmann 1999 | Gradually increased from 0.0 to 1.3 m/sec | BWS ‐ yes, amount of body weight support and progression not reported;
HAND SUPPORT ‐ yes, use of hand rails if required;
ASSISTANCE FROM THERAPIST ‐ yes, assisted with swing phase, foot placement, hip and knee extension during stance phase, and weight shift if required | 30 minutes | 5 times per week | 3 weeks | Non‐task orientated (neurophysiological) | 30 minutes | 5 times per week | 3 weeks |
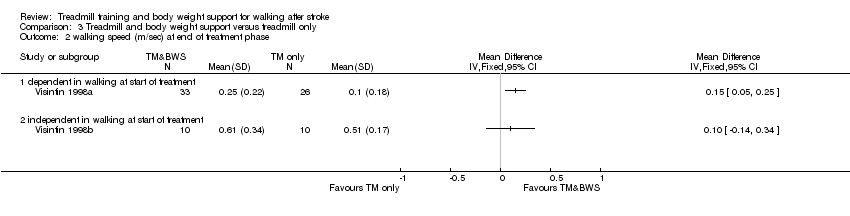
| Visintin 1998 | Gradually increased in increments of 0.04 m/sec, from 0.23 to 0.42 m/sec, on average, on an individual basis | BWS ‐ yes, starting at 40% body weight and progressively decreased to 0%;
HAND SUPPORT ‐ yes, use of hand rails if required;
ASSISTANCE FROM THERAPIST ‐ yes, assisted with stepping and limb control during stance and swing phases, and weight shift if required | 20 minutes | 4 times per week | 6 weeks | Task orientated (treadmill only)
‐ gradually increased speed from 0.19 to 0.34 m/sec, on average, on an individual basis | 20 minutes | 4 times per week | 6 weeks |
| Werner 2002a | Increased from a mean of 0.32 (SD 0.05) m/sec at baseline on an individual basis | BWS ‐ yes, starting at a mean of 8.93% (SD 1.84) body weight and progressively decreased;
HAND SUPPORT ‐ yes, use of handrails if required;
ASSISTANCE FROM THERAPIST ‐ yes, assisted with foot placement, swing phase, and hip and trunk extension during stance phase if required | 15‐20 minutes | 5 times per week | 2 weeks | Task orientated | 15‐20 minutes | 5 times per week | 2 weeks |