| Study | Any Comment re: AE | AE Occurred (y/n/nr) | Description | Dropout Pathologies | Pain | Medical Care | Deaths |
| Ades 1996 | No | | | None reported | | | |
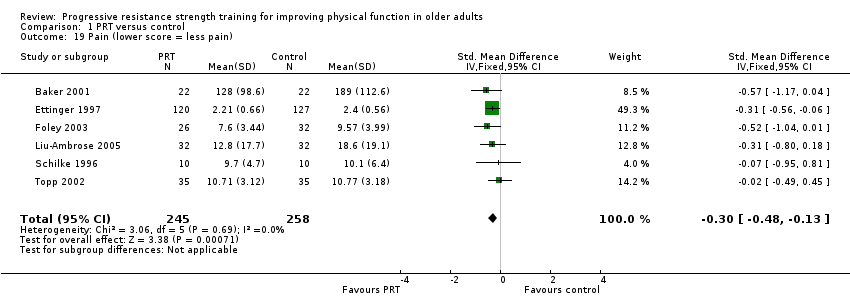
| Baker 2001 | Yes | No | NR | Yes, 2 in treatment group (neck arthritis, prior back injury), 2 in control (illness, psoriatic arthritis) | Treatment group decreased in WOMAC, SF‐36 BP no change | NR | |
| Balagopal 2001 | No | | | NR | | | |
| Ballor 1996 | No | | | NR | | | |
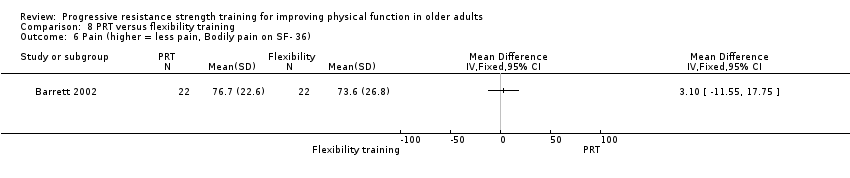
| Barrett 2002 | Yes | Yes | 2 in PRT group, aggravation of OA | 2 in PRT group, aggravation of OA | | | |
| Baum 2003 | Yes | Yes | | The number of illness was not reported. 13% of repeated measurements after baseline were missing because of death or patient inability to perform the test because of acute illness. | | | 1 in the PRT group |
| Bean 2004 | Yes | no | No significant adverse events occurred | | | | |
| Beneka 2005 | No | NR | | | | | |
| Bermon 1999 | No | | | No | | | |
| Boshuizen 2005 | Yes | yes | | 9 dropout due to illness of participant or partner | 4 reported pain during or after the exercise | | 1 in control |
| Brandon 2000 | No | | | | NR | NR | |
| Brandon 2003 | Yes | 8 members of exercise group had BP raised to over 200 mmHg systolic or 100 mmHg diastolic at some point during the exercises during 24 months; and had to stop exercising that day | | Participant's disease (diabetics) got worse; specific number was not reported | | | |
| Brochu 2002 | Yes | Yes | 2 experienced occasional significant exacerbation of arthritic conditions during the training. 1 experienced significant dizziness in a supine position. | Yes, 3 due to medical problems that are not related to the training | 2 individuals experienced occasional significant exacerbation of arthritic conditions during the training | NR | NR |
| Bruunsgaard 2004 | No | NR | | | | | |
| Buchner 1997 | Yes | Yes | 6 Injuries in strength training or in strength/endurance training group (not reported separately, n = 50) | Not described | no significant change in BP of SF‐36 | For all exercise groups (i.e. including endurance exercise groups): stable outpatient visits in exercise group/ control increased, no difference in hospitalisation rates | |
| Casaburi 2004 | Yes | No | | 5 (group?)‐non protocol related health problems | NR | | |
| Castaneda 2001 | Yes | No | | No | | | |
| Castaneda 2004 | Yes | Yes | | The authors did not report the number and group of the dropouts. The statement is "reasons for early termination of the study included loss of greater than 20% of initial body weight, need for dialysis therapy or transplantation, development of a serious condition requiring hospitalization or precluding exercise and signs of malnutrition" | | | |
| Chandler 1998 | No | | | 9 drop‐outs due to illness, 1 due to increased hip pain, 1 refused further strength testing (not given by group) | NR | NR | |
| Charette 1991 | No | | | 1 discomfort after initial strength testing, 3 intercurrent illness not related to training | NR | NR | |
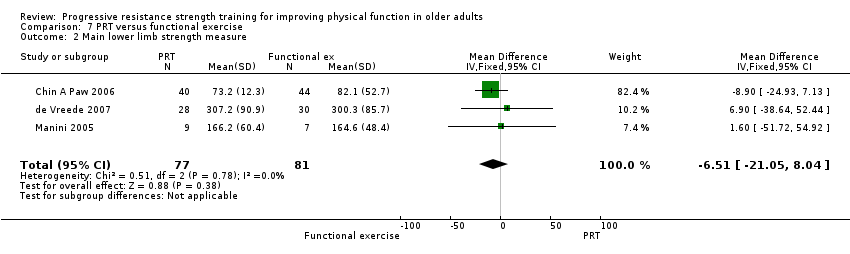
| Chin A Paw 2006 | Yes | Yes | None withdrew because of adverse effects | 9 illness in PRT; 9 illness in functional training group; 10 illness in combined training group; 6 illness in control group | | | 1 in PRT; 4 in functional training; 1 in combined training; 2 in control group |
| Collier 1997 | No | | | No | | | |
| Damush 1999 | No | | | 6 exercise drop‐outs due to illness | | | |
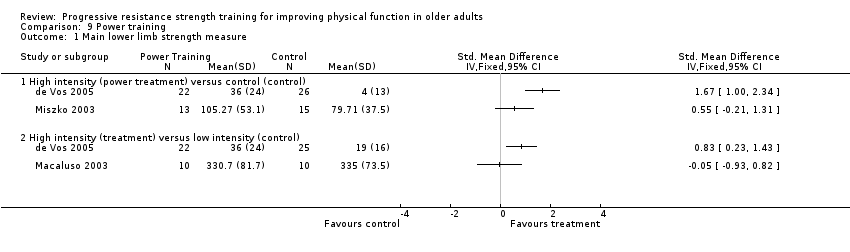
| de Vos 2005 | Yes | Yes | 20 AEs reported in 17 participants. 16 were related to strength testing and 4 were related to power training. 8 were in high intensity group, 7 in medium, 4 in low, and 1 in control. AEs included minor strains, tendonities, and exacerbation of osteoarthritis. | 4 (1 in each group) dropout‐joint pain
1 inguinal hernia in medium intensity group. 1 medical reason in low intensity group | Joint pain (see dropout pathologies) | | |
| de Vreede 2007 | Yes | Yes | PRT: 1 had muscle strained. 10 reported muscle pain, 5 osteoarthritic joint pain, 3 prosthetic joint pain, and 4 lower back pain | PRT group: 1 hip fracture, 1 pneumonia, & 1 eye operation. Control: 1 wrist fracture | PRT: 10 reported muscle pain, 5 osteoarthritic joint pain, 3 prosthetic joint pain, and 4 lower back pain | | |
| DeBeliso 2005 | Yes | no | no injuries occurred during the training | | | | |
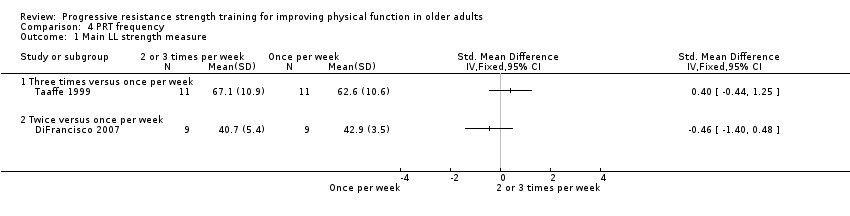
| DiFrancisco 2007 | Yes | No | Occasionally complaints of muscle soreness for 2 days after exercise, but it did not affect participants' daily routine or training | | | | |
| Donald 2000 | No | | | not clear | | | |
| Earles 2001 | Yes (a priori outcome) | Yes | 4 reported discomfort, 2 stopped program ‐ 1 due to back pain, 1 due to lumbar disc herniation, possibly due to study intervention | Yes | | | |
| Ettinger 1997 | Yes | Yes | PRT: 2 falls, one weight dropped on foot; Aerobic: 2 falls; Control: 1 sudden death (defined AE as death or injury requiring medical care) | NR | less for PRT group vs control | NR | NR |
| Fahlman 2002 | No | NR | | | | | |
| Fatouros 2002 | No | NR | | | | | |
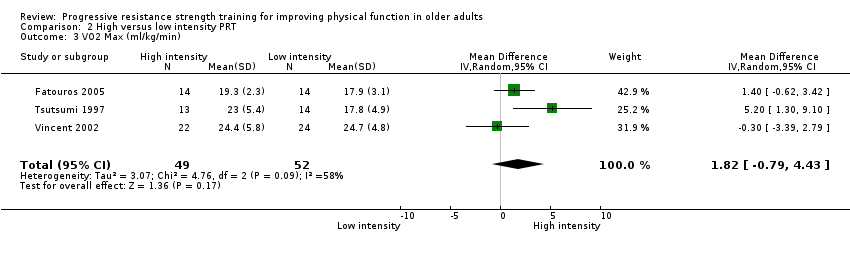
| Fatouros 2005 | Yes | Yes | | 3 men stopped within the 1st week due to injury | | | |
| Fiatarone 1997 | No | | | 1 exercise drop‐out due to increased musculoskeletal pain | NR | no difference in health care visits between groups | NR |
| Fiatarone 1994 | Yes | Yes | PRT: 2 reports of joint pain, program was altered No control info No cardiovascular events | 2 exercise drop outs, 1 due to musculoskeletal pain, 1 due to pneumonia | not measured | NR | 0 PRT and 1 control |
| Fielding 2002 | Yes | yes | see the dropout pathologies | 4 (2 in each group) discontinued secondary to exacerbation of preexist OA. 1 in the high velocity group withdrew secondary to recurrence of chronic plantar fasciicis | | | |
| Flynn 1999 | No | | | NR | NR | NR | NR |
| Foley 2003 | Yes | Yes | Gym‐based exercise group: 2 had increased pain and 1 had increased blood pressure. 1 ‐Dr. advised to cease program | Gym‐based exercise group: 2 with increased pain, 1 with unrelated surgery, 1 with increased blood pressure, and 1 had joint replacement surgery. Control group: 2 with joint replacement surgery and 1 with illness. | 2 reported increased pain the gym‐based exercise group. | | |
| Frontera 2003 | No | NR | | | | | |
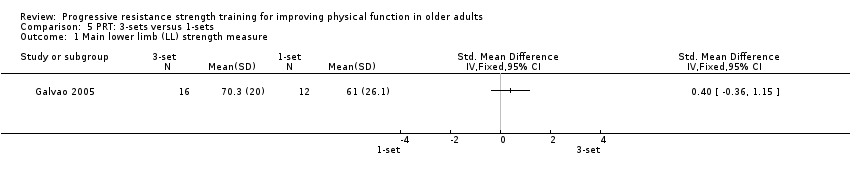
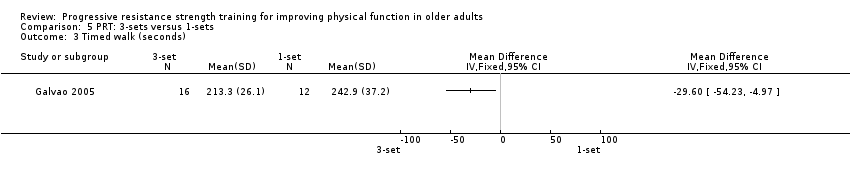
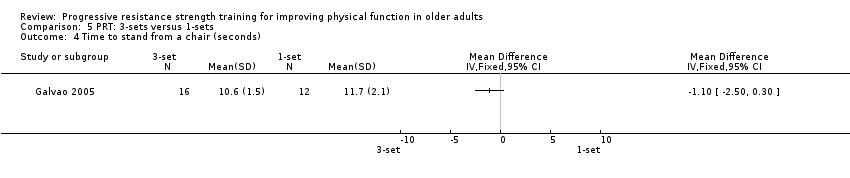
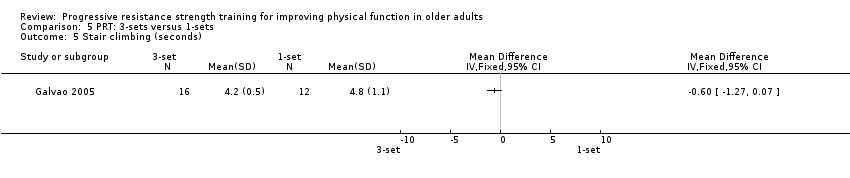
| Galvao 2005 | Yes | No | 1 in 1‐set group withdrew due to illness, 1 due to injury sustained during part‐time work, and 1 due to aggravation of a preexisting hip injury | | | | |
| Hagerman 2000 | No | | | 3 PRT and 1 control withdrew because of minor injuries or previous medical problems exacerbated by testing/training | "no complaints of excess or intolerable muscle soreness or fatigue" | NR | NR |
| Harris 2004 | Yes | No | | | | | |
| Haykowsky 2005 | Yes | Yes | | 1 in PRT withdrew because of shoulder discomfort and migraines. 1 in the combination training suffered a lower extremity injury not related to the study | | | |
| Haykowsky 2000 | Yes | No (completed without complications) | | NR | | | |
| Hennessey 2001 | No | | | NR | | | |
| Hepple 1997 | No | | | No | | | |
| Hiatt 1994 | No | | | No | | | |
| Hortobagyi 2001 | No (not identified as such) | Yes | Pain and bruising of shoulder from machine ‐ dropped out | Yes | Yes | NR | NR |
| Hruda 2003 | Yes | Yes? | | 5 (2 in the PRT group and 3 in the control group) dropped out due to health reasons | | | |
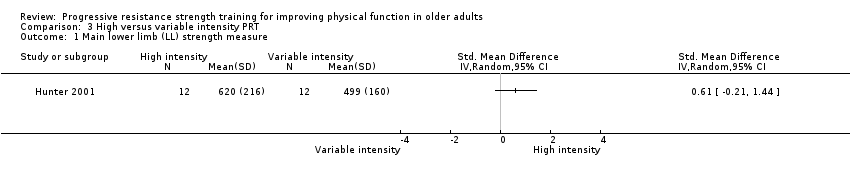
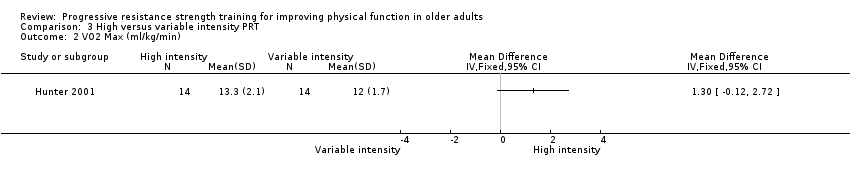
| Hunter 2001 | No | | | NR | | | |
| Izquierdo 2004 | No | NR | | | | | |
| Jette 1996 | No (not identified as such) | | | Yes ‐ 2 drop‐outs because of the exercises, 1 due to back pain, 1 due to shortness of breath during exercise, | | | |
| Jette 1999 | Yes | No | | Reasons not described | NR, but fatigue significantly worse in exercise group | NR | NR |
| Jones 1994 | Yes | No | | NR | | | |
| Jubrias 2001 | Yes | No | | NR | | | |
| Judge 1994 | Yes (a priori outcome of study) | Yes | 10/55 people in RT or combined balance and RT developed musculoskeletal complaints, (specific details given), only 1 complaint in balance group, no control report, no serious injuries in any group | NR | NR | | |
| Kalapotharakos 2005 | NR | NR | | | | | |
| Kallinen 2002 | Yes | Yes | 1‐PRT, died of myocardial infarction at 8 weeks; 1‐PRT, unstable angina at 4 weeks; 1 in PRT, began to have occasional angina and dyspnoea at 8 weeks; 1‐endurance, brainstem infarction at week 9, 1‐endurance, abnormal aortic aneurysm happened after the program | See the description | | | 1 in PRT, died of myocardial infarction |
| Katznelson 2006 | Yes | Yes | | 5 were due to events unrelated to study drug, including bruised ribs, need for knee replacement, angina prior to the baseline visit, nausea during the first week of the study, and excessive i e commitments. Another subject in the placebo arm withdrew because of depression. | | | |
| Kerr 2001 | No | | | Yes ‐ 3 in FITNESS group, including wrist and back injury | | | |
| Kongsgaard 2004 | No | NR | | | | | |
| Krebs 2007 | Yes | Yes | 1 in the PRT group sustained an unrelated fall halfway through the 6‐week intervention, resulting in injury of her dominate shoulder. Exercise was modified for her. | | | | |
| Lamoureux 2003 | No | NR | | | | | |
| Latham 2001 | Yes | No | | No | | | |
| Latham 2003 | Yes (a priori outcome) | Yes | 18 musculoskeletal adverse events in PRT group vs 5 in control group | No | | | 6 in PRT versus 8 in control |
| Liu‐Ambrose 2005 | Yes | Yes | 10 in PRT group and 2 in stretching control group had minor musculoskeletal complains but resolved or diminished within 3 weeks | Yes, 1 in PRT and 1 in control drop out due to illness | | | |
| Macaluso 2003 | Yes | Yes | 1 back pain and 1 spur on the heel | 1 back pain and 1 spur on the heel | 1 back pain | | |
| Madden 2006 | No | NR | | | | | |
| Maiorana 1997 | Yes (safety an aim of study) | Yes | In ex group: MI (before exercises began),1 vasovagal episode, 1 musculoskeletal pain. Control: 2 people stop testing because of aggravation of psoriatic arthritis(1) and atrial fibrilation (1) | Yes, as reported | NR | NR ‐ ischaemic symptoms/ECG changes during training | |
| Malliou 2003 | No | NR | | | | | |
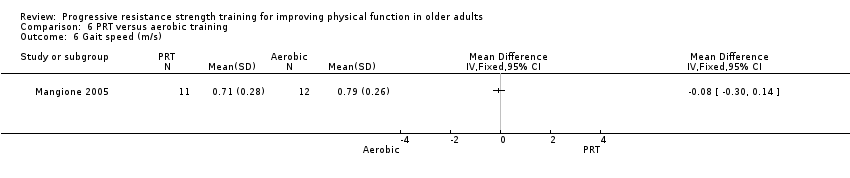
| Mangione 2005 | Yes | Yes | several participants reported muscle soreness or fatigue in the PRT group. 1 fell during post‐training examination, 4 in the PRT were hospitalized | in the PRT group, 1‐illness (progressive neuromuscular disorder), 4 were hospitalized. | 1 in aerobic training group was unable to perform exercise at recommended intensity level | | 2 (among those who were hospitalized) in the PRT group |
| Manini 2005 | Yes | Yes | 11 were excluded from the steadiness experiment because of discomfort from knee OA during the testing protocol. 14 dropout for a variety of medical personal reasons | 11 were excluded from the steadiness experiment because of discomfort from knee OA during the testing protocol. 14 others dropped out for a variety of medical and personal reasons. | | | |
| Maurer 1999 | Yes | No | | Yes, 4 drop‐outs due to increased pain "but neither subjects nor investigators attributed pain to the treatment" | WOMAC pain, 143.8 in PRT vs 167.1 control | NR | NR |
| McCartney 1995 | Yes | No | | 9 exercise drop‐outs due to "illness", 3 controls due to medical problems. Stated "no injuries as a result of training" | | | |
| McGuigan 2001 | No | | | NR | | | |
| McMurdo 1995 | Yes | No | | see hosp admissions | | 3 hospital admissions in PRT, 2 in control, 3 in home mobility ‐ reported not related to exercise | 2 in home mobility group, no others ‐ not related to exercise |
| Mihalko 1996 | No | | | NR | | | |
| Mikesky 2006 | Yes | Yes | 1 discontinued in the PRT group because of increased knee pain | 1 discontinued in the PRT group because of increased knee pain | 1 discontinued in the PRT group because of increased knee pain | | |
| Miller 2006 | No | NR | | | | Discharge destination ‐ on discharge from acute care, 52 participants were discharged to a rehabilitation programme, 12 were transferred to a community hospital, 16 were discharged to higher level care and 20 returned directly to their pre‐injury admission accommodation. | 2 in PRT, 1 in attention control |
| Miszko 2003 | Yes | Yes | 6 women fell (5 in PRT, 1 in control) | some (the number is not specified) due to personal medical reasons or injuries | | | |
| Moreland 2001 | Yes (a priori outcome) | Yes | yes to pain or stiffness = 14 in PRT vs 8 in control; other adverse: 8 in PRT vs 3 in control | 5 withdrew due to medical complications in PRT vs 3 in control | | | |
| Nelson 1994 | Yes | Yes | 7/20 in PRT group experienced transient musculoskeletal pain; 3 musculoskeletal injuries (2 fractures and 1 sprain) in the control group | No ‐ MI in PRT group occurred while patient was on vacation | | | |
| Newnham 1995 | No | | | No | | | 3 in each group |
| Nichols 1993 | Yes (safety a priori objective) | Yes | control subject contused sternum during baseline testing, mild to moderate delayed onset muscle soreness | PRT ‐ 1 injury unrelated to program | | | |
| Ouellette 2004 | Yes | Yes, 4 events | 1 in the PRT group was withdrawn after coronary artery stent placement unrelated to study participation. 2 subjects did not undergo week‐12 strength testing due to recurrence of an inguinal hernia (PRT group) and ECG abnormalities (control group). A fourth subject experienced anginal symptoms consistent with coronary artery disease but returned to the study after medical clearance. | Please see the description | | | |
| Parkhouse 2000 | No | | | NR | | | |
| Pollock 1991 | Yes (a‐priori outcome, well‐defined) | Yes | 11/57 subjects sustained an injury during 1RM testing; 2/23 sustained an injury during training. In aerobic group, no injuries during testing but 9/21 had an injury during training | NR by group | | | |
| Pu 2001 | Yes | Yes | 1 control patient developed trochanteric bursitis from 1RM testing, 4 people had mild musculoskeletal soreness, no cardiac complications, deaths or hospitalisations occurred | No | | | |
| Rall 1996 | Yes | No | | | | | |
| Reeves 2004 | No | NR | | | | | |
| Rhodes 2000 | No | | | NR | | | |
| Sartario 2001 | No | | | NR | | | |
| Schilke 1996 | No | | | No | decreased in OASI, no difference between groups on AIMS | | |
| Schlicht 1999 | Yes | No | | No | | | |
| Segal 2003 | No | NR | | | | | |
| Selig 2004 | Yes | yes | 1 illness (noncardiac) and 1 died at home in the exercise group | | | | 1 in exercise group |
| Seynnes 2004 | Yes | No | No injuries, medical complications, or study‐related AE | 3 dropouts because of medical reasons not related to the study | | | |
| Simons 2006 | Yes | NR | 2 dropouts for non‐study related illnesses | | | | |
| Simoneau 2006 | No | NR | | | | | |
| Simpson 1992 | No | | | No | | | |
| Sims 2006 | No | No | | 1 acquired a health problem that prohibited from driving | | | |
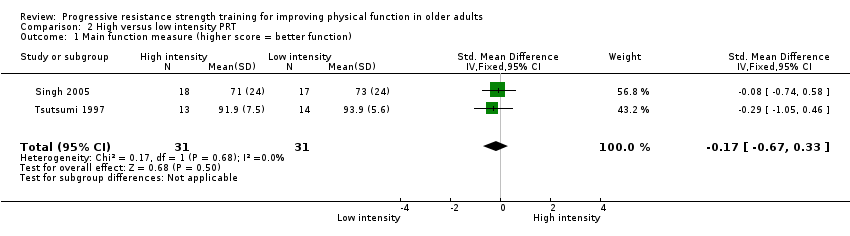
| Singh 1997 | Yes (a priori outcome) | No | | No | weeks of pain reported‐: mean 5.4 (SD=0.7) in PRT, mean 5.6 (SD 0.7) in control | health prof visits mean 2.1 (SD 0.4) for PRT; mean 2.0 (SD 0.5) for control; hospital stays mean 0.24 (SD 0.2) for PRT, mean 0.53 (SD 0.4) for control | |
| Singh 2005 | Yes | Yes | visits to a health professional, minor illness, pain, injuries requiring training adjustment, hospital days, falls | 2 drop out in low intensity group due to pain. I in the control due to hospitalisation | Muscular pain (number of weeks reported per person): High intensity group‐4.1 (2.7); low intensity group‐2.9 (2.6); control group‐3.6 (2.5)
Chest pain (number of weeks reported per person): High intensity group‐ 0.9 (1.9); low‐intensity group‐0.5 (0.9);control group‐.5 (0.8) | Visits to a health professional over the study (numbers per person): high intensity group ‐ 2 (2); low intensity group ‐ 2 (1.8); controls ‐ 5 (1.8) | |
| Sipila 1996 | No | | | 3 drop‐outs due to illness "not related to exercise" | | | |
| Skelton 1995 | Yes | No | | 4 exercise and control participants dropped out because of ill‐health "not related to exercise" | | | |
| Skelton 1996 | Yes | yes | patient fainted due to an arythmia during exercise | NR | | | |
| Sousa 2005 | No | NR | | | | | |
| Suetta 2004 | yes | No | | 2 became ill (1 in PRT) for reasons unrelated to the study | | | |
| Sullivan 2005 | Yes | Yes | 7 withdrew, developed an exacerbation of an underlying medical problem | 7 withdrew, developed an exacerbation of an underlying medical problem | | | |
| Symons 2005 | Yes | Yes | 5 knee discomfort; 1 bruising | 5 knee discomfort; 1 bruising | | | |
| Taaffe 1996 | No | | | 5 drop‐outs from exercise groups for medical problems "not related to the exercise program" | | | |
| Taaffe 1999 | No | | | NR | | | |
| Topp 1993 | No | | | 1 exercise drop‐out due to worsening emphysema, 1 due to a stroke | | | |
| Topp 1996 | No | | | NR | | | |
| Topp 2002 | No | NR | | | | | |
| Topp 2005 | No | NR | | | | | |
| Tracy 2004 | No | NR | | | | | |
| Tsutsumi 1997 | No | | | NR | | | |
| Tyni‐Lenne 2001 | Yes | Maybe | increased oedema in exercise patient | No | | | |
| Vincent 2002 | Yes | Yes | 6 participants stopped exercise for 6 weeks due to hip/knee pain | few (the number is not specified) dropped out for surgery/injury not related to the study protocol. | | | |
| Westhoff 2000 | Yes (asked about complaints during exercise) | Yes | increased knee pain in person with OA, 1 person had pain from elastic band | 2 drop outs because of medica problems (1 had increased epileptic attacks, 1 was often ill) | | | |
| Wieser 2007 | No | NR | | | | | |
| Wood 2001 | No | NR | stated none of the dropouts left the program as a result of adverse responses to treatment ‐ not information about adverse events overall | No | | | |