Compresión‐descompresión activa del tórax para la reanimación cardiopulmonar
Referencias
Referencias de los estudios incluidos en esta revisión
Referencias de los estudios excluidos de esta revisión
Referencias adicionales
Characteristics of studies
Characteristics of included studies [ordered by study ID]
Ir a:
| Methods | Randomized controlled trial. | |
| Participants | n = 150. Mean age: 61.5 y. Male: 72%. Exclusions: trauma victims. VF: 15%. Cardiac cause of heart arrest: 70% | |
| Interventions | ACDR vs. STR. Physician in responder team. Mean response time: 16 mins. Mean adrenaline dose: 12.5 mg. | |
| Outcomes | Immediate and at hospital discharge mortality. | |
| Notes | Pre‐hospital. | |
| Risk of bias | ||
| Bias | Authors' judgement | Support for judgement |
| Allocation concealment? | Low risk | A ‐ Adequate |
| Methods | Randomized controlled trial. | |
| Participants | n = 61. Mean age: 69 y. Male: 73%. Exclusions: pregnancy, trauma victims. VF: 27%. Cardiac antecedents: 52%. Pulmonary antecedents: 12.5%. | |
| Interventions | ACDR vs. STR. Physician in responder team. | |
| Outcomes | Immediate and at hospital discharge mortality. Neurological outcome. Complications. | |
| Notes | Pre‐hospital. | |
| Risk of bias | ||
| Bias | Authors' judgement | Support for judgement |
| Allocation concealment? | Unclear risk | B ‐ Unclear |
| Methods | Randomized controlled trial. | |
| Participants | n = 130. Mean age: 67 y. Male: 72%. Exclusions: hypothermia, trauma victims. VF: 62%. Cardiac antecedents: 62% | |
| Interventions | ACDR vs. STR. Only paramedics in responder team. Mean response time: 5.2 mins. Mean adrenaline dose: 2.7 mg. | |
| Outcomes | Immediate and at hospital discharge mortality. Complications. | |
| Notes | Pre‐hospital. | |
| Risk of bias | ||
| Bias | Authors' judgement | Support for judgement |
| Allocation concealment? | High risk | C ‐ Inadequate |
| Methods | Randomized controlled trial. | |
| Participants | n = 220. Mean age: 68.7 y. Male: ?. Exclusions: pregnancy, hypothermia, drowning, overdose, trauma victims. VF: 45%. Cardiac antecedents: 61%. Pulmonary antecedents: 12.7%. | |
| Interventions | ACDR vs. STR. Physician in responder team. Mean response time: nine mins. Mean adrenaline dose: 4.3 mg. | |
| Outcomes | Immediate and at hospital discharge mortality. Complications. | |
| Notes | Pre‐hospital. | |
| Risk of bias | ||
| Bias | Authors' judgement | Support for judgement |
| Allocation concealment? | Low risk | A ‐ Adequate |
| Methods | Randomized controlled trial. | |
| Participants | n = 674. Mean age: 67 y. Male: 68%. Exclusions: trauma victims. VF: 60%. | |
| Interventions | ACDR vs. STR. Only paramedics in responder team. Mean response time: 8.7 mins. Adrenaline dose: ?. | |
| Outcomes | Immediate and at hospital discharge mortality. Neurological outcome. Complications. | |
| Notes | Pre‐hospital. | |
| Risk of bias | ||
| Bias | Authors' judgement | Support for judgement |
| Allocation concealment? | High risk | C ‐ Inadequate |
| Methods | Randomized controlled trial. | |
| Participants | n = 750. Mean age: 58.5 y. Male: 68%. Exclusions: irreversible death, excessive delay. VF: 12%. Cardiac cause of heart arrest: 64%. | |
| Interventions | ACDR vs. STR. Physician in responder team. | |
| Outcomes | Immediate mortality. Complications. Intention‐to‐treatanalysis was explicitly done. | |
| Notes | Pre‐hospital. | |
| Risk of bias | ||
| Bias | Authors' judgement | Support for judgement |
| Allocation concealment? | High risk | C ‐ Inadequate |
| Methods | Randomized controlled trial. | |
| Participants | n = 253. Mean age: 65 y. Male: 61%. Exclusions: trauma victims, hypothermia. VF: 38%. | |
| Interventions | ACDR vs. STR. Only paramedics in responder team. Mean response time: 5.3 mins. Adrenaline dose: ?. | |
| Outcomes | Immediate and at hospital discharge mortality. Complications. | |
| Notes | Pre‐hospital. | |
| Risk of bias | ||
| Bias | Authors' judgement | Support for judgement |
| Allocation concealment? | High risk | C ‐ Inadequate |
| Methods | Randomized controlled trial. | |
| Participants | n = 607. Mean age: 65 y. Male: 67%. Exclusions: trauma victims, hypothermia. VF: 18%. | |
| Interventions | ACDR vs. STR. | |
| Outcomes | Immediate and at hospital discharge mortality. Complications. | |
| Notes | Pre‐hospital. | |
| Risk of bias | ||
| Bias | Authors' judgement | Support for judgement |
| Allocation concealment? | High risk | C ‐ Inadequate |
| Methods | Randomized controlled trial. | |
| Participants | n = 306. Mean age: 71 y. Male: 73%. Exclusions: trauma victims, intoxication, airway obstruction. VF: 57%. | |
| Interventions | ACDR vs. STR. Physician in responder team. Mean response time: 9 mins. Adrenaline dose: ?. | |
| Outcomes | Immediate and at hospital discharge mortality. Neurological outcome. Intention‐to‐treatanalysis was explicitly done. | |
| Notes | Pre‐hospital. | |
| Risk of bias | ||
| Bias | Authors' judgement | Support for judgement |
| Allocation concealment? | Low risk | A ‐ Adequate |
| Methods | Randomized controlled trial. | |
| Participants | n = 773. Mean age: 68.5 y. Male: 57%. Exclusions: trauma, recent sternotomy, operating room. VF: 32%. Cardiac antecedents: 49%. Cardiac cause of heart arrest: 77%. Respiratory cause: 16% | |
| Interventions | ACDR vs. STR. Physician in responder team. Mean response time: 1.4 mins. Adrenaline dose: ?. | |
| Outcomes | Immediate and at hospital discharge mortality. Neurological outcome. Complications. Intention‐to‐treatanalysis was explicitly done. | |
| Notes | In‐hospital. | |
| Risk of bias | ||
| Bias | Authors' judgement | Support for judgement |
| Allocation concealment? | Low risk | A ‐ Adequate |
| Methods | Randomized controlled trial. | |
| Participants | n = 1011. Mean age: 68 y. Male: 63%. Exclusions: trauma, excessive delay. VF: 32.5%. Cardiac antecedents: 49%. Cardiac cause of heart arrest: 86%. Respiratory cause: 8%. | |
| Interventions | ACDR vs. STR. | |
| Outcomes | Immediate and at hospital discharge mortality. Neurological outcome. Complications. Intention‐to‐treatanalysis was explicitly done. | |
| Notes | Pre‐hospital. | |
| Risk of bias | ||
| Bias | Authors' judgement | Support for judgement |
| Allocation concealment? | Low risk | A ‐ Adequate |
| Methods | Randomized controlled trial. | |
| Participants | n = 53. Mean age: 71 y. Male: 43%. Exclusions: trauma victims, pregnancy. VF: 28%. Cardiac antecedents: 58%. | |
| Interventions | ACDR vs. STR. Physician in responder team. Mean response time: 2 mins. Adrenaline dose: ?. | |
| Outcomes | Immediate and at hospital discharge mortality. Neurological outcome. Intention‐to‐treatanalysis was explicitly done. | |
| Notes | In‐hospital. | |
| Risk of bias | ||
| Bias | Authors' judgement | Support for judgement |
| Allocation concealment? | High risk | C ‐ Inadequate |
n = number of patients included in the study.
VF = presenting ventricular fibrillation or ventricular tachycardia as initial electrical rhythm.
ACDR = active chest compression‐decompression resuscitation.
STR = standard resuscitation (manual chest compression).
Characteristics of excluded studies [ordered by study ID]
Ir a:
| Study | Reason for exclusion |
| Not randomized | |
| 60% of included patients had a known preexisting terminal disease | |
| Patients were randomized to receive high or standard doses of adrenaline. Some patients included in this study received ACDR, but they were not randomized to receive ACDR or STR. | |
| Not randomized | |
| Retrospective, not randomized | |
| ACDR CPR was applied to all patients groups. This trial studied the effect of a respiratory impedance threshold device compared to usual ventilation | |
| Alternation of different methods of chest compression on the same patient | |
| Therapeutic interventions other than the method of chest compression were different: ACDR was combined with an inspiratory impedance threshold device (ITD). Control group received neither ACDR nor ITD. |
Data and analyses
| Outcome or subgroup title | No. of studies | No. of participants | Statistical method | Effect size |
| 1 Immediate mortality Show forest plot | 10 | 4162 | Risk Ratio (M‐H, Random, 95% CI) | 0.98 [0.94, 1.03] |
| Analysis 1.1  Comparison 1 Out‐of‐hospital cardiac arrests, Outcome 1 Immediate mortality. | ||||
| 2 Mortality at hospital discharge Show forest plot | 9 | 3412 | Risk Ratio (M‐H, Fixed, 95% CI) | 0.99 [0.98, 1.01] |
| Analysis 1.2  Comparison 1 Out‐of‐hospital cardiac arrests, Outcome 2 Mortality at hospital discharge. | ||||
| 3 Neurological impairment in survivors Show forest plot | 5 | 358 | Risk Ratio (M‐H, Fixed, 95% CI) | 1.74 [1.06, 2.83] |
| Analysis 1.3  Comparison 1 Out‐of‐hospital cardiac arrests, Outcome 3 Neurological impairment in survivors. | ||||
| 3.1 Moderate neurological impairment | 4 | 107 | Risk Ratio (M‐H, Fixed, 95% CI) | 0.98 [0.34, 2.79] |
| 3.2 Severe neurological impairment | 4 | 107 | Risk Ratio (M‐H, Fixed, 95% CI) | 3.11 [0.98, 9.83] |
| 3.3 Any neurological impairment (any severity) | 5 | 144 | Risk Ratio (M‐H, Fixed, 95% CI) | 1.71 [0.90, 3.25] |
| 4 Complications Show forest plot | 7 | 3032 | Risk Ratio (M‐H, Fixed, 95% CI) | 1.09 [0.86, 1.38] |
| Analysis 1.4  Comparison 1 Out‐of‐hospital cardiac arrests, Outcome 4 Complications. | ||||
| Outcome or subgroup title | No. of studies | No. of participants | Statistical method | Effect size |
| 1 Immediate mortality Show forest plot | 2 | 826 | Risk Ratio (M‐H, Fixed, 95% CI) | 0.98 [0.88, 1.08] |
| Analysis 2.1  Comparison 2 In‐hospital cardiac arrests, Outcome 1 Immediate mortality. | ||||
| 2 Mortality at hospital discharge Show forest plot | 2 | 826 | Risk Ratio (M‐H, Fixed, 95% CI) | 1.00 [0.95, 1.05] |
| Analysis 2.2  Comparison 2 In‐hospital cardiac arrests, Outcome 2 Mortality at hospital discharge. | ||||
| 3 Neurological impairment in survivors Show forest plot | 2 | 279 | Risk Ratio (M‐H, Fixed, 95% CI) | 1.19 [0.63, 2.25] |
| Analysis 2.3  Comparison 2 In‐hospital cardiac arrests, Outcome 3 Neurological impairment in survivors. | ||||
| 3.1 Moderate neurologic impairment | 2 | 93 | Risk Ratio (M‐H, Fixed, 95% CI) | 0.5 [0.10, 2.58] |
| 3.2 Severe neurologic impairment | 2 | 93 | Risk Ratio (M‐H, Fixed, 95% CI) | 1.95 [0.59, 6.50] |
| 3.3 Any neurological impairment (any severity) | 2 | 93 | Risk Ratio (M‐H, Fixed, 95% CI) | 1.19 [0.50, 2.86] |
| 4 Complications Show forest plot | 1 | 773 | Risk Ratio (M‐H, Fixed, 95% CI) | 0.97 [0.49, 1.93] |
| Analysis 2.4  Comparison 2 In‐hospital cardiac arrests, Outcome 4 Complications. | ||||
| Outcome or subgroup title | No. of studies | No. of participants | Statistical method | Effect size |
| 1 Immediate mortality Show forest plot | 10 | 4162 | Risk Ratio (M‐H, Fixed, 95% CI) | 0.98 [0.94, 1.01] |
| Analysis 3.1  Comparison 3 Subgroup analysis: Physician in first responding team or only paramedics, Outcome 1 Immediate mortality. | ||||
| 1.1 Physician in first responding team | 5 | 1487 | Risk Ratio (M‐H, Fixed, 95% CI) | 0.96 [0.89, 1.04] |
| 1.2 Only paramedics in first responding team | 5 | 2675 | Risk Ratio (M‐H, Fixed, 95% CI) | 0.98 [0.95, 1.02] |
| 2 Mortality at hospital discharge Show forest plot | 9 | 3412 | Risk Ratio (M‐H, Fixed, 95% CI) | 0.99 [0.98, 1.01] |
| Analysis 3.2  Comparison 3 Subgroup analysis: Physician in first responding team or only paramedics, Outcome 2 Mortality at hospital discharge. | ||||
| 2.1 Physician in first responding team | 4 | 737 | Risk Ratio (M‐H, Fixed, 95% CI) | 0.99 [0.94, 1.04] |
| 2.2 Only paramedics in first responding team | 5 | 2675 | Risk Ratio (M‐H, Fixed, 95% CI) | 1.00 [0.98, 1.01] |
| 3 Neurological impairment in survivors (any severity) Show forest plot | 5 | 144 | Risk Ratio (M‐H, Fixed, 95% CI) | 1.71 [0.90, 3.25] |
| Analysis 3.3  Comparison 3 Subgroup analysis: Physician in first responding team or only paramedics, Outcome 3 Neurological impairment in survivors (any severity). | ||||
| 3.1 Physician in first responding team | 2 | 44 | Risk Ratio (M‐H, Fixed, 95% CI) | 1.07 [0.41, 2.80] |
| 3.2 Only paramedics in first responding team | 3 | 100 | Risk Ratio (M‐H, Fixed, 95% CI) | 2.19 [0.93, 5.13] |
| Outcome or subgroup title | No. of studies | No. of participants | Statistical method | Effect size |
| 1 Immediate mortality Show forest plot | 12 | 4988 | Risk Ratio (M‐H, Fixed, 95% CI) | 0.98 [0.95, 1.01] |
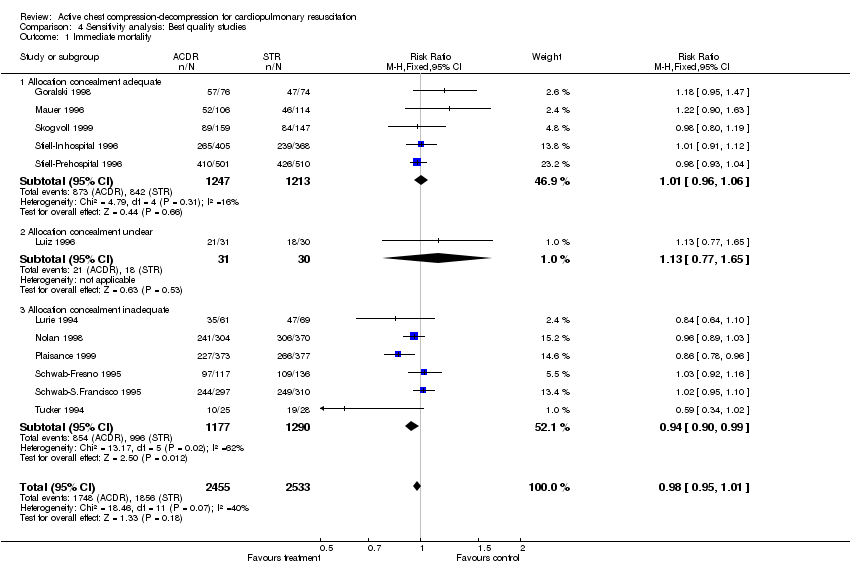
| Analysis 4.1  Comparison 4 Sensitivity analysis: Best quality studies, Outcome 1 Immediate mortality. | ||||
| 1.1 Allocation concealment adequate | 5 | 2460 | Risk Ratio (M‐H, Fixed, 95% CI) | 1.01 [0.96, 1.06] |
| 1.2 Allocation concealment unclear | 1 | 61 | Risk Ratio (M‐H, Fixed, 95% CI) | 1.13 [0.77, 1.65] |
| 1.3 Allocation concealment inadequate | 6 | 2467 | Risk Ratio (M‐H, Fixed, 95% CI) | 0.94 [0.90, 0.99] |
| 2 Mortality at hospital discharge Show forest plot | 11 | 4238 | Risk Ratio (M‐H, Fixed, 95% CI) | 1.00 [0.98, 1.01] |
| Analysis 4.2  Comparison 4 Sensitivity analysis: Best quality studies, Outcome 2 Mortality at hospital discharge. | ||||
| 2.1 Allocation concealment adequate | 5 | 2460 | Risk Ratio (M‐H, Fixed, 95% CI) | 1.00 [0.97, 1.02] |
| 2.2 Allocation concealment unclear | 1 | 61 | Risk Ratio (M‐H, Fixed, 95% CI) | 1.04 [0.87, 1.25] |
| 2.3 Allocation concealment inadequate | 5 | 1717 | Risk Ratio (M‐H, Fixed, 95% CI) | 0.99 [0.97, 1.02] |
| 3 Neurological impairment in survivors (any severity) Show forest plot | 7 | 237 | Risk Ratio (M‐H, Fixed, 95% CI) | 1.50 [0.89, 2.51] |
| Analysis 4.3  Comparison 4 Sensitivity analysis: Best quality studies, Outcome 3 Neurological impairment in survivors (any severity). | ||||
| 3.1 Allocation concealment adequate | 3 | 163 | Risk Ratio (M‐H, Fixed, 95% CI) | 1.45 [0.75, 2.79] |
| 3.2 Allocation concealment unclear | 1 | 7 | Risk Ratio (M‐H, Fixed, 95% CI) | 0.89 [0.33, 2.37] |
| 3.3 Allocation concealment inadequate | 3 | 67 | Risk Ratio (M‐H, Fixed, 95% CI) | 2.09 [0.67, 6.54] |
| Outcome or subgroup title | No. of studies | No. of participants | Statistical method | Effect size |
| 1 Immediate mortality Show forest plot | 5 | 3815 | Risk Ratio (M‐H, Fixed, 95% CI) | 0.97 [0.93, 1.00] |
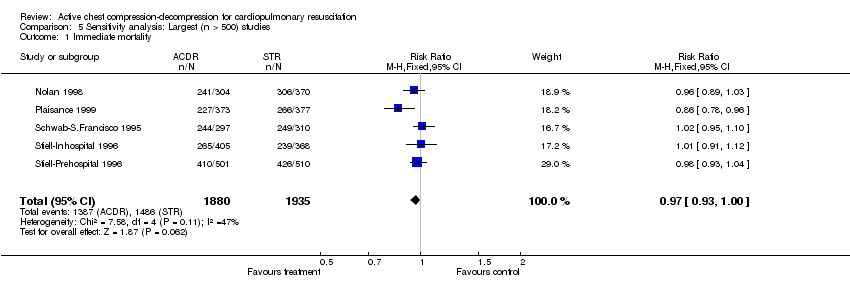
| Analysis 5.1  Comparison 5 Sensitivity analysis: Largest (n > 500) studies, Outcome 1 Immediate mortality. | ||||
| 2 Mortality at hospital discharge Show forest plot | 4 | 3065 | Risk Ratio (M‐H, Fixed, 95% CI) | 1.00 [0.98, 1.02] |
| Analysis 5.2  Comparison 5 Sensitivity analysis: Largest (n > 500) studies, Outcome 2 Mortality at hospital discharge. | ||||
| 3 Neurological impairment in survivors (any severity) Show forest plot | 3 | 159 | Risk Ratio (M‐H, Fixed, 95% CI) | 1.60 [0.81, 3.16] |
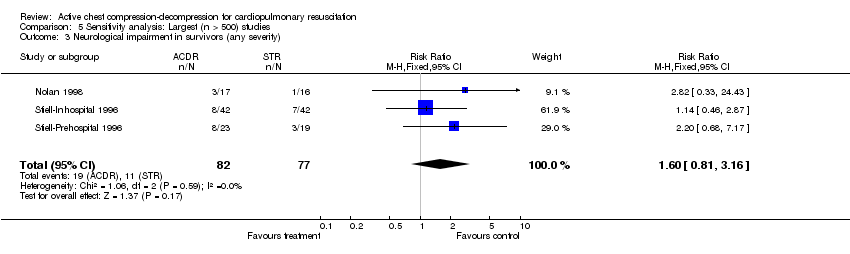
| Analysis 5.3  Comparison 5 Sensitivity analysis: Largest (n > 500) studies, Outcome 3 Neurological impairment in survivors (any severity). | ||||
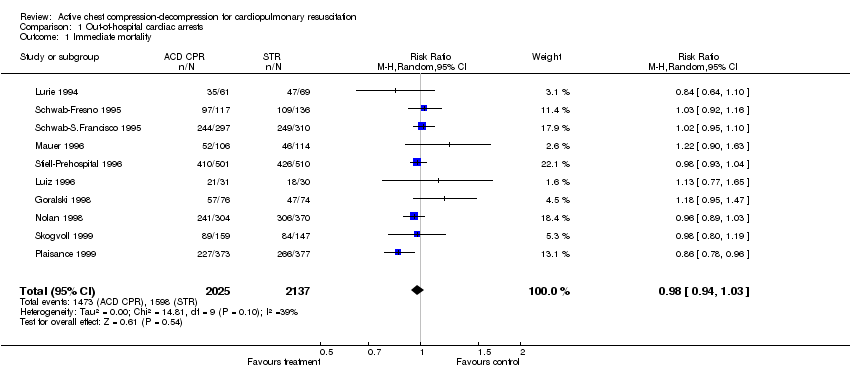
Comparison 1 Out‐of‐hospital cardiac arrests, Outcome 1 Immediate mortality.

Comparison 1 Out‐of‐hospital cardiac arrests, Outcome 2 Mortality at hospital discharge.

Comparison 1 Out‐of‐hospital cardiac arrests, Outcome 3 Neurological impairment in survivors.
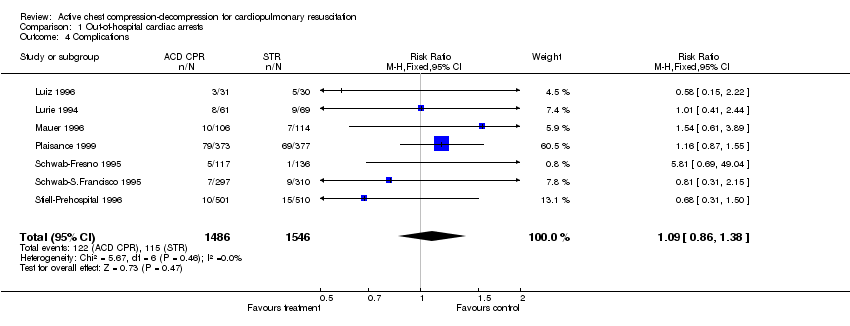
Comparison 1 Out‐of‐hospital cardiac arrests, Outcome 4 Complications.

Comparison 2 In‐hospital cardiac arrests, Outcome 1 Immediate mortality.

Comparison 2 In‐hospital cardiac arrests, Outcome 2 Mortality at hospital discharge.
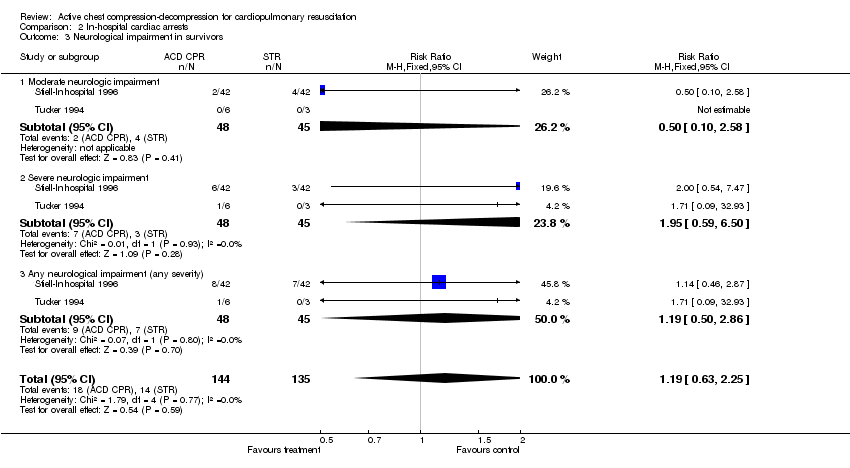
Comparison 2 In‐hospital cardiac arrests, Outcome 3 Neurological impairment in survivors.

Comparison 2 In‐hospital cardiac arrests, Outcome 4 Complications.

Comparison 3 Subgroup analysis: Physician in first responding team or only paramedics, Outcome 1 Immediate mortality.

Comparison 3 Subgroup analysis: Physician in first responding team or only paramedics, Outcome 2 Mortality at hospital discharge.
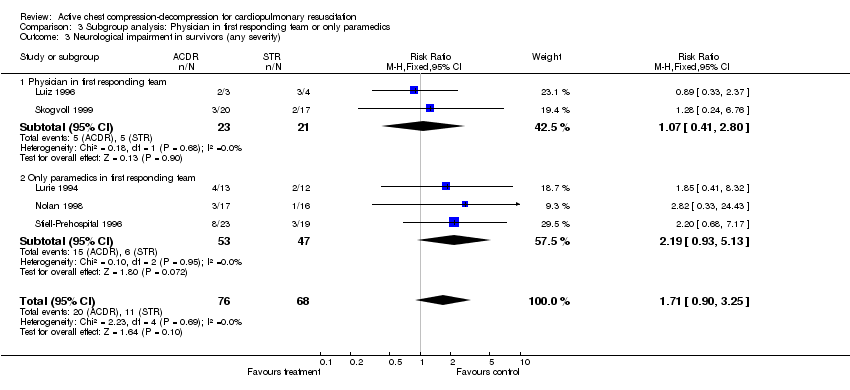
Comparison 3 Subgroup analysis: Physician in first responding team or only paramedics, Outcome 3 Neurological impairment in survivors (any severity).
Comparison 4 Sensitivity analysis: Best quality studies, Outcome 1 Immediate mortality.

Comparison 4 Sensitivity analysis: Best quality studies, Outcome 2 Mortality at hospital discharge.

Comparison 4 Sensitivity analysis: Best quality studies, Outcome 3 Neurological impairment in survivors (any severity).
Comparison 5 Sensitivity analysis: Largest (n > 500) studies, Outcome 1 Immediate mortality.

Comparison 5 Sensitivity analysis: Largest (n > 500) studies, Outcome 2 Mortality at hospital discharge.
Comparison 5 Sensitivity analysis: Largest (n > 500) studies, Outcome 3 Neurological impairment in survivors (any severity).
| Outcome or subgroup title | No. of studies | No. of participants | Statistical method | Effect size |
| 1 Immediate mortality Show forest plot | 10 | 4162 | Risk Ratio (M‐H, Random, 95% CI) | 0.98 [0.94, 1.03] |
| 2 Mortality at hospital discharge Show forest plot | 9 | 3412 | Risk Ratio (M‐H, Fixed, 95% CI) | 0.99 [0.98, 1.01] |
| 3 Neurological impairment in survivors Show forest plot | 5 | 358 | Risk Ratio (M‐H, Fixed, 95% CI) | 1.74 [1.06, 2.83] |
| 3.1 Moderate neurological impairment | 4 | 107 | Risk Ratio (M‐H, Fixed, 95% CI) | 0.98 [0.34, 2.79] |
| 3.2 Severe neurological impairment | 4 | 107 | Risk Ratio (M‐H, Fixed, 95% CI) | 3.11 [0.98, 9.83] |
| 3.3 Any neurological impairment (any severity) | 5 | 144 | Risk Ratio (M‐H, Fixed, 95% CI) | 1.71 [0.90, 3.25] |
| 4 Complications Show forest plot | 7 | 3032 | Risk Ratio (M‐H, Fixed, 95% CI) | 1.09 [0.86, 1.38] |
| Outcome or subgroup title | No. of studies | No. of participants | Statistical method | Effect size |
| 1 Immediate mortality Show forest plot | 2 | 826 | Risk Ratio (M‐H, Fixed, 95% CI) | 0.98 [0.88, 1.08] |
| 2 Mortality at hospital discharge Show forest plot | 2 | 826 | Risk Ratio (M‐H, Fixed, 95% CI) | 1.00 [0.95, 1.05] |
| 3 Neurological impairment in survivors Show forest plot | 2 | 279 | Risk Ratio (M‐H, Fixed, 95% CI) | 1.19 [0.63, 2.25] |
| 3.1 Moderate neurologic impairment | 2 | 93 | Risk Ratio (M‐H, Fixed, 95% CI) | 0.5 [0.10, 2.58] |
| 3.2 Severe neurologic impairment | 2 | 93 | Risk Ratio (M‐H, Fixed, 95% CI) | 1.95 [0.59, 6.50] |
| 3.3 Any neurological impairment (any severity) | 2 | 93 | Risk Ratio (M‐H, Fixed, 95% CI) | 1.19 [0.50, 2.86] |
| 4 Complications Show forest plot | 1 | 773 | Risk Ratio (M‐H, Fixed, 95% CI) | 0.97 [0.49, 1.93] |
| Outcome or subgroup title | No. of studies | No. of participants | Statistical method | Effect size |
| 1 Immediate mortality Show forest plot | 10 | 4162 | Risk Ratio (M‐H, Fixed, 95% CI) | 0.98 [0.94, 1.01] |
| 1.1 Physician in first responding team | 5 | 1487 | Risk Ratio (M‐H, Fixed, 95% CI) | 0.96 [0.89, 1.04] |
| 1.2 Only paramedics in first responding team | 5 | 2675 | Risk Ratio (M‐H, Fixed, 95% CI) | 0.98 [0.95, 1.02] |
| 2 Mortality at hospital discharge Show forest plot | 9 | 3412 | Risk Ratio (M‐H, Fixed, 95% CI) | 0.99 [0.98, 1.01] |
| 2.1 Physician in first responding team | 4 | 737 | Risk Ratio (M‐H, Fixed, 95% CI) | 0.99 [0.94, 1.04] |
| 2.2 Only paramedics in first responding team | 5 | 2675 | Risk Ratio (M‐H, Fixed, 95% CI) | 1.00 [0.98, 1.01] |
| 3 Neurological impairment in survivors (any severity) Show forest plot | 5 | 144 | Risk Ratio (M‐H, Fixed, 95% CI) | 1.71 [0.90, 3.25] |
| 3.1 Physician in first responding team | 2 | 44 | Risk Ratio (M‐H, Fixed, 95% CI) | 1.07 [0.41, 2.80] |
| 3.2 Only paramedics in first responding team | 3 | 100 | Risk Ratio (M‐H, Fixed, 95% CI) | 2.19 [0.93, 5.13] |
| Outcome or subgroup title | No. of studies | No. of participants | Statistical method | Effect size |
| 1 Immediate mortality Show forest plot | 12 | 4988 | Risk Ratio (M‐H, Fixed, 95% CI) | 0.98 [0.95, 1.01] |
| 1.1 Allocation concealment adequate | 5 | 2460 | Risk Ratio (M‐H, Fixed, 95% CI) | 1.01 [0.96, 1.06] |
| 1.2 Allocation concealment unclear | 1 | 61 | Risk Ratio (M‐H, Fixed, 95% CI) | 1.13 [0.77, 1.65] |
| 1.3 Allocation concealment inadequate | 6 | 2467 | Risk Ratio (M‐H, Fixed, 95% CI) | 0.94 [0.90, 0.99] |
| 2 Mortality at hospital discharge Show forest plot | 11 | 4238 | Risk Ratio (M‐H, Fixed, 95% CI) | 1.00 [0.98, 1.01] |
| 2.1 Allocation concealment adequate | 5 | 2460 | Risk Ratio (M‐H, Fixed, 95% CI) | 1.00 [0.97, 1.02] |
| 2.2 Allocation concealment unclear | 1 | 61 | Risk Ratio (M‐H, Fixed, 95% CI) | 1.04 [0.87, 1.25] |
| 2.3 Allocation concealment inadequate | 5 | 1717 | Risk Ratio (M‐H, Fixed, 95% CI) | 0.99 [0.97, 1.02] |
| 3 Neurological impairment in survivors (any severity) Show forest plot | 7 | 237 | Risk Ratio (M‐H, Fixed, 95% CI) | 1.50 [0.89, 2.51] |
| 3.1 Allocation concealment adequate | 3 | 163 | Risk Ratio (M‐H, Fixed, 95% CI) | 1.45 [0.75, 2.79] |
| 3.2 Allocation concealment unclear | 1 | 7 | Risk Ratio (M‐H, Fixed, 95% CI) | 0.89 [0.33, 2.37] |
| 3.3 Allocation concealment inadequate | 3 | 67 | Risk Ratio (M‐H, Fixed, 95% CI) | 2.09 [0.67, 6.54] |
| Outcome or subgroup title | No. of studies | No. of participants | Statistical method | Effect size |
| 1 Immediate mortality Show forest plot | 5 | 3815 | Risk Ratio (M‐H, Fixed, 95% CI) | 0.97 [0.93, 1.00] |
| 2 Mortality at hospital discharge Show forest plot | 4 | 3065 | Risk Ratio (M‐H, Fixed, 95% CI) | 1.00 [0.98, 1.02] |
| 3 Neurological impairment in survivors (any severity) Show forest plot | 3 | 159 | Risk Ratio (M‐H, Fixed, 95% CI) | 1.60 [0.81, 3.16] |