| 1 Diarrhoea Show forest plot | 3 | 655 | Risk Ratio (M‐H, Random, 95% CI) | 0.79 [0.42, 1.47] |
|
| 1.1 AMT | 2 | 599 | Risk Ratio (M‐H, Random, 95% CI) | 0.81 [0.43, 1.53] |
| 1.2 RMT | 1 | 56 | Risk Ratio (M‐H, Random, 95% CI) | 0.36 [0.02, 8.41] |
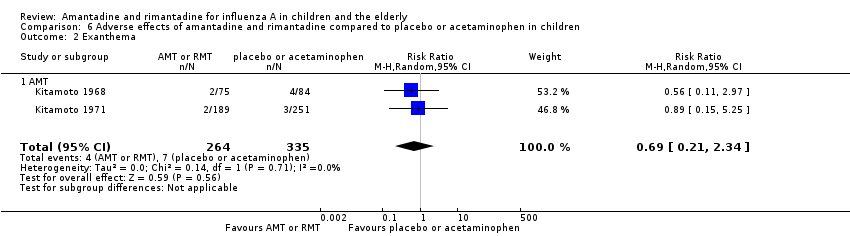
| 2 Exanthema Show forest plot | 2 | 599 | Risk Ratio (M‐H, Random, 95% CI) | 0.69 [0.21, 2.34] |
|
| 2.1 AMT | 2 | 599 | Risk Ratio (M‐H, Random, 95% CI) | 0.69 [0.21, 2.34] |
| 3 Muscular, limb pain Show forest plot | 2 | 599 | Risk Ratio (M‐H, Random, 95% CI) | 0.85 [0.46, 1.59] |
|
| 3.1 AMT | 2 | 599 | Risk Ratio (M‐H, Random, 95% CI) | 0.85 [0.46, 1.59] |
| 4 Headache Show forest plot | 2 | 599 | Risk Ratio (M‐H, Random, 95% CI) | 0.73 [0.52, 1.03] |
|
| 4.1 AMT | 2 | 599 | Risk Ratio (M‐H, Random, 95% CI) | 0.73 [0.52, 1.03] |
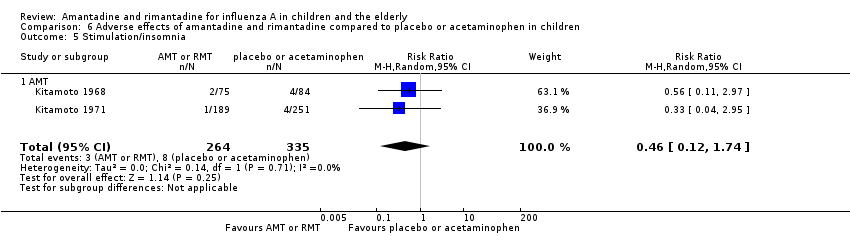
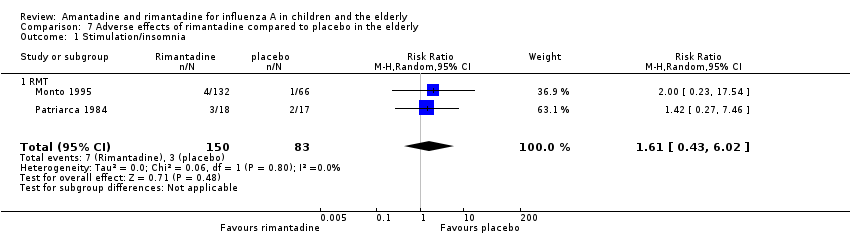
| 5 Stimulation/insomnia Show forest plot | 2 | 599 | Risk Ratio (M‐H, Random, 95% CI) | 0.46 [0.12, 1.74] |
|
| 5.1 AMT | 2 | 599 | Risk Ratio (M‐H, Random, 95% CI) | 0.46 [0.12, 1.74] |
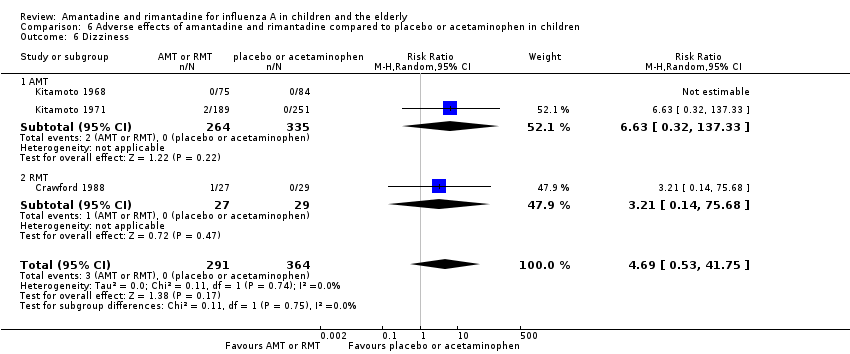
| 6 Dizziness Show forest plot | 3 | 655 | Risk Ratio (M‐H, Random, 95% CI) | 4.69 [0.53, 41.75] |
|
| 6.1 AMT | 2 | 599 | Risk Ratio (M‐H, Random, 95% CI) | 6.63 [0.32, 137.33] |
| 6.2 RMT | 1 | 56 | Risk Ratio (M‐H, Random, 95% CI) | 3.21 [0.14, 75.68] |
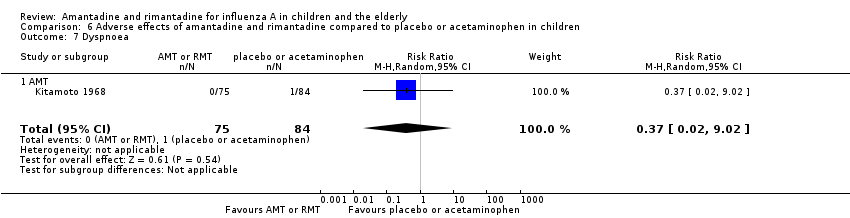
| 7 Dyspnoea Show forest plot | 1 | 159 | Risk Ratio (M‐H, Random, 95% CI) | 0.37 [0.02, 9.02] |
|
| 7.1 AMT | 1 | 159 | Risk Ratio (M‐H, Random, 95% CI) | 0.37 [0.02, 9.02] |
| 8 Central nervous system symptoms Show forest plot | 1 | 76 | Risk Ratio (M‐H, Random, 95% CI) | 0.23 [0.01, 4.70] |
|
| 8.1 RMT | 1 | 76 | Risk Ratio (M‐H, Random, 95% CI) | 0.23 [0.01, 4.70] |
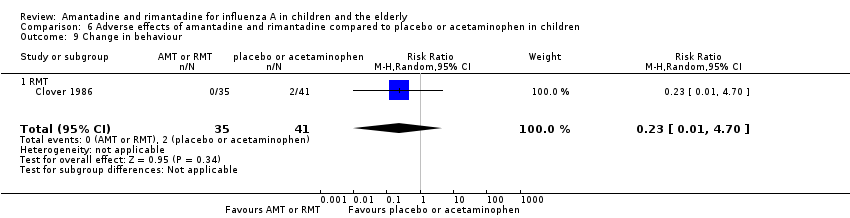
| 9 Change in behaviour Show forest plot | 1 | 76 | Risk Ratio (M‐H, Random, 95% CI) | 0.23 [0.01, 4.70] |
|
| 9.1 RMT | 1 | 76 | Risk Ratio (M‐H, Random, 95% CI) | 0.23 [0.01, 4.70] |
| 10 Gastrointestinal symptoms Show forest plot | 1 | 76 | Risk Ratio (M‐H, Random, 95% CI) | 1.17 [0.08, 18.05] |
|
| 10.1 RMT | 1 | 76 | Risk Ratio (M‐H, Random, 95% CI) | 1.17 [0.08, 18.05] |
| 11 Hyperreactivity Show forest plot | 1 | 56 | Risk Ratio (M‐H, Random, 95% CI) | 0.36 [0.02, 8.41] |
|
| 11.1 RMT | 1 | 56 | Risk Ratio (M‐H, Random, 95% CI) | 0.36 [0.02, 8.41] |
| 12 Tinnitus Show forest plot | 1 | 56 | Risk Ratio (M‐H, Random, 95% CI) | 3.21 [0.14, 75.68] |
|
| 12.1 RMT | 1 | 56 | Risk Ratio (M‐H, Random, 95% CI) | 3.21 [0.14, 75.68] |
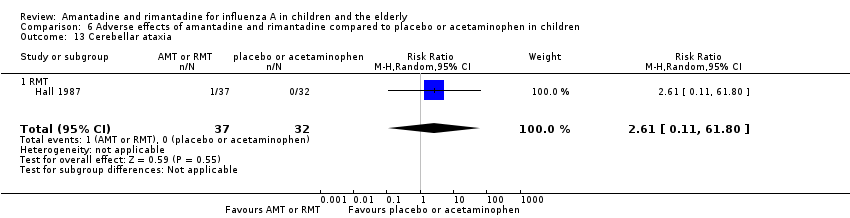
| 13 Cerebellar ataxia Show forest plot | 1 | 69 | Risk Ratio (M‐H, Random, 95% CI) | 2.61 [0.11, 61.80] |
|
| 13.1 RMT | 1 | 69 | Risk Ratio (M‐H, Random, 95% CI) | 2.61 [0.11, 61.80] |
| 14 Malaise Show forest plot | 2 | 599 | Risk Ratio (M‐H, Random, 95% CI) | 0.89 [0.41, 1.96] |
|
| 14.1 AMT | 2 | 599 | Risk Ratio (M‐H, Random, 95% CI) | 0.89 [0.41, 1.96] |
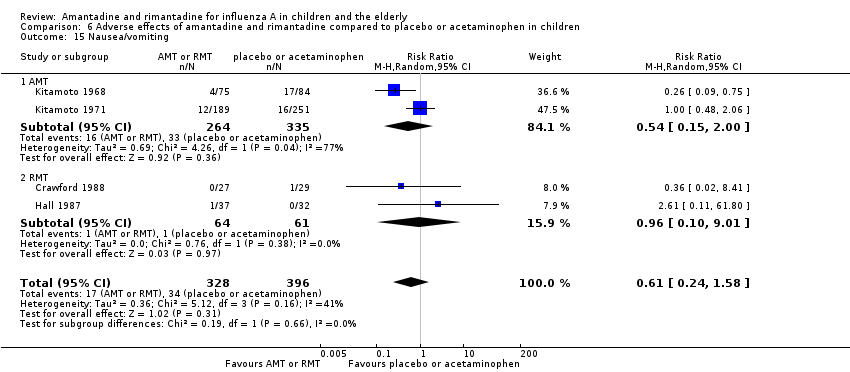
| 15 Nausea/vomiting Show forest plot | 4 | 724 | Risk Ratio (M‐H, Random, 95% CI) | 0.61 [0.24, 1.58] |
|
| 15.1 AMT | 2 | 599 | Risk Ratio (M‐H, Random, 95% CI) | 0.54 [0.15, 2.00] |
| 15.2 RMT | 2 | 125 | Risk Ratio (M‐H, Random, 95% CI) | 0.96 [0.10, 9.01] |
| 16 Arrhythmia Show forest plot | 2 | 599 | Risk Ratio (M‐H, Random, 95% CI) | 0.0 [0.0, 0.0] |
|
| 16.1 AMT | 2 | 599 | Risk Ratio (M‐H, Random, 95% CI) | 0.0 [0.0, 0.0] |