Cepillos dentales manuales versus eléctricos para la salud oral
Información
- DOI:
- https://doi.org/10.1002/14651858.CD002281.pub3Copiar DOI

- Base de datos:
-
- Cochrane Database of Systematic Reviews
- Versión publicada:
-
- 17 junio 2014see what's new
- Tipo:
-
- Intervention
- Etapa:
-
- Review
- Grupo Editorial Cochrane:
-
Grupo Cochrane de Salud oral
- Copyright:
-
- Copyright © 2014 The Cochrane Collaboration. Published by John Wiley & Sons, Ltd.
Cifras del artículo
Altmetric:
Citado por:
Autores
Contributions of authors
Bill Shaw and Helen Worthington wrote the protocol. Anne‐Marie Glenny, Bill Shaw, Mike Heanue, Peter Robinson, Damien Walmsley and Munirah Yaacob co‐ordinated the review. Bill Shaw and Peter Robinson wrote the letters to the authors. Bill Shaw, Scott Deacon, Chris Deery, Mike Heanue, Peter Robinson, Damien Walmsley and Munirah Yaacob independently and in duplicate assessed the eligibility of trials, extracted data and assessed the quality of the trials. Damien Walmsley and Peter Robinson provided the background and sourced information on brush action and plaque and gingival indices. Helen Worthington conducted the statistical analysis. Scott Deacon, Anne‐Marie Glenny, Munirah Yaacob and Mike Heanue checked and entered data. Anne‐Mare Glenny, Helen Worthington and Munirah Yaacob wrote this version of the review, and checked for numerical consistency. Chris Deery updated the background.
Sources of support
Internal sources
-
School of Dentistry, The University of Manchester, UK.
-
School of Dentistry, The University of Birmingham, UK.
-
Edinburgh Dental Institute, UK.
-
University of Sheffield, School of Dentistry, UK.
-
MAHSC, UK.
The Cochrane Oral Health Group is supported by the Manchester Academic Health Sciences Centre (MAHSC) and the NIHR Manchester Biomedical Research Centre.
External sources
-
Cochrane Oral Health Group Global Alliance, UK.
All reviews in the Cochrane Oral Health Group are supported by Global Alliance member organisations (British Association of Oral Surgeons, UK; British Orthodontic Society, UK; British Society of Paediatric Dentistry, UK; British Society of Periodontology, UK; Canadian Dental Hygienists Association, Canada; Mayo Clinic, USA; National Center for Dental Hygiene Research & Practice, USA; New York University College of Dentistry, USA; and Royal College of Surgeons of Edinburgh, UK) providing funding for the editorial process (http://ohg.cochrane.org/).
-
National Institute for Health Research (NIHR), UK.
CRG funding acknowledgement:
The NIHR is the largest single funder of the Cochrane Oral Health Group.Disclaimer:
The views and opinions expressed therein are those of the authors and do not necessarily reflect those of the NIHR, NHS or the Department of Health.
Declarations of interest
Bill Shaw and Helen Worthington were co‐researchers on a randomised controlled trial sponsored by Braun AG (Clerehugh 1998) through a grant to The University of Manchester. Damien Walmsley was a consultant and undertook laboratory trials of powered toothbrushes sponsored by Braun AG through a grant to the University of Birmingham.
Acknowledgements
Thanks are due to Anne Littlewood and Sylvia Bickley, Trials Search Co‐ordinator for the Cochrane Oral Health Group for carrying out the searches for the review; Philip Riley and Liz Asbridge for administration of the review, co‐ordination of databases and location of articles for the review; Luisa Fernandez Mauleffinch, Managing Editor for the Cochrane Oral Health Group for copy editing the review; and Bill Shaw and Mike Heanue for their contribution to previous versions of this review. For help with the translations of foreign papers our thanks go to Selva Can (German), Dr Mona Nasser (German), Dr Patrick Sequeira‐Byron (German), Regina Mitezki (German), Paul Tramini (French), Professor Stéphanie Tubert‐Jeannin (French) and Giovanni Lodi (Italian).
We would also like to thank the following investigators who replied to our requests for additional information about their trials: J de Boever (Universitair Ziekenhuis, Gent), C Burge (University of Colorado), M Darby (Old Dominion University), A Dentino (Marquette University), W Killoy (University of Missouri), A Koerber (University of Illinois), I Moschén (Leopold‐Franzens‐Universität), R Nolden (Rheinishe Friedrich‐Wilhelms Universität), T Palmer (Clinical Research Associates), M Thompson (Gillette Company), P Warren (Gillette Company), AK Pelka (University Hospital of Munich), C Kossack (University of Berlin) and G.I MacCracken (Newcastle University). For their help as referees, we express our thanks to Martin Addy, Nik Barstow, Robin Davies, Marco Esposito, Eleanor Grey, Jayne Harrison, Lee Hooper, Ian Needleman, Richard Niederman, Derek Richards and Philip Riley.
Version history
| Published | Title | Stage | Authors | Version |
| 2014 Jun 17 | Powered versus manual toothbrushing for oral health | Review | Munirah Yaacob, Helen V Worthington, Scott A Deacon, Chris Deery, A Damien Walmsley, Peter G Robinson, Anne‐Marie Glenny | |
| 2005 Apr 20 | Manual versus powered toothbrushing for oral health | Review | Peter Robinson, Scott A Deacon, Chris Deery, Mike Heanue, A Damien Walmsley, Helen V Worthington, Anne‐Marie Glenny, Bill C Shaw | |
| 2003 Jan 20 | Manual versus powered toothbrushing for oral health | Review | Mike Heanue, Scott A Deacon, Chris Deery, Peter G Robinson, A. Damien Walmsley, Helen V Worthington, W C Shaw, Bill C Shaw | |
Keywords
MeSH
Medical Subject Headings (MeSH) Keywords
- Dental Devices, Home Care [*adverse effects, *economics];
- Dental Plaque [complications, *prevention & control];
- Gingival Diseases [prevention & control];
- Gingivitis [*prevention & control];
- Oral Health;
- Periodontal Diseases [prevention & control];
- Randomized Controlled Trials as Topic;
- Toothbrushing [*instrumentation, methods];
Medical Subject Headings Check Words
Humans;
PICO

Flow chart of study selection in this update.
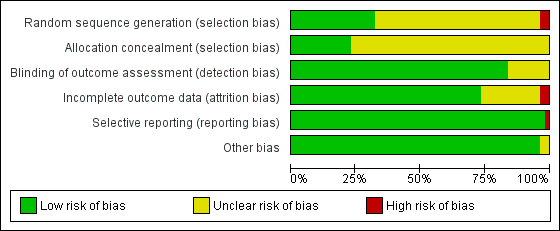
Risk of bias graph: review authors' judgements about each risk of bias item presented as percentages across all included studies.

Risk of bias summary: review authors' judgements about each risk of bias item for each included study.

Funnel plot of Comparison 1: All powered toothbrushes versus manual toothbrushes, Outcome 1.1: Plaque scores at 1 to 3 months at all sites.
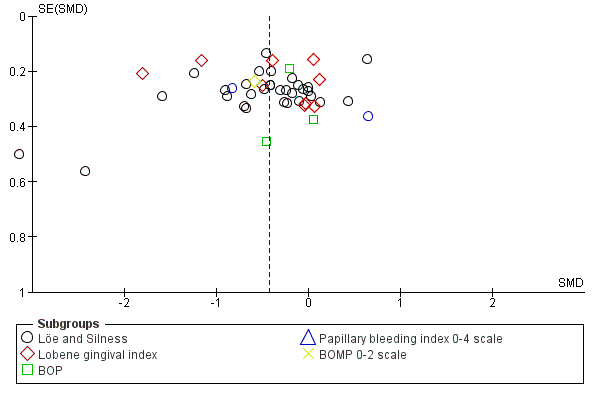
Funnel plot of Comparison 1: All powered toothbrushes versus manual toothbrushes, Outcome 1.2: Gingival scores at 1 to 3 months at all sites.

Comparison 1 All powered toothbrushes versus manual toothbrushes, Outcome 1 Plaque scores at 1 to 3 month at all sites.
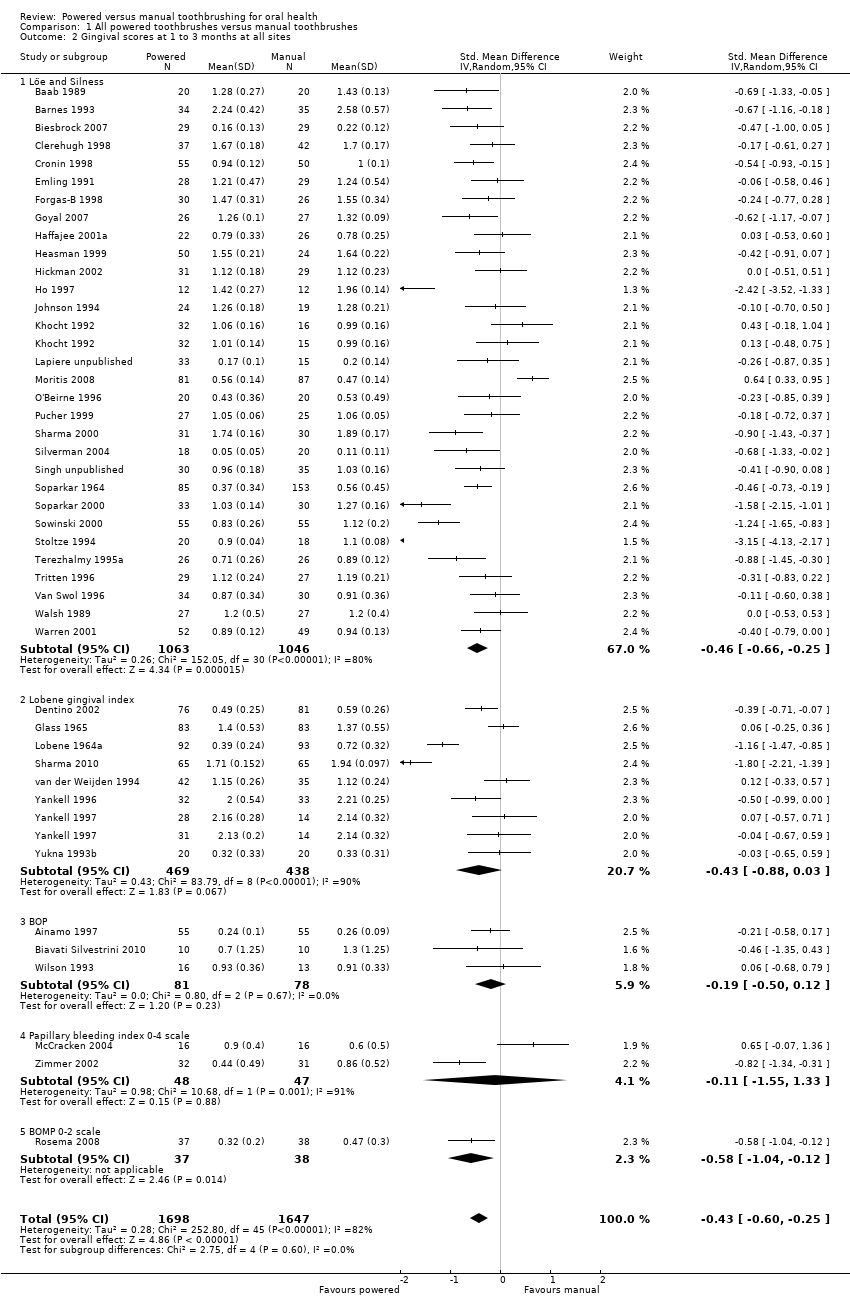
Comparison 1 All powered toothbrushes versus manual toothbrushes, Outcome 2 Gingival scores at 1 to 3 months at all sites.

Comparison 1 All powered toothbrushes versus manual toothbrushes, Outcome 3 Plaque scores at >3 months.

Comparison 1 All powered toothbrushes versus manual toothbrushes, Outcome 4 Gingival scores at >3 months.

Comparison 2 Side to side powered toothbrushes versus manual toothbrushes, Outcome 1 Plaque scores at 1 to 3 month at all sites.

Comparison 2 Side to side powered toothbrushes versus manual toothbrushes, Outcome 2 Gingival scores at 1 to 3 months at all sites.
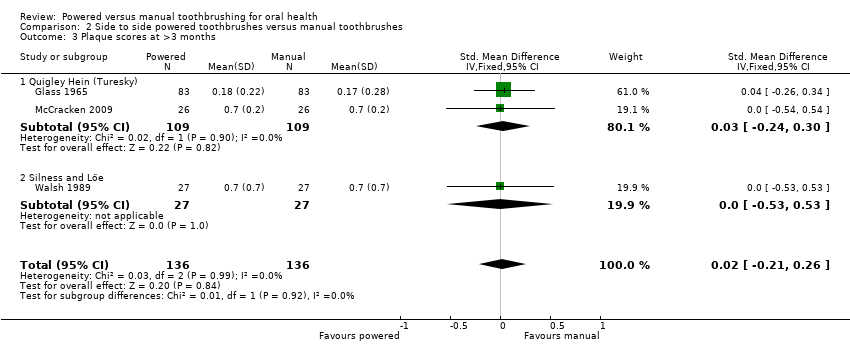
Comparison 2 Side to side powered toothbrushes versus manual toothbrushes, Outcome 3 Plaque scores at >3 months.

Comparison 2 Side to side powered toothbrushes versus manual toothbrushes, Outcome 4 Gingival scores at >3 months.

Comparison 3 Counter oscillation powered toothbrushes versus manual toothbrushes, Outcome 1 Plaque scores at 1 to 3 month at all sites.

Comparison 3 Counter oscillation powered toothbrushes versus manual toothbrushes, Outcome 2 Gingivitis scores at 1 to 3 months at all sites.

Comparison 3 Counter oscillation powered toothbrushes versus manual toothbrushes, Outcome 3 Plaque scores at >3 months.

Comparison 3 Counter oscillation powered toothbrushes versus manual toothbrushes, Outcome 4 Gingival scores at >3 months.
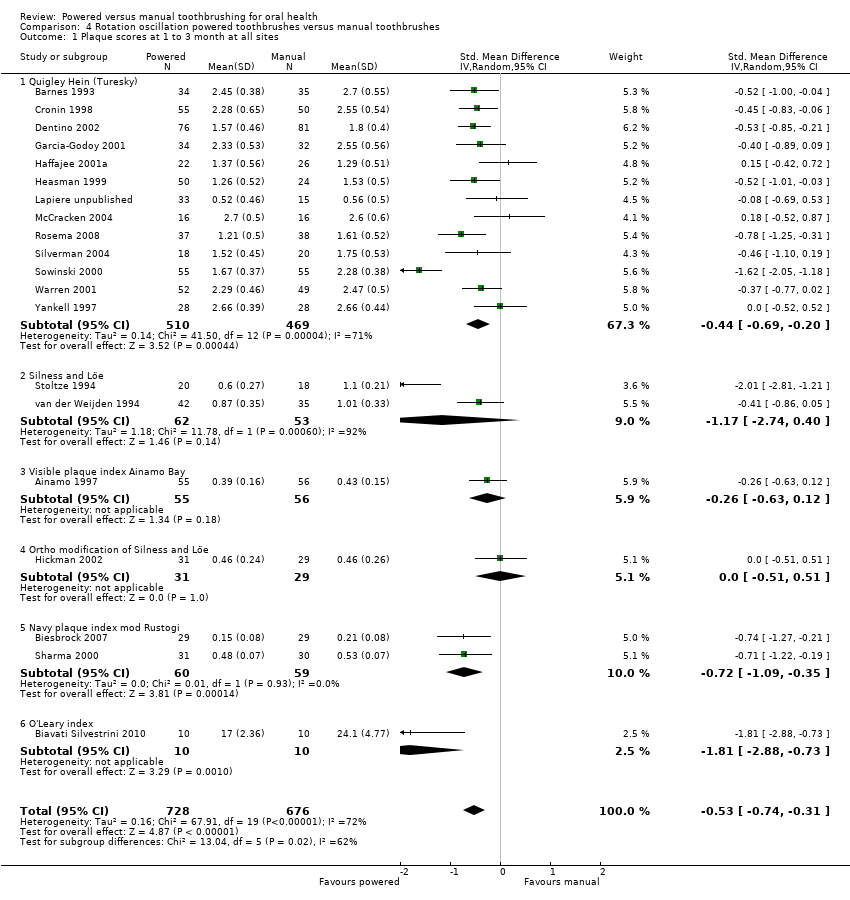
Comparison 4 Rotation oscillation powered toothbrushes versus manual toothbrushes, Outcome 1 Plaque scores at 1 to 3 month at all sites.

Comparison 4 Rotation oscillation powered toothbrushes versus manual toothbrushes, Outcome 2 Gingival scores at 1 to 3 months at all sites.
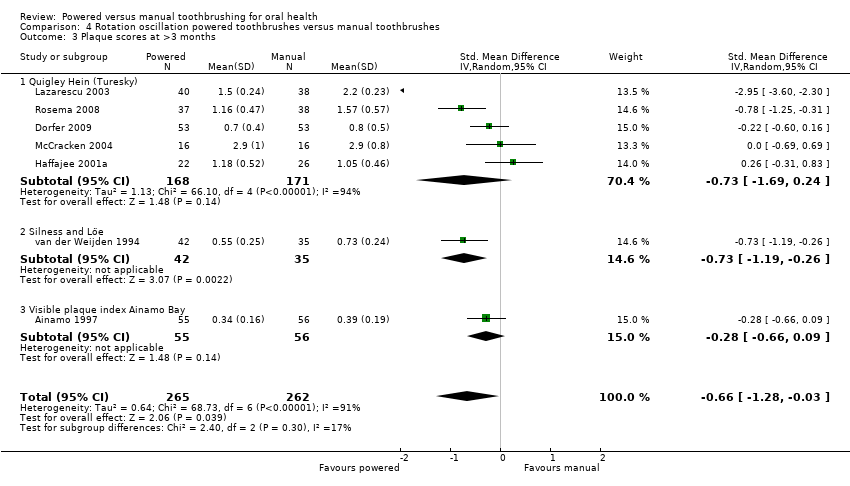
Comparison 4 Rotation oscillation powered toothbrushes versus manual toothbrushes, Outcome 3 Plaque scores at >3 months.
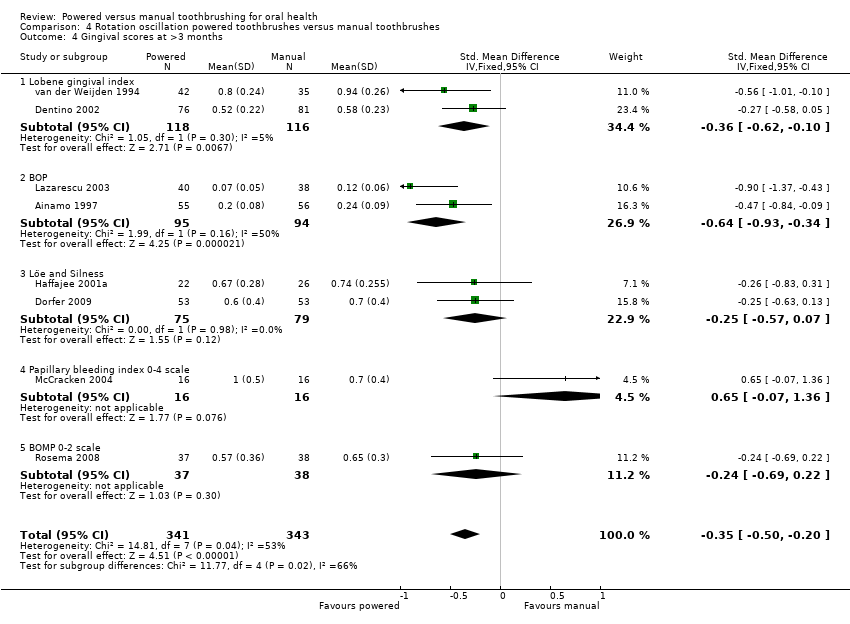
Comparison 4 Rotation oscillation powered toothbrushes versus manual toothbrushes, Outcome 4 Gingival scores at >3 months.
| Study | Plaque | Gingivitis |
| Costa 2007 | No statistically significant pre‐post differences shown | No statistically significant pre‐post differences shown |
| Gugerli 2007 | "Subjects using a power toothbrush during initial treatment reduced supragingival plaque to lower levels...than subjects using a manual brush" | "Subjects using a power toothbrush ...showed significantly less bleeding on probing than subjects using a manual brush" |
| Zimmer 2005 | Median change in Quigely‐Hein at 4 weeks: Powered (Cybersonic): 0.23 Powered (Braun 3D Excel): 0.07 Manual: 0.22 Median change in Quigely‐Hein at 8 weeks: Powered (Cybersonic): 0.41 Powered (Braun 3D Excel): 0.08 Manual: 0.35 All indices showed statistically significant reductions for both power | Median change in papillary bleeding index at 4 weeks: Powered (Cybersonic): 0.25 Powered (Braun 3D Excel): 0.02 Manual: 0.39 Median change in papillary bleeding index at 8 weeks: Powered (Cybersonic): 0.36 Powered (Braun 3D Excel): 0.10 Manual: 0.61 |
Comparison 4 Rotation oscillation powered toothbrushes versus manual toothbrushes, Outcome 5 Rotation oscillation versus manual: data not suitable for meta‐analysis.

Comparison 5 Circular powered toothbrushes versus manual toothbrushes, Outcome 1 Plaque scores at 1 to 3 month at all sites.

Comparison 5 Circular powered toothbrushes versus manual toothbrushes, Outcome 2 Gingival scores at 1 to 3 months at all sites.

Comparison 6 Ionic toothbrushes versus manual toothbrushes, Outcome 1 Plaque scores at 1 to 3 months.

Comparison 6 Ionic toothbrushes versus manual toothbrushes, Outcome 2 Plaque scores at >3 months at all sites.

Comparison 6 Ionic toothbrushes versus manual toothbrushes, Outcome 3 Gingivitis at 1 to 3 months.
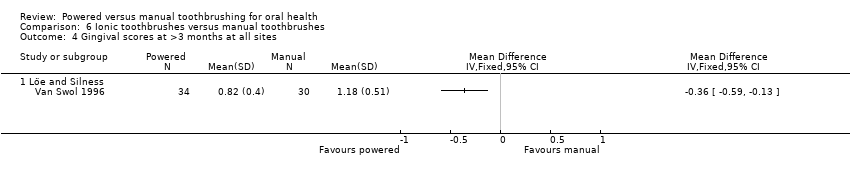
Comparison 6 Ionic toothbrushes versus manual toothbrushes, Outcome 4 Gingival scores at >3 months at all sites.
| Study | Plaque | Gingivitis |
| Galgut 1996 | The electrically active toothbrushes better plaque removal than the inactive toothbrushes (6.5% more plaque removal at final visit) | Not reported |
| Moreira 2007 | Frequency distribution for plaque zero at baseline and 28 days was 9.27+/‐ 10.14/17.75+/‐9.60 and 8.42+/‐10.43/16.79+/‐8.93 for ionic and conventional toothbrushes respectively | Not reported |
Comparison 6 Ionic toothbrushes versus manual toothbrushes, Outcome 5 Ionic versus manual: data not suitable for meta‐analysis.

Comparison 7 Ultrasonic powered toothbrushes versus manual toothbrushes, Outcome 1 Plaque scores at 1 to 3 month at all sites.

Comparison 7 Ultrasonic powered toothbrushes versus manual toothbrushes, Outcome 2 Gingival scores at 1 to 3 months at all sites.

Comparison 7 Ultrasonic powered toothbrushes versus manual toothbrushes, Outcome 3 Plaque scores at >3 months at all sites.
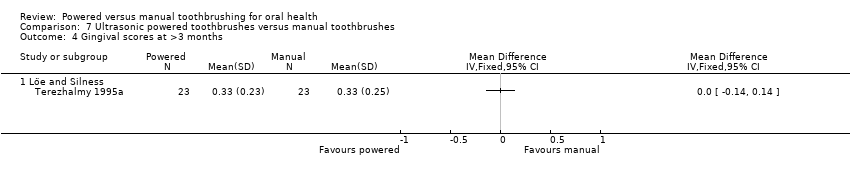
Comparison 7 Ultrasonic powered toothbrushes versus manual toothbrushes, Outcome 4 Gingival scores at >3 months.
| Study | Plaque | Gingivitis |
| Costa 2007 | "There was a significant difference for the ultrasonic/buccal group indicating that the ultrasonic brush improved plaque reduction on the buccal surfaces (p=0.007, Wilcoxon test)" | Marginal bleeding: "No significant differences were noted in the nine subgroups (p>0.05, Wilcoxon test)" |
| Zimmer 2005 | "Improvements of the indices after 4 and 8 weeks were calculated for comparison between groups. After 4 and 8 weeks, with respect to all indices, the use of the power toothbrushes resulted in improvements which were statistically significant superior to what was found for the manual brush (p<0.001)." Results were presented as box‐plots with medians and 25, 75 percentiles. Non‐parametric tests have been used for the data analysis | "Improvements of the indices after 4 and 8 weeks were calculated for comparison between groups. After 4 and 8 weeks, with respect to all indices, the use of the power toothbrushes resulted in improvements which were statistically significant superior to what was found for the manual brush (p<0.001)." Results were presented as box‐plots with medians and 25, 75 percentiles. Non‐parametric tests have been used for the data analysis |
Comparison 7 Ultrasonic powered toothbrushes versus manual toothbrushes, Outcome 5 Ultrasonic versus manual: data not suitable for meta‐analysis.
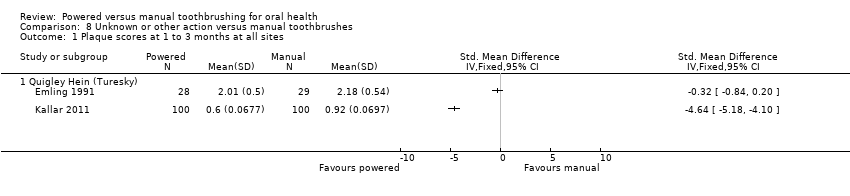
Comparison 8 Unknown or other action versus manual toothbrushes, Outcome 1 Plaque scores at 1 to 3 months at all sites.

Comparison 8 Unknown or other action versus manual toothbrushes, Outcome 2 Gingival scores at 1 to 3 months at all sites.
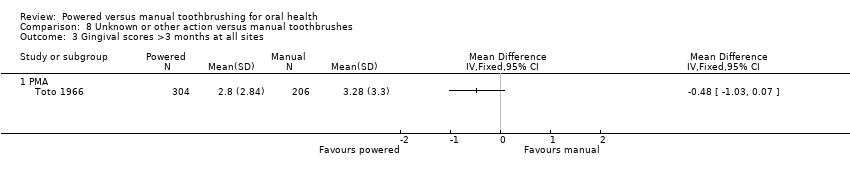
Comparison 8 Unknown or other action versus manual toothbrushes, Outcome 3 Gingival scores >3 months at all sites.
| Powered toothbrushes compared with manual toothbrushes for oral health | ||||||
| Patient or population: Individuals of any age with no reported disability that might affect toothbrushing Intervention: Powered toothbrushes with any mode of action Comparison: Manual toothbrushes | ||||||
| Outcomes | Illustrative comparative risks* (95% CI) | Relative effect | No of participants | Quality of the evidence | Comments | |
| Assumed risk | Corresponding risk | |||||
| Manual toothbrush | Powered toothbrush | |||||
| Plaque scores at 1 to 3 months Scale from: 0 to 5 | The mean plaque score in the control group was 2.16 points1 | The mean plaque score in the intervention groups was | 2871 (40 studies) | ⊕⊕⊕⊝ | This effect represents an 11% reduction in plaque at 1 to 3 months Long‐term data (>3 months) also showed a statistically significant reduction in plaque for powered toothbrushes compared to manual toothbrushes | |
| Gingival scores at 1 to 3 months Scale from: 0 to 3 | The mean gingivitis score in the control group was 1.1 points2 | The mean gingivitis score in the intervention groups was | 3345 | ⊕⊕⊕⊝ | This effect represents a 6% reduction in gingivitis at 1 to 3 months Long‐term data (>3 months) also showed a statistically significant reduction in gingivitis for powered toothbrushes compared to manual toothbrushes | |
| Adverse events | There was no apparent relationship between the use of powered toothbrushes and soft tissue trauma. In part this finding was due to the very small number of adverse events reported in the trials | |||||
| *The basis for the assumed risk (e.g. the median control group risk across studies) is provided in footnotes. The corresponding risk (and its 95% confidence interval) is based on the assumed risk in the comparison group and the relative effect of the intervention (and its 95% CI) | ||||||
| GRADE Working Group grades of evidence | ||||||
| 1. Based on median of control means for all trials presenting data using Quigley Hein index at 1 to 3 months 2. Based on median of control means for all trials presenting data using Löe and Silness index at 1 to 3 months 3. Downgraded due to statistically significant heterogeneity (I2 = 83% for plaque; I2 = 82% for gingivitis) 4. No downgrading was undertaken for risk of bias although 46/56 included trials were assessed as being at unclear risk of bias. Given that many of the studies were conducted over 10 years ago, it was felt much of the uncertainty may be due to poor reporting | ||||||
| Inclusion criteria | Number (n = 56) |
| Adults | 43 |
| Minimum number of teeth | 31 |
| Minimum periodontal baseline measures | 28 |
| Participants recruited from dental clinics | 9 |
| Concurrent fixed orthodontic treatment | 8 |
| Some participants aged less than 16 years | 11 |
| Volunteer university students | 3 |
| Dental students | 2 |
| School children | 3 |
| Exclusion criteria1 | Number (n = 56) |
| Exclusion criteria related to medical history | 31 |
| Pregnancy or lactation | 5 |
| Previous use of powered toothbrushes | 6 |
| Patients undergoing orthodontic treatment | 9 |
| Previous periodontal treatment | 3 |
| Dental students | 2 |
| Cervical restorations | 1 |
| Smoking | 3 |
| Maximum periodontal measure | 8 |
| Wearing partial denture | 2 |
| 1 Not all trials explicitly stated exclusion criteria | |
| Mode of action | Trial ID | Number of trials | Number in trials |
| Side to side | Glass 1965, Ho 1997, Johnson 1994, Lobene 1964, McCracken 2009, Moritis 2008, O'Beirne 1996, Tritten 1996, Walsh 1989, Yankell 1997 | 10 | 988 |
| Counter oscillation | Baab 1989, Khocht 1992, Stabholz 1996, Wilson 1993, Yukna 1993 | 5 | 267 |
| Rotation oscillation | Ainamo 1997, Barnes 1993, Biavati Silvestrini 2010, Biesbrock 2007, Clerehugh 1998, Costa 2007, Cronin 1998, Dentino 2002, Dorfer 2009, Garcia‐Godoy 2001, Gugerli 2007, Haffajee 2001a, Heasman 1999, Hickman 2002, Lapiere unpublished, Lazarescu unpublished, McCracken 2004, Rosema 2008, Sharma 2000, Silverman 2004, Soparkar 2000, Sowinski 2000, Stoltze 1994, van der Weijden 1994, Warren 2001, Yankell 1997, Zimmer 2005 | 27 | 2159 |
| Circular | Khocht 1992, Yankell 1996 | 2 | 162 |
| Ultrasonic | Costa 2007, Forgas‐B 1998, Goyal 2007, Sharma 2010, Terezhalmy 1995, Zimmer 2002, Zimmer 2005 | 7 | 506 |
| Unknown | Emling 1991, Kallar 2011, Singh unpublished, Soparkar 1964, Toto 1966 | 5 | 1130 |
| Ionic | Galgut 1996, Moreira 2007, Pucher 1999, van Swol 1996 | 4 | 221 |
| Four trials evaluated two powered toothbrushes | |||
| Index | Group selected | Number of trials | SMD | Effect P value | Het. P value | I2 |
| Plaque 1‐3 months | All trials | 40 | ‐0.50 (‐0.70 to ‐0.31) | <0.0001 | <0.0001 | 88 |
| Full mouth | 34 | ‐0.58 (‐0.80 to ‐0.36) | <0.0001 | <0.0001 | 85 | |
| Low risk of bias | 3 | ‐0.83 (‐2.02 to 0.36) | 0.17 | <0.0001 | 94 | |
| Manufacturer funded | 26 | ‐0.56 (‐0.82 to ‐0.29) | <0.0001 | <0.0001 | 88 | |
| Trials excluding ortho patients | 36 | ‐0.46 (‐0.66 to ‐0.27) | <0.0001 | <0.0001 | 83 | |
| Plaque >3 months | All trials | 14 | ‐0.37 (‐0.50 to ‐0.24) | <0.0001 | <0.0001 | 86 |
| Full mouth | 13 | ‐0.39 (‐0.53 to ‐0.26) | <0.0001 | <0.0001 | 87 | |
| Low risk of bias | 2 | 0.12 (‐0.27 to 0.52) | 0.53 | 0.51 | 0 | |
| Manufacturer funded | 9 | ‐0.41 (‐0.56 to ‐0.25) | <0.0001 | <0.0001 | 91 | |
| Trials excluding ortho patients | 14 (all) | ‐0.37 (‐0.50 to ‐0.24) | <0.0001 | <0.0001 | 86 | |
| Gingivitis 1‐3 months | All trials | 44 | ‐0.43 (‐0.60 to ‐0.25) | <0.0001 | <0.0001 | 82 |
| Full mouth | 35 | ‐0.47 (‐0.68 to ‐0.25) | <0.0001 | <0.0001 | 85 | |
| Low risk of bias | 3 | ‐0.96 (‐1.95 to 0.03) | 0.06 | <0.0001 | 93 | |
| Manufacturer funded | 32 | ‐0.47 (‐0.68 to ‐0.26) | <0.0001 | <0.0001 | 84 | |
| Trials excluding ortho patients | 38 | ‐0.42 (‐0.61 to ‐0.23) | <0.0001 | <0.0001 | 83 | |
|
| ||||||
| Gingivitis >3 months | All trials | 16 | ‐0.21 (‐0.31 to ‐0.12) | <0.0001 | <0.0001 | 51 |
| Full mouth | 14 | ‐0.25 (‐0.37 to ‐0.13) | <0.0001 | 0.006 | 56 | |
| Low risk of bias | 2 | ‐0.12 (‐0.52 to 0.27) | 0.54 | 0.52 | 0 | |
| Manufacturer funded | 10 | ‐0.21 (‐0.35 to ‐0.07) | 0.003 | 0.003 | 68 | |
| Trials excluding ortho patients | 16 (all) | ‐0.21 (‐0.31 to ‐0.12) | <0.0001 | <0.0001 | 51 | |
| SMD = standardised mean difference | ||||||
| Outcome or subgroup title | No. of studies | No. of participants | Statistical method | Effect size |
| 1 Plaque scores at 1 to 3 month at all sites Show forest plot | 40 | 2871 | Std. Mean Difference (IV, Random, 95% CI) | ‐0.50 [‐0.70, ‐0.31] |
| 1.1 Quigley Hein (Turesky) | 28 | 2000 | Std. Mean Difference (IV, Random, 95% CI) | ‐0.39 [‐0.56, ‐0.22] |
| 1.2 Silness and Löe | 6 | 431 | Std. Mean Difference (IV, Random, 95% CI) | ‐0.94 [‐1.83, ‐0.05] |
| 1.3 Visible plaque index Ainamo Bay | 1 | 111 | Std. Mean Difference (IV, Random, 95% CI) | ‐0.26 [‐0.63, 0.12] |
| 1.4 Ortho modification of Silness and Löe | 1 | 60 | Std. Mean Difference (IV, Random, 95% CI) | 0.0 [‐0.51, 0.51] |
| 1.5 Navy plaque index mod Rustogi | 3 | 249 | Std. Mean Difference (IV, Random, 95% CI) | ‐1.13 [‐1.94, ‐0.31] |
| 1.6 O'Leary index | 1 | 20 | Std. Mean Difference (IV, Random, 95% CI) | ‐1.81 [‐2.88, ‐0.73] |
| 2 Gingival scores at 1 to 3 months at all sites Show forest plot | 44 | 3345 | Std. Mean Difference (IV, Random, 95% CI) | ‐0.43 [‐0.60, ‐0.25] |
| 2.1 Löe and Silness | 30 | 2109 | Std. Mean Difference (IV, Random, 95% CI) | ‐0.46 [‐0.66, ‐0.25] |
| 2.2 Lobene gingival index | 8 | 907 | Std. Mean Difference (IV, Random, 95% CI) | ‐0.43 [‐0.88, 0.03] |
| 2.3 BOP | 3 | 159 | Std. Mean Difference (IV, Random, 95% CI) | ‐0.19 [‐0.50, 0.12] |
| 2.4 Papillary bleeding index 0‐4 scale | 2 | 95 | Std. Mean Difference (IV, Random, 95% CI) | ‐0.11 [‐1.55, 1.33] |
| 2.5 BOMP 0‐2 scale | 1 | 75 | Std. Mean Difference (IV, Random, 95% CI) | ‐0.58 [‐1.04, ‐0.12] |
| 3 Plaque scores at >3 months Show forest plot | 14 | 978 | Std. Mean Difference (IV, Random, 95% CI) | ‐0.47 [‐0.82, ‐0.11] |
| 3.1 Quigley Hein (Turesky) | 11 | 736 | Std. Mean Difference (IV, Random, 95% CI) | ‐0.51 [‐0.97, ‐0.04] |
| 3.2 Silness and Löe | 2 | 131 | Std. Mean Difference (IV, Random, 95% CI) | ‐0.38 [‐1.09, 0.34] |
| 3.3 Visible plaque index Ainamo Bay | 1 | 111 | Std. Mean Difference (IV, Random, 95% CI) | ‐0.28 [‐0.66, 0.09] |
| 4 Gingival scores at >3 months Show forest plot | 16 | 1645 | Std. Mean Difference (IV, Fixed, 95% CI) | ‐0.21 [‐0.31, ‐0.12] |
| 4.1 Löe and Silness | 5 | 318 | Std. Mean Difference (IV, Fixed, 95% CI) | ‐0.27 [‐0.49, ‐0.05] |
| 4.2 Lobene gingival index | 4 | 440 | Std. Mean Difference (IV, Fixed, 95% CI) | ‐0.14 [‐0.33, 0.04] |
| 4.3 BOP | 4 | 270 | Std. Mean Difference (IV, Fixed, 95% CI) | ‐0.46 [‐0.70, ‐0.22] |
| 4.4 Papillary bleeding index 0‐4 scale | 1 | 32 | Std. Mean Difference (IV, Fixed, 95% CI) | 0.65 [‐0.07, 1.36] |
| 4.5 BOMP 0‐2 scale | 1 | 75 | Std. Mean Difference (IV, Fixed, 95% CI) | ‐0.24 [‐0.69, 0.22] |
| 4.6 PMA | 1 | 510 | Std. Mean Difference (IV, Fixed, 95% CI) | ‐0.16 [‐0.34, 0.02] |
| Outcome or subgroup title | No. of studies | No. of participants | Statistical method | Effect size |
| 1 Plaque scores at 1 to 3 month at all sites Show forest plot | 7 | 570 | Std. Mean Difference (IV, Random, 95% CI) | ‐0.27 [‐0.77, 0.23] |
| 1.1 Quigley Hein (Turesky) | 4 | 324 | Std. Mean Difference (IV, Random, 95% CI) | ‐0.14 [‐0.36, 0.08] |
| 1.2 Silness and Löe | 3 | 246 | Std. Mean Difference (IV, Random, 95% CI) | ‐0.78 [‐2.25, 0.68] |
| 2 Gingival scores at 1 to 3 months at all sites Show forest plot | 9 | 795 | Std. Mean Difference (IV, Random, 95% CI) | ‐0.32 [‐0.81, 0.17] |
| 2.1 Löe and Silness | 6 | 385 | Std. Mean Difference (IV, Random, 95% CI) | ‐0.28 [‐0.88, 0.32] |
| 2.2 Lobene gingival index | 3 | 410 | Std. Mean Difference (IV, Random, 95% CI) | ‐0.39 [‐1.24, 0.46] |
| 3 Plaque scores at >3 months Show forest plot | 3 | 272 | Std. Mean Difference (IV, Fixed, 95% CI) | 0.02 [‐0.21, 0.26] |
| 3.1 Quigley Hein (Turesky) | 2 | 218 | Std. Mean Difference (IV, Fixed, 95% CI) | 0.03 [‐0.24, 0.30] |
| 3.2 Silness and Löe | 1 | 54 | Std. Mean Difference (IV, Fixed, 95% CI) | 0.0 [‐0.53, 0.53] |
| 4 Gingival scores at >3 months Show forest plot | 3 | 272 | Std. Mean Difference (IV, Fixed, 95% CI) | 0.10 [‐0.14, 0.34] |
| 4.1 Löe and Silness | 1 | 54 | Std. Mean Difference (IV, Fixed, 95% CI) | 0.0 [‐0.53, 0.53] |
| 4.2 Lobene gingival index | 1 | 166 | Std. Mean Difference (IV, Fixed, 95% CI) | 0.16 [‐0.14, 0.47] |
| 4.3 BOP | 1 | 52 | Std. Mean Difference (IV, Fixed, 95% CI) | 0.0 [‐0.54, 0.54] |
| Outcome or subgroup title | No. of studies | No. of participants | Statistical method | Effect size |
| 1 Plaque scores at 1 to 3 month at all sites Show forest plot | 4 | Mean Difference (IV, Random, 95% CI) | Subtotals only | |
| 1.1 Quigley Hein (Turesky) | 4 | 184 | Mean Difference (IV, Random, 95% CI) | ‐0.03 [‐0.15, 0.10] |
| 2 Gingivitis scores at 1 to 3 months at all sites Show forest plot | 4 | 172 | Std. Mean Difference (IV, Fixed, 95% CI) | 0.01 [‐0.30, 0.31] |
| 2.1 Löe and Silness | 2 | 103 | Std. Mean Difference (IV, Fixed, 95% CI) | 0.01 [‐0.39, 0.40] |
| 2.2 Lobene gingival index | 1 | 40 | Std. Mean Difference (IV, Fixed, 95% CI) | ‐0.03 [‐0.65, 0.59] |
| 2.3 BOP | 1 | 29 | Std. Mean Difference (IV, Fixed, 95% CI) | 0.06 [‐0.68, 0.79] |
| 3 Plaque scores at >3 months Show forest plot | 2 | Mean Difference (IV, Fixed, 95% CI) | Subtotals only | |
| 3.1 Quigley Hein (Turesky) | 2 | 69 | Mean Difference (IV, Fixed, 95% CI) | ‐0.27 [‐0.48, ‐0.07] |
| 4 Gingival scores at >3 months Show forest plot | 2 | 69 | Std. Mean Difference (IV, Fixed, 95% CI) | ‐0.19 [‐0.66, 0.29] |
| 4.1 Lobene gingival index | 1 | 40 | Std. Mean Difference (IV, Fixed, 95% CI) | ‐0.18 [‐0.80, 0.44] |
| 4.2 BOP | 1 | 29 | Std. Mean Difference (IV, Fixed, 95% CI) | ‐0.19 [‐0.93, 0.54] |
| Outcome or subgroup title | No. of studies | No. of participants | Statistical method | Effect size |
| 1 Plaque scores at 1 to 3 month at all sites Show forest plot | 20 | 1404 | Std. Mean Difference (IV, Random, 95% CI) | ‐0.53 [‐0.74, ‐0.31] |
| 1.1 Quigley Hein (Turesky) | 13 | 979 | Std. Mean Difference (IV, Random, 95% CI) | ‐0.44 [‐0.69, ‐0.20] |
| 1.2 Silness and Löe | 2 | 115 | Std. Mean Difference (IV, Random, 95% CI) | ‐1.17 [‐2.74, 0.40] |
| 1.3 Visible plaque index Ainamo Bay | 1 | 111 | Std. Mean Difference (IV, Random, 95% CI) | ‐0.26 [‐0.63, 0.12] |
| 1.4 Ortho modification of Silness and Löe | 1 | 60 | Std. Mean Difference (IV, Random, 95% CI) | 0.0 [‐0.51, 0.51] |
| 1.5 Navy plaque index mod Rustogi | 2 | 119 | Std. Mean Difference (IV, Random, 95% CI) | ‐0.72 [‐1.09, ‐0.35] |
| 1.6 O'Leary index | 1 | 20 | Std. Mean Difference (IV, Random, 95% CI) | ‐1.81 [‐2.88, ‐0.73] |
| 2 Gingival scores at 1 to 3 months at all sites Show forest plot | 21 | 1479 | Std. Mean Difference (IV, Random, 95% CI) | ‐0.49 [‐0.73, ‐0.26] |
| 2.1 Löe and Silness | 14 | 952 | Std. Mean Difference (IV, Random, 95% CI) | ‐0.68 [‐0.99, ‐0.38] |
| 2.2 Lobene gingival index | 3 | 290 | Std. Mean Difference (IV, Random, 95% CI) | ‐0.11 [‐0.46, 0.24] |
| 2.3 BOP | 2 | 130 | Std. Mean Difference (IV, Random, 95% CI) | ‐0.25 [‐0.59, 0.10] |
| 2.4 Papillary bleeding index | 1 | 32 | Std. Mean Difference (IV, Random, 95% CI) | 0.65 [‐0.07, 1.36] |
| 2.5 BOMP 0‐2 scale | 1 | 75 | Std. Mean Difference (IV, Random, 95% CI) | ‐0.58 [‐1.04, ‐0.12] |
| 3 Plaque scores at >3 months Show forest plot | 7 | 527 | Std. Mean Difference (IV, Random, 95% CI) | ‐0.66 [‐1.28, ‐0.03] |
| 3.1 Quigley Hein (Turesky) | 5 | 339 | Std. Mean Difference (IV, Random, 95% CI) | ‐0.73 [‐1.69, 0.24] |
| 3.2 Silness and Löe | 1 | 77 | Std. Mean Difference (IV, Random, 95% CI) | ‐0.73 [‐1.19, ‐0.26] |
| 3.3 Visible plaque index Ainamo Bay | 1 | 111 | Std. Mean Difference (IV, Random, 95% CI) | ‐0.28 [‐0.66, 0.09] |
| 4 Gingival scores at >3 months Show forest plot | 8 | 684 | Std. Mean Difference (IV, Fixed, 95% CI) | ‐0.35 [‐0.50, ‐0.20] |
| 4.1 Lobene gingival index | 2 | 234 | Std. Mean Difference (IV, Fixed, 95% CI) | ‐0.36 [‐0.62, ‐0.10] |
| 4.2 BOP | 2 | 189 | Std. Mean Difference (IV, Fixed, 95% CI) | ‐0.64 [‐0.93, ‐0.34] |
| 4.3 Löe and Silness | 2 | 154 | Std. Mean Difference (IV, Fixed, 95% CI) | ‐0.25 [‐0.57, 0.07] |
| 4.4 Papillary bleeding index 0‐4 scale | 1 | 32 | Std. Mean Difference (IV, Fixed, 95% CI) | 0.65 [‐0.07, 1.36] |
| 4.5 BOMP 0‐2 scale | 1 | 75 | Std. Mean Difference (IV, Fixed, 95% CI) | ‐0.24 [‐0.69, 0.22] |
| 5 Rotation oscillation versus manual: data not suitable for meta‐analysis Show forest plot | Other data | No numeric data | ||
| Outcome or subgroup title | No. of studies | No. of participants | Statistical method | Effect size |
| 1 Plaque scores at 1 to 3 month at all sites Show forest plot | 2 | 128 | Std. Mean Difference (IV, Fixed, 95% CI) | ‐0.02 [‐0.37, 0.33] |
| 1.1 Quigley Hein (Turesky) | 2 | 128 | Std. Mean Difference (IV, Fixed, 95% CI) | ‐0.02 [‐0.37, 0.33] |
| 1.2 Silness and Löe | 0 | 0 | Std. Mean Difference (IV, Fixed, 95% CI) | 0.0 [0.0, 0.0] |
| 2 Gingival scores at 1 to 3 months at all sites Show forest plot | 2 | 128 | Std. Mean Difference (IV, Fixed, 95% CI) | ‐0.18 [‐0.53, 0.17] |
| 2.1 Löe and Silness | 1 | 63 | Std. Mean Difference (IV, Fixed, 95% CI) | 0.13 [‐0.36, 0.63] |
| 2.2 Lobene gingival index | 1 | 65 | Std. Mean Difference (IV, Fixed, 95% CI) | ‐0.50 [‐0.99, ‐0.00] |
| Outcome or subgroup title | No. of studies | No. of participants | Statistical method | Effect size |
| 1 Plaque scores at 1 to 3 months Show forest plot | 3 | 186 | Std. Mean Difference (IV, Fixed, 95% CI) | ‐0.57 [‐0.87, ‐0.27] |
| 1.1 Quigley Hein (Turesky) | 2 | 116 | Std. Mean Difference (IV, Fixed, 95% CI) | ‐0.30 [‐0.67, 0.06] |
| 1.2 Silness and Löe | 1 | 70 | Std. Mean Difference (IV, Fixed, 95% CI) | ‐1.07 [‐1.57, ‐0.57] |
| 2 Plaque scores at >3 months at all sites Show forest plot | 1 | Mean Difference (IV, Fixed, 95% CI) | Totals not selected | |
| 2.1 Quigley Hein (Turesky) | 1 | Mean Difference (IV, Fixed, 95% CI) | 0.0 [0.0, 0.0] | |
| 3 Gingivitis at 1 to 3 months Show forest plot | 2 | 116 | Mean Difference (IV, Fixed, 95% CI) | ‐0.01 [‐0.04, 0.02] |
| 3.1 Löe and Silness | 2 | 116 | Mean Difference (IV, Fixed, 95% CI) | ‐0.01 [‐0.04, 0.02] |
| 4 Gingival scores at >3 months at all sites Show forest plot | 1 | Mean Difference (IV, Fixed, 95% CI) | Totals not selected | |
| 4.1 Löe and Silness | 1 | Mean Difference (IV, Fixed, 95% CI) | 0.0 [0.0, 0.0] | |
| 5 Ionic versus manual: data not suitable for meta‐analysis Show forest plot | Other data | No numeric data | ||
| Outcome or subgroup title | No. of studies | No. of participants | Statistical method | Effect size |
| 1 Plaque scores at 1 to 3 month at all sites Show forest plot | 4 | 301 | Std. Mean Difference (IV, Fixed, 95% CI) | ‐1.33 [‐1.59, ‐1.07] |
| 1.1 Quigley Hein (Turesky) | 3 | 171 | Std. Mean Difference (IV, Fixed, 95% CI) | ‐0.97 [‐1.30, ‐0.63] |
| 1.2 Navy plaque index mod Rustogi | 1 | 130 | Std. Mean Difference (IV, Fixed, 95% CI) | ‐1.89 [‐2.30, ‐1.47] |
| 2 Gingival scores at 1 to 3 months at all sites Show forest plot | 5 | 354 | Std. Mean Difference (IV, Fixed, 95% CI) | ‐0.99 [‐1.21, ‐0.76] |
| 2.1 Löe and Silness | 3 | 161 | Std. Mean Difference (IV, Fixed, 95% CI) | ‐0.56 [‐0.88, ‐0.25] |
| 2.2 Lobene gingival index | 1 | 130 | Std. Mean Difference (IV, Fixed, 95% CI) | ‐1.80 [‐2.21, ‐1.39] |
| 2.3 Papillary bleeding index 0‐4 scale | 1 | 63 | Std. Mean Difference (IV, Fixed, 95% CI) | ‐0.82 [‐1.34, ‐0.31] |
| 3 Plaque scores at >3 months at all sites Show forest plot | 1 | Mean Difference (IV, Fixed, 95% CI) | Totals not selected | |
| 3.1 Quigley Hein | 1 | Mean Difference (IV, Fixed, 95% CI) | 0.0 [0.0, 0.0] | |
| 4 Gingival scores at >3 months Show forest plot | 1 | Mean Difference (IV, Fixed, 95% CI) | Totals not selected | |
| 4.1 Löe and Silness | 1 | Mean Difference (IV, Fixed, 95% CI) | 0.0 [0.0, 0.0] | |
| 5 Ultrasonic versus manual: data not suitable for meta‐analysis Show forest plot | Other data | No numeric data | ||
| Outcome or subgroup title | No. of studies | No. of participants | Statistical method | Effect size |
| 1 Plaque scores at 1 to 3 months at all sites Show forest plot | 2 | Std. Mean Difference (IV, Fixed, 95% CI) | Totals not selected | |
| 1.1 Quigley Hein (Turesky) | 2 | Std. Mean Difference (IV, Fixed, 95% CI) | 0.0 [0.0, 0.0] | |
| 2 Gingival scores at 1 to 3 months at all sites Show forest plot | 3 | Std. Mean Difference (IV, Fixed, 95% CI) | Totals not selected | |
| 2.1 Löe and Sillness | 3 | Std. Mean Difference (IV, Fixed, 95% CI) | 0.0 [0.0, 0.0] | |
| 3 Gingival scores >3 months at all sites Show forest plot | 1 | Mean Difference (IV, Fixed, 95% CI) | Totals not selected | |
| 3.1 PMA | 1 | Mean Difference (IV, Fixed, 95% CI) | 0.0 [0.0, 0.0] | |