Escova de dente elétrica comparada com escova comum para a saúde bucal
Resumo
Introdução
A remoção da placa bacteriana é fundamental para a manutenção da saúde bucal. As evidências são conflitantes quanto aos benefícios da escovação manual e elétrica na remoção da placa. Esta é a segunda atualização de uma revisão Cochrane publicada pela primeira vez em 2003, e que já foi atualizada em 2005.
Objetivos
Comparar as escovas de dente manuais e elétricas no uso no dia a dia, por pessoas de qualquer idade, em relação à remoção de placa, à saúde da gengiva, coloração dental e cálculos, confiabilidade, eventos adversos e custos.
Métodos de busca
Nós realizamos buscas nas seguintes bases de dados eletrônicas: Cochrane Oral Health Group’s Trials Register (até 23 de janeiro de 2014), Cochrane Central Register of Controlled Trials (CENTRAL)(The Cochrane Library 2014, Issue 1), MEDLINE via OVID (desde 1946 a 23 de janeiro de 2014), EMBASE via OVID (desde 1980 até 23 de janeiro de 2014) e CINAHL via EBSCO (desde 1980 até 23 de janeiro de 2014). Procuramos por estudos em andamento fazendo buscas nas plataformas de registros de ensaios clínicos US National Institutes of Health Trials Register e WHO Clinical Trials. Não houve restrições de idioma ou data de publicação.
Critério de seleção
Foram incluídos ensaios clínicos randomizados com duração de pelo menos quatro semanas de escovação elétrica não supervisionada versus escovação manual, para a saúde bucal de crianças e adultos.
Coleta dos dados e análises
Utilizamos os procedimentos metodológicos padrão da Colaboração Cochrane. Usamos modelos de efeito randômico quando havia quatro ou mais estudos incluídos na metanálises; caso contrário, usamos os modelos de efeito fixo. Os dados foram classificados como de curto prazo (um a três meses) e de longo prazo (mais do que três meses).
Principais resultados
Um total de 56 estudos preencheram os critérios de inclusão; 51 estudos envolvendo 4.624 participantes contribuíram com dados para metanálise. O risco de viés foi considerado incerto em 46 estudos, baixo em 5 estudos e alto em 5 estudos.
Houve evidência de qualidade moderada de que escovas elétricas, em comparação com as escovas manuais, têm efeito benéfico estatisticamente significante em relação à redução de placa bacteriana tanto em curto prazo (diferença média padronizada, DMP, ‐0,50; intervalo de confiança de 95%, 95% CI, de ‐0,70 a ‐0,31; 40 estudos, n = 2.871) como no longo prazo (DMP ‐0,47, 95% CI ‐0,82 a ‐0,11; 14 estudos, n = 978). Esses resultados correspondem a uma redução de placa da ordem de 11% no curto prazo e 21% a longo prazo, segundo o índice Quigley Hein (Turesky). As duas metanálises tiveram bastante heterogeneidade (I2 = 83% e 86%, respectivamente), que não foi explicada pelos diferentes subgrupos de tipos de escovas elétricas.
Em relação à gengivite, houve evidência de qualidade moderada de que as escovas elétricas, em comparação com as escovas manuais, promovem benefício estatisticamente significante tanto em curto prazo (DMP ‐0,43; 95% CI ‐0,60 a ‐0,25; 44 estudos, n = 3.345) como no longo prazo (DMP ‐0,21 95% CI ‐0,31 a ‐0,12; 16 estudos, n = 1.645). Isso corresponde a uma redução de gengivite de 6% e 11%, respectivamente, segundo o índice Löeand Silness. As duas metanálises tiveram bastante heterogeneidade (I2 = 82% e 51%, respectivamente) que não foi explicada pelos diferentes subgrupos de tipo de escova elétrica.
O número de estudos para cada tipo de escova elétrica variou: movimento de vai e vem lateral (10 estudos), rotação contrária (5 estudos), rotação oscilante (27 estudos), circular (2 estudos), ultrassônica (7 estudos), iônica (4 estudos) e sem detalhes (5 estudos). O maior corpo de evidências foi para as escovas com rotação oscilante, mostrando uma redução estatisticamente significante da placa e da gengivite nos dois períodos em que esses desfechos foram medidos.
Conclusão dos autores
O uso de escova elétrica, comparada com escova manual, reduz mais a placa e a gengivite tanto no curto como no longo prazo. A importância clínica desses achados permanece incerta. Estudos futuros devem procurar seguir as diretrizes metodológicas e padronizar melhor seus desenhos, para melhorar tanto os próprios estudos primários como as futuras metanálises.
O custo, a reprodutibilidade e os efeitos adversos foram relatados de maneira inconsistente nos estudos existentes. Todos os eventos adversos relatados nos estudos incluídos nesta revisão foram localizados e apenas transitórios.
PICO
Resumo para leigos
Escovas de dentes elétricas comparadas com escovas manuais para preservar a saúde da boca
Pergunta da revisão
Esta revisão foi conduzida para avaliar os efeitos de se usar a escova de dentes elétrica em comparação com a escova de dente comum (manual) para preservar a saúde da boca (oral).
Introdução
A boa higiene oral, com uma escovação bem feita que remove a placa bacteriana (um filme grudento que contém bactérias), é importante para prevenir as doenças das gengivas e as cáries dentárias. A placa bacteriana é a principal causa de gengivite (inflamação de gengiva) e está envolvida na progressão da gengivite para periodontite, uma forma mais grave de doença gengival que afeta os tecidos que dão sustentação ao dentes (por exemplo, os ossos). A placa também pode levar a cárie dentária. As doenças das gengivas e as cáries são os principais responsáveis pela perda dos dentes.
Existem diversos tipos de escovas de dentes elétricas disponíveis para o público, variando em preço e modo de ação. Por exemplo, elas podem fazer movimentos de vaivém lateral ou então movimentos circulares. O preço das escovas elétricas também varia bastante. É importante saber se as escovas elétricas são mais efetivas do que as escovas comuns (manuais) para remover a placa, e se o seu uso reduz a inflamação das gengivas (gengivite) e previne ou diminui a progressão dessa inflamação para a periodontite.
Características do estudo
Os autores do Grupo de Saúde Oral da Cochrane realizaram esta revisão de estudos existentes e a evidência está atualizada até 23 de janeiro de 2014. A revisão inclui 56 estudos publicados desde 1964 até 2011, nos quais 5.068 participantes foram randomizados (colocados em diferentes grupos através de sorteio) para receber uma escova elétrica ou uma escova manual. A maioria dos estudos incluiu adultos, e mais de 50% dos estudos usaram um tipo de escova elétrica que fazia movimentos alternados de rotação (rotação oscilante), em que a cabeça da escova girava em uma direção e depois em outra.
Resultados principais
A evidência mostra que existem benefícios em usar a escova elétrica em comparação com a escova manual. Houve redução de 11% na placa bacteriana medida entre um e três meses de uso, e redução de 21% após três meses de uso. Houve redução de 6% dos casos de gengivite em um a três meses de uso e redução de 11% quando a avaliação foi feita após três meses de uso. Os benefícios disso em longo prazo para a saúde dental foram incertos.
Poucos estudos relataram efeitos adversos e, quando relatados, eles foram locais e transitórios.
Qualidade da evidência
A evidência sobre placa e gengivite foi considerada de qualidade moderada.
Authors' conclusions
Summary of findings
| Powered toothbrushes compared with manual toothbrushes for oral health | ||||||
| Patient or population: Individuals of any age with no reported disability that might affect toothbrushing Intervention: Powered toothbrushes with any mode of action Comparison: Manual toothbrushes | ||||||
| Outcomes | Illustrative comparative risks* (95% CI) | Relative effect | No of participants | Quality of the evidence | Comments | |
| Assumed risk | Corresponding risk | |||||
| Manual toothbrush | Powered toothbrush | |||||
| Plaque scores at 1 to 3 months Scale from: 0 to 5 | The mean plaque score in the control group was 2.16 points1 | The mean plaque score in the intervention groups was | 2871 (40 studies) | ⊕⊕⊕⊝ | This effect represents an 11% reduction in plaque at 1 to 3 months Long‐term data (>3 months) also showed a statistically significant reduction in plaque for powered toothbrushes compared to manual toothbrushes | |
| Gingival scores at 1 to 3 months Scale from: 0 to 3 | The mean gingivitis score in the control group was 1.1 points2 | The mean gingivitis score in the intervention groups was | 3345 | ⊕⊕⊕⊝ | This effect represents a 6% reduction in gingivitis at 1 to 3 months Long‐term data (>3 months) also showed a statistically significant reduction in gingivitis for powered toothbrushes compared to manual toothbrushes | |
| Adverse events | There was no apparent relationship between the use of powered toothbrushes and soft tissue trauma. In part this finding was due to the very small number of adverse events reported in the trials | |||||
| *The basis for the assumed risk (e.g. the median control group risk across studies) is provided in footnotes. The corresponding risk (and its 95% confidence interval) is based on the assumed risk in the comparison group and the relative effect of the intervention (and its 95% CI) | ||||||
| GRADE Working Group grades of evidence | ||||||
| 1. Based on median of control means for all trials presenting data using Quigley Hein index at 1 to 3 months 2. Based on median of control means for all trials presenting data using Löe and Silness index at 1 to 3 months 3. Downgraded due to statistically significant heterogeneity (I2 = 83% for plaque; I2 = 82% for gingivitis) 4. No downgrading was undertaken for risk of bias although 46/56 included trials were assessed as being at unclear risk of bias. Given that many of the studies were conducted over 10 years ago, it was felt much of the uncertainty may be due to poor reporting | ||||||
Background
Description of the condition
Periodontal diseases
Periodontal diseases are a diverse family of oral health conditions affecting the periodontium. As the most prevalent periodontal diseases, gingivitis and periodontitis are of major public health importance. Dental plaque is the primary cause of gingivitis (gum inflammation), which is recognised by redness of the gums at the junction with the teeth, together with slight swelling and bleeding from the gingival margin (Farina 2013). Globally, 80% to 90% of adolescents between 15 and 19 years of age have mild to moderate gingivitis, rising to 92% to 97% in adults between 35 and 44 (Petersen 2012).
Gingivitis can progress to involve the periodontal membrane (periodontitis). A pocket between the gingiva and the tooth forms, and with further destruction bone supporting the tooth is eroded. Eventually the tooth becomes mobile and can be lost. This is a slow process and is related to the amount of plaque and calculus present on the tooth surface, mediated by genetic factors, age, and lifestyle choices such as smoking (British Society of Periodontology 2012). Severe periodontitis is the sixth most prevalent condition, affecting 11% of the global population (Marcenes 2013) and tooth loss as a result is found in 5% to 20% of most adult populations worldwide (Petersen 2005).
Dental caries
Caries (decay) in permanent teeth is the most prevalent disease worldwide, with a global prevalence of 35% for all ages combined (Marcenes 2013). Whilst in high‐income countries the prevalence of caries has decreased over the past decade, in lower‐ and middle‐income countries (LMICs) the incidence is increasing due to population growth, an aging population, changing diets and inadequate exposure to fluorides (Marcenes 2013). In the United Kingdom (UK), 85% of adults have at least one filling (Steele 2011) and 31% have obvious untreated caries (White 2011).
The presence of plaque (biofilm) on the tooth is necessary for the development of caries. Like periodontal disease, caries has a complex aetiology, being an interaction between lifestyle, particularly diet and fluoride use, together with host factors. Although the relationship between the presence of plaque and caries is not as clear as with gingivitis, there is clear evidence that the presence of plaque makes teeth more at risk of caries. Zenkner 2013 demonstrated that on erupting teeth with visible plaque accumulation were 14.5 times more likely to have caries than teeth without the presence of visible plaque.
Over twice as many adults who reported not brushing their teeth have caries compared to those who report brushing their teeth twice a day (White 2011). Almost all people in industrialised countries use fluoride toothpaste. When teeth are brushed with a fluoride toothpaste there is clear evidence that this is effective at preventing caries (White 2011) and that this is overall more important than brushing per se (Chesters 1992).
Description of the intervention
Powered versus manual toothbrushing for oral health
Good oral hygiene (the removal of plaque or biofilm from the tooth and gums) by effective toothbrushing has a key role in oral health. In general, populations of high‐income countries have adopted regular toothbrushing (Albertsson 2010). There is, however, substantial within‐country variation correlating strongly with educational level (Chen 1997). Toothbrushing is much less frequent in LMICs but is again associated with social status indicators (McKittrick 2014).
Effective toothbrushing depends on a number of factors including motivation, knowledge and manual dexterity. Powered brushes simulate the manual motion of toothbrushes with lateral and rotary movements of the brush head. Brushes which operate at a higher frequency of vibration have also been introduced (Johnson 1994; Terezhalmy 1995b). Powered toothbrushes were first introduced commercially in the early 1960s (Chilton 1962a; Cross 1962; Elliot 1963; Hoover 1962) and have become established as an alternative to manual methods of toothbrushing. In the UK a quarter of adults report using a powered toothbrush (Chadwick 2011) and use by children may be even higher (White 2004).
How the intervention might work
Dental plaque is the primary cause of gingivitis and is implicated in the progression of periodontitis. Therefore more effective removal of plaque by a powered toothbrush compared to a manual brush will reduce the inflammation of the gums (gingivitis), a benefit in itself, and in the long term may prevent or slow the progression of periodontitis and therefore maintain a functioning dentition for longer (Aspiras 2013).
There is a potential to reduce caries incidence by the effective removal of plaque (Zenkner 2013) but previous reviews on the effectiveness of powered toothbrushes have not identified any studies reporting this outcome (Deacon 2010; Robinson 2005).
Why it is important to do this review
Powered toothbrushes are popular and expensive compared to manual toothbrushes. However, the question remains, which is better, powered or manual? This is an update of the Cochrane review first published in 2003 and previously updated in 2005 comparing powered and manual toothbrushes (Heanue 2003; Robinson 2005). There is also a related review comparing the effectiveness of different designs of powered toothbrushes (Deacon 2010). However, the previous review comparing powered and manual toothbrushes was published in 2005, and there is a requirement to update that review to identify new evidence, and to include any evaluations of new designs of powered toothbrush introduced to the market.
Objectives
To compare manual and powered toothbrushes in everyday use, by people of any age, in relation to the removal of plaque, the health of the gingivae, staining and calculus, dependability, adverse effects and cost.
Methods
Criteria for considering studies for this review
Types of studies
The review is confined to randomised controlled trials comparing manual and powered toothbrushes. It excludes trials only comparing different kinds of powered brushes or those comparing different kinds of manual brushes.
In the current update an agreement was made that cross‐over trials were eligible for inclusion if the wash‐out period length was more than two weeks. This was particularly important to diminish any carry‐over effects of the different toothbrushes on clinical gingivitis. Split‐mouth trials were excluded, as these were not considered representative of 'everyday use'.
Studies were included irrespective of publication status or language.
Types of participants
We included individuals of any age with no reported disability that might affect toothbrushing. We also included individuals wearing orthodontic appliances.
Types of interventions
The toothbrushes included in the review were all forms of manual brushes and all forms of powered brushes. Trials instituting combined interventions, e.g. brushing combined with the use of mouthrinse or irrigation, were excluded. However, trials where participants were permitted to continue with their usual adjuncts to oral hygiene, such as flossing, were included.
Trials were excluded where the brushing intervention was carried out or was supervised by a professional less than 28 days before a follow‐up assessment.
Trials of 28 days and over were eligible and a subgroup analysis was carried out on the duration of trials for the different outcome measures.
Powered toothbrushes were divided into seven groups according to their mode of action.
-
Side to side action, indicates a brush head action that moves laterally from side to side.
-
Counter oscillation, indicates a brush action in which adjacent tufts of bristles (usually six to 10 in number) rotate in one direction and then the other, independently. Each tuft rotating in the opposite direction to that adjacent to it.
-
Rotation oscillation, indicates a brush action in which the brush head rotates in one direction and then the other.
-
Circular, indicates a brush action in which the brush head rotates in one direction.
-
Ultrasonic, indicates a brush action where the bristles vibrate at ultrasonic frequencies (> 20 kHz).
-
Ionic, indicates a brush that aims to impart an electrical charge to the tooth surface with the intent of disrupting the attachment of dental plaque.
-
Unknown, indicates a brush action that the review authors have been unable to establish based on the trial report or confirm with the manufacturers.
An additional group was added in a parallel review of the effectiveness of different powered brushes (Deacon 2010). This 'multidimensional group' included brushes with two of the above action types. Due to the limited number of trials conducted using this brush type, they were considered as part of the rotation oscillation group in this update.
It was agreed from the earlier reviews that analysis of filament arrangement, orientation, size, shape and flexibility, brush head size and shape along with presence or absence and characteristics of a timer would prove difficult to define across time and brush types.
Types of outcome measures
Primary outcomes
The primary outcome measures employed were quantified levels of plaque or gingivitis or both. Where possible, values recorded on arrival at the assessment were used. If necessary, measures of gingivitis taken after participants had been instructed or permitted to brush their teeth at the assessment visit were used as it was assumed that toothbrushing would not affect gingivitis within such a short period. However, measures of plaque taken after participants had been instructed or permitted to brush their teeth at the assessment visit were not used. It was assumed that plaque scores achieved during toothbrushing under these circumstances would not reflect scores achieved in normal home use.
Secondary outcomes
Secondary outcome measures sought were levels of calculus and staining; dependability and cost of the brush used, including mechanical deterioration; and adverse effects such as hard or soft tissue injury and damage to orthodontic appliances and prostheses.
Future updates of this review will include caries as an outcome.
Search methods for identification of studies
For the identification of studies included or considered for this review, we developed a detailed search strategy for each database, based on the strategy developed for MEDLINE (OVID) but revised accordingly. The search strategy used a combination of controlled vocabulary and free text terms and was linked with the Cochrane Highly Sensitive Search Strategy (CHSSS) for identifying randomised trials (RCTs) in MEDLINE: sensitivity maximising version (2008 revision) as referenced in Chapter 6.4.11.1 and detailed in box 6.4.c of the Cochrane Handbook for Systematic Reviews of Interventions, Version 5.1.0 (updated March 2011) (Higgins 2011). Details of the MEDLINE search are provided in Appendix 3. The searches of EMBASE and CINAHL were linked to the Cochrane Oral Health Group filters for identifying RCTs.
Electronic searches
We searched the following electronic databases:
-
the Cochrane Oral Health Group's Trials Register (to 23 January 2014) (Appendix 1);
-
the Cochrane Central Register of Controlled Trials (CENTRAL) (The Cochrane Library 2014, Issue 1) (Appendix 2);
-
MEDLINE via OVID (1946 to 23 January 2014) (Appendix 3);
-
EMBASE via OVID (1980 to 23 January 2014) (Appendix 4);
-
CINAHL via EBSCO (1980 to 23 January 2014) (Appendix 5).
No restrictions were placed on the language or date of publication when searching the electronic databases.
Searching other resources
We searched the following databases for ongoing trials, seeAppendix 6 for details of the search strategy:
-
US National Institutes of Health Trials Register (http://clinicaltrials.gov) (to 23 January 2014);
-
the WHO Clinical Trials Registry Platform (http://apps.who.int/trialsearch/default.aspx) (to 23 January 2014).
Only handsearching done as part of the Cochrane Worldwide Handsearching Programme and uploaded to CENTRAL was included (see the Cochrane Masterlist for details of journal issues searched to date).
All references cited in the included trials were checked for additional studies. Identified manufacturers were contacted and additional published or unpublished trial reports requested.
Data collection and analysis
Selection of studies
Two review authors independently reviewed the titles and abstracts identified in the search. If in the opinion of both authors an article clearly did not fulfil the defined inclusion criteria it was considered ineligible. We obtained full reports of all trials of possible relevance for assessment. On receipt of the full article, two review authors assessed each study independently using specifically designed data extraction forms. Disagreements were resolved by discussion with the review team.
Data extraction and management
For this update, piloting of data extraction was performed independently by two authors on eight pilot articles. However, all authors reported back on the design of the data extraction forms and their interpretation of the inclusion and exclusion criteria along with their understanding of the outcome measures and new risk of bias (ROB) assessment. On the basis of this feedback the data extraction forms were altered and the inclusion, exclusion, outcome measures and ROB assessment were redefined to avoid misinterpretation. All data extraction for the included studies was then undertaken independently and in duplicate.
The final data extraction protocol considered the following information.
-
Bibliographic details of the study.
-
Funding source for the trial. A trial was considered to have been funded by a brush manufacturer if it was reported that any material sponsorship from the manufacturer occurred, including the donation of brushes. It was considered unclear, if there was no statement on funding. A trial was only considered to be unsponsored by a manufacturer if it clearly stated so.
-
Inclusion eligibility.
-
Baseline characteristics of the participants in the study, including age, number of participants in the study and gender. Also, specific groups, such as dental students or orthodontic patients were noted, where mentioned.
-
Intervention characteristics including type of brush and its mode of action, duration of use and delivery of instructions.
-
Outcomes including plaque and gingivitis indices.
-
Additional information on a priori calculation of sample size, duration of study, reliability and validity of outcomes measures and monitoring of compliance.
Trials were considered as 'short term' or 'long term'. 'Short‐term' data included follow‐up between 28 days and three months. 'Long‐term' data included follow‐up beyond three months. Within each category of long term and short term, where a trial reported multiple end points, only the latest data were extracted.
Data from trials that reported follow‐up before and after three months were included in the short‐ and long‐term meta‐analyses. Likewise, data from trials that reported both plaque and gingivitis would be included in meta‐analyses for both outcomes. These were the only circumstances when data from the same trial were considered more than once.
Many different indices of plaque and gingivitis were used across trials and some trials reported multiple indices. A frequencies table was prepared of the indices used and they were ranked based on common usage and simplicity. For plaque we extracted, where possible, data reported as the Turesky modification of the Quigley‐Hein plaque index (Quigley 1962; Turesky 1970). For gingival inflammation we extracted where possible data reported as the gingival index of Löe and Silness (Löe 1963) or, if unavailable, bleeding on probing (Ainamo 1975). Data for Russell's periodontal index were excluded because this index fails to distinguish between gingivitis and periodontitis (Russell 1967).
Where available, data were extracted for whole as opposed to part‐mouth scores. Where only part‐mouth scores were reported in a study, they were extracted and a sensitivity analysis carried out to consider their impact on the results of the review. Part‐mouth scoring was said to have occurred if plaque or gingivitis or both were not recorded around all erupted teeth, except third molars.
Completed data extraction forms were compared. Where there was disagreement between review authors with regard to any part of the extraction details it was resolved by discussion between the authors and a note made on the data collection forms. Any disagreement, unresolved between the two authors, was settled by majority vote of the entire panel of review authors. Authors were contacted for clarification where necessary.
Assessment of risk of bias in included studies
We conducted this assessment using the recommended approach for assessing risk of bias in included studies for Cochrane reviews (Higgins 2011). All included studies were assessed independently and in duplicate by two review authors as part of the data extraction process. The risk of bias tool evaluates six specific domains.
-
Sequence generation (selection bias).
-
Allocation concealment (selection bias).
-
Blinding of outcome assessment (detection bias).
-
Incomplete outcome data (attrition bias).
-
Selective outcome reporting (reporting bias).
-
Other sources of bias; comparability of groups at baseline.
Risk of bias assessment.
-
A trial was considered to have adequately generated a random sequence of allocation, if it fully reported the type of allocation generation and it satisfied the CONSORT guidelines as true randomisation (http://www.consort‐statement.org/).
-
A trial was considered to have adequate blinding, if the report indicated that the method of outcome assessment did not allow the recording clinician to know to which group the participants had been allocated, with no other contradicting statement.
-
Attrition was considered to have been adequately reported if there was a clear indication of how many withdrawals occurred in each group during the trial and an attempt made to give reasons why the withdrawals occurred.
The first part of the entry involved authors' describing what was reported in the study. The second part involved the authors' judgements of the adequacy of the study, that is, whether they are at low, high or unclear risk of bias. Numerical data extracted from the included trials were checked by a third author for accuracy and entered into Review Manager (RevMan) software (RevMan 2012).
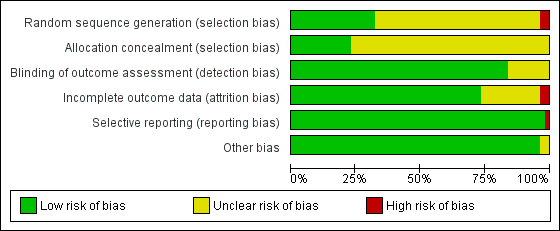
Two risk of bias figures were generated to illustrate the findings of the assessment. A 'Risk of bias graph' illustrated the proportion of studies across the domain with each of the judgements ('low risk', 'high risk', 'unclear risk'). A 'Risk of bias summary' summarised all of the judgements for a study entry. We assumed that the risk of bias of outcomes was equally important both within and across studies. They were assessed as follows.
| Low risk of bias | Interpretation | Within a study | Across studies |
| Low risk of bias | Plausible bias unlikely to seriously alter the results | Low risk of bias for all key domains | Most information is from studies at low risk of bias |
| Unclear risk of bias | Plausible bias that raises some doubt about the results | Unclear risk of bias for one or more key domains | Most information is from studies at low or unclear risk of bias |
| High risk of bias | Plausible bias that seriously weakens confidence in the results | High risk of bias for one or more key domains | The proportion of information from studies at high risk of bias is sufficient to affect the interpretation of results |
Measures of treatment effect
The estimate of effect used was the mean difference (MD) and corresponding 95% confidence intervals (CI). However, different indices for plaque measure the same concept on different scales, with high correlation between the different indices. The same is true for gingivitis. As it is not possible to combine the results from different indices, the effects were expressed as standardised values, which have no units, before combining. The standardised mean difference (SMD) was therefore calculated along with the appropriate 95% CI and was used as the effect measure for each meta‐analysis where results were available for more than one index (Deeks 2001). Where only one index was presented in a comparison, the treatment effect was measured as the MD with 95% CI.
Unit of analysis issues
No units of analysis issues were anticipated other than cross‐over studies which were included using the generic inverse variance (GIV) approach (Elbourne 2002; Higgins 2011).
Dealing with missing data
Trial authors were contacted to retrieve missing data where necessary. Data remain excluded until further clarification becomes available. Standard deviations were imputed as in section 7.7.3 of the Cochrane Handbook for Systematic Reviews of interventions (Higgins 2011).
Assessment of heterogeneity
We assessed heterogeneity by inspection of a graphical display of the estimated treatment effects from the trials along with their 95% CI and by Cochran's test for heterogeneity undertaken before each meta‐analysis as described in the Cochrane Handbook for Systematic Reviews of interventions (Higgins 2011). The heterogeneity was quantified using the I2 statistic, where a guide for interpretation in the Cochrane Handbook for Systematic Reviews of interventions is (Higgins 2011):
-
0% to 40%: might not be important;
-
30% to 60%: may represent moderate heterogeneity;
-
50% to 90%: may represent substantial heterogeneity;
-
75% to 100%: considerable heterogeneity.
Assessment of reporting biases
A funnel plot (plots of effect estimates versus the inverse of their standard errors) was drawn. Asymmetry of the funnel plot may indicate publication bias and other biases related to sample size, though it may also represent a true relationship between trial size and effect size. A formal investigation of the degree of asymmetry was performed using the method proposed by Egger et al (Egger 1997). This was carried out using Stata version 12.0 (Stata Corporation, USA) using the program Metabias.
Data synthesis
Statistical values such as SMD have no inherent clinical meaning. Therefore we back‐translated key effect scores using the clinical indices from a study where the difference was similar to the SMD. Such examples are given in the Discussion. Random‐effects models were performed where four or more studies were to be combined, otherwise fixed‐effect models were used.
Data from cross‐over trials were included with that of similar parallel group trials, using the techniques described by Elbourne and colleagues (Elbourne 2002). This was done using the generic inverse variance method within RevMan (Higgins 2011).
Subgroup analysis and investigation of heterogeneity
Subgroup analyses were undertaken for assessments based on full mouth recording versus those based on a partial recording and to examine the effects of concealed allocation, randomisation generation and blinded outcome assessment on the overall estimates of effect for important outcomes.
Additional subgroup analyses were undertaken to explore heterogeneity. Evidence of variability in any subgroup was further explored by examining funnel plots.
Sensitivity analysis
Sensitivity analyses were conducted to test whether the assumptions involved in the design of this review affected the findings. These analyses were undertaken by repeating the meta‐analyses in the following cases: where a full mouth index had been used, where adequate concealment of randomisation occurred, where there was adequate generation of randomisation sequence, where there was blinding of the outcome assessor, if the trial was funded by a manufacturer, with adequate information about attrition and for trials that were not restricted to participants only wearing fixed orthodontic appliances.
Presentation of main results
A GRADE approach was used to interpret findings. A 'Summary of findings' table was developed for the primary outcomes of this review using GRADE Profiler software (version 3.6). These tables provide information concerning the overall quality of the evidence from the trials, the magnitude of effect of the interventions examined, and the sum of available data on the primary outcomes and secondary outcomes. The outcomes selected for inclusion in these tables were plaque and gingivitis at two time points.
Results
Description of studies
Results of the search
SeeFigure 1.

Flow chart of study selection in this update.
This review was originally published in 2003, updated in 2005 and again for this version. Since its first publication to January 2014 a total of 1195 articles have been identified through the search strategy. After removing duplicates, this number falls to 432; titles and abstracts of these 432 articles were screened for eligibility. A total of 200 full‐text articles were retrieved as potentially relevant trials. Of these, 134 were excluded (Characteristics of excluded studies table) leaving 56 trials, in 66 publications.
In the original review 29 trials, all providing data for meta‐analysis, were included. In the 2005 update, an additional 10 trials were identified as meeting the inclusion criteria (Galgut 1996; Garcia‐Godoy 2001; Hickman 2002; Pucher 1999; Sharma 2000; Soparkar 2000; Sowinski 2000; Toto 1966; Van Swol 1996; Zimmer 2002). Data for three trials identified in the original search was received from the authors allowing their inclusion (Haffajee 2001a; Lapiere unpublished; Singh unpublished). Thus 42 trials were included in the 2005 publication.
In the current update, an additional 15 trials were identified as being eligible (Biavati Silvestrini 2010; Biesbrock 2007; Costa 2007; Dorfer 2009; Goyal 2007; Gugerli 2007; Kallar 2011; McCracken 2004; McCracken 2009; Moreira 2007; Moritis 2008; Rosema 2008; Sharma 2010; Silverman 2004; Zimmer 2005). Fourteen were parallel group designs and there was one cross‐over trial (Moreira 2007). One trial included in the original review was excluded as it was not truly a randomised controlled trial (McAllan 1976), leaving a total of 56 trials included in this 2014 update. Of these 56 trials, five did not present data in a way that allowed for meta‐analysis (Costa 2007; Galgut 1996; Gugerli 2007; Moreira 2007; Zimmer 2005). The meta‐analyses are based on 51 trials with a parallel group design.
Included studies
Of the 56 included trials, 36 were conducted in North America (Baab 1989; Barnes 1993; Biesbrock 2007; Costa 2007; Cronin 1998; Dentino 2002; Emling 1991; Forgas‐B 1998; Garcia‐Godoy 2001; Glass 1965; Goyal 2007; Haffajee 2001a; Ho 1997; Johnson 1994; Khocht 1992; Lobene 1964a; Moreira 2007; O'Beirne 1996; Pucher 1999; Sharma 2000; Sharma 2010; Silverman 2004; Singh unpublished; Soparkar 1964; Soparkar 2000; Sowinski 2000; Terezhalmy 1995a; Toto 1966; Tritten 1996; Van Swol 1996; Walsh 1989; Warren 2001; Wilson 1993; Yankell 1996; Yankell 1997; Yukna 1993b); 18 in Europe (Ainamo 1997; Biavati Silvestrini 2010; Clerehugh 1998; Dorfer 2009; Galgut 1996; Gugerli 2007; Heasman 1999; Hickman 2002; Lapiere unpublished; Lazarescu 2003; McCracken 2004; McCracken 2009; Moritis 2008; Rosema 2008; Stoltze 1994; van der Weijden 1994; Zimmer 2002; Zimmer 2005), one each in Israel (Stabholz 1996) and in India (Kallar 2011).
Three trials remain unpublished (Lapiere unpublished; Lazarescu 2003; Singh unpublished). The remainder were published between 1964 and October 2011; four in the 1960s; one in the 1970s; two in the 1980s; 23 in the 1990s and 19 in the 20th century. At least 37 were funded in some part by the manufacturer of one of the powered toothbrushes, one was funded by government scholarship and the remainder were unclear about sponsorship.
The combined total number of participants included in the trials was 5068. The number of patients reported lost to follow‐up was 334 (6.6%).
Characteristics of participants
The characteristics of participants in each study are noted in the Characteristics of included studies table and in Additional Table 1. Out of the 56 included trials the four most frequently stated inclusion criteria were adults (77% of trials), no relevant medical history (55%), a stated minimum number of teeth (55%) and a criterion related to gingival or periodontal health or plaque at baseline (50%). Exclusion criteria used in the included trials were noted and are summarised in Additional Table 2. Only seven trials included orthodontic patients (Biavati Silvestrini 2010; Clerehugh 1998; Costa 2007; Hickman 2002; Ho 1997; Pucher 1999; Singh unpublished).
| Inclusion criteria | Number (n = 56) |
| Adults | 43 |
| Minimum number of teeth | 31 |
| Minimum periodontal baseline measures | 28 |
| Participants recruited from dental clinics | 9 |
| Concurrent fixed orthodontic treatment | 8 |
| Some participants aged less than 16 years | 11 |
| Volunteer university students | 3 |
| Dental students | 2 |
| School children | 3 |
| Exclusion criteria1 | Number (n = 56) |
| Exclusion criteria related to medical history | 31 |
| Pregnancy or lactation | 5 |
| Previous use of powered toothbrushes | 6 |
| Patients undergoing orthodontic treatment | 9 |
| Previous periodontal treatment | 3 |
| Dental students | 2 |
| Cervical restorations | 1 |
| Smoking | 3 |
| Maximum periodontal measure | 8 |
| Wearing partial denture | 2 |
1 Not all trials explicitly stated exclusion criteria
Characteristics of interventions
The powered toothbrushes, included:
Braun, Interplak, Braun Plaque Remover with OD5 head, Braun Oral B Pro Care series, Oral B CrossAction, Braun Oral B Pro Care 8500, Braun Oral B D25, Braun Oral B 3D, Braun Oral B D9, PlaK Trac, Ultrasonex, GEC, Braun Oral B D7, Philips Jordan HP 735, Philips HP 550, Sonicare Ultrasonic, Philips Sonicare, Philips Sensiflex 2000, Philips Sonicare Elite, Epident, Braun Oral B D5, Philips 550, Touchtronic Teledyne Aqua Tec, Ronson, Dominion, Pulse Plaque Remover, Broxodent, Plaq and White, LPA/Broxo, Braun D17, Rowenta Dentiphant, Rowenta, Plaque Dentacontrol Plus, Sangi Co Electronic, Braun Oral B D10, Braun Oral B D15 Plaque Remover, Braun Plaque Remover 3D with orthodontic head, Oral B Mickey Mouse, Hukuba Ionic, Colgate Actibrush, HyG Ionic, unspecified ionic, Ultra Sonex Ultima, Ultreo, Sunbeam cordless. These are summarised in Additional Table 3.
| Mode of action | Trial ID | Number of trials | Number in trials |
| Side to side | Glass 1965, Ho 1997, Johnson 1994, Lobene 1964, McCracken 2009, Moritis 2008, O'Beirne 1996, Tritten 1996, Walsh 1989, Yankell 1997 | 10 | 988 |
| Counter oscillation | Baab 1989, Khocht 1992, Stabholz 1996, Wilson 1993, Yukna 1993 | 5 | 267 |
| Rotation oscillation | Ainamo 1997, Barnes 1993, Biavati Silvestrini 2010, Biesbrock 2007, Clerehugh 1998, Costa 2007, Cronin 1998, Dentino 2002, Dorfer 2009, Garcia‐Godoy 2001, Gugerli 2007, Haffajee 2001a, Heasman 1999, Hickman 2002, Lapiere unpublished, Lazarescu unpublished, McCracken 2004, Rosema 2008, Sharma 2000, Silverman 2004, Soparkar 2000, Sowinski 2000, Stoltze 1994, van der Weijden 1994, Warren 2001, Yankell 1997, Zimmer 2005 | 27 | 2159 |
| Circular | Khocht 1992, Yankell 1996 | 2 | 162 |
| Ultrasonic | Costa 2007, Forgas‐B 1998, Goyal 2007, Sharma 2010, Terezhalmy 1995, Zimmer 2002, Zimmer 2005 | 7 | 506 |
| Unknown | Emling 1991, Kallar 2011, Singh unpublished, Soparkar 1964, Toto 1966 | 5 | 1130 |
| Ionic | Galgut 1996, Moreira 2007, Pucher 1999, van Swol 1996 | 4 | 221 |
Four trials evaluated two powered toothbrushes
Powered toothbrush, mode of action
The powered toothbrushes were subdivided into the seven groups according to their mode of action.
Side to side action
Philips Sonicare, Philips Sonicare Elite and Sonicare brushes (Sonicare c/o Philips Oral Healthcare, 35301 SE Center Street, Snoqualmie, WA 98065; http://www.sonicare.com/); Philips 550 (Philips Jordan, PO Box 324, 5500 AH Veldhoven, The Netherlands; http://www.philips‐jordan.com/) and Philips Sensiflex 2000 (http://www.philips.co.uk/c/electric‐toothbrushes/sensiflex‐hx1610_05/prd/).
Counter oscillation
Interplak brush (Interplak Conair Corporation, 1 Cummings Point Road, Stamford, CT 06904; http://www.conair.com/products/).
Rotation oscillation
Oral B CrossAction, Braun Oral B 3D, D17, Plaque Remover with OD5 head, Oral B D9, Oral B D7, Oral B D5, Oral B D10, Oral B D25, Oral B Pro Care 8500, Oral B Mickey Mouse, Braun Plaque Remover 3D with orthodontic head, Braun Oral B D15 Plaque Remover (Braun Oral B Consumer Services, 1 Gillette Park, South Boston, MA; http://www.oralb.com/); Philips Jordan HP 735, Philips HP 550 (Philips Jordan PO Box 324, 5500 AH Veldhoven, The Netherlands; http://www.philips‐jordan.com/); Colgate Actibrush (Consumer Affairs, Colgate‐Palmolive (UK) Limited, Guildford Business Park, Middleton Road, Guildford, Surrey GU2 8JZ UK; http://www.colgate.co.uk/contact/index.shtml).
Circular
Rowenta Dentiphant, Rowenta, Plaque Dentacontrol Plus (Rowenta Werke GmbH, Franz Alban, Stützer, Germany; http://www.products.rowenta.de/row/index.html); Epident (EPI Products, Santa Monica, CA).
Ultrasonic
Ultrasonex brush, Ultra Sonex Ultima (Salton‐Maxim 1801 N Stadium Boulevard, Columbia, MO 65202; http://www.salton‐maxim.com/salton/ultrasonex/ultrasonex.asp) and Ultreo (http://www.ultreo.com/meet‐ultreo), Oral B Pulsonic.
Ionic
Sangi Co Electronic (Tokyo), Hukuba Ionic and the HyG Ionic (Hukuba Dental Corporation, 914‐1 Nazukari, Nagareyama, Chiba, 270‐01 Japan).
Unknown
Some companies are no longer trading or complete details of the relevant toothbrushes are not easily found. The following toothbrushes fall into this latter category: PlaK Trac, GEC, Epident, Touchtronic, Ronson, Dominion, Broxodent, Plaq and White, LPA/Broxo, Sunbeam cordless.
The names and addresses of the manufacturers have changed over the years and those quoted above are correct at the time of the present review. Some of the trials were conducted when another company made the powered toothbrush.
Ten trials recruiting 988 participants compared manual brushing versus side to side powered toothbrushing. Five trials recruited 267 participants and compared manual brushing versus counter oscillating toothbrushing. Twenty‐seven trials recruiting 2159 participants compared manual brushing versus rotation oscillation powered brushing. Two trials recruiting 162 participants compared manual brushing versus circular powered brushing and seven trials recruiting 506 participants compared manual brushing versus ultrasonic powered brushing. Four trials recruiting 221 participants compared manual brushing versus ionic brushing. Five trials recruiting 1130 participants compared manual brushing and a powered toothbrush with an unknown action. It should be noted that four trials evaluated two powered brushes (Costa 2007; Khocht 1992; Yankell 1997; Zimmer 2005).
Summary of trials by toothbrush action
See Additional Table 3 for list of trials by mode of action.
Characteristics of outcome measures
Forty trials (2871 participants at the end of the trials) provided data for analysis on plaque at one to three months and 14 trials (978 participants at the end of the trials) provided data at longer than three months. Forty‐four trials (3345 participants at the end of the trials) provided data for analysis on gingivitis at one to three months and 16 trials (1645 participants at the end of the trials) provided data at longer than three months.
If it was not stated that a full or partial mouth index was used, we assumed it was full mouth. Fifty‐four trials reported plaque data, and of these eight trials reported that a partial mouth assessment was used. Fifty‐two trials reported gingivitis data and 10 of these reported using a partial mouth index.
The following plaque indices were reported.
-
Quigley Hein (Turesky) (Barnes 1993; Cronin 1998; Dentino 2002; Dorfer 2009; Emling 1991; Forgas‐B 1998; Garcia‐Godoy 2001; Glass 1965; Haffajee 2001a; Heasman 1999; Johnson 1994; Kallar 2011; Khocht 1992; Lapiere unpublished; Lazarescu 2003; McCracken 2004; McCracken 2009; Pucher 1999; Rosema 2008; Silverman 2004; Sowinski 2000; Terezhalmy 1995a; Tritten 1996; Van Swol 1996; Warren 2001; Wilson 1993; Yankell 1996; Yankell 1997; Yukna 1993b; Zimmer 2002.
-
Silness and Löe (Galgut 1996; Ho 1997; Moritis 2008; Stoltze 1994; van der Weijden 1994; Walsh 1989).
-
Visible plaque index Ainamo Bay (Ainamo 1997).
-
Ortho modification of Silness and Löe (Hickman 2002).
-
Navy plaque index mod Rustogi (Biesbrock 2007; Sharma 2000; Sharma 2010).
-
O'Leary index (Biavati Silvestrini 2010).
The following gingivitis indices were reported.
-
Löe Silness (Baab 1989; Barnes 1993; Biesbrock 2007; Clerehugh 1998; Cronin 1998; Dorfer 2009; Emling 1991; Forgas‐B 1998; Goyal 2007; Haffajee 2001a; Heasman 1999; Hickman 2002; Ho 1997; Johnson 1994; Khocht 1992; Lapiere unpublished; Moritis 2008; O'Beirne 1996; Pucher 1999; Sharma 2000; Silverman 2004; Singh unpublished; Soparkar 1964; Soparkar 2000; Stoltze 1994; Terezhalmy 1995a; Tritten 1996; Van Swol 1996; Walsh 1989; Warren 2001).
-
Lobene gingival index (Dentino 2002; Glass 1965; Lobene 1964a; Sharma 2010; van der Weijden 1994; Yankell 1996; Yankell 1997; Yukna 1993b).
-
Bleeding on probing (BOP) (0 to 1 scale) (Ainamo 1997; Biavati Silvestrini 2010; Lazarescu 2003; McCracken 2009; Wilson 1993).
-
Papillary bleeding index (0 to 4 scale) (McCracken 2004; Zimmer 2002).
-
Bleeding on marginal probing (BOMP) (0 to 2 scale) (Rosema 2008).
-
Papillary marginal attachment (PMA) (Toto 1966).
Excluded studies
The primary reason for the exclusion of each study is given in the Characteristics of excluded studies table. Many trials were ineligible for more than one reason, however the primary reason for exclusion was study duration of less than 28 days. Other reasons included a high potential for compromised self toothbrushing efficacy; combined interventions that did not allow for assessment of the effect of powered toothbrushing; split‐mouth design; or insufficient information to determine whether inclusion criteria were met (in these situations authors have been contacted and if further information is supplied to confirm criteria for inclusion are met, the studies will be included in subsequent updates).
Risk of bias in included studies
SeeFigure 2; Figure 3. Fifty‐six studies were assessed for risk of bias, including five that were not meta‐analysed (Costa 2007; Galgut 1996; Gugerli 2007; Moreira 2007; Zimmer 2005). Overall, only five were assessed as being at low risk of bias (Clerehugh 1998; Haffajee 2001a; McCracken 2009; Sharma 2010; Silverman 2004). Five trials were assessed as being at high risk of bias (Glass 1965; Kallar 2011; Lazarescu 2003; Walsh 1989; Wilson 1993).

Risk of bias graph: review authors' judgements about each risk of bias item presented as percentages across all included studies.

Risk of bias summary: review authors' judgements about each risk of bias item for each included study.
Allocation
The generation of randomisation sequence was at low risk of bias for 18 trials (32.1%), unclear risk for 36 (64.3%) and at high risk of bias for two trials (3.6%) (Lazarescu 2003; Walsh 1989). The concealment of allocation was at low risk of bias in 13 trials (23.2%) and unclear risk of bias in all other trials.
Blinding
The outcome assessment was at low risk of bias in 47 trials (83.9%). The adequacy of blinding was unclear in nine trials (16.1%).
Incomplete outcome data
The reported drop‐out rate ranged from 1% to 34%. Forty‐one trials were at low risk of bias with regard to attrition bias, either due to no drop‐outs, or drop‐outs unlikely to influence findings. Thirteen trials were at unclear risk of bias due to insufficient data for assessment; two studies with high drop‐out rates that did not present reasons for the losses were assessed as at high risk of bias (Glass 1965; Wilson 1993).
Selective reporting
All of the trials apart from one reported important outcomes and were assessed as at low risk of bias. Kallar 2011 failed to report gingivitis and was assessed as at high risk of bias for this domain.
Other potential sources of bias
Two trials were at unclear risk of bias due to other potential sources (Kallar 2011; Yukna 1993b) due to lack of information on the methods or insufficient detail regarding baseline comparison. All other trials were assessed as at low risk of bias for this domain.
Effects of interventions
See: Summary of findings for the main comparison
As mentioned in the methods section, the differences in plaque and gingivitis reduction between the powered and manual brushes were expressed as standardised mean differences (SMDs) unless all the studies used the same index in which case mean difference (MD) was used. The results are presented for both short‐term and long‐term studies.
All powered toothbrushes versus manual toothbrushes (Comparison 1)
Analysis 1.1; Analysis 1.2; Analysis 1.3; Analysis 1.4.
This primary analysis compared all powered brush types with manual.
Plaque
The meta‐analyses for both short‐term (40 trials n = 2871) and long‐term (14 trials n = 978) plaque indices indicated that there was a reduction in plaque when the powered toothbrushes were used, short term (one to three months) SMD ‐0.50 (95% confidence interval (CI) ‐0.70 to ‐0.31) and long term (>3 months) SMD ‐0.47 (95% CI ‐0.82 to ‐0.11). Both meta‐analyses showed high levels of heterogeneity (I2 = 83% and 86% respectively). These were not explained by the different powered toothbrush type subgroups, and there was considerable heterogeneity within these.
Gingivitis
The meta‐analyses for both short‐term (44 trials n = 3345) and long‐term (16 trials n = 1645) gingival indices indicated that there was a reduction in gingivitis when the powered toothbrushes were used, short term (1‐3 months) SMD ‐0.43 (95% CI ‐0.60 to ‐0.25) and long term (>3 months) SMD ‐0.21 (95% CI ‐0.31 to ‐0.12). Both meta‐analyses showed high levels of heterogeneity (I2 = 82% and 51% respectively). These were not explained by the different powered toothbrush type subgroups, and there was considerable heterogeneity within these.
Side to side powered toothbrushes versus manual toothbrushes (Comparison 2)
Analysis 2.1; Analysis 2.2; Analysis 2.3; Analysis 2.4.
Ten studies (n = 988) compared side to side toothbrushes with manual, one of which was at low risk (McCracken 2009) and two at high risk of bias (Glass 1965; Walsh 1989), the remainder being unclear.
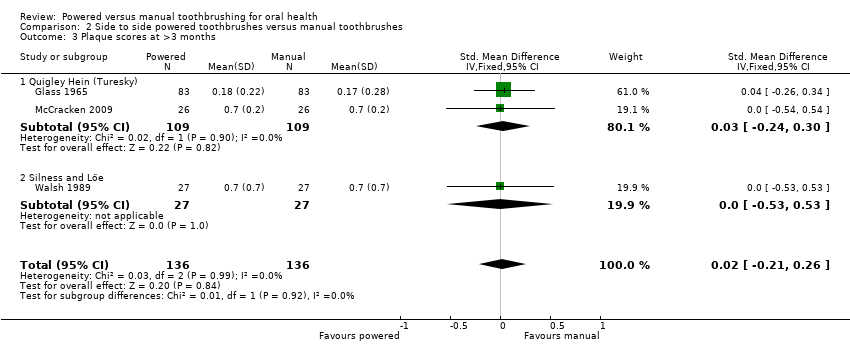
No significant differences were found between side to side action and manual brushes in the reduction of plaque or gingivitis in the long or short term.
Counter oscillation powered toothbrushes versus manual (Comparison 3)
Analysis 3.1; Analysis 3.2; Analysis 3.3; Analysis 3.4.
All five studies (n = 267) that compared counter oscillation powered toothbrushes with manual toothbrushes were at unclear (Baab 1989; Khocht 1992; Stabholz 1996; Yukna 1993b) or high risk of bias (Wilson 1993). There was no evidence that counter oscillation powered toothbrushes were more effective than manual brushes for the removal of plaque or reduction of gingivitis with the exception of being associated with less plaque in the long term, where the MD was ‐0.27 (95% CI ‐0.48 to ‐0.07; two trials, n = 69; I2=0) (Analysis 3.3).
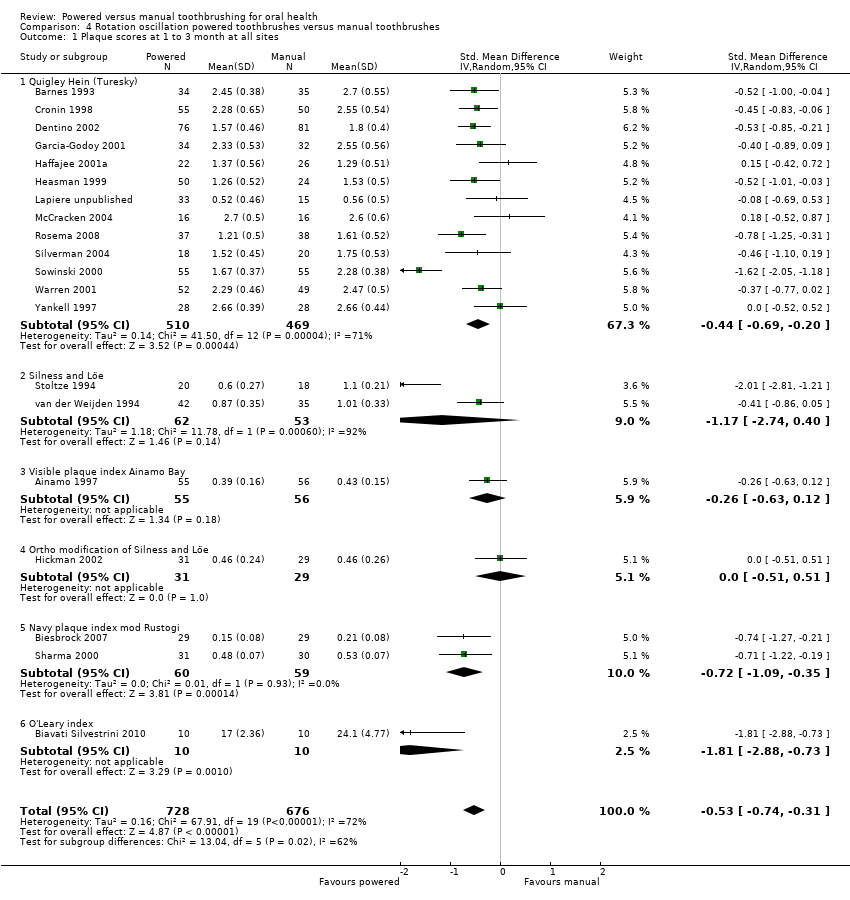
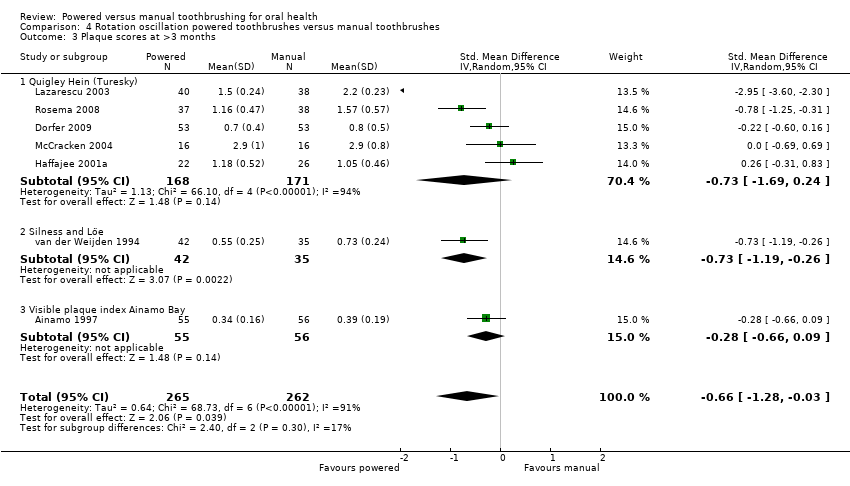
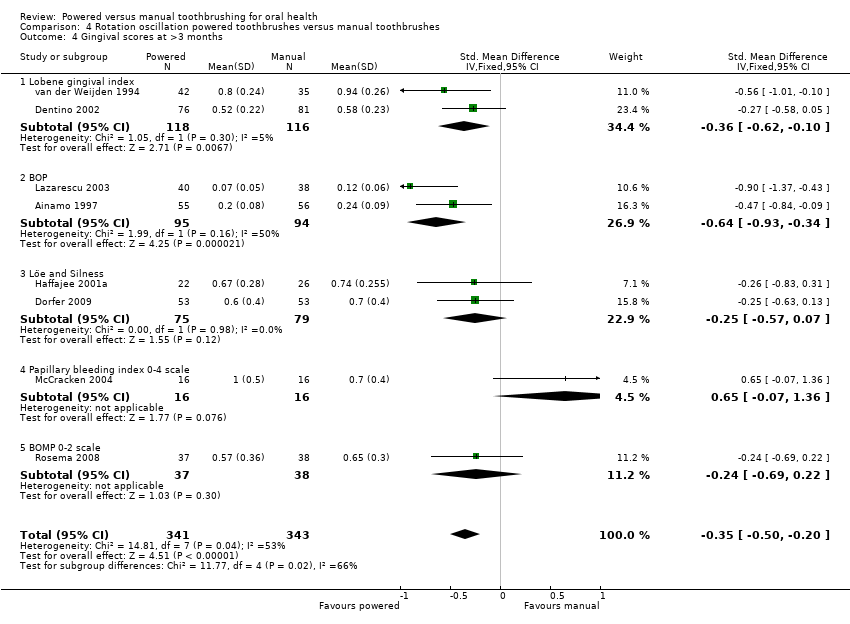
Rotation oscillation powered toothbrushes versus manual (Comparison 4)
Analysis 4.1; Analysis 4.2; Analysis 4.3; Analysis 4.4.
Twenty‐seven trials (n = 2159) compared rotation oscillation powered with manual toothbrushes. Only three of these were at low risk of bias (Clerehugh 1998; Haffajee 2001a; Silverman 2004) and one at high risk of bias (Lazarescu 2003), the remainder being unclear. This comparison contained the greatest number of trials, with 20 (n = 1404) and 21 (n = 1479) trials included in the meta‐analyses for plaque and gingivitis respectively in the short term, and seven (n = 527) and eight (n = 684) trials included in the meta‐analyses for plaque and gingivitis in the long term. Brushes with a rotation oscillation action removed more plaque and reduced gingivitis more effectively than manual brushes in the short term. For plaque at one to three months the SMD was ‐0.53 (95% CI ‐0.74 to ‐0.31; I2 = 72%) (Analysis 4.1) and for gingivitis the SMD was ‐0.49 (95% CI ‐0.73 to ‐0.26; I2 = 78%) (Analysis 4.2). Rotation oscillation brushes also reduced plaque and gingivitis in the long term. The SMD for plaque over 3 months was ‐0.66 (95% CI ‐1.28 to ‐0.03; I2 = 91%) (Analysis 4.3) and for gingivitis was ‐0.35 (95% CI ‐0.50 to ‐0.20; I2 = 53%) (Analysis 4.4). There was heterogeneity between the trials in the meta‐analyses for both short‐term and long‐term follow‐up, which is reported later in this section.
Three studies examined both outcomes but did not include sufficient information for meta‐analysis (Costa 2007; Gugerli 2007; Zimmer 2005). Two suggested treatment benefits from using rotation oscillation toothbrushes (Analysis 4.5). All three were at unclear risk of bias.
Circular powered toothbrushes versus manual (Comparison 5)
Two trials (n = 162) were included in this comparison, both were at unclear risk (Khocht 1992; Yankell 1996). Both trials were included in the analyses for plaque and gingivitis in the short term; there were no long‐term data. There was no evidence that brushes with a circular action removed plaque or reduced gingivitis more effectively than manual brushes in either time period.
Ionic toothbrushes versus manual (Comparison 6)
Analysis 6.1; Analysis 6.2; Analysis 6.3; Analysis 6.4.
Four trials (n = 221) compared an ionic toothbrush with a manual brush. All four trials were at unclear risk of bias (Galgut 1996; Moreira 2007; Pucher 1999; Van Swol 1996). One trial (Moreira 2007) did not present data in a form suitable for meta‐analysis (Analysis 6.5).
Three trials provided data for meta‐analysis (Galgut 1996; Pucher 1999; Van Swol 1996). The short‐term analyses (one to three months) indicated an effect on plaque in favour of the ionic brush (SMD ‐0.57 (95% CI ‐0.87 to ‐0.27)) but not gingivitis (MD ‐0.01 (95% CI ‐0.04 to 0.02)).
The single long‐term trial showed a difference in favour of the ionic toothbrush on both plaque (MD ‐0.50 (95% CI ‐0.74 to ‐0.26)) and gingivitis (MD ‐0.36 (95% CI ‐0.59 to ‐0.13)).
Ultrasonic toothbrushes versus manual (Comparison 7)
Analysis 7.1; Analysis 7.2; Analysis 7.3; Analysis 7.4.
Seven trials (n = 506) compared ultrasonic toothbrushes with manual. One of the seven trials in this comparison was at low risk of bias (Sharma 2010) and all others were at unclear risk of bias. There were four trials for the meta‐analysis for the short‐term assessment of plaque and five for gingivitis; two trials did not provide data for meta‐analysis (Analysis 7.5). Ultrasonic powered toothbrushes reduced plaque and gingivitis in the short term, with SMDs of ‐1.33 (95% CI ‐1.59 to ‐1.07; I2 = 93%) (Analysis 7.1) and ‐0.99 (95% CI ‐1.21 to ‐0.76; I2 = 84%) (Analysis 7.2) respectively. Only one trial presented long‐term data and showed no statistically significant difference between brushes for either plaque or gingivitis (Terezhalmy 1995a) (Analysis 7.3; Analysis 7.4).
Unknown versus manual (Comparison 8)
Analysis 8.1; Analysis 8.2; Analysis 8.3.
Five studies (n = 1130) compared powered brushes of unknown action against manual brushes. One was assessed as being at high risk of bias (Kallar 2011) and four were at unclear risk. The data are presented in forest plots however, due to the lack of clarity about the toothbrushes being compared it is difficult to draw any conclusions.
Investigation of heterogeneity
Heterogenity was present for both plaque at one to three months and plaque at >3 months and gingivitis at >3 months for the rotation oscillation brushes compared with manual. We were unable to put forward covariates other than those considered in the sensitivity analyses below to explain this.
Sensitivity analyses
Sensitivity analyses were limited to the data on all types of powered toothbrushes (Comparison 1: Analysis 1.1; Analysis 1.2; Analysis 1.3; Analysis 1.4) as this was the primary analysis for this review.
These were conducted for trials with (1) full mouth indices only, (2) low risk of bias trials, (3) manufacturer funded (reported) and (4) excluding orthodontic patients (Additional Table 4). The effect estimates were similar to those for all trials apart from those for the low risk of bias studies. There are only five low risk of bias trials in total and two to three included in the sensitivity analyses. Due to the lack of evidence none of these were statistically significant although the effect estimates for plaque and gingivitis at one to three months were higher than those for all trials.
| Index | Group selected | Number of trials | SMD | Effect P value | Het. P value | I2 |
| Plaque 1‐3 months | All trials | 40 | ‐0.50 (‐0.70 to ‐0.31) | <0.0001 | <0.0001 | 88 |
| Full mouth | 34 | ‐0.58 (‐0.80 to ‐0.36) | <0.0001 | <0.0001 | 85 | |
| Low risk of bias | 3 | ‐0.83 (‐2.02 to 0.36) | 0.17 | <0.0001 | 94 | |
| Manufacturer funded | 26 | ‐0.56 (‐0.82 to ‐0.29) | <0.0001 | <0.0001 | 88 | |
| Trials excluding ortho patients | 36 | ‐0.46 (‐0.66 to ‐0.27) | <0.0001 | <0.0001 | 83 | |
| Plaque >3 months | All trials | 14 | ‐0.37 (‐0.50 to ‐0.24) | <0.0001 | <0.0001 | 86 |
| Full mouth | 13 | ‐0.39 (‐0.53 to ‐0.26) | <0.0001 | <0.0001 | 87 | |
| Low risk of bias | 2 | 0.12 (‐0.27 to 0.52) | 0.53 | 0.51 | 0 | |
| Manufacturer funded | 9 | ‐0.41 (‐0.56 to ‐0.25) | <0.0001 | <0.0001 | 91 | |
| Trials excluding ortho patients | 14 (all) | ‐0.37 (‐0.50 to ‐0.24) | <0.0001 | <0.0001 | 86 | |
| Gingivitis 1‐3 months | All trials | 44 | ‐0.43 (‐0.60 to ‐0.25) | <0.0001 | <0.0001 | 82 |
| Full mouth | 35 | ‐0.47 (‐0.68 to ‐0.25) | <0.0001 | <0.0001 | 85 | |
| Low risk of bias | 3 | ‐0.96 (‐1.95 to 0.03) | 0.06 | <0.0001 | 93 | |
| Manufacturer funded | 32 | ‐0.47 (‐0.68 to ‐0.26) | <0.0001 | <0.0001 | 84 | |
| Trials excluding ortho patients | 38 | ‐0.42 (‐0.61 to ‐0.23) | <0.0001 | <0.0001 | 83 | |
|
| ||||||
| Gingivitis >3 months | All trials | 16 | ‐0.21 (‐0.31 to ‐0.12) | <0.0001 | <0.0001 | 51 |
| Full mouth | 14 | ‐0.25 (‐0.37 to ‐0.13) | <0.0001 | 0.006 | 56 | |
| Low risk of bias | 2 | ‐0.12 (‐0.52 to 0.27) | 0.54 | 0.52 | 0 | |
| Manufacturer funded | 10 | ‐0.21 (‐0.35 to ‐0.07) | 0.003 | 0.003 | 68 | |
| Trials excluding ortho patients | 16 (all) | ‐0.21 (‐0.31 to ‐0.12) | <0.0001 | <0.0001 | 51 | |
SMD = standardised mean difference
Converting SMDs back to original indices
As the results of both gingivitis and plaque meta‐analyses were calculated as SMDs, which are unit‐less and difficult to interpret, we re‐expressed them in Summary of findings table 1 by calculating SMDs back into the most commonly reported indices (Quigley Hein for plaque and Löe Silness for gingivitis). In order to back translate we calculated the mean difference by multiplying the median standard deviation of the control group (end of study mean) by the pooled SMD. The table below shows this for plaque and gingivitis in both the short and long term. The differences are also expressed as percentage reductions of the median control group mean.
| Plaque index | Time | Pooled SMD | Control mean* | Control standard deviation* | Difference in mean scores (95% CI) | Difference as % of control mean |
| Quigley Hein | 1‐3 months | ‐0.50 (‐0.70 to ‐0.31) | 2.16 | 0.46 | ‐0.23 (‐0.32 to ‐0.14) | 11% |
| Quigley Hein | >3 months | ‐0.47 (‐0.82 to ‐0.11) | 1.05 | 0.46 | ‐0.22 (‐0.38 to ‐0.05) | 21% |
| Gingivitis index | Time | Pooled SMD | Control mean* | Control standard deviation* | Difference in mean scores (95% CI) | Difference as % of control mean |
| Löe Silness | 1‐3 months | ‐0.43 (‐0.60 to ‐0.25) | 1.1 | 0.16 | ‐0.07 (‐0.10 to ‐0.04) | 6% |
| Löe Silness | >3 months | ‐0.21 (‐0.31 to ‐0.12) | 0.74 | 0.4 | ‐0.08 (‐0.12 to ‐0.05) | 11% |
*median values for all trials presenting data using chosen indices (i.e. Quigley Hein for plaque; Löe Silness for gingivitis).
Publication bias
Publication bias was assessed for the studies included in the meta‐analysis for all powered toothbrushes versus manual for the one to three month assessments. Both funnel plots appear asymmetrical in visual interpretation (Figure 4; Figure 5) with some evidence of publication bias. A formal test of small study effects (Egger test) was undertaken for the Quigley Hein (Turesky) index for plaque and the Löe Silness index for gingivitis. The slope was not significant for either index (P value = 0.203; 0.56) and the hypothesis of no small study effects was also not significant (P value = 0.748; 0.15). From the statistical tests there was no evidence of any publication bias.

Funnel plot of Comparison 1: All powered toothbrushes versus manual toothbrushes, Outcome 1.1: Plaque scores at 1 to 3 months at all sites.

Funnel plot of Comparison 1: All powered toothbrushes versus manual toothbrushes, Outcome 1.2: Gingival scores at 1 to 3 months at all sites.
Secondary outcomes
Cost
None of the included trials reported on the relative costs of manual compared with powered toothbrushes.
Reliability
One trial reported a mechanical failure of one of the 48 powered toothbrushes used (Clerehugh 1998) and one trial reported mechanical failure in four of 20 powered brushes (Yukna 1993b). No other mechanical failures were reported.
Calculus
Three trials (Dentino 2002; Glass 1965; van der Weijden 1994) reported on calculus, two reporting that there was no significant difference between the brush types (Glass 1965; van der Weijden 1994) and one reporting that, compared to the manual brush, the powered brush group showed a significant favourable difference in the accumulation of calculus at six months (P value < 0.01) (Dentino 2002).
Stain
Three trials reported that there was no difference in the degree of staining on the teeth between the brush types (Dentino 2002; Glass 1965; Walsh 1989).
Adverse events ‐ Tissue trauma
There was no apparent relationship between the use of powered toothbrushes and soft tissue trauma. In part this finding was due to the very small number of adverse events reported in the trials.
Sixteen trials did not report on adverse events (Biavati Silvestrini 2010; Costa 2007; Galgut 1996; Goyal 2007; Haffajee 2001a; Ho 1997; Lazarescu 2003; Lobene 1964a; Moritis 2008; Rosema 2008; Sharma 2010; Silverman 2004; Soparkar 1964; Van Swol 1996; Zimmer 2002; Zimmer 2005 ). Of the 40 trials that did report on adverse events, 27 reported no trauma to soft or hard tissues or both (Ainamo 1997; Biesbrock 2007; Clerehugh 1998; Dentino 2002; Dorfer 2009; Emling 1991; Forgas‐B 1998; Galgut 1996; Garcia‐Godoy 2001; Glass 1965; Heasman 1999; Hickman 2002; McCracken 2009; Moreira 2007; Pucher 1999; Sharma 2000; Singh unpublished; Soparkar 2000; Sowinski 2000; Stabholz 1996; Stoltze 1994; Toto 1966; Walsh 1989; Warren 2001; Wilson 1993; Yankell 1996; Yankell 1997) and six reported no significant differences between powered and manual toothbrushes, or that tissue trauma was negligible (Baab 1989; Barnes 1993; Cronin 1998; Lapiere unpublished; O'Beirne 1996; Terezhalmy 1995a).
Therefore, of the 56 studies, there were seven trials that described differences in tissue trauma between participants using manual and powered toothbrushes. One trial reported five cases of gingival abrasion in the manual and one case of abrasion in the powered group (Tritten 1996), another reported 12 cases of gingival abrasion in the manual and five cases of gingival abrasion in the powered group (van der Weijden 1994). One trial reported seven soft tissue abnormalities in six participants in the manual group and 10 abnormalities in seven participants in the powered group (Johnson 1994). In the trial by Yukna et al (Yukna 1993b) four cases of abrasion were reported in the powered toothbrush group and one in the manual group. Khocht 1992 reported soft tissue changes in four participants using the manual toothbrush, six using the experimental powered toothbrush and one participant using a control powered toothbrush. In the trial by McCracken 2004, soft tissue lesion which included abrasion and ulcer were reported in eight of manual toothbrushes group and five in powered toothbrushes group. Gugerli 2007 reported three cases of abrasion in both manual and powered toothbrushes. These soft tissue changes were seen as transient irritations that were possibly/probably due to the product.
Discussion
We brush our teeth for many reasons: to feel fresh and confident; to have a nice smile; to avoid bad breath and to avoid disease. The selection of one's toothbrush is largely a matter of personal preference, affordability, availability and professional recommendation. Powered toothbrushes may have a particular appeal to some because they represent a 'high tech' solution to an everyday task. There is overwhelming evidence that toothbrushing reduces gingivitis (Lang 1973). It may prevent periodontitis and certainly prevents tooth decay if carried out in conjunction with fluoride toothpaste. These benefits occur whether the brush is manual or powered and the results of this review do not indicate that toothbrushing is only worthwhile with a powered toothbrush.
Summary of main results
The results of this review demonstrate that powered toothbrushes remove statistically significantly more plaque and gingivitis than manual brushes in both the short and long term. The results of the meta‐analyses are presented as standardised mean differences (SMD), which do not relate to tangible differences in clinical indices. To help interpret the magnitude of the effect, the results of the 'all powered toothbrushes' meta‐analysis have been back‐translated to the most commonly reported plaque and gingivitis indices. An 11% reduction in plaque was shown at one to three months for the Quigley Hein (Turesky) index and a 21% reduction in plaque at longer than three months. The longer term result was based only on 14 trials, compared to 40 trials for the short‐term analysis. With regard to gingivitis a 6% reduction was seen at one to three months for the Löe Silness index, based on 44 trials, and a greater reduction of 11% in the long term (16 trials).
When looking at individual modes of action of powered brushes there are inconsistencies with regard to reductions of plaque and gingivitis. Rotation oscillation brushes showed statistically significant reductions in both plaque and gingivitis at both time points. All other brushes, apart from side to side, showed some statistically significant findings but not consistently across both outcomes and time points. It is difficult to explain this inconsistency that a particular toothbrush design could affect plaque or gingivitis at one time but not at another and so the findings of these analyses may warrant further research, particularly given the small number of trials for some modes of action.
Overall completeness and applicability of evidence
The effectiveness of powered toothbrushes in removing plaque and reducing gingivitis can be related to destructive periodontal disease (periodontitis) only with some difficulty. Many factors are associated with the occurrence of periodontitis including plaque, tobacco use and individual medical factors. Periodontitis takes many years to develop whereas the trials have much shorter follow‐up. There is little compelling evidence that plaque and gingivitis are reliable proxies for long‐term destructive disease and it is difficult to estimate a threshold for clinically important reductions in either. We conclude that powered brushes reduce plaque accumulation and gingivitis but the clinical importance of these reductions cannot be assessed. More high quality long‐term studies are required to investigate the effectiveness of rotation oscillation brushes in the treatment and prevention of periodontitis.
Some authorities have advocated the use of arbitrary thresholds to make superiority claims for a specific product. For example, Imrey has proposed that a product cannot be claimed to be superior unless it provides a 20% improvement in performance (which was not the case for any types of brush in this review, in terms of long‐term plaque removal) (Imrey 1992; Imrey 1994). However, other authors have criticised the use of arbitrary thresholds and prefer a threshold for clinical significance to be decided in advance and selected on clinical grounds (D'Agostino 1992).
Few data were reported on the costs or reliability of the brushes or the side effects of their use. When reported, injuries to the gums were minor and transient.
Many factors may influence the effectiveness of toothbrushes including filament arrangement, orientation, size, shape and flexibility, brush head size and shape along with presence or absence and characteristics of a timer, that not all of them could be isolated and analysed. Whether the brush has a battery or rechargeable power source may also be important. These factors could be considered in subgroup analyses in the parallel review of different powered toothbrushes by Deacon and colleagues (Deacon 2010). More recently powered toothbrushes have been introduced with multidimensional actions (for example the filaments on some rotation oscillation brushes now also move in and out towards the tooth). Trials of such designs are yet to be identified.
The funnel plots for the trials of all powered toothbrushes were skewed for both plaque and gingivitis. This observation suggests but does not conclusively demonstrate publication bias. In the review intervention effects were measured by SMDs, which are naturally correlated with their standard error, which can produce spurious asymmetry in funnel plots. Other potential factors that may contribute to asymmetry include poor methodological quality of studies, true heterogeneity and the play of chance.
Publication bias might be expected in the reporting of toothbrush trials as manufacturers would like to have scientific support for the effectiveness of their products. Studies sponsored by pharmaceutical companies are more likely to favour the sponsor (Lexchin 2003). There was no evidence of this when publication bias was examined statistically, and no evidence of a difference in effect estimates when a sensitivity analysis was conducted for trials which did not mention commercial funding. It should be noted that the methods for detecting publication bias relate effect size to sample size, and in this review the trials tend to be of similar size. Therefore other methods may be required to examine publication bias in short‐term, low cost studies.
Quality of the evidence
The current review focused purely on truly randomised trials. Five trials were assessed as at low risk of bias (8.9%), five at high risk of bias (8.9%) and the remaining 46 trials (82%) at unclear risk of bias. Only three trials were able to be used in the sensitivity analysis for trials at low risk of bias. These trials were unable to demonstrate statistically significant differences between powered and manual toothbrushes, although the effect estimates for plaque and gingivitis at one to three months were higher than those for all trials.
There was considerable unexplained heterogeneity in the meta‐analyses for plaque and gingivitis for the primary analysis of powered toothbrushes versus manual brushes, and for the meta‐analyses of individual modes of action. This heterogeneity could not be explained.

Flow chart of study selection in this update.
Risk of bias graph: review authors' judgements about each risk of bias item presented as percentages across all included studies.

Risk of bias summary: review authors' judgements about each risk of bias item for each included study.

Funnel plot of Comparison 1: All powered toothbrushes versus manual toothbrushes, Outcome 1.1: Plaque scores at 1 to 3 months at all sites.
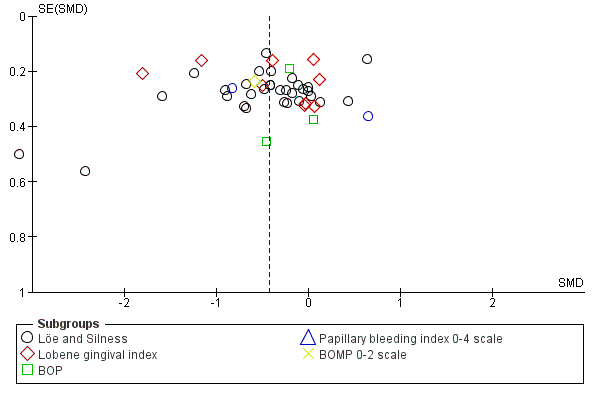
Funnel plot of Comparison 1: All powered toothbrushes versus manual toothbrushes, Outcome 1.2: Gingival scores at 1 to 3 months at all sites.

Comparison 1 All powered toothbrushes versus manual toothbrushes, Outcome 1 Plaque scores at 1 to 3 month at all sites.
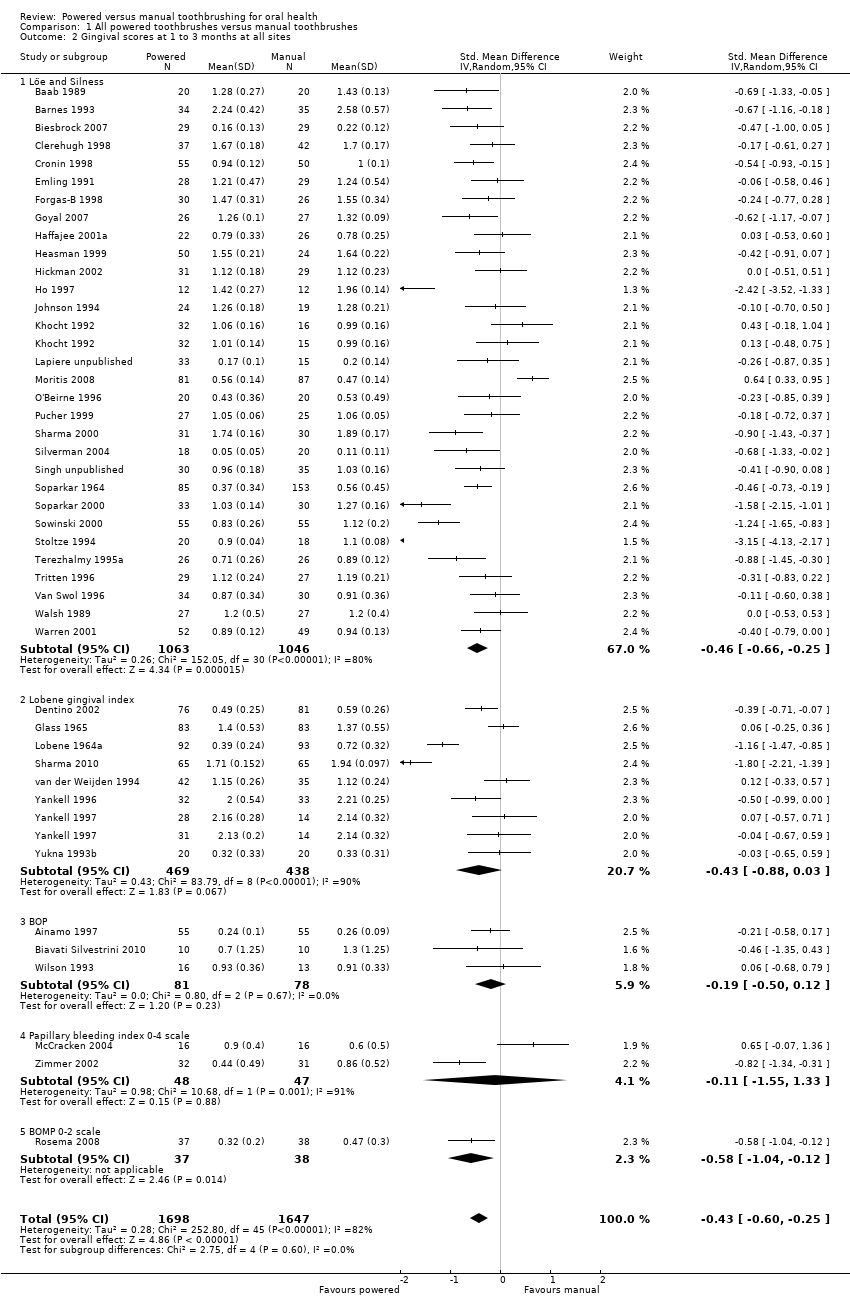
Comparison 1 All powered toothbrushes versus manual toothbrushes, Outcome 2 Gingival scores at 1 to 3 months at all sites.

Comparison 1 All powered toothbrushes versus manual toothbrushes, Outcome 3 Plaque scores at >3 months.

Comparison 1 All powered toothbrushes versus manual toothbrushes, Outcome 4 Gingival scores at >3 months.

Comparison 2 Side to side powered toothbrushes versus manual toothbrushes, Outcome 1 Plaque scores at 1 to 3 month at all sites.

Comparison 2 Side to side powered toothbrushes versus manual toothbrushes, Outcome 2 Gingival scores at 1 to 3 months at all sites.
Comparison 2 Side to side powered toothbrushes versus manual toothbrushes, Outcome 3 Plaque scores at >3 months.

Comparison 2 Side to side powered toothbrushes versus manual toothbrushes, Outcome 4 Gingival scores at >3 months.

Comparison 3 Counter oscillation powered toothbrushes versus manual toothbrushes, Outcome 1 Plaque scores at 1 to 3 month at all sites.

Comparison 3 Counter oscillation powered toothbrushes versus manual toothbrushes, Outcome 2 Gingivitis scores at 1 to 3 months at all sites.

Comparison 3 Counter oscillation powered toothbrushes versus manual toothbrushes, Outcome 3 Plaque scores at >3 months.

Comparison 3 Counter oscillation powered toothbrushes versus manual toothbrushes, Outcome 4 Gingival scores at >3 months.
Comparison 4 Rotation oscillation powered toothbrushes versus manual toothbrushes, Outcome 1 Plaque scores at 1 to 3 month at all sites.

Comparison 4 Rotation oscillation powered toothbrushes versus manual toothbrushes, Outcome 2 Gingival scores at 1 to 3 months at all sites.
Comparison 4 Rotation oscillation powered toothbrushes versus manual toothbrushes, Outcome 3 Plaque scores at >3 months.
Comparison 4 Rotation oscillation powered toothbrushes versus manual toothbrushes, Outcome 4 Gingival scores at >3 months.
| Study | Plaque | Gingivitis |
| Costa 2007 | No statistically significant pre‐post differences shown | No statistically significant pre‐post differences shown |
| Gugerli 2007 | "Subjects using a power toothbrush during initial treatment reduced supragingival plaque to lower levels...than subjects using a manual brush" | "Subjects using a power toothbrush ...showed significantly less bleeding on probing than subjects using a manual brush" |
| Zimmer 2005 | Median change in Quigely‐Hein at 4 weeks: Powered (Cybersonic): 0.23 Powered (Braun 3D Excel): 0.07 Manual: 0.22 Median change in Quigely‐Hein at 8 weeks: Powered (Cybersonic): 0.41 Powered (Braun 3D Excel): 0.08 Manual: 0.35 All indices showed statistically significant reductions for both power | Median change in papillary bleeding index at 4 weeks: Powered (Cybersonic): 0.25 Powered (Braun 3D Excel): 0.02 Manual: 0.39 Median change in papillary bleeding index at 8 weeks: Powered (Cybersonic): 0.36 Powered (Braun 3D Excel): 0.10 Manual: 0.61 |
Comparison 4 Rotation oscillation powered toothbrushes versus manual toothbrushes, Outcome 5 Rotation oscillation versus manual: data not suitable for meta‐analysis.

Comparison 5 Circular powered toothbrushes versus manual toothbrushes, Outcome 1 Plaque scores at 1 to 3 month at all sites.

Comparison 5 Circular powered toothbrushes versus manual toothbrushes, Outcome 2 Gingival scores at 1 to 3 months at all sites.

Comparison 6 Ionic toothbrushes versus manual toothbrushes, Outcome 1 Plaque scores at 1 to 3 months.

Comparison 6 Ionic toothbrushes versus manual toothbrushes, Outcome 2 Plaque scores at >3 months at all sites.

Comparison 6 Ionic toothbrushes versus manual toothbrushes, Outcome 3 Gingivitis at 1 to 3 months.
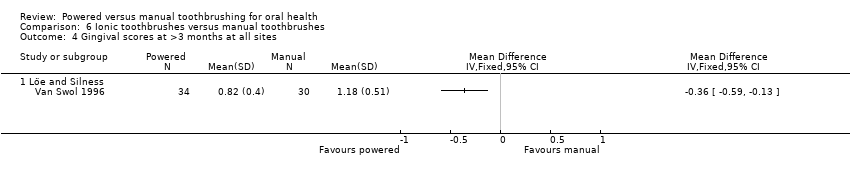
Comparison 6 Ionic toothbrushes versus manual toothbrushes, Outcome 4 Gingival scores at >3 months at all sites.
| Study | Plaque | Gingivitis |
| Galgut 1996 | The electrically active toothbrushes better plaque removal than the inactive toothbrushes (6.5% more plaque removal at final visit) | Not reported |
| Moreira 2007 | Frequency distribution for plaque zero at baseline and 28 days was 9.27+/‐ 10.14/17.75+/‐9.60 and 8.42+/‐10.43/16.79+/‐8.93 for ionic and conventional toothbrushes respectively | Not reported |
Comparison 6 Ionic toothbrushes versus manual toothbrushes, Outcome 5 Ionic versus manual: data not suitable for meta‐analysis.

Comparison 7 Ultrasonic powered toothbrushes versus manual toothbrushes, Outcome 1 Plaque scores at 1 to 3 month at all sites.

Comparison 7 Ultrasonic powered toothbrushes versus manual toothbrushes, Outcome 2 Gingival scores at 1 to 3 months at all sites.

Comparison 7 Ultrasonic powered toothbrushes versus manual toothbrushes, Outcome 3 Plaque scores at >3 months at all sites.
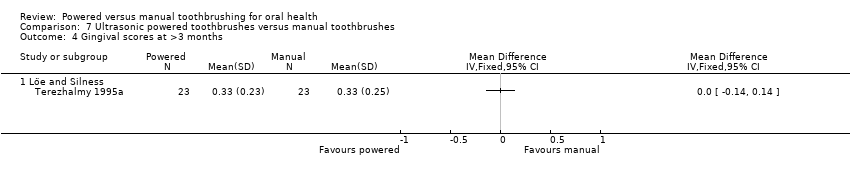
Comparison 7 Ultrasonic powered toothbrushes versus manual toothbrushes, Outcome 4 Gingival scores at >3 months.
| Study | Plaque | Gingivitis |
| Costa 2007 | "There was a significant difference for the ultrasonic/buccal group indicating that the ultrasonic brush improved plaque reduction on the buccal surfaces (p=0.007, Wilcoxon test)" | Marginal bleeding: "No significant differences were noted in the nine subgroups (p>0.05, Wilcoxon test)" |
| Zimmer 2005 | "Improvements of the indices after 4 and 8 weeks were calculated for comparison between groups. After 4 and 8 weeks, with respect to all indices, the use of the power toothbrushes resulted in improvements which were statistically significant superior to what was found for the manual brush (p<0.001)." Results were presented as box‐plots with medians and 25, 75 percentiles. Non‐parametric tests have been used for the data analysis | "Improvements of the indices after 4 and 8 weeks were calculated for comparison between groups. After 4 and 8 weeks, with respect to all indices, the use of the power toothbrushes resulted in improvements which were statistically significant superior to what was found for the manual brush (p<0.001)." Results were presented as box‐plots with medians and 25, 75 percentiles. Non‐parametric tests have been used for the data analysis |
Comparison 7 Ultrasonic powered toothbrushes versus manual toothbrushes, Outcome 5 Ultrasonic versus manual: data not suitable for meta‐analysis.
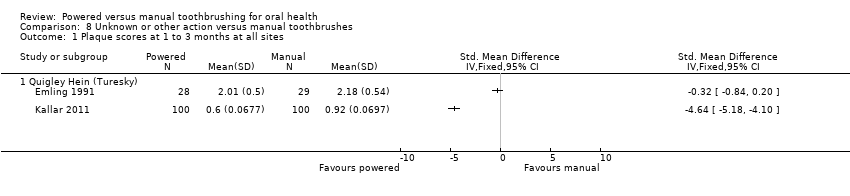
Comparison 8 Unknown or other action versus manual toothbrushes, Outcome 1 Plaque scores at 1 to 3 months at all sites.

Comparison 8 Unknown or other action versus manual toothbrushes, Outcome 2 Gingival scores at 1 to 3 months at all sites.
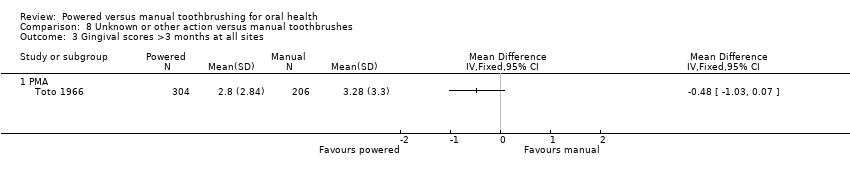
Comparison 8 Unknown or other action versus manual toothbrushes, Outcome 3 Gingival scores >3 months at all sites.
| Powered toothbrushes compared with manual toothbrushes for oral health | ||||||
| Patient or population: Individuals of any age with no reported disability that might affect toothbrushing Intervention: Powered toothbrushes with any mode of action Comparison: Manual toothbrushes | ||||||
| Outcomes | Illustrative comparative risks* (95% CI) | Relative effect | No of participants | Quality of the evidence | Comments | |
| Assumed risk | Corresponding risk | |||||
| Manual toothbrush | Powered toothbrush | |||||
| Plaque scores at 1 to 3 months Scale from: 0 to 5 | The mean plaque score in the control group was 2.16 points1 | The mean plaque score in the intervention groups was | 2871 (40 studies) | ⊕⊕⊕⊝ | This effect represents an 11% reduction in plaque at 1 to 3 months Long‐term data (>3 months) also showed a statistically significant reduction in plaque for powered toothbrushes compared to manual toothbrushes | |
| Gingival scores at 1 to 3 months Scale from: 0 to 3 | The mean gingivitis score in the control group was 1.1 points2 | The mean gingivitis score in the intervention groups was | 3345 | ⊕⊕⊕⊝ | This effect represents a 6% reduction in gingivitis at 1 to 3 months Long‐term data (>3 months) also showed a statistically significant reduction in gingivitis for powered toothbrushes compared to manual toothbrushes | |
| Adverse events | There was no apparent relationship between the use of powered toothbrushes and soft tissue trauma. In part this finding was due to the very small number of adverse events reported in the trials | |||||
| *The basis for the assumed risk (e.g. the median control group risk across studies) is provided in footnotes. The corresponding risk (and its 95% confidence interval) is based on the assumed risk in the comparison group and the relative effect of the intervention (and its 95% CI) | ||||||
| GRADE Working Group grades of evidence | ||||||
| 1. Based on median of control means for all trials presenting data using Quigley Hein index at 1 to 3 months 2. Based on median of control means for all trials presenting data using Löe and Silness index at 1 to 3 months 3. Downgraded due to statistically significant heterogeneity (I2 = 83% for plaque; I2 = 82% for gingivitis) 4. No downgrading was undertaken for risk of bias although 46/56 included trials were assessed as being at unclear risk of bias. Given that many of the studies were conducted over 10 years ago, it was felt much of the uncertainty may be due to poor reporting | ||||||
| Inclusion criteria | Number (n = 56) |
| Adults | 43 |
| Minimum number of teeth | 31 |
| Minimum periodontal baseline measures | 28 |
| Participants recruited from dental clinics | 9 |
| Concurrent fixed orthodontic treatment | 8 |
| Some participants aged less than 16 years | 11 |
| Volunteer university students | 3 |
| Dental students | 2 |
| School children | 3 |
| Exclusion criteria1 | Number (n = 56) |
| Exclusion criteria related to medical history | 31 |
| Pregnancy or lactation | 5 |
| Previous use of powered toothbrushes | 6 |
| Patients undergoing orthodontic treatment | 9 |
| Previous periodontal treatment | 3 |
| Dental students | 2 |
| Cervical restorations | 1 |
| Smoking | 3 |
| Maximum periodontal measure | 8 |
| Wearing partial denture | 2 |
| 1 Not all trials explicitly stated exclusion criteria | |
| Mode of action | Trial ID | Number of trials | Number in trials |
| Side to side | Glass 1965, Ho 1997, Johnson 1994, Lobene 1964, McCracken 2009, Moritis 2008, O'Beirne 1996, Tritten 1996, Walsh 1989, Yankell 1997 | 10 | 988 |
| Counter oscillation | Baab 1989, Khocht 1992, Stabholz 1996, Wilson 1993, Yukna 1993 | 5 | 267 |
| Rotation oscillation | Ainamo 1997, Barnes 1993, Biavati Silvestrini 2010, Biesbrock 2007, Clerehugh 1998, Costa 2007, Cronin 1998, Dentino 2002, Dorfer 2009, Garcia‐Godoy 2001, Gugerli 2007, Haffajee 2001a, Heasman 1999, Hickman 2002, Lapiere unpublished, Lazarescu unpublished, McCracken 2004, Rosema 2008, Sharma 2000, Silverman 2004, Soparkar 2000, Sowinski 2000, Stoltze 1994, van der Weijden 1994, Warren 2001, Yankell 1997, Zimmer 2005 | 27 | 2159 |
| Circular | Khocht 1992, Yankell 1996 | 2 | 162 |
| Ultrasonic | Costa 2007, Forgas‐B 1998, Goyal 2007, Sharma 2010, Terezhalmy 1995, Zimmer 2002, Zimmer 2005 | 7 | 506 |
| Unknown | Emling 1991, Kallar 2011, Singh unpublished, Soparkar 1964, Toto 1966 | 5 | 1130 |
| Ionic | Galgut 1996, Moreira 2007, Pucher 1999, van Swol 1996 | 4 | 221 |
| Four trials evaluated two powered toothbrushes | |||
| Index | Group selected | Number of trials | SMD | Effect P value | Het. P value | I2 |
| Plaque 1‐3 months | All trials | 40 | ‐0.50 (‐0.70 to ‐0.31) | <0.0001 | <0.0001 | 88 |
| Full mouth | 34 | ‐0.58 (‐0.80 to ‐0.36) | <0.0001 | <0.0001 | 85 | |
| Low risk of bias | 3 | ‐0.83 (‐2.02 to 0.36) | 0.17 | <0.0001 | 94 | |
| Manufacturer funded | 26 | ‐0.56 (‐0.82 to ‐0.29) | <0.0001 | <0.0001 | 88 | |
| Trials excluding ortho patients | 36 | ‐0.46 (‐0.66 to ‐0.27) | <0.0001 | <0.0001 | 83 | |
| Plaque >3 months | All trials | 14 | ‐0.37 (‐0.50 to ‐0.24) | <0.0001 | <0.0001 | 86 |
| Full mouth | 13 | ‐0.39 (‐0.53 to ‐0.26) | <0.0001 | <0.0001 | 87 | |
| Low risk of bias | 2 | 0.12 (‐0.27 to 0.52) | 0.53 | 0.51 | 0 | |
| Manufacturer funded | 9 | ‐0.41 (‐0.56 to ‐0.25) | <0.0001 | <0.0001 | 91 | |
| Trials excluding ortho patients | 14 (all) | ‐0.37 (‐0.50 to ‐0.24) | <0.0001 | <0.0001 | 86 | |
| Gingivitis 1‐3 months | All trials | 44 | ‐0.43 (‐0.60 to ‐0.25) | <0.0001 | <0.0001 | 82 |
| Full mouth | 35 | ‐0.47 (‐0.68 to ‐0.25) | <0.0001 | <0.0001 | 85 | |
| Low risk of bias | 3 | ‐0.96 (‐1.95 to 0.03) | 0.06 | <0.0001 | 93 | |
| Manufacturer funded | 32 | ‐0.47 (‐0.68 to ‐0.26) | <0.0001 | <0.0001 | 84 | |
| Trials excluding ortho patients | 38 | ‐0.42 (‐0.61 to ‐0.23) | <0.0001 | <0.0001 | 83 | |
|
| ||||||
| Gingivitis >3 months | All trials | 16 | ‐0.21 (‐0.31 to ‐0.12) | <0.0001 | <0.0001 | 51 |
| Full mouth | 14 | ‐0.25 (‐0.37 to ‐0.13) | <0.0001 | 0.006 | 56 | |
| Low risk of bias | 2 | ‐0.12 (‐0.52 to 0.27) | 0.54 | 0.52 | 0 | |
| Manufacturer funded | 10 | ‐0.21 (‐0.35 to ‐0.07) | 0.003 | 0.003 | 68 | |
| Trials excluding ortho patients | 16 (all) | ‐0.21 (‐0.31 to ‐0.12) | <0.0001 | <0.0001 | 51 | |
| SMD = standardised mean difference | ||||||
| Outcome or subgroup title | No. of studies | No. of participants | Statistical method | Effect size |
| 1 Plaque scores at 1 to 3 month at all sites Show forest plot | 40 | 2871 | Std. Mean Difference (IV, Random, 95% CI) | ‐0.50 [‐0.70, ‐0.31] |
| 1.1 Quigley Hein (Turesky) | 28 | 2000 | Std. Mean Difference (IV, Random, 95% CI) | ‐0.39 [‐0.56, ‐0.22] |
| 1.2 Silness and Löe | 6 | 431 | Std. Mean Difference (IV, Random, 95% CI) | ‐0.94 [‐1.83, ‐0.05] |
| 1.3 Visible plaque index Ainamo Bay | 1 | 111 | Std. Mean Difference (IV, Random, 95% CI) | ‐0.26 [‐0.63, 0.12] |
| 1.4 Ortho modification of Silness and Löe | 1 | 60 | Std. Mean Difference (IV, Random, 95% CI) | 0.0 [‐0.51, 0.51] |
| 1.5 Navy plaque index mod Rustogi | 3 | 249 | Std. Mean Difference (IV, Random, 95% CI) | ‐1.13 [‐1.94, ‐0.31] |
| 1.6 O'Leary index | 1 | 20 | Std. Mean Difference (IV, Random, 95% CI) | ‐1.81 [‐2.88, ‐0.73] |
| 2 Gingival scores at 1 to 3 months at all sites Show forest plot | 44 | 3345 | Std. Mean Difference (IV, Random, 95% CI) | ‐0.43 [‐0.60, ‐0.25] |
| 2.1 Löe and Silness | 30 | 2109 | Std. Mean Difference (IV, Random, 95% CI) | ‐0.46 [‐0.66, ‐0.25] |
| 2.2 Lobene gingival index | 8 | 907 | Std. Mean Difference (IV, Random, 95% CI) | ‐0.43 [‐0.88, 0.03] |
| 2.3 BOP | 3 | 159 | Std. Mean Difference (IV, Random, 95% CI) | ‐0.19 [‐0.50, 0.12] |
| 2.4 Papillary bleeding index 0‐4 scale | 2 | 95 | Std. Mean Difference (IV, Random, 95% CI) | ‐0.11 [‐1.55, 1.33] |
| 2.5 BOMP 0‐2 scale | 1 | 75 | Std. Mean Difference (IV, Random, 95% CI) | ‐0.58 [‐1.04, ‐0.12] |
| 3 Plaque scores at >3 months Show forest plot | 14 | 978 | Std. Mean Difference (IV, Random, 95% CI) | ‐0.47 [‐0.82, ‐0.11] |
| 3.1 Quigley Hein (Turesky) | 11 | 736 | Std. Mean Difference (IV, Random, 95% CI) | ‐0.51 [‐0.97, ‐0.04] |
| 3.2 Silness and Löe | 2 | 131 | Std. Mean Difference (IV, Random, 95% CI) | ‐0.38 [‐1.09, 0.34] |
| 3.3 Visible plaque index Ainamo Bay | 1 | 111 | Std. Mean Difference (IV, Random, 95% CI) | ‐0.28 [‐0.66, 0.09] |
| 4 Gingival scores at >3 months Show forest plot | 16 | 1645 | Std. Mean Difference (IV, Fixed, 95% CI) | ‐0.21 [‐0.31, ‐0.12] |
| 4.1 Löe and Silness | 5 | 318 | Std. Mean Difference (IV, Fixed, 95% CI) | ‐0.27 [‐0.49, ‐0.05] |
| 4.2 Lobene gingival index | 4 | 440 | Std. Mean Difference (IV, Fixed, 95% CI) | ‐0.14 [‐0.33, 0.04] |
| 4.3 BOP | 4 | 270 | Std. Mean Difference (IV, Fixed, 95% CI) | ‐0.46 [‐0.70, ‐0.22] |
| 4.4 Papillary bleeding index 0‐4 scale | 1 | 32 | Std. Mean Difference (IV, Fixed, 95% CI) | 0.65 [‐0.07, 1.36] |
| 4.5 BOMP 0‐2 scale | 1 | 75 | Std. Mean Difference (IV, Fixed, 95% CI) | ‐0.24 [‐0.69, 0.22] |
| 4.6 PMA | 1 | 510 | Std. Mean Difference (IV, Fixed, 95% CI) | ‐0.16 [‐0.34, 0.02] |
| Outcome or subgroup title | No. of studies | No. of participants | Statistical method | Effect size |
| 1 Plaque scores at 1 to 3 month at all sites Show forest plot | 7 | 570 | Std. Mean Difference (IV, Random, 95% CI) | ‐0.27 [‐0.77, 0.23] |
| 1.1 Quigley Hein (Turesky) | 4 | 324 | Std. Mean Difference (IV, Random, 95% CI) | ‐0.14 [‐0.36, 0.08] |
| 1.2 Silness and Löe | 3 | 246 | Std. Mean Difference (IV, Random, 95% CI) | ‐0.78 [‐2.25, 0.68] |
| 2 Gingival scores at 1 to 3 months at all sites Show forest plot | 9 | 795 | Std. Mean Difference (IV, Random, 95% CI) | ‐0.32 [‐0.81, 0.17] |
| 2.1 Löe and Silness | 6 | 385 | Std. Mean Difference (IV, Random, 95% CI) | ‐0.28 [‐0.88, 0.32] |
| 2.2 Lobene gingival index | 3 | 410 | Std. Mean Difference (IV, Random, 95% CI) | ‐0.39 [‐1.24, 0.46] |
| 3 Plaque scores at >3 months Show forest plot | 3 | 272 | Std. Mean Difference (IV, Fixed, 95% CI) | 0.02 [‐0.21, 0.26] |
| 3.1 Quigley Hein (Turesky) | 2 | 218 | Std. Mean Difference (IV, Fixed, 95% CI) | 0.03 [‐0.24, 0.30] |
| 3.2 Silness and Löe | 1 | 54 | Std. Mean Difference (IV, Fixed, 95% CI) | 0.0 [‐0.53, 0.53] |
| 4 Gingival scores at >3 months Show forest plot | 3 | 272 | Std. Mean Difference (IV, Fixed, 95% CI) | 0.10 [‐0.14, 0.34] |
| 4.1 Löe and Silness | 1 | 54 | Std. Mean Difference (IV, Fixed, 95% CI) | 0.0 [‐0.53, 0.53] |
| 4.2 Lobene gingival index | 1 | 166 | Std. Mean Difference (IV, Fixed, 95% CI) | 0.16 [‐0.14, 0.47] |
| 4.3 BOP | 1 | 52 | Std. Mean Difference (IV, Fixed, 95% CI) | 0.0 [‐0.54, 0.54] |
| Outcome or subgroup title | No. of studies | No. of participants | Statistical method | Effect size |
| 1 Plaque scores at 1 to 3 month at all sites Show forest plot | 4 | Mean Difference (IV, Random, 95% CI) | Subtotals only | |
| 1.1 Quigley Hein (Turesky) | 4 | 184 | Mean Difference (IV, Random, 95% CI) | ‐0.03 [‐0.15, 0.10] |
| 2 Gingivitis scores at 1 to 3 months at all sites Show forest plot | 4 | 172 | Std. Mean Difference (IV, Fixed, 95% CI) | 0.01 [‐0.30, 0.31] |
| 2.1 Löe and Silness | 2 | 103 | Std. Mean Difference (IV, Fixed, 95% CI) | 0.01 [‐0.39, 0.40] |
| 2.2 Lobene gingival index | 1 | 40 | Std. Mean Difference (IV, Fixed, 95% CI) | ‐0.03 [‐0.65, 0.59] |
| 2.3 BOP | 1 | 29 | Std. Mean Difference (IV, Fixed, 95% CI) | 0.06 [‐0.68, 0.79] |
| 3 Plaque scores at >3 months Show forest plot | 2 | Mean Difference (IV, Fixed, 95% CI) | Subtotals only | |
| 3.1 Quigley Hein (Turesky) | 2 | 69 | Mean Difference (IV, Fixed, 95% CI) | ‐0.27 [‐0.48, ‐0.07] |
| 4 Gingival scores at >3 months Show forest plot | 2 | 69 | Std. Mean Difference (IV, Fixed, 95% CI) | ‐0.19 [‐0.66, 0.29] |
| 4.1 Lobene gingival index | 1 | 40 | Std. Mean Difference (IV, Fixed, 95% CI) | ‐0.18 [‐0.80, 0.44] |
| 4.2 BOP | 1 | 29 | Std. Mean Difference (IV, Fixed, 95% CI) | ‐0.19 [‐0.93, 0.54] |
| Outcome or subgroup title | No. of studies | No. of participants | Statistical method | Effect size |
| 1 Plaque scores at 1 to 3 month at all sites Show forest plot | 20 | 1404 | Std. Mean Difference (IV, Random, 95% CI) | ‐0.53 [‐0.74, ‐0.31] |
| 1.1 Quigley Hein (Turesky) | 13 | 979 | Std. Mean Difference (IV, Random, 95% CI) | ‐0.44 [‐0.69, ‐0.20] |
| 1.2 Silness and Löe | 2 | 115 | Std. Mean Difference (IV, Random, 95% CI) | ‐1.17 [‐2.74, 0.40] |
| 1.3 Visible plaque index Ainamo Bay | 1 | 111 | Std. Mean Difference (IV, Random, 95% CI) | ‐0.26 [‐0.63, 0.12] |
| 1.4 Ortho modification of Silness and Löe | 1 | 60 | Std. Mean Difference (IV, Random, 95% CI) | 0.0 [‐0.51, 0.51] |
| 1.5 Navy plaque index mod Rustogi | 2 | 119 | Std. Mean Difference (IV, Random, 95% CI) | ‐0.72 [‐1.09, ‐0.35] |
| 1.6 O'Leary index | 1 | 20 | Std. Mean Difference (IV, Random, 95% CI) | ‐1.81 [‐2.88, ‐0.73] |
| 2 Gingival scores at 1 to 3 months at all sites Show forest plot | 21 | 1479 | Std. Mean Difference (IV, Random, 95% CI) | ‐0.49 [‐0.73, ‐0.26] |
| 2.1 Löe and Silness | 14 | 952 | Std. Mean Difference (IV, Random, 95% CI) | ‐0.68 [‐0.99, ‐0.38] |
| 2.2 Lobene gingival index | 3 | 290 | Std. Mean Difference (IV, Random, 95% CI) | ‐0.11 [‐0.46, 0.24] |
| 2.3 BOP | 2 | 130 | Std. Mean Difference (IV, Random, 95% CI) | ‐0.25 [‐0.59, 0.10] |
| 2.4 Papillary bleeding index | 1 | 32 | Std. Mean Difference (IV, Random, 95% CI) | 0.65 [‐0.07, 1.36] |
| 2.5 BOMP 0‐2 scale | 1 | 75 | Std. Mean Difference (IV, Random, 95% CI) | ‐0.58 [‐1.04, ‐0.12] |
| 3 Plaque scores at >3 months Show forest plot | 7 | 527 | Std. Mean Difference (IV, Random, 95% CI) | ‐0.66 [‐1.28, ‐0.03] |
| 3.1 Quigley Hein (Turesky) | 5 | 339 | Std. Mean Difference (IV, Random, 95% CI) | ‐0.73 [‐1.69, 0.24] |
| 3.2 Silness and Löe | 1 | 77 | Std. Mean Difference (IV, Random, 95% CI) | ‐0.73 [‐1.19, ‐0.26] |
| 3.3 Visible plaque index Ainamo Bay | 1 | 111 | Std. Mean Difference (IV, Random, 95% CI) | ‐0.28 [‐0.66, 0.09] |
| 4 Gingival scores at >3 months Show forest plot | 8 | 684 | Std. Mean Difference (IV, Fixed, 95% CI) | ‐0.35 [‐0.50, ‐0.20] |
| 4.1 Lobene gingival index | 2 | 234 | Std. Mean Difference (IV, Fixed, 95% CI) | ‐0.36 [‐0.62, ‐0.10] |
| 4.2 BOP | 2 | 189 | Std. Mean Difference (IV, Fixed, 95% CI) | ‐0.64 [‐0.93, ‐0.34] |
| 4.3 Löe and Silness | 2 | 154 | Std. Mean Difference (IV, Fixed, 95% CI) | ‐0.25 [‐0.57, 0.07] |
| 4.4 Papillary bleeding index 0‐4 scale | 1 | 32 | Std. Mean Difference (IV, Fixed, 95% CI) | 0.65 [‐0.07, 1.36] |
| 4.5 BOMP 0‐2 scale | 1 | 75 | Std. Mean Difference (IV, Fixed, 95% CI) | ‐0.24 [‐0.69, 0.22] |
| 5 Rotation oscillation versus manual: data not suitable for meta‐analysis Show forest plot | Other data | No numeric data | ||
| Outcome or subgroup title | No. of studies | No. of participants | Statistical method | Effect size |
| 1 Plaque scores at 1 to 3 month at all sites Show forest plot | 2 | 128 | Std. Mean Difference (IV, Fixed, 95% CI) | ‐0.02 [‐0.37, 0.33] |
| 1.1 Quigley Hein (Turesky) | 2 | 128 | Std. Mean Difference (IV, Fixed, 95% CI) | ‐0.02 [‐0.37, 0.33] |
| 1.2 Silness and Löe | 0 | 0 | Std. Mean Difference (IV, Fixed, 95% CI) | 0.0 [0.0, 0.0] |
| 2 Gingival scores at 1 to 3 months at all sites Show forest plot | 2 | 128 | Std. Mean Difference (IV, Fixed, 95% CI) | ‐0.18 [‐0.53, 0.17] |
| 2.1 Löe and Silness | 1 | 63 | Std. Mean Difference (IV, Fixed, 95% CI) | 0.13 [‐0.36, 0.63] |
| 2.2 Lobene gingival index | 1 | 65 | Std. Mean Difference (IV, Fixed, 95% CI) | ‐0.50 [‐0.99, ‐0.00] |
| Outcome or subgroup title | No. of studies | No. of participants | Statistical method | Effect size |
| 1 Plaque scores at 1 to 3 months Show forest plot | 3 | 186 | Std. Mean Difference (IV, Fixed, 95% CI) | ‐0.57 [‐0.87, ‐0.27] |
| 1.1 Quigley Hein (Turesky) | 2 | 116 | Std. Mean Difference (IV, Fixed, 95% CI) | ‐0.30 [‐0.67, 0.06] |
| 1.2 Silness and Löe | 1 | 70 | Std. Mean Difference (IV, Fixed, 95% CI) | ‐1.07 [‐1.57, ‐0.57] |
| 2 Plaque scores at >3 months at all sites Show forest plot | 1 | Mean Difference (IV, Fixed, 95% CI) | Totals not selected | |
| 2.1 Quigley Hein (Turesky) | 1 | Mean Difference (IV, Fixed, 95% CI) | 0.0 [0.0, 0.0] | |
| 3 Gingivitis at 1 to 3 months Show forest plot | 2 | 116 | Mean Difference (IV, Fixed, 95% CI) | ‐0.01 [‐0.04, 0.02] |
| 3.1 Löe and Silness | 2 | 116 | Mean Difference (IV, Fixed, 95% CI) | ‐0.01 [‐0.04, 0.02] |
| 4 Gingival scores at >3 months at all sites Show forest plot | 1 | Mean Difference (IV, Fixed, 95% CI) | Totals not selected | |
| 4.1 Löe and Silness | 1 | Mean Difference (IV, Fixed, 95% CI) | 0.0 [0.0, 0.0] | |
| 5 Ionic versus manual: data not suitable for meta‐analysis Show forest plot | Other data | No numeric data | ||
| Outcome or subgroup title | No. of studies | No. of participants | Statistical method | Effect size |
| 1 Plaque scores at 1 to 3 month at all sites Show forest plot | 4 | 301 | Std. Mean Difference (IV, Fixed, 95% CI) | ‐1.33 [‐1.59, ‐1.07] |
| 1.1 Quigley Hein (Turesky) | 3 | 171 | Std. Mean Difference (IV, Fixed, 95% CI) | ‐0.97 [‐1.30, ‐0.63] |
| 1.2 Navy plaque index mod Rustogi | 1 | 130 | Std. Mean Difference (IV, Fixed, 95% CI) | ‐1.89 [‐2.30, ‐1.47] |
| 2 Gingival scores at 1 to 3 months at all sites Show forest plot | 5 | 354 | Std. Mean Difference (IV, Fixed, 95% CI) | ‐0.99 [‐1.21, ‐0.76] |
| 2.1 Löe and Silness | 3 | 161 | Std. Mean Difference (IV, Fixed, 95% CI) | ‐0.56 [‐0.88, ‐0.25] |
| 2.2 Lobene gingival index | 1 | 130 | Std. Mean Difference (IV, Fixed, 95% CI) | ‐1.80 [‐2.21, ‐1.39] |
| 2.3 Papillary bleeding index 0‐4 scale | 1 | 63 | Std. Mean Difference (IV, Fixed, 95% CI) | ‐0.82 [‐1.34, ‐0.31] |
| 3 Plaque scores at >3 months at all sites Show forest plot | 1 | Mean Difference (IV, Fixed, 95% CI) | Totals not selected | |
| 3.1 Quigley Hein | 1 | Mean Difference (IV, Fixed, 95% CI) | 0.0 [0.0, 0.0] | |
| 4 Gingival scores at >3 months Show forest plot | 1 | Mean Difference (IV, Fixed, 95% CI) | Totals not selected | |
| 4.1 Löe and Silness | 1 | Mean Difference (IV, Fixed, 95% CI) | 0.0 [0.0, 0.0] | |
| 5 Ultrasonic versus manual: data not suitable for meta‐analysis Show forest plot | Other data | No numeric data | ||
| Outcome or subgroup title | No. of studies | No. of participants | Statistical method | Effect size |
| 1 Plaque scores at 1 to 3 months at all sites Show forest plot | 2 | Std. Mean Difference (IV, Fixed, 95% CI) | Totals not selected | |
| 1.1 Quigley Hein (Turesky) | 2 | Std. Mean Difference (IV, Fixed, 95% CI) | 0.0 [0.0, 0.0] | |
| 2 Gingival scores at 1 to 3 months at all sites Show forest plot | 3 | Std. Mean Difference (IV, Fixed, 95% CI) | Totals not selected | |
| 2.1 Löe and Sillness | 3 | Std. Mean Difference (IV, Fixed, 95% CI) | 0.0 [0.0, 0.0] | |
| 3 Gingival scores >3 months at all sites Show forest plot | 1 | Mean Difference (IV, Fixed, 95% CI) | Totals not selected | |
| 3.1 PMA | 1 | Mean Difference (IV, Fixed, 95% CI) | 0.0 [0.0, 0.0] | |