Bromocriptina versus levodopa en la enfermedad de Parkinson temprana
Referencias
Referencias de los estudios incluidos en esta revisión
Referencias de los estudios excluidos de esta revisión
Referencias adicionales
Characteristics of studies
Characteristics of included studies [ordered by study ID]
Ir a:
| Methods | Randomised: randomisation tables. | |
| Participants | Country: Australia. | |
| Interventions | 1) BR monotherapy (start: 1mg/day increased at weekly, then monthly intervals to a max. of 30 mg/day after 40 weeks) [62]. | |
| Outcomes | Dyskinesias: significant more in LD‐group at 1‐2‐3‐4‐5 year(s). | |
| Notes | LD:carbidopa = 4:1. | |
| Risk of bias | ||
| Bias | Authors' judgement | Support for judgement |
| Allocation concealment? | Low risk | A ‐ Adequate |
| Methods | Randomised: unclear. | |
| Participants | Country: Argentina. | |
| Interventions | 1) BR monotherapy (start: 1.25 mg/day increased with 1.25 mg/day to a max. of 15 mg/day) [26]. | |
| Outcomes | Dyskinesias: 1 patient on a low dose of BR and 1 patient in the LD‐group. | |
| Notes | LD:carbidopa = 10:1. | |
| Risk of bias | ||
| Bias | Authors' judgement | Support for judgement |
| Allocation concealment? | Unclear risk | B ‐ Unclear |
| Methods | Randomised: unclear. | |
| Participants | Country: USA. | |
| Interventions | 1) BR monotherapy (start: 1.25 mg/day, increased with 1.25 mg/week) [23]. | |
| Outcomes | Dyskinesias: absent. | |
| Notes | LD:carbidopa = 4:1. | |
| Risk of bias | ||
| Bias | Authors' judgement | Support for judgement |
| Allocation concealment? | Unclear risk | B ‐ Unclear |
| Methods | Randomised: unclear. | |
| Participants | Country: Canada. | |
| Interventions | 1) BR monotherapy (start: 5 mg/day increased every 3rd week to a max. of 30 mg/day [42]. | |
| Outcomes | Dyskinesias were absent. | |
| Notes | LD:carbidopa = 4:1. | |
| Risk of bias | ||
| Bias | Authors' judgement | Support for judgement |
| Allocation concealment? | Unclear risk | B ‐ Unclear |
| Methods | Randomised: random number tables. | |
| Participants | Country: UK. | |
| Interventions | 1) BR monotherapy (start: 2.5 mg/day increased with 2.5 mg/ 3rd day to a max. of 120 mg/d [262]. | |
| Outcomes | Dyskinesias: statistically significant more in LD‐group at 3 years. | |
| Notes | LD:benserazide = 4:1. | |
| Risk of bias | ||
| Bias | Authors' judgement | Support for judgement |
| Allocation concealment? | Low risk | A ‐ Adequate |
| Methods | Randomised: computerised random allocation. | |
| Participants | Country: USA. | |
| Interventions | 1) BR monotherapy (start 1.25 mg/day increased to a max. of 30 mg/day [6]. | |
| Outcomes | Dyskinesias: significant more in LD‐group at 1‐2‐3 year(s). | |
| Notes | LD:carbidopa = 4:1. | |
| Risk of bias | ||
| Bias | Authors' judgement | Support for judgement |
| Allocation concealment? | Low risk | A ‐ Adequate |
ADL: Activities‐of‐daily‐living (scale)
BR: bromocriptine
CURS: Columbia University Rating Scale
DIS: disability
IMP: impairment
LD: levodopa
max.: maximum
(mod.) NUDS: (modified) Northwestern University Disability Scale
(mod.) CURS: (modified) Columbia University Rating Scale
NA: not available
NS: not significant
TP: Total Parkinson's score, a combination of the modified England‐Schwab Disability Scale, a modified Columbia Scale and the Hoehn and Yahr stage with a maximum total score of 420
[X]: number of patients
Characteristics of excluded studies [ordered by study ID]
Ir a:
| Study | Reason for exclusion |
| Bromocriptine or lisuride could be used. Results not split. | |
| Identical to included study of Riopelle 1988. | |
| Identical to included study of Riopelle 1988. | |
| Identical to included study of Riopelle 1988. | |
| Lack of final results. |
Data and analyses
| Outcome or subgroup title | No. of studies | No. of participants | Statistical method | Effect size |
| 1 At one year Show forest plot | 2 | Peto Odds Ratio (Peto, Fixed, 95% CI) | Subtotals only | |
| Analysis 1.1  Comparison 1 Occurrence of dyskinesias, Outcome 1 At one year. | ||||
| 2 At two years Show forest plot | 2 | Peto Odds Ratio (Peto, Fixed, 95% CI) | Subtotals only | |
| Analysis 1.2  Comparison 1 Occurrence of dyskinesias, Outcome 2 At two years. | ||||
| 3 At three years Show forest plot | 3 | Peto Odds Ratio (Peto, Fixed, 95% CI) | Subtotals only | |
| Analysis 1.3  Comparison 1 Occurrence of dyskinesias, Outcome 3 At three years. | ||||
| 4 At four years Show forest plot | 1 | Peto Odds Ratio (Peto, Fixed, 95% CI) | Subtotals only | |
| Analysis 1.4  Comparison 1 Occurrence of dyskinesias, Outcome 4 At four years. | ||||
| 5 At five years Show forest plot | 1 | Peto Odds Ratio (Peto, Fixed, 95% CI) | Subtotals only | |
| Analysis 1.5  Comparison 1 Occurrence of dyskinesias, Outcome 5 At five years. | ||||
| Outcome or subgroup title | No. of studies | No. of participants | Statistical method | Effect size |
| 1 At one year Show forest plot | 3 | Peto Odds Ratio (Peto, Fixed, 95% CI) | Subtotals only | |
| Analysis 2.1  Comparison 2 Occurrence of dystonia, Outcome 1 At one year. | ||||
| 2 At two years Show forest plot | 3 | Peto Odds Ratio (Peto, Fixed, 95% CI) | Subtotals only | |
| Analysis 2.2  Comparison 2 Occurrence of dystonia, Outcome 2 At two years. | ||||
| 3 At three years Show forest plot | 3 | Peto Odds Ratio (Peto, Fixed, 95% CI) | Subtotals only | |
| Analysis 2.3  Comparison 2 Occurrence of dystonia, Outcome 3 At three years. | ||||
| 4 At four years Show forest plot | 1 | Peto Odds Ratio (Peto, Fixed, 95% CI) | Subtotals only | |
| Analysis 2.4  Comparison 2 Occurrence of dystonia, Outcome 4 At four years. | ||||
| 5 At five years Show forest plot | 1 | Peto Odds Ratio (Peto, Fixed, 95% CI) | Subtotals only | |
| Analysis 2.5  Comparison 2 Occurrence of dystonia, Outcome 5 At five years. | ||||
| Outcome or subgroup title | No. of studies | No. of participants | Statistical method | Effect size |
| 1 At one year | 0 | Peto Odds Ratio (Peto, Fixed, 95% CI) | Subtotals only | |
| 2 At two years | 0 | Peto Odds Ratio (Peto, Fixed, 95% CI) | Subtotals only | |
| 3 At three years Show forest plot | 1 | Peto Odds Ratio (Peto, Fixed, 95% CI) | Subtotals only | |
| Analysis 3.3  Comparison 3 Occurrence of on/off‐fluctuations, Outcome 3 At three years. | ||||
| 4 At four years | 0 | Peto Odds Ratio (Peto, Fixed, 95% CI) | Subtotals only | |
| 5 At five years Show forest plot | 1 | Peto Odds Ratio (Peto, Fixed, 95% CI) | Subtotals only | |
| Analysis 3.5  Comparison 3 Occurrence of on/off‐fluctuations, Outcome 5 At five years. | ||||
| Outcome or subgroup title | No. of studies | No. of participants | Statistical method | Effect size |
| 1 At one year Show forest plot | 1 | Peto Odds Ratio (Peto, Fixed, 95% CI) | Subtotals only | |
| Analysis 4.1  Comparison 4 Occurrence of wearing‐off, Outcome 1 At one year. | ||||
| 2 At two years Show forest plot | 1 | Peto Odds Ratio (Peto, Fixed, 95% CI) | Subtotals only | |
| Analysis 4.2  Comparison 4 Occurrence of wearing‐off, Outcome 2 At two years. | ||||
| 3 At three years Show forest plot | 1 | Peto Odds Ratio (Peto, Fixed, 95% CI) | Subtotals only | |
| Analysis 4.3  Comparison 4 Occurrence of wearing‐off, Outcome 3 At three years. | ||||
| 4 At four years Show forest plot | 1 | Peto Odds Ratio (Peto, Fixed, 95% CI) | Subtotals only | |
| Analysis 4.4  Comparison 4 Occurrence of wearing‐off, Outcome 4 At four years. | ||||
| 5 At five years Show forest plot | 1 | Peto Odds Ratio (Peto, Fixed, 95% CI) | Subtotals only | |
| Analysis 4.5  Comparison 4 Occurrence of wearing‐off, Outcome 5 At five years. | ||||
| Outcome or subgroup title | No. of studies | No. of participants | Statistical method | Effect size |
| 1 All causes Show forest plot | 5 | Peto Odds Ratio (Peto, Fixed, 95% CI) | Subtotals only | |
| Analysis 5.1  Comparison 5 Withdrawal rate, Outcome 1 All causes. | ||||
| 2 Lost to follow up Show forest plot | 2 | Peto Odds Ratio (Peto, Fixed, 95% CI) | Subtotals only | |
| Analysis 5.2  Comparison 5 Withdrawal rate, Outcome 2 Lost to follow up. | ||||
| 3 Poor compliance Show forest plot | 1 | Peto Odds Ratio (Peto, Fixed, 95% CI) | Subtotals only | |
| Analysis 5.3  Comparison 5 Withdrawal rate, Outcome 3 Poor compliance. | ||||
| 4 Protocol violation Show forest plot | 1 | Peto Odds Ratio (Peto, Fixed, 95% CI) | Subtotals only | |
| Analysis 5.4  Comparison 5 Withdrawal rate, Outcome 4 Protocol violation. | ||||
| 5 Lack of response Show forest plot | 1 | Peto Odds Ratio (Peto, Fixed, 95% CI) | Subtotals only | |
| Analysis 5.5  Comparison 5 Withdrawal rate, Outcome 5 Lack of response. | ||||
| 6 Deterioration Show forest plot | 1 | Peto Odds Ratio (Peto, Fixed, 95% CI) | Subtotals only | |
| Analysis 5.6  Comparison 5 Withdrawal rate, Outcome 6 Deterioration. | ||||
| 7 Adverse reaction Show forest plot | 4 | Peto Odds Ratio (Peto, Fixed, 95% CI) | Totals not selected | |
| Analysis 5.7  Comparison 5 Withdrawal rate, Outcome 7 Adverse reaction. | ||||
| 7.1 Hallucinations/confusion | 2 | Peto Odds Ratio (Peto, Fixed, 95% CI) | 0.0 [0.0, 0.0] | |
| 7.2 Nausea | 2 | Peto Odds Ratio (Peto, Fixed, 95% CI) | 0.0 [0.0, 0.0] | |
| 7.3 Orthostase | 1 | Peto Odds Ratio (Peto, Fixed, 95% CI) | 0.0 [0.0, 0.0] | |
| 7.4 Other/unclear | 2 | Peto Odds Ratio (Peto, Fixed, 95% CI) | 0.0 [0.0, 0.0] | |
| 8 Revised diagnosis Show forest plot | 1 | Peto Odds Ratio (Peto, Fixed, 95% CI) | Subtotals only | |
| Analysis 5.8  Comparison 5 Withdrawal rate, Outcome 8 Revised diagnosis. | ||||

Comparison 1 Occurrence of dyskinesias, Outcome 1 At one year.
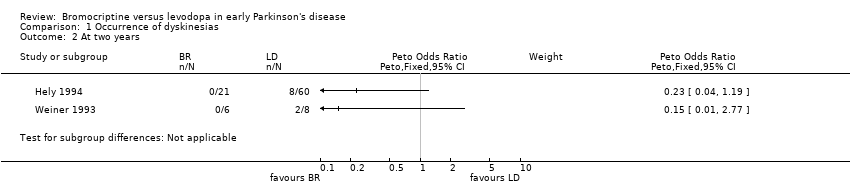
Comparison 1 Occurrence of dyskinesias, Outcome 2 At two years.

Comparison 1 Occurrence of dyskinesias, Outcome 3 At three years.

Comparison 1 Occurrence of dyskinesias, Outcome 4 At four years.
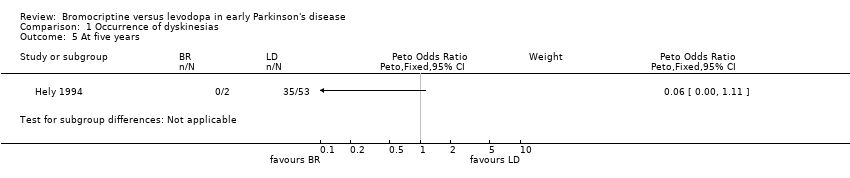
Comparison 1 Occurrence of dyskinesias, Outcome 5 At five years.

Comparison 2 Occurrence of dystonia, Outcome 1 At one year.

Comparison 2 Occurrence of dystonia, Outcome 2 At two years.

Comparison 2 Occurrence of dystonia, Outcome 3 At three years.

Comparison 2 Occurrence of dystonia, Outcome 4 At four years.

Comparison 2 Occurrence of dystonia, Outcome 5 At five years.

Comparison 3 Occurrence of on/off‐fluctuations, Outcome 3 At three years.
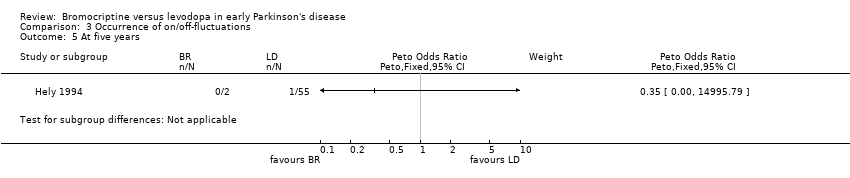
Comparison 3 Occurrence of on/off‐fluctuations, Outcome 5 At five years.
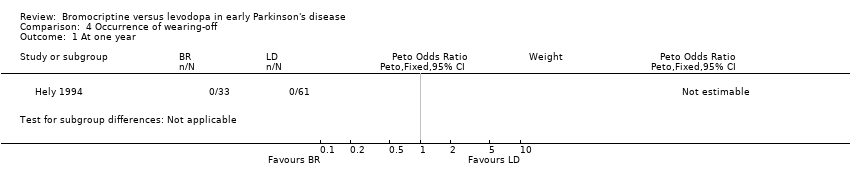
Comparison 4 Occurrence of wearing‐off, Outcome 1 At one year.

Comparison 4 Occurrence of wearing‐off, Outcome 2 At two years.

Comparison 4 Occurrence of wearing‐off, Outcome 3 At three years.

Comparison 4 Occurrence of wearing‐off, Outcome 4 At four years.

Comparison 4 Occurrence of wearing‐off, Outcome 5 At five years.
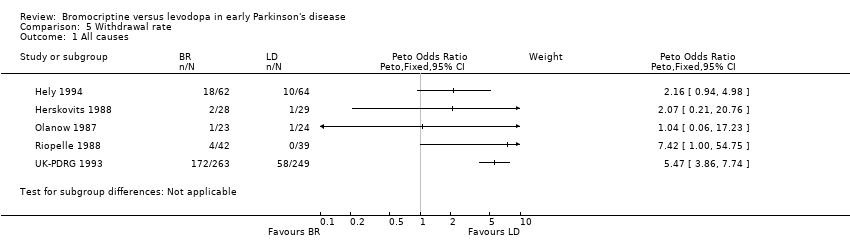
Comparison 5 Withdrawal rate, Outcome 1 All causes.
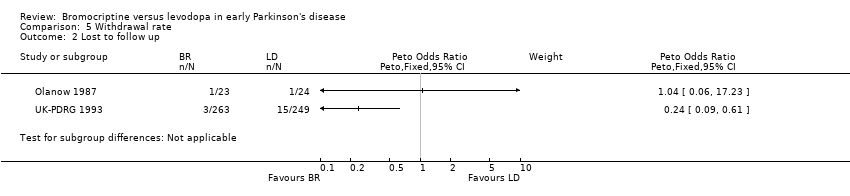
Comparison 5 Withdrawal rate, Outcome 2 Lost to follow up.

Comparison 5 Withdrawal rate, Outcome 3 Poor compliance.
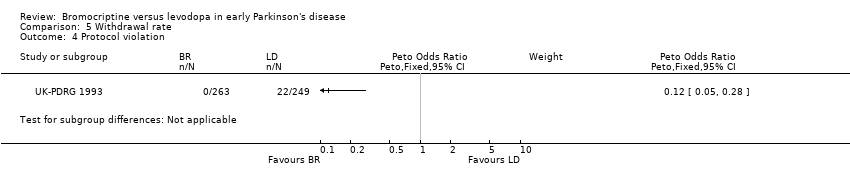
Comparison 5 Withdrawal rate, Outcome 4 Protocol violation.

Comparison 5 Withdrawal rate, Outcome 5 Lack of response.
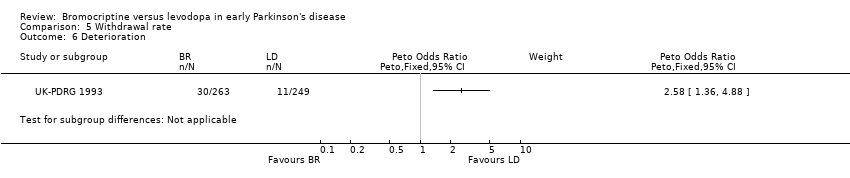
Comparison 5 Withdrawal rate, Outcome 6 Deterioration.
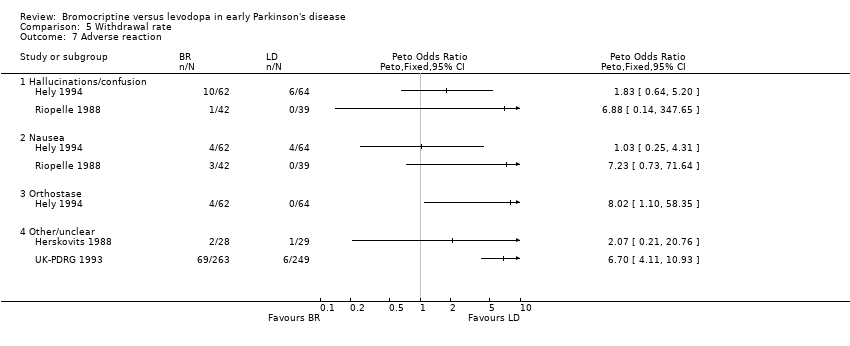
Comparison 5 Withdrawal rate, Outcome 7 Adverse reaction.

Comparison 5 Withdrawal rate, Outcome 8 Revised diagnosis.
| Outcome or subgroup title | No. of studies | No. of participants | Statistical method | Effect size |
| 1 At one year Show forest plot | 2 | Peto Odds Ratio (Peto, Fixed, 95% CI) | Subtotals only | |
| 2 At two years Show forest plot | 2 | Peto Odds Ratio (Peto, Fixed, 95% CI) | Subtotals only | |
| 3 At three years Show forest plot | 3 | Peto Odds Ratio (Peto, Fixed, 95% CI) | Subtotals only | |
| 4 At four years Show forest plot | 1 | Peto Odds Ratio (Peto, Fixed, 95% CI) | Subtotals only | |
| 5 At five years Show forest plot | 1 | Peto Odds Ratio (Peto, Fixed, 95% CI) | Subtotals only | |
| Outcome or subgroup title | No. of studies | No. of participants | Statistical method | Effect size |
| 1 At one year Show forest plot | 3 | Peto Odds Ratio (Peto, Fixed, 95% CI) | Subtotals only | |
| 2 At two years Show forest plot | 3 | Peto Odds Ratio (Peto, Fixed, 95% CI) | Subtotals only | |
| 3 At three years Show forest plot | 3 | Peto Odds Ratio (Peto, Fixed, 95% CI) | Subtotals only | |
| 4 At four years Show forest plot | 1 | Peto Odds Ratio (Peto, Fixed, 95% CI) | Subtotals only | |
| 5 At five years Show forest plot | 1 | Peto Odds Ratio (Peto, Fixed, 95% CI) | Subtotals only | |
| Outcome or subgroup title | No. of studies | No. of participants | Statistical method | Effect size |
| 1 At one year | 0 | Peto Odds Ratio (Peto, Fixed, 95% CI) | Subtotals only | |
| 2 At two years | 0 | Peto Odds Ratio (Peto, Fixed, 95% CI) | Subtotals only | |
| 3 At three years Show forest plot | 1 | Peto Odds Ratio (Peto, Fixed, 95% CI) | Subtotals only | |
| 4 At four years | 0 | Peto Odds Ratio (Peto, Fixed, 95% CI) | Subtotals only | |
| 5 At five years Show forest plot | 1 | Peto Odds Ratio (Peto, Fixed, 95% CI) | Subtotals only | |
| Outcome or subgroup title | No. of studies | No. of participants | Statistical method | Effect size |
| 1 At one year Show forest plot | 1 | Peto Odds Ratio (Peto, Fixed, 95% CI) | Subtotals only | |
| 2 At two years Show forest plot | 1 | Peto Odds Ratio (Peto, Fixed, 95% CI) | Subtotals only | |
| 3 At three years Show forest plot | 1 | Peto Odds Ratio (Peto, Fixed, 95% CI) | Subtotals only | |
| 4 At four years Show forest plot | 1 | Peto Odds Ratio (Peto, Fixed, 95% CI) | Subtotals only | |
| 5 At five years Show forest plot | 1 | Peto Odds Ratio (Peto, Fixed, 95% CI) | Subtotals only | |
| Outcome or subgroup title | No. of studies | No. of participants | Statistical method | Effect size |
| 1 All causes Show forest plot | 5 | Peto Odds Ratio (Peto, Fixed, 95% CI) | Subtotals only | |
| 2 Lost to follow up Show forest plot | 2 | Peto Odds Ratio (Peto, Fixed, 95% CI) | Subtotals only | |
| 3 Poor compliance Show forest plot | 1 | Peto Odds Ratio (Peto, Fixed, 95% CI) | Subtotals only | |
| 4 Protocol violation Show forest plot | 1 | Peto Odds Ratio (Peto, Fixed, 95% CI) | Subtotals only | |
| 5 Lack of response Show forest plot | 1 | Peto Odds Ratio (Peto, Fixed, 95% CI) | Subtotals only | |
| 6 Deterioration Show forest plot | 1 | Peto Odds Ratio (Peto, Fixed, 95% CI) | Subtotals only | |
| 7 Adverse reaction Show forest plot | 4 | Peto Odds Ratio (Peto, Fixed, 95% CI) | Totals not selected | |
| 7.1 Hallucinations/confusion | 2 | Peto Odds Ratio (Peto, Fixed, 95% CI) | 0.0 [0.0, 0.0] | |
| 7.2 Nausea | 2 | Peto Odds Ratio (Peto, Fixed, 95% CI) | 0.0 [0.0, 0.0] | |
| 7.3 Orthostase | 1 | Peto Odds Ratio (Peto, Fixed, 95% CI) | 0.0 [0.0, 0.0] | |
| 7.4 Other/unclear | 2 | Peto Odds Ratio (Peto, Fixed, 95% CI) | 0.0 [0.0, 0.0] | |
| 8 Revised diagnosis Show forest plot | 1 | Peto Odds Ratio (Peto, Fixed, 95% CI) | Subtotals only | |