Técnicas para la prevención de la hipotensión durante la anestesia espinal para la cesárea
Información
- DOI:
- https://doi.org/10.1002/14651858.CD002251.pub3Copiar DOI

- Base de datos:
-
- Cochrane Database of Systematic Reviews
- Versión publicada:
-
- 04 agosto 2017see what's new
- Tipo:
-
- Intervention
- Etapa:
-
- Review
- Grupo Editorial Cochrane:
-
Grupo Cochrane de Embarazo y parto
- Copyright:
-
- Copyright © 2017 The Cochrane Collaboration. Published by John Wiley & Sons, Ltd.
Cifras del artículo
Altmetric:
Citado por:
Autores
Contributions of authors
Planning review: Allan Cyna, Scott Simmons.
Writing protocol: Allan Cyna, Scott Simmons.
Revising protocol: Allan Cyna, Richard Emmett, Scott Simmons.
Retrieving papers for review: Richard Emmett.
Extracting data from reviewed papers: Cheryl Chooi, Julia Cox, Richard Lumb.
Writing draft review: Richard Emmett, Allan Cyna.
Revising original review: Scott Simmons, Allan Cyna, Richard Emmett.
First update and amendments: Allan Cyna, Richard Emmett, Philippa Middleton.
Second update (2006) and amendments: Allan Cyna and Philippa Middleton, with comments from the other review authors.
Third update (2017) and amendments: Cheryl Chooi, Julia Cox, Richard Lumb.
Sources of support
Internal sources
-
Discipline of Obstetrics and Gynaecology, The University of Adelaide, Australia.
-
Department of Health and Ageing, Australia.
External sources
-
No sources of support supplied
Declarations of interest
Cheryl Chooi: none known.
Richard S Lumb: none known.
Julia J Cox: none known.
Richard S Emmett: none known.
Philippa Middleton: none known.
Scott W Simmons: none known.
Mark Chemali: none known.
Allan M Cyna: is also an author of one of the included studies (Cyna 2010). CC and RSL extracted data from this study.
Acknowledgements
Thanks to Caroline Crowther and Charlotte Howell for helpful comments on the protocol. We also thank Gill Gyte and Beth Shearer for their extremely useful consumer feedback, and Jacques Riad for assistance with translation. Thanks also to Marion Andrew for her contribution as an author on the original protocol and review.
We would like to thank Anna Cuthbert and Lambert Felix, Cochrane Pregnancy and Childbirth and Jane Marjoribanks, Cochrane Editorial Unit, for their contribution to the current update (2017).
This project was supported by the National Institute for Health Research, via Cochrane Infrastructure funding to Cochrane Pregnancy and Childbirth. The views and opinions expressed therein are those of the authors and do not necessarily reflect those of the Systematic Reviews Programme, NIHR, NHS, or the Department of Health.
Version history
| Published | Title | Stage | Authors | Version |
| 2020 Jul 01 | Techniques for preventing hypotension during spinal anaesthesia for caesarean section | Review | Cheryl Chooi, Julia J Cox, Richard S Lumb, Philippa Middleton, Mark Chemali, Richard S Emmett, Scott W Simmons, Allan M Cyna | |
| 2017 Aug 04 | Techniques for preventing hypotension during spinal anaesthesia for caesarean section | Review | Cheryl Chooi, Julia J Cox, Richard S Lumb, Philippa Middleton, Mark Chemali, Richard S Emmett, Scott W Simmons, Allan M Cyna | |
| 2006 Oct 18 | Techniques for preventing hypotension during spinal anaesthesia for caesarean section | Review | Allan M Cyna, Marion Andrew, Richard S Emmett, Philippa Middleton, Scott W Simmons | |
| 2002 Jul 22 | Techniques for preventing hypotension during spinal anaesthesia for caesarean section | Review | Richard S Emmett, Allan M Cyna, Marion Andrew, Scott W Simmons | |
Differences between protocol and review
In this update (2017), the criteria for considering studies for this review were changed to exclude:
-
quasi‐randomised, cluster or cross‐over studies;
-
studies in which women received combined spinal‐epidural anaesthesia or epidural anaesthesia.
Primary and secondary outcomes were specified from the main and other outcomes.
We reported Apgar scores as they were reported by trialists. This meant that as well as Apgar scores of less than 7 or 8 at five minutes, we reported Apgar scores of less than 9 at five minutes.
We only performed assessment of publication bias through funnel plots for the primary outcome, as it was likely caused by the large amount of small trials that contributed to all the analyses.
Notes
None.
Keywords
MeSH
Medical Subject Headings (MeSH) Keywords
Medical Subject Headings Check Words
Female; Humans; Pregnancy;
PICO

Risk of bias graph: review authors' judgements about each risk of bias item presented as percentages across all included studies.

Risk of bias summary: review authors' judgements about each risk of bias item for each included study.
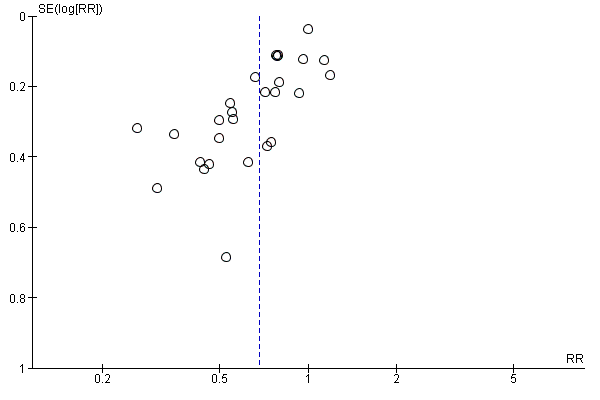
Funnel plot of comparison: 7 Colloid vs crystalloid, outcome: 7.1 Women with hypotension requiring intervention.

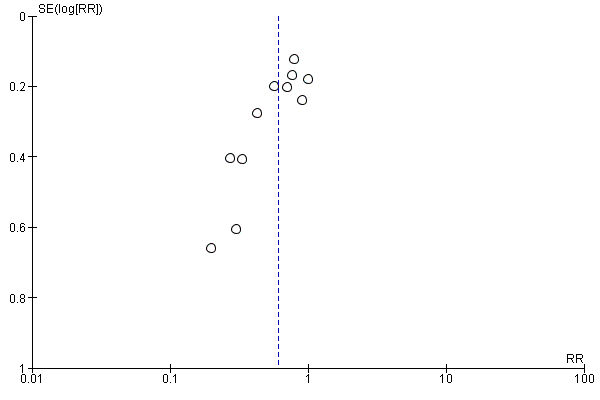
Funnel plot of comparison: 13 Ephedrine vs control, outcome: 13.1 Women with hypotension requiring intervention.
Funnel plot of comparison: 47 Lower limb compression vs control, outcome: 47.1 Women with hypotension requiring intervention.

Comparison 1 Crystalloid vs control, Outcome 1 Women with hypotension requiring intervention.
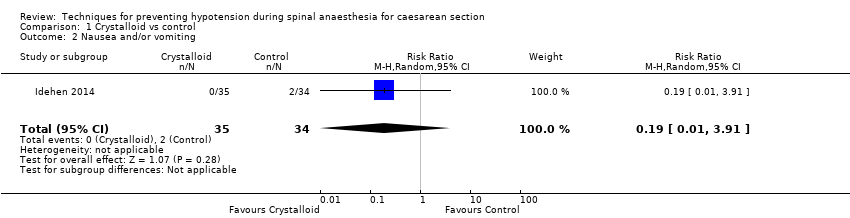
Comparison 1 Crystalloid vs control, Outcome 2 Nausea and/or vomiting.

Comparison 1 Crystalloid vs control, Outcome 3 Anaphylaxis.

Comparison 1 Crystalloid vs control, Outcome 4 Apgar < 8 at 5 min.

Comparison 2 Crystalloid: rapid infusion vs slow infusion, Outcome 1 Women with hypotension requiring intervention.

Comparison 3 Crystalloid: high vs low preload volume, Outcome 1 Women with hypotension requiring intervention.
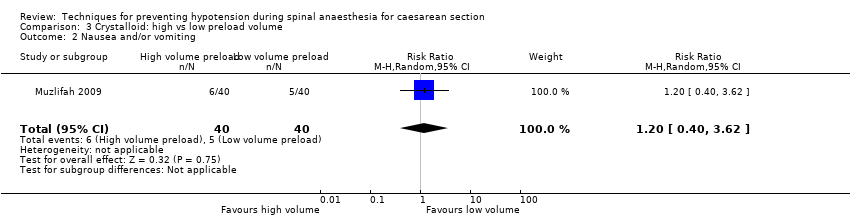
Comparison 3 Crystalloid: high vs low preload volume, Outcome 2 Nausea and/or vomiting.
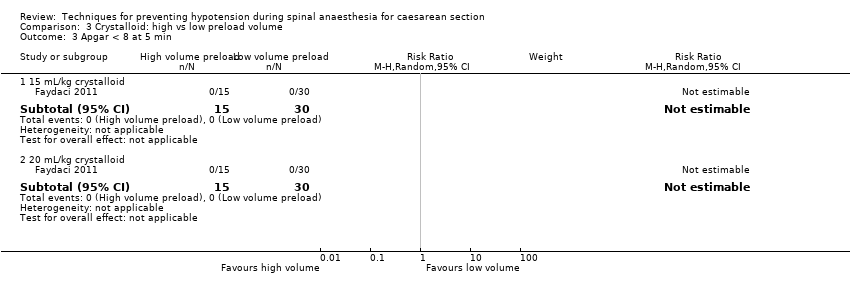
Comparison 3 Crystalloid: high vs low preload volume, Outcome 3 Apgar < 8 at 5 min.
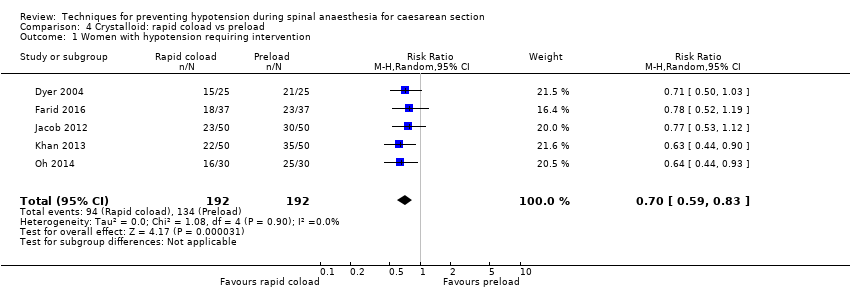
Comparison 4 Crystalloid: rapid coload vs preload, Outcome 1 Women with hypotension requiring intervention.

Comparison 4 Crystalloid: rapid coload vs preload, Outcome 2 Hypertension requiring intervention.

Comparison 4 Crystalloid: rapid coload vs preload, Outcome 3 Women with bradycardia.
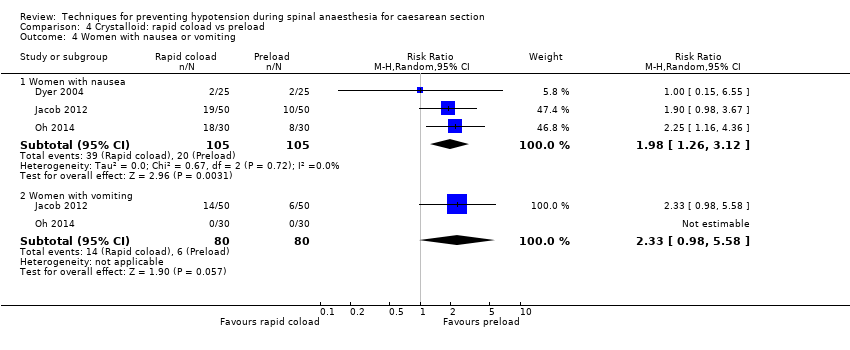
Comparison 4 Crystalloid: rapid coload vs preload, Outcome 4 Women with nausea or vomiting.
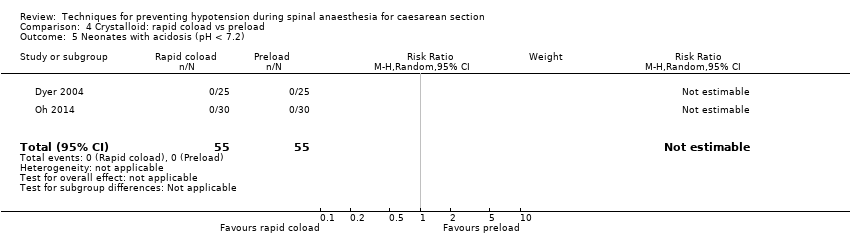
Comparison 4 Crystalloid: rapid coload vs preload, Outcome 5 Neonates with acidosis (pH < 7.2).

Comparison 4 Crystalloid: rapid coload vs preload, Outcome 6 Apgar < 8 at 5 min.

Comparison 5 Crystalloid: warm vs cold, Outcome 1 Women with hypotension requiring intervention.
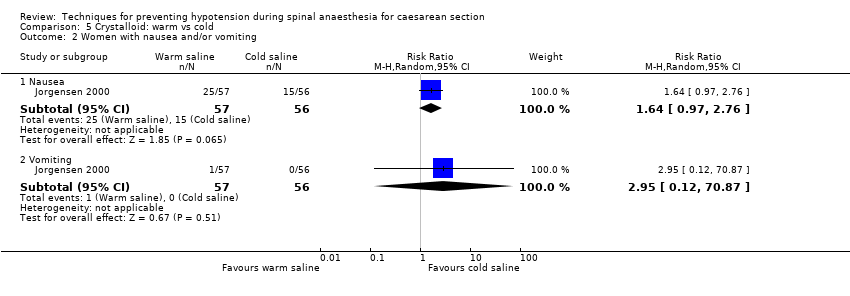
Comparison 5 Crystalloid: warm vs cold, Outcome 2 Women with nausea and/or vomiting.
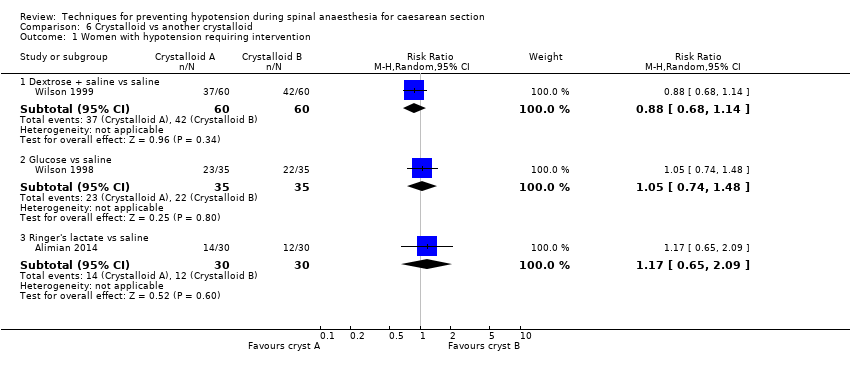
Comparison 6 Crystalloid vs another crystalloid, Outcome 1 Women with hypotension requiring intervention.
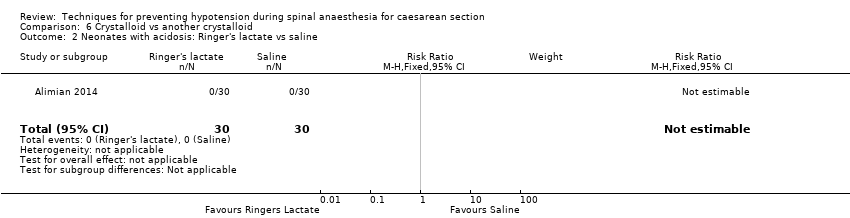
Comparison 6 Crystalloid vs another crystalloid, Outcome 2 Neonates with acidosis: Ringer's lactate vs saline.

Comparison 6 Crystalloid vs another crystalloid, Outcome 3 Neonates with acidosis: dextrose vs saline.

Comparison 6 Crystalloid vs another crystalloid, Outcome 4 Neonates with Apgar score < 7 at 5 min.
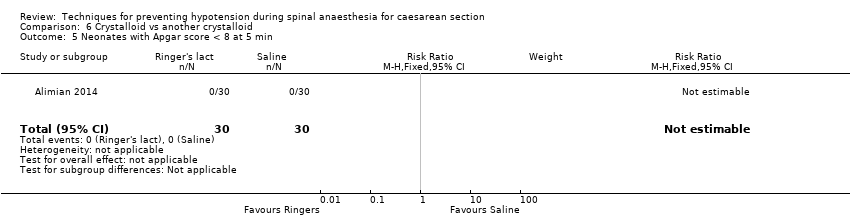
Comparison 6 Crystalloid vs another crystalloid, Outcome 5 Neonates with Apgar score < 8 at 5 min.
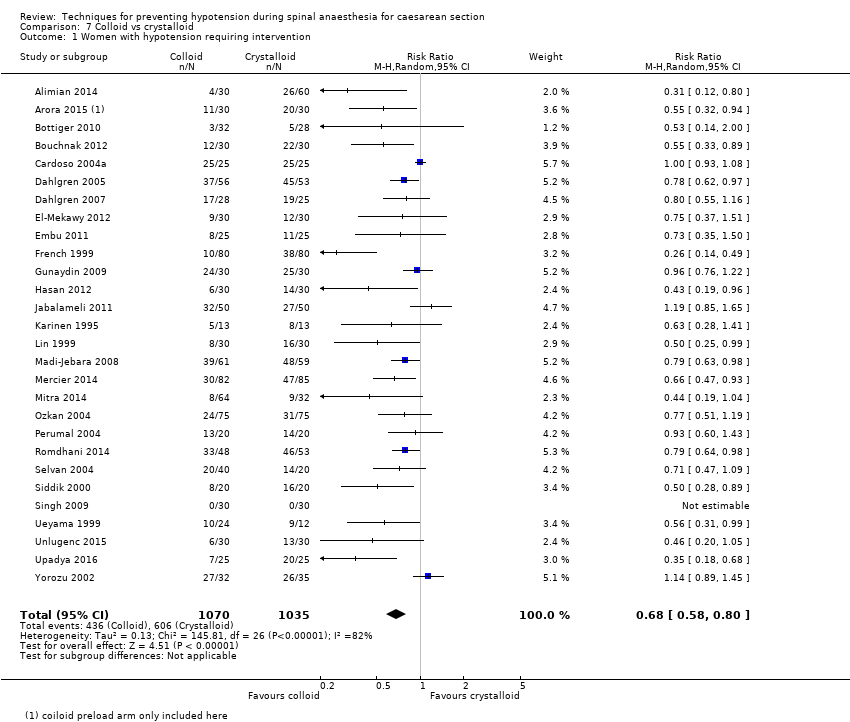
Comparison 7 Colloid vs crystalloid, Outcome 1 Women with hypotension requiring intervention.
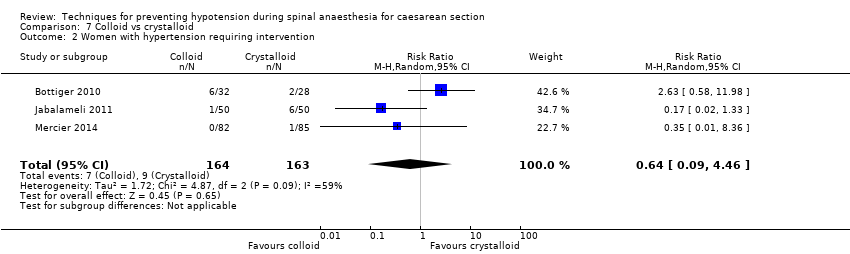
Comparison 7 Colloid vs crystalloid, Outcome 2 Women with hypertension requiring intervention.

Comparison 7 Colloid vs crystalloid, Outcome 3 Women with cardiac dysrhythmia.

Comparison 7 Colloid vs crystalloid, Outcome 4 Women with nausea and/or vomiting.
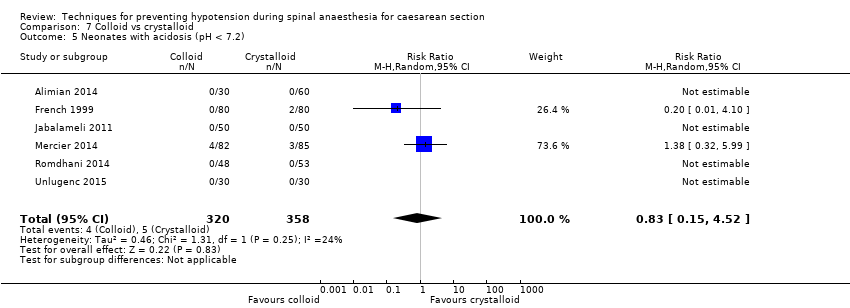
Comparison 7 Colloid vs crystalloid, Outcome 5 Neonates with acidosis (pH < 7.2).

Comparison 7 Colloid vs crystalloid, Outcome 6 Neonates: Apgar score.
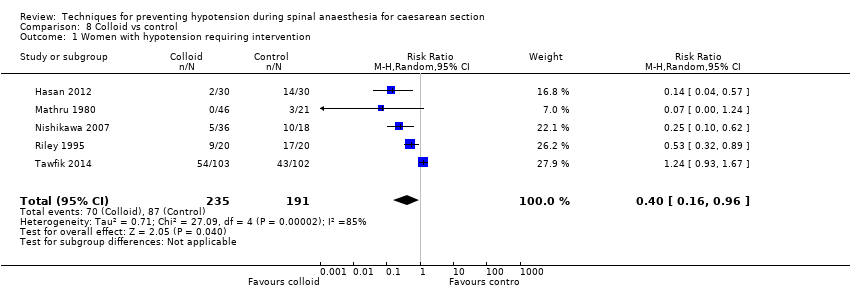
Comparison 8 Colloid vs control, Outcome 1 Women with hypotension requiring intervention.

Comparison 8 Colloid vs control, Outcome 2 Women with bradycardia.
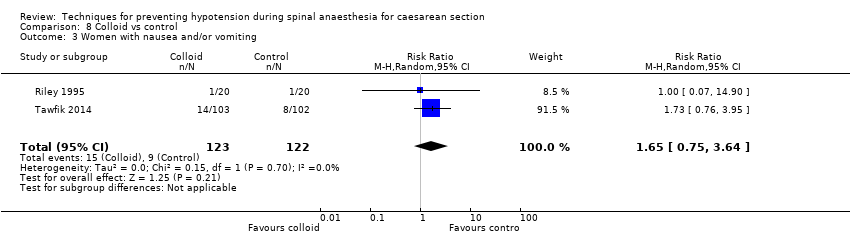
Comparison 8 Colloid vs control, Outcome 3 Women with nausea and/or vomiting.

Comparison 8 Colloid vs control, Outcome 4 Neonates with acidosis (pH < 7.2).

Comparison 8 Colloid vs control, Outcome 5 Neonates with Apgar score < 7 at 5 min.

Comparison 8 Colloid vs control, Outcome 6 Neonatal Apgar < 8 at 5 min.
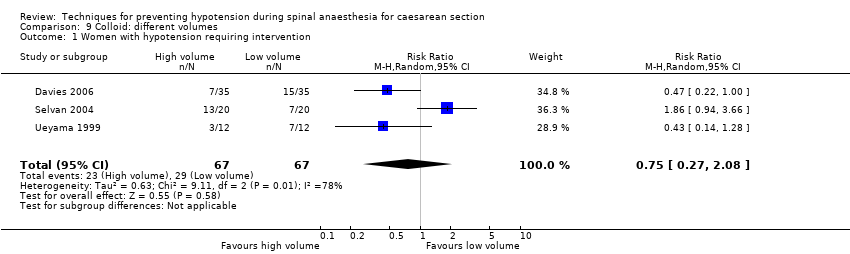
Comparison 9 Colloid: different volumes, Outcome 1 Women with hypotension requiring intervention.

Comparison 9 Colloid: different volumes, Outcome 2 Apgar < 9 at 5 min.

Comparison 10 Colloid preload vs colloid coload, Outcome 1 Women with hypotension requiring intervention.
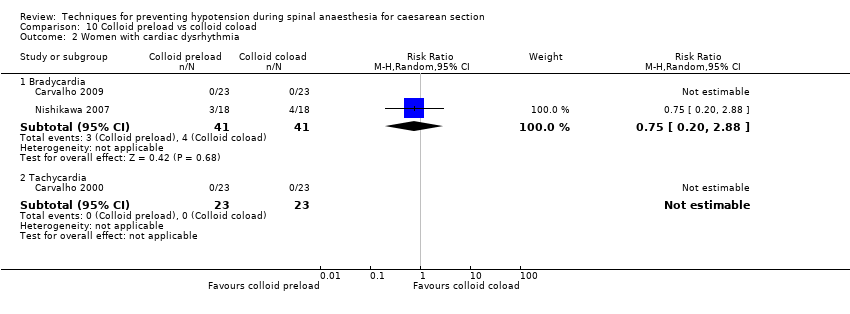
Comparison 10 Colloid preload vs colloid coload, Outcome 2 Women with cardiac dysrhythmia.

Comparison 10 Colloid preload vs colloid coload, Outcome 3 Women with nausea and/or vomiting.

Comparison 10 Colloid preload vs colloid coload, Outcome 4 Women with anaphylaxis.
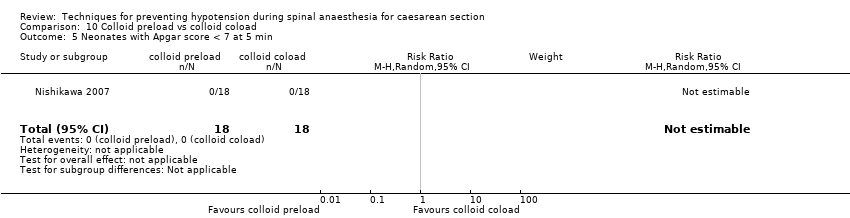
Comparison 10 Colloid preload vs colloid coload, Outcome 5 Neonates with Apgar score < 7 at 5 min.

Comparison 11 Colloid + crystalloid vs another colloid + crystalloid, Outcome 1 Women with hypotension requiring intervention.
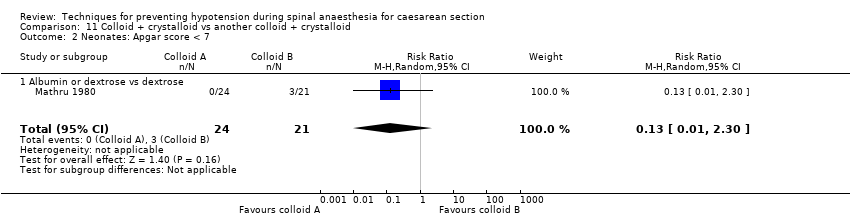
Comparison 11 Colloid + crystalloid vs another colloid + crystalloid, Outcome 2 Neonates: Apgar score < 7.

Comparison 11 Colloid + crystalloid vs another colloid + crystalloid, Outcome 3 Neonates with Apgar score < 8 at 5 min.
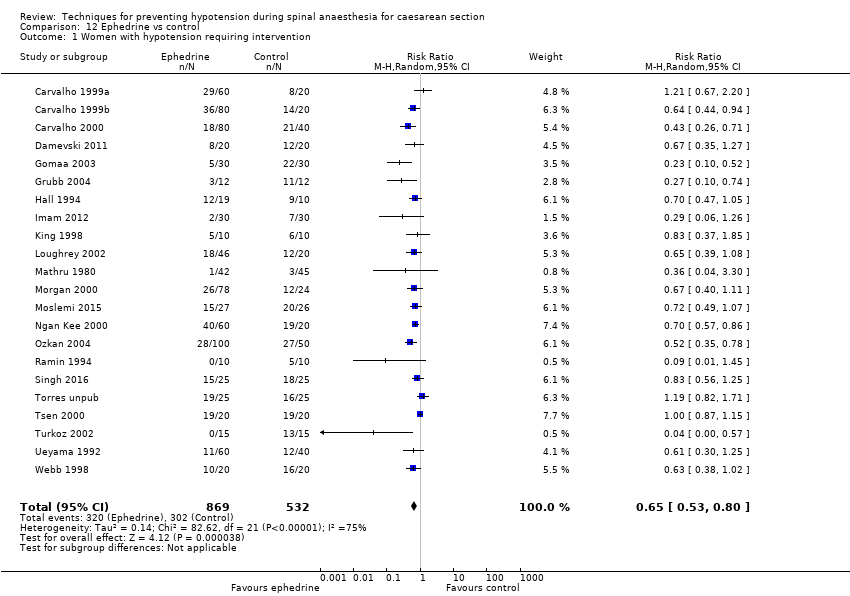
Comparison 12 Ephedrine vs control, Outcome 1 Women with hypotension requiring intervention.
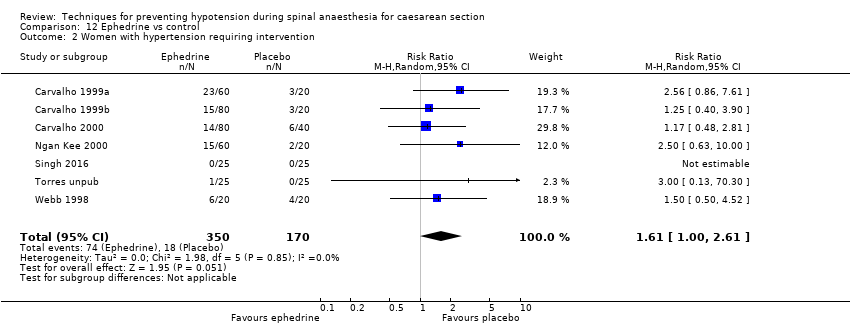
Comparison 12 Ephedrine vs control, Outcome 2 Women with hypertension requiring intervention.

Comparison 12 Ephedrine vs control, Outcome 3 Women with cardiac arrhythmia.
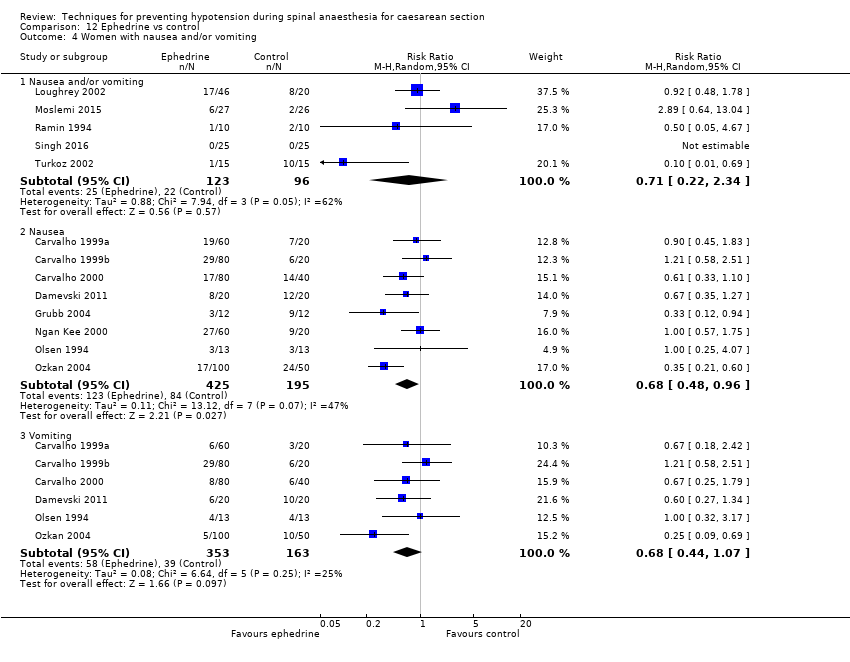
Comparison 12 Ephedrine vs control, Outcome 4 Women with nausea and/or vomiting.

Comparison 12 Ephedrine vs control, Outcome 5 Neonates with acidosis (pH < 7.2).

Comparison 12 Ephedrine vs control, Outcome 6 Neonates: Apgar score.

Comparison 13 Ephedrine vs crystalloid, Outcome 1 Women with hypotension requiring intervention.
Comparison 13 Ephedrine vs crystalloid, Outcome 2 Women with hypertension requiring intervention.

Comparison 13 Ephedrine vs crystalloid, Outcome 3 Women with bradycardia.

Comparison 13 Ephedrine vs crystalloid, Outcome 4 Women with nausea and/or vomiting.

Comparison 13 Ephedrine vs crystalloid, Outcome 5 Women with impaired consciousness.
Comparison 13 Ephedrine vs crystalloid, Outcome 6 Neonates with acidosis (pH < 7.2).
Comparison 13 Ephedrine vs crystalloid, Outcome 7 Neonatal Apgar score.

Comparison 14 Ephedrine + crystalloid vs colloid, Outcome 1 Women with hypotension requiring intervention.
Comparison 14 Ephedrine + crystalloid vs colloid, Outcome 2 Women with nausea and/or vomiting.
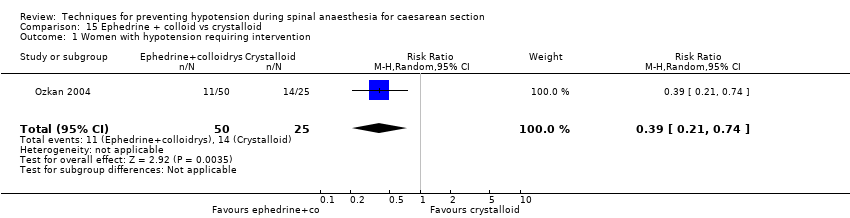
Comparison 15 Ephedrine + colloid vs crystalloid, Outcome 1 Women with hypotension requiring intervention.
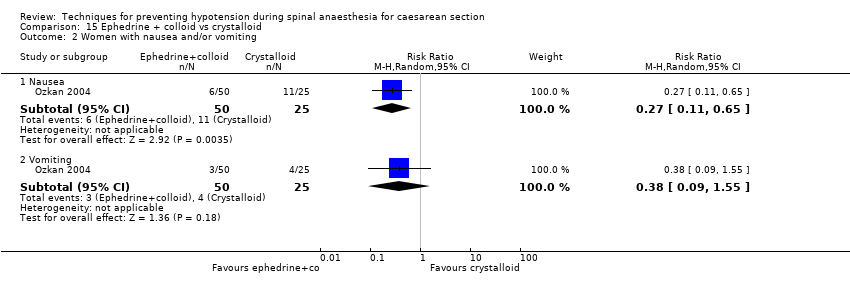
Comparison 15 Ephedrine + colloid vs crystalloid, Outcome 2 Women with nausea and/or vomiting.

Comparison 16 Ephedrine vs phenylephrine, Outcome 1 Women with hypotension requiring intervention.

Comparison 16 Ephedrine vs phenylephrine, Outcome 2 Women with hypertension requiring intervention.

Comparison 16 Ephedrine vs phenylephrine, Outcome 3 Cardiac dysrhythmia.

Comparison 16 Ephedrine vs phenylephrine, Outcome 4 Women with nausea and/or vomiting.
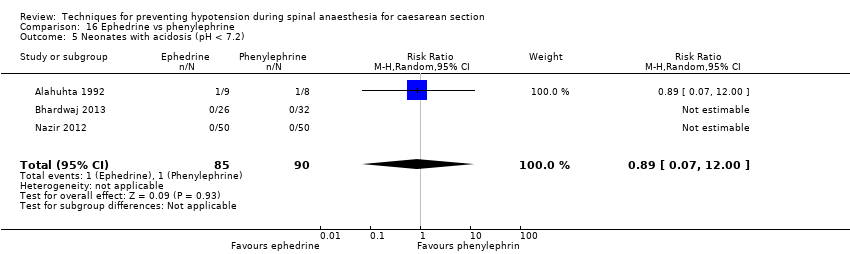
Comparison 16 Ephedrine vs phenylephrine, Outcome 5 Neonates with acidosis (pH < 7.2).

Comparison 16 Ephedrine vs phenylephrine, Outcome 6 Neonates with Apgar score < 8 at 5 min.

Comparison 17 Ephedrine vs angiotensin, Outcome 1 Women with hypotension requiring intervention.

Comparison 17 Ephedrine vs angiotensin, Outcome 2 Women with nausea and/or vomiting.

Comparison 17 Ephedrine vs angiotensin, Outcome 3 Neonates with acidosis (pH < 7.2).

Comparison 18 Ephedrine vs colloid, Outcome 1 Women with hypotension requiring intervention.

Comparison 18 Ephedrine vs colloid, Outcome 2 Women with hypertension requiring intervention.

Comparison 18 Ephedrine vs colloid, Outcome 3 Women with bradycardia.
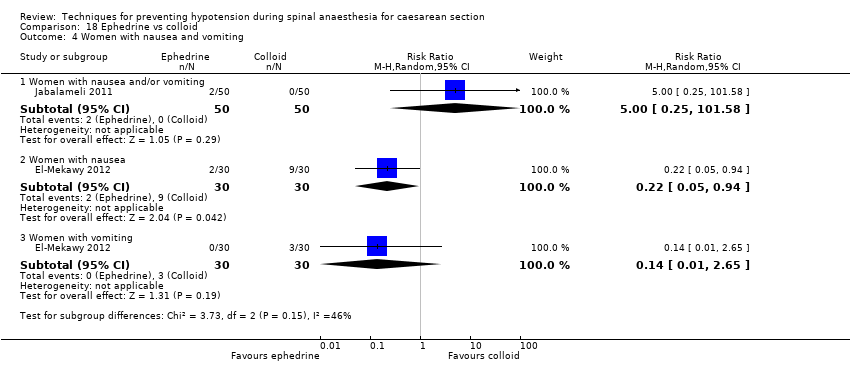
Comparison 18 Ephedrine vs colloid, Outcome 4 Women with nausea and vomiting.

Comparison 18 Ephedrine vs colloid, Outcome 5 5 Neonates with acidosis (pH < 7.2).

Comparison 18 Ephedrine vs colloid, Outcome 6 Apgar score < 8 at 5 min.

Comparison 19 Ephedrine vs metaraminol, Outcome 1 Women with hypotension requiring intervention.
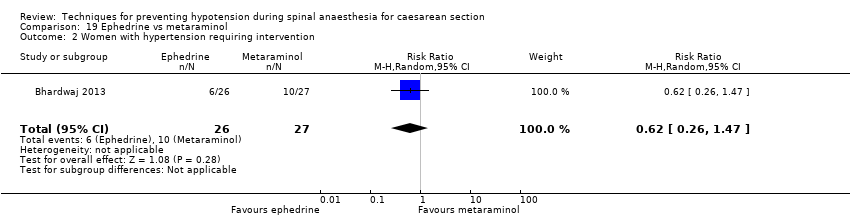
Comparison 19 Ephedrine vs metaraminol, Outcome 2 Women with hypertension requiring intervention.

Comparison 19 Ephedrine vs metaraminol, Outcome 3 Women with bradycardia.
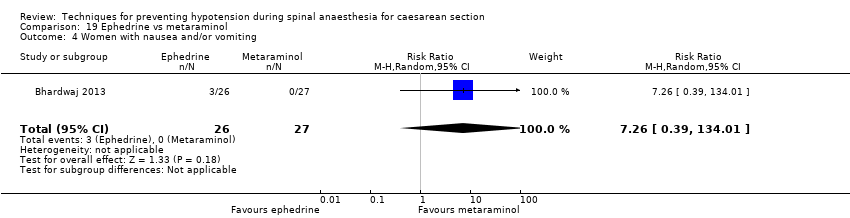
Comparison 19 Ephedrine vs metaraminol, Outcome 4 Women with nausea and/or vomiting.
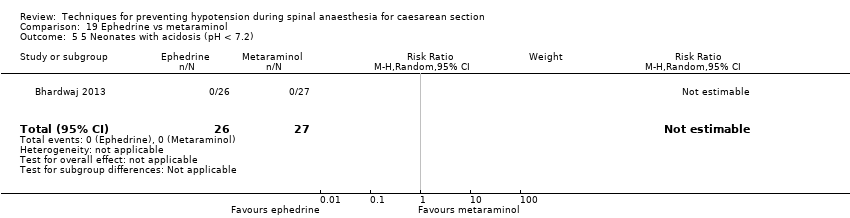
Comparison 19 Ephedrine vs metaraminol, Outcome 5 5 Neonates with acidosis (pH < 7.2).

Comparison 19 Ephedrine vs metaraminol, Outcome 6 Neonatal Apgar score < 8 at 5 min.

Comparison 20 Ephedrine: different doses, Outcome 1 Women with hypotension requiring intervention.

Comparison 20 Ephedrine: different doses, Outcome 2 Women with hypertension requiring intervention.

Comparison 20 Ephedrine: different doses, Outcome 3 Women with nausea and/or vomiting.
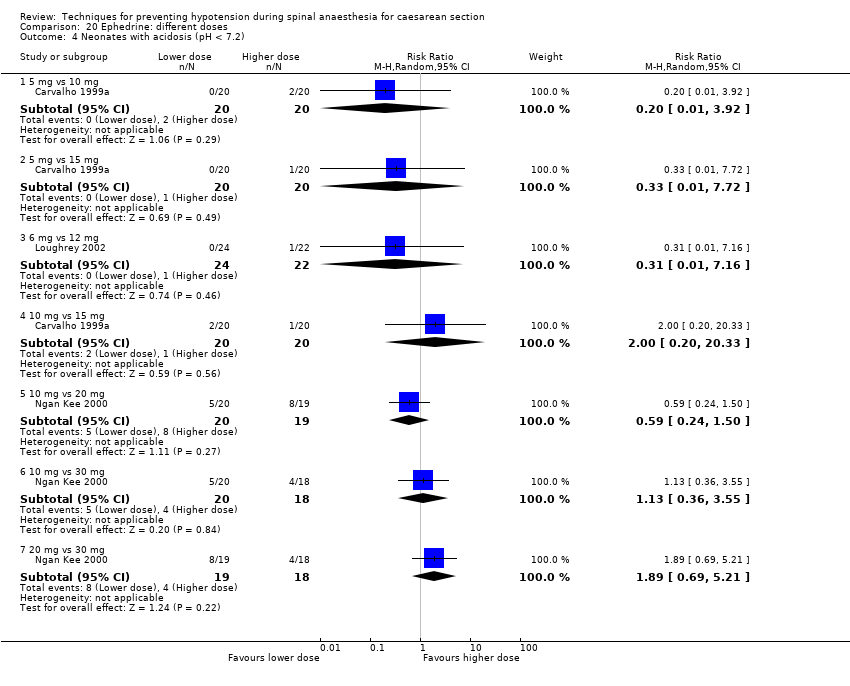
Comparison 20 Ephedrine: different doses, Outcome 4 Neonates with acidosis (pH < 7.2).
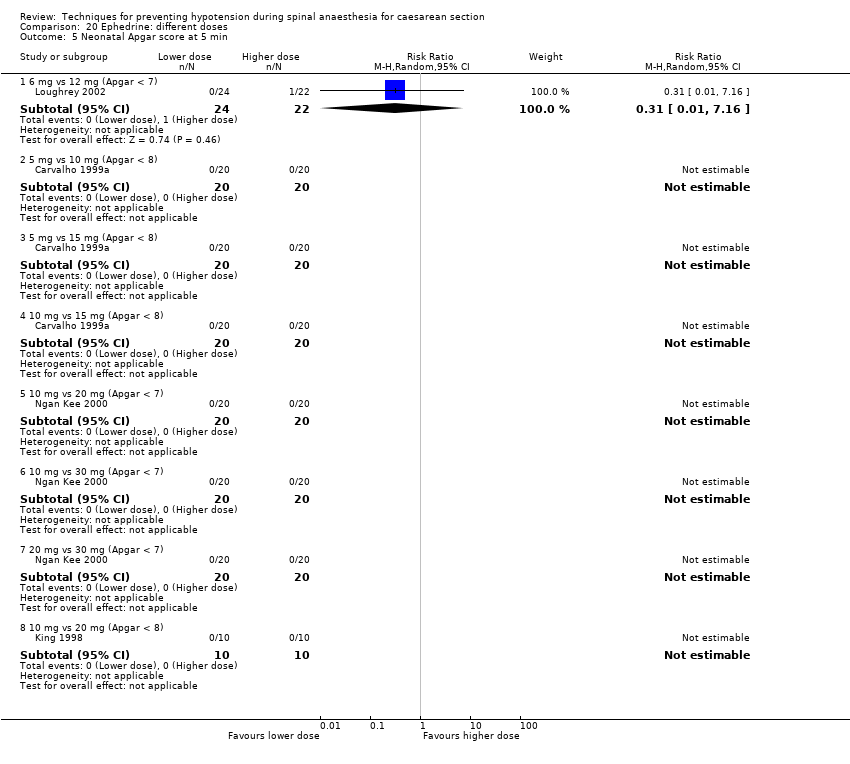
Comparison 20 Ephedrine: different doses, Outcome 5 Neonatal Apgar score at 5 min.

Comparison 21 Ephedrine: different rates, Outcome 1 Women with hypotension requiring intervention.

Comparison 21 Ephedrine: different rates, Outcome 2 Women with hypertension requiring intervention.

Comparison 21 Ephedrine: different rates, Outcome 3 Women with bradycardia.

Comparison 21 Ephedrine: different rates, Outcome 4 Women with nausea and/or vomiting.
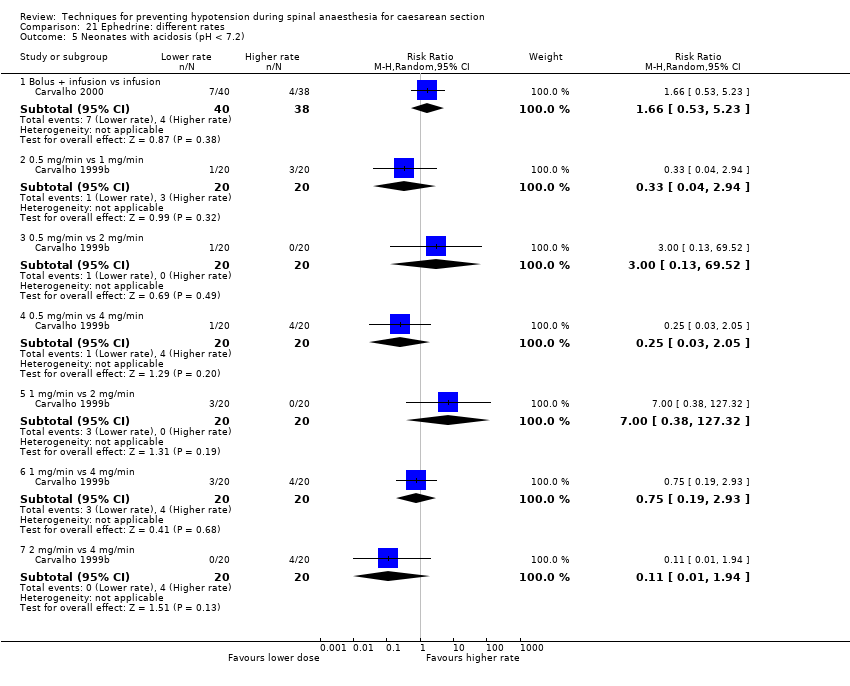
Comparison 21 Ephedrine: different rates, Outcome 5 Neonates with acidosis (pH < 7.2).

Comparison 21 Ephedrine: different rates, Outcome 6 Neonatal Apgar score at 5 min.

Comparison 22 Ephedrine: oral vs IM or IV, Outcome 1 Women with hypotension requiring intervention.
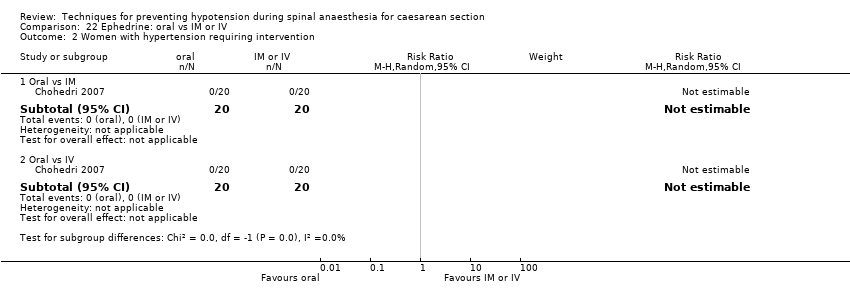
Comparison 22 Ephedrine: oral vs IM or IV, Outcome 2 Women with hypertension requiring intervention.

Comparison 22 Ephedrine: oral vs IM or IV, Outcome 3 Women with nausea and vomiting.
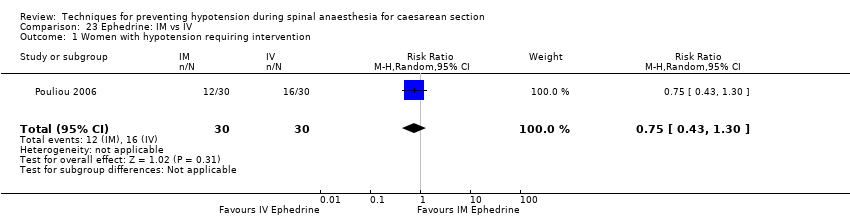
Comparison 23 Ephedrine: IM vs IV, Outcome 1 Women with hypotension requiring intervention.

Comparison 23 Ephedrine: IM vs IV, Outcome 2 Women with hypertension requiring intervention.

Comparison 23 Ephedrine: IM vs IV, Outcome 3 Apgar < 8 at 5 min.

Comparison 24 Phenylephrine vs control, Outcome 1 Women with hypotension requiring intervention.

Comparison 24 Phenylephrine vs control, Outcome 2 Women with cardiac dysrhythmia.

Comparison 24 Phenylephrine vs control, Outcome 3 Women with nausea and/or vomiting.

Comparison 24 Phenylephrine vs control, Outcome 4 Neonates with acidosis (pH < 7.2).
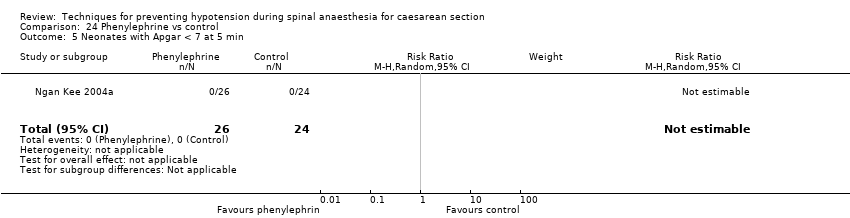
Comparison 24 Phenylephrine vs control, Outcome 5 Neonates with Apgar < 7 at 5 min.

Comparison 24 Phenylephrine vs control, Outcome 6 Neonates with Apgar < 8 at 5 min.
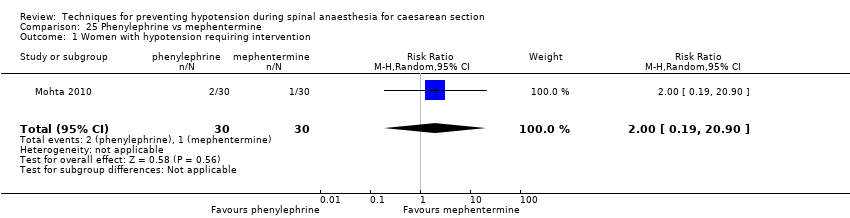
Comparison 25 Phenylephrine vs mephentermine, Outcome 1 Women with hypotension requiring intervention.
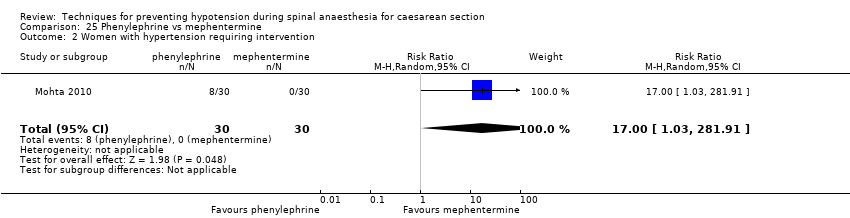
Comparison 25 Phenylephrine vs mephentermine, Outcome 2 Women with hypertension requiring intervention.

Comparison 25 Phenylephrine vs mephentermine, Outcome 3 Cardiac dysrhythmia.

Comparison 25 Phenylephrine vs mephentermine, Outcome 4 Nausea and/or vomiting.

Comparison 26 Phenylephrine vs metaraminol, Outcome 1 Women with hypotension requiring intervention.
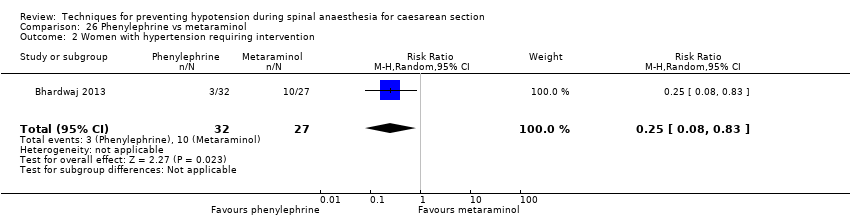
Comparison 26 Phenylephrine vs metaraminol, Outcome 2 Women with hypertension requiring intervention.

Comparison 26 Phenylephrine vs metaraminol, Outcome 3 Women with bradycardia.

Comparison 26 Phenylephrine vs metaraminol, Outcome 4 Women with nausea and/or vomiting.

Comparison 26 Phenylephrine vs metaraminol, Outcome 5 Neonatal pH < 7.2.
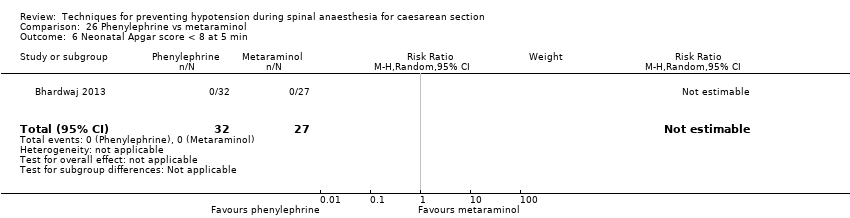
Comparison 26 Phenylephrine vs metaraminol, Outcome 6 Neonatal Apgar score < 8 at 5 min.
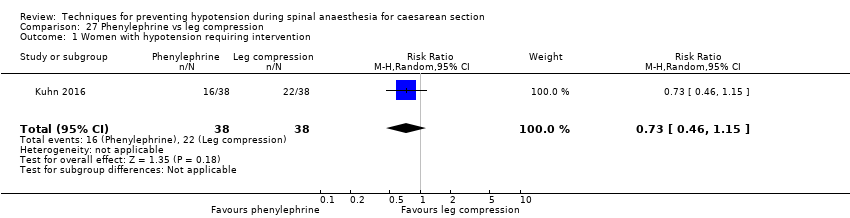
Comparison 27 Phenylephrine vs leg compression, Outcome 1 Women with hypotension requiring intervention.
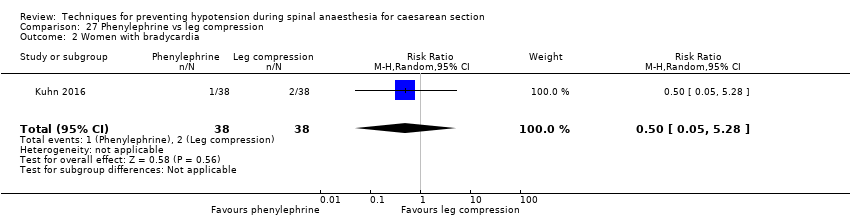
Comparison 27 Phenylephrine vs leg compression, Outcome 2 Women with bradycardia.

Comparison 27 Phenylephrine vs leg compression, Outcome 3 Women with nausea and/or vomiting.

Comparison 28 Phenylephrine: infusion vs bolus, Outcome 1 Women with hypotension requiring intervention.

Comparison 28 Phenylephrine: infusion vs bolus, Outcome 2 Women with cardiac dysrhythmia.
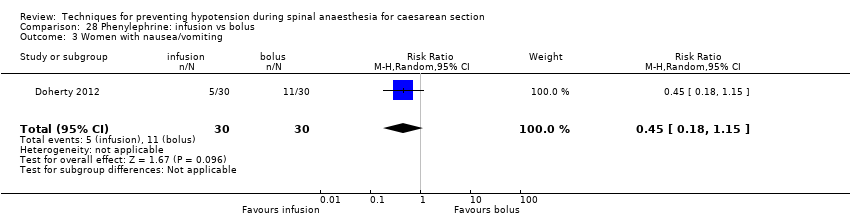
Comparison 28 Phenylephrine: infusion vs bolus, Outcome 3 Women with nausea/vomiting.

Comparison 28 Phenylephrine: infusion vs bolus, Outcome 4 Neonatal Apgar score < 8 at 5 min.
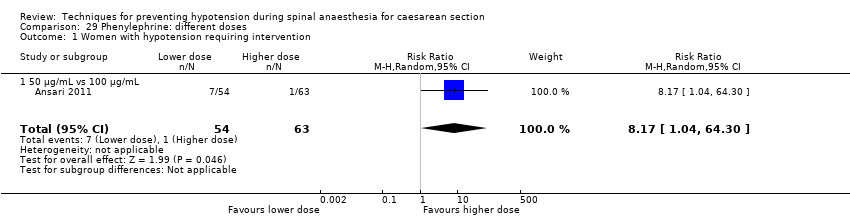
Comparison 29 Phenylephrine: different doses, Outcome 1 Women with hypotension requiring intervention.
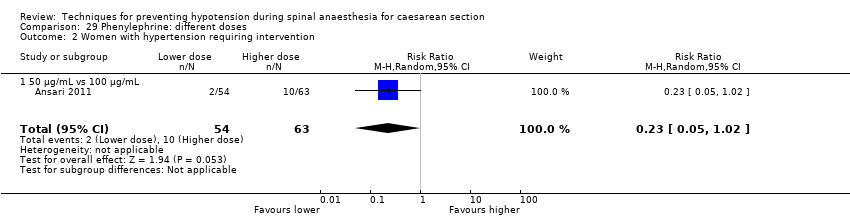
Comparison 29 Phenylephrine: different doses, Outcome 2 Women with hypertension requiring intervention.

Comparison 29 Phenylephrine: different doses, Outcome 3 Women with cardiac dysrhythmia.
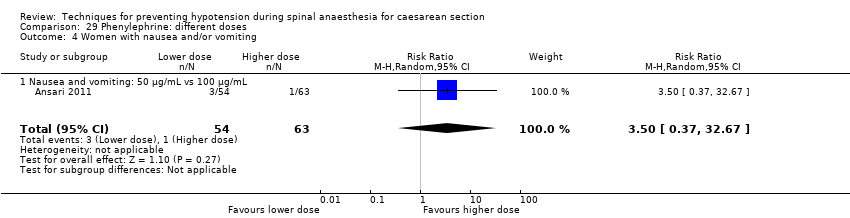
Comparison 29 Phenylephrine: different doses, Outcome 4 Women with nausea and/or vomiting.

Comparison 29 Phenylephrine: different doses, Outcome 5 Neonatal cord blood pH < 7.2.

Comparison 29 Phenylephrine: different doses, Outcome 6 Neonatal Apgar score < 8 at 5 min.

Comparison 30 Glycopyrrolate vs control, Outcome 1 Women with hypotension requiring intervention.
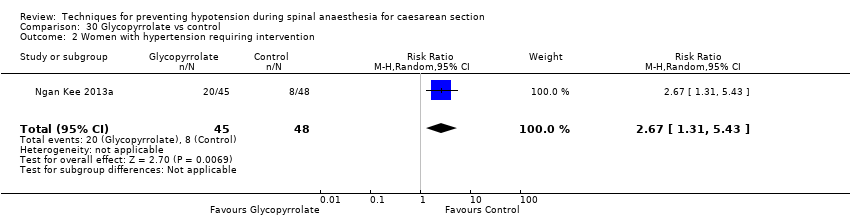
Comparison 30 Glycopyrrolate vs control, Outcome 2 Women with hypertension requiring intervention.
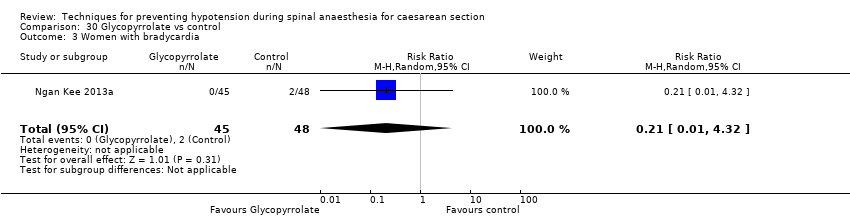
Comparison 30 Glycopyrrolate vs control, Outcome 3 Women with bradycardia.
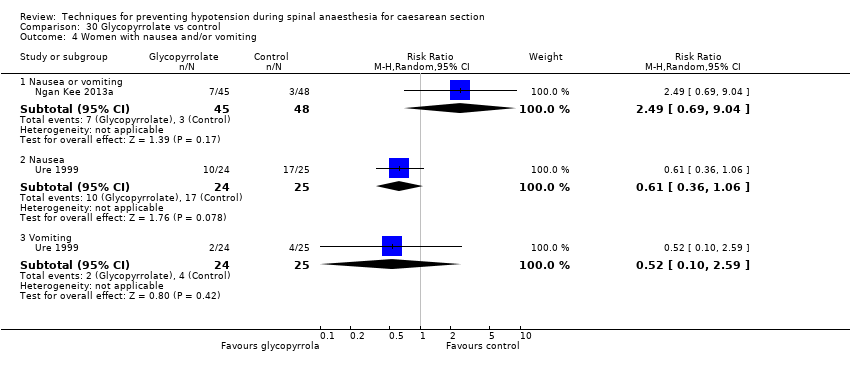
Comparison 30 Glycopyrrolate vs control, Outcome 4 Women with nausea and/or vomiting.

Comparison 30 Glycopyrrolate vs control, Outcome 5 Neonates with Apgar score < 8 at 5 min.

Comparison 31 Ondansetron vs control, Outcome 1 Women with hypotension requiring intervention.
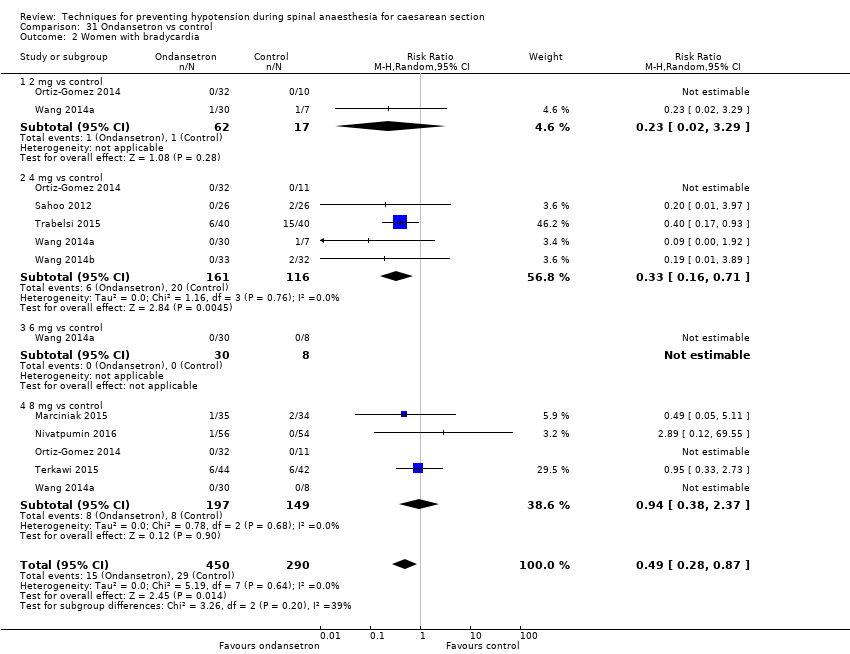
Comparison 31 Ondansetron vs control, Outcome 2 Women with bradycardia.

Comparison 31 Ondansetron vs control, Outcome 3 Women with nausea or vomiting.
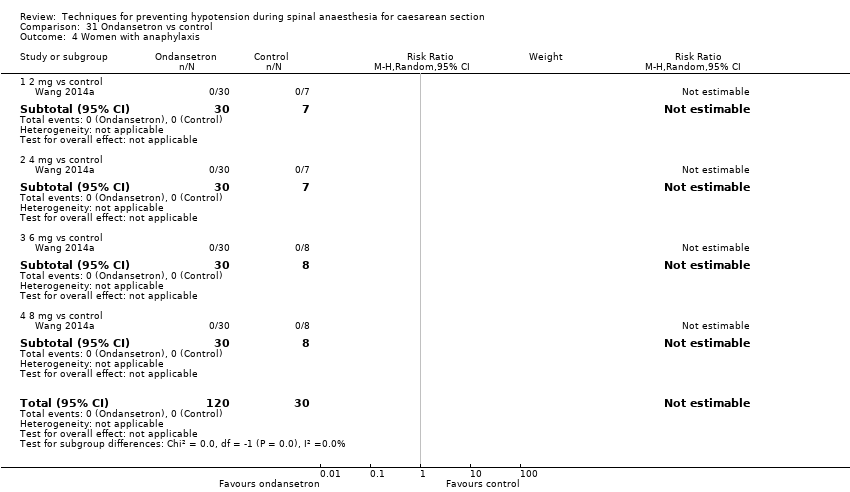
Comparison 31 Ondansetron vs control, Outcome 4 Women with anaphylaxis.
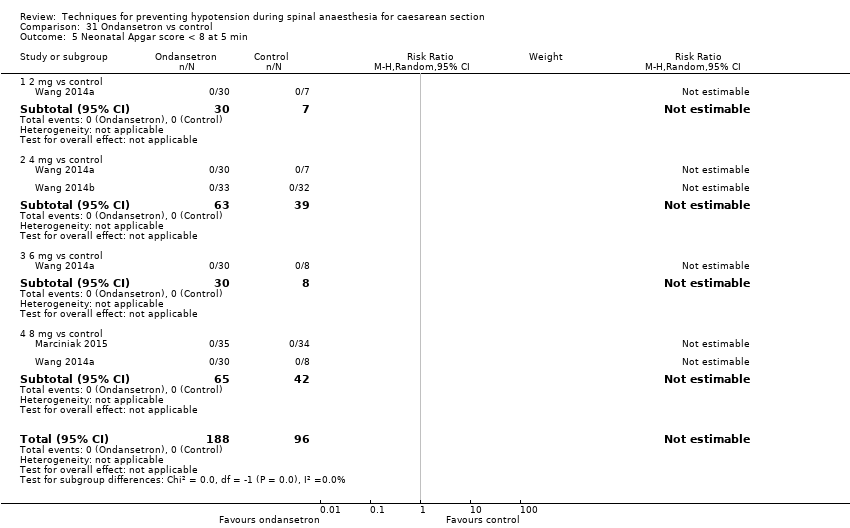
Comparison 31 Ondansetron vs control, Outcome 5 Neonatal Apgar score < 8 at 5 min.

Comparison 31 Ondansetron vs control, Outcome 6 Neonatal pH < 7.2.

Comparison 32 Ondansetron vs ephedrine, Outcome 1 Women with hypotension requiring intervention.
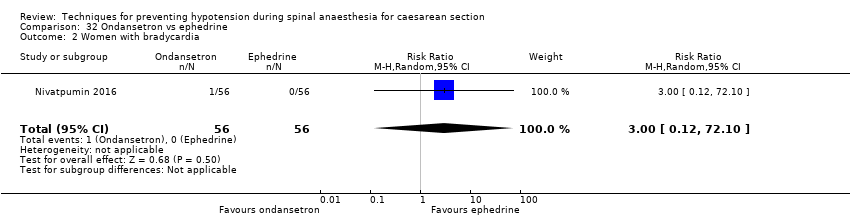
Comparison 32 Ondansetron vs ephedrine, Outcome 2 Women with bradycardia.
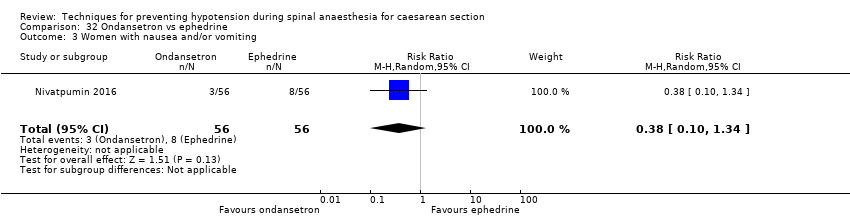
Comparison 32 Ondansetron vs ephedrine, Outcome 3 Women with nausea and/or vomiting.

Comparison 33 Granisetron vs control, Outcome 1 Women with hypotension requiring intervention.
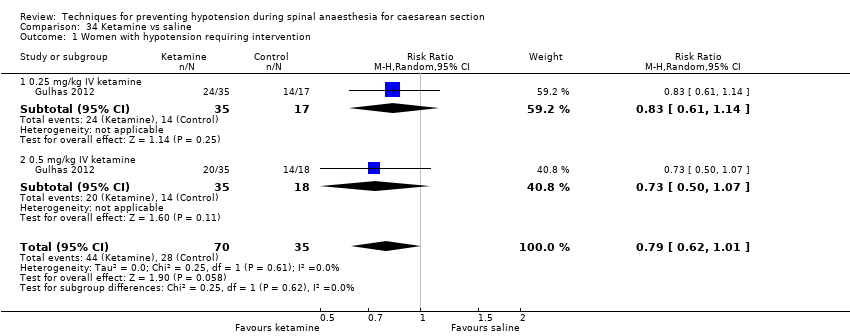
Comparison 34 Ketamine vs saline, Outcome 1 Women with hypotension requiring intervention.
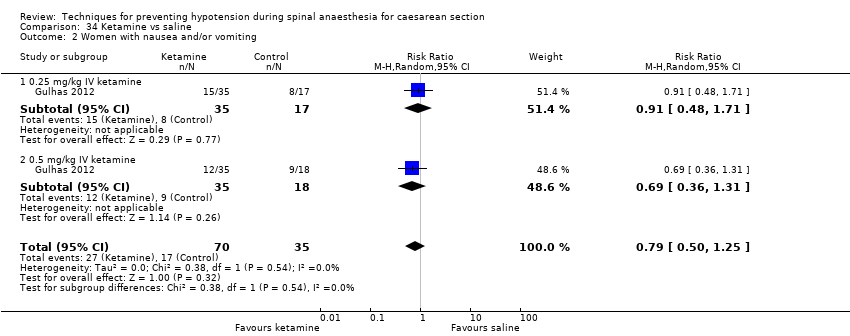
Comparison 34 Ketamine vs saline, Outcome 2 Women with nausea and/or vomiting.

Comparison 34 Ketamine vs saline, Outcome 3 Apgar score < 8 at 5 min.

Comparison 35 Angiotensin vs control, Outcome 1 Women with hypotension requiring intervention.

Comparison 35 Angiotensin vs control, Outcome 2 Women with nausea and/or vomiting.

Comparison 35 Angiotensin vs control, Outcome 3 Neonates with acidosis (pH < 7.2).

Comparison 36 Dopamine vs control, Outcome 1 Women with hypotension requiring intervention.

Comparison 36 Dopamine vs control, Outcome 2 Neonatal Apgar score < 8 at 5 min.

Comparison 37 Lower limb compression vs control, Outcome 1 Women with hypotension requiring intervention.

Comparison 37 Lower limb compression vs control, Outcome 2 Women with bradycardia.
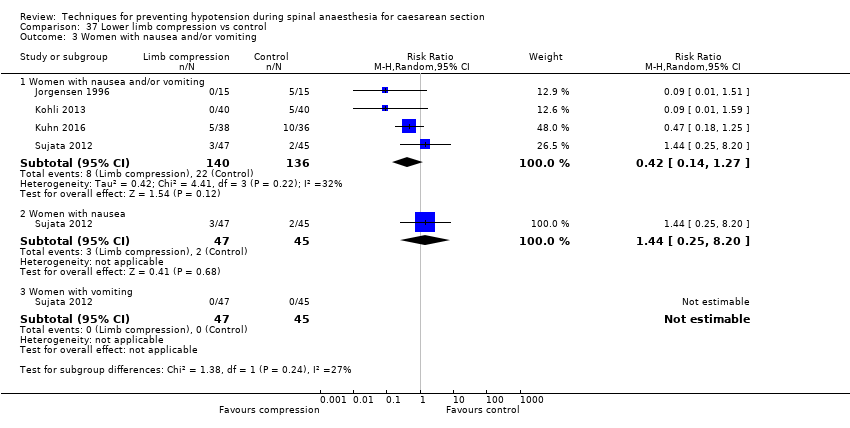
Comparison 37 Lower limb compression vs control, Outcome 3 Women with nausea and/or vomiting.

Comparison 37 Lower limb compression vs control, Outcome 4 Neonates with Apgar score < 8 at 5 min.

Comparison 38 Wedge vs supine, Outcome 1 Women with hypotension requiring intervention.

Comparison 38 Wedge vs supine, Outcome 2 Women with nausea and/or vomiting.
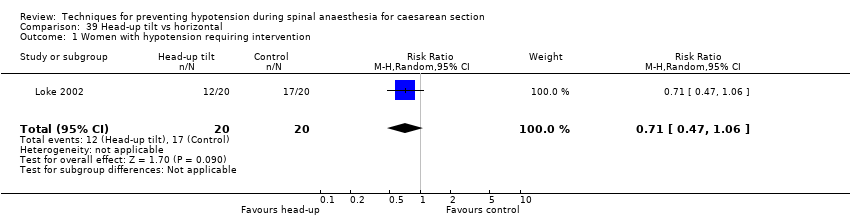
Comparison 39 Head‐up tilt vs horizontal, Outcome 1 Women with hypotension requiring intervention.

Comparison 39 Head‐up tilt vs horizontal, Outcome 2 Neonates with Apgar score < 8 at 5 min.
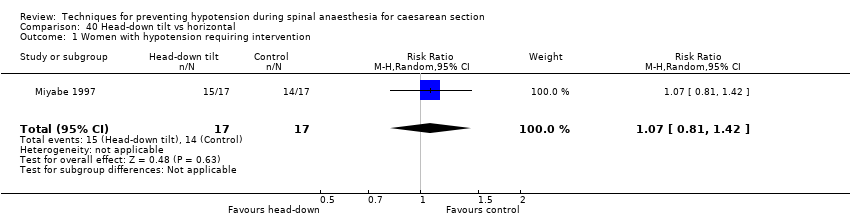
Comparison 40 Head‐down tilt vs horizontal, Outcome 1 Women with hypotension requiring intervention.

Comparison 41 Crawford's wedge vs manual uterine displacement, Outcome 1 Women with hypotension requiring intervention.

Comparison 41 Crawford's wedge vs manual uterine displacement, Outcome 2 Neonates with Apgar score < 8 at 5 min.

Comparison 42 Supine vs sitting, Outcome 1 Women with hypotension requiring intervention.

Comparison 42 Supine vs sitting, Outcome 2 Women with nausea and/or vomiting.

Comparison 42 Supine vs sitting, Outcome 3 Neonates with acidosis (pH < 7.2).

Comparison 42 Supine vs sitting, Outcome 4 Neonates with Apgar < 7 at 5 min.

Comparison 43 Walking vs lying, Outcome 1 Women requiring intervention for hypotension.

Comparison 44 Lateral vs supine wedged position, Outcome 1 Women with hypotension requiring intervention.

Comparison 44 Lateral vs supine wedged position, Outcome 2 Women with cardiac dysrhythmia requiring intervention.
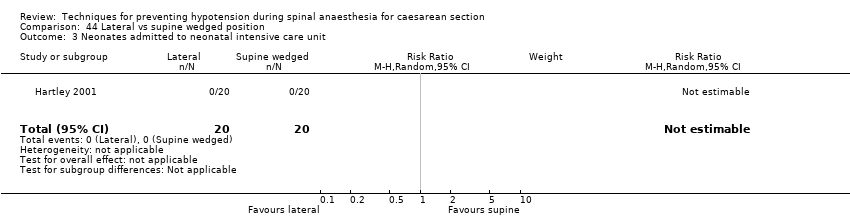
Comparison 44 Lateral vs supine wedged position, Outcome 3 Neonates admitted to neonatal intensive care unit.

Comparison 44 Lateral vs supine wedged position, Outcome 4 Women with nausea.
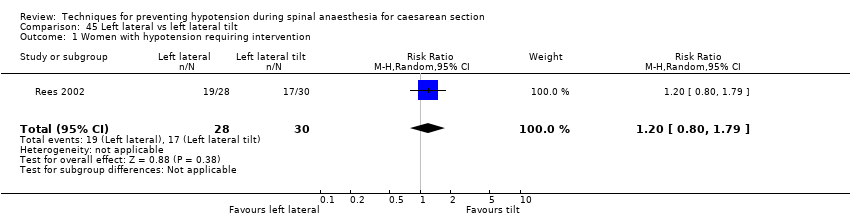
Comparison 45 Left lateral vs left lateral tilt, Outcome 1 Women with hypotension requiring intervention.

Comparison 45 Left lateral vs left lateral tilt, Outcome 2 Women with cardiac dysrhythmia requiring intervention.

Comparison 45 Left lateral vs left lateral tilt, Outcome 3 Women with nausea and/or vomiting.
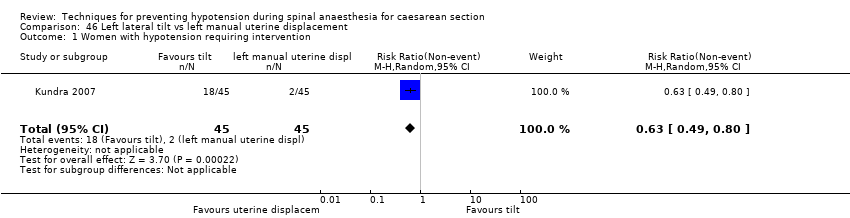
Comparison 46 Left lateral tilt vs left manual uterine displacement, Outcome 1 Women with hypotension requiring intervention.
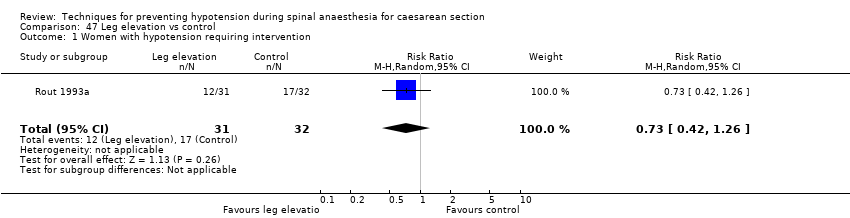
Comparison 47 Leg elevation vs control, Outcome 1 Women with hypotension requiring intervention.

Comparison 48 Acupressure vs placebo, Outcome 1 Women with hypotension requiring intervention.

Comparison 48 Acupressure vs placebo, Outcome 2 Women with nausea and/or vomiting.

Comparison 48 Acupressure vs placebo, Outcome 3 Neonates with Apgar < 7 at 5 min.
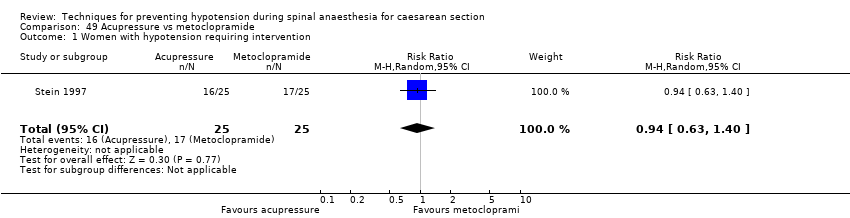
Comparison 49 Acupressure vs metoclopramide, Outcome 1 Women with hypotension requiring intervention.

Comparison 49 Acupressure vs metoclopramide, Outcome 2 Women with nausea and/or vomiting.

Comparison 49 Acupressure vs metoclopramide, Outcome 3 Neonates with Apgar < 7 at 5 min.
| Techniques for preventing hypotension during spinal anaesthesia for caesarean section | |||||
| Patient or population: women having spinal anaesthesia for caesarean section Setting: hospital (inpatient) Outcome: maternal hypotension requiring intervention | |||||
| Comparisons | Anticipated absolute effects* (95% CI) | Relative effect | № of participants | Quality of the evidence | |
| Risk with control | Risk with Intervention | ||||
| Crystalloid vs control | Control | Crystalloid | average RR 0.84 | 370 | ⊕⊕⊝⊝ |
| 535 per 1000 | 449 per 1000 | ||||
| Colloid vs crystalloid | Crystalloid | Colloid | average RR 0.68 (0.58 to 0.80) | 2105 | ⊕⊝⊝⊝ |
| 586 per 1000 | 398 per 1000 | ||||
| Ephedrine vs phenylephrine | Phenylephrine | Ephedrine | average RR 0.92 | 401 | ⊕⊝⊝⊝ |
| 465 per 1000 | 428 per 1000 | ||||
| Ondansetron vs control | Control | Ondansetron | average RR 0.67 | 740 | ⊕⊕⊝⊝ |
| 579 per 1000 | 388 per 1000 | ||||
| Lower limb compression vs control | Control | Lower limb compression | average RR 0.61 | 705 | ⊕⊝⊝⊝ |
| 663 per 1000 | 404 per 1000 | ||||
| Walking vs lying | Lying | Walking | RR 0.71 (0.41 to 1.21) | 37 (1 RCT) | ⊕⊝⊝⊝ Very lowf,g |
| 706 per 1000 | 501 per 1000 | ||||
| *The risk in the intervention group (and its 95% confidence interval) is based on the assumed risk in the comparison group and the relative effect of the intervention (and its 95% CI). | |||||
| GRADE Working Group grades of evidence | |||||
| aInclusion criteria not representative of wider population (e.g. only elective caesarean sections) (−1). | |||||
| Crystalloid versus control for preventing hypotension during spinal anaesthesia for caesarean section | |||||
| Patient or population: women having spinal anaesthesia for caesarean section | |||||
| Outcomes | Anticipated absolute effects* (95% CI) | Relative effect | № of participants | Quality of the evidence | |
| Risk with control | Risk with crystalloid | ||||
| Maternal hypotension requiring intervention | Study population | RR 0.84 | 370 | ⊕⊕⊝⊝ | |
| 535 per 1000 | 449 per 1000 | ||||
| Maternal hypertension requiring intervention | No studies reported this outcome. | ||||
| Maternal bradycardia requiring intervention | No studies reported this outcome. | ||||
| Maternal nausea and/or vomiting | Study population | RR 0.19 (0.01 to 3.91) | 69 (1 RCT) | ⊕⊝⊝⊝ Very lowa,c | |
| 59 per 1000 | 11 per 1000 (1 to 230) | ||||
| Neonatal acidosis as defined by cord or neonatal blood with a pH < 7.2 | No studies reported this outcome. | ||||
| Neonatal Apgar score < 8 at 5 minutes | Study population | Not estimable | 60 | ⊕⊕⊝⊝ | |
| 0 per 1000 | 0 per 1000 | ||||
| Admission to neonatal intensive care unit | No studies reported this outcome. | ||||
| *The risk in the intervention group (and its 95% confidence interval) is based on the assumed risk in the comparison group and the relative effect of the intervention (and its 95% CI). | |||||
| GRADE Working Group grades of evidence High quality: we are very confident that the true effect lies close to that of the estimate of the effect. | |||||
| aOnly elective caesarean sections included (−1). | |||||
| Colloid versus crystalloid for preventing hypotension during spinal anaesthesia for caesarean section | |||||
| Patient or population: women having spinal anaesthesia for caesarean section | |||||
| Outcomes | Anticipated absolute effects* (95% CI) | Relative effect | № of participants | Quality of the evidence | |
| Risk with crystalloid | Risk with colloid | ||||
| Maternal hypotension requiring intervention | Study population | RR 0.68 (0.58 to 0.80) | 2105 | ⊕⊝⊝⊝ | |
| 586 per 1000 | 398 per 1000 | ||||
| Maternal hypertension requiring intervention | Study population | RR 0.64 | 327 | ⊕⊝⊝⊝ | |
| 55 per 1000 | 35 per 1000 | ||||
| Maternal bradycardia requiring intervention | Study population | RR 0.99 | 509 | ⊕⊝⊝⊝ | |
| 76 per 1000 | 75 per 1000 | ||||
| Maternal nausea and/or vomiting | Study population | RR 0.83 | 1154 | ⊕⊝⊝⊝ | |
| 228 per 1000 | 189 per 1000 | ||||
| Neonatal acidosis as defined by cord or neonatal blood with a pH < 7.2 | Study population | RR 0.83 | 678 | ⊕⊝⊝⊝ | |
| 26 per 1000 | 21 per 1000 | ||||
| Neonatal Apgar score < 8 at 5 minutes | Study population | RR 0.24 | 826 | ⊕⊝⊝⊝ | |
| 10 per 1000 | 2 per 1000 | ||||
| Admission to neonatal intensive care unit | No studies reported this outcome. | ||||
| *The risk in the intervention group (and its 95% confidence interval) is based on the assumed risk in the comparison group and the relative effect of the intervention (and its 95% CI). | |||||
| GRADE Working Group grades of evidence High quality: we are very confident that the true effect lies close to that of the estimate of the effect. | |||||
| aDowngraded one level for serious risk of bias (due to unclear risk of selection bias in most included studies) (−1). | |||||
| Ephedrine versus phenylephrine for preventing hypotension during spinal anaesthesia for caesarean section | ||||||
| Patient or population: women having spinal anaesthesia for caesarean section | ||||||
| Outcomes | Anticipated absolute effects* (95% CI) | Relative effect | № of participants | Quality of the evidence | Comments | |
| Risk with phenylephrine | Risk with ephedrine | |||||
| Maternal hypotension requiring intervention | Study population | RR 0.92 | 401 | ⊕⊝⊝⊝ | — | |
| 465 per 1000 | 428 per 1000 | |||||
| Maternal hypertension requiring intervention | Study population | RR 1.72 | 118 | ⊕⊕⊝⊝ | — | |
| 113 per 1000 | 194 per 1000 | |||||
| Maternal bradycardia requiring intervention | Study population | RR 0.37 | 304 | ⊕⊕⊝⊝ | — | |
| 243 per 1000 | 90 per 1000 | |||||
| Maternal nausea and/or vomiting | Study population | RR 0.76 | 204 | ⊕⊝⊝⊝ | — | |
| 216 per 1000 | 164 per 1000 | |||||
| Neonatal acidosis as defined by cord or neonatal blood with a pH < 7.2 | Study population | RR 0.89 | 175 | ⊕⊕⊝⊝ | — | |
| 11 per 1000 | 10 per 1000 | |||||
| Neonatal Apgar score < 8 at 5 minutes | Study population | Not estimable | 321 | ⊕⊕⊝⊝ | No events observed in any studies. Relative effect could not be estimated. | |
| Not pooled | Not pooled | |||||
| Admission to neonatal intensive care unit | No studies reported this outcome. | |||||
| *The risk in the intervention group (and its 95% confidence interval) is based on the assumed risk in the comparison group and the relative effect of the intervention (and its 95% CI). | ||||||
| GRADE Working Group grades of evidence High quality: we are very confident that the true effect lies close to that of the estimate of the effect. | ||||||
| aSubstantial heterogeneity (−1). | ||||||
| Ondansetron versus saline placebo for preventing hypotension during spinal anaesthesia for caesarean section | |||||
| Patient or population: women having spinal anaesthesia for caesarean section | |||||
| Outcomes | Anticipated absolute effects* (95% CI) | Relative effect | № of participants | Quality of the evidence | |
| Risk with control | Risk with ondansetron | ||||
| Maternal hypotension requiring intervention | Study population | RR 0.67 | 740 | ⊕⊕⊝⊝ | |
| 579 per 1000 | 388 per 1000 | ||||
| Maternal hypertension requiring intervention | No studies reported this outcome. | ||||
| Maternal bradycardia requiring intervention | Study population | RR 0.49 | 740 | ⊕⊕⊝⊝ | |
| 100 per 1000 | 49 per 1000 | ||||
| Maternal nausea and/or vomiting | Study population | RR 0.35 | 653 | ⊕⊕⊝⊝ | |
| 296 per 1000 | 103 per 1000 | ||||
| Neonatal Apgar score < 8 at 5 minutes | Study population | Not estimable | 284 | ⊕⊕⊝⊝ | |
| Not pooled | Not pooled | ||||
| Neonatal acidosis as defined by cord or neonatal blood with a pH < 7.2 | Study population | RR 0.48 | 134 | ⊕⊕⊝⊝ | |
| 30 per 1000 | 15 per 1000 | ||||
| Admission to neonatal care unit | No studies reported this outcome. | ||||
| *The risk in the intervention group (and its 95% confidence interval) is based on the assumed risk in the comparison group and the relative effect of the intervention (and its 95% CI). | |||||
| GRADE Working Group grades of evidence High quality: we are very confident that the true effect lies close to that of the estimate of the effect. | |||||
| a Inclusion criteria not representative of wider population (e.g. elective caesarean section only) (−1). | |||||
| Leg compression versus control for preventing hypotension during spinal anaesthesia for caesarean section | ||||||
| Patient or population: women having spinal anaesthesia for caesarean section | ||||||
| Outcomes | Anticipated absolute effects* (95% CI) | Relative effect | № of participants | Quality of the evidence | Comments | |
| Risk with control | Risk with lower limb compression | |||||
| Maternal hypotension requiring intervention | Study population | RR 0.61 | 705 | ⊕⊝⊝⊝ | — | |
| 663 per 1000 | 404 per 1000 | |||||
| Maternal hypertension requiring intervention | No studies reported this outcome. | |||||
| Maternal bradycardia requiring intervention | Study population | RR 0.63 (0.11 to 3.56) | 74 (1 RCTs) | ⊕⊝⊝⊝ | — | |
| 83 per 1000 | 53 per 1000 (9 to 297) | |||||
| Maternal nausea and/or vomiting | Study population | RR 0.42 | 276 | ⊕⊝⊝⊝ | — | |
| 162 per 1000 | 68 per 1000 | |||||
| Neonatal acidosis as defined by cord or neonatal blood with a pH < 7.2 | No studies reported this outcome. | |||||
| Neonatal Apgar score < 8 at 5 minutes | Study population | Not estimable | 130 | ⊕⊝⊝⊝ | No events observed in any studies. Relative effect could not be estimated. | |
| Not pooled | Not pooled | |||||
| Admission to neonatal intensive care unit | No studies reported this outcome. | |||||
| *The risk in the intervention group (and its 95% confidence interval) is based on the assumed risk in the comparison group and the relative effect of the intervention (and its 95% CI). | ||||||
| GRADE Working Group grades of evidence High quality: we are very confident that the true effect lies close to that of the estimate of the effect. | ||||||
| aDowngraded one level for serious risk of bias (due to unclear risk of selection bias in the majority of included studies (−1). | ||||||
| Walking versus lying for reducing risk of maternal hypotension during spinal anaesthesia for caesarean section | |||||
| Patient or population: women having spinal anaesthesia for caesarean section | |||||
| Outcomes | Anticipated absolute effects* (95% CI) | Relative effect | № of participants | Quality of the evidence | |
| Risk with lying | Risk with walking | ||||
| Maternal hypotension requiring intervention | Study population | RR 0.71 | 37 | ⊕⊝⊝⊝ | |
| 706 per 1000 | 501 per 1000 | ||||
| Maternal hypertension requiring intervention | No studies reported this outcome. | ||||
| Maternal bradycardia requiring intervention | No studies reported this outcome. | ||||
| Maternal nausea and/or vomiting | No studies reported this outcome. | ||||
| Neonatal acidosis as defined by cord or neonatal blood with a pH < 7.2 | No studies reported this outcome. | ||||
| Neonal Apgar score < 8 at 5 minutes | No studies reported this outcome. | ||||
| Admission to neonatal intensive care unit | No studies reported this outcome. | ||||
| *The risk in the intervention group (and its 95% confidence interval) is based on the assumed risk in the comparison group and the relative effect of the intervention (and its 95% CI). | |||||
| GRADE Working Group grades of evidence | |||||
| aParticipants and anaesthetists not blinded in 1 study with 100% weight in analysis (−1). | |||||
| Outcome or subgroup title | No. of studies | No. of participants | Statistical method | Effect size |
| 1 Women with hypotension requiring intervention Show forest plot | 5 | 370 | Risk Ratio (M‐H, Random, 95% CI) | 0.84 [0.72, 0.98] |
| 2 Nausea and/or vomiting Show forest plot | 1 | 69 | Risk Ratio (M‐H, Random, 95% CI) | 0.19 [0.01, 3.91] |
| 3 Anaphylaxis Show forest plot | 1 | 69 | Risk Ratio (M‐H, Random, 95% CI) | 0.0 [0.0, 0.0] |
| 4 Apgar < 8 at 5 min Show forest plot | 1 | 60 | Risk Ratio (M‐H, Random, 95% CI) | 0.0 [0.0, 0.0] |
| Outcome or subgroup title | No. of studies | No. of participants | Statistical method | Effect size |
| 1 Women with hypotension requiring intervention Show forest plot | 1 | 20 | Risk Ratio (M‐H, Random, 95% CI) | 0.86 [0.45, 1.64] |
| Outcome or subgroup title | No. of studies | No. of participants | Statistical method | Effect size |
| 1 Women with hypotension requiring intervention Show forest plot | 3 | 192 | Risk Ratio (M‐H, Random, 95% CI) | 0.55 [0.29, 1.02] |
| 1.1 15 mL/kg crystalloid | 2 | 67 | Risk Ratio (M‐H, Random, 95% CI) | 0.56 [0.33, 0.96] |
| 1.2 20 mL/kg crystalloid | 2 | 125 | Risk Ratio (M‐H, Random, 95% CI) | 0.51 [0.11, 2.44] |
| 2 Nausea and/or vomiting Show forest plot | 1 | 80 | Risk Ratio (M‐H, Random, 95% CI) | 1.2 [0.40, 3.62] |
| 3 Apgar < 8 at 5 min Show forest plot | 1 | Risk Ratio (M‐H, Random, 95% CI) | Subtotals only | |
| 3.1 15 mL/kg crystalloid | 1 | 45 | Risk Ratio (M‐H, Random, 95% CI) | 0.0 [0.0, 0.0] |
| 3.2 20 mL/kg crystalloid | 1 | 45 | Risk Ratio (M‐H, Random, 95% CI) | 0.0 [0.0, 0.0] |
| Outcome or subgroup title | No. of studies | No. of participants | Statistical method | Effect size |
| 1 Women with hypotension requiring intervention Show forest plot | 5 | 384 | Risk Ratio (M‐H, Random, 95% CI) | 0.70 [0.59, 0.83] |
| 2 Hypertension requiring intervention Show forest plot | 1 | 100 | Risk Ratio (M‐H, Random, 95% CI) | 1.67 [0.42, 6.60] |
| 3 Women with bradycardia Show forest plot | 1 | 100 | Risk Ratio (M‐H, Random, 95% CI) | 1.43 [0.59, 3.45] |
| 4 Women with nausea or vomiting Show forest plot | 3 | Risk Ratio (M‐H, Random, 95% CI) | Subtotals only | |
| 4.1 Women with nausea | 3 | 210 | Risk Ratio (M‐H, Random, 95% CI) | 1.98 [1.26, 3.12] |
| 4.2 Women with vomiting | 2 | 160 | Risk Ratio (M‐H, Random, 95% CI) | 2.33 [0.98, 5.58] |
| 5 Neonates with acidosis (pH < 7.2) Show forest plot | 2 | 110 | Risk Ratio (M‐H, Random, 95% CI) | 0.0 [0.0, 0.0] |
| 6 Apgar < 8 at 5 min Show forest plot | 3 | 210 | Risk Ratio (M‐H, Random, 95% CI) | 0.0 [0.0, 0.0] |
| Outcome or subgroup title | No. of studies | No. of participants | Statistical method | Effect size |
| 1 Women with hypotension requiring intervention Show forest plot | 1 | 113 | Risk Ratio (M‐H, Random, 95% CI) | 1.03 [0.65, 1.62] |
| 2 Women with nausea and/or vomiting Show forest plot | 1 | Risk Ratio (M‐H, Random, 95% CI) | Subtotals only | |
| 2.1 Nausea | 1 | 113 | Risk Ratio (M‐H, Random, 95% CI) | 1.64 [0.97, 2.76] |
| 2.2 Vomiting | 1 | 113 | Risk Ratio (M‐H, Random, 95% CI) | 2.95 [0.12, 70.87] |
| Outcome or subgroup title | No. of studies | No. of participants | Statistical method | Effect size |
| 1 Women with hypotension requiring intervention Show forest plot | 3 | Risk Ratio (M‐H, Random, 95% CI) | Subtotals only | |
| 1.1 Dextrose + saline vs saline | 1 | 120 | Risk Ratio (M‐H, Random, 95% CI) | 0.88 [0.68, 1.14] |
| 1.2 Glucose vs saline | 1 | 70 | Risk Ratio (M‐H, Random, 95% CI) | 1.05 [0.74, 1.48] |
| 1.3 Ringer's lactate vs saline | 1 | 60 | Risk Ratio (M‐H, Random, 95% CI) | 1.17 [0.65, 2.09] |
| 2 Neonates with acidosis: Ringer's lactate vs saline Show forest plot | 1 | 60 | Risk Ratio (M‐H, Fixed, 95% CI) | 0.0 [0.0, 0.0] |
| 3 Neonates with acidosis: dextrose vs saline Show forest plot | 1 | 120 | Risk Ratio (M‐H, Random, 95% CI) | 1.2 [0.39, 3.72] |
| 4 Neonates with Apgar score < 7 at 5 min Show forest plot | 1 | 120 | Risk Ratio (M‐H, Random, 95% CI) | 0.0 [0.0, 0.0] |
| 5 Neonates with Apgar score < 8 at 5 min Show forest plot | 1 | 60 | Risk Ratio (M‐H, Fixed, 95% CI) | 0.0 [0.0, 0.0] |
| Outcome or subgroup title | No. of studies | No. of participants | Statistical method | Effect size |
| 1 Women with hypotension requiring intervention Show forest plot | 28 | 2105 | Risk Ratio (M‐H, Random, 95% CI) | 0.68 [0.58, 0.80] |
| 2 Women with hypertension requiring intervention Show forest plot | 3 | 327 | Risk Ratio (M‐H, Random, 95% CI) | 0.64 [0.09, 4.46] |
| 3 Women with cardiac dysrhythmia Show forest plot | 7 | Risk Ratio (M‐H, Random, 95% CI) | Subtotals only | |
| 3.1 Tachycardia | 1 | 60 | Risk Ratio (M‐H, Random, 95% CI) | 1.1 [0.79, 1.53] |
| 3.2 Bradycardia | 6 | 509 | Risk Ratio (M‐H, Random, 95% CI) | 0.99 [0.55, 1.79] |
| 4 Women with nausea and/or vomiting Show forest plot | 16 | Risk Ratio (M‐H, Random, 95% CI) | Subtotals only | |
| 4.1 Nausea and/or vomiting | 15 | 1154 | Risk Ratio (M‐H, Random, 95% CI) | 0.83 [0.61, 1.13] |
| 4.2 Nausea | 5 | 390 | Risk Ratio (M‐H, Random, 95% CI) | 1.10 [0.77, 1.58] |
| 4.3 Vomiting | 4 | 320 | Risk Ratio (M‐H, Random, 95% CI) | 1.35 [0.55, 3.27] |
| 5 Neonates with acidosis (pH < 7.2) Show forest plot | 6 | 678 | Risk Ratio (M‐H, Random, 95% CI) | 0.83 [0.15, 4.52] |
| 6 Neonates: Apgar score Show forest plot | 13 | Risk Ratio (M‐H, Random, 95% CI) | Subtotals only | |
| 6.1 Apgar < 7 at 5 min | 2 | 127 | Risk Ratio (M‐H, Random, 95% CI) | 0.16 [0.01, 2.90] |
| 6.2 Apgar < 8 at 5 min | 11 | 826 | Risk Ratio (M‐H, Random, 95% CI) | 0.24 [0.03, 2.05] |
| Outcome or subgroup title | No. of studies | No. of participants | Statistical method | Effect size |
| 1 Women with hypotension requiring intervention Show forest plot | 5 | 426 | Risk Ratio (M‐H, Random, 95% CI) | 0.40 [0.16, 0.96] |
| 2 Women with bradycardia Show forest plot | 1 | 54 | Risk Ratio (M‐H, Random, 95% CI) | 7.70 [0.46, 127.78] |
| 3 Women with nausea and/or vomiting Show forest plot | 2 | 245 | Risk Ratio (M‐H, Random, 95% CI) | 1.65 [0.75, 3.64] |
| 4 Neonates with acidosis (pH < 7.2) Show forest plot | 1 | 205 | Risk Ratio (M‐H, Random, 95% CI) | 1.24 [0.34, 4.48] |
| 5 Neonates with Apgar score < 7 at 5 min Show forest plot | 4 | 221 | Risk Ratio (M‐H, Random, 95% CI) | 0.07 [0.00, 1.24] |
| 6 Neonatal Apgar < 8 at 5 min Show forest plot | 1 | 205 | Risk Ratio (M‐H, Random, 95% CI) | 0.0 [0.0, 0.0] |
| Outcome or subgroup title | No. of studies | No. of participants | Statistical method | Effect size |
| 1 Women with hypotension requiring intervention Show forest plot | 3 | 134 | Risk Ratio (M‐H, Random, 95% CI) | 0.75 [0.27, 2.08] |
| 2 Apgar < 9 at 5 min Show forest plot | 1 | Risk Ratio (M‐H, Random, 95% CI) | Subtotals only | |
| Outcome or subgroup title | No. of studies | No. of participants | Statistical method | Effect size |
| 1 Women with hypotension requiring intervention Show forest plot | 4 | 320 | Risk Ratio (M‐H, Random, 95% CI) | 0.93 [0.78, 1.10] |
| 2 Women with cardiac dysrhythmia Show forest plot | 3 | Risk Ratio (M‐H, Random, 95% CI) | Subtotals only | |
| 2.1 Bradycardia | 2 | 82 | Risk Ratio (M‐H, Random, 95% CI) | 0.75 [0.20, 2.88] |
| 2.2 Tachycardia | 1 | 46 | Risk Ratio (M‐H, Random, 95% CI) | 0.0 [0.0, 0.0] |
| 3 Women with nausea and/or vomiting Show forest plot | 2 | Risk Ratio (M‐H, Random, 95% CI) | Subtotals only | |
| 3.1 Nausea and/or vomiting | 1 | 178 | Risk Ratio (M‐H, Random, 95% CI) | 0.92 [0.63, 1.35] |
| 3.2 Nausea | 1 | 46 | Risk Ratio (M‐H, Random, 95% CI) | 1.0 [0.15, 6.51] |
| 3.3 Vomiting | 1 | 46 | Risk Ratio (M‐H, Random, 95% CI) | 0.0 [0.0, 0.0] |
| 4 Women with anaphylaxis Show forest plot | 1 | 178 | Risk Ratio (M‐H, Random, 95% CI) | 0.0 [0.0, 0.0] |
| 5 Neonates with Apgar score < 7 at 5 min Show forest plot | 1 | 36 | Risk Ratio (M‐H, Random, 95% CI) | 0.0 [0.0, 0.0] |
| Outcome or subgroup title | No. of studies | No. of participants | Statistical method | Effect size |
| 1 Women with hypotension requiring intervention Show forest plot | 2 | Risk Ratio (M‐H, Random, 95% CI) | Subtotals only | |
| 1.1 Albumin or dextrose vs dextrose | 1 | 45 | Risk Ratio (M‐H, Random, 95% CI) | 0.13 [0.01, 2.30] |
| 1.2 Unbalanced vs balanced hydroxyethyl starch | 1 | 51 | Risk Ratio (M‐H, Random, 95% CI) | 1.04 [0.78, 1.39] |
| 2 Neonates: Apgar score < 7 Show forest plot | 1 | 45 | Risk Ratio (M‐H, Random, 95% CI) | 0.13 [0.01, 2.30] |
| 2.1 Albumin or dextrose vs dextrose | 1 | 45 | Risk Ratio (M‐H, Random, 95% CI) | 0.13 [0.01, 2.30] |
| 3 Neonates with Apgar score < 8 at 5 min Show forest plot | 1 | 51 | Risk Ratio (M‐H, Random, 95% CI) | 0.0 [0.0, 0.0] |
| 3.1 Unbalanced vs balanced hydroxyethyl starch | 1 | 51 | Risk Ratio (M‐H, Random, 95% CI) | 0.0 [0.0, 0.0] |
| Outcome or subgroup title | No. of studies | No. of participants | Statistical method | Effect size |
| 1 Women with hypotension requiring intervention Show forest plot | 22 | 1401 | Risk Ratio (M‐H, Random, 95% CI) | 0.65 [0.53, 0.80] |
| 2 Women with hypertension requiring intervention Show forest plot | 7 | 520 | Risk Ratio (M‐H, Random, 95% CI) | 1.61 [1.00, 2.61] |
| 3 Women with cardiac arrhythmia Show forest plot | 3 | Risk Ratio (M‐H, Random, 95% CI) | Subtotals only | |
| 3.1 Tachycardia | 2 | 93 | Risk Ratio (M‐H, Random, 95% CI) | 1.12 [0.74, 1.70] |
| 3.2 Bradycardia | 2 | 103 | Risk Ratio (M‐H, Random, 95% CI) | 14.46 [0.87, 241.09] |
| 4 Women with nausea and/or vomiting Show forest plot | 13 | Risk Ratio (M‐H, Random, 95% CI) | Subtotals only | |
| 4.1 Nausea and/or vomiting | 5 | 219 | Risk Ratio (M‐H, Random, 95% CI) | 0.71 [0.22, 2.34] |
| 4.2 Nausea | 8 | 620 | Risk Ratio (M‐H, Random, 95% CI) | 0.68 [0.48, 0.96] |
| 4.3 Vomiting | 6 | 516 | Risk Ratio (M‐H, Random, 95% CI) | 0.68 [0.44, 1.07] |
| 5 Neonates with acidosis (pH < 7.2) Show forest plot | 9 | 576 | Risk Ratio (M‐H, Random, 95% CI) | 1.29 [0.67, 2.49] |
| 6 Neonates: Apgar score Show forest plot | 14 | Risk Ratio (M‐H, Random, 95% CI) | Subtotals only | |
| 6.1 Apgar < 8 at 5 min | 10 | 579 | Risk Ratio (M‐H, Random, 95% CI) | 0.0 [0.0, 0.0] |
| 6.2 Apgar < 7 at 5 min | 4 | 263 | Risk Ratio (M‐H, Random, 95% CI) | 1.14 [0.34, 3.81] |
| Outcome or subgroup title | No. of studies | No. of participants | Statistical method | Effect size |
| 1 Women with hypotension requiring intervention Show forest plot | 9 | 613 | Risk Ratio (M‐H, Random, 95% CI) | 0.60 [0.47, 0.78] |
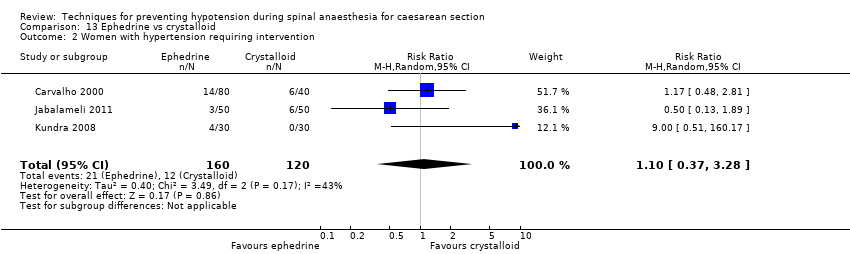
| 2 Women with hypertension requiring intervention Show forest plot | 3 | 280 | Risk Ratio (M‐H, Random, 95% CI) | 1.10 [0.37, 3.28] |
| 3 Women with bradycardia Show forest plot | 1 | 100 | Risk Ratio (M‐H, Fixed, 95% CI) | 0.33 [0.01, 7.99] |
| 4 Women with nausea and/or vomiting Show forest plot | 5 | Risk Ratio (M‐H, Random, 95% CI) | Subtotals only | |
| 4.1 Nausea and/or vomiting | 2 | 146 | Risk Ratio (M‐H, Random, 95% CI) | 1.0 [0.48, 2.08] |
| 4.2 Nausea | 3 | 220 | Risk Ratio (M‐H, Random, 95% CI) | 0.54 [0.31, 0.93] |
| 4.3 Vomiting | 3 | 220 | Risk Ratio (M‐H, Random, 95% CI) | 0.57 [0.31, 1.05] |
| 5 Women with impaired consciousness Show forest plot | 1 | 46 | Risk Ratio (M‐H, Random, 95% CI) | 0.4 [0.09, 1.86] |
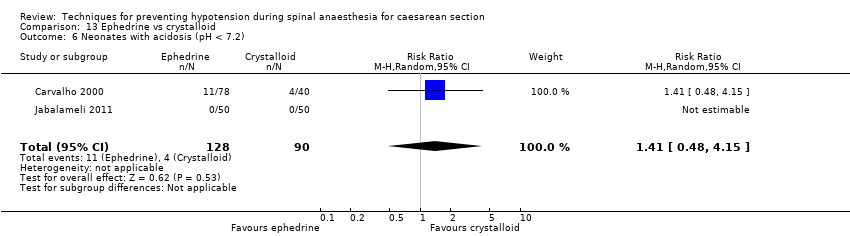
| 6 Neonates with acidosis (pH < 7.2) Show forest plot | 2 | 218 | Risk Ratio (M‐H, Random, 95% CI) | 1.41 [0.48, 4.15] |
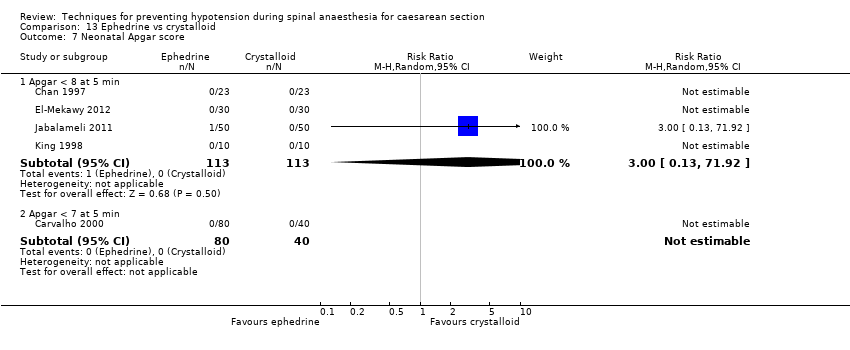
| 7 Neonatal Apgar score Show forest plot | 5 | Risk Ratio (M‐H, Random, 95% CI) | Subtotals only | |
| 7.1 Apgar < 8 at 5 min | 4 | 226 | Risk Ratio (M‐H, Random, 95% CI) | 3.0 [0.13, 71.92] |
| 7.2 Apgar < 7 at 5 min | 1 | 120 | Risk Ratio (M‐H, Random, 95% CI) | 0.0 [0.0, 0.0] |
| Outcome or subgroup title | No. of studies | No. of participants | Statistical method | Effect size |
| 1 Women with hypotension requiring intervention Show forest plot | 1 | 75 | Risk Ratio (M‐H, Random, 95% CI) | 0.65 [0.38, 1.12] |
| 2 Women with nausea and/or vomiting Show forest plot | 1 | Risk Ratio (M‐H, Random, 95% CI) | Subtotals only | |
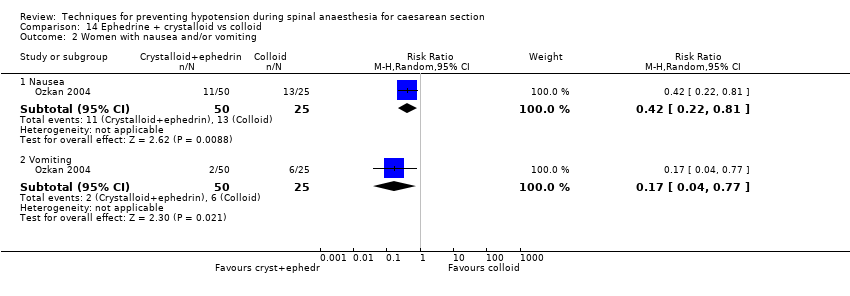
| 2.1 Nausea | 1 | 75 | Risk Ratio (M‐H, Random, 95% CI) | 0.42 [0.22, 0.81] |
| 2.2 Vomiting | 1 | 75 | Risk Ratio (M‐H, Random, 95% CI) | 0.17 [0.04, 0.77] |
| Outcome or subgroup title | No. of studies | No. of participants | Statistical method | Effect size |
| 1 Women with hypotension requiring intervention Show forest plot | 1 | 75 | Risk Ratio (M‐H, Random, 95% CI) | 0.39 [0.21, 0.74] |
| 2 Women with nausea and/or vomiting Show forest plot | 1 | Risk Ratio (M‐H, Random, 95% CI) | Subtotals only | |
| 2.1 Nausea | 1 | 75 | Risk Ratio (M‐H, Random, 95% CI) | 0.27 [0.11, 0.65] |
| 2.2 Vomiting | 1 | 75 | Risk Ratio (M‐H, Random, 95% CI) | 0.38 [0.09, 1.55] |
| Outcome or subgroup title | No. of studies | No. of participants | Statistical method | Effect size |
| 1 Women with hypotension requiring intervention Show forest plot | 8 | 401 | Risk Ratio (M‐H, Random, 95% CI) | 0.92 [0.71, 1.18] |
| 2 Women with hypertension requiring intervention Show forest plot | 2 | 118 | Risk Ratio (M‐H, Random, 95% CI) | 1.72 [0.71, 4.16] |
| 3 Cardiac dysrhythmia Show forest plot | 5 | Risk Ratio (M‐H, Random, 95% CI) | Subtotals only | |
| 3.1 Bradycardia | 5 | 304 | Risk Ratio (M‐H, Random, 95% CI) | 0.37 [0.21, 0.64] |
| 3.2 Tachycardia | 1 | 57 | Risk Ratio (M‐H, Random, 95% CI) | 2.22 [0.44, 11.18] |
| 4 Women with nausea and/or vomiting Show forest plot | 4 | 204 | Risk Ratio (M‐H, Random, 95% CI) | 0.76 [0.39, 1.49] |
| 5 Neonates with acidosis (pH < 7.2) Show forest plot | 3 | 175 | Risk Ratio (M‐H, Random, 95% CI) | 0.89 [0.07, 12.00] |
| 6 Neonates with Apgar score < 8 at 5 min Show forest plot | 6 | 321 | Risk Ratio (M‐H, Random, 95% CI) | 0.0 [0.0, 0.0] |
| Outcome or subgroup title | No. of studies | No. of participants | Statistical method | Effect size |
| 1 Women with hypotension requiring intervention Show forest plot | 1 | 20 | Risk Ratio (M‐H, Random, 95% CI) | 0.0 [0.0, 0.0] |
| 2 Women with nausea and/or vomiting Show forest plot | 1 | 20 | Risk Ratio (M‐H, Random, 95% CI) | 3.0 [0.14, 65.90] |
| 3 Neonates with acidosis (pH < 7.2) Show forest plot | 1 | 20 | Risk Ratio (M‐H, Random, 95% CI) | 9.00 [0.55, 147.95] |
| Outcome or subgroup title | No. of studies | No. of participants | Statistical method | Effect size |
| 1 Women with hypotension requiring intervention Show forest plot | 2 | 160 | Risk Ratio (M‐H, Random, 95% CI) | 0.53 [0.36, 0.79] |
| 2 Women with hypertension requiring intervention Show forest plot | 1 | 100 | Risk Ratio (M‐H, Fixed, 95% CI) | 3.0 [0.32, 27.87] |
| 3 Women with bradycardia Show forest plot | 1 | 100 | Risk Ratio (M‐H, Fixed, 95% CI) | 0.0 [0.0, 0.0] |
| 4 Women with nausea and vomiting Show forest plot | 2 | Risk Ratio (M‐H, Random, 95% CI) | Subtotals only | |
| 4.1 Women with nausea and/or vomiting | 1 | 100 | Risk Ratio (M‐H, Random, 95% CI) | 5.00 [0.25, 101.58] |
| 4.2 Women with nausea | 1 | 60 | Risk Ratio (M‐H, Random, 95% CI) | 0.22 [0.05, 0.94] |
| 4.3 Women with vomiting | 1 | 60 | Risk Ratio (M‐H, Random, 95% CI) | 0.14 [0.01, 2.65] |
| 5 5 Neonates with acidosis (pH < 7.2) Show forest plot | 1 | 100 | Risk Ratio (M‐H, Fixed, 95% CI) | 0.0 [0.0, 0.0] |
| 6 Apgar score < 8 at 5 min Show forest plot | 2 | 160 | Risk Ratio (M‐H, Random, 95% CI) | 3.0 [0.13, 71.92] |
| Outcome or subgroup title | No. of studies | No. of participants | Statistical method | Effect size |
| 1 Women with hypotension requiring intervention Show forest plot | 1 | 53 | Risk Ratio (M‐H, Random, 95% CI) | 1.56 [0.50, 4.89] |
| 2 Women with hypertension requiring intervention Show forest plot | 1 | 53 | Risk Ratio (M‐H, Random, 95% CI) | 0.62 [0.26, 1.47] |
| 3 Women with bradycardia Show forest plot | 1 | 53 | Risk Ratio (M‐H, Random, 95% CI) | 0.0 [0.0, 0.0] |
| 4 Women with nausea and/or vomiting Show forest plot | 1 | 53 | Risk Ratio (M‐H, Random, 95% CI) | 7.26 [0.39, 134.01] |
| 5 5 Neonates with acidosis (pH < 7.2) Show forest plot | 1 | 53 | Risk Ratio (M‐H, Random, 95% CI) | 0.0 [0.0, 0.0] |
| 6 Neonatal Apgar score < 8 at 5 min Show forest plot | 1 | 53 | Risk Ratio (M‐H, Random, 95% CI) | 0.0 [0.0, 0.0] |
| Outcome or subgroup title | No. of studies | No. of participants | Statistical method | Effect size |
| 1 Women with hypotension requiring intervention Show forest plot | 6 | Risk Ratio (M‐H, Random, 95% CI) | Subtotals only | |
| 1.1 5 mg vs 10 mg | 2 | 100 | Risk Ratio (M‐H, Random, 95% CI) | 1.05 [0.65, 1.69] |
| 1.2 6 mg vs 12 mg | 1 | 46 | Risk Ratio (M‐H, Random, 95% CI) | 1.83 [0.83, 4.04] |
| 1.3 5 mg vs 15 mg | 1 | 40 | Risk Ratio (M‐H, Random, 95% CI) | 2.0 [0.94, 4.27] |
| 1.4 10 mg vs 15 mg | 1 | 40 | Risk Ratio (M‐H, Random, 95% CI) | 1.83 [0.84, 3.99] |
| 1.5 10 mg vs 20 mg | 2 | 60 | Risk Ratio (M‐H, Random, 95% CI) | 1.06 [0.80, 1.39] |
| 1.6 10 mg vs 30 mg | 1 | 40 | Risk Ratio (M‐H, Random, 95% CI) | 2.43 [1.30, 4.54] |
| 1.7 15 mg vs 30 mg | 1 | 100 | Risk Ratio (M‐H, Random, 95% CI) | 2.11 [1.06, 4.21] |
| 1.8 20 mg vs 30 mg | 1 | 40 | Risk Ratio (M‐H, Random, 95% CI) | 2.29 [1.21, 4.32] |
| 2 Women with hypertension requiring intervention Show forest plot | 2 | Risk Ratio (M‐H, Random, 95% CI) | Subtotals only | |
| 2.1 5 mg vs 10 mg | 1 | 40 | Risk Ratio (M‐H, Random, 95% CI) | 1.2 [0.44, 3.30] |
| 2.2 5 mg vs 15 mg | 1 | 40 | Risk Ratio (M‐H, Random, 95% CI) | 0.5 [0.23, 1.07] |
| 2.3 10 mg vs 15 mg | 1 | 40 | Risk Ratio (M‐H, Random, 95% CI) | 0.42 [0.18, 0.96] |
| 2.4 10 mg vs 20 mg | 1 | 40 | Risk Ratio (M‐H, Random, 95% CI) | 0.2 [0.03, 1.56] |
| 2.5 10 mg vs 30 mg | 1 | 40 | Risk Ratio (M‐H, Random, 95% CI) | 0.11 [0.02, 0.80] |
| 2.6 20 mg vs 30 mg | 1 | 40 | Risk Ratio (M‐H, Random, 95% CI) | 0.56 [0.23, 1.37] |
| 3 Women with nausea and/or vomiting Show forest plot | 4 | Risk Ratio (M‐H, Random, 95% CI) | Subtotals only | |
| 3.1 6 mg vs 12 mg (nausea and/or vomiting) | 1 | 46 | Risk Ratio (M‐H, Random, 95% CI) | 0.81 [0.38, 1.74] |
| 3.2 5 mg vs 10 mg (vomiting) | 1 | 40 | Risk Ratio (M‐H, Random, 95% CI) | 3.0 [0.34, 26.45] |
| 3.3 5 mg vs 15 mg (vomiting) | 1 | 40 | Risk Ratio (M‐H, Random, 95% CI) | 1.5 [0.28, 8.04] |
| 3.4 10 mg vs 15 mg (vomiting) | 1 | 40 | Risk Ratio (M‐H, Random, 95% CI) | 0.5 [0.05, 5.08] |
| 3.5 5 mg vs 10 mg (nausea) | 1 | 40 | Risk Ratio (M‐H, Random, 95% CI) | 2.0 [0.83, 4.81] |
| 3.6 5 mg vs 15 mg (nausea) | 1 | 40 | Risk Ratio (M‐H, Random, 95% CI) | 2.5 [0.94, 6.66] |
| 3.7 10 mg vs 15 mg (nausea) | 1 | 40 | Risk Ratio (M‐H, Random, 95% CI) | 1.25 [0.39, 3.99] |
| 3.8 10 mg vs 20 mg (nausea) | 1 | 40 | Risk Ratio (M‐H, Random, 95% CI) | 0.69 [0.39, 1.24] |
| 3.9 10 mg vs 30 mg (nausea) | 1 | 40 | Risk Ratio (M‐H, Random, 95% CI) | 1.8 [0.73, 4.43] |
| 3.10 15 mg vs 30 mg (nausea) | 1 | 100 | Risk Ratio (M‐H, Random, 95% CI) | 1.43 [0.59, 3.45] |
| 3.11 20 mg vs 30 mg (nausea) | 1 | 40 | Risk Ratio (M‐H, Random, 95% CI) | 2.6 [1.14, 5.93] |
| 3.12 15 mg vs 30 mg (vomiting) | 1 | 100 | Risk Ratio (M‐H, Random, 95% CI) | 0.67 [0.12, 3.82] |
| 4 Neonates with acidosis (pH < 7.2) Show forest plot | 3 | Risk Ratio (M‐H, Random, 95% CI) | Subtotals only | |
| 4.1 5 mg vs 10 mg | 1 | 40 | Risk Ratio (M‐H, Random, 95% CI) | 0.2 [0.01, 3.92] |
| 4.2 5 mg vs 15 mg | 1 | 40 | Risk Ratio (M‐H, Random, 95% CI) | 0.33 [0.01, 7.72] |
| 4.3 6 mg vs 12 mg | 1 | 46 | Risk Ratio (M‐H, Random, 95% CI) | 0.31 [0.01, 7.16] |
| 4.4 10 mg vs 15 mg | 1 | 40 | Risk Ratio (M‐H, Random, 95% CI) | 2.0 [0.20, 20.33] |
| 4.5 10 mg vs 20 mg | 1 | 39 | Risk Ratio (M‐H, Random, 95% CI) | 0.59 [0.24, 1.50] |
| 4.6 10 mg vs 30 mg | 1 | 38 | Risk Ratio (M‐H, Random, 95% CI) | 1.13 [0.36, 3.55] |
| 4.7 20 mg vs 30 mg | 1 | 37 | Risk Ratio (M‐H, Random, 95% CI) | 1.89 [0.69, 5.21] |
| 5 Neonatal Apgar score at 5 min Show forest plot | 4 | Risk Ratio (M‐H, Random, 95% CI) | Subtotals only | |
| 5.1 6 mg vs 12 mg (Apgar < 7) | 1 | 46 | Risk Ratio (M‐H, Random, 95% CI) | 0.31 [0.01, 7.16] |
| 5.2 5 mg vs 10 mg (Apgar < 8) | 1 | 40 | Risk Ratio (M‐H, Random, 95% CI) | 0.0 [0.0, 0.0] |
| 5.3 5 mg vs 15 mg (Apgar < 8) | 1 | 40 | Risk Ratio (M‐H, Random, 95% CI) | 0.0 [0.0, 0.0] |
| 5.4 10 mg vs 15 mg (Apgar < 8) | 1 | 40 | Risk Ratio (M‐H, Random, 95% CI) | 0.0 [0.0, 0.0] |
| 5.5 10 mg vs 20 mg (Apgar < 7) | 1 | 40 | Risk Ratio (M‐H, Random, 95% CI) | 0.0 [0.0, 0.0] |
| 5.6 10 mg vs 30 mg (Apgar < 7) | 1 | 40 | Risk Ratio (M‐H, Random, 95% CI) | 0.0 [0.0, 0.0] |
| 5.7 20 mg vs 30 mg (Apgar < 7) | 1 | 40 | Risk Ratio (M‐H, Random, 95% CI) | 0.0 [0.0, 0.0] |
| 5.8 10 mg vs 20 mg (Apgar < 8) | 1 | 20 | Risk Ratio (M‐H, Random, 95% CI) | 0.0 [0.0, 0.0] |
| Outcome or subgroup title | No. of studies | No. of participants | Statistical method | Effect size |
| 1 Women with hypotension requiring intervention Show forest plot | 4 | Risk Ratio (M‐H, Random, 95% CI) | Subtotals only | |
| 1.1 Bolus + infusion vs infusion | 1 | 80 | Risk Ratio (M‐H, Random, 95% CI) | 3.5 [1.26, 9.72] |
| 1.2 0.5 mg/min vs 1 mg/min | 1 | 40 | Risk Ratio (M‐H, Random, 95% CI) | 1.22 [0.65, 2.29] |
| 1.3 0.5 mg/min vs 2 mg/min | 1 | 40 | Risk Ratio (M‐H, Random, 95% CI) | 1.57 [0.77, 3.22] |
| 1.4 0.5 mg/min vs 4 mg/min | 1 | 40 | Risk Ratio (M‐H, Random, 95% CI) | 1.22 [0.65, 2.29] |
| 1.5 1 mg/min vs 2 mg/min | 3 | 107 | Risk Ratio (M‐H, Random, 95% CI) | 1.24 [0.83, 1.84] |
| 1.6 1 mg/min vs 3 to 4 mg/min | 2 | 99 | Risk Ratio (M‐H, Random, 95% CI) | 1.29 [0.81, 2.05] |
| 1.7 2 mg/min vs 3 to 4 mg/min | 2 | 239 | Risk Ratio (M‐H, Random, 95% CI) | 1.21 [0.60, 2.43] |
| 2 Women with hypertension requiring intervention Show forest plot | 2 | Risk Ratio (M‐H, Random, 95% CI) | Subtotals only | |
| 2.1 Bolus + infusion vs infusion | 1 | 80 | Risk Ratio (M‐H, Random, 95% CI) | 1.0 [0.39, 2.59] |
| 2.2 0.5 mg/min vs 1 mg/min | 1 | 40 | Risk Ratio (M‐H, Random, 95% CI) | 5.0 [0.26, 98.00] |
| 2.3 0.5 mg/min vs 2 mg/min | 1 | 40 | Risk Ratio (M‐H, Random, 95% CI) | 0.67 [0.12, 3.57] |
| 2.4 0.5 mg/min vs 4 mg/min | 1 | 40 | Risk Ratio (M‐H, Random, 95% CI) | 0.2 [0.05, 0.80] |
| 2.5 1 mg/min vs 2 mg/min | 1 | 40 | Risk Ratio (M‐H, Random, 95% CI) | 0.14 [0.01, 2.60] |
| 2.6 1 mg/min vs 4 mg/min | 1 | 40 | Risk Ratio (M‐H, Random, 95% CI) | 0.05 [0.00, 0.76] |
| 2.7 2 mg/min vs 4 mg/min | 1 | 40 | Risk Ratio (M‐H, Random, 95% CI) | 0.30 [0.10, 0.93] |
| 3 Women with bradycardia Show forest plot | 1 | 19 | Risk Ratio (M‐H, Random, 95% CI) | 0.0 [0.0, 0.0] |
| 3.1 1 mg/min vs 2 mg/min | 1 | 19 | Risk Ratio (M‐H, Random, 95% CI) | 0.0 [0.0, 0.0] |
| 4 Women with nausea and/or vomiting Show forest plot | 3 | Risk Ratio (M‐H, Random, 95% CI) | Subtotals only | |
| 4.1 Bolus + infusion vs infusion (nausea) | 1 | 80 | Risk Ratio (M‐H, Random, 95% CI) | 1.83 [0.75, 4.48] |
| 4.2 0.5 mg/min vs 1 mg/min (nausea) | 1 | 40 | Risk Ratio (M‐H, Random, 95% CI) | 1.29 [0.60, 2.77] |
| 4.3 0.5 mg/min vs 2 mg/min (nausea) | 1 | 40 | Risk Ratio (M‐H, Random, 95% CI) | 1.5 [0.66, 3.43] |
| 4.4 0.5 mg/min vs 4 mg/min (nausea) | 1 | 40 | Risk Ratio (M‐H, Random, 95% CI) | 1.29 [0.60, 2.77] |
| 4.5 1 mg/min vs 2 mg/min (nausea) | 2 | 60 | Risk Ratio (M‐H, Random, 95% CI) | 2.19 [0.30, 15.85] |
| 4.6 1 mg/min vs 4 mg/min (nausea) | 1 | 40 | Risk Ratio (M‐H, Random, 95% CI) | 1.0 [0.43, 2.33] |
| 4.7 2 mg/min vs 4 mg/min (nausea) | 1 | 40 | Risk Ratio (M‐H, Random, 95% CI) | 0.86 [0.35, 2.10] |
| 4.8 Bolus + infusion vs infusion (vomiting) | 1 | 80 | Risk Ratio (M‐H, Random, 95% CI) | 1.67 [0.43, 6.51] |
| 4.9 0.5 mg/min vs 1 mg/min (vomiting) | 1 | 40 | Risk Ratio (M‐H, Random, 95% CI) | 0.67 [0.12, 3.57] |
| 4.10 0.5 mg/min vs 2 mg/min (vomiting) | 1 | 40 | Risk Ratio (M‐H, Random, 95% CI) | 2.0 [0.20, 20.33] |
| 4.11 0.5 mg/min vs 4 mg/min (vomiting) | 1 | 40 | Risk Ratio (M‐H, Random, 95% CI) | 2.0 [0.20, 20.33] |
| 4.12 1 mg/min vs 2 mg/min (vomiting) | 1 | 40 | Risk Ratio (M‐H, Random, 95% CI) | 3.0 [0.34, 26.45] |
| 4.13 1 mg/min vs 4 mg/min (vomiting) | 1 | 40 | Risk Ratio (M‐H, Random, 95% CI) | 3.0 [0.34, 26.45] |
| 4.14 2 mg/min vs 4 mg/min (vomiting) | 1 | 40 | Risk Ratio (M‐H, Random, 95% CI) | 1.0 [0.07, 14.90] |
| 4.15 1 mg/min vs 2 mg/min (nausea or vomiting) | 1 | 19 | Risk Ratio (M‐H, Random, 95% CI) | 8.18 [0.50, 133.66] |
| 5 Neonates with acidosis (pH < 7.2) Show forest plot | 2 | Risk Ratio (M‐H, Random, 95% CI) | Subtotals only | |
| 5.1 Bolus + infusion vs infusion | 1 | 78 | Risk Ratio (M‐H, Random, 95% CI) | 1.66 [0.53, 5.23] |
| 5.2 0.5 mg/min vs 1 mg/min | 1 | 40 | Risk Ratio (M‐H, Random, 95% CI) | 0.33 [0.04, 2.94] |
| 5.3 0.5 mg/min vs 2 mg/min | 1 | 40 | Risk Ratio (M‐H, Random, 95% CI) | 3.0 [0.13, 69.52] |
| 5.4 0.5 mg/min vs 4 mg/min | 1 | 40 | Risk Ratio (M‐H, Random, 95% CI) | 0.25 [0.03, 2.05] |
| 5.5 1 mg/min vs 2 mg/min | 1 | 40 | Risk Ratio (M‐H, Random, 95% CI) | 7.0 [0.38, 127.32] |
| 5.6 1 mg/min vs 4 mg/min | 1 | 40 | Risk Ratio (M‐H, Random, 95% CI) | 0.75 [0.19, 2.93] |
| 5.7 2 mg/min vs 4 mg/min | 1 | 40 | Risk Ratio (M‐H, Random, 95% CI) | 0.11 [0.01, 1.94] |
| 6 Neonatal Apgar score at 5 min Show forest plot | 3 | Risk Ratio (M‐H, Random, 95% CI) | Subtotals only | |
| 6.1 Bolus + infusion vs infusion (Apgar < 7) | 1 | 80 | Risk Ratio (M‐H, Random, 95% CI) | 0.0 [0.0, 0.0] |
| 6.2 0.5 mg/min vs 1 mg/min (Apgar < 8) | 1 | 40 | Risk Ratio (M‐H, Random, 95% CI) | 0.0 [0.0, 0.0] |
| 6.3 0.5 mg/min vs 2 mg/min (Apgar < 8) | 1 | 40 | Risk Ratio (M‐H, Random, 95% CI) | 0.0 [0.0, 0.0] |
| 6.4 0.5 mg/min vs 4 mg/min (Apgar < 8) | 1 | 40 | Risk Ratio (M‐H, Random, 95% CI) | 0.0 [0.0, 0.0] |
| 6.5 1 mg/min vs 2 mg/min (Apgar < 8) | 2 | 59 | Risk Ratio (M‐H, Random, 95% CI) | 0.0 [0.0, 0.0] |
| 6.6 1 mg/min vs 4 mg/min (Apgar < 8) | 1 | 40 | Risk Ratio (M‐H, Random, 95% CI) | 0.0 [0.0, 0.0] |
| 6.7 2 mg/min vs 4 mg/min (Apgar < 8) | 1 | 40 | Risk Ratio (M‐H, Random, 95% CI) | 0.0 [0.0, 0.0] |
| Outcome or subgroup title | No. of studies | No. of participants | Statistical method | Effect size |
| 1 Women with hypotension requiring intervention Show forest plot | 1 | Risk Ratio (M‐H, Random, 95% CI) | Subtotals only | |
| 1.1 Oral vs IM | 1 | 40 | Risk Ratio (M‐H, Random, 95% CI) | 3.0 [0.95, 9.48] |
| 1.2 Oral vs IV | 1 | 40 | Risk Ratio (M‐H, Random, 95% CI) | 19.00 [1.18, 305.88] |
| 2 Women with hypertension requiring intervention Show forest plot | 1 | Risk Ratio (M‐H, Random, 95% CI) | Subtotals only | |
| 2.1 Oral vs IM | 1 | 40 | Risk Ratio (M‐H, Random, 95% CI) | 0.0 [0.0, 0.0] |
| 2.2 Oral vs IV | 1 | 40 | Risk Ratio (M‐H, Random, 95% CI) | 0.0 [0.0, 0.0] |
| 3 Women with nausea and vomiting Show forest plot | 1 | Risk Ratio (M‐H, Random, 95% CI) | Subtotals only | |
| 3.1 Oral vs IM | 1 | 40 | Risk Ratio (M‐H, Random, 95% CI) | 1.33 [0.34, 5.21] |
| 3.2 Oral vs IV | 1 | 40 | Risk Ratio (M‐H, Random, 95% CI) | 9.00 [0.52, 156.91] |
| Outcome or subgroup title | No. of studies | No. of participants | Statistical method | Effect size |
| 1 Women with hypotension requiring intervention Show forest plot | 1 | 60 | Risk Ratio (M‐H, Random, 95% CI) | 0.75 [0.43, 1.30] |
| 2 Women with hypertension requiring intervention Show forest plot | 1 | 60 | Risk Ratio (M‐H, Random, 95% CI) | 0.0 [0.0, 0.0] |
| 3 Apgar < 8 at 5 min Show forest plot | 1 | 60 | Risk Ratio (M‐H, Random, 95% CI) | 0.0 [0.0, 0.0] |
| Outcome or subgroup title | No. of studies | No. of participants | Statistical method | Effect size |
| 1 Women with hypotension requiring intervention Show forest plot | 5 | 280 | Risk Ratio (M‐H, Random, 95% CI) | 0.45 [0.26, 0.80] |
| 2 Women with cardiac dysrhythmia Show forest plot | 3 | Risk Ratio (M‐H, Random, 95% CI) | Subtotals only | |
| 2.1 Tachycardia | 1 | 56 | Risk Ratio (M‐H, Random, 95% CI) | 0.87 [0.13, 5.73] |
| 2.2 Bradycardia | 3 | 180 | Risk Ratio (M‐H, Random, 95% CI) | 3.23 [0.17, 61.85] |
| 3 Women with nausea and/or vomiting Show forest plot | 3 | 180 | Risk Ratio (M‐H, Random, 95% CI) | 0.70 [0.16, 2.98] |
| 4 Neonates with acidosis (pH < 7.2) Show forest plot | 1 | 49 | Risk Ratio (M‐H, Random, 95% CI) | 0.96 [0.06, 14.50] |
| 5 Neonates with Apgar < 7 at 5 min Show forest plot | 1 | 50 | Risk Ratio (M‐H, Random, 95% CI) | 0.0 [0.0, 0.0] |
| 6 Neonates with Apgar < 8 at 5 min Show forest plot | 2 | 96 | Risk Ratio (M‐H, Random, 95% CI) | 0.0 [0.0, 0.0] |
| Outcome or subgroup title | No. of studies | No. of participants | Statistical method | Effect size |
| 1 Women with hypotension requiring intervention Show forest plot | 1 | 60 | Risk Ratio (M‐H, Random, 95% CI) | 2.0 [0.19, 20.90] |
| 2 Women with hypertension requiring intervention Show forest plot | 1 | 60 | Risk Ratio (M‐H, Random, 95% CI) | 17.0 [1.03, 281.91] |
| 3 Cardiac dysrhythmia Show forest plot | 1 | Risk Ratio (M‐H, Random, 95% CI) | Subtotals only | |
| 3.1 Bradycardia | 1 | 60 | Risk Ratio (M‐H, Random, 95% CI) | 15.0 [0.89, 251.42] |
| 4 Nausea and/or vomiting Show forest plot | 1 | Risk Ratio (M‐H, Random, 95% CI) | Subtotals only | |
| 4.1 Nausea | 1 | 60 | Risk Ratio (M‐H, Random, 95% CI) | 0.2 [0.01, 4.00] |
| 4.2 Vomiting | 1 | 60 | Risk Ratio (M‐H, Random, 95% CI) | 1.0 [0.07, 15.26] |
| Outcome or subgroup title | No. of studies | No. of participants | Statistical method | Effect size |
| 1 Women with hypotension requiring intervention Show forest plot | 1 | 59 | Risk Ratio (M‐H, Random, 95% CI) | 0.84 [0.23, 3.06] |
| 2 Women with hypertension requiring intervention Show forest plot | 1 | 59 | Risk Ratio (M‐H, Random, 95% CI) | 0.25 [0.08, 0.83] |
| 3 Women with bradycardia Show forest plot | 1 | 59 | Risk Ratio (M‐H, Random, 95% CI) | 0.0 [0.0, 0.0] |
| 4 Women with nausea and/or vomiting Show forest plot | 1 | 59 | Risk Ratio (M‐H, Random, 95% CI) | 0.0 [0.0, 0.0] |
| 5 Neonatal pH < 7.2 Show forest plot | 1 | 59 | Risk Ratio (M‐H, Random, 95% CI) | 0.0 [0.0, 0.0] |
| 6 Neonatal Apgar score < 8 at 5 min Show forest plot | 1 | 59 | Risk Ratio (M‐H, Random, 95% CI) | 0.0 [0.0, 0.0] |
| Outcome or subgroup title | No. of studies | No. of participants | Statistical method | Effect size |
| 1 Women with hypotension requiring intervention Show forest plot | 1 | 76 | Risk Ratio (M‐H, Random, 95% CI) | 0.73 [0.46, 1.15] |
| 2 Women with bradycardia Show forest plot | 1 | 76 | Risk Ratio (M‐H, Random, 95% CI) | 0.5 [0.05, 5.28] |
| 3 Women with nausea and/or vomiting Show forest plot | 1 | 76 | Risk Ratio (M‐H, Random, 95% CI) | 1.0 [0.32, 3.17] |
| Outcome or subgroup title | No. of studies | No. of participants | Statistical method | Effect size |
| 1 Women with hypotension requiring intervention Show forest plot | 1 | 60 | Risk Ratio (M‐H, Random, 95% CI) | 1.4 [0.50, 3.92] |
| 2 Women with cardiac dysrhythmia Show forest plot | 1 | 60 | Risk Ratio (M‐H, Random, 95% CI) | 1.22 [0.59, 2.51] |
| 2.1 Bradycardia | 1 | 60 | Risk Ratio (M‐H, Random, 95% CI) | 1.22 [0.59, 2.51] |
| 3 Women with nausea/vomiting Show forest plot | 1 | 60 | Risk Ratio (M‐H, Random, 95% CI) | 0.45 [0.18, 1.15] |
| 4 Neonatal Apgar score < 8 at 5 min Show forest plot | 1 | 60 | Risk Ratio (M‐H, Random, 95% CI) | 0.0 [0.0, 0.0] |
| Outcome or subgroup title | No. of studies | No. of participants | Statistical method | Effect size |
| 1 Women with hypotension requiring intervention Show forest plot | 1 | 117 | Risk Ratio (M‐H, Random, 95% CI) | 8.17 [1.04, 64.30] |
| 1.1 50 μg/mL vs 100 μg/mL | 1 | 117 | Risk Ratio (M‐H, Random, 95% CI) | 8.17 [1.04, 64.30] |
| 2 Women with hypertension requiring intervention Show forest plot | 1 | 117 | Risk Ratio (M‐H, Random, 95% CI) | 0.23 [0.05, 1.02] |
| 2.1 50 μg/mL vs 100 μg/mL | 1 | 117 | Risk Ratio (M‐H, Random, 95% CI) | 0.23 [0.05, 1.02] |
| 3 Women with cardiac dysrhythmia Show forest plot | 1 | 117 | Risk Ratio (M‐H, Random, 95% CI) | 0.11 [0.01, 0.80] |
| 3.1 Bradycardia: 50 μg/mL vs 100 μg/mL | 1 | 117 | Risk Ratio (M‐H, Random, 95% CI) | 0.11 [0.01, 0.80] |
| 4 Women with nausea and/or vomiting Show forest plot | 1 | 117 | Risk Ratio (M‐H, Random, 95% CI) | 3.5 [0.37, 32.67] |
| 4.1 Nausea and vomiting: 50 μg/mL vs 100 μg/mL | 1 | 117 | Risk Ratio (M‐H, Random, 95% CI) | 3.5 [0.37, 32.67] |
| 5 Neonatal cord blood pH < 7.2 Show forest plot | 1 | 117 | Risk Ratio (M‐H, Random, 95% CI) | 0.0 [0.0, 0.0] |
| 5.1 50 μg/mL vs 100 μg/mL | 1 | 117 | Risk Ratio (M‐H, Random, 95% CI) | 0.0 [0.0, 0.0] |
| 6 Neonatal Apgar score < 8 at 5 min Show forest plot | 1 | 117 | Risk Ratio (M‐H, Random, 95% CI) | 0.0 [0.0, 0.0] |
| 6.1 50 μg/mL vs 100 μg/mL | 1 | 117 | Risk Ratio (M‐H, Random, 95% CI) | 0.0 [0.0, 0.0] |
| Outcome or subgroup title | No. of studies | No. of participants | Statistical method | Effect size |
| 1 Women with hypotension requiring intervention Show forest plot | 2 | 142 | Risk Ratio (M‐H, Random, 95% CI) | 0.63 [0.21, 1.91] |
| 2 Women with hypertension requiring intervention Show forest plot | 1 | 93 | Risk Ratio (M‐H, Random, 95% CI) | 2.67 [1.31, 5.43] |
| 3 Women with bradycardia Show forest plot | 1 | 93 | Risk Ratio (M‐H, Random, 95% CI) | 0.21 [0.01, 4.32] |
| 4 Women with nausea and/or vomiting Show forest plot | 2 | Risk Ratio (M‐H, Random, 95% CI) | Subtotals only | |
| 4.1 Nausea or vomiting | 1 | 93 | Risk Ratio (M‐H, Random, 95% CI) | 2.49 [0.69, 9.04] |
| 4.2 Nausea | 1 | 49 | Risk Ratio (M‐H, Random, 95% CI) | 0.61 [0.36, 1.06] |
| 4.3 Vomiting | 1 | 49 | Risk Ratio (M‐H, Random, 95% CI) | 0.52 [0.10, 2.59] |
| 5 Neonates with Apgar score < 8 at 5 min Show forest plot | 2 | 142 | Risk Ratio (M‐H, Random, 95% CI) | 0.0 [0.0, 0.0] |
| Outcome or subgroup title | No. of studies | No. of participants | Statistical method | Effect size |
| 1 Women with hypotension requiring intervention Show forest plot | 8 | 740 | Risk Ratio (M‐H, Random, 95% CI) | 0.67 [0.54, 0.83] |
| 1.1 2 mg vs control | 2 | 79 | Risk Ratio (M‐H, Random, 95% CI) | 0.90 [0.51, 1.58] |
| 1.2 4 mg vs control | 5 | 277 | Risk Ratio (M‐H, Random, 95% CI) | 0.46 [0.34, 0.63] |
| 1.3 6 mg vs control | 1 | 38 | Risk Ratio (M‐H, Random, 95% CI) | 0.48 [0.22, 1.03] |
| 1.4 8 mg vs control | 5 | 346 | Risk Ratio (M‐H, Random, 95% CI) | 0.85 [0.70, 1.03] |
| 2 Women with bradycardia Show forest plot | 8 | 740 | Risk Ratio (M‐H, Random, 95% CI) | 0.49 [0.28, 0.87] |
| 2.1 2 mg vs control | 2 | 79 | Risk Ratio (M‐H, Random, 95% CI) | 0.23 [0.02, 3.29] |
| 2.2 4 mg vs control | 5 | 277 | Risk Ratio (M‐H, Random, 95% CI) | 0.33 [0.16, 0.71] |
| 2.3 6 mg vs control | 1 | 38 | Risk Ratio (M‐H, Random, 95% CI) | 0.0 [0.0, 0.0] |
| 2.4 8 mg vs control | 5 | 346 | Risk Ratio (M‐H, Random, 95% CI) | 0.94 [0.38, 2.37] |
| 3 Women with nausea or vomiting Show forest plot | 7 | 653 | Risk Ratio (M‐H, Random, 95% CI) | 0.35 [0.24, 0.51] |
| 3.1 2 mg vs control | 2 | 79 | Risk Ratio (M‐H, Random, 95% CI) | 0.54 [0.18, 1.59] |
| 3.2 4 mg vs control | 5 | 277 | Risk Ratio (M‐H, Random, 95% CI) | 0.32 [0.17, 0.60] |
| 3.3 6 mg vs control | 1 | 38 | Risk Ratio (M‐H, Random, 95% CI) | 0.09 [0.01, 0.74] |
| 3.4 8 mg vs control | 4 | 259 | Risk Ratio (M‐H, Random, 95% CI) | 0.38 [0.19, 0.76] |
| 4 Women with anaphylaxis Show forest plot | 1 | 150 | Risk Ratio (M‐H, Random, 95% CI) | 0.0 [0.0, 0.0] |
| 4.1 2 mg vs control | 1 | 37 | Risk Ratio (M‐H, Random, 95% CI) | 0.0 [0.0, 0.0] |
| 4.2 4 mg vs control | 1 | 37 | Risk Ratio (M‐H, Random, 95% CI) | 0.0 [0.0, 0.0] |
| 4.3 6 mg vs control | 1 | 38 | Risk Ratio (M‐H, Random, 95% CI) | 0.0 [0.0, 0.0] |
| 4.4 8 mg vs control | 1 | 38 | Risk Ratio (M‐H, Random, 95% CI) | 0.0 [0.0, 0.0] |
| 5 Neonatal Apgar score < 8 at 5 min Show forest plot | 3 | 284 | Risk Ratio (M‐H, Random, 95% CI) | 0.0 [0.0, 0.0] |
| 5.1 2 mg vs control | 1 | 37 | Risk Ratio (M‐H, Random, 95% CI) | 0.0 [0.0, 0.0] |
| 5.2 4 mg vs control | 2 | 102 | Risk Ratio (M‐H, Random, 95% CI) | 0.0 [0.0, 0.0] |
| 5.3 6 mg vs control | 1 | 38 | Risk Ratio (M‐H, Random, 95% CI) | 0.0 [0.0, 0.0] |
| 5.4 8 mg vs control | 2 | 107 | Risk Ratio (M‐H, Random, 95% CI) | 0.0 [0.0, 0.0] |
| 6 Neonatal pH < 7.2 Show forest plot | 2 | 134 | Risk Ratio (M‐H, Random, 95% CI) | 0.48 [0.05, 5.09] |
| 6.1 4 mg vs control | 1 | 65 | Risk Ratio (M‐H, Random, 95% CI) | 0.48 [0.05, 5.09] |
| 6.2 8 mg vs control | 1 | 69 | Risk Ratio (M‐H, Random, 95% CI) | 0.0 [0.0, 0.0] |
| Outcome or subgroup title | No. of studies | No. of participants | Statistical method | Effect size |
| 1 Women with hypotension requiring intervention Show forest plot | 1 | 112 | Risk Ratio (M‐H, Random, 95% CI) | 1.07 [0.76, 1.49] |
| 2 Women with bradycardia Show forest plot | 1 | 112 | Risk Ratio (M‐H, Random, 95% CI) | 3.0 [0.12, 72.10] |
| 3 Women with nausea and/or vomiting Show forest plot | 1 | 112 | Risk Ratio (M‐H, Random, 95% CI) | 0.38 [0.10, 1.34] |
| Outcome or subgroup title | No. of studies | No. of participants | Statistical method | Effect size |
| 1 Women with hypotension requiring intervention Show forest plot | 1 | 200 | Risk Ratio (M‐H, Random, 95% CI) | 0.05 [0.02, 0.14] |
| Outcome or subgroup title | No. of studies | No. of participants | Statistical method | Effect size |
| 1 Women with hypotension requiring intervention Show forest plot | 1 | 105 | Risk Ratio (M‐H, Random, 95% CI) | 0.79 [0.62, 1.01] |
| 1.1 0.25 mg/kg IV ketamine | 1 | 52 | Risk Ratio (M‐H, Random, 95% CI) | 0.83 [0.61, 1.14] |
| 1.2 0.5 mg/kg IV ketamine | 1 | 53 | Risk Ratio (M‐H, Random, 95% CI) | 0.73 [0.50, 1.07] |
| 2 Women with nausea and/or vomiting Show forest plot | 1 | 105 | Risk Ratio (M‐H, Random, 95% CI) | 0.79 [0.50, 1.25] |
| 2.1 0.25 mg/kg IV ketamine | 1 | 52 | Risk Ratio (M‐H, Random, 95% CI) | 0.91 [0.48, 1.71] |
| 2.2 0.5 mg/kg IV ketamine | 1 | 53 | Risk Ratio (M‐H, Random, 95% CI) | 0.69 [0.36, 1.31] |
| 3 Apgar score < 8 at 5 min Show forest plot | 1 | 105 | Risk Ratio (M‐H, Random, 95% CI) | 0.0 [0.0, 0.0] |
| 3.1 0.25 mg/kg IV ketamine | 1 | 52 | Risk Ratio (M‐H, Random, 95% CI) | 0.0 [0.0, 0.0] |
| 3.2 0.5 mg/kg IV ketamine | 1 | 53 | Risk Ratio (M‐H, Random, 95% CI) | 0.0 [0.0, 0.0] |
| Outcome or subgroup title | No. of studies | No. of participants | Statistical method | Effect size |
| 1 Women with hypotension requiring intervention Show forest plot | 1 | 20 | Risk Ratio (M‐H, Random, 95% CI) | 0.09 [0.01, 1.45] |
| 2 Women with nausea and/or vomiting Show forest plot | 1 | 20 | Risk Ratio (M‐H, Random, 95% CI) | 0.2 [0.01, 3.70] |
| 3 Neonates with acidosis (pH < 7.2) Show forest plot | 1 | 20 | Risk Ratio (M‐H, Random, 95% CI) | 0.0 [0.0, 0.0] |
| Outcome or subgroup title | No. of studies | No. of participants | Statistical method | Effect size |
| 1 Women with hypotension requiring intervention Show forest plot | 1 | 30 | Risk Ratio (M‐H, Random, 95% CI) | 0.05 [0.00, 0.75] |
| 2 Neonatal Apgar score < 8 at 5 min Show forest plot | 1 | 30 | Risk Ratio (M‐H, Random, 95% CI) | 0.0 [0.0, 0.0] |
| Outcome or subgroup title | No. of studies | No. of participants | Statistical method | Effect size |
| 1 Women with hypotension requiring intervention Show forest plot | 11 | 705 | Risk Ratio (M‐H, Random, 95% CI) | 0.61 [0.47, 0.78] |
| 2 Women with bradycardia Show forest plot | 1 | 74 | Risk Ratio (M‐H, Random, 95% CI) | 0.63 [0.11, 3.56] |
| 3 Women with nausea and/or vomiting Show forest plot | 4 | Risk Ratio (M‐H, Random, 95% CI) | Subtotals only | |
| 3.1 Women with nausea and/or vomiting | 4 | 276 | Risk Ratio (M‐H, Random, 95% CI) | 0.42 [0.14, 1.27] |
| 3.2 Women with nausea | 1 | 92 | Risk Ratio (M‐H, Random, 95% CI) | 1.44 [0.25, 8.20] |
| 3.3 Women with vomiting | 1 | 92 | Risk Ratio (M‐H, Random, 95% CI) | 0.0 [0.0, 0.0] |
| 4 Neonates with Apgar score < 8 at 5 min Show forest plot | 3 | 130 | Risk Ratio (M‐H, Random, 95% CI) | 0.0 [0.0, 0.0] |
| Outcome or subgroup title | No. of studies | No. of participants | Statistical method | Effect size |
| 1 Women with hypotension requiring intervention Show forest plot | 1 | 80 | Risk Ratio (M‐H, Random, 95% CI) | 0.85 [0.53, 1.37] |
| 2 Women with nausea and/or vomiting Show forest plot | 1 | Risk Ratio (M‐H, Random, 95% CI) | Subtotals only | |
| 2.1 Women with nausea | 1 | 80 | Risk Ratio (M‐H, Random, 95% CI) | 0.27 [0.12, 0.60] |
| 2.2 Women with vomiting | 1 | 80 | Risk Ratio (M‐H, Random, 95% CI) | 0.11 [0.01, 2.00] |
| Outcome or subgroup title | No. of studies | No. of participants | Statistical method | Effect size |
| 1 Women with hypotension requiring intervention Show forest plot | 1 | 40 | Risk Ratio (M‐H, Random, 95% CI) | 0.71 [0.47, 1.06] |
| 2 Neonates with Apgar score < 8 at 5 min Show forest plot | 1 | 40 | Risk Ratio (M‐H, Random, 95% CI) | 0.0 [0.0, 0.0] |
| Outcome or subgroup title | No. of studies | No. of participants | Statistical method | Effect size |
| 1 Women with hypotension requiring intervention Show forest plot | 1 | 34 | Risk Ratio (M‐H, Random, 95% CI) | 1.07 [0.81, 1.42] |
| Outcome or subgroup title | No. of studies | No. of participants | Statistical method | Effect size |
| 1 Women with hypotension requiring intervention Show forest plot | 1 | 40 | Risk Ratio (M‐H, Random, 95% CI) | 0.92 [0.57, 1.49] |
| 2 Neonates with Apgar score < 8 at 5 min Show forest plot | 1 | 40 | Risk Ratio (M‐H, Random, 95% CI) | 0.0 [0.0, 0.0] |
| Outcome or subgroup title | No. of studies | No. of participants | Statistical method | Effect size |
| 1 Women with hypotension requiring intervention Show forest plot | 1 | 98 | Risk Ratio (M‐H, Random, 95% CI) | 0.81 [0.58, 1.12] |
| 2 Women with nausea and/or vomiting Show forest plot | 1 | Risk Ratio (M‐H, Random, 95% CI) | Subtotals only | |
| 2.1 Nausea | 1 | 98 | Risk Ratio (M‐H, Random, 95% CI) | 0.65 [0.40, 1.07] |
| 2.2 Vomiting | 1 | 98 | Risk Ratio (M‐H, Random, 95% CI) | 0.38 [0.02, 9.01] |
| 3 Neonates with acidosis (pH < 7.2) Show forest plot | 1 | 98 | Risk Ratio (M‐H, Random, 95% CI) | 0.0 [0.0, 0.0] |
| 4 Neonates with Apgar < 7 at 5 min Show forest plot | 1 | 98 | Risk Ratio (M‐H, Random, 95% CI) | 0.0 [0.0, 0.0] |
| Outcome or subgroup title | No. of studies | No. of participants | Statistical method | Effect size |
| 1 Women requiring intervention for hypotension Show forest plot | 1 | 37 | Risk Ratio (M‐H, Random, 95% CI) | 0.71 [0.41, 1.21] |
| Outcome or subgroup title | No. of studies | No. of participants | Statistical method | Effect size |
| 1 Women with hypotension requiring intervention Show forest plot | 2 | 126 | Risk Ratio (M‐H, Random, 95% CI) | 0.91 [0.75, 1.09] |
| 2 Women with cardiac dysrhythmia requiring intervention Show forest plot | 1 | 40 | Risk Ratio (M‐H, Random, 95% CI) | 0.5 [0.05, 5.08] |
| 3 Neonates admitted to neonatal intensive care unit Show forest plot | 1 | 40 | Risk Ratio (M‐H, Random, 95% CI) | 0.0 [0.0, 0.0] |
| 4 Women with nausea Show forest plot | 1 | 86 | Risk Ratio (M‐H, Random, 95% CI) | 0.81 [0.45, 1.48] |
| Outcome or subgroup title | No. of studies | No. of participants | Statistical method | Effect size |
| 1 Women with hypotension requiring intervention Show forest plot | 1 | 58 | Risk Ratio (M‐H, Random, 95% CI) | 1.20 [0.80, 1.79] |
| 2 Women with cardiac dysrhythmia requiring intervention Show forest plot | 1 | Risk Ratio (M‐H, Random, 95% CI) | Subtotals only | |
| 2.1 Bradycardia | 1 | 58 | Risk Ratio (M‐H, Random, 95% CI) | 0.10 [0.01, 1.68] |
| 3 Women with nausea and/or vomiting Show forest plot | 1 | Risk Ratio (M‐H, Random, 95% CI) | Subtotals only | |
| 3.1 Nausea: 15 degree tilt | 1 | 58 | Risk Ratio (M‐H, Random, 95% CI) | 0.45 [0.18, 1.11] |
| 3.2 Vomiting: 15 degree tilt | 1 | 58 | Risk Ratio (M‐H, Random, 95% CI) | 0.15 [0.01, 2.83] |
| Outcome or subgroup title | No. of studies | No. of participants | Statistical method | Effect size |
| 1 Women with hypotension requiring intervention Show forest plot | 1 | 90 | Risk Ratio (M‐H, Random, 95% CI) | 0.63 [0.49, 0.80] |
| Outcome or subgroup title | No. of studies | No. of participants | Statistical method | Effect size |
| 1 Women with hypotension requiring intervention Show forest plot | 1 | 63 | Risk Ratio (M‐H, Random, 95% CI) | 0.73 [0.42, 1.26] |
| Outcome or subgroup title | No. of studies | No. of participants | Statistical method | Effect size |
| 1 Women with hypotension requiring intervention Show forest plot | 1 | 50 | Risk Ratio (M‐H, Random, 95% CI) | 0.84 [0.58, 1.22] |
| 2 Women with nausea and/or vomiting Show forest plot | 1 | Risk Ratio (M‐H, Random, 95% CI) | Subtotals only | |
| 2.1 Nausea | 1 | 50 | Risk Ratio (M‐H, Random, 95% CI) | 0.32 [0.15, 0.66] |
| 2.2 Vomiting | 1 | 50 | Risk Ratio (M‐H, Random, 95% CI) | 0.5 [0.14, 1.78] |
| 3 Neonates with Apgar < 7 at 5 min Show forest plot | 1 | 50 | Risk Ratio (M‐H, Random, 95% CI) | 0.0 [0.0, 0.0] |
| Outcome or subgroup title | No. of studies | No. of participants | Statistical method | Effect size |
| 1 Women with hypotension requiring intervention Show forest plot | 1 | 50 | Risk Ratio (M‐H, Random, 95% CI) | 0.94 [0.63, 1.40] |
| 2 Women with nausea and/or vomiting Show forest plot | 1 | Risk Ratio (M‐H, Random, 95% CI) | Subtotals only | |
| 2.1 Nausea | 1 | 50 | Risk Ratio (M‐H, Random, 95% CI) | 1.5 [0.48, 4.68] |
| 2.2 Vomiting | 1 | 50 | Risk Ratio (M‐H, Random, 95% CI) | 3.0 [0.33, 26.92] |
| 3 Neonates with Apgar < 7 at 5 min Show forest plot | 1 | 50 | Risk Ratio (M‐H, Random, 95% CI) | 0.0 [0.0, 0.0] |