Técnicas para la prevención de la hipotensión durante la anestesia espinal para la cesárea
Resumen
Antecedentes
La hipotensión materna es la complicación más frecuente de la anestesia espinal para la cesárea. Se puede asociar con náuseas o vómitos y puede entrañar graves riesgos para la madre (inconsciencia, aspiración pulmonar) y el niño (hipoxia, acidosis, lesión neurológica).
Objetivos
Evaluar los efectos de las intervenciones profilácticas para la hipotensión posterior a la anestesia espinal para la cesárea.
Métodos de búsqueda
Se hicieron búsquedas en el registro de ensayos del Grupo Cochrane de Embarazo y Parto (Cochrane Pregnancy and Childbirth's Trials Register) (9 agosto 2016) y en las listas de referencias de los estudios recuperados.
Criterios de selección
Ensayos controlados aleatorios (textos completos y resúmenes) que compararan intervenciones para prevenir la hipotensión con placebo u otro tratamiento alternativo en pacientes sometidas a anestesia espinal para la cesárea. Los estudios se excluyeron si la hipotensión no fue una medida de resultado.
Obtención y análisis de los datos
Dos autores de la revisión, de forma independiente, evaluaron la calidad de los estudios y extrajeron los datos de los estudios elegibles. Las tablas "Resumen de los hallazgos" se informan mediante GRADE.
Resultados principales
Se incluyeron 126 estudios con 9565 participantes. Las intervenciones se realizaron para prevenir la hipotensión materna posterior a la anestesia espinal solamente, y se excluyó cualquier intervención que considerara un tratamiento activo. Todos los estudios incluidos informaron el resultado primario de la revisión. En 49 comparaciones se identificaron tres grupos de intervención: líquidos intravenosos, intervenciones farmacológicas e intervenciones físicas. Los autores no informaron efectos adversos graves con ninguna de las intervenciones investigadas. La mayoría de los ensayos informaron hipotensión que requiera intervención y puntuación de Apgar menor de 8 a los cinco minutos como los únicos resultados. Ninguno de los ensayos incluidos en las comparaciones que se describen informó el ingreso a la unidad de cuidados intensivos neonatales.
Cristaloide versus control (ningún líquido)
Menos pacientes presentaron hipotensión en el grupo de cristaloide en comparación con ningún líquido (cociente de riesgos promedio [CR] 0,84; intervalo de confianza [IC] del 95%: 0,72 a 0,98; 370 pacientes; cinco estudios; evidencia de baja calidad). No hubo diferencias claras entre los grupos en el número de pacientes con náuseas y vómitos (CR promedio 0,19; IC del 95%: 0,01 a 3,91; un estudio; 69 pacientes; evidencia de muy baja calidad). Ningún recién nacido tuvo una puntuación de Apgar menor de 8 a los cinco minutos en ninguno de los grupos (60 recién nacidos; evidencia de baja calidad).
Coloide versus cristaloide
Menos pacientes presentaron hipotensión en el grupo de coloide en comparación con el grupo de cristaloide (CR promedio 0,68; IC del 95%: 0,58 a 0,80; 2105 pacientes; 28 estudios; evidencia de muy baja calidad). No hubo diferencias claras entre los grupos en la hipertensión materna que requiera intervención (CR promedio 0,64; IC del 95%: 0,09 a 4,46; tres estudios, 327 evidencia de muy baja calidad), la bradicardia materna que requiera intervención (CR promedio 0,99; IC del 95%: 0,55 a 1,79; seis estudios, 509 mujeres; evidencia de muy baja calidad), las náuseas y los vómitos (CR promedio 0,83; IC del 95%: 0,61 a 1,13; 15 estudios, 1154 mujeres, I² = 37%; evidencia de muy baja calidad), la acidosis neonatal (CR promedio 0,83; IC del 95%: 0,15 a 4,52; seis estudios, 678 recién nacidos; evidencia de muy baja calidad) ni la puntuación de Apgar menor de 8 a los cinco minutos (CR promedio 0,24; IC del 95%: 0,03 a 2,05; 11 estudios, 826 recién nacidos; evidencia de muy baja calidad).
Efedrina versus fenilefrina
No hubo diferencias claras entre los grupos de efedrina y fenilefrina en la prevención de la hipotensión materna (CR promedio 0,92; IC del 95%: 0,71 a 1,18; 401 pacientes; ocho estudios; evidencia de muy baja calidad) ni en la hipertensión (CR promedio 1,72; IC del 95%: 0,71 a 4,16; dos estudios, 118 mujeres, evidencia de baja calidad). Las tasas de bradicardia fueron menores en el grupo de efedrina (CR promedio 0,37; IC del 95%: 0,21 a 0,64; cinco estudios, 304 mujeres, evidencia de baja calidad). No hubo diferencias claras en el número de pacientes con náuseas o vómitos (CR promedio 0,76; IC del 95%: 0,39 a 1,49; cuatro estudios, 204 pacientes, I² = 37%, evidencia de muy baja calidad) ni en los recién nacidos con acidosis neonatal (CR promedio 0,89; IC del 95%: 0,07 a 12,00; tres estudios, 175 recién nacidos, evidencia de baja calidad). Ningún recién nacido tuvo una puntuación de Apgar menor de 8 a los cinco minutos en alguno de los grupos (321 recién nacidos; evidencia de baja calidad).
Ondansetrón versus control
La administración de ondansetrón fue más efectiva que el control (solución salina placebo) para prevenir la hipotensión que requiera tratamiento (CR promedio 0,67; IC del 95%: 0,54 a 0,83; 740 mujeres, ocho estudios, evidencia de baja calidad), la bradicardia que requiera tratamiento (CR promedio 0,49; IC del 95%: 0,28 a 0,87; 740 pacientes, ocho estudios, evidencia de baja calidad), y las náuseas o los vómitos (CR promedio 0,35; IC del 95%: 0,24 a 0,51; 653 mujeres, siete estudios, evidencia de baja calidad). No hubo diferencias claras entre los grupos en las tasas de acidosis neonatal (CR promedio 0,48; IC del 95%: 0,05 a 5,09; 134 recién nacidos; dos estudios, evidencia de baja calidad) ni en las puntuaciones de Apgar menores de 8 a los cinco minutos (284 recién nacidos, evidencia de baja calidad).
Compresión de miembros inferiores versus control
La compresión de miembros inferiores fue más efectiva que el control para prevenir la hipotensión (CR promedio 0,61; IC del 95%: 0,47 a 0,78; 11 estudios, 705 mujeres, I² = 65%, evidencia de muy baja calidad). No hubo diferencias claras entre los grupos en las tasas de bradicardia (CR 0,63; IC del 95%: 0,11 a 3,56; un estudio, 74 pacientes, evidencia de muy baja calidad) ni en las náuseas y los vómitos (CR promedio 0,42,IC del 95%: 0,14 a 1,27; cuatro estudios, 276 mujeres, I² = 32%, evidencia de muy baja calidad). Ningún recién nacido tuvo una puntuación de Apgar menor de 8 a los cinco minutos en alguno de los grupos (130 recién nacidos, evidencia de muy baja calidad).
Deambular versus permanecer acostada
No hubo diferencias claras entre los grupos en las pacientes con hipotensión que requiera tratamiento (CR 0,71; IC del 95%: 0,41 a 1,21; un estudio, 37 mujeres, evidencia de muy baja calidad).
Muchos estudios incluidos brindaron poca o ninguna información que permitiera una evaluación del riesgo de sesgo, lo que limita la capacidad para establecer conclusiones significativas. Las evaluaciones GRADE de la calidad de la evidencia variaron de muy baja a baja. La calidad de la evidencia se disminuyó por limitaciones en el diseño de los estudios, imprecisión e indireccionalidad; la mayoría de los estudios solamente evaluaron a pacientes programadas para cesárea electiva.
La validez externa también necesita consideración. Los lectores deben cuestionar la administración de coloides en este contexto debido a los posibles efectos secundarios graves como las alergias y la insuficiencia renal asociadas con su administración.
Conclusiones de los autores
Aunque las intervenciones como los cristaloides, los coloides, la efedrina, la fenilefrina, el ondansetrón o la compresión de las piernas pueden reducir la incidencia de hipotensión, ninguna ha demostrado evitar la necesidad de tratar la hipotensión materna en algunas pacientes. No se pueden establecer conclusiones con respecto a efectos adversos poco frecuentes asociados con el uso de las intervenciones (por ejemplo, coloides) debido al número relativamente pequeño de pacientes estudiadas.
PICOs
Resumen en términos sencillos
Técnicas para prevenir la disminución de la presión arterial durante la anestesia espinal para la cesárea
¿Cuál es el problema?
La anestesia espinal es una técnica utilizada habitualmente para el parto por cesárea porque la madre puede estar despierta durante el parto y generalmente sigue siendo cómoda posteriormente. Además, la técnica evita los riesgos de la anestesia general. El efecto adverso más frecuente de la anestesia espinal es una disminución de la presión arterial (hipotensión).
Este estudio examina la evidencia para prevenir la hipotensión posterior a la anestesia espinal para el parto por cesárea.
¿Por qué es esto importante?
La hipotensión posterior a la anestesia espinal para el parto por cesárea ocurre con frecuencia. Cuando ocurre, la madre puede sentirse débil o con náuseas y puede vomitar. Si su presión arterial disminuye en exceso, la madre corre riesgos graves (como pérdida de la conciencia), y también el feto (como falta de oxígeno y daño cerebral). La hipotensión se puede prevenir al administrar líquidos intravenosos, administrar fármacos (como efedrina, fenilefrina y ondansetrón), mediante la compresión de las piernas, o al hacer que la madre se acueste o camine antes de la anestesia espinal.
¿Qué evidencia se encontró?
Se buscó la evidencia en agosto 2016 y se encontró un total de 126 estudios con 9565 mujeres. Los estudios incluidos investigaron 49 comparaciones diferentes que se dividieron en tres grupos: tratamiento con líquidos intravenosos, fármacos y métodos físicos. Aquí se describen los resultados de las seis comparaciones principales (cristaloide versus control; coloide versus cristaloide; efedrina versus fenilefrina; ondansetrón versus control; compresión de las piernas versus control; caminar versus permanecer acostada).
Tratamiento con líquidos (cristaloide versus control; coloide versus cristaloide)
No está claro si los cristaloides previenen la hipotensión porque la calidad de la evidencia es muy baja. Administrar coloides en lugar de cristaloides puede significar que menos pacientes presenten hipotensión después de ser sometidas a anestesia espinal.
No fue posible asegurarlo debido a la evidencia de calidad muy baja con respecto a si los cristaloides o los coloides son mejores para prevenir la frecuencia cardíaca baja materna (bradicardia), la hipertensión, las náuseas y los vómitos, la acidosis neonatal o las puntuaciones de Apgar bajas. Si las pacientes recibieron cristaloides o ningún líquido no afectó el número de pacientes que presentaron náuseas o vómitos.
Fármacos (efedrina versus fenilefrina; ondansetrón versus control)
Se observaron tasas inferiores de bradicardia en las pacientes que recibieron efedrina versus fenilefrina, y con ondansetrón versus ningún ondansetrón, pero la evidencia es de baja calidad. El ondansetrón puede prevenir la hipotensión y las náuseas/vómitos, pero se asocia con poca o ninguna diferencia en la acidosis neonatal o las puntuaciones de Apgar. Hubo poca diferencia entre la efedrina y la fenilefrina en la hipertensión baja o alta, las náuseas y los vómitos, la acidosis neonatal o las puntuaciones de Apgar. No fue posible estar seguros sobre estos resultados debido a la calidad baja o muy baja de la evidencia.
Métodos físicos (compresión de las piernas versus control; caminar versus permanecer acostada)
No está claro si la compresión de las piernas reduce el número de pacientes con hipotensión en comparación con ninguna compresión de las piernas porque la calidad de la evidencia es muy baja. De manera similar, no fue posible asegurar si la compresión de las piernas logró algún cambio en las pacientes que presentaban bradicardia o náuseas y vómitos, ni en las puntuaciones de Apgar de los recién nacidos. Tampoco está claro si caminar o permanecer acostada antes de la anestesia espinal reduce la hipotensión.
¿Qué significa esto?
No se encontró un método que prevenga completamente la hipotensión en las pacientes sometidas a anestesia espinal durante el parto por cesárea. La administración de líquidos intravenosos o ciertos fármacos y la compresión de las piernas con vendas, medias o dispositivos inflables pueden reducir la incidencia de hipotensión. Sin embargo, se encontró que la calidad de la evidencia fue baja o muy baja, por lo que aún se necesitan estudios grandes de alta calidad que utilicen estas intervenciones clínicamente relevantes solas o en combinación.
Los estudios de investigación futuros en este contexto se podrían centrar en las combinaciones de estas estrategias efectivas o en nuevas estrategias innovadoras.
Conclusiones de los autores
Summary of findings
| Techniques for preventing hypotension during spinal anaesthesia for caesarean section | |||||
| Patient or population: women having spinal anaesthesia for caesarean section Setting: hospital (inpatient) Outcome: maternal hypotension requiring intervention | |||||
| Comparisons | Anticipated absolute effects* (95% CI) | Relative effect | № of participants | Quality of the evidence | |
| Risk with control | Risk with Intervention | ||||
| Crystalloid vs control | Control | Crystalloid | average RR 0.84 | 370 | ⊕⊕⊝⊝ |
| 535 per 1000 | 449 per 1000 | ||||
| Colloid vs crystalloid | Crystalloid | Colloid | average RR 0.68 (0.58 to 0.80) | 2105 | ⊕⊝⊝⊝ |
| 586 per 1000 | 398 per 1000 | ||||
| Ephedrine vs phenylephrine | Phenylephrine | Ephedrine | average RR 0.92 | 401 | ⊕⊝⊝⊝ |
| 465 per 1000 | 428 per 1000 | ||||
| Ondansetron vs control | Control | Ondansetron | average RR 0.67 | 740 | ⊕⊕⊝⊝ |
| 579 per 1000 | 388 per 1000 | ||||
| Lower limb compression vs control | Control | Lower limb compression | average RR 0.61 | 705 | ⊕⊝⊝⊝ |
| 663 per 1000 | 404 per 1000 | ||||
| Walking vs lying | Lying | Walking | RR 0.71 (0.41 to 1.21) | 37 (1 RCT) | ⊕⊝⊝⊝ Very lowf,g |
| 706 per 1000 | 501 per 1000 | ||||
| *The risk in the intervention group (and its 95% confidence interval) is based on the assumed risk in the comparison group and the relative effect of the intervention (and its 95% CI). | |||||
| GRADE Working Group grades of evidence | |||||
| aInclusion criteria not representative of wider population (e.g. only elective caesarean sections) (−1). | |||||
| Crystalloid versus control for preventing hypotension during spinal anaesthesia for caesarean section | |||||
| Patient or population: women having spinal anaesthesia for caesarean section | |||||
| Outcomes | Anticipated absolute effects* (95% CI) | Relative effect | № of participants | Quality of the evidence | |
| Risk with control | Risk with crystalloid | ||||
| Maternal hypotension requiring intervention | Study population | RR 0.84 | 370 | ⊕⊕⊝⊝ | |
| 535 per 1000 | 449 per 1000 | ||||
| Maternal hypertension requiring intervention | No studies reported this outcome. | ||||
| Maternal bradycardia requiring intervention | No studies reported this outcome. | ||||
| Maternal nausea and/or vomiting | Study population | RR 0.19 (0.01 to 3.91) | 69 (1 RCT) | ⊕⊝⊝⊝ Very lowa,c | |
| 59 per 1000 | 11 per 1000 (1 to 230) | ||||
| Neonatal acidosis as defined by cord or neonatal blood with a pH < 7.2 | No studies reported this outcome. | ||||
| Neonatal Apgar score < 8 at 5 minutes | Study population | Not estimable | 60 | ⊕⊕⊝⊝ | |
| 0 per 1000 | 0 per 1000 | ||||
| Admission to neonatal intensive care unit | No studies reported this outcome. | ||||
| *The risk in the intervention group (and its 95% confidence interval) is based on the assumed risk in the comparison group and the relative effect of the intervention (and its 95% CI). | |||||
| GRADE Working Group grades of evidence High quality: we are very confident that the true effect lies close to that of the estimate of the effect. | |||||
| aOnly elective caesarean sections included (−1). | |||||
| Colloid versus crystalloid for preventing hypotension during spinal anaesthesia for caesarean section | |||||
| Patient or population: women having spinal anaesthesia for caesarean section | |||||
| Outcomes | Anticipated absolute effects* (95% CI) | Relative effect | № of participants | Quality of the evidence | |
| Risk with crystalloid | Risk with colloid | ||||
| Maternal hypotension requiring intervention | Study population | RR 0.68 (0.58 to 0.80) | 2105 | ⊕⊝⊝⊝ | |
| 586 per 1000 | 398 per 1000 | ||||
| Maternal hypertension requiring intervention | Study population | RR 0.64 | 327 | ⊕⊝⊝⊝ | |
| 55 per 1000 | 35 per 1000 | ||||
| Maternal bradycardia requiring intervention | Study population | RR 0.99 | 509 | ⊕⊝⊝⊝ | |
| 76 per 1000 | 75 per 1000 | ||||
| Maternal nausea and/or vomiting | Study population | RR 0.83 | 1154 | ⊕⊝⊝⊝ | |
| 228 per 1000 | 189 per 1000 | ||||
| Neonatal acidosis as defined by cord or neonatal blood with a pH < 7.2 | Study population | RR 0.83 | 678 | ⊕⊝⊝⊝ | |
| 26 per 1000 | 21 per 1000 | ||||
| Neonatal Apgar score < 8 at 5 minutes | Study population | RR 0.24 | 826 | ⊕⊝⊝⊝ | |
| 10 per 1000 | 2 per 1000 | ||||
| Admission to neonatal intensive care unit | No studies reported this outcome. | ||||
| *The risk in the intervention group (and its 95% confidence interval) is based on the assumed risk in the comparison group and the relative effect of the intervention (and its 95% CI). | |||||
| GRADE Working Group grades of evidence High quality: we are very confident that the true effect lies close to that of the estimate of the effect. | |||||
| aDowngraded one level for serious risk of bias (due to unclear risk of selection bias in most included studies) (−1). | |||||
| Ephedrine versus phenylephrine for preventing hypotension during spinal anaesthesia for caesarean section | ||||||
| Patient or population: women having spinal anaesthesia for caesarean section | ||||||
| Outcomes | Anticipated absolute effects* (95% CI) | Relative effect | № of participants | Quality of the evidence | Comments | |
| Risk with phenylephrine | Risk with ephedrine | |||||
| Maternal hypotension requiring intervention | Study population | RR 0.92 | 401 | ⊕⊝⊝⊝ | — | |
| 465 per 1000 | 428 per 1000 | |||||
| Maternal hypertension requiring intervention | Study population | RR 1.72 | 118 | ⊕⊕⊝⊝ | — | |
| 113 per 1000 | 194 per 1000 | |||||
| Maternal bradycardia requiring intervention | Study population | RR 0.37 | 304 | ⊕⊕⊝⊝ | — | |
| 243 per 1000 | 90 per 1000 | |||||
| Maternal nausea and/or vomiting | Study population | RR 0.76 | 204 | ⊕⊝⊝⊝ | — | |
| 216 per 1000 | 164 per 1000 | |||||
| Neonatal acidosis as defined by cord or neonatal blood with a pH < 7.2 | Study population | RR 0.89 | 175 | ⊕⊕⊝⊝ | — | |
| 11 per 1000 | 10 per 1000 | |||||
| Neonatal Apgar score < 8 at 5 minutes | Study population | Not estimable | 321 | ⊕⊕⊝⊝ | No events observed in any studies. Relative effect could not be estimated. | |
| Not pooled | Not pooled | |||||
| Admission to neonatal intensive care unit | No studies reported this outcome. | |||||
| *The risk in the intervention group (and its 95% confidence interval) is based on the assumed risk in the comparison group and the relative effect of the intervention (and its 95% CI). | ||||||
| GRADE Working Group grades of evidence High quality: we are very confident that the true effect lies close to that of the estimate of the effect. | ||||||
| aSubstantial heterogeneity (−1). | ||||||
| Ondansetron versus saline placebo for preventing hypotension during spinal anaesthesia for caesarean section | |||||
| Patient or population: women having spinal anaesthesia for caesarean section | |||||
| Outcomes | Anticipated absolute effects* (95% CI) | Relative effect | № of participants | Quality of the evidence | |
| Risk with control | Risk with ondansetron | ||||
| Maternal hypotension requiring intervention | Study population | RR 0.67 | 740 | ⊕⊕⊝⊝ | |
| 579 per 1000 | 388 per 1000 | ||||
| Maternal hypertension requiring intervention | No studies reported this outcome. | ||||
| Maternal bradycardia requiring intervention | Study population | RR 0.49 | 740 | ⊕⊕⊝⊝ | |
| 100 per 1000 | 49 per 1000 | ||||
| Maternal nausea and/or vomiting | Study population | RR 0.35 | 653 | ⊕⊕⊝⊝ | |
| 296 per 1000 | 103 per 1000 | ||||
| Neonatal Apgar score < 8 at 5 minutes | Study population | Not estimable | 284 | ⊕⊕⊝⊝ | |
| Not pooled | Not pooled | ||||
| Neonatal acidosis as defined by cord or neonatal blood with a pH < 7.2 | Study population | RR 0.48 | 134 | ⊕⊕⊝⊝ | |
| 30 per 1000 | 15 per 1000 | ||||
| Admission to neonatal care unit | No studies reported this outcome. | ||||
| *The risk in the intervention group (and its 95% confidence interval) is based on the assumed risk in the comparison group and the relative effect of the intervention (and its 95% CI). | |||||
| GRADE Working Group grades of evidence High quality: we are very confident that the true effect lies close to that of the estimate of the effect. | |||||
| a Inclusion criteria not representative of wider population (e.g. elective caesarean section only) (−1). | |||||
| Leg compression versus control for preventing hypotension during spinal anaesthesia for caesarean section | ||||||
| Patient or population: women having spinal anaesthesia for caesarean section | ||||||
| Outcomes | Anticipated absolute effects* (95% CI) | Relative effect | № of participants | Quality of the evidence | Comments | |
| Risk with control | Risk with lower limb compression | |||||
| Maternal hypotension requiring intervention | Study population | RR 0.61 | 705 | ⊕⊝⊝⊝ | — | |
| 663 per 1000 | 404 per 1000 | |||||
| Maternal hypertension requiring intervention | No studies reported this outcome. | |||||
| Maternal bradycardia requiring intervention | Study population | RR 0.63 (0.11 to 3.56) | 74 (1 RCTs) | ⊕⊝⊝⊝ | — | |
| 83 per 1000 | 53 per 1000 (9 to 297) | |||||
| Maternal nausea and/or vomiting | Study population | RR 0.42 | 276 | ⊕⊝⊝⊝ | — | |
| 162 per 1000 | 68 per 1000 | |||||
| Neonatal acidosis as defined by cord or neonatal blood with a pH < 7.2 | No studies reported this outcome. | |||||
| Neonatal Apgar score < 8 at 5 minutes | Study population | Not estimable | 130 | ⊕⊝⊝⊝ | No events observed in any studies. Relative effect could not be estimated. | |
| Not pooled | Not pooled | |||||
| Admission to neonatal intensive care unit | No studies reported this outcome. | |||||
| *The risk in the intervention group (and its 95% confidence interval) is based on the assumed risk in the comparison group and the relative effect of the intervention (and its 95% CI). | ||||||
| GRADE Working Group grades of evidence High quality: we are very confident that the true effect lies close to that of the estimate of the effect. | ||||||
| aDowngraded one level for serious risk of bias (due to unclear risk of selection bias in the majority of included studies (−1). | ||||||
| Walking versus lying for reducing risk of maternal hypotension during spinal anaesthesia for caesarean section | |||||
| Patient or population: women having spinal anaesthesia for caesarean section | |||||
| Outcomes | Anticipated absolute effects* (95% CI) | Relative effect | № of participants | Quality of the evidence | |
| Risk with lying | Risk with walking | ||||
| Maternal hypotension requiring intervention | Study population | RR 0.71 | 37 | ⊕⊝⊝⊝ | |
| 706 per 1000 | 501 per 1000 | ||||
| Maternal hypertension requiring intervention | No studies reported this outcome. | ||||
| Maternal bradycardia requiring intervention | No studies reported this outcome. | ||||
| Maternal nausea and/or vomiting | No studies reported this outcome. | ||||
| Neonatal acidosis as defined by cord or neonatal blood with a pH < 7.2 | No studies reported this outcome. | ||||
| Neonal Apgar score < 8 at 5 minutes | No studies reported this outcome. | ||||
| Admission to neonatal intensive care unit | No studies reported this outcome. | ||||
| *The risk in the intervention group (and its 95% confidence interval) is based on the assumed risk in the comparison group and the relative effect of the intervention (and its 95% CI). | |||||
| GRADE Working Group grades of evidence | |||||
| aParticipants and anaesthetists not blinded in 1 study with 100% weight in analysis (−1). | |||||
Antecedentes
La elección de la anestesia para la cesárea se basa en el equilibrio entre la preferencia de la paciente y los riesgos y beneficios de una técnica particular para la madre y para el niño (Glosten 2000).
La mortalidad materna relacionada con la anestesia ocurre con mayor frecuencia cuando se utiliza la anestesia general para el parto por cesárea (Hawkins 1997; Hibbard 1996; Rasmussen 1994). Otros riesgos de la anestesia general incluyen: intubación endotraqueal fallida, ventilación fallida, neumonía por aspiración, trauma dental, náuseas y vómitos posoperatorios, lactancia retardada y sedación del neonato (Atlee 1999; Reisner 1999). Las técnicas regionales como la anestesia epidural o espinal evitan dichos riegos, permiten a la madre estar despierta en el parto y pueden reducir la necesidad de administración posoperatoria de opiáceos sistémicos. La analgesia epidural durante el trabajo de parto se puede extender para proporcionar anestesia quirúrgica si fuera necesaria la operación cesárea (Lucas 1999). Sin embargo, la técnica de anestesia espinal tiene la ventaja de ser simple, de inicio rápido, con un bajo índice de fallo, utiliza una dosis mínima del fármaco y proporciona una excelente relajación muscular durante la cirugía (Glosten 2000). Esto hace que esta técnica anestésica sea la de elección tanto para el parto por cesárea electiva como de urgencia cuando no está colocado un catéter epidural funcional. De hecho, al menos el 40% de las pacientes a las que se les realiza una cesárea en los EE.UU. recibe anestesia espinal (Hawkins 1997), al igual que la mayoría de las pacientes a las que se les realiza una cesárea electiva en el Reino Unido (Husaini 1998; Shibli 2000).
Es necesaria una anestesia espinal hasta el nivel de T4 que cause un bloqueo adecuado para la cesárea (Glosten 2000; Ousley 2012; Russell 1995). En consecuencia, es casi inevitable que ocurra un bloqueo simpático completo y disminuya el retorno venoso al corazón, exacerbado por cierto grado de compresión de la vena cava inferior, lo que provoca hipotensión y disminución del gasto cardíaco (Rocke 1995). La hipotensión durante la anestesia espinal para el parto por cesárea electiva se presentan en hasta un 70% a un 80% de las pacientes que reciben profilaxis farmacológica (Mercier 2013).
A pesar de que todas las técnicas regionales se asocian con hipotensión materna, la aparición más lenta y la menor incidencia de esta complicación durante la anestesia epidural puede hacer que los fármacos profilácticos como la efedrina sean innecesarios (Glosten 2000; May 1995). Por otra parte, la ocurrencia frecuente y el comienzo rápido de la hipotensión durante la anestesia espinal han estimulado a los anestesistas a tratar de prevenir o disminuir los síntomas maternos asociados, como náuseas y vómitos y pérdida de la conciencia, al establecer el bloqueo. La reducción concomitante de la irrigación sanguínea uteroplacentaria asociada con la hipotensión materna tiene efectos nocivos, como la acidosis fetal (Roberts 1995; Robson 1992), y puede provocar reflejos de prensión y succión débiles en los neonatos (Hollmen 1978); que pueden comprometer gravemente el establecimiento de la lactancia materna posparto (May 1995).
Parece más probable que la prevención de la hipotensión por anestesia espinal disminuya la frecuencia y la gravedad de los síntomas maternos adversos asociados, en comparación con el tratamiento de la hipotensión establecida (Datta 1982; Husaini 1998; Kang 1982). Sorprende que algunas pacientes con preeclampsia sometidas a cesárea bajo anestesia espinal requieran una intervención para la hipotensión (Clark 2005; Sharwood‐Smith 1999), lo que hace que la profilaxis habitual sea probablemente innecesaria en este grupo particular de pacientes. De manera similar, las pacientes en trabajo de parto establecido que posteriormente reciben anestesia espinal no parecen verse afectadas por la hipotensión (Lapins 2001).
Descripción de la afección
La hipotensión materna es la complicación más frecuente de la anestesia espinal, con una incidencia de cerca del 100% (Glosten 2000; May 1995). De no tratarse, la hipotensión grave puede representar un riesgo importante para la madre (inconsciencia, aspiración pulmonar, apnea o incluso paro cardíaco) y para el feto (daño en la perfusión placentaria que provoca hipoxia, acidosis fetal y daño neurológico). Aunque existen algunas variaciones, la mayoría de los autores definen la hipotensión como una presión sanguínea sistólica materna por debajo del 70% al 80% de los registros iniciales o un valor absoluto < 90 mmHg a 100 mmHg, o ambos (Glosten 2000).
Descripción de la intervención
Actualmente los médicos utilizan varias estrategias que incluyen los líquidos intravenosos, los tratamientos farmacológicos y las intervenciones físicas para disminuir o prevenir la hipotensión. Estas estrategias pueden incluir una posición materna adecuada con el útero colocado lejos de la vena cava, la infusión de líquidos para aumentar el volumen sanguíneo efectivo y la administración de efedrina para la vasoconstricción de la circulación periférica y aumentar la frecuencia cardíaca (Glosten 2000). Otros profesionales sanitarios han administrado los agonistas alfa fenilefrina o metaraminol, que actúan principalmente mediante la vasoconstricción (Alahuhta 1992; Morgan 1994). Las intervenciones físicas como vendar las piernas también se han utilizado y pueden actuar al disminuir la retención venosa de sangre en las piernas (Van Bogaert 1998). El objetivo de estos métodos es mantener la presión arterial mediante el aumento del retorno venoso al corazón o de la resistencia de la circulación periférica, o ambos. Sin embargo, no se ha establecido una técnica ideal.
De qué manera podría funcionar la intervención
Los profesionales sanitarios pueden administrar líquidos intravenosos, que incluyen cristaloides y coloides, para aumentar el volumen sanguíneo materno, lo que da lugar a un aumento del retorno venoso, el volumen sistólico y la presión arterial. La administración de líquidos intravenosos antes de la anestesia espinal para la cesárea se acepta como la práctica estándar (Rout 1993b). La elección del líquido depende de la práctica individual e institucional, el costo material (el cristaloide es considerablemente más barato) y los beneficios y los riesgos relativos percibidos. Los efectos adversos poco frecuentes pero potencialmente graves de los coloides incluyen: reacciones anafilactoides (MIMS 1995), deterioro de la coagulación (Sharma 1999) y riesgo de infecciones, como la hepatitis C, a partir de los preparados de albúmina humana. Además, han surgido preocupaciones entre los autores con respecto a la transmisión previa de la encefalopatía espongiforme bovina a partir de preparaciones farmacéuticas derivadas de bovinos, como la gelatina Haemaccel (Wickham 1996).
Los vasopresores como el agonista alfa fenilefrina, causan vasoconstricción periférica y un aumento de la resistencia vascular sistémica. Posteriormente, este hecho da lugar a un aumento de la presión arterial. Los agonistas alfa y beta combinados como la efedrina también pueden prevenir la hipotensión al aumentar la frecuencia cardíaca y la resistencia vascular sistémica. Además, los agentes antimuscarínicos como el glicopirrolato pueden ser útiles al aumentar la frecuencia cardíaca, lo que da lugar a un aumento posterior de la presión arterial. Los posibles efectos adversos de los vasopresores incluyen anafilaxia, hipertensión y arritmias cardíacas (MIMS 1995). Además, existe la posibilidad de deterioro de la perfusión uteroplacentaria secundaria a la vasoconstricción (a pesar del mantenimiento o la recuperación de la presión arterial materna), con las consecuencias fetales o neonatales descritas anteriormente.
Las intervenciones físicas como vendar las piernas y los dispositivos de compresión de las pantorrillas pueden ser útiles al mejorar el retorno venoso, por lo que pueden mejorar la presión arterial. Sin embargo, estas técnicas también pueden tener efectos no intencionales como isquemia localizada, lesión nerviosa o molestias maternas inadmisibles.
Por qué es importante realizar esta revisión
La mayoría de las pacientes presentarán hipotensión después de la anestesia espinal para la cesárea si no reciben una intervención preventiva. No hay una intervención ideal ampliamente aceptada y basada en la evidencia para prevenir la hipotensión materna asociada con la anestesia espinal.
Objetivos
Evaluar los efectos de las intervenciones profilácticas para la hipotensión posterior a la anestesia espinal para la cesárea.
Métodos
Criterios de inclusión de estudios para esta revisión
Tipos de estudios
Todos los ensayos controlados aleatorios publicados o no que compararan el uso de una intervención para prevenir la hipotensión con placebo u otro tratamiento alternativo, en pacientes sometidas a anestesia espinal para la cesárea. En esta actualización de la revisión no se incluyeron ensayos cuasialeatorios, grupales ni cruzados (crossover), lo que es una diferencia con el protocolo de la versión original. Los resúmenes se incluyeron si brindaron información suficiente para permitir una evaluación adecuada de la metodología y el riesgo de sesgo.
Los estudios se excluyeron si la hipotensión no era una medida de resultado o no se definía claramente antes de administrar un tratamiento de rescate.
Tipos de participantes
Pacientes sometidas a anestesia espinal para una cesárea.
Tipos de intervenciones
Líquidos intravenosos
-
Coloides
-
Cristaloides
Fármacos
-
Simpaticomiméticos: efedrina, metaraminol, fenilefrina
-
Otros fármacos utilizados para prevenir la hipotensión, por ejemplo, el ondansetrón
Métodos físicos
-
Bandas compresivas en la pierna
-
Medias compresivas
-
Otras maniobras
No se hicieron comparaciones entre diferentes técnicas anestésicas porque esta pregunta de la revisión se refiere a las técnicas preventivas en el contexto de los métodos anestésicos estandarizados. Se excluyeron los estudios en los que las pacientes recibieron anestesia espinal‐epidural combinada o anestesia epidural.
Tipos de medida de resultado
Resultados primarios
La incidencia de hipotensión materna que requiera intervención farmacológica (después de la inyección intratecal y antes del parto), cuando la hipotensión fue una disminución verdadera de la presión arterial sistólica o media, como lo definieron y midieron los autores de los estudios incluidos (Tabla 1).
Los estudios se excluyeron si la hipotensión no era una medida de resultado o no se definía claramente antes de administrar un tratamiento de rescate.
Resultados secundarios
Se consideró cualquier resultado materno o neonatal que pudiera reflejar una consecuencia de la intervención.
Maternas
-
Hipertensión que requiera intervención
-
Arritmia cardíaca definida como cualquier ritmo que requiera intervención (p.ej. bradicardia, taquicardia)
-
Náuseas, vómitos
-
Anafilaxia
-
Alteración de la conciencia, mareos
Neonatales
-
Acidosis definida mediante sangre del cordón o neonatal con un pH menor de 7,2
-
Puntuaciones de Apgar menores de 7 u 8 a los cinco minutos
-
Ingreso a la unidad de cuidados intensivos neonatales
Los estudios incluidos rara vez informaron sobre estos resultados secundarios.
Results
Description of studies
For details of included and excluded studies, see Characteristics of included studies and Characteristics of excluded studies tables. Studies took place in Europe, North America, India, and the Middle East.
Results of the search
We assessed 380 studies in total. Our review includes 126 studies involving 9565 women. We excluded 228 studies; 13 of these were included in Cyna 2006, but we excluded them from this updated version due to a change in the inclusion criteria (see below for reasons). There are 25 studies awaiting further classification and 1 ongoing study.
Included studies
Interventions
We grouped the 126 included trials into three main categories of interventions.
Administration of fluids
-
Crystalloid versus control (Idehen 2014; Imam 2012; King 1998; Morgan 2000; Ouerghi 2010)
-
Different regimens of crystalloids (Alimian 2014; Dyer 2004; Farid 2016; Faydaci 2011; Jacob 2012; Jorgensen 2000; Khan 2013; Muzlifah 2009; Oh 2014; Rout 1992; Tercanli 2005; Wilson 1999)
-
Colloids versus crystalloids (Alimian 2014; Arora 2015; Bottiger 2010; Bouchnak 2012; Cardoso 2004a; Dahlgren 2005; Dahlgren 2007; El‐Mekawy 2012; Embu 2011; French 1999; Gunaydin 2009; Hasan 2012; Jabalameli 2011; Karinen 1995; Lin 1999; Madi‐Jebara 2008; Mercier 2014; Mitra 2014; Ozkan 2004; Perumal 2004; Romdhani 2014; Selvan 2004; Siddik 2000; Singh 2009; Ueyama 1999; Unlugenc 2015; Upadya 2016; Yorozu 2002)
-
Different regimens of colloids (Arora 2015; Carvalho 2009; Davies 2006; Nishikawa 2007; Selvan 2004; Siddik‐Sayyid 2009; Ueyama 1999)
-
Colloid versus control (Hasan 2012; Mathru 1980; Nishikawa 2007; Riley 1995; Tawfik 2014)
-
Colloid plus crystalloid versus another colloid or crystalloid (Marciniak 2015; Mathru 1980)
Drugs
-
Ephedrine versus control (Carvalho 1999a; Carvalho 1999b; Carvalho 2000; Damevski 2011; Gomaa 2003; Grubb 2004; Hall 1994; Imam 2012; King 1998; Loughrey 2002; Mathru 1980; Morgan 2000; Moslemi 2015; Ngan Kee 2000; Olsen 1994; Ozkan 2004; Ramin 1994; Singh 2016; Torres unpub; Tsen 2000; Turkoz 2002; Ueyama 1992; Webb 1998)
-
Ephedrine versus crystalloids (Carvalho 2000; Chan 1997; Damevski 2011; El‐Mekawy 2012; Imam 2012; Jabalameli 2011; King 1998; Kundra 2008; Morgan 2000)
-
Ephedrine plus crystalloid versus colloid (Ozkan 2004)
-
Ephedrine plus colloid versus crystalloid (Ozkan 2004)
-
Ephedrine versus phenylephrine (Alahuhta 1992; Bhardwaj 2013; Gomaa 2003; Hall 1994; Magalhaes 2009; Moslemi 2015; Nazir 2012; Ueyama 2002)
-
Ephedrine versus angiotensin (Ramin 1994)
-
Different regimens of ephedrine (Carvalho 1999a; Carvalho 1999b; Carvalho 2000; Chohedri 2007; Hall 1994; King 1998; Loughrey 2002; Morgan 2000; Ngan Kee 2000; Ozkan 2004; Pouliou 2006)
-
Ephedrine versus colloid (El‐Mekawy 2012; Jabalameli 2011)
-
Ephedrine versus metaraminol (Bhardwaj 2013)
-
Phenylephrine versus control (Gomaa 2003; Kuhn 2016; Loughrey 2005; Moslemi 2015; Ngan Kee 2004a)
-
Different regimens of phenylephrine (Doherty 2012)
-
Phenylephrine versus mephentermine (Mohta 2010)
-
Phenylephrine versus metaraminol (Bhardwaj 2013)
-
Phenylephrine plus crystalloid different regimens (Ansari 2011)
-
Phenyleprine versus leg compression (Kuhn 2016)
-
Glycopyrrolate versus control (Ngan Kee 2013a; Ure 1999)
-
Ondansetron versus control (Marciniak 2015; Nivatpumin 2016; Ortiz‐Gomez 2014; Sahoo 2012; Terkawi 2015; Trabelsi 2015; Wang 2014a; Wang 2014b)
-
Ondansetron versus ephedrine (Nivatpumin 2016)
-
Granisetron versus control (Eldaba 2015)
-
Ketamine versus saline (Gulhas 2012)
-
Angiotension versus control (Ramin 1994)
-
Dopamine versus control (Yokoyama 1997)
Physical methods
-
Lower limb compression versus control (Adsumelli 2003; Bhagwanjee 1990; James 1973; Jorgensen 1996; Kohli 2013; Kuhn 2016; Rout 1993a; Singh 2014; Sood 1996; Sujata 2012; Sutherland 2001)
-
Wedge versus supine (Calvache 2011)
-
Head‐up tilt versus horizontal (Loke 2002)
-
Head‐down tilt versus horizontal (Miyabe 1997)
-
Crawford's wedge versus manual uterine displacement (Amaro 1998)
-
Supine versus sitting (Kohler 2002)
-
Walking versus lying (Cyna 2010)
-
Lateral versus supine wedged position (Hartley 2001; Hwang 2012)
-
Left lateral versus left lateral tilt (Rees 2002)
-
Left lateral tilt versus left manual uterine displacement (Kundra 2007)
-
Leg elevation versus control (Rout 1993a)
-
Acupressure versus placebo (Stein 1997)
-
Acupressure versus metoclopramide (Stein 1997)
Furthermore, we chose to focus on six key comparisons (crystalloid versus control, colloid versus crystalloid, ephedrine versus phenylephrine, ondansetron versus control, lower limb compression versus control, walking versus lying) in the summary of findings Table for the main comparison, as we felt these represented the most important clinical comparisons.
Methods and techniques
Although definitions of hypotension in the included studies varied, most fell within the generally accepted range. Table 1 presents details (where trials did not specify systolic or mean arterial pressure, we assumed the definition to be systolic).
Participants
All but one of the included trials assessed women having (or probably having) elective caesarean sections. In Ueyama 1992, 40 women in labour were scheduled for emergency caesareans and 60 women not in labour were scheduled for elective caesareans.
Reviewed interventions were not necessarily applied prior to spinal injection. Clinicians administered pharmacological interventions prior or immediately after spinal injection, before onset of hypotension.
Excluded studies
Please see Characteristics of excluded studies.
We excluded 228 studies for the following reasons.
-
Women received combined spinal epidural anaesthesia.
-
Women received epidural anaesthesia.
-
Trials did not report incidence of hypotension requiring intervention.
-
Researchers did not investigate prevention of hypotension due to spinal anaesthesia (including studies investigating treatment of hypotension or prevention of oxytocin‐induced hypotension)
-
Authors reporting of data was inadequate for analysis (for example, the number of women in each study group).
-
Anaesthetic regimen differed between study groups.
-
Not a prospective randomised study.
-
Quasi‐randomised study.
-
Unclear definition of hypotension.
-
Study compared prevention of hypotension to treatment of hypotension.
We excluded 13 studies from the original 2006 review for the following reasons (Cyna 2006).
-
Combined spinal‐epidural (Mendonca 2003; Rucklidge 2002; Rucklidge 2005; Russell 2002; Vercauteren 2000; Yun 1998; Yentis 2000).
-
Number of women allocated to each study group not reported (Miller 2000).
-
Incidence of hypotension not reported (Van Bogaert 1998).
-
Quasi‐randomised (Rout 1993b).
-
Intervention was to treat, not prevent, hypotension (Cooper 2007; Yadav 2012; Young 1996).
Risk of bias in included studies
Please see Figure 1 and Figure 2 for a summary of 'Risk of bias' assessments.

Risk of bias graph: review authors' judgements about each risk of bias item presented as percentages across all included studies.

Risk of bias summary: review authors' judgements about each risk of bias item for each included study.
Allocation
Fifty‐two studies reported adequate randomisation sequence generation, so we considered them to be at low risk of selection bias (Alimian 2014; Allen 2010; Arora 2015; Bhardwaj 2013; Bottiger 2010; Calvache 2011; Cardoso 2004a; Carvalho 2009; Cyna 2010; Dahlgren 2007; Das Neves 2010; Doherty 2012; Eldaba 2015; Faydaci 2011; Gulhas 2012; Gunusen 2010; Hwang 2012; Idehen 2014; Jabalameli 2011; Jacob 2012; Jorgensen 1996; Jorgensen 2000; Kohler 2002; Kuhn 2016; Kundra 2007; Loughrey 2002; Magalhaes 2009; Marciniak 2015; Mercier 2014; Mitra 2014; Moslemi 2015; Muzlifah 2009; Ngan Kee 2004a; Ngan Kee 2013a; Nishikawa 2007; Nivatpumin 2016; Oh 2014; Ortiz‐Gomez 2014; Rees 2002; Romdhani 2014; Sahoo 2012; Siddik‐Sayyid 2009; Singh 2016; Tawfik 2014; Terkawi 2015; Torres unpub; Trabelsi 2015; Ueyama 1999; Unlugenc 2015; Wang 2014a; Wang 2014b; Wilson 1999). The remaining 74 studies reported that the study was randomised; however, authors did not report the method of random sequence generation.
Only 22 studies contained a description of adequate allocation concealment (Bhardwaj 2013; Cyna 2010; Faydaci 2011; French 1999; Hasan 2012; Hwang 2012; King 1998; Kohler 2002; Kuhn 2016; Loughrey 2002; Magalhaes 2009; Marciniak 2015; Ngan Kee 2000; Ngan Kee 2004a; Ngan Kee 2013a; Nivatpumin 2016; Ortiz‐Gomez 2014; Tawfik 2014; Tercanli 2005; Trabelsi 2015; Unlugenc 2015; Wang 2014b), mostly of opaque, sealed envelopes. One hundred and three studies did not report whether allocation was concealed or not, while one study did not conceal allocation at all (Ueyama 1999).
The Characteristics of included studies table includes details of the randomisation and allocation concealment processes.
Blinding
Participants and anaesthetists were blinded in 54 studies (Adsumelli 2003; Alahuhta 1992; Allen 2010; Ansari 2011; Bhardwaj 2013; Dahlgren 2005; Dahlgren 2007; Davies 2006; Doherty 2012; Eldaba 2015; El‐Mekawy 2012; Embu 2011; French 1999; Gomaa 2003; Gulhas 2012; Gunaydin 2009; Hall 1994; Hasan 2012; Hwang 2012; Idehen 2014; Inglis 1995; Karinen 1995; Khan 2013; King 1998; Kuhn 2016; Loughrey 2002; Loughrey 2005; Marciniak 2015; Mercier 2014; Mitra 2014; Moslemi 2015; Nazir 2012; Ngan Kee 2004a; Ngan Kee 2013a; Nishikawa 2007; Nivatpumin 2016; Oh 2014; Ortiz‐Gomez 2014; Ouerghi 2010; Riley 1995; Siddik 2000; Siddik‐Sayyid 2009; Singh 2014; Singh 2016; Sujata 2012; Tawfik 2014; Terkawi 2015; Trabelsi 2015; Unlugenc 2015; Ure 1999; Wang 2014a; Wang 2014b; Wilson 1998; Wilson 1999). In the remaining studies, blinding was either not performed (8 studies) or not reported (64 studies). We assessed the eight studies in which it was clear that the participants and anaesthetists were not blinded as being at high risk of bias (Bhagwanjee 1990; Calvache 2011; Carvalho 2009; Cyna 2010; Dyer 2004; Pouliou 2006; Romdhani 2014; Sutherland 2001).
The outcome assessors were blinded in 43 studies (Ansari 2011; Bhardwaj 2013; Dahlgren 2007; Das Neves 2010; Davies 2006; Doherty 2012; Eldaba 2015; El‐Mekawy 2012; Embu 2011; French 1999; Gomaa 2003; Gulhas 2012; Gunaydin 2009; Hall 1994; Hasan 2012; Hwang 2012; Idehen 2014; Khan 2013; Kohler 2002; Kuhn 2016; Loke 2002; Loughrey 2005; Marciniak 2015; Mercier 2014; Mitra 2014; Moslemi 2015; Nazir 2012; Ngan Kee 2013a; Nivatpumin 2016; Oh 2014; Ortiz‐Gomez 2014; Ouerghi 2010; Sahoo 2012; Siddik‐Sayyid 2009; Singh 2014; Singh 2016; Sujata 2012; Tawfik 2014; Terkawi 2015; Trabelsi 2015; Unlugenc 2015; Wang 2014a; Wang 2014b), and they were not blinded in 2 (Magalhaes 2009; Sutherland 2001). The remaining 81 studies did not report blinding of the outcome assessor.
Incomplete outcome data
There were no or only unlikely losses to follow‐up in 70 studies. In 52 studies there was some evidence of incomplete data and small losses to follow‐up, or insufficient information reported to assess this domain adequately (Adsumelli 2003; Alimian 2014; Allen 2010; Amaro 1998; Ansari 2011; Bhagwanjee 1990; Carvalho 1999a; Carvalho 1999b; Davies 2006; Farid 2016; Faydaci 2011; Grubb 2004; Gunusen 2010; Hall 1994; Imam 2012; Inglis 1995; Jacob 2012; James 1973; Jorgensen 1996; Jorgensen 2000; King 1998; Kohli 2013; Lin 1999; Loo 2002; Loughrey 2005; Marciniak 2013; Mathru 1980; Miyabe 1997; Morgan 2000; Ngan Kee 2000; Olsen 1994; Ozkan 2004; Pouliou 2006; Pouta 1996; Riley 1995; Romdhani 2014; Rout 1992; Rout 1993a; Selvan 2004; Siddik 2000; Singh 2009; Sood 1996; Stein 1997; Turkoz 2002; Ueyama 1992; Ueyama 1999; Webb 1998; Wilson 1998; Wilson 1999; Yokoyama 1997; Yorozu 2002). We assessed these studies as being at unclear risk of attrition bias. We considered the remaining four studies to be at high risk of bias due to losses to follow‐up (Bottiger 2010 reported the exclusion of 3 women for unspecified reasons at an unclear point along the study pathway; Eldaba 2015 reported 5/200 exclusions due to failed blocks; Gulhas 2012 excluded 3/105 patients due to failed blocks; Sutherland 2001 reported 46/100 protocol violations).
The Characteristics of included studies table provides reasons for losses to follow‐up.
Selective reporting
Selective reporting was not present in 71 studies (Adsumelli 2003; Alimian 2014; Allen 2010; Amaro 1998; Ansari 2011; Arora 2015; Bhagwanjee 1990; Bhardwaj 2013; Bottiger 2010; Dahlgren 2007; Das Neves 2010; Dyer 2004; Eldaba 2015; El‐Mekawy 2012; Embu 2011; Farid 2016; Faydaci 2011; French 1999; Gomaa 2003; Grubb 2004; Gulhas 2012; Gunaydin 2009; Gunusen 2010; Hall 1994; Hartley 2001; Hasan 2012; Hwang 2012; Idehen 2014; Imam 2012; Inglis 1995; Jabalameli 2011; Jorgensen 2000; Khan 2013; King 1998; Kohler 2002; Kuhn 2016; Loke 2002; Loughrey 2002; Loughrey 2005; Magalhaes 2009; Marciniak 2015; Mercier 2014; Mitra 2014; Mohta 2010; Moslemi 2015; Nazir 2012; Ngan Kee 2000; Ngan Kee 2004a; Ngan Kee 2013a; Nishikawa 2007; Nivatpumin 2016; Oh 2014; Ortiz‐Gomez 2014; Romdhani 2014; Sahoo 2012; Singh 2014; Singh 2016; Stein 1997; Sujata 2012; Tawfik 2014; Tercanli 2005; Terkawi 2015; Torres unpub; Trabelsi 2015; Tsen 2000; Ueyama 2002; Unlugenc 2015; Upadya 2016; Ure 1999; Wang 2014a; Wang 2014b). It was not clear in a further 51 studies whether selective reporting was present, with the remaining four studies demonstrating evidence of selective reporting (Calvache 2011; Cardoso 2004a; Dahlgren 2005; Muzlifah 2009).
Other potential sources of bias
We found no other potential sources of bias in 84 studies. It was unclear in a further 37 studies whether there was potential source of bias (Ansari 2011; Carvalho 1999a; Carvalho 1999b; Carvalho 2000; Das Neves 2010; Jacob 2012; James 1973; Jorgensen 1996; Kohli 2013; Lin 1999; Magalhaes 2009; Miyabe 1997; Morgan 2000; Nishikawa 2007; Olsen 1994; Ouerghi 2010;; Perumal 2004; Pouliou 2006; Pouta 1996; Ramin 1994; Rees 2002; Riley 1995; Rout 1992; Rout 1993a; Selvan 2004; Siddik 2000; Singh 2009; Singh 2016; Sood 1996; Sutherland 2001; Turkoz 2002; Ueyama 1992; Ueyama 1999; Webb 1998; Wilson 1999; Yokoyama 1997; Yorozu 2002). There was a potential source of bias with respect to funding source in one study: Mercier 2014 performed a study comparing colloid (HES) preload to crystalloid (Ringer's lactate) preload, which was fully funded by Fresenius Kabi, the company that produces HES. We assessed this study as being at high risk of other bias. Some evidence of asymmetry is apparent in two of the three funnel plots (Figure 3, Figure 4 and Figure 5), which suggests possible publication bias due to the number of small studies.

Funnel plot of comparison: 7 Colloid vs crystalloid, outcome: 7.1 Women with hypotension requiring intervention.

Funnel plot of comparison: 13 Ephedrine vs control, outcome: 13.1 Women with hypotension requiring intervention.

Funnel plot of comparison: 47 Lower limb compression vs control, outcome: 47.1 Women with hypotension requiring intervention.
There were 2 studies assessed as high risk as study participants received variable doses of local anaesthetic in their spinal block (Alahuhta 1992; Mathru 1980). Also, there were 2 studies assessed as high risk of bias as it was unclear whether the spinal anaesthetic technique and dose was standardised between the study groups (Ozkan 2004; Wilson 1998). It was unlikely that with randomisation this source of bias would have an important effect on the review findings.
Effects of interventions
See: Summary of findings for the main comparison Techniques for preventing hypotension during spinal anaesthesia for caesarean section: key interventions for the primary outcome (women with hypotension requiring intervention); Summary of findings 2 Crystalloid versus control; Summary of findings 3 Colloid versus crystalloid; Summary of findings 4 Ephedrine versus phenylephrine; Summary of findings 5 Ondansetron versus control; Summary of findings 6 Lower limb compression versus control; Summary of findings 7 Walking versus lying
We included 126 studies, involving 9565 women and assessing 49 comparisons of different methods to prevent hypotension following spinal anaesthesia at caesarean.
As noted above, we grouped the comparisons into three main categories of interventions: fluids (data and analyses 1 to 11), drugs (data and analyses 12 to 36), and physical methods (data and analyses 37 to 49). Comparisons 1, 7, 16, 31, 37, and 43 constitute our key review comparisons; see summary of findings Table for the main comparison for a summary of the findings of each for our main review outcome: maternal hypotension requiring pharmacological intervention.
Fluids
This group of interventions comprises comparisons corresponding to data analyses 1 to 11. The section first presents comparisons with crystalloids, including crystalloid versus control (comparison 1; see summary of findings Table 2), different regimens of crystalloids, and different types of crystalloids. Comparison 7 assesses colloid versus crystalloid directly (see summary of findings Table 3), while the remaining comparisons focus on colloids alone (versus control: different regimens of colloids: and different types of colloids).
Crystalloids
Crystalloid versus control
See summary of findings Table 2.
Primary outcome: maternal hypotension requiring pharmacological intervention
Crystalloids appeared to be more effective than control for preventing maternal hypotension requiring intervention (average RR 0.84, 95% CI 0.72 to 0.98; 5 studies; 370 women; low‐quality evidence; Analysis 1.1).
Secondary outcomes
Maternal
-
Nausea and/or vomiting
There was insufficient evidence to determine whether there was a difference between the groups (RR 0.19, 95% CI 0.01 to 3.91; 1 study; 69 women; very low‐quality evidence; Analysis 1.2).
-
Anaphylaxis
One study reported this outcome (Idehen 2014, 69 women). There were no events in either group (Analysis 1.3).
Neonatal
-
Apgar scores of less than 7 or 8 at five minutes
One study reported this outcome (Idehen 2014, 60 babies; low‐quality evidence). There were no events in either group (Analysis 1.4).
No trials reported other secondary outcomes for this comparison.
Different regimens of crystalloids
Crystalloid: rapid infusion versus slow infusion
Primary outcome: maternal hypotension requiring pharmacological intervention
There was insufficient evidence to determine whether there was a difference between the groups (RR 0.86, 95% CI 0.45 to 1.64; 1 study, 20 women; Analysis 2.1).
Secondary outcomes
No trials reported secondary outcomes for this comparison.
Crystalloid: high versus low preload volume
Primary outcome: maternal hypotension requiring pharmacological intervention
There was no conclusive evidence of a difference between the groups in rates of hypotension when comparing high volume preload (15 mL/kg to 20 mL/kg) to lower volume preload (10 mL/kg or less) (average RR 0.55, 95% CI 0.29 to 1.02; I² = 57%, 3 studies, 192 women; Analysis 3.1). There was considerable heterogeneity in the 20 mL subgroup (I² = 85%) but no evidence of subgroup differences (test for subgroup differences: Chi² = 0.01, df = 1 (P = 0.92), I² = 0%).
Secondary outcomes
Maternal
-
Nausea and/or vomiting
There was insufficient evidence to determine whether there was a difference between the groups (RR 1.20, 95% CI 0.40 to 3.62, one study, 80 women; Analysis 3.2).
Neonatal
-
Apgar scores of less than 7 or 8 at five minutes
One study reported this outcome (Faydaci 2011, 90 babies). There were no events in either group (Analysis 3.3).
No trials reported other secondary outcomes for this comparison.
Sensitivity analysis
Removing Muzlifah 2009 from Analysis 3.1 resulted in fewer women in the high volume preloading group experiencing hypotension than in the low volume group (average RR 0.43, 95% CI 0.23 to 0.78); data not shown.
Crystalloid: rapid coload versus preload
Primary outcome: maternal hypotension requiring pharmacological intervention
A rapid crystalloid coload was associated with a lower incidence of hypotension than a preload (average RR 0.70, 95% CI 0.59 to 0.83, 5 studies, 384 women; Analysis 4.1).
Secondary outcomes
Maternal
-
Hypertension requiring intervention
There was insufficient evidence to determine whether there was a difference between the groups (RR 1.67, 95% CI 0.42 to 6.60, 1 study, 100 women; Analysis 4.2).
-
Cardiac dysrhythmia
There was insufficient evidence to determine whether there was a difference between the groups in rates of bradycardia (RR 1.43, 95% CI 0.59 to 3.45, 1 study, 100 women; Analysis 4.3).
-
Nausea and/or vomiting
Rapid coload was associated with a higher risk of nausea than preload (average RR 1.98, 95% CI 1.26 to 3.12, 3 studies, 201 women; Analysis 4.4).
There was insufficient evidence to determine conclusively whether there was a difference between the groups in rates of vomiting (average RR 2.33, 95% CI 0.98 to 5.58, 2 studies, 160 women).
Neonatal
-
Acidosis
Two studies reported this outcome (Dyer 2004; Oh 2014, 110 babies). There were no events in either group (Analysis 4.5).
-
Apgar scores of less than 7 or 8 at five minutes
Three studies reported this outcome (Dyer 2004; Jacob 2012; Oh 2014, 210 babies). There were no events in either group (Analysis 4.6).
No trials reported other secondary outcomes for this comparison.
Sensitivity analysis
Removing Dyer 2004 from the analysis did not impact the results.
Crystalloid: warm versus cold saline
Primary outcome: maternal hypotension requiring pharmacological intervention
There was insufficient evidence to determine whether there was a difference between the groups (RR 1.03, 95% CI 0.65 to 1.62, one study,113 women; Analysis 5.1).
Secondary outcomes
-
Nausea and/or vomiting
There was insufficient evidence to determine whether warm or cold saline had an effect on nausea (RR 1.64, 95% CI 0.97 to 2.76, one study, 113 women) or vomiting (RR 2.95, 95% CI 0.12 to 70.87, one study, 113 women); see Analysis 5.2.
No trials reported other secondary outcomes for this comparison.
Different types of crystalloids
Dextrose plus saline versus saline alone
Primary outcome: maternal hypotension requiring pharmacological intervention
There was no clear evidence of a difference between the interventions (RR 0.88, 95% CI 0.68 to 1.14, 1 study, 120 women; Analysis 6.1.1).
Secondary outcomes
Neonatal
-
Acidosis
There was insufficient evidence to determine whether there was a difference between the groups (RR 1.20, 95% CI 0.39 to 3.72, 1 study, 120 babies; Analysis 6.3).
-
Apgar scores of less than 7 at five minutes
One study reported this outcome (Wilson 1999, 120 babies). There were no events in either group (Analysis 6.4).
No trials reported other secondary outcomes for this comparison.
Glucose versus saline
Primary outcome: maternal hypotension requiring pharmacological intervention
There was no clear evidence of a difference between the interventions (RR 1.05, 95% CI 0.74 to 1.48, 1 study, 70 women; Analysis 6.1.2).
Secondary outcomes
No studies reported secondary outcomes for this comparison.
Ringers lactate versus saline
Primary outcome: maternal hypotension requiring pharmacological intervention
There was insufficient evidence to determine whether there was a difference between the groups (RR 1.17, 95% CI 0.65 to 2.09, 1 study, 60 women; Analysis 6.1.3).
Secondary outcomes
Neonatal
-
Acidosis
One study reported this outcome (Alimian 2014, 60 babies). There were no events in either group (Analysis 6.2).
-
Apgar scores of less than 8 at five minutes
One study reported this outcome (Alimian 2014, 60 babies). There were no events in either group (Analysis 6.5).
No trials reported other secondary outcomes for this comparison.
Colloids versus crystalloids
See summary of findings Table 3.
Primary outcome: maternal hypotension requiring pharmacological intervention
The incidence of hypotension was lower with colloids compared to crystalloids (average RR 0.68, 95% CI 0.58 to 0.80; 28 studies, 2105 women; very low‐quality evidence; Analysis 7.1). Substantial heterogeneity (I² = 85%, Tau² = 0.16) was likely due to differences in formulation and volume of fluid administered between studies. However, due to the variation in regimens between studies, it was not possible to conduct formal subgroup analyses. There was some evidence of asymmetry on funnel plot (Figure 3), which could be due to the large number of small studies contributing to this analysis.
Secondary outcomes
Maternal
-
Hypertension requiring intervention
There was insufficient evidence to determine whether there was a difference between the groups (average RR 0.64, 95% CI 0.09 to 4.46, 3 studies, 327 women;very low‐quality evidence; Analysis 7.2).
-
Cardiac dysrhythmia
There was no clear evidence of a difference in the groups in rates of tachycardia (RR 1.10, 95% CI 0.79, 1.53, 1 study, 60 women) or bradycardia (RR 0.99, 95% CI 0.55 to 1.79, 6 studies, 509 women; very low‐quality evidence); see Analysis 7.3.
-
Nausea and/or vomiting
There was no clear evidence of a difference in the groups for rates of nausea or vomiting (average RR 0.83, 95% CI 0.61 to 1.13, 15 studies, 1154 women, I² = 37%; very low‐quality evidence), nausea alone (average RR 1.10, 95% CI 0.77 to 1.58, 5 studies, 390 women, I² = 10%), vomiting alone (average RR 1.35, 95% CI 0.55 to 3.27, 4 studies, 320 women, I² = 33%); see Analysis 7.4.
Neonatal
-
Acidosis
There was insufficient evidence to determine whether there was a difference between the groups (average RR 0.83, 95% CI 0.15 to 4.52, 6 studies, 678 babies, I² = 24%; very low‐quality evidence; Analysis 7.5).
-
Apgar scores of less than 7 or 8 at five minutes
There was insufficient evidence to determine whether there was a difference between the groups in the rates of Apgar scores of less than 7 (average RR 0.16, 95% CI 0.01 to 2.90, 2 studies ,127 babies) or of less than 8 (average RR 0.24, 95% CI 0.03 to 2.05, 11 studies, 826 babies; very low‐quality evidence) at five minutes; see Analysis 7.6.
No trials reported other secondary outcomes for this comparison.
Sensitivity analysis
Removing studies for at high risk of bias in one or more domain made little difference to the results of any analysis under this comparison (Bottiger 2010; Cardoso 2004a; Dahlgren 2005; Mercier 2014; Romdhani 2014; Ueyama 1999).
Colloids versus control
Primary outcome: maternal hypotension requiring pharmacological intervention
There was a reduced incidence of hypotension in the colloid group (average RR 0.40, 95% CI 0.16 to 0.96, 5 studies, 426 women; Analysis 8.1). There was substantial heterogeneity (I² = 85%, Tau² = 0.71), likely due to differences in formulation and volume of fluid administered. In addition, Tawfik 2014 reported higher event rates than other studies.
Secondary outcomes
Maternal
-
Cardiac dysrhythmia
There was insufficient evidence to determine whether there was a difference between the groups (RR 7.70, 95% CI 0.46 to 127.78; 54 women; 1 study; Analysis 8.2).
-
Nausea and/or vomiting
There was insufficient evidence to determine whether there was a difference between the groups (average RR 1.65, 95% CI 0.75 to 3.64, 2 studies, 245 women; Analysis 8.3).
Neonatal
-
Acidosis
There was insufficient evidence to determine whether there was a difference between the groups (RR 1.24, 95% CI 0.34 to 4.48, 1 study, 205 babies; Analysis 8.4).
-
Apgar scores of less than 7 or 8 at five minutes
There was insufficient evidence to determine whether there was a difference between the groups in Apgar scores of less than 7 at five minutes (average RR 0.07, 95% CI 0.00 to 1.24, 4 studies, 205 babies; Analysis 8.5). Three of the four studies in this analysis reported no events in either arm. One study reported Apgar score of less than 8 at five minutes (Tawfik 2014, 205 women), and there were no events in either arm (Analysis 8.6).
No trials reported other secondary outcomes for this comparison.
Different regimens of colloids
Colloids: high versus low volume
Primary outcome: maternal hypotension requiring pharmacological intervention
In three studies, there was no difference in the incidence of hypotension when comparing high volume versus low volume colloids (average RR 0.75, 95% CI 0.27 to 2.08; 134 women; Analysis 9.1). Substantial heterogeneity (I² = 78, Tau² = 0.63) was present. None of the studies contributing to the analysis were good quality, and all were at unclear or high risk of selection bias, which may have impacted results (Davies 2006; Selvan 2004; Ueyama 1999).
Secondary outcomes
Neonatal
-
Apgar of less than 9 at five minutes (non‐prespecified outcome)
One study reported this outcome (Davies 2006, 70 babies). There were no events in either arm (Analysis 9.2).
No trials reported other secondary outcomes for this comparison.
Colloid: preload versus coload
Note: the comparison for crystalloid is coload versus preload.
Primary outcome: maternal hypotension requiring pharmacological intervention
There was no clear evidence of a difference between the groups (average RR 0.93, 95% CI 0.78 to 1.10, 4 studies, 320 women; Analysis 10.1).
Secondary outcomes
Maternal
-
Cardiac dysrhythmia
There was insufficient evidence to determine whether there was a difference between the groups in rates of bradycardia (average RR 0.75, 95% CI 0.20 to 2.88, 2 studies, 82 women; Analysis 10.2. One study had no events). One study reported tachycardia (Carvalho 2009, 46 women); there were no events in either arm (Analysis 10.2).
-
Nausea and/or vomiting
There was insufficient evidence to determine whether there was a difference between the groups in rates of nausea or vomiting (RR 0.92, 95% CI 0.63 to 1.35, 1 study, 178 women), rates of nausea alone (RR 1.00, 95% CI 0.15 to 6.51, 1 study, 46 women). One study reported rates of vomiting alone (Carvalho 2009, 46 women); there were no events in either arm (Analysis 10.3).
-
Anaphylaxis
One study reported this outcome (Siddik‐Sayyid 2009, 178 women). There were no events in either group (Analysis 10.4).
Neonatal
-
Apgar scores of less than 7 or 8 at five minutes
One study reported this outcome (Nishikawa 2007, 36 babies): there were no events in either arm (Analysis 10.5).
No trials reported other secondary outcomes for this comparison.
Sensitivity analysis
Removing Carvalho 2009 made very little difference to Analysis 10.1 and Analysis 10.2.
Different types of colloids
Two studies compared colloid + crystalloid versus another colloid or dextrose + crystalloid (Marciniak 2015; Mathru 1980)
Albumen and dextrose plus crystalloid versus dextrose plus crystalloid
Primary outcome: maternal hypotension requiring pharmacological intervention
One study compared colloid plus crystalloid versus another colloid or dextrose plus crystalloid (Mathru 1980).There was insufficient evidence to determine whether there was a difference between the groups (RR 0.13, 95% CI 0.01 to 2.30, 1 study, 45 women; Analysis 11.1.1).
Secondary outcomes
Neonatal
-
Apgar scores of less than 7 at five minutes
There was insufficient evidence to determine whether there was a difference between the groups for Apgar scores of less than 7 (RR 0.13, 95% CI 0.01 to 2.30, 1 study, 45 babies; Analysis 11.2).
No trials reported other secondary outcomes for this comparison.
Unbalanced versus balanced hydroxyethyl starch
Primary outcome: maternal hypotension requiring pharmacological intervention
One study compared unbalanced versus balanced hydroxyethyl starch (Marciniak 2015). There was no clear evidence of a difference between the groups (RR 1.04, 95% CI 0.78 to 1.39, 1 study, 51 women; Analysis 11.1.2).
Secondary outcomes
Neonatal
-
Apgar scores of less than 8 at five minutes
Marciniak 2013 (51 women) reported this outcome. There were no events in either arm (Analysis 11.3).
No trials reported other secondary outcomes for this comparison.
Summary: fluids
In preventing hypotension following spinal anaesthesia at caesarean section, we found the following.
-
Crystalloids may be more effective than control.
-
Rapid crystalloid coload is more effective than crystalloid preload.
-
Colloids are more effective than crystalloids.
-
For colloids, there is no clear difference with high versus low volumes or with preloading versus coloading.
Drugs
This group of interventions comprises comparisons corresponding to data analyses 12 to 36. The section begins by reporting comparisons involving ephedrine, including ephedrine versus control, ephedrine versus other drugs; see summary of findings Table 4 for comparison 'ephedrine versus phenylephrine'), different regimens of ephedrine, and different ephedrine regimens plus crystalloid or colloid. Other comparisons assess phenylephrine versus control, other drugs, different regimens of phenylephrine, and phenylephrine combined with crystalloid. Finally, we assess other drugs: glycopyrrolate, ondansetron; see summary of findings Table 5 for 'ondansetron versus control'), granisetron, ketamine, angiotensin, and dopamine.
Ephedrine
Ephedrine versus control
Primary outcome: maternal hypotension requiring pharmacological intervention
There was a lower incidence of hypotension in the ephedrine prophylaxis groups than in controls (average RR 0.65, 95% CI 0.53 to 0.80; 22 studies, 1401 women; Analysis 12.1). Substantial heterogeneity was present (I² = 75%, Tau² = 0.14), which was most likely due to differences in dosing of prophylactic ephedrine, rescue treatments for hypotension when it occurred, and administration routes for the ephedrine. Of note, most studies were unclear in reporting methods of sequence generation, allocation concealment, and blinding.
All studies examined intravenous (IV) ephedrine except for two studies where ephedrine was given intramuscularly (Gomaa 2003; Grubb 2004). Excluding these two studies from analyses reduced heterogeneity only slightly (I² = 69%, Tau² = 0.09). The asymmetrical funnel plot (Figure 4) may be due to small study effects or publication‐type bias.
Secondary outcomes
Maternal
-
Hypertension requiring intervention
There was no conclusive evidence of a difference between the groups (average RR 1.61, 95% CI 1.00 to 2.61, 7 studies, 520 women; Analysis 12.2).
-
Cardiac dysrhythmia
There was no clear evidence of a difference between the groups in rates of tachycardia (average RR 1.12, 95% CI 0.74 to 1.70, 2 studies, 93 women) and no conclusive evidence with respect to bradycardia (average RR 14.46, 95% CI 0.87, 241.09, 2 studies, 103 women, no events in one study). There were only seven events in the analysis for bradycardia, but they were all in the ephedrine group (Analysis 12.3).
-
Nausea and/or vomiting
There was no conclusive evidence of a difference between the groups for rates of nausea or vomiting (average RR 0.71, 95% CI 0.22 to 2.34, 5 studies, 219 women, I² = 62%), or rates of vomiting alone (average RR 0.68, 95% CI 0.44 to 1.07, 6 studies, 516 women, I² = 47%). Rates of nausea alone were lower in the ephedrine group (average RR 0.68, 95% CI 0.48 to 0.96, 8 studies, 620 women, I² = 25%; Analysis 12.4).
Neonatal
-
Acidosis
There was insufficient evidence to determine whether there was a difference between the groups (RR 1.29, 95% CI 0.67 to 2.49, 9 studies, 576 babies; Analysis 12.5).
-
Apgar scores of less than 7 or 8 at five minutes
There was insufficient evidence to determine whether there was a difference between the groups in Apgar scores of less than 7 at five minutes (RR 1.14, 95% CI 0.34 to 3.81, 4 studies, 263 women). Ten studies (N = 579) reported Apgar score of less than 8 at five minutes and there were no events in either arm (Analysis 12.6).
No trials reported other secondary outcomes for this comparison.
Ephedrine versus other drug regimens
Ephedrine versus crystalloid
Primary outcome: maternal hypotension requiring pharmacological intervention
Fewer women in the ephedrine group developed hypotension compared with the crystalloid group (average RR 0.60, 95% CI 0.47 to 0.78, 9 studies, 613 women; Analysis 13.1). There was moderate heterogeneity between the studies (I² = 40%), which may be related to variation in methods and dose of ephedrine between the different studies.
Secondary outcomes
Maternal
-
Hypertension requiring intervention
There was insufficient evidence to determine whether there was a difference between the groups (average RR 1.10, 95% CI 0.37 to 3.28, 3 studies, 280 women, I² = 43%; Analysis 13.2).
-
Cardiac dysrhythmia
There was insufficient evidence to determine whether there was a difference between the groups in rates of bradycardia (RR 0.33, 95% CI 0.01 to 7.99, 1 study, 100 women; Analysis 13.3).
-
Nausea and/or vomiting
There was insufficient evidence to determine whether there was a difference between the groups for rates of nausea or vomiting (average RR 1.00, 95% CI 0.48 to 2.08, 2 studies, 146 women) and no conclusive evidence of a difference for rates of vomiting alone (average RR 0.57, 95% CI 0.31 to 1.05, 3 studies, 220 women, I² = 33%). Rates of nausea alone were lower in the ephedrine group (average RR 0.54, 95% CI 0.31 to 0.93, 3 studies, 220 women); see Analysis 13.4.
-
Impaired consciousness, dizziness
There was insufficient evidence to determine whether there was a difference between the groups (RR 0.40, 95% CI 0.37 to 3.28, 1 study, 46 women; Analysis 13.5).
Neonatal
-
Acidosis
There was insufficient evidence to determine whether there was a difference between the groups (average RR 1.41, 95% CI 0.48 to 4.15, 2 studies, 218 babies). There were no events in one of the two studies (Analysis 13.6).
-
Apgar scores of less than 7 or 8 at five minutes
One study (Carvalho 2000, 100 women) reported Apgar score of less than 7 at five minutes; no events occurred in either arm. Four studies (226 women) reported Apgar scores of less than 8 at five minutes; only one event occurred, which was in the ephedrine group (average RR 3.00, 95% CI 0.13 to 71.92; Analysis 13.7).
No trials reported other secondary outcomes for this comparison.
Ephedrine plus crystalloid versus colloid
Primary outcome: maternal hypotension requiring pharmacological intervention
One study investigating this comparison found no evidence of a difference in the incidence of hypotension (RR 0.65, 95% CI 0.38 to 1.12; Analysis 14.1).
Secondary outcomes
Maternal
-
Nausea and/or vomiting
One study investigating this comparison found nausea (RR 0.42, 95% CI 0.22 to 0.81; 75 women) and vomiting (RR 0.17, 95% CI 0.04 to 0.77; 75 women) were less common in the ephedrine plus crystalloid group than in the colloid group (Analysis 14.2).
Ephedrine plus colloid versus crystalloid
Primary outcome: maternal hypotension requiring pharmacological intervention
Hypotension was less common in the ephedrine plus colloid group than in the crystalloid group (RR 0.39, 95% CI 0.21 to 0.74, 1 study, 75 women; Analysis 15.1).
Secondary outcomes
Maternal
-
Nausea and/or vomiting
Nausea was less common in the ephedrine plus colloid group than in the crystalloid group (RR 0.27, 95% CI 0.11 to 0.65, 1 study, 75 women. There was insufficient evidence to determine whether there was a difference between the groups in rates of vomiting (RR 0.38, 95% CI 0.09 to 1.55, 1 study, 75 women); see Analysis 15.2.
No trials reported other secondary outcomes for this comparison.
Ephedrine versus phenylephrine
See summary of findings Table 4.
Primary outcome: maternal hypotension requiring pharmacological intervention
There was no clear evidence of a difference between the groups (average RR 0.92, 95% CI 0.71 to 1.18, 8 studies, 401 women, I² = 37%; very low‐quality evidence; Analysis 16.1).
Secondary outcomes
Maternal
-
Hypertension requiring intervention
There was insufficient evidence to determine whether there was a difference between the groups (average RR 1.72, 95% CI 0.71 to 4.16, 2 studies, 118 women, low‐quality evidence; Analysis 16.2).
-
Cardiac dysrhythmia
Rates of bradycardia were lower in the ephedrine group (average RR 0.37, 95% CI 0.21 to 0.64, 5 studies, 304 women, low‐quality evidence). There was insufficient evidence to determine whether there was a difference between the groups in rates of tachycardia (RR 2.22, 95% CI 0.44 to 11.18, 1 study, 57 women). See Analysis 16.3.
-
Nausea and/or vomiting
There was no clear evidence of a difference between the groups (average RR 0.76, 95% CI 0.39 to 1.49, 4 studies, 204 women, I² = 37%, very low‐quality evidence; Analysis 16.4).
Neonatal
-
Acidosis
There was no clear evidence of a difference between the groups (average RR 0.89, 95% CI 0.07 to 12.00, 3 studies, 175 babies, low‐quality evidence). Only two events occurred, both in the same study (Analysis 16.5).
-
Apgar scores of less than 7 or 8 at five minutes
Six studies (321 babies, low‐quality evidence) measured this outcome. There were no events in either group (Analysis 16.6).
No trials reported other secondary outcomes for this comparison.
Sensitivity analysis
Removing Magalhaes 2009 from Analysis 16.1, Analysis 16.3, Analysis 16.2, Analysis 16.6, and Analysis 16.4 made very little difference to the overall results.
Ephedrine versus angiotension
Primary outcome: maternal hypotension requiring pharmacological intervention
One study reported this outcome (Ramin 1994, 20 women). No events occurred in either arm (Analysis 17.1).
Secondary outcomes
Maternal
-
Nausea and/or vomiting
There was insufficient evidence to determine whether there was a difference between the groups (RR 3.00, 95% CI 0.14 to 65.90, 1 study, 20 women; Analysis 17.2).
Neonatal
-
Acidosis
There was insufficient evidence to determine whether there was a difference between the groups (RR 9.00, 95% CI 0.55 to 147.95, 1 study, 20 babies). Only four events occurred, all in the ephedrine arm (Analysis 17.3).
No trials reported other secondary outcomes for this comparison.
Ephedrine versus colloid
Primary outcome: maternal hypotension requiring pharmacological intervention
Rates of hypotension were lower in the ephedrine group (average RR 0.53, 95% CI 0.36 to 0.79, 2 studies, 160 women; Analysis 18.1).
Secondary outcomes
Maternal
-
Hypertension requiring intervention
There was insufficient evidence to determine whether there was a difference between the groups (RR 3.00, 95% CI 0.32 to 27.87, 1 study, 100 women; Analysis 18.2).
-
Cardiac dysrhythmia
One study reported bradycardia (Jabalameli 2011, 100 women). There were no events in either arm (Analysis 18.3).
-
Nausea and/or vomiting
There was insufficient evidence to determine whether there was a difference between the groups in rates of nausea or vomiting (RR 5.00, 95% CI 0.25 to 101.58, 1 study, 100 women) or in rates of vomiting alone (RR 0.14, 95% CI 0.01 to 2.65, 1 study, 60 women). Rates of nausea alone were lower in the ephedrine group (RR 0.22, 95% CI 0.05, 0.94, 1 study, 60 women); see Analysis 18.4.
Neonatal
-
Acidosis
One study reported this outcome (Jabalameli 2011, 100 babies). There were no events in either arm (Analysis 18.5).
-
Apgar scores of less than 7 or 8 at five minutes
There was insufficient evidence to determine whether there was a difference between the groups (RR 3.00, 95% CI 0.13 to 71.92, 1 study, 100 babies; Analysis 18.6).
No trials reported other secondary outcomes for this comparison.
Ephedrine versus metaraminol
Primary outcome: maternal hypotension requiring pharmacological intervention
There was insufficient evidence to determine whether there was a difference between the groups (RR 1.56,95% CI 0.50 to 4.89, 1 study, 53 women; Analysis 19.1).
Secondary outcomes
Maternal
-
Hypertension requiring intervention
There was insufficient evidence to determine whether there was a difference between the groups (RR 0.62, 95% CI 0.26 to 1.47, 1 study, 53 women; Analysis 19.2).
-
Cardiac dysrhythmia
One study reported bradycardia (Bhardwaj 2013, 53 women). There were no events in either arm (Analysis 19.3).
-
Nausea and/or vomiting
There was insufficient evidence to determine whether there was a difference between the groups (RR 7.26, 95% CI 0.39 to 134.01, 1 study, 53 women; Analysis 19.4).
Neonatal
-
Acidosis
One study reported this outcome (Bhardwaj 2013, 53 babies). There were no events in either arm (Analysis 19.5).
-
Apgar scores of less than 8 at five minutes
One study reported this outcome (Bhardwaj 2013, 53 babies). There were no events in either arm (Analysis 19.6).
No trials reported other secondary outcomes for this comparison.
Different ephedrine regimens
Ephedrine: lower dose versus higher dose
Primary outcome: maternal hypotension requiring pharmacological intervention
There was no clear evidence of a difference between the groups in dose comparisons of 5 mg versus 10 mg (RR 1.05, 95% CI 0.65 to 1.69, 2 studies, 100 women), 6 mg versus 12 mg (RR 1.83, 95% CI 0.83 to 4.04, 1 study, 46 women), 5 mg versus 15 mg (RR 2.00, 95% CI 0.94 to 4.27, 1 study, 40 women), 10 mg versus 15 mg (RR 1.83, 95% CI 0.84 to 3.99, 1 study, 40 women), 10 mg versus 20 mg (RR 1.06, 95% CI 0.80 to 1.39, 2 studies, 60 women), or 15 mg compared to 30 mg ephedrine (RR 2.11, 95% CI 1.06 to 4.21, 1 study, 100 women). However, rates of hypotension were higher with 10 mg compared to 30 mg (RR 2.43, 95% CI 1.30 to 4.54, 1 study, 40 women), and 20 mg compared to 30 mg (RR 2.29, 95% CI 1.21 to 4.32, 1 study, 40 women); see Analysis 20.1.
Secondary outcomes
Maternal
-
Hypertension requiring intervention
There was insufficient evidence to determine whether there was a difference between the groups in comparisons of 5 mg versus 10 mg ephedrine (RR 1.20, 95% CI 0.44 to 3.30, 1 study, 40 women), 5 mg versus 15 mg (RR 0.50, 95% CI 0.23 to 1.07, 1 study, 40 women), 10 mg versus 15 mg (RR 0.42, 95% CI 0.18 to 0.96, 1 study, 40 women), 10 mg versus 20mg (RR 0.20, 95% CI 0.03 to 1.56, 1 study, 40 women), 10 mg versus 30 mg (RR 0.11, 95% CI 0.02 to 0.80, 1 study, 40 women), or 20 mg versus 30 mg ephedrine (RR 0.56, 95% CI 0.23 to 1.37, 1 study, 40 women); see Analysis 20.2.
-
Nausea and/or vomiting
There was no clear evidence of a difference between the groups in rates of nausea and/or vomiting in comparisons of 6 mg versus 12 mg ephedrine (RR 0.81, 95% CI 0.38 to 1.74, 1 study, 46 women); see Analysis 20.3.1.
There was insufficient evidence to determine whether there was a difference between the dosing groups in rates of vomiting in comparisons of 5 mg versus 10 mg (RR 3.00, 95% CI 0.34 to 26.45, 1 study, 40 women), 5 mg versus 15 mg (RR 1.50, 95% CI 0.28 to 8.04, 1 study, 40 women), 10 mg versus 15 mg (RR 0.50, 95% CI 0.05 to 5.08, 1 study, 40 women), or 15 mg versus 30 mg ephedrine (RR 0.67, 95% CI 0.12 to 3.82, 1 study, 100 women); see Analysis 20.3.
There was insufficient evidence to determine whether there was a difference between the groups in rates of nausea, in comparisons of 5 mg versus 10 mg (RR 2.00, 95% CI 0.83 to 4.81, 1 study, 40 women), 5 mg versus 15 mg (RR 2.50, 95% CI 0.94 to 6.66, 1 study, 40 women), 10 mg versus 15 mg (RR 1.25, 95% CI 0.39 to 3.99, 1 study, 40 women, 10 mg versus 20 mg (RR 0.69, 95% CI 0.39 to 1.24, 1 study, 40 women), 10 mg versus 30 mg (RR 1.80, 95% CI 0.73 to 4.43, 1 study, 40 women), 15 mg versus 30 mg (RR 1.43, 95% CI 0.59 to 3.45, 1 study, 100 women), or 20 mg versus 30 mg ephedrine (RR 2.60, 95% CI 1.14 to 5.93, 1 study, 40 women); see Analysis 20.3.
Neonatal
-
Acidosis (pH less than 7.2)
There was insufficient evidence to determine whether there was a difference between the groups in comparisons of 5 mg versus 10 mg ephedrine (RR 0.20, 95% CI 0.01 to 3.92, 1 study, 40 babies), 5 mg versus 15 mg (RR 0.33, 95% CI 0.01 to 7.72, 1 study, 40 babies), 6 mg versus 12 mg (RR 0.31, 95% CI 0.01 to 7.16, 1 study, 46 babies), 10 mg versus 15 mg (RR 2.00, 95% CI 0.20 to 20.33, 1 study, 40 babies), 10 mg versus 20 mg (RR 0.59, 95% CI 0.24 to 1.50, 1 study, 39 babies), 10 mg versus 30 mg (RR 1.13, 95% CI 0.36 to 3.55, 1 study, 38 babies), or 20 mg versus 30 mg (RR 1.89, 95% CI 0.69 to 5.21, 1 study, 37 babies); see Analysis 20.4.
-
Apgar scores of less than 7 or 8 at five minutes
There was insufficient evidence to determine whether there was a difference between the groups, in comparisons of 6 mg versus 12 mg ephedrine (RR 0.31, 95% CI 0.01 to 7.16, 1 study, 46 babies).
No events occurred in comparisons of 5 mg versus 10 mg ephedrine (1 study, 40 babies), 5 mg versus 15 mg (1 study, 40 babies), 10 mg versus 15 mg (1 study, 40 babies), 10 mg versus 20 mg (1 study, 40 babies), 10 mg versus 30 mg (1 study, 40 babies), 20 mg versus 30 mg (1 study, 40 babies); see Analysis 20.5.
No trials reported other secondary outcomes for this comparison.
Ephedrine: slower rate versus faster rate
Primary outcome: maternal hypotension requiring pharmacological intervention
One study compared ephedrine given as a 10 mg in bolus followed by continuous infusion of 2 mg/min versus ephedrine 8 mg/min for 3 min, followed by 4 mg/min for 2 min, then 2 mg/min (Carvalho 2000). Rates of hypotension requiring intervention were higher in the bolus group (RR 3.50, 95% CI 1.26 to 9.72, 1 study, 80 women).
There was insufficient evidence to determine whether there was a difference between the groups, in comparisons of 0.5 mg/min versus 1 mg/min (RR 1.22, 95% CI 0.65 to 2.29, 1 study, 40 women), 0.5 mg/min versus 2 mg/min (RR 1.57, 95% CI 0.77 to 3.22, 1 study, 40 women), 0.5 mg/min versus 4 mg/min (1.22, 95% CI 0.65 to 2.29, 1 study, 40 women), 1 mg/min versus 2 mg/min (average RR 1.24, 95% CI 0.83 to 1.84, 3 studies, 107 women, I2=0%), 1 mg/min versus 3 to 4 mg/min (average RR 1.29, 95% CI 0.81 to 2.05, 2 studies, 99 women, I² = 0%), 2 mg/min versus 3 to 4 mg/min (average RR 1.21, 95% CI 0.60 to 2.43, 2 studies, 239 women, I² = 38%; Analysis 21.1).
Secondary outcomes
Maternal
-
Cardiac dysrhythmia
One study in 19 women comparing ephedrine 1 mg/min versus 2 mg/min reported bradycardia as an outcome (Hall 1994). There were no events in either arm (Analysis 21.3).
-
Nausea and/or vomiting
There was insufficient evidence to determine whether there was a difference between the groups in rates of nausea or vomiting, in a comparison of infusion at 1 mg/min versus 2 mg/min (RR 8.18, 95% CI 0.50 to 133.66, 1 study, 19 women; Analysis 21.4).
There was insufficient evidence to determine whether there was a difference between the groups in rates of nausea alone in comparisons of ephedrine bolus plus slow infusion versus faster infusion (as described above) (RR 1.83, 95% CI 0.75 to 4.48, 1 study, 80 women), or infusion of 0.5 mg/min versus 1 mg/min (RR 1.29, 95% CI 0.60 to 2.77, 1 study, 40 women), 0.5 mg/min versus 2 mg/min (RR 1.50, 95% CI 0.66 to 3.43, 1 study, 40 women), 0.5 mg/min versus 4 mg/min (RR 1.29, 95% CI 0.60 to 2.77, 1 study, 40 women), 1 mg/min versus 2 mg/min (RR 1.17, 95% CI 0.48, 2.86, 1 study, 40 women), 1 mg/min versus 4 mg/min (RR 1.00, 95% CI 0.43, 2.33, 1 study, 40 women), or 2 mg/min versus 4 mg/min (RR 0.86, 95% CI 0.35 to 2.10, 1 study, 40 women). See Analysis 21.4.
There was insufficient evidence to determine whether there was a difference between the groups in rates of vomiting alone, in comparisons of ephedrine bolus plus slow infusion versus faster infusion (as described above) (RR 1.67, 95% CI 0.43 to 6.51, 1 study, 80 women), or infusion of 0.5 mg/min versus 1 mg/min (RR 0.67, 95% CI 0.12, 3.57, 1 study, 40 women), 0.5 mg/min versus 2 mg/min (RR 2.00, 95% CI 0.20 to 20.33, 1 study, 40 women), 0.5 mg/min versus 4 mg/min (RR 2.00, 95% CI 0.20 to 20.33, 1 study, 40 women), 1 mg/min versus 2 mg/min (RR 3.00, 95% CI 0.34, 26.45, 1 study, 40 women), 1 mg/min versus 4 mg/min (RR 3.00, 95% CI 0.34 to 26.45, 1 study, 40 women) or 2 mg/min versus 4 mg/min (RR 1.00, 95% CI 0.07 to 14.90, 1 study, 40 women). See Analysis 21.4.
Neonatal
-
Acidosis
There was insufficient evidence to determine whether there was a difference between the groups in comparisons of ephedrine bolus plus slow infusion versus faster infusion (as described above) (RR 1.66, 95% CI 0.53 to 5.23, 1 study, 78 babies), or infusion of 0.5 mg/min versus 1 mg/min (RR 0.33, 95% CI 0.04 to 2.94, 1 study, 40 babies), 0.5 mg/min versus 2 mg/min (3.00, 95% CI 0.13 to 69.52, 1 study, 40 babies), 0.5 mg/min versus 4 mg/min (RR 0.25, 95% CI 0.03, 2.05, 1 study, 40 babies), 1 mg/min versus 2 mg/min (RR 7.00, 95% CI 0.38 to 127.32, 1 study, 40 babies), 1 mg/min versus 4 mg/min (RR 0.75, 95% CI 0.19 to 2.93, 1 study, 40 babies), or 2 mg/min versus 4 mg/min (RR 0.11, 95% CI 0.01 to 1.94, 1 study, 40 babies); see Analysis 21.5.
-
Apgar scores of less than 7 or 8 at five minutes
One study in 80 women reported this outcome (Carvalho 2000), comparing ephedrine bolus plus slow infusion versus faster infusion (as described above), and one study in 40 babies compared 0.5 mg/min versus 1 mg/min, 0.5 mg/min versus 2 mg/min, 0.5 mg/min versus 4 mg/min, 1 mg/min versus 2 mg/min, 1 mg/min versus 4 mg/min, and 2 mg/min versus 4 mg/min (Carvalho 1999b). There were no events in either arm of any of these studies (Analysis 21.6).
No trials reported other secondary outcomes for this comparison.
Ephedrine: oral versus intramuscular (IM) or intravenous (IV)
Primary outcome: maternal hypotension requiring pharmacological intervention
There was no conclusive evidence of a difference between the groups when comparing oral versus IM administration of ephedrine (RR 3.00, 95% CI 0.95 to 9.48, 1 study, 40 women). Rates of maternal hypotension were higher in the oral group compared with the IV group (RR 19.00, 95% CI 1.18 to 305.88, 1 study, 40 women). See Analysis 22.1.
Secondary outcomes
Maternal
-
Hypertension requiring intervention
There were no events in either arm when comparing oral ephedrine with IM or IV (1 study, 40 women; Analysis 22.2).
-
Nausea and/or vomiting
There was no conclusive evidence of a difference between the groups in rates of nausea or vomiting when comparing oral versus IM (RR 1.33, 95% CI 0.34 to 5.21, 1 study, 40 women) or IV administration (RR 9.00, 95% CI 0.52 to 156.91, 1 study, 40 women); see Analysis 22.3.
No trials reported other secondary outcomes for this comparison.
Ephedrine: IM versus IV
Primary outcome: maternal hypotension requiring pharmacological intervention
There was no clear evidence of a difference between the groups (RR 0.75, 95% CI 0.43 to 1.30, 1 study, 60 women; Analysis 23.1).
Secondary outcomes
Maternal
-
Hypertension requiring intervention
There were no events in either arm when comparing IM ephedrine versus IV (1 study, 60 women; Analysis 23.2).
Neonatal
-
Apgar scores of less than 7 or 8 at five minutes
There were no events in either arm when comparing IM ephedrine with IV (1 study, 60 babies; Analysis 23.3).
No trials reported other secondary outcomes for this comparison.
Sensitivity analysis
Sensitivity analysis was not possible for this comparison.
Phenylephrine versus control (placebo)
Primary outcome: maternal hypotension requiring pharmacological intervention
Five studies investigating this comparison found less hypotension with phenylephrine compared with control (average RR 0.45, 95% CI 0.26 to 0.80, 280 women, 5 studies, I² = 86%, Tau² = 0.34; Analysis 24.1).
Secondary outcomes
Maternal
-
Cardiac dysrhythmia
There was insufficient evidence to determine whether there was a difference between the groups in rates of tachycardia (RR 0.87, 95% CI 0.13 to 5.73, 1 study, 56 women) or bradycardia (average RR 3.23, 95% CI 0.17 to 61.85, 3 studies, 180 women, I² = 73%, Tau² = 4.97); see Analysis 24.2.
-
Nausea and/or vomiting
There was insufficient evidence to determine whether there was a difference between the groups in rates of nausea or vomiting (average RR 0.70, 95% CI 0.16 to 0.80, 3 studies, 180 women, I² = 67%, Tau² = 0.34; Analysis 24.3).
Neonatal
-
Acidosis
There was insufficient evidence to determine whether there was a difference between the groups (RR 0.96, 95% CI 0.06 to 14.50, 1 study, 49 babies; Analysis 24.4).
-
Apgar scores of less than 7 or 8 at five minutes
Three studies reported Apgar scores of less than 7 (Ngan Kee 2004a, 50 babies), or of less than 8 (Loughrey 2005; Moslemi 2015, 96 babies). There were no events in any study arm (Analysis 24.5; Analysis 24.6).
No trials reported other secondary outcomes for this comparison.
Phenylephrine versus other regimens or interventions
Phenylephrine versus mephentermine
Primary outcome: maternal hypotension requiring pharmacological intervention
There was insufficient evidence to determine whether there was a difference between the groups (RR 2.00, 95% CI 0.19 to 20.90, 1 study, 60 women; Analysis 25.1).
Secondary outcomes
Maternal
-
Hypertension requiring intervention
There was insufficient evidence to determine whether there was a difference between the groups (RR 17.00, 95% CI 1.03 to 281.91, 1 study, 60 women; Analysis 25.2).
-
Cardiac dysrhythmia
There was insufficient evidence to determine whether there was a difference between the groups in rates of bradycardia (RR 15.00, 95% CI 0.89 to 251.42, 1 study, 60 women; Analysis 25.3).
-
Nausea and/or vomiting
There was insufficient evidence to determine whether there was a difference between the groups in rates of nausea (RR 0.20, 95% CI 0.01 to 4.00, 1 study, 60 women) or vomiting (RR 1.00, 95% CI 0.07 to15.26 1 study, 60 women); see Analysis 25.4.
No trials reported other secondary outcomes for this comparison.
Phenylephrine versus metaraminol
Primary outcome: maternal hypotension requiring pharmacological intervention
There was insufficient evidence to determine whether there was a difference between the groups (RR 0.84, 95% CI 0.23 to 3.06, 1 study, 59 women; Analysis 26.1).
Secondary outcomes
Maternal
-
Hypertension requiring intervention
Rates of hypertension were lower in the phenylephrine arm (RR 0.25, 95% CI 0.08 to 0.83, 1 study, 59 women; Analysis 26.2).
-
Cardiac dysrhythmia
One study reported bradycardia (Bhardwaj 2013, 59 women). No events occurred in either arm (Analysis 26.3).
-
Nausea and/or vomiting
One study reported this outcome (Bhardwaj 2013, 59 women). No events occurred in either arm (Analysis 26.4).
Neonatal
-
Acidosis
One study reported this outcome (Bhardwaj 2013, 59 babies). No events occurred in either arm (Analysis 26.5).
-
Apgar scores of less than 7 or 8 at five minutes
One study reported this outcome (Bhardwaj 2013, 59 babies). No events occurred in either arm (Analysis 26.6).
No trials reported other secondary outcomes for this comparison.
Phenylephrine versus leg compression
Primary outcome: maternal hypotension requiring pharmacological intervention
There was insufficient evidence to determine whether there was a difference between the groups (RR 0.73, 95% CI 0.46 to 1.15, 1 study, 76 women; Analysis 27.1).
Secondary outcomes
Maternal
-
Cardiac dysrhythmia
There was insufficient evidence to determine whether there was a difference between the groups in rates of bradycardia (RR 0.50, 95% CI 0.05 to 5.28, 1 study, 76 women; Analysis 27.2).
-
Nausea and/or vomiting
There was insufficient evidence to determine whether there was a difference between the groups (RR 1.00, 95% CI 0.32 to 3.17 1 study, 76 women; Analysis 27.3).
No trials reported other secondary outcomes for this comparison.
Phenylephrine: different regimens
Phenylephrine infusion versus bolus
Primary outcome: maternal hypotension requiring pharmacological intervention
There was insufficient evidence to determine whether there was a difference between the groups (RR 1.40, 95% CI 0.50 to 3.92, 1 study, 60 women; Analysis 28.1).
Secondary outcomes
Maternal
-
Cardiac dysrhythmia
There was insufficient evidence to determine whether there was a difference between the groups in rates of bradycardia (RR 1.22, 95% CI 0.59 to 2.51, 1 study, 60 women; Analysis 28.2).
-
Nausea and/or vomiting
There was insufficient evidence to determine whether there was a difference between the groups in rates of nausea or vomiting (RR 0.45, 95% CI 0.18 to 1.15, 1 study, 60 women; Analysis 28.3).
Neonatal
-
Apgar scores of less than 8 at five minutes
One study reported this outcome (Doherty 2012, 60 babies). No events occurred in either arm (Analysis 28.4).
No trials reported other secondary outcomes for this comparison.
Phenylephrine: lower dose versus higher dose
Primary outcome: maternal hypotension requiring pharmacological intervention
When comparing 50 μg/mL phenylephrine versus 100 μg/mL phenylephrine used as an infusion starting at 60mL/h, rates of hypotension were higher in the lower dose group (RR 8.17, 95% CI 1.04 to 64.30, 1 study, 117 women; Analysis 29.1).
Secondary outcomes
Maternal
-
Hypertension requiring intervention
When comparing crystalloid plus 50 μg/mL versus 100 μg/mL phenylephrine, there was no conclusive evidence of a difference between the groups (RR 0.23, 95% CI 0.05 to 1.02, 1 study, 117 women; Analysis 29.2).
-
Cardiac dysrhythmia
When comparing crystalloid plus 50 μg/mL versus 100 μg/mL phenylephrine, fewer episodes of bradycardia occurred in the lower dose group (RR 0.11, 95% CI 0.01 to 0.80, 1 study, 117 women; Analysis 29.3).
-
Nausea and/or vomiting
When comparing crystalloid plus 50 μg/mL versus 100 μg/mL phenylephrine, there was insufficient evidence to determine whether there was a difference between the groups in rates of nausea or vomiting (RR 3.50, 95% CI 0.37 to 32.67, 1 study, 117 women; Analysis 29.4).
Neonatal
-
Acidosis
One study reported this outcome (Ansari 2011, 117 babies). No events occurred in either arm (Analysis 29.5).
-
Apgar scores of less than 7 or 8 at five minutes
One study reported this outcome (Ansari 2011, 117 babies). No events occurred in either arm (Analysis 29.6).
No trials reported other secondary outcomes for this comparison.
Glycopyrrolate versus control
Primary outcome: maternal hypotension requiring pharmacological intervention
There was insufficient evidence to determine whether there was a difference between the groups (average RR 0.63, 95% CI 0.21 to 1.91, 2 studies, 142 women; Analysis 30.1).
Secondary outcomes
Maternal
-
Hypertension requiring intervention
Rates of hypertension were higher in the glycopyrrolate group (RR 2.67, 95% CI 1.31 to 5.43, 1 study, 93 women; Analysis 30.2).
-
Cardiac dysrhythmia
There was insufficient evidence to determine whether there was a difference between the groups in rates of bradycardia (RR 0.21, 95% CI 0.01 to 4.32, 1 study, 93 women; Analysis 30.3).
-
Nausea and/or vomiting
There was insufficient evidence to determine whether there was a difference between the groups in rates of nausea or vomiting (RR 2.49, 95% CI 0.69 to 9.04, 1 study, 93 women), or rates of nausea alone (0.61, 95% CI 0.36 to 1.06, 1 study, 49 women) or vomiting alone (RR 0.52, 95% CI 0.10 to 2.59, 1 study, 49 women; Analysis 30.4).
Neonatal
-
Apgar scores of less than 7 or 8 at five minutes
Two studies reported this outcome (Ngan Kee 2013a, Ure 1999, 142 babies). No events occurred in either study (Analysis 30.5).
No trials reported other secondary outcomes for this comparison.
Ondansetron versus control
See summary of findings Table 5.
Primary outcome: maternal hypotension requiring pharmacological intervention
There was a lower incidence of hypotension in the ondansetron group (average RR 0.67, 95% CI 0.54 to 0.83, 8 studies, 740 women, I² = 35%, Tau² = 0.05,low‐quality evidence).
The studies compared doses of 2 mg, 4 mg, 6 mg, and 8 mg ondansetron versus control. The test for subgroup differences indicated a significant difference between the subgroups (Chi² = 11.97, df = 3 (P = 0.008), I² = 74.9%). The treatment effect was strongest in the 4 mg subgroup, and when we excluded this subgroup from the analysis there was no longer any indication of a difference between the subgroups (Chi² = 2.07, df = 2 (P = 0.36), I² = 3.3%). The possible explanation for the effectiveness of this lower dose compared with higher doses is unclear (Analysis 31.1).
Secondary outcomes
Maternal
-
Cardiac dysrhythmia
There was a lower rate of bradycardia in the ondansetron group (average RR 0.49, 95% CI 0.28 to 0.87, 8 studies, 740 women,low‐quality evidence; Analysis 31.2).
-
Nausea and/or vomiting
There was a lower rate of nausea or vomiting in the ondansetron group (average RR 0.35, 95% CI 0.24 to 0.51, 7 studies, 653 women, low‐quality evidence; Analysis 31.3).
-
Anaphylaxis
One study measured this outcome (Wang 2014a, 150 women). There were no events in either arm (Analysis 31.4).
Neonatal
-
Acidosis
Two studies measured this outcome. There was insufficient evidence to determine whether there was any difference between the groups (average RR 0.48, 95% CI 0.05 to 5.09, 2 studies, 134 babies, low‐quality evidence). There were no events in one of the studies (Analysis 31.6).
-
Apgar scores of less than 8 at five minutes
Three studies measured this outcome (Wang 2014a, Wang 2014b, Marciniak 2015, 284 babies, low‐quality evidence). There were no events in any of the studies (Analysis 31.5).
No trials reported other secondary outcomes for this comparison.
Ondansetron versus ephedrine
Primary outcome: maternal hypotension requiring pharmacological intervention
There was insufficient evidence to determine whether there was a difference between the groups (RR 1.07, 95% CI 0.76 to 1.49, 1 study, 112 women; Analysis 32.1).
Secondary outcomes
Maternal
-
Cardiac dysrhythmia
There was no clear evidence of a difference between the groups in the rate of bradycardia (RR 3.00, 95% CI 0.12 to 72.10, 1 study, 112 women; Analysis 32.2).
-
Nausea and/or vomiting
There was insufficient evidence to determine whether there was a difference between the groups in the rate of nausea or vomiting (RR 0.38, 95% CI 0.10 to 1.34, 1 study, 112 women; Analysis 32.3).
No trials reported other secondary outcomes for this comparison.
Granisetron versus control
Primary outcome: maternal hypotension requiring pharmacological intervention
One study, Eldaba 2015, investigated this comparison and found rates of hypotension were lower with granisetron than with saline control (RR 0.05, 95% CI 0.02 to 0.14, 1 study, 200 women; Analysis 33.1).
Secondary outcomes
No studies reported secondary outcomes for this comparison.
Sensitivity analysis
Sensitivity analysis was not possible under this comparison.
Ketamine versus saline
Primary outcome: maternal hypotension requiring pharmacological intervention
There was no conclusive evidence of a difference between the groups (RR 0.79, 95% CI 0.62 to 1.01, 1 study, 105 women). The study compared two different doses of IV ketamine (0.25 mg/kg and 0.5 mg/kg) versus saline.There was no evidence of a difference between the effects of the two doses (test for subgroup differences: Chi² = 0.25, df = 1 (P = 0.62), I² = 0%; Analysis 34.1).
Secondary outcomes
Maternal
-
Nausea and/or vomiting
There was insufficient evidence to determine whether there was a difference between the groups in rates of nausea or vomiting (RR 0.79, 95% CI 0.50 to 1.25, 1 study, 105 women; Analysis 34.2).
Neonatal
-
Apgar scores of less than 8 at five minutes
One study reported this outcome (Gulhas 2012, 105 women). No events occurred in either arm (Analysis 34.3).
No trials reported other secondary outcomes for this comparison.
Sensitivity analysis
Sensitivity analysis was not possible under this comparison.
Angiotensin versus control
Primary outcome: maternal hypotension requiring pharmacological intervention
There was insufficient evidence to determine whether there was a difference between the groups (RR 0.09, 95% CI 0.01 to 1.45, 1 study, 20 women; Analysis 35.1).
Secondary outcomes
Maternal
-
Nausea and/or vomiting
There was insufficient evidence to determine whether there was a difference between the groups (RR 0.20, 95% CI 0.01 to 3.70, 1 study, 20 women; Analysis 35.2).
Neonatal
-
Acidosis
One study reported this comparison (Ramin 1994, 20 babies). There were no events in either arm (Analysis 35.3).
No trials reported other secondary outcomes for this comparison.
Dopamine versus control
Primary outcome: maternal hypotension requiring pharmacological intervention
One small study, Yokoyama 1997, found that dopamine was more effective than control in preventing hypotension (RR 0.05, 95% CI 0.00 to 0.75, 1 study, 30 women; Analysis 36.1).
Secondary outcomes
Neonatal
-
Apgar scores of less than 8 at five minutes
One study reported this outcome (Yokoyama 1997, 30 babies). There were no events in either arm (Analysis 36.2).
No trials reported other secondary outcomes for this comparison.
Summary: drugs
In preventing hypotension following spinal anaesthesia at caesarean section, we found the following.
-
Ephedrine is more effective than control, crystalloid, or colloid.
-
There were no differences in hypotension between ephedrine and phenylephrine, ephedrine and metaraminol, or ephedrine and angiotension. Higher doses or higher rates of ephedrine infusions result in no differences in hypotension. IV ephedrine is associated with less hypotension than oral ephedrine. There is no difference when comparing IM to IV ephedrine.
-
Phenylephrine is more effective than control in preventing hypotension. We found no difference in hypotension between phenylephrine and metaraminol.
-
We found no clear differences in the incidence of hypotension between glycopyrrolate and control.
-
We found no clear differences between ondansetron and control.
-
We found no clear differences in hypotension between angiotensin and control, or between ketamine and control.
-
Dopamine appears effective for preventing hypotension.
Physical methods
This group of interventions comprises comparisons corresponding to data analyses 37 to 49. Comparison 37 assesses lower limb compression versus control (summary of findings Table 6), while other comparisons assess different positioning techniques (see summary of findings Table 7 on comparison, 'walking versus lying'), and acupressure.
Lower limb compression versus control
See summary of findings Table 6.
Primary outcome: maternal hypotension requiring pharmacological intervention
Lower limb compression was more effective than control for preventing hypotension (average RR 0.61, 95% CI 0.47 to 0.78, 11 studies, 705 women, very low‐quality evidence; Analysis 37.1). There was substantial heterogeneity (I² = 65, Tau² = 0.10), which may be due to the different types of compression used (bandages, boots, or stockings). We did not perform a subgroup analysis here as we did not feel it would be meaningful. It also may have been due to differences in formulation and volume of IV fluids given. The asymmetrical funnel plot (Figure 5) may be due to small study effects or publication‐type bias.
Secondary outcomes
Maternal
-
Cardiac dysrhythmia
There was insufficient evidence to determine whether there was a difference between the groups in rates of bradycardia (RR 0.63, 95% CI 0.11 to 3.56, 1 study, 74 women, very low‐quality evidence; Analysis 37.2).
-
Nausea and/or vomiting
There was insufficient evidence to determine whether there was a difference between the groups in rates of nausea or vomiting (average RR 0.42 , 95% CI 0.14 to 1.27, 4 studies, 276 women, I² = 32%, very‐low quality evidence) or rates of nausea alone (RR 1.44, 95% CI 0.25 to 8.20, 1 study, 92 women). One study in 92 women measured rates of vomiting; there were no events in either arm (Sujata 2012; Analysis 37.3).
Neonatal
-
Apgar scores of less than 7 or 8 at five minutes
Three studies measured this outcome (Adsumelli 2003; Jorgensen 1996; Sood 1996, 130 babies, very low‐quality evidence). There were no events in any of the studies (Analysis 37.4).
No trials reported other secondary outcomes for this comparison.
Sensitivity analysis
Removing Bhagwanjee 1990 and Sutherland 2001 made little difference to the overall results in Analysis 37.1.
Comparisons of positioning
Wedge versus supine
Primary outcome: maternal hypotension requiring pharmacological intervention
There was insufficient evidence to determine whether there was a difference between the groups in the incidence of hypotension (RR 0.85, 95% CI 0.53 to 1.37, 1 study, 80 women; Analysis 38.1).
Secondary outcomes
Maternal
-
Nausea and/or vomiting
There was insufficient evidence to determine whether there was a difference between the groups in rates of nausea (RR 0.27, 95% CI 0.12 to 0.60, 1 study, 80 women) or vomiting (RR 0.11, 95% CI 0.01 to 2.00, 1 study, 80 women); see Analysis 38.2.
No trials reported other secondary outcomes for this comparison.
Sensitivity analysis
Sensitivity analysis was not possible under this comparison.
Head‐up tilt versus horizontal
Primary outcome: maternal hypotension requiring pharmacological intervention
There was insufficient evidence to determine whether there was a difference between the groups (RR 0.71, 95% CI 0.47 to 1.06, 1 study, 40 women; Analysis 39.1).
Secondary outcomes
Neonatal
-
Apgar scores of less than 8 at five minutes
One study measured this outcome (Loke 2002, 40 babies). There were no events in either arm (Analysis 39.2).
No trials reported other secondary outcomes for this comparison.
Head‐down tilt versus horizontal
Primary outcome: maternal hypotension requiring pharmacological intervention
There was insufficient evidence to determine whether there was a difference between the groups (RR 1.07, 95% CI 0.81 to 1.42, 1 study, 40 women; Analysis 40.1).
No studies reported secondary outcomes for this comparison.
Crawford's wedge versus manual uterine displacement
Primary outcome: maternal hypotension requiring pharmacological intervention
There was insufficient evidence to determine whether there was a difference between the groups (RR 0.92, 95% CI 0.57 to 1.49, 1 study, 40 women; Analysis 41.1).
Secondary outcomes
Neonatal
-
Apgar scores of less than 8 at five minutes
One study measured this outcome (Amaro 1998, 40 babies). There were no events in either arm (Analysis 41.2).
No trials reported other secondary outcomes for this comparison.
Supine versus sitting
Primary outcome: maternal hypotension requiring pharmacological intervention
There was insufficient evidence to determine whether there was a difference between the groups (RR 0.81, 95% CI 0.58 to 1.12, 1 study, 98 women; Analysis 42.1).
Secondary outcomes
Maternal
-
Nausea and/or vomiting
There was insufficient evidence to determine whether there was a difference between the groups in rates of nausea (RR 0.65, 95% CI 0.40 to 1.07, 1 study, 98 women) or vomiting (RR 0.38, 95% CI 0.02 to 9.01, 1 study, 98 women; Analysis 42.2).
Neonatal
-
Acidosis
One study measured this outcome (Kohler 2002, 98 babies). There were no events in either arm (Analysis 42.3).
-
Apgar scores of less than 7 or 8 at five minutes
One study measured this outcome (Kohler 2002, 98 women). There were no events in either arm (Analysis 42.4).
No trials reported other secondary outcomes for this comparison.
Walking versus lying
See summary of findings Table 7.
Primary outcome: maternal hypotension requiring pharmacological intervention
There was insufficient evidence to determine whether there was a difference between the groups (RR 0.71, 95% CI 0.41 to 1.09, 1 study, 37 women, very low‐quality evidence; Analysis 43.1).
No studies reported secondary outcomes for this comparison.
Sensitivity analysis
Sensitivity analysis was not possible under this comparison.
Lateral versus supine wedged position
Primary outcome: maternal hypotension requiring pharmacological intervention
There was no clear evidence of a difference between the groups (average RR 0.91, 95% CI 0.75 to 1.09, 2 studies, 126 women; Analysis 44.1).
Secondary outcomes
Maternal
-
Nausea and/or vomiting
There was insufficient evidence to determine whether there was a difference between the groups in rates of nausea (RR 0.81, 95% CI 0.45 to 1.48, 1 study, 86 women; Analysis 44.4).
-
Cardiac dysrhythmia
There was insufficient evidence to determine whether there was a difference between the groups (RR 0.50, 95% CI 0.05 to 5.08, 1 study, 40 women; Analysis 44.2.
Neonatal
-
Admission to neonatal intensive care unit
One study measured this outcome (Hartley 2001, 40 babies). There were no events in either arm (Analysis 44.3).
No trials reported other secondary outcomes for this comparison.
Left lateral versus left lateral tilt
Primary outcome: maternal hypotension requiring pharmacological intervention
There was insufficient evidence to determine whether there was a difference between the groups (RR 1.20, 95% CI 0.80 to 1.79, 1 study, 58 women; Analysis 45.1).
Secondary outcomes
Maternal
-
Cardiac dysrhythmia
There was no conclusive evidence of a difference between the groups in rates of bradycardia (RR 0.10, 95% CI 0.01 to 1.68, 1 study, 58 women; Analysis 45.2).
-
Nausea and/or vomiting
There was insufficient evidence to determine whether there was a difference between the groups in rates of nausea (RR 0.45, 95% CI 0.18 to 1.11, 1 study, 58 women) or vomiting (RR 0.15, 95% CI 0.01 to 2.83, 1 study, 58 women; Analysis 45.3).
No trials reported other secondary outcomes for this comparison.
Left lateral tilt versus left manual uterine displacement
Primary outcome: maternal hypotension requiring pharmacological intervention
Left uterine displacement was associated with a reduced rate of hypotension compared to left lateral tilt (RR 0.63, 95% CI 0.49 to 0.80, 1 study, 90 women; Analysis 46.1).
No studies reported other outcomes for this comparison.
Leg elevation versus control
Primary outcome: maternal hypotension requiring pharmacological intervention
There was insufficient evidence to determine whether there was a difference between the groups (RR 0.73, 95% CI 0.42 to 1.26, 1 study, 63 women; Analysis 47.1).
No other outcomes were reported for this comparison
Comparisons of acupressure
Acupressure versus placebo
Primary outcome: maternal hypotension requiring pharmacological intervention
There was insufficient evidence to determine whether there was a difference between the groups (RR 0.84, 95% CI 0.58 to 1.22, 1 study, 50 women; Analysis 48.1).
Secondary outcomes
Maternal
-
Nausea and/or vomiting
Rates of nausea were lower in the acupressure group than in the placebo group (RR 0.32, 95% CI 0.15 to 0.66, 1 study, 50 women). There was no clear evidence of a difference between the groups in rates of vomiting (RR 0.50, 95% CI 0.14 to 1.78, 1 study, 50 women). See Analysis 48.2.
-
Apgar scores of less than 7 at five minutes
One study measured this outcome (Stein 1997, 50 babies). There were no events in either arm (Analysis 48.3).
No trials reported other secondary outcomes for this comparison.
Acupressure versus metoclopramide
Primary outcome: maternal hypotension requiring pharmacological intervention
There was insufficient evidence to determine whether there was a difference between the groups (RR 0.94, 95% CI 0.63 to 1.40, 1 study, 50 women; Analysis 49.1).
Secondary outcomes
Maternal
-
Nausea and/or vomiting
There was insufficient evidence to determine whether there was a difference between the groups in rates of nausea (RR 1.50, 95% CI 0.48 to 4.68, 1 study, 50 women) or vomiting (RR 3.00, 95% CI 0.33 to 26.92, 1 study, 50 women; Analysis 49.2).
Neonatal
-
Apgar scores of less than 7 or 8 at five minutes
One study measured Apgar scores of less than 7 at five minutes (Stein 1997, 50 babies). There were no events in either arm (Analysis 49.3).
No trials reported other secondary outcomes for this comparison.
Summary: physical methods
In preventing hypotension following spinal anaesthesia at caesarean section, we found the following.
-
Lower leg compression is more effective than control (i.e. no leg compression) for preventing hypotension, although different methods of compression appear to vary in their effectiveness.
-
Manual left uterine displacement while supine is more effective than left lateral tilt of the bed for preventing hypotension.
-
In other comparisons between different physical methods such as position, wedging or leg elevation, we found none to be effective, but these trials were often small and may benefit from further research. Similarly, walking into the operating theatre as opposed to lying on the barouche is a non‐invasive, safe, and simple intervention and may also be worth further investigating in a larger study.
-
There was insufficient evidence to show whether acupressure is more effective than placebo or metoclopramide.
Discusión
Esta revisión es la más exhaustiva hasta la fecha que examina los efectos de las intervenciones utilizadas para prevenir la hipotensión posterior a la anestesia espinal para la cesárea.
Resumen de los resultados principales
Aunque algunas intervenciones evaluadas en esta revisión (como coloides, efedrina o compresión de las piernas) pueden reducir la incidencia de hipotensión, no se encontró ninguna que evite la necesidad de tratar la hipotensión materna durante la anestesia espinal para la cesárea. Es probable que una o más intervenciones utilizadas juntas, como habitualmente ocurre en la práctica clínica, sean más efectivas.
Los hallazgos clave incluyen los siguientes.
Líquidos
-
Los cristaloides solos pueden ser insuficientes para prevenir la hipotensión.
-
Los cristaloides pueden ser más efectivos cuando se administran en un volumen mayor como una cocarga rápida.
-
Los coloides pueden ser más efectivos que los cristaloides.
Fármacos
-
Los vasopresores como la efedrina, la fenilefrina y el metaraminol parecen ser efectivos y pueden ser más efectivos que los líquidos solos o el control.
-
El ondansetrón puede ser más efectivo que el control para prevenir la hipotensión.
-
No hay evidencia clara para mostrar que el glicopirrolato, la ketamina o la angiotensina sean efectivos para prevenir la hipotensión.
Métodos físicos
-
La compresión de las piernas es más efectiva que el control para prevenir la hipotensión.
-
El desplazamiento manual uterino mientras la paciente está en posición supina puede ser más efectivo que la inclinación lateral izquierda.
-
No se encontró que otros métodos físicos como la posición, la colocación de soportes en forma de cuñas o la elevación de las piernas fueran efectivos, pero estos ensayos a menudo fueron pequeños y se pueden beneficiar de la realización de estudios de investigación adicionales.
La mortalidad y la morbilidad grave en esta población son poco frecuentes (Hibbard 1996). Los ensayos revisados no informan eventos adversos graves como anafilaxia, hemorragia cerebral o muerte materna. No se observaron diferencias en la incidencia de acidosis fetal cuando se comparó efedrina con fenilefrina para prevenir la hipotensión durante la anestesia espinal, aunque Ngan Kee 2006 ha indicado un mayor riesgo al utilizar efedrina para tratar, en lugar de prevenir, la hipotensión.
Compleción y aplicabilidad general de las pruebas
Es muy probable que esta revisión represente los resultados de los estudios de investigación clave hasta la fecha y de que sea aplicable a la práctica clínica. Se indica cierta precaución acerca de la magnitud de los resultados de algunas comparaciones de las intervenciones debido a que muchas de estas comparaciones solamente están apoyadas por un estudio único o por varios estudios pequeños de calidad poco clara. A pesar del hallazgo de que los coloides fueron más efectivos que los cristaloides para reducir la hipotensión materna después de la anestesia espinal, los ensayos incluidos fueron demasiado pequeños para mostrar los riesgos bien conocidos y potencialmente graves que representa la administración de coloides.
Los resultados de esta revisión serán menos pertinentes para las pacientes con preeclampsia, en las que sería menos probable que se necesiten medidas profilácticas o procedimientos de urgencia en comparación con las pacientes normotensas (Clark 2005). La mayoría de los estudios de esta revisión excluyeron a las pacientes con hipertensión preexistente.
Una de las limitaciones principales de una revisión de este tipo es la definición de los resultados. Hubo múltiples definiciones diferentes de hipotensión entre los estudios (Tabla 1). En esta revisión se utilizó la definición de hipotensión proporcionada por los autores de los estudios para agrupar estos datos en los metanálisis.
Todos los estudios investigaron a pacientes que tuvieron un parto por cesárea electiva, excepto un estudio que incluyó pacientes sometidas a cesárea de urgencia.
Como se pudo observar en la sección de Resultados y en los metanálisis, se encontró un gran número de estudios pequeños con poca o ninguna información para permitir una evaluación suficiente del "Riesgo de sesgo". Muchos estudios no informaron detalles acerca del método de asignación al azar, la ocultación de la asignación y el cegamiento, lo que limita la capacidad para establecer conclusiones claras. Además, varios resultados agrupados mostraron niveles altos de heterogeneidad entre los estudios, lo que se debe con mayor probabilidad a las diferencias en el diseño de los estudios, las intervenciones, las técnicas anestésicas y las variaciones en la definición de hipotensión.
Se señala que hay varios estudios en espera de evaluación y se reconoce que habrá un tiempo de desfase al evaluar e incorporar estos estudios en las revisiones futuras. Sin embargo, parece poco probable que estos estudios repercutan en los resultados clave.
Calidad de la evidencia
Las evaluaciones GRADE de los resultados clave (incidencia de hipotensión/hipertensión materna que requiera intervención; incidencia de bradicardia materna; incidencia de náuseas o vómitos maternos; acidosis neonatal definida mediante sangre del cordón o neonatal con un pH menor de 7,2; puntuación de Apgar < 8 a los cinco minutos; ingreso a la unidad de cuidados intensivos neonatales) mostraron una calidad baja o muy baja. Se seleccionaron seis comparaciones clave para las evaluaciones GRADE de la calidad porque representan las comparaciones clínicamente más relevantes de la revisión actualizada (ver Resumen de los hallazgos para la comparación principal; Resumen de los hallazgos 2; Resumen de los hallazgos 3; Resumen de los hallazgos 4; Resumen de los hallazgos 5; Resumen de los hallazgos 6; Resumen de los hallazgos 7). Muchos estudios fueron pequeños y la falta de detalles en los informes dio lugar a que se consideraran con riesgo de sesgo incierto en el método de asignación al azar, la ocultación de la asignación y el cegamiento. Diecisiete estudios tuvieron uno o más factores designados como causa de alto riesgo de sesgo, pero los análisis de sensibilidad en los que se retiraron 12 estudios cuando fue posible no cambiaron los resultados (Bhagwanjee 1990; Bottiger 2010; Cardoso 2004a; Carvalho 2009; Dahlgren 2005; Dyer 2004; Magalhaes 2009; Mercier 2014; Muzlifah 2009; Romdhani 2014; Sutherland 2001; Ueyama 1999). Los cinco estudios restantes fueron estudios únicos en los que no fue posible realizar análisis de sensibilidad (Calvache 2011; Cyna 2010; Eldaba 2015; Gulhas 2012; Pouliou 2006). Al igual que para el diseño de los estudios, la calidad de la evidencia se disminuyó por indireccionalidad (porque la mayoría de los estudios solamente incluyeron pacientes sometidas a cesárea electiva), inconsistencia e imprecisión.
Se observó heterogeneidad significativa en algunas comparaciones, a saber cristaloides versus coloides, coloides a diferentes volúmenes, efedrina versus control, efedrina versus cristaloides, efedrina versus fenilefrina. El análisis de sensibilidad mostró cambios mínimos en los resultados generales.
Sesgos potenciales en el proceso de revisión
Existen varias fuentes potenciales de sesgo en este proceso de revisión.
En primer lugar, hubo varias diferencias entre las versiones publicadas anteriormente y esta versión, incluyendo:
-
exclusión específica de los ensayos cuasialeatorios, grupales y cruzados; y
-
exclusión específica de los estudios que investigaron la prevención de la hipotensión con técnicas combinadas espinales‐epidurales.
Debido al gran número de ensayos controlados aleatorios que investigaron el objetivo central de la revisión (evaluar los efectos de las intervenciones profilácticas para la hipotensión después de la anestesia espinal para la cesárea), los autores acordaron que la incorporación de estos ensayos en esta revisión contribuiría a disminuir la calidad y a hacer que la revisión fuera menos consistente.
En segundo lugar, uno de los autores de la revisión (AMC) es el autor principal de un estudio incluido (Cyna 2010). Esta posible fuente de sesgo se redujo al mínimo al asegurar que los autores de la revisión que no estaban relacionados con este estudio (RSL y CC) realizaran la extracción de los datos.
En tercer lugar, hubo dos estudios que se consideraron con alto riesgo porque las participantes recibieron dosis variables de anestésicos locales para el bloqueo espinal (Alahuhta 1992; Mathru 1980). Además, hubo dos estudios que se consideraron con alto riesgo de sesgo porque no estuvo claro si la técnica y la dosis del anestésico espinal estaban estandarizadas entre los grupos de estudio (Ozkan 2004; Wilson 1998). Fue poco probable que con la asignación al azar esta fuente de sesgo tenga un efecto importante sobre los resultados de la revisión.
Finalmente, para la presente revisión se excluyó específicamente la administración de bombas de infusión programadas con algoritmos para tratar la hipotensión. Fue difícil determinar si este enfoque respondía a la prevención o al tratamiento de la hipotensión, pero la discusión entre los autores de la revisión produjo un consenso de que fue este último. Las revisiones futuras pueden considerar si puede ser apropiado incluir los resultados de estas otras técnicas controladas por computadora.
Acuerdos y desacuerdos con otros estudios o revisiones
Los resultados son consistentes con un metanálisis que encontró que el ondansetrón profiláctico reduce la incidencia de hipotensión inducida por anestesia espinal (Gao 2015). Este metanálisis también indicó que debido a la gran heterogeneidad grande y al pequeño tamaño de la muestra, se deben realizar ensayos aleatorios adicionales grandes y de alta calidad que investiguen la eficacia del ondansetrón para prevenir la hipotensión en este contexto.
Los resultados también son consistentes con una revisión sistemática que encontró evidencia limitada para apoyar o refutar claramente el valor de la posición materna, que incluye el uso de mesas inclinadas y soportes en forma de cuñas (Cluver 2013). También encontraron que el desplazamiento manual del útero puede ser mejor que la inclinación lateral izquierda, pero se necesitan estudios más grandes para confirmar este resultado, una conclusión consistente con la de la presente revisión.
Finalmente, una revisión reciente determinó los efectos de los coloides y los cristaloides en la incidencia de hipotensión inducida por la anestesia espinal en la cesárea electiva y también indicó que la administración de coloides redujo la incidencia de hipotensión asociada con la anestesia espinal en la cesárea electiva en comparación con el uso de cristaloides (Rippoles 2015). Sin embargo, estos autores no mencionan los riesgos potenciales graves que puede representar la administración de coloides ni los costos adicionales implicados. De hecho, una revisión Cochrane reciente no encontró evidencia de que la reanimación con coloides reduzca el riesgo de muerte en comparación con la reanimación con cristaloides en los pacientes con traumatismo, quemaduras o después de una cirugía. Los autores de la revisión indican que como los coloides no fueron más efectivos para prevenir la mortalidad que los cristaloides y fueron considerablemente más costosos, es difícil justificar su uso continuado en la práctica clínica (Perel 2013).
Risk of bias graph: review authors' judgements about each risk of bias item presented as percentages across all included studies.
Risk of bias summary: review authors' judgements about each risk of bias item for each included study.
Funnel plot of comparison: 7 Colloid vs crystalloid, outcome: 7.1 Women with hypotension requiring intervention.
Funnel plot of comparison: 13 Ephedrine vs control, outcome: 13.1 Women with hypotension requiring intervention.
Funnel plot of comparison: 47 Lower limb compression vs control, outcome: 47.1 Women with hypotension requiring intervention.

Comparison 1 Crystalloid vs control, Outcome 1 Women with hypotension requiring intervention.

Comparison 1 Crystalloid vs control, Outcome 2 Nausea and/or vomiting.

Comparison 1 Crystalloid vs control, Outcome 3 Anaphylaxis.
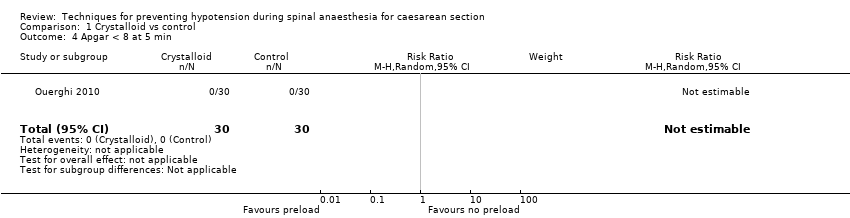
Comparison 1 Crystalloid vs control, Outcome 4 Apgar < 8 at 5 min.

Comparison 2 Crystalloid: rapid infusion vs slow infusion, Outcome 1 Women with hypotension requiring intervention.

Comparison 3 Crystalloid: high vs low preload volume, Outcome 1 Women with hypotension requiring intervention.

Comparison 3 Crystalloid: high vs low preload volume, Outcome 2 Nausea and/or vomiting.

Comparison 3 Crystalloid: high vs low preload volume, Outcome 3 Apgar < 8 at 5 min.
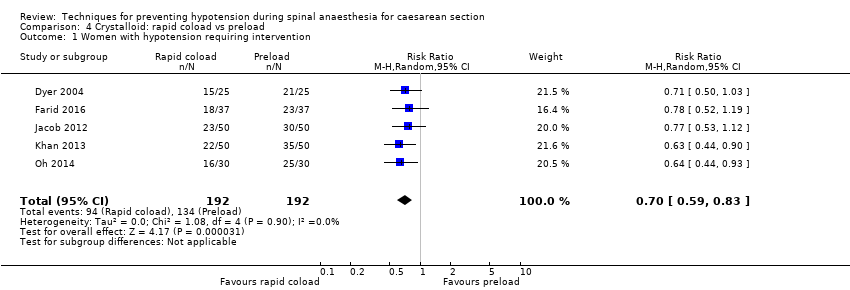
Comparison 4 Crystalloid: rapid coload vs preload, Outcome 1 Women with hypotension requiring intervention.

Comparison 4 Crystalloid: rapid coload vs preload, Outcome 2 Hypertension requiring intervention.

Comparison 4 Crystalloid: rapid coload vs preload, Outcome 3 Women with bradycardia.
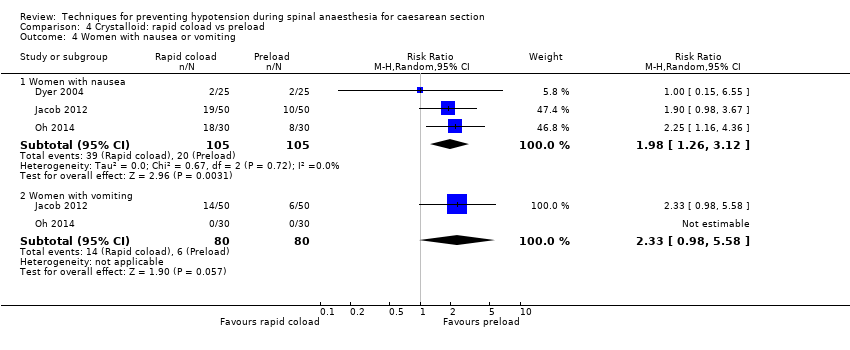
Comparison 4 Crystalloid: rapid coload vs preload, Outcome 4 Women with nausea or vomiting.

Comparison 4 Crystalloid: rapid coload vs preload, Outcome 5 Neonates with acidosis (pH < 7.2).

Comparison 4 Crystalloid: rapid coload vs preload, Outcome 6 Apgar < 8 at 5 min.
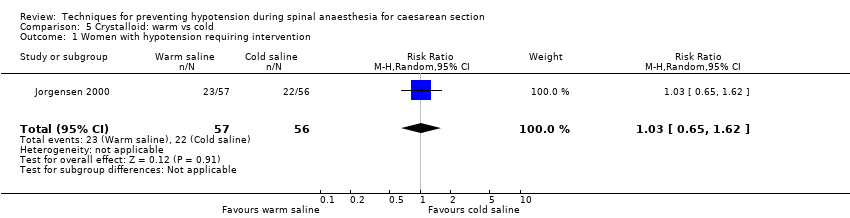
Comparison 5 Crystalloid: warm vs cold, Outcome 1 Women with hypotension requiring intervention.
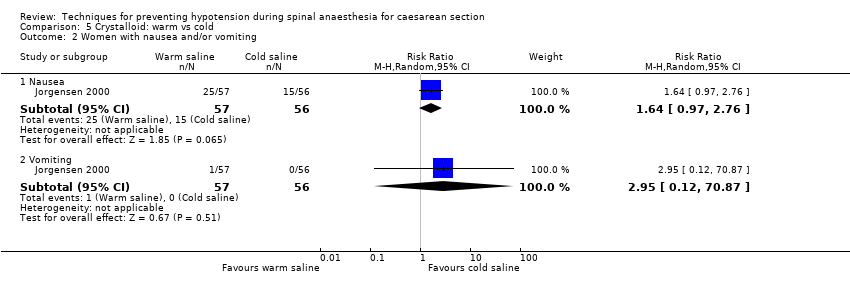
Comparison 5 Crystalloid: warm vs cold, Outcome 2 Women with nausea and/or vomiting.
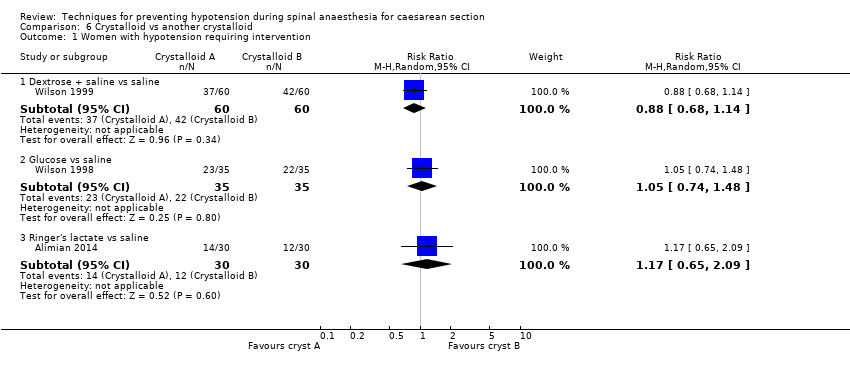
Comparison 6 Crystalloid vs another crystalloid, Outcome 1 Women with hypotension requiring intervention.
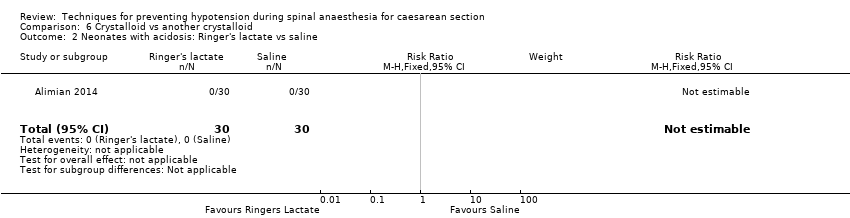
Comparison 6 Crystalloid vs another crystalloid, Outcome 2 Neonates with acidosis: Ringer's lactate vs saline.
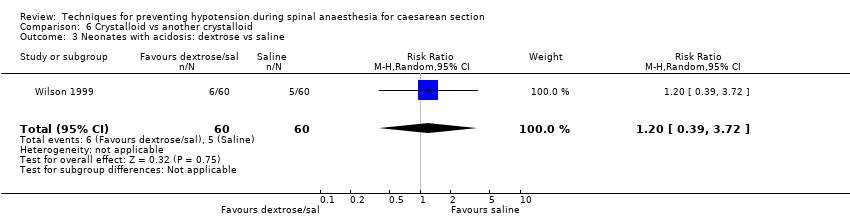
Comparison 6 Crystalloid vs another crystalloid, Outcome 3 Neonates with acidosis: dextrose vs saline.

Comparison 6 Crystalloid vs another crystalloid, Outcome 4 Neonates with Apgar score < 7 at 5 min.

Comparison 6 Crystalloid vs another crystalloid, Outcome 5 Neonates with Apgar score < 8 at 5 min.
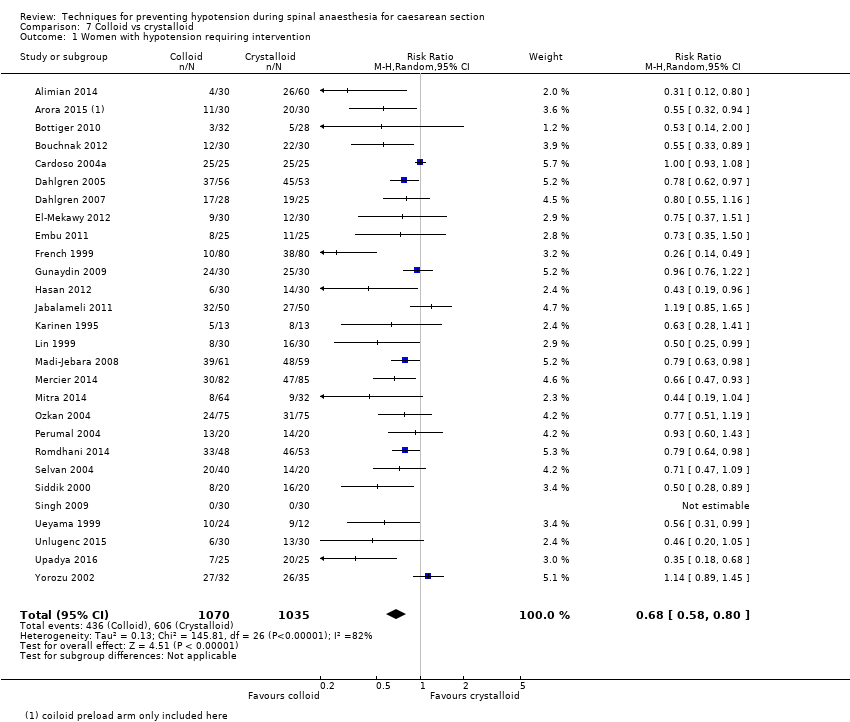
Comparison 7 Colloid vs crystalloid, Outcome 1 Women with hypotension requiring intervention.

Comparison 7 Colloid vs crystalloid, Outcome 2 Women with hypertension requiring intervention.
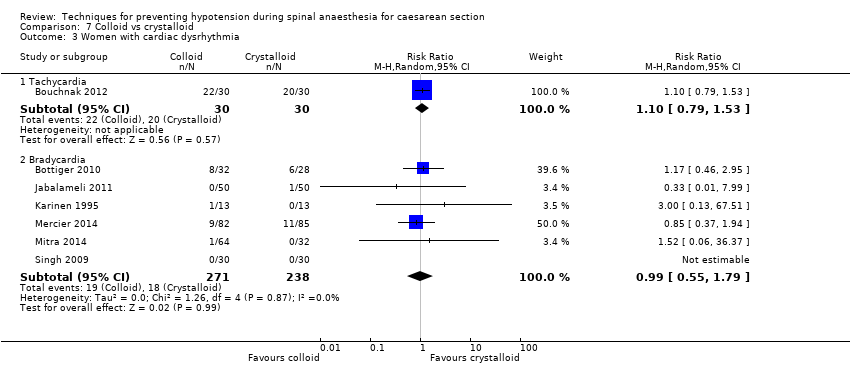
Comparison 7 Colloid vs crystalloid, Outcome 3 Women with cardiac dysrhythmia.
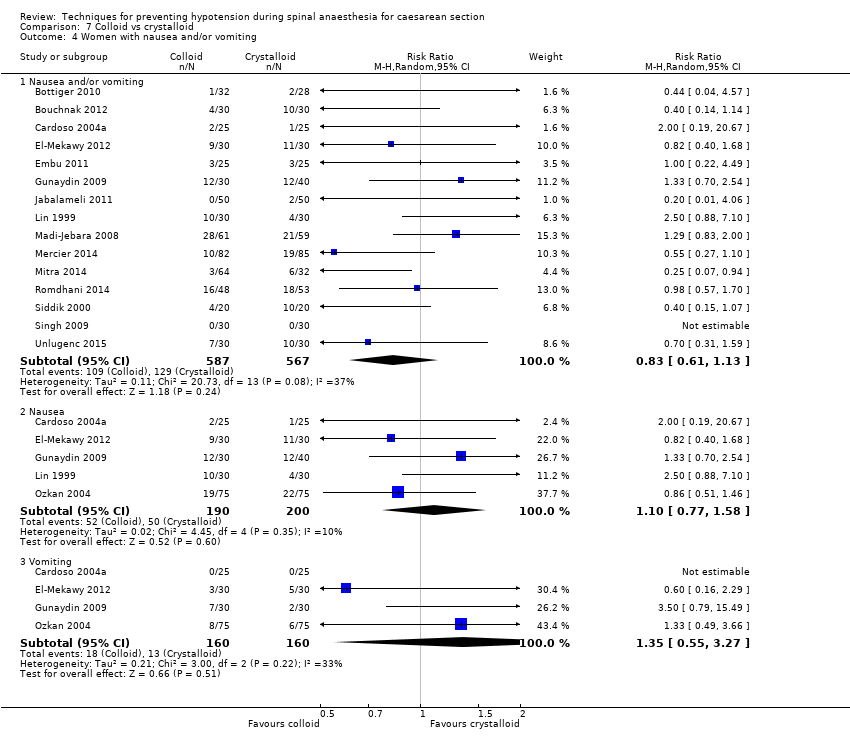
Comparison 7 Colloid vs crystalloid, Outcome 4 Women with nausea and/or vomiting.

Comparison 7 Colloid vs crystalloid, Outcome 5 Neonates with acidosis (pH < 7.2).
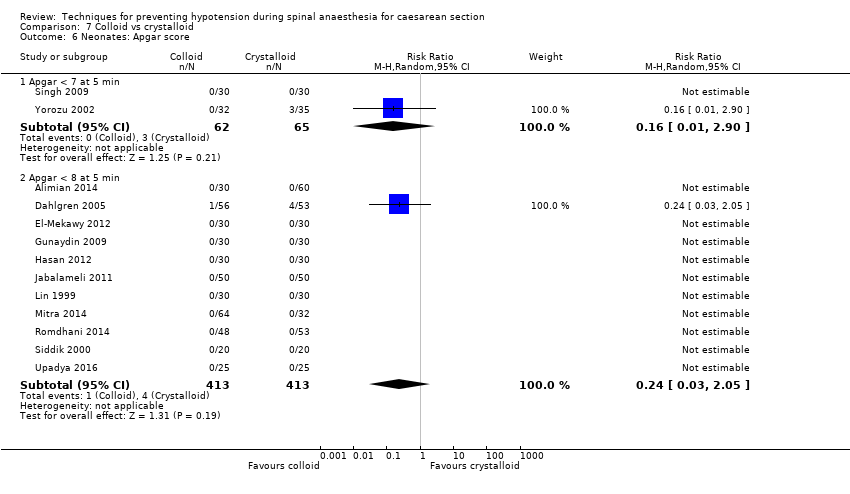
Comparison 7 Colloid vs crystalloid, Outcome 6 Neonates: Apgar score.

Comparison 8 Colloid vs control, Outcome 1 Women with hypotension requiring intervention.

Comparison 8 Colloid vs control, Outcome 2 Women with bradycardia.
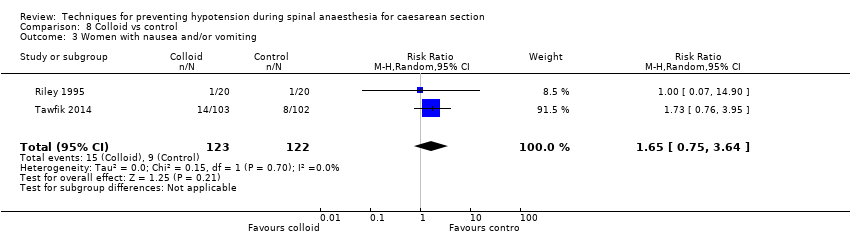
Comparison 8 Colloid vs control, Outcome 3 Women with nausea and/or vomiting.
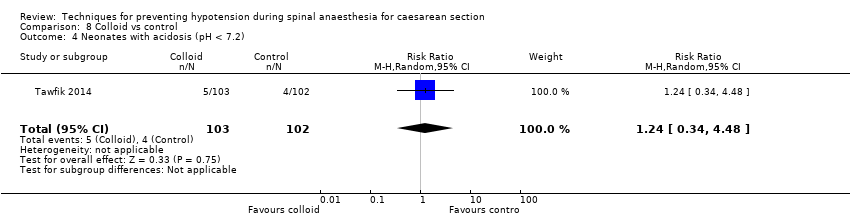
Comparison 8 Colloid vs control, Outcome 4 Neonates with acidosis (pH < 7.2).
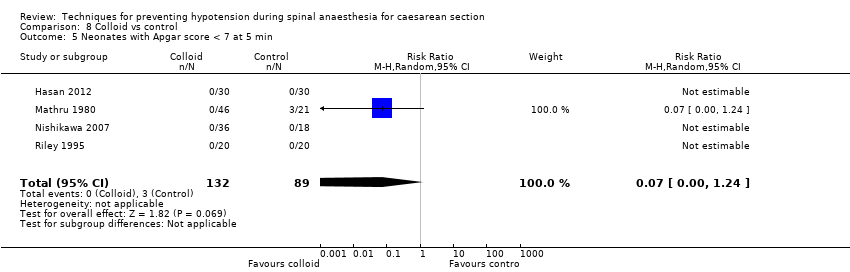
Comparison 8 Colloid vs control, Outcome 5 Neonates with Apgar score < 7 at 5 min.

Comparison 8 Colloid vs control, Outcome 6 Neonatal Apgar < 8 at 5 min.

Comparison 9 Colloid: different volumes, Outcome 1 Women with hypotension requiring intervention.

Comparison 9 Colloid: different volumes, Outcome 2 Apgar < 9 at 5 min.

Comparison 10 Colloid preload vs colloid coload, Outcome 1 Women with hypotension requiring intervention.
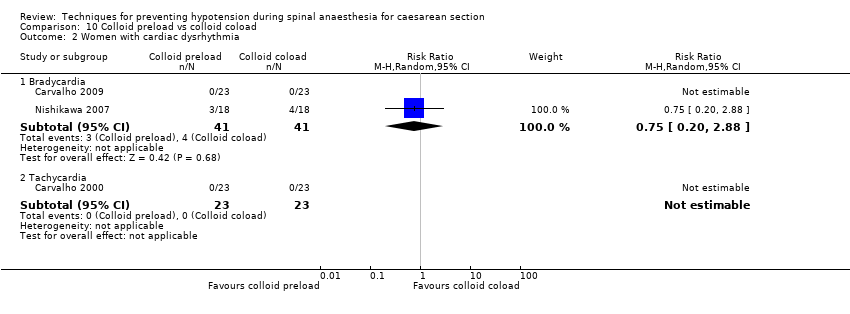
Comparison 10 Colloid preload vs colloid coload, Outcome 2 Women with cardiac dysrhythmia.

Comparison 10 Colloid preload vs colloid coload, Outcome 3 Women with nausea and/or vomiting.
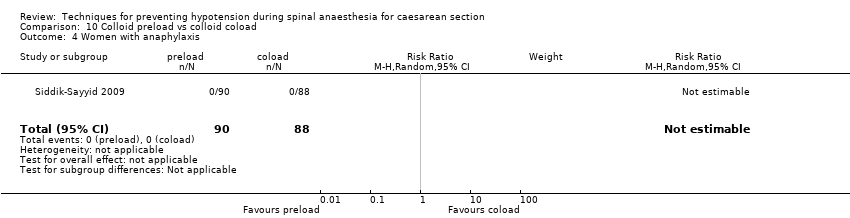
Comparison 10 Colloid preload vs colloid coload, Outcome 4 Women with anaphylaxis.
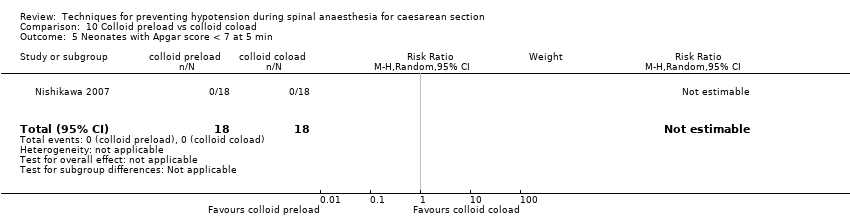
Comparison 10 Colloid preload vs colloid coload, Outcome 5 Neonates with Apgar score < 7 at 5 min.
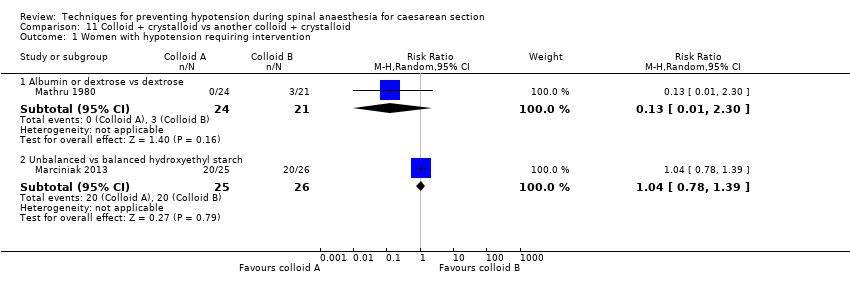
Comparison 11 Colloid + crystalloid vs another colloid + crystalloid, Outcome 1 Women with hypotension requiring intervention.

Comparison 11 Colloid + crystalloid vs another colloid + crystalloid, Outcome 2 Neonates: Apgar score < 7.

Comparison 11 Colloid + crystalloid vs another colloid + crystalloid, Outcome 3 Neonates with Apgar score < 8 at 5 min.

Comparison 12 Ephedrine vs control, Outcome 1 Women with hypotension requiring intervention.
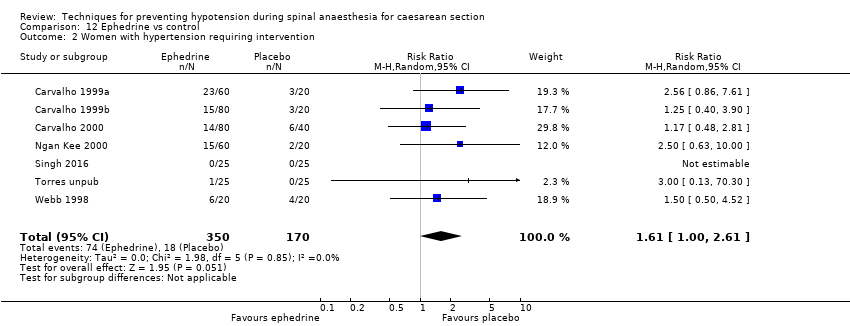
Comparison 12 Ephedrine vs control, Outcome 2 Women with hypertension requiring intervention.

Comparison 12 Ephedrine vs control, Outcome 3 Women with cardiac arrhythmia.

Comparison 12 Ephedrine vs control, Outcome 4 Women with nausea and/or vomiting.

Comparison 12 Ephedrine vs control, Outcome 5 Neonates with acidosis (pH < 7.2).

Comparison 12 Ephedrine vs control, Outcome 6 Neonates: Apgar score.

Comparison 13 Ephedrine vs crystalloid, Outcome 1 Women with hypotension requiring intervention.

Comparison 13 Ephedrine vs crystalloid, Outcome 2 Women with hypertension requiring intervention.

Comparison 13 Ephedrine vs crystalloid, Outcome 3 Women with bradycardia.
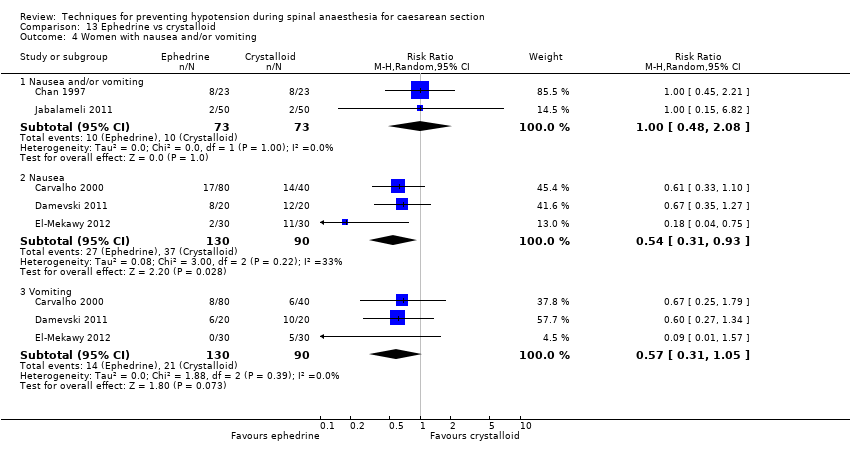
Comparison 13 Ephedrine vs crystalloid, Outcome 4 Women with nausea and/or vomiting.
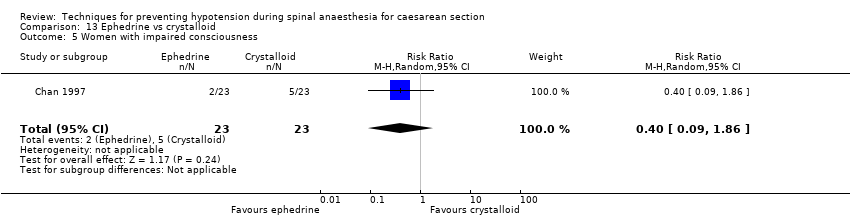
Comparison 13 Ephedrine vs crystalloid, Outcome 5 Women with impaired consciousness.

Comparison 13 Ephedrine vs crystalloid, Outcome 6 Neonates with acidosis (pH < 7.2).

Comparison 13 Ephedrine vs crystalloid, Outcome 7 Neonatal Apgar score.

Comparison 14 Ephedrine + crystalloid vs colloid, Outcome 1 Women with hypotension requiring intervention.
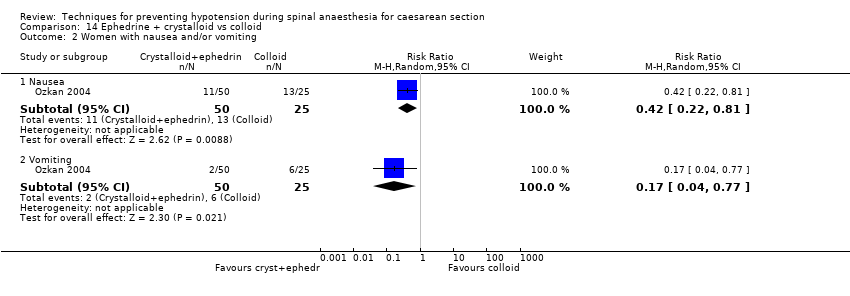
Comparison 14 Ephedrine + crystalloid vs colloid, Outcome 2 Women with nausea and/or vomiting.
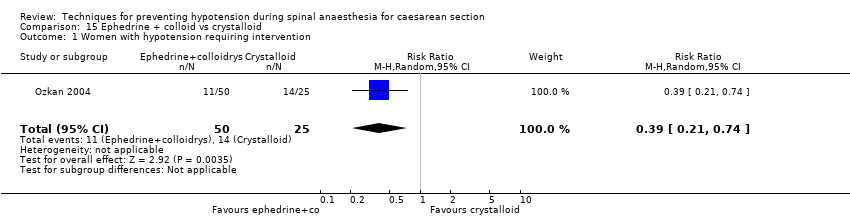
Comparison 15 Ephedrine + colloid vs crystalloid, Outcome 1 Women with hypotension requiring intervention.
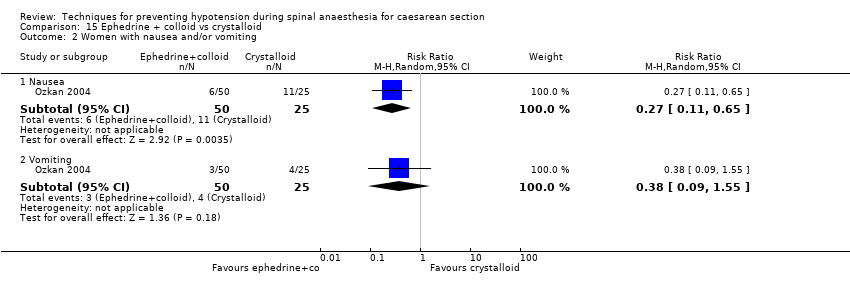
Comparison 15 Ephedrine + colloid vs crystalloid, Outcome 2 Women with nausea and/or vomiting.

Comparison 16 Ephedrine vs phenylephrine, Outcome 1 Women with hypotension requiring intervention.

Comparison 16 Ephedrine vs phenylephrine, Outcome 2 Women with hypertension requiring intervention.

Comparison 16 Ephedrine vs phenylephrine, Outcome 3 Cardiac dysrhythmia.

Comparison 16 Ephedrine vs phenylephrine, Outcome 4 Women with nausea and/or vomiting.
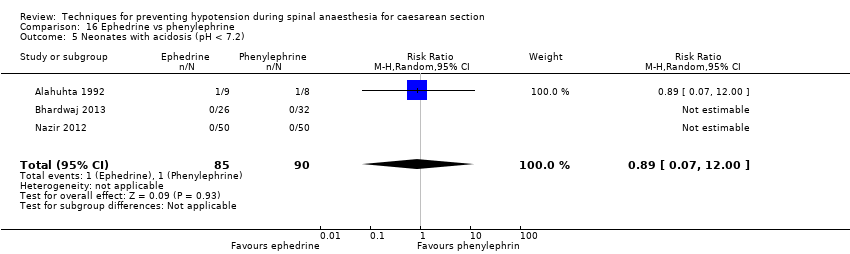
Comparison 16 Ephedrine vs phenylephrine, Outcome 5 Neonates with acidosis (pH < 7.2).

Comparison 16 Ephedrine vs phenylephrine, Outcome 6 Neonates with Apgar score < 8 at 5 min.

Comparison 17 Ephedrine vs angiotensin, Outcome 1 Women with hypotension requiring intervention.

Comparison 17 Ephedrine vs angiotensin, Outcome 2 Women with nausea and/or vomiting.

Comparison 17 Ephedrine vs angiotensin, Outcome 3 Neonates with acidosis (pH < 7.2).
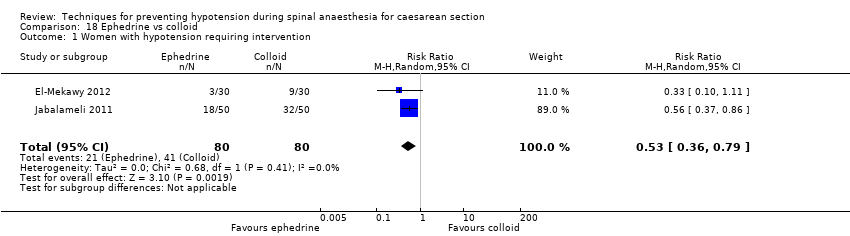
Comparison 18 Ephedrine vs colloid, Outcome 1 Women with hypotension requiring intervention.

Comparison 18 Ephedrine vs colloid, Outcome 2 Women with hypertension requiring intervention.

Comparison 18 Ephedrine vs colloid, Outcome 3 Women with bradycardia.

Comparison 18 Ephedrine vs colloid, Outcome 4 Women with nausea and vomiting.

Comparison 18 Ephedrine vs colloid, Outcome 5 5 Neonates with acidosis (pH < 7.2).

Comparison 18 Ephedrine vs colloid, Outcome 6 Apgar score < 8 at 5 min.
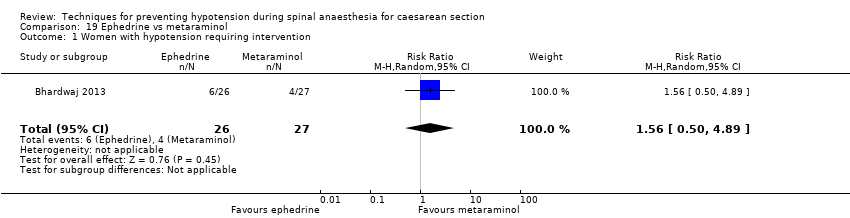
Comparison 19 Ephedrine vs metaraminol, Outcome 1 Women with hypotension requiring intervention.

Comparison 19 Ephedrine vs metaraminol, Outcome 2 Women with hypertension requiring intervention.
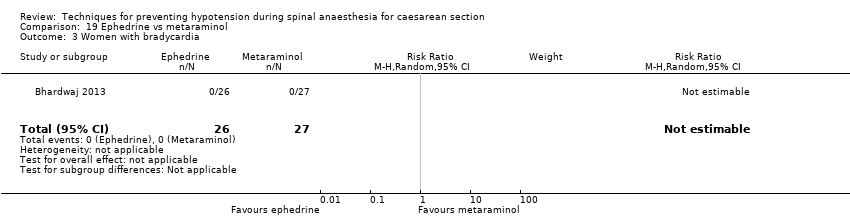
Comparison 19 Ephedrine vs metaraminol, Outcome 3 Women with bradycardia.

Comparison 19 Ephedrine vs metaraminol, Outcome 4 Women with nausea and/or vomiting.

Comparison 19 Ephedrine vs metaraminol, Outcome 5 5 Neonates with acidosis (pH < 7.2).

Comparison 19 Ephedrine vs metaraminol, Outcome 6 Neonatal Apgar score < 8 at 5 min.
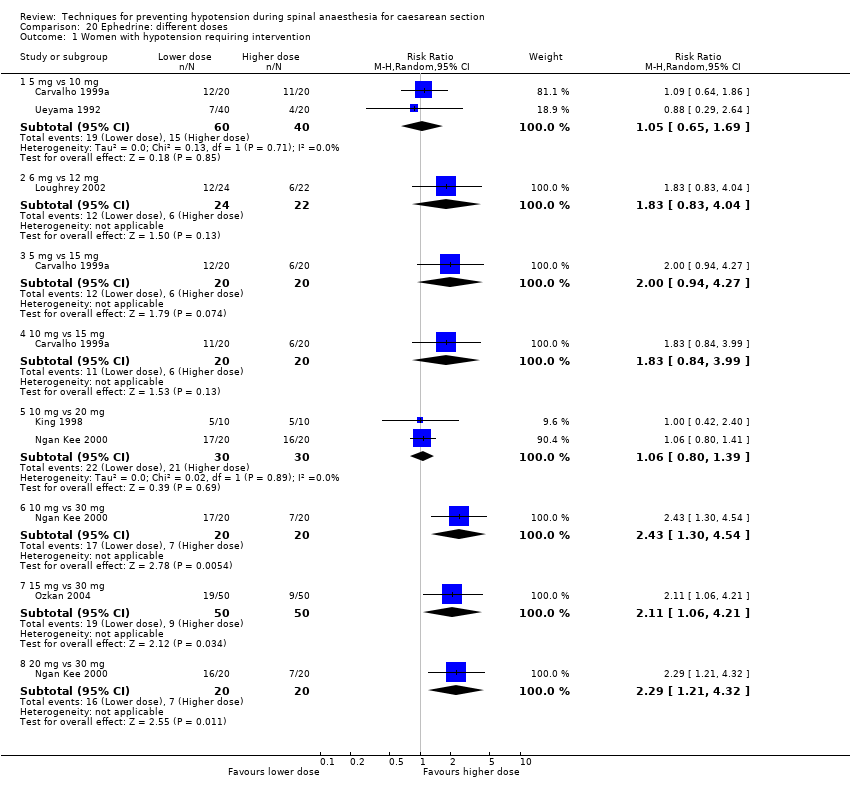
Comparison 20 Ephedrine: different doses, Outcome 1 Women with hypotension requiring intervention.
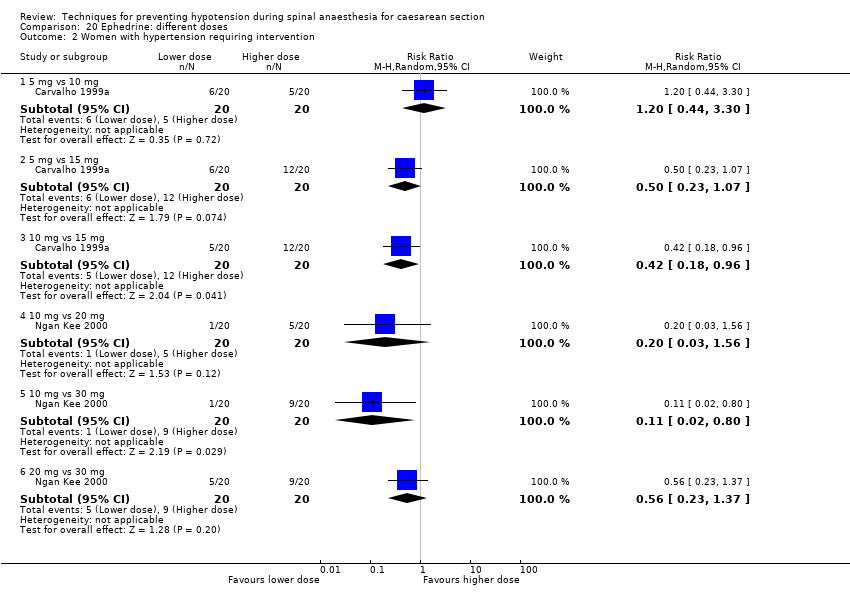
Comparison 20 Ephedrine: different doses, Outcome 2 Women with hypertension requiring intervention.
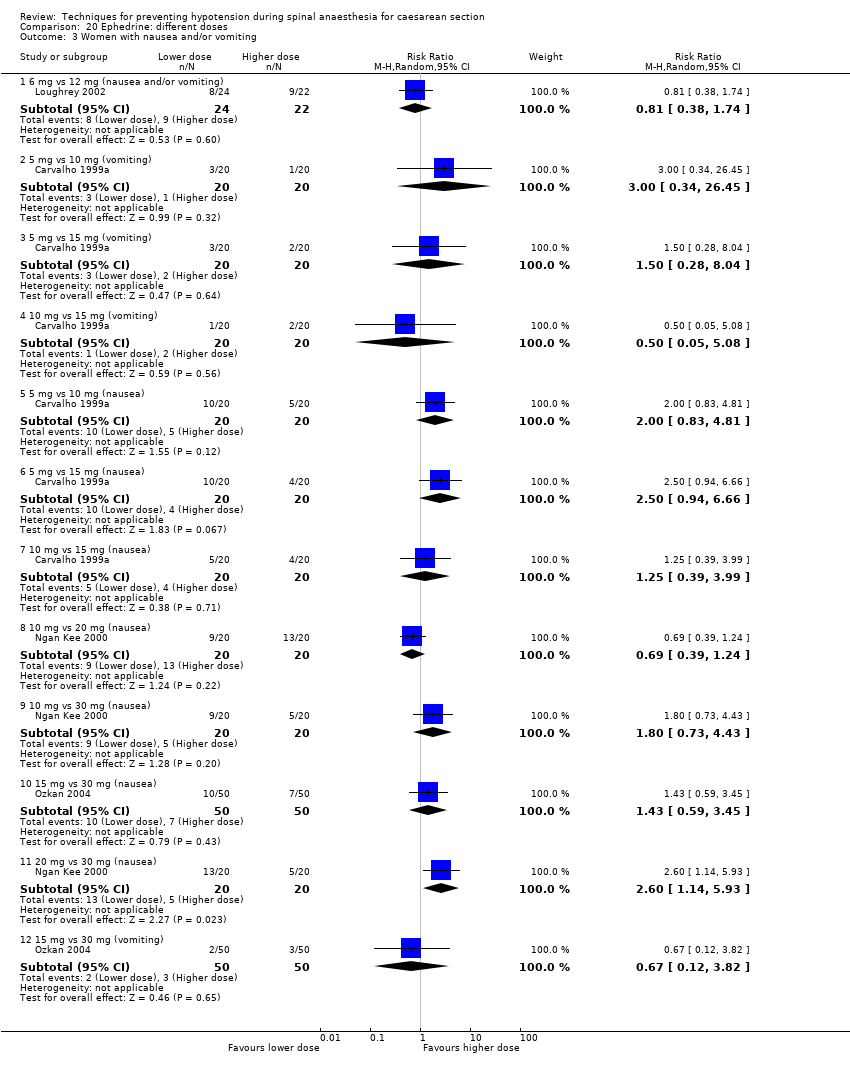
Comparison 20 Ephedrine: different doses, Outcome 3 Women with nausea and/or vomiting.

Comparison 20 Ephedrine: different doses, Outcome 4 Neonates with acidosis (pH < 7.2).
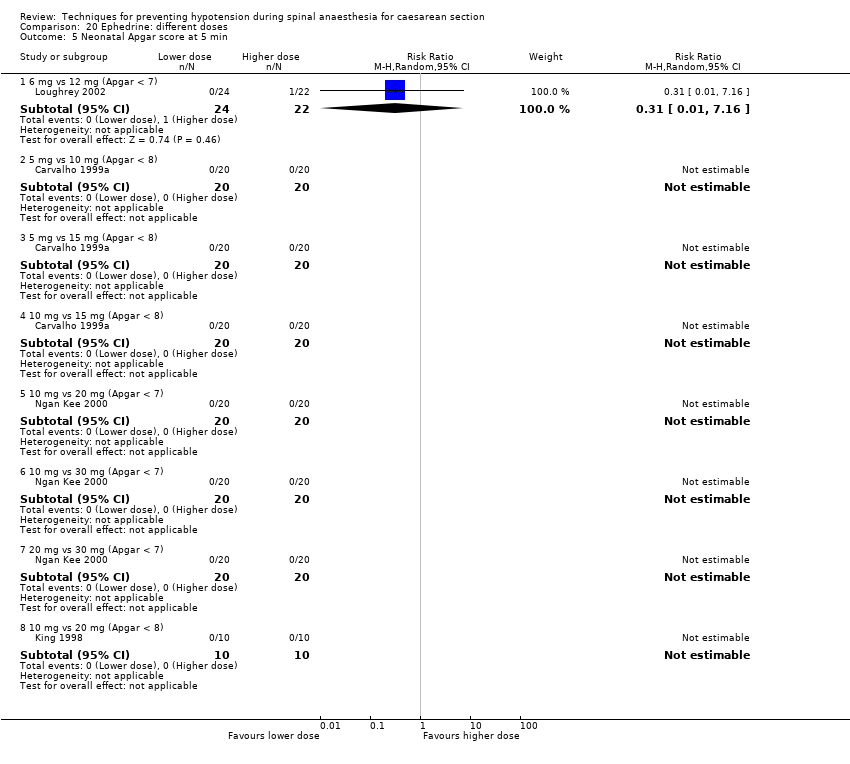
Comparison 20 Ephedrine: different doses, Outcome 5 Neonatal Apgar score at 5 min.
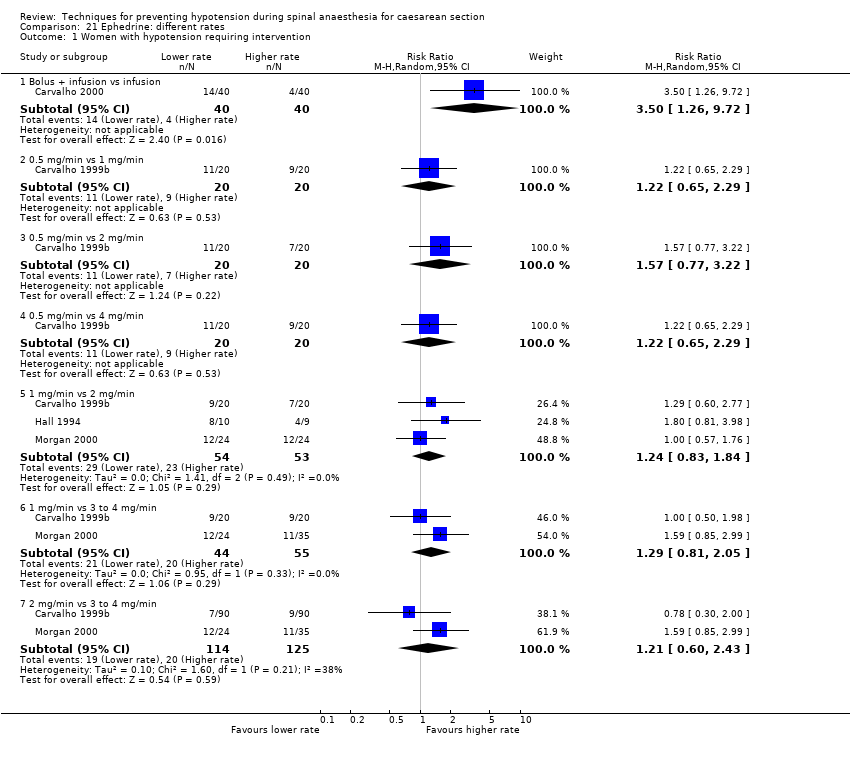
Comparison 21 Ephedrine: different rates, Outcome 1 Women with hypotension requiring intervention.

Comparison 21 Ephedrine: different rates, Outcome 2 Women with hypertension requiring intervention.
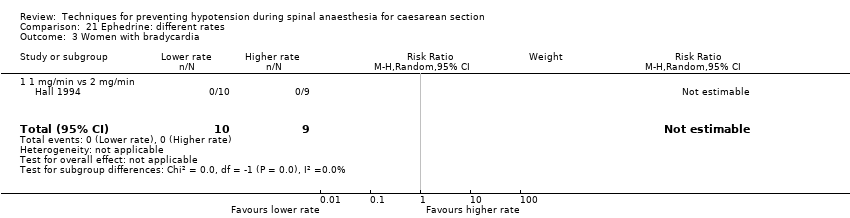
Comparison 21 Ephedrine: different rates, Outcome 3 Women with bradycardia.

Comparison 21 Ephedrine: different rates, Outcome 4 Women with nausea and/or vomiting.

Comparison 21 Ephedrine: different rates, Outcome 5 Neonates with acidosis (pH < 7.2).
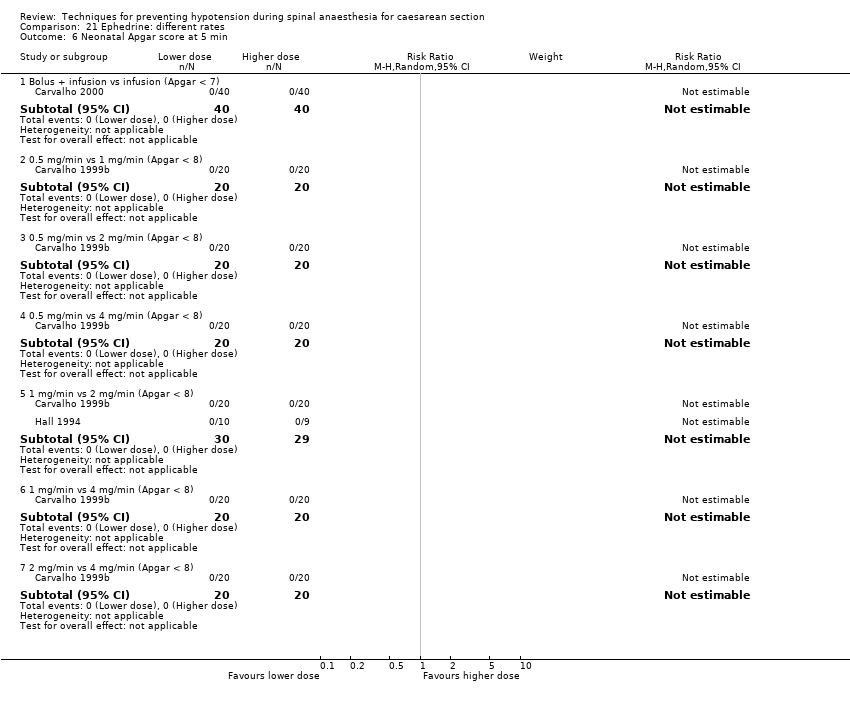
Comparison 21 Ephedrine: different rates, Outcome 6 Neonatal Apgar score at 5 min.

Comparison 22 Ephedrine: oral vs IM or IV, Outcome 1 Women with hypotension requiring intervention.

Comparison 22 Ephedrine: oral vs IM or IV, Outcome 2 Women with hypertension requiring intervention.

Comparison 22 Ephedrine: oral vs IM or IV, Outcome 3 Women with nausea and vomiting.

Comparison 23 Ephedrine: IM vs IV, Outcome 1 Women with hypotension requiring intervention.

Comparison 23 Ephedrine: IM vs IV, Outcome 2 Women with hypertension requiring intervention.

Comparison 23 Ephedrine: IM vs IV, Outcome 3 Apgar < 8 at 5 min.
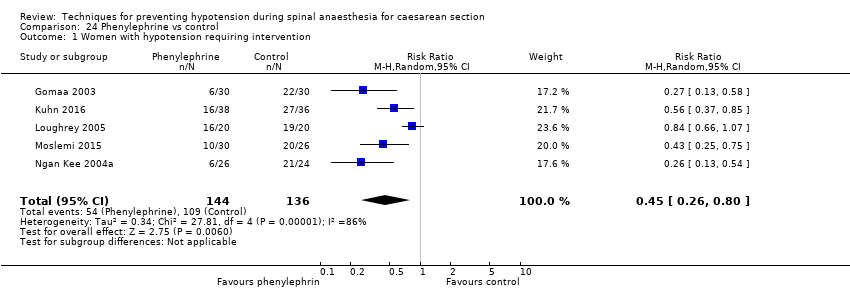
Comparison 24 Phenylephrine vs control, Outcome 1 Women with hypotension requiring intervention.

Comparison 24 Phenylephrine vs control, Outcome 2 Women with cardiac dysrhythmia.

Comparison 24 Phenylephrine vs control, Outcome 3 Women with nausea and/or vomiting.
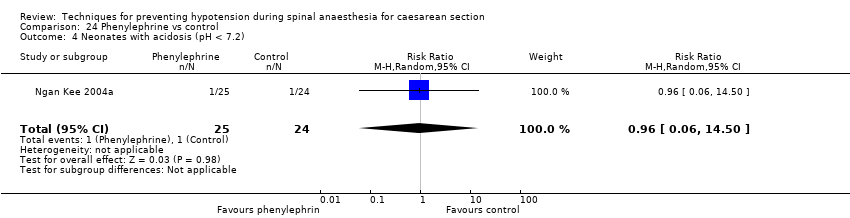
Comparison 24 Phenylephrine vs control, Outcome 4 Neonates with acidosis (pH < 7.2).

Comparison 24 Phenylephrine vs control, Outcome 5 Neonates with Apgar < 7 at 5 min.

Comparison 24 Phenylephrine vs control, Outcome 6 Neonates with Apgar < 8 at 5 min.

Comparison 25 Phenylephrine vs mephentermine, Outcome 1 Women with hypotension requiring intervention.

Comparison 25 Phenylephrine vs mephentermine, Outcome 2 Women with hypertension requiring intervention.
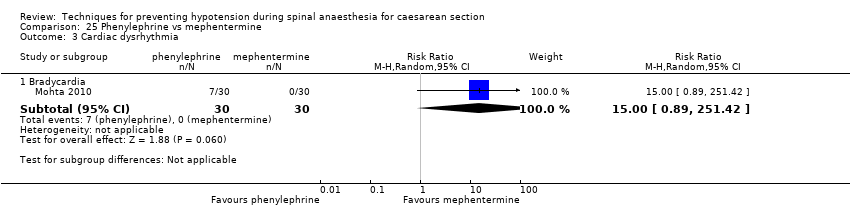
Comparison 25 Phenylephrine vs mephentermine, Outcome 3 Cardiac dysrhythmia.

Comparison 25 Phenylephrine vs mephentermine, Outcome 4 Nausea and/or vomiting.

Comparison 26 Phenylephrine vs metaraminol, Outcome 1 Women with hypotension requiring intervention.

Comparison 26 Phenylephrine vs metaraminol, Outcome 2 Women with hypertension requiring intervention.
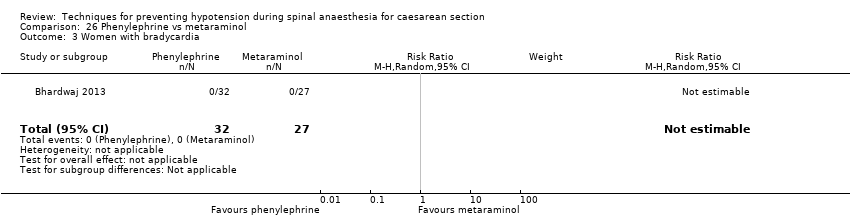
Comparison 26 Phenylephrine vs metaraminol, Outcome 3 Women with bradycardia.
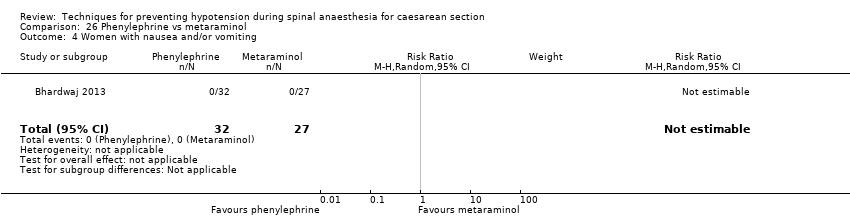
Comparison 26 Phenylephrine vs metaraminol, Outcome 4 Women with nausea and/or vomiting.
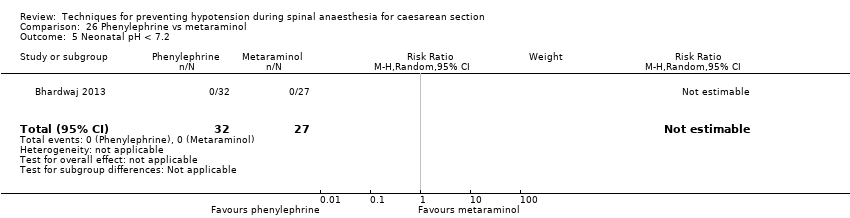
Comparison 26 Phenylephrine vs metaraminol, Outcome 5 Neonatal pH < 7.2.

Comparison 26 Phenylephrine vs metaraminol, Outcome 6 Neonatal Apgar score < 8 at 5 min.

Comparison 27 Phenylephrine vs leg compression, Outcome 1 Women with hypotension requiring intervention.

Comparison 27 Phenylephrine vs leg compression, Outcome 2 Women with bradycardia.

Comparison 27 Phenylephrine vs leg compression, Outcome 3 Women with nausea and/or vomiting.

Comparison 28 Phenylephrine: infusion vs bolus, Outcome 1 Women with hypotension requiring intervention.

Comparison 28 Phenylephrine: infusion vs bolus, Outcome 2 Women with cardiac dysrhythmia.
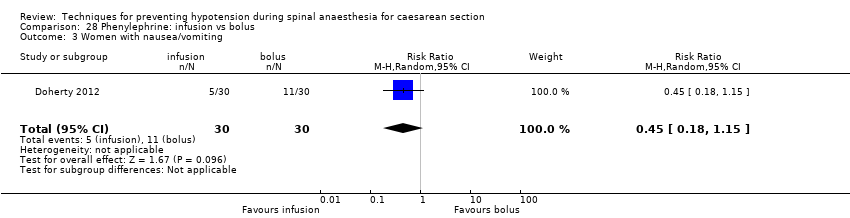
Comparison 28 Phenylephrine: infusion vs bolus, Outcome 3 Women with nausea/vomiting.

Comparison 28 Phenylephrine: infusion vs bolus, Outcome 4 Neonatal Apgar score < 8 at 5 min.
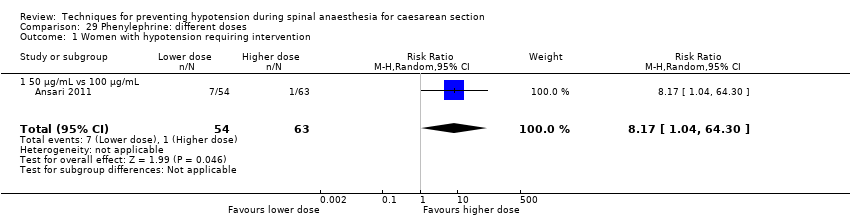
Comparison 29 Phenylephrine: different doses, Outcome 1 Women with hypotension requiring intervention.
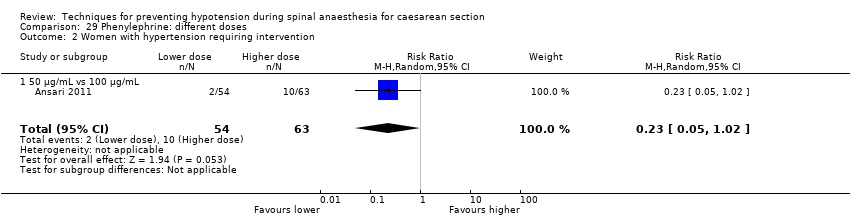
Comparison 29 Phenylephrine: different doses, Outcome 2 Women with hypertension requiring intervention.
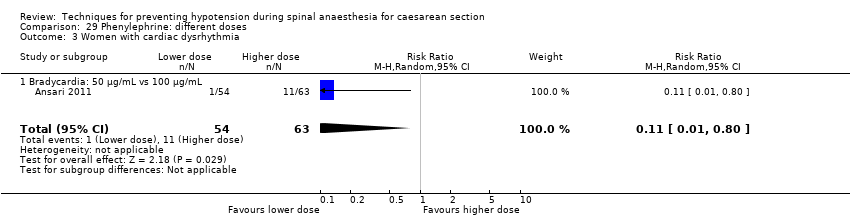
Comparison 29 Phenylephrine: different doses, Outcome 3 Women with cardiac dysrhythmia.

Comparison 29 Phenylephrine: different doses, Outcome 4 Women with nausea and/or vomiting.

Comparison 29 Phenylephrine: different doses, Outcome 5 Neonatal cord blood pH < 7.2.

Comparison 29 Phenylephrine: different doses, Outcome 6 Neonatal Apgar score < 8 at 5 min.

Comparison 30 Glycopyrrolate vs control, Outcome 1 Women with hypotension requiring intervention.
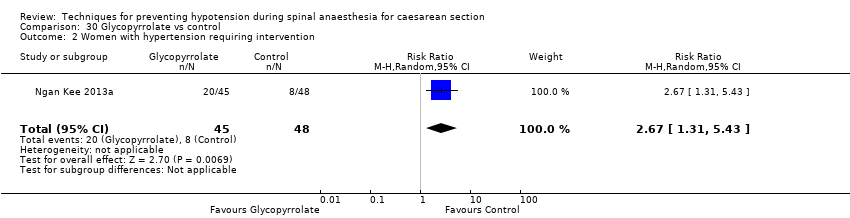
Comparison 30 Glycopyrrolate vs control, Outcome 2 Women with hypertension requiring intervention.
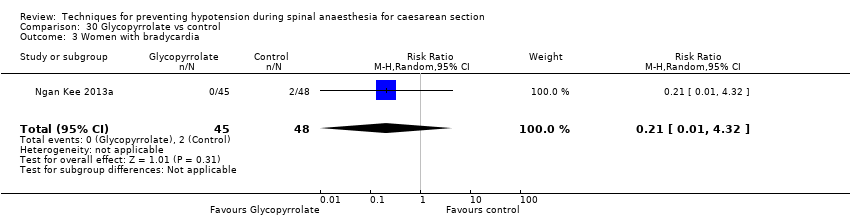
Comparison 30 Glycopyrrolate vs control, Outcome 3 Women with bradycardia.

Comparison 30 Glycopyrrolate vs control, Outcome 4 Women with nausea and/or vomiting.

Comparison 30 Glycopyrrolate vs control, Outcome 5 Neonates with Apgar score < 8 at 5 min.
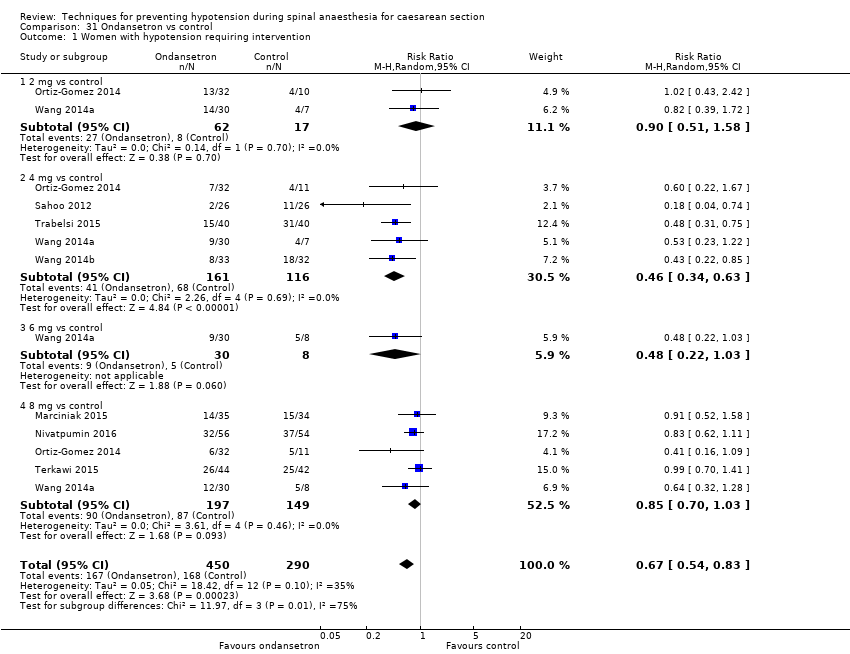
Comparison 31 Ondansetron vs control, Outcome 1 Women with hypotension requiring intervention.

Comparison 31 Ondansetron vs control, Outcome 2 Women with bradycardia.

Comparison 31 Ondansetron vs control, Outcome 3 Women with nausea or vomiting.
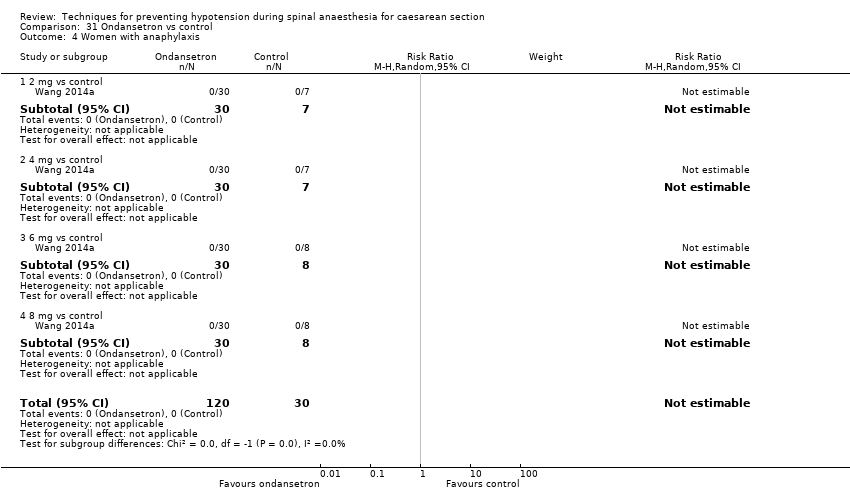
Comparison 31 Ondansetron vs control, Outcome 4 Women with anaphylaxis.

Comparison 31 Ondansetron vs control, Outcome 5 Neonatal Apgar score < 8 at 5 min.
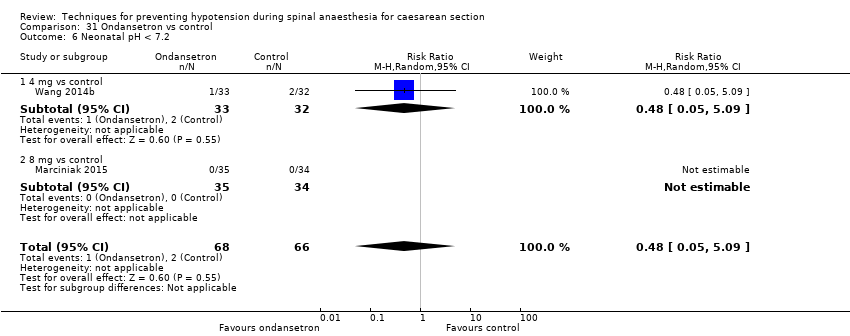
Comparison 31 Ondansetron vs control, Outcome 6 Neonatal pH < 7.2.

Comparison 32 Ondansetron vs ephedrine, Outcome 1 Women with hypotension requiring intervention.

Comparison 32 Ondansetron vs ephedrine, Outcome 2 Women with bradycardia.

Comparison 32 Ondansetron vs ephedrine, Outcome 3 Women with nausea and/or vomiting.
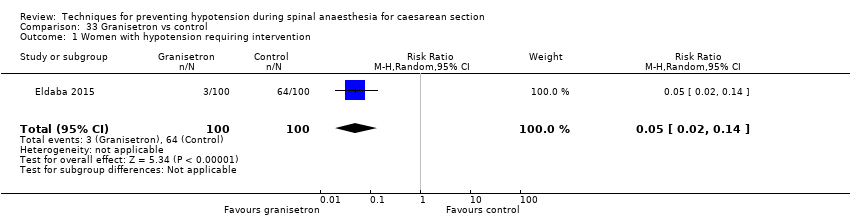
Comparison 33 Granisetron vs control, Outcome 1 Women with hypotension requiring intervention.

Comparison 34 Ketamine vs saline, Outcome 1 Women with hypotension requiring intervention.
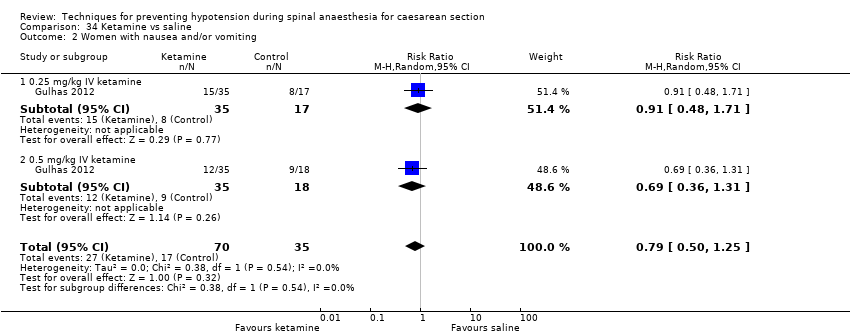
Comparison 34 Ketamine vs saline, Outcome 2 Women with nausea and/or vomiting.

Comparison 34 Ketamine vs saline, Outcome 3 Apgar score < 8 at 5 min.
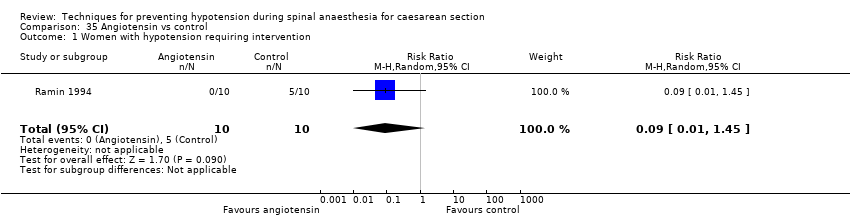
Comparison 35 Angiotensin vs control, Outcome 1 Women with hypotension requiring intervention.
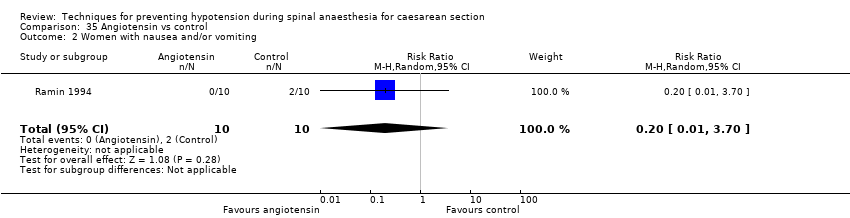
Comparison 35 Angiotensin vs control, Outcome 2 Women with nausea and/or vomiting.

Comparison 35 Angiotensin vs control, Outcome 3 Neonates with acidosis (pH < 7.2).

Comparison 36 Dopamine vs control, Outcome 1 Women with hypotension requiring intervention.

Comparison 36 Dopamine vs control, Outcome 2 Neonatal Apgar score < 8 at 5 min.
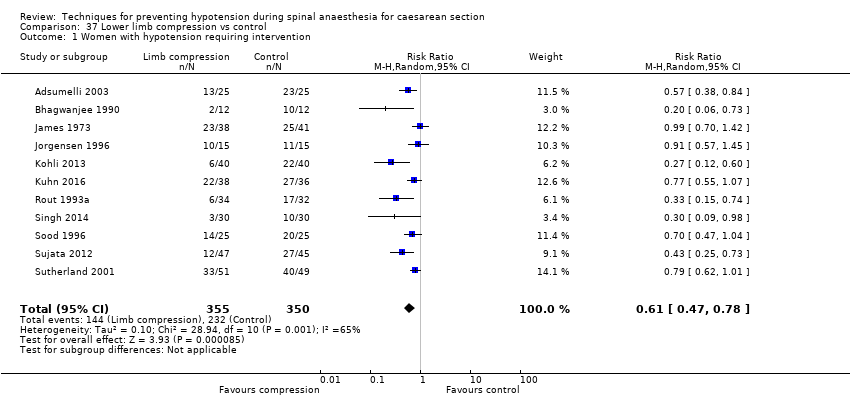
Comparison 37 Lower limb compression vs control, Outcome 1 Women with hypotension requiring intervention.
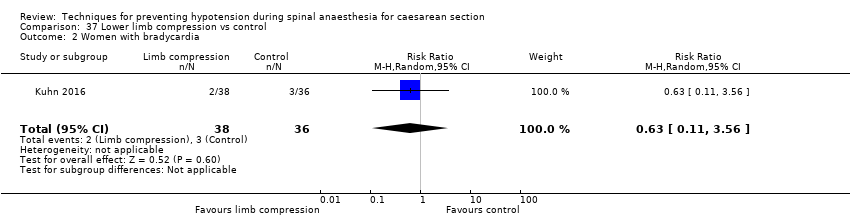
Comparison 37 Lower limb compression vs control, Outcome 2 Women with bradycardia.
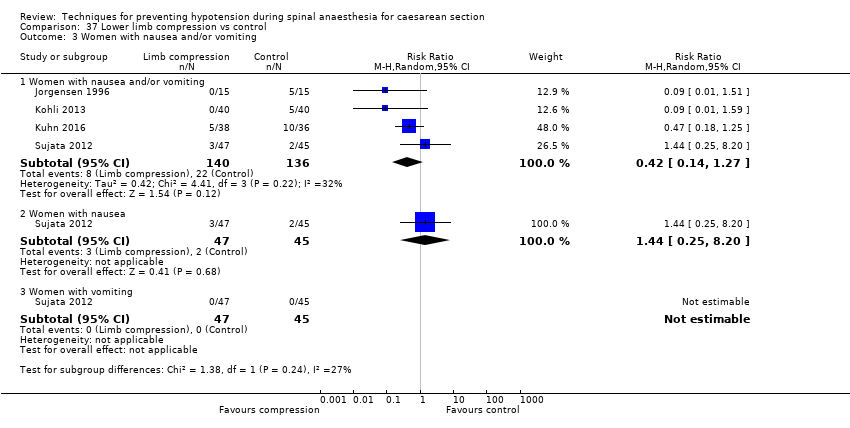
Comparison 37 Lower limb compression vs control, Outcome 3 Women with nausea and/or vomiting.

Comparison 37 Lower limb compression vs control, Outcome 4 Neonates with Apgar score < 8 at 5 min.
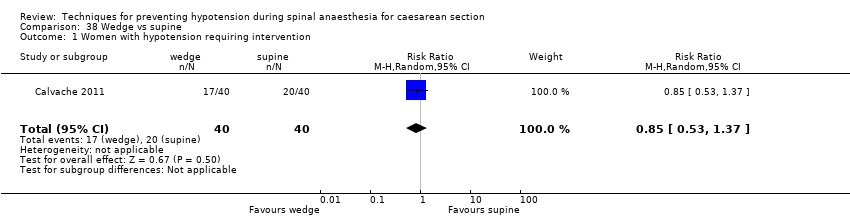
Comparison 38 Wedge vs supine, Outcome 1 Women with hypotension requiring intervention.
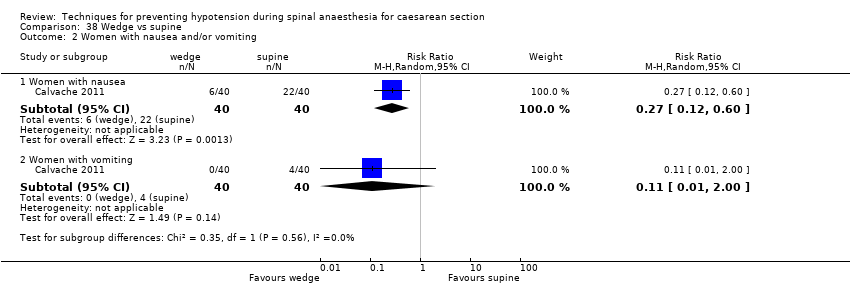
Comparison 38 Wedge vs supine, Outcome 2 Women with nausea and/or vomiting.
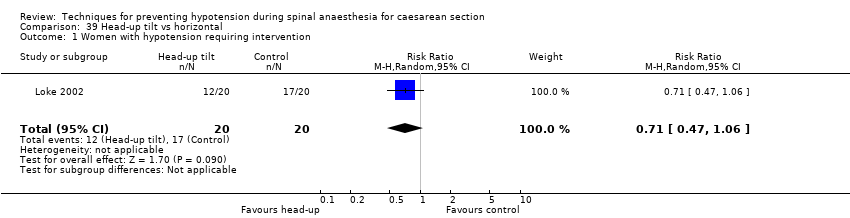
Comparison 39 Head‐up tilt vs horizontal, Outcome 1 Women with hypotension requiring intervention.

Comparison 39 Head‐up tilt vs horizontal, Outcome 2 Neonates with Apgar score < 8 at 5 min.

Comparison 40 Head‐down tilt vs horizontal, Outcome 1 Women with hypotension requiring intervention.

Comparison 41 Crawford's wedge vs manual uterine displacement, Outcome 1 Women with hypotension requiring intervention.
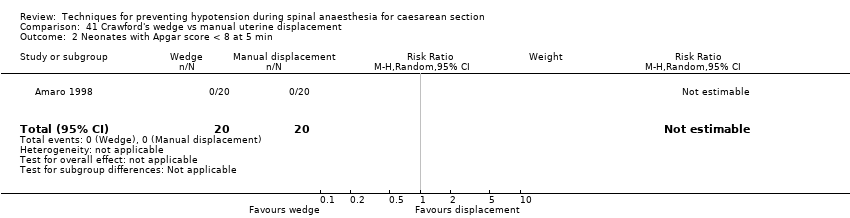
Comparison 41 Crawford's wedge vs manual uterine displacement, Outcome 2 Neonates with Apgar score < 8 at 5 min.

Comparison 42 Supine vs sitting, Outcome 1 Women with hypotension requiring intervention.
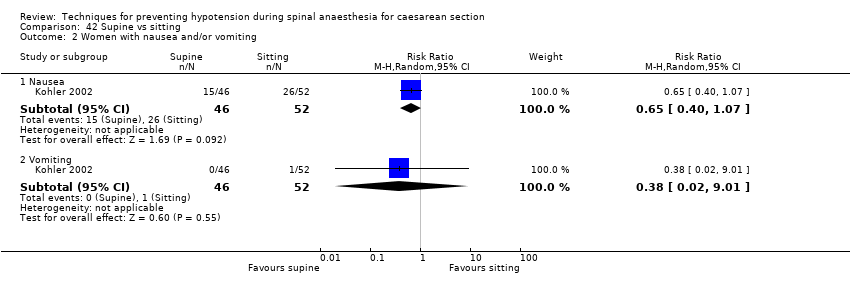
Comparison 42 Supine vs sitting, Outcome 2 Women with nausea and/or vomiting.

Comparison 42 Supine vs sitting, Outcome 3 Neonates with acidosis (pH < 7.2).
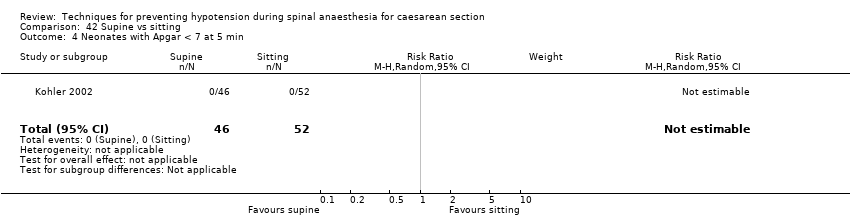
Comparison 42 Supine vs sitting, Outcome 4 Neonates with Apgar < 7 at 5 min.

Comparison 43 Walking vs lying, Outcome 1 Women requiring intervention for hypotension.

Comparison 44 Lateral vs supine wedged position, Outcome 1 Women with hypotension requiring intervention.

Comparison 44 Lateral vs supine wedged position, Outcome 2 Women with cardiac dysrhythmia requiring intervention.

Comparison 44 Lateral vs supine wedged position, Outcome 3 Neonates admitted to neonatal intensive care unit.

Comparison 44 Lateral vs supine wedged position, Outcome 4 Women with nausea.
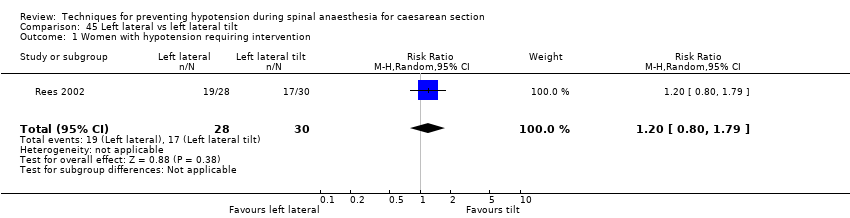
Comparison 45 Left lateral vs left lateral tilt, Outcome 1 Women with hypotension requiring intervention.

Comparison 45 Left lateral vs left lateral tilt, Outcome 2 Women with cardiac dysrhythmia requiring intervention.

Comparison 45 Left lateral vs left lateral tilt, Outcome 3 Women with nausea and/or vomiting.

Comparison 46 Left lateral tilt vs left manual uterine displacement, Outcome 1 Women with hypotension requiring intervention.

Comparison 47 Leg elevation vs control, Outcome 1 Women with hypotension requiring intervention.
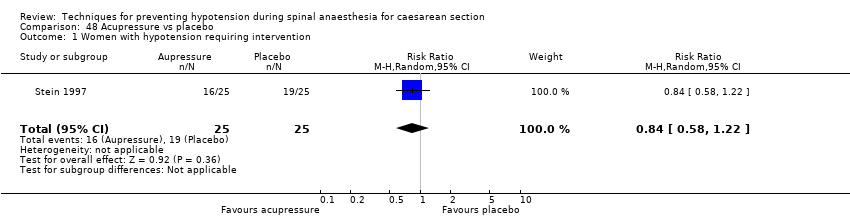
Comparison 48 Acupressure vs placebo, Outcome 1 Women with hypotension requiring intervention.
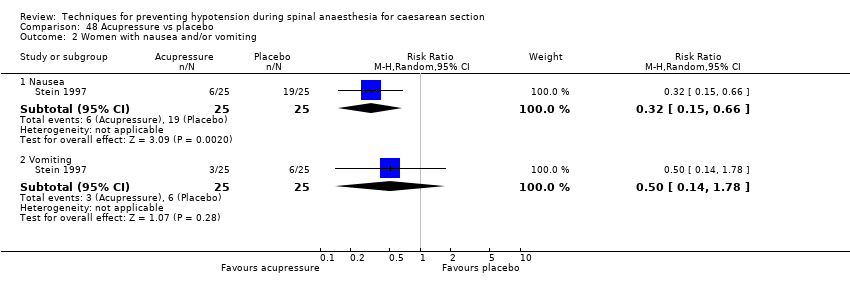
Comparison 48 Acupressure vs placebo, Outcome 2 Women with nausea and/or vomiting.

Comparison 48 Acupressure vs placebo, Outcome 3 Neonates with Apgar < 7 at 5 min.

Comparison 49 Acupressure vs metoclopramide, Outcome 1 Women with hypotension requiring intervention.

Comparison 49 Acupressure vs metoclopramide, Outcome 2 Women with nausea and/or vomiting.

Comparison 49 Acupressure vs metoclopramide, Outcome 3 Neonates with Apgar < 7 at 5 min.
| Techniques for preventing hypotension during spinal anaesthesia for caesarean section | |||||
| Patient or population: women having spinal anaesthesia for caesarean section Setting: hospital (inpatient) Outcome: maternal hypotension requiring intervention | |||||
| Comparisons | Anticipated absolute effects* (95% CI) | Relative effect | № of participants | Quality of the evidence | |
| Risk with control | Risk with Intervention | ||||
| Crystalloid vs control | Control | Crystalloid | average RR 0.84 | 370 | ⊕⊕⊝⊝ |
| 535 per 1000 | 449 per 1000 | ||||
| Colloid vs crystalloid | Crystalloid | Colloid | average RR 0.68 (0.58 to 0.80) | 2105 | ⊕⊝⊝⊝ |
| 586 per 1000 | 398 per 1000 | ||||
| Ephedrine vs phenylephrine | Phenylephrine | Ephedrine | average RR 0.92 | 401 | ⊕⊝⊝⊝ |
| 465 per 1000 | 428 per 1000 | ||||
| Ondansetron vs control | Control | Ondansetron | average RR 0.67 | 740 | ⊕⊕⊝⊝ |
| 579 per 1000 | 388 per 1000 | ||||
| Lower limb compression vs control | Control | Lower limb compression | average RR 0.61 | 705 | ⊕⊝⊝⊝ |
| 663 per 1000 | 404 per 1000 | ||||
| Walking vs lying | Lying | Walking | RR 0.71 (0.41 to 1.21) | 37 (1 RCT) | ⊕⊝⊝⊝ Very lowf,g |
| 706 per 1000 | 501 per 1000 | ||||
| *The risk in the intervention group (and its 95% confidence interval) is based on the assumed risk in the comparison group and the relative effect of the intervention (and its 95% CI). | |||||
| GRADE Working Group grades of evidence | |||||
| aInclusion criteria not representative of wider population (e.g. only elective caesarean sections) (−1). | |||||
| Crystalloid versus control for preventing hypotension during spinal anaesthesia for caesarean section | |||||
| Patient or population: women having spinal anaesthesia for caesarean section | |||||
| Outcomes | Anticipated absolute effects* (95% CI) | Relative effect | № of participants | Quality of the evidence | |
| Risk with control | Risk with crystalloid | ||||
| Maternal hypotension requiring intervention | Study population | RR 0.84 | 370 | ⊕⊕⊝⊝ | |
| 535 per 1000 | 449 per 1000 | ||||
| Maternal hypertension requiring intervention | No studies reported this outcome. | ||||
| Maternal bradycardia requiring intervention | No studies reported this outcome. | ||||
| Maternal nausea and/or vomiting | Study population | RR 0.19 (0.01 to 3.91) | 69 (1 RCT) | ⊕⊝⊝⊝ Very lowa,c | |
| 59 per 1000 | 11 per 1000 (1 to 230) | ||||
| Neonatal acidosis as defined by cord or neonatal blood with a pH < 7.2 | No studies reported this outcome. | ||||
| Neonatal Apgar score < 8 at 5 minutes | Study population | Not estimable | 60 | ⊕⊕⊝⊝ | |
| 0 per 1000 | 0 per 1000 | ||||
| Admission to neonatal intensive care unit | No studies reported this outcome. | ||||
| *The risk in the intervention group (and its 95% confidence interval) is based on the assumed risk in the comparison group and the relative effect of the intervention (and its 95% CI). | |||||
| GRADE Working Group grades of evidence High quality: we are very confident that the true effect lies close to that of the estimate of the effect. | |||||
| aOnly elective caesarean sections included (−1). | |||||
| Colloid versus crystalloid for preventing hypotension during spinal anaesthesia for caesarean section | |||||
| Patient or population: women having spinal anaesthesia for caesarean section | |||||
| Outcomes | Anticipated absolute effects* (95% CI) | Relative effect | № of participants | Quality of the evidence | |
| Risk with crystalloid | Risk with colloid | ||||
| Maternal hypotension requiring intervention | Study population | RR 0.68 (0.58 to 0.80) | 2105 | ⊕⊝⊝⊝ | |
| 586 per 1000 | 398 per 1000 | ||||
| Maternal hypertension requiring intervention | Study population | RR 0.64 | 327 | ⊕⊝⊝⊝ | |
| 55 per 1000 | 35 per 1000 | ||||
| Maternal bradycardia requiring intervention | Study population | RR 0.99 | 509 | ⊕⊝⊝⊝ | |
| 76 per 1000 | 75 per 1000 | ||||
| Maternal nausea and/or vomiting | Study population | RR 0.83 | 1154 | ⊕⊝⊝⊝ | |
| 228 per 1000 | 189 per 1000 | ||||
| Neonatal acidosis as defined by cord or neonatal blood with a pH < 7.2 | Study population | RR 0.83 | 678 | ⊕⊝⊝⊝ | |
| 26 per 1000 | 21 per 1000 | ||||
| Neonatal Apgar score < 8 at 5 minutes | Study population | RR 0.24 | 826 | ⊕⊝⊝⊝ | |
| 10 per 1000 | 2 per 1000 | ||||
| Admission to neonatal intensive care unit | No studies reported this outcome. | ||||
| *The risk in the intervention group (and its 95% confidence interval) is based on the assumed risk in the comparison group and the relative effect of the intervention (and its 95% CI). | |||||
| GRADE Working Group grades of evidence High quality: we are very confident that the true effect lies close to that of the estimate of the effect. | |||||
| aDowngraded one level for serious risk of bias (due to unclear risk of selection bias in most included studies) (−1). | |||||
| Ephedrine versus phenylephrine for preventing hypotension during spinal anaesthesia for caesarean section | ||||||
| Patient or population: women having spinal anaesthesia for caesarean section | ||||||
| Outcomes | Anticipated absolute effects* (95% CI) | Relative effect | № of participants | Quality of the evidence | Comments | |
| Risk with phenylephrine | Risk with ephedrine | |||||
| Maternal hypotension requiring intervention | Study population | RR 0.92 | 401 | ⊕⊝⊝⊝ | — | |
| 465 per 1000 | 428 per 1000 | |||||
| Maternal hypertension requiring intervention | Study population | RR 1.72 | 118 | ⊕⊕⊝⊝ | — | |
| 113 per 1000 | 194 per 1000 | |||||
| Maternal bradycardia requiring intervention | Study population | RR 0.37 | 304 | ⊕⊕⊝⊝ | — | |
| 243 per 1000 | 90 per 1000 | |||||
| Maternal nausea and/or vomiting | Study population | RR 0.76 | 204 | ⊕⊝⊝⊝ | — | |
| 216 per 1000 | 164 per 1000 | |||||
| Neonatal acidosis as defined by cord or neonatal blood with a pH < 7.2 | Study population | RR 0.89 | 175 | ⊕⊕⊝⊝ | — | |
| 11 per 1000 | 10 per 1000 | |||||
| Neonatal Apgar score < 8 at 5 minutes | Study population | Not estimable | 321 | ⊕⊕⊝⊝ | No events observed in any studies. Relative effect could not be estimated. | |
| Not pooled | Not pooled | |||||
| Admission to neonatal intensive care unit | No studies reported this outcome. | |||||
| *The risk in the intervention group (and its 95% confidence interval) is based on the assumed risk in the comparison group and the relative effect of the intervention (and its 95% CI). | ||||||
| GRADE Working Group grades of evidence High quality: we are very confident that the true effect lies close to that of the estimate of the effect. | ||||||
| aSubstantial heterogeneity (−1). | ||||||
| Ondansetron versus saline placebo for preventing hypotension during spinal anaesthesia for caesarean section | |||||
| Patient or population: women having spinal anaesthesia for caesarean section | |||||
| Outcomes | Anticipated absolute effects* (95% CI) | Relative effect | № of participants | Quality of the evidence | |
| Risk with control | Risk with ondansetron | ||||
| Maternal hypotension requiring intervention | Study population | RR 0.67 | 740 | ⊕⊕⊝⊝ | |
| 579 per 1000 | 388 per 1000 | ||||
| Maternal hypertension requiring intervention | No studies reported this outcome. | ||||
| Maternal bradycardia requiring intervention | Study population | RR 0.49 | 740 | ⊕⊕⊝⊝ | |
| 100 per 1000 | 49 per 1000 | ||||
| Maternal nausea and/or vomiting | Study population | RR 0.35 | 653 | ⊕⊕⊝⊝ | |
| 296 per 1000 | 103 per 1000 | ||||
| Neonatal Apgar score < 8 at 5 minutes | Study population | Not estimable | 284 | ⊕⊕⊝⊝ | |
| Not pooled | Not pooled | ||||
| Neonatal acidosis as defined by cord or neonatal blood with a pH < 7.2 | Study population | RR 0.48 | 134 | ⊕⊕⊝⊝ | |
| 30 per 1000 | 15 per 1000 | ||||
| Admission to neonatal care unit | No studies reported this outcome. | ||||
| *The risk in the intervention group (and its 95% confidence interval) is based on the assumed risk in the comparison group and the relative effect of the intervention (and its 95% CI). | |||||
| GRADE Working Group grades of evidence High quality: we are very confident that the true effect lies close to that of the estimate of the effect. | |||||
| a Inclusion criteria not representative of wider population (e.g. elective caesarean section only) (−1). | |||||
| Leg compression versus control for preventing hypotension during spinal anaesthesia for caesarean section | ||||||
| Patient or population: women having spinal anaesthesia for caesarean section | ||||||
| Outcomes | Anticipated absolute effects* (95% CI) | Relative effect | № of participants | Quality of the evidence | Comments | |
| Risk with control | Risk with lower limb compression | |||||
| Maternal hypotension requiring intervention | Study population | RR 0.61 | 705 | ⊕⊝⊝⊝ | — | |
| 663 per 1000 | 404 per 1000 | |||||
| Maternal hypertension requiring intervention | No studies reported this outcome. | |||||
| Maternal bradycardia requiring intervention | Study population | RR 0.63 (0.11 to 3.56) | 74 (1 RCTs) | ⊕⊝⊝⊝ | — | |
| 83 per 1000 | 53 per 1000 (9 to 297) | |||||
| Maternal nausea and/or vomiting | Study population | RR 0.42 | 276 | ⊕⊝⊝⊝ | — | |
| 162 per 1000 | 68 per 1000 | |||||
| Neonatal acidosis as defined by cord or neonatal blood with a pH < 7.2 | No studies reported this outcome. | |||||
| Neonatal Apgar score < 8 at 5 minutes | Study population | Not estimable | 130 | ⊕⊝⊝⊝ | No events observed in any studies. Relative effect could not be estimated. | |
| Not pooled | Not pooled | |||||
| Admission to neonatal intensive care unit | No studies reported this outcome. | |||||
| *The risk in the intervention group (and its 95% confidence interval) is based on the assumed risk in the comparison group and the relative effect of the intervention (and its 95% CI). | ||||||
| GRADE Working Group grades of evidence High quality: we are very confident that the true effect lies close to that of the estimate of the effect. | ||||||
| aDowngraded one level for serious risk of bias (due to unclear risk of selection bias in the majority of included studies (−1). | ||||||
| Walking versus lying for reducing risk of maternal hypotension during spinal anaesthesia for caesarean section | |||||
| Patient or population: women having spinal anaesthesia for caesarean section | |||||
| Outcomes | Anticipated absolute effects* (95% CI) | Relative effect | № of participants | Quality of the evidence | |
| Risk with lying | Risk with walking | ||||
| Maternal hypotension requiring intervention | Study population | RR 0.71 | 37 | ⊕⊝⊝⊝ | |
| 706 per 1000 | 501 per 1000 | ||||
| Maternal hypertension requiring intervention | No studies reported this outcome. | ||||
| Maternal bradycardia requiring intervention | No studies reported this outcome. | ||||
| Maternal nausea and/or vomiting | No studies reported this outcome. | ||||
| Neonatal acidosis as defined by cord or neonatal blood with a pH < 7.2 | No studies reported this outcome. | ||||
| Neonal Apgar score < 8 at 5 minutes | No studies reported this outcome. | ||||
| Admission to neonatal intensive care unit | No studies reported this outcome. | ||||
| *The risk in the intervention group (and its 95% confidence interval) is based on the assumed risk in the comparison group and the relative effect of the intervention (and its 95% CI). | |||||
| GRADE Working Group grades of evidence | |||||
| aParticipants and anaesthetists not blinded in 1 study with 100% weight in analysis (−1). | |||||
| Outcome or subgroup title | No. of studies | No. of participants | Statistical method | Effect size |
| 1 Women with hypotension requiring intervention Show forest plot | 5 | 370 | Risk Ratio (M‐H, Random, 95% CI) | 0.84 [0.72, 0.98] |
| 2 Nausea and/or vomiting Show forest plot | 1 | 69 | Risk Ratio (M‐H, Random, 95% CI) | 0.19 [0.01, 3.91] |
| 3 Anaphylaxis Show forest plot | 1 | 69 | Risk Ratio (M‐H, Random, 95% CI) | 0.0 [0.0, 0.0] |
| 4 Apgar < 8 at 5 min Show forest plot | 1 | 60 | Risk Ratio (M‐H, Random, 95% CI) | 0.0 [0.0, 0.0] |
| Outcome or subgroup title | No. of studies | No. of participants | Statistical method | Effect size |
| 1 Women with hypotension requiring intervention Show forest plot | 1 | 20 | Risk Ratio (M‐H, Random, 95% CI) | 0.86 [0.45, 1.64] |
| Outcome or subgroup title | No. of studies | No. of participants | Statistical method | Effect size |
| 1 Women with hypotension requiring intervention Show forest plot | 3 | 192 | Risk Ratio (M‐H, Random, 95% CI) | 0.55 [0.29, 1.02] |
| 1.1 15 mL/kg crystalloid | 2 | 67 | Risk Ratio (M‐H, Random, 95% CI) | 0.56 [0.33, 0.96] |
| 1.2 20 mL/kg crystalloid | 2 | 125 | Risk Ratio (M‐H, Random, 95% CI) | 0.51 [0.11, 2.44] |
| 2 Nausea and/or vomiting Show forest plot | 1 | 80 | Risk Ratio (M‐H, Random, 95% CI) | 1.2 [0.40, 3.62] |
| 3 Apgar < 8 at 5 min Show forest plot | 1 | Risk Ratio (M‐H, Random, 95% CI) | Subtotals only | |
| 3.1 15 mL/kg crystalloid | 1 | 45 | Risk Ratio (M‐H, Random, 95% CI) | 0.0 [0.0, 0.0] |
| 3.2 20 mL/kg crystalloid | 1 | 45 | Risk Ratio (M‐H, Random, 95% CI) | 0.0 [0.0, 0.0] |
| Outcome or subgroup title | No. of studies | No. of participants | Statistical method | Effect size |
| 1 Women with hypotension requiring intervention Show forest plot | 5 | 384 | Risk Ratio (M‐H, Random, 95% CI) | 0.70 [0.59, 0.83] |
| 2 Hypertension requiring intervention Show forest plot | 1 | 100 | Risk Ratio (M‐H, Random, 95% CI) | 1.67 [0.42, 6.60] |
| 3 Women with bradycardia Show forest plot | 1 | 100 | Risk Ratio (M‐H, Random, 95% CI) | 1.43 [0.59, 3.45] |
| 4 Women with nausea or vomiting Show forest plot | 3 | Risk Ratio (M‐H, Random, 95% CI) | Subtotals only | |
| 4.1 Women with nausea | 3 | 210 | Risk Ratio (M‐H, Random, 95% CI) | 1.98 [1.26, 3.12] |
| 4.2 Women with vomiting | 2 | 160 | Risk Ratio (M‐H, Random, 95% CI) | 2.33 [0.98, 5.58] |
| 5 Neonates with acidosis (pH < 7.2) Show forest plot | 2 | 110 | Risk Ratio (M‐H, Random, 95% CI) | 0.0 [0.0, 0.0] |
| 6 Apgar < 8 at 5 min Show forest plot | 3 | 210 | Risk Ratio (M‐H, Random, 95% CI) | 0.0 [0.0, 0.0] |
| Outcome or subgroup title | No. of studies | No. of participants | Statistical method | Effect size |
| 1 Women with hypotension requiring intervention Show forest plot | 1 | 113 | Risk Ratio (M‐H, Random, 95% CI) | 1.03 [0.65, 1.62] |
| 2 Women with nausea and/or vomiting Show forest plot | 1 | Risk Ratio (M‐H, Random, 95% CI) | Subtotals only | |
| 2.1 Nausea | 1 | 113 | Risk Ratio (M‐H, Random, 95% CI) | 1.64 [0.97, 2.76] |
| 2.2 Vomiting | 1 | 113 | Risk Ratio (M‐H, Random, 95% CI) | 2.95 [0.12, 70.87] |
| Outcome or subgroup title | No. of studies | No. of participants | Statistical method | Effect size |
| 1 Women with hypotension requiring intervention Show forest plot | 3 | Risk Ratio (M‐H, Random, 95% CI) | Subtotals only | |
| 1.1 Dextrose + saline vs saline | 1 | 120 | Risk Ratio (M‐H, Random, 95% CI) | 0.88 [0.68, 1.14] |
| 1.2 Glucose vs saline | 1 | 70 | Risk Ratio (M‐H, Random, 95% CI) | 1.05 [0.74, 1.48] |
| 1.3 Ringer's lactate vs saline | 1 | 60 | Risk Ratio (M‐H, Random, 95% CI) | 1.17 [0.65, 2.09] |
| 2 Neonates with acidosis: Ringer's lactate vs saline Show forest plot | 1 | 60 | Risk Ratio (M‐H, Fixed, 95% CI) | 0.0 [0.0, 0.0] |
| 3 Neonates with acidosis: dextrose vs saline Show forest plot | 1 | 120 | Risk Ratio (M‐H, Random, 95% CI) | 1.2 [0.39, 3.72] |
| 4 Neonates with Apgar score < 7 at 5 min Show forest plot | 1 | 120 | Risk Ratio (M‐H, Random, 95% CI) | 0.0 [0.0, 0.0] |
| 5 Neonates with Apgar score < 8 at 5 min Show forest plot | 1 | 60 | Risk Ratio (M‐H, Fixed, 95% CI) | 0.0 [0.0, 0.0] |
| Outcome or subgroup title | No. of studies | No. of participants | Statistical method | Effect size |
| 1 Women with hypotension requiring intervention Show forest plot | 28 | 2105 | Risk Ratio (M‐H, Random, 95% CI) | 0.68 [0.58, 0.80] |
| 2 Women with hypertension requiring intervention Show forest plot | 3 | 327 | Risk Ratio (M‐H, Random, 95% CI) | 0.64 [0.09, 4.46] |
| 3 Women with cardiac dysrhythmia Show forest plot | 7 | Risk Ratio (M‐H, Random, 95% CI) | Subtotals only | |
| 3.1 Tachycardia | 1 | 60 | Risk Ratio (M‐H, Random, 95% CI) | 1.1 [0.79, 1.53] |
| 3.2 Bradycardia | 6 | 509 | Risk Ratio (M‐H, Random, 95% CI) | 0.99 [0.55, 1.79] |
| 4 Women with nausea and/or vomiting Show forest plot | 16 | Risk Ratio (M‐H, Random, 95% CI) | Subtotals only | |
| 4.1 Nausea and/or vomiting | 15 | 1154 | Risk Ratio (M‐H, Random, 95% CI) | 0.83 [0.61, 1.13] |
| 4.2 Nausea | 5 | 390 | Risk Ratio (M‐H, Random, 95% CI) | 1.10 [0.77, 1.58] |
| 4.3 Vomiting | 4 | 320 | Risk Ratio (M‐H, Random, 95% CI) | 1.35 [0.55, 3.27] |
| 5 Neonates with acidosis (pH < 7.2) Show forest plot | 6 | 678 | Risk Ratio (M‐H, Random, 95% CI) | 0.83 [0.15, 4.52] |
| 6 Neonates: Apgar score Show forest plot | 13 | Risk Ratio (M‐H, Random, 95% CI) | Subtotals only | |
| 6.1 Apgar < 7 at 5 min | 2 | 127 | Risk Ratio (M‐H, Random, 95% CI) | 0.16 [0.01, 2.90] |
| 6.2 Apgar < 8 at 5 min | 11 | 826 | Risk Ratio (M‐H, Random, 95% CI) | 0.24 [0.03, 2.05] |
| Outcome or subgroup title | No. of studies | No. of participants | Statistical method | Effect size |
| 1 Women with hypotension requiring intervention Show forest plot | 5 | 426 | Risk Ratio (M‐H, Random, 95% CI) | 0.40 [0.16, 0.96] |
| 2 Women with bradycardia Show forest plot | 1 | 54 | Risk Ratio (M‐H, Random, 95% CI) | 7.70 [0.46, 127.78] |
| 3 Women with nausea and/or vomiting Show forest plot | 2 | 245 | Risk Ratio (M‐H, Random, 95% CI) | 1.65 [0.75, 3.64] |
| 4 Neonates with acidosis (pH < 7.2) Show forest plot | 1 | 205 | Risk Ratio (M‐H, Random, 95% CI) | 1.24 [0.34, 4.48] |
| 5 Neonates with Apgar score < 7 at 5 min Show forest plot | 4 | 221 | Risk Ratio (M‐H, Random, 95% CI) | 0.07 [0.00, 1.24] |
| 6 Neonatal Apgar < 8 at 5 min Show forest plot | 1 | 205 | Risk Ratio (M‐H, Random, 95% CI) | 0.0 [0.0, 0.0] |
| Outcome or subgroup title | No. of studies | No. of participants | Statistical method | Effect size |
| 1 Women with hypotension requiring intervention Show forest plot | 3 | 134 | Risk Ratio (M‐H, Random, 95% CI) | 0.75 [0.27, 2.08] |
| 2 Apgar < 9 at 5 min Show forest plot | 1 | Risk Ratio (M‐H, Random, 95% CI) | Subtotals only | |
| Outcome or subgroup title | No. of studies | No. of participants | Statistical method | Effect size |
| 1 Women with hypotension requiring intervention Show forest plot | 4 | 320 | Risk Ratio (M‐H, Random, 95% CI) | 0.93 [0.78, 1.10] |
| 2 Women with cardiac dysrhythmia Show forest plot | 3 | Risk Ratio (M‐H, Random, 95% CI) | Subtotals only | |
| 2.1 Bradycardia | 2 | 82 | Risk Ratio (M‐H, Random, 95% CI) | 0.75 [0.20, 2.88] |
| 2.2 Tachycardia | 1 | 46 | Risk Ratio (M‐H, Random, 95% CI) | 0.0 [0.0, 0.0] |
| 3 Women with nausea and/or vomiting Show forest plot | 2 | Risk Ratio (M‐H, Random, 95% CI) | Subtotals only | |
| 3.1 Nausea and/or vomiting | 1 | 178 | Risk Ratio (M‐H, Random, 95% CI) | 0.92 [0.63, 1.35] |
| 3.2 Nausea | 1 | 46 | Risk Ratio (M‐H, Random, 95% CI) | 1.0 [0.15, 6.51] |
| 3.3 Vomiting | 1 | 46 | Risk Ratio (M‐H, Random, 95% CI) | 0.0 [0.0, 0.0] |
| 4 Women with anaphylaxis Show forest plot | 1 | 178 | Risk Ratio (M‐H, Random, 95% CI) | 0.0 [0.0, 0.0] |
| 5 Neonates with Apgar score < 7 at 5 min Show forest plot | 1 | 36 | Risk Ratio (M‐H, Random, 95% CI) | 0.0 [0.0, 0.0] |
| Outcome or subgroup title | No. of studies | No. of participants | Statistical method | Effect size |
| 1 Women with hypotension requiring intervention Show forest plot | 2 | Risk Ratio (M‐H, Random, 95% CI) | Subtotals only | |
| 1.1 Albumin or dextrose vs dextrose | 1 | 45 | Risk Ratio (M‐H, Random, 95% CI) | 0.13 [0.01, 2.30] |
| 1.2 Unbalanced vs balanced hydroxyethyl starch | 1 | 51 | Risk Ratio (M‐H, Random, 95% CI) | 1.04 [0.78, 1.39] |
| 2 Neonates: Apgar score < 7 Show forest plot | 1 | 45 | Risk Ratio (M‐H, Random, 95% CI) | 0.13 [0.01, 2.30] |
| 2.1 Albumin or dextrose vs dextrose | 1 | 45 | Risk Ratio (M‐H, Random, 95% CI) | 0.13 [0.01, 2.30] |
| 3 Neonates with Apgar score < 8 at 5 min Show forest plot | 1 | 51 | Risk Ratio (M‐H, Random, 95% CI) | 0.0 [0.0, 0.0] |
| 3.1 Unbalanced vs balanced hydroxyethyl starch | 1 | 51 | Risk Ratio (M‐H, Random, 95% CI) | 0.0 [0.0, 0.0] |
| Outcome or subgroup title | No. of studies | No. of participants | Statistical method | Effect size |
| 1 Women with hypotension requiring intervention Show forest plot | 22 | 1401 | Risk Ratio (M‐H, Random, 95% CI) | 0.65 [0.53, 0.80] |
| 2 Women with hypertension requiring intervention Show forest plot | 7 | 520 | Risk Ratio (M‐H, Random, 95% CI) | 1.61 [1.00, 2.61] |
| 3 Women with cardiac arrhythmia Show forest plot | 3 | Risk Ratio (M‐H, Random, 95% CI) | Subtotals only | |
| 3.1 Tachycardia | 2 | 93 | Risk Ratio (M‐H, Random, 95% CI) | 1.12 [0.74, 1.70] |
| 3.2 Bradycardia | 2 | 103 | Risk Ratio (M‐H, Random, 95% CI) | 14.46 [0.87, 241.09] |
| 4 Women with nausea and/or vomiting Show forest plot | 13 | Risk Ratio (M‐H, Random, 95% CI) | Subtotals only | |
| 4.1 Nausea and/or vomiting | 5 | 219 | Risk Ratio (M‐H, Random, 95% CI) | 0.71 [0.22, 2.34] |
| 4.2 Nausea | 8 | 620 | Risk Ratio (M‐H, Random, 95% CI) | 0.68 [0.48, 0.96] |
| 4.3 Vomiting | 6 | 516 | Risk Ratio (M‐H, Random, 95% CI) | 0.68 [0.44, 1.07] |
| 5 Neonates with acidosis (pH < 7.2) Show forest plot | 9 | 576 | Risk Ratio (M‐H, Random, 95% CI) | 1.29 [0.67, 2.49] |
| 6 Neonates: Apgar score Show forest plot | 14 | Risk Ratio (M‐H, Random, 95% CI) | Subtotals only | |
| 6.1 Apgar < 8 at 5 min | 10 | 579 | Risk Ratio (M‐H, Random, 95% CI) | 0.0 [0.0, 0.0] |
| 6.2 Apgar < 7 at 5 min | 4 | 263 | Risk Ratio (M‐H, Random, 95% CI) | 1.14 [0.34, 3.81] |
| Outcome or subgroup title | No. of studies | No. of participants | Statistical method | Effect size |
| 1 Women with hypotension requiring intervention Show forest plot | 9 | 613 | Risk Ratio (M‐H, Random, 95% CI) | 0.60 [0.47, 0.78] |
| 2 Women with hypertension requiring intervention Show forest plot | 3 | 280 | Risk Ratio (M‐H, Random, 95% CI) | 1.10 [0.37, 3.28] |
| 3 Women with bradycardia Show forest plot | 1 | 100 | Risk Ratio (M‐H, Fixed, 95% CI) | 0.33 [0.01, 7.99] |
| 4 Women with nausea and/or vomiting Show forest plot | 5 | Risk Ratio (M‐H, Random, 95% CI) | Subtotals only | |
| 4.1 Nausea and/or vomiting | 2 | 146 | Risk Ratio (M‐H, Random, 95% CI) | 1.0 [0.48, 2.08] |
| 4.2 Nausea | 3 | 220 | Risk Ratio (M‐H, Random, 95% CI) | 0.54 [0.31, 0.93] |
| 4.3 Vomiting | 3 | 220 | Risk Ratio (M‐H, Random, 95% CI) | 0.57 [0.31, 1.05] |
| 5 Women with impaired consciousness Show forest plot | 1 | 46 | Risk Ratio (M‐H, Random, 95% CI) | 0.4 [0.09, 1.86] |
| 6 Neonates with acidosis (pH < 7.2) Show forest plot | 2 | 218 | Risk Ratio (M‐H, Random, 95% CI) | 1.41 [0.48, 4.15] |
| 7 Neonatal Apgar score Show forest plot | 5 | Risk Ratio (M‐H, Random, 95% CI) | Subtotals only | |
| 7.1 Apgar < 8 at 5 min | 4 | 226 | Risk Ratio (M‐H, Random, 95% CI) | 3.0 [0.13, 71.92] |
| 7.2 Apgar < 7 at 5 min | 1 | 120 | Risk Ratio (M‐H, Random, 95% CI) | 0.0 [0.0, 0.0] |
| Outcome or subgroup title | No. of studies | No. of participants | Statistical method | Effect size |
| 1 Women with hypotension requiring intervention Show forest plot | 1 | 75 | Risk Ratio (M‐H, Random, 95% CI) | 0.65 [0.38, 1.12] |
| 2 Women with nausea and/or vomiting Show forest plot | 1 | Risk Ratio (M‐H, Random, 95% CI) | Subtotals only | |
| 2.1 Nausea | 1 | 75 | Risk Ratio (M‐H, Random, 95% CI) | 0.42 [0.22, 0.81] |
| 2.2 Vomiting | 1 | 75 | Risk Ratio (M‐H, Random, 95% CI) | 0.17 [0.04, 0.77] |
| Outcome or subgroup title | No. of studies | No. of participants | Statistical method | Effect size |
| 1 Women with hypotension requiring intervention Show forest plot | 1 | 75 | Risk Ratio (M‐H, Random, 95% CI) | 0.39 [0.21, 0.74] |
| 2 Women with nausea and/or vomiting Show forest plot | 1 | Risk Ratio (M‐H, Random, 95% CI) | Subtotals only | |
| 2.1 Nausea | 1 | 75 | Risk Ratio (M‐H, Random, 95% CI) | 0.27 [0.11, 0.65] |
| 2.2 Vomiting | 1 | 75 | Risk Ratio (M‐H, Random, 95% CI) | 0.38 [0.09, 1.55] |
| Outcome or subgroup title | No. of studies | No. of participants | Statistical method | Effect size |
| 1 Women with hypotension requiring intervention Show forest plot | 8 | 401 | Risk Ratio (M‐H, Random, 95% CI) | 0.92 [0.71, 1.18] |
| 2 Women with hypertension requiring intervention Show forest plot | 2 | 118 | Risk Ratio (M‐H, Random, 95% CI) | 1.72 [0.71, 4.16] |
| 3 Cardiac dysrhythmia Show forest plot | 5 | Risk Ratio (M‐H, Random, 95% CI) | Subtotals only | |
| 3.1 Bradycardia | 5 | 304 | Risk Ratio (M‐H, Random, 95% CI) | 0.37 [0.21, 0.64] |
| 3.2 Tachycardia | 1 | 57 | Risk Ratio (M‐H, Random, 95% CI) | 2.22 [0.44, 11.18] |
| 4 Women with nausea and/or vomiting Show forest plot | 4 | 204 | Risk Ratio (M‐H, Random, 95% CI) | 0.76 [0.39, 1.49] |
| 5 Neonates with acidosis (pH < 7.2) Show forest plot | 3 | 175 | Risk Ratio (M‐H, Random, 95% CI) | 0.89 [0.07, 12.00] |
| 6 Neonates with Apgar score < 8 at 5 min Show forest plot | 6 | 321 | Risk Ratio (M‐H, Random, 95% CI) | 0.0 [0.0, 0.0] |
| Outcome or subgroup title | No. of studies | No. of participants | Statistical method | Effect size |
| 1 Women with hypotension requiring intervention Show forest plot | 1 | 20 | Risk Ratio (M‐H, Random, 95% CI) | 0.0 [0.0, 0.0] |
| 2 Women with nausea and/or vomiting Show forest plot | 1 | 20 | Risk Ratio (M‐H, Random, 95% CI) | 3.0 [0.14, 65.90] |
| 3 Neonates with acidosis (pH < 7.2) Show forest plot | 1 | 20 | Risk Ratio (M‐H, Random, 95% CI) | 9.00 [0.55, 147.95] |
| Outcome or subgroup title | No. of studies | No. of participants | Statistical method | Effect size |
| 1 Women with hypotension requiring intervention Show forest plot | 2 | 160 | Risk Ratio (M‐H, Random, 95% CI) | 0.53 [0.36, 0.79] |
| 2 Women with hypertension requiring intervention Show forest plot | 1 | 100 | Risk Ratio (M‐H, Fixed, 95% CI) | 3.0 [0.32, 27.87] |
| 3 Women with bradycardia Show forest plot | 1 | 100 | Risk Ratio (M‐H, Fixed, 95% CI) | 0.0 [0.0, 0.0] |
| 4 Women with nausea and vomiting Show forest plot | 2 | Risk Ratio (M‐H, Random, 95% CI) | Subtotals only | |
| 4.1 Women with nausea and/or vomiting | 1 | 100 | Risk Ratio (M‐H, Random, 95% CI) | 5.00 [0.25, 101.58] |
| 4.2 Women with nausea | 1 | 60 | Risk Ratio (M‐H, Random, 95% CI) | 0.22 [0.05, 0.94] |
| 4.3 Women with vomiting | 1 | 60 | Risk Ratio (M‐H, Random, 95% CI) | 0.14 [0.01, 2.65] |
| 5 5 Neonates with acidosis (pH < 7.2) Show forest plot | 1 | 100 | Risk Ratio (M‐H, Fixed, 95% CI) | 0.0 [0.0, 0.0] |
| 6 Apgar score < 8 at 5 min Show forest plot | 2 | 160 | Risk Ratio (M‐H, Random, 95% CI) | 3.0 [0.13, 71.92] |
| Outcome or subgroup title | No. of studies | No. of participants | Statistical method | Effect size |
| 1 Women with hypotension requiring intervention Show forest plot | 1 | 53 | Risk Ratio (M‐H, Random, 95% CI) | 1.56 [0.50, 4.89] |
| 2 Women with hypertension requiring intervention Show forest plot | 1 | 53 | Risk Ratio (M‐H, Random, 95% CI) | 0.62 [0.26, 1.47] |
| 3 Women with bradycardia Show forest plot | 1 | 53 | Risk Ratio (M‐H, Random, 95% CI) | 0.0 [0.0, 0.0] |
| 4 Women with nausea and/or vomiting Show forest plot | 1 | 53 | Risk Ratio (M‐H, Random, 95% CI) | 7.26 [0.39, 134.01] |
| 5 5 Neonates with acidosis (pH < 7.2) Show forest plot | 1 | 53 | Risk Ratio (M‐H, Random, 95% CI) | 0.0 [0.0, 0.0] |
| 6 Neonatal Apgar score < 8 at 5 min Show forest plot | 1 | 53 | Risk Ratio (M‐H, Random, 95% CI) | 0.0 [0.0, 0.0] |
| Outcome or subgroup title | No. of studies | No. of participants | Statistical method | Effect size |
| 1 Women with hypotension requiring intervention Show forest plot | 6 | Risk Ratio (M‐H, Random, 95% CI) | Subtotals only | |
| 1.1 5 mg vs 10 mg | 2 | 100 | Risk Ratio (M‐H, Random, 95% CI) | 1.05 [0.65, 1.69] |
| 1.2 6 mg vs 12 mg | 1 | 46 | Risk Ratio (M‐H, Random, 95% CI) | 1.83 [0.83, 4.04] |
| 1.3 5 mg vs 15 mg | 1 | 40 | Risk Ratio (M‐H, Random, 95% CI) | 2.0 [0.94, 4.27] |
| 1.4 10 mg vs 15 mg | 1 | 40 | Risk Ratio (M‐H, Random, 95% CI) | 1.83 [0.84, 3.99] |
| 1.5 10 mg vs 20 mg | 2 | 60 | Risk Ratio (M‐H, Random, 95% CI) | 1.06 [0.80, 1.39] |
| 1.6 10 mg vs 30 mg | 1 | 40 | Risk Ratio (M‐H, Random, 95% CI) | 2.43 [1.30, 4.54] |
| 1.7 15 mg vs 30 mg | 1 | 100 | Risk Ratio (M‐H, Random, 95% CI) | 2.11 [1.06, 4.21] |
| 1.8 20 mg vs 30 mg | 1 | 40 | Risk Ratio (M‐H, Random, 95% CI) | 2.29 [1.21, 4.32] |
| 2 Women with hypertension requiring intervention Show forest plot | 2 | Risk Ratio (M‐H, Random, 95% CI) | Subtotals only | |
| 2.1 5 mg vs 10 mg | 1 | 40 | Risk Ratio (M‐H, Random, 95% CI) | 1.2 [0.44, 3.30] |
| 2.2 5 mg vs 15 mg | 1 | 40 | Risk Ratio (M‐H, Random, 95% CI) | 0.5 [0.23, 1.07] |
| 2.3 10 mg vs 15 mg | 1 | 40 | Risk Ratio (M‐H, Random, 95% CI) | 0.42 [0.18, 0.96] |
| 2.4 10 mg vs 20 mg | 1 | 40 | Risk Ratio (M‐H, Random, 95% CI) | 0.2 [0.03, 1.56] |
| 2.5 10 mg vs 30 mg | 1 | 40 | Risk Ratio (M‐H, Random, 95% CI) | 0.11 [0.02, 0.80] |
| 2.6 20 mg vs 30 mg | 1 | 40 | Risk Ratio (M‐H, Random, 95% CI) | 0.56 [0.23, 1.37] |
| 3 Women with nausea and/or vomiting Show forest plot | 4 | Risk Ratio (M‐H, Random, 95% CI) | Subtotals only | |
| 3.1 6 mg vs 12 mg (nausea and/or vomiting) | 1 | 46 | Risk Ratio (M‐H, Random, 95% CI) | 0.81 [0.38, 1.74] |
| 3.2 5 mg vs 10 mg (vomiting) | 1 | 40 | Risk Ratio (M‐H, Random, 95% CI) | 3.0 [0.34, 26.45] |
| 3.3 5 mg vs 15 mg (vomiting) | 1 | 40 | Risk Ratio (M‐H, Random, 95% CI) | 1.5 [0.28, 8.04] |
| 3.4 10 mg vs 15 mg (vomiting) | 1 | 40 | Risk Ratio (M‐H, Random, 95% CI) | 0.5 [0.05, 5.08] |
| 3.5 5 mg vs 10 mg (nausea) | 1 | 40 | Risk Ratio (M‐H, Random, 95% CI) | 2.0 [0.83, 4.81] |
| 3.6 5 mg vs 15 mg (nausea) | 1 | 40 | Risk Ratio (M‐H, Random, 95% CI) | 2.5 [0.94, 6.66] |
| 3.7 10 mg vs 15 mg (nausea) | 1 | 40 | Risk Ratio (M‐H, Random, 95% CI) | 1.25 [0.39, 3.99] |
| 3.8 10 mg vs 20 mg (nausea) | 1 | 40 | Risk Ratio (M‐H, Random, 95% CI) | 0.69 [0.39, 1.24] |
| 3.9 10 mg vs 30 mg (nausea) | 1 | 40 | Risk Ratio (M‐H, Random, 95% CI) | 1.8 [0.73, 4.43] |
| 3.10 15 mg vs 30 mg (nausea) | 1 | 100 | Risk Ratio (M‐H, Random, 95% CI) | 1.43 [0.59, 3.45] |
| 3.11 20 mg vs 30 mg (nausea) | 1 | 40 | Risk Ratio (M‐H, Random, 95% CI) | 2.6 [1.14, 5.93] |
| 3.12 15 mg vs 30 mg (vomiting) | 1 | 100 | Risk Ratio (M‐H, Random, 95% CI) | 0.67 [0.12, 3.82] |
| 4 Neonates with acidosis (pH < 7.2) Show forest plot | 3 | Risk Ratio (M‐H, Random, 95% CI) | Subtotals only | |
| 4.1 5 mg vs 10 mg | 1 | 40 | Risk Ratio (M‐H, Random, 95% CI) | 0.2 [0.01, 3.92] |
| 4.2 5 mg vs 15 mg | 1 | 40 | Risk Ratio (M‐H, Random, 95% CI) | 0.33 [0.01, 7.72] |
| 4.3 6 mg vs 12 mg | 1 | 46 | Risk Ratio (M‐H, Random, 95% CI) | 0.31 [0.01, 7.16] |
| 4.4 10 mg vs 15 mg | 1 | 40 | Risk Ratio (M‐H, Random, 95% CI) | 2.0 [0.20, 20.33] |
| 4.5 10 mg vs 20 mg | 1 | 39 | Risk Ratio (M‐H, Random, 95% CI) | 0.59 [0.24, 1.50] |
| 4.6 10 mg vs 30 mg | 1 | 38 | Risk Ratio (M‐H, Random, 95% CI) | 1.13 [0.36, 3.55] |
| 4.7 20 mg vs 30 mg | 1 | 37 | Risk Ratio (M‐H, Random, 95% CI) | 1.89 [0.69, 5.21] |
| 5 Neonatal Apgar score at 5 min Show forest plot | 4 | Risk Ratio (M‐H, Random, 95% CI) | Subtotals only | |
| 5.1 6 mg vs 12 mg (Apgar < 7) | 1 | 46 | Risk Ratio (M‐H, Random, 95% CI) | 0.31 [0.01, 7.16] |
| 5.2 5 mg vs 10 mg (Apgar < 8) | 1 | 40 | Risk Ratio (M‐H, Random, 95% CI) | 0.0 [0.0, 0.0] |
| 5.3 5 mg vs 15 mg (Apgar < 8) | 1 | 40 | Risk Ratio (M‐H, Random, 95% CI) | 0.0 [0.0, 0.0] |
| 5.4 10 mg vs 15 mg (Apgar < 8) | 1 | 40 | Risk Ratio (M‐H, Random, 95% CI) | 0.0 [0.0, 0.0] |
| 5.5 10 mg vs 20 mg (Apgar < 7) | 1 | 40 | Risk Ratio (M‐H, Random, 95% CI) | 0.0 [0.0, 0.0] |
| 5.6 10 mg vs 30 mg (Apgar < 7) | 1 | 40 | Risk Ratio (M‐H, Random, 95% CI) | 0.0 [0.0, 0.0] |
| 5.7 20 mg vs 30 mg (Apgar < 7) | 1 | 40 | Risk Ratio (M‐H, Random, 95% CI) | 0.0 [0.0, 0.0] |
| 5.8 10 mg vs 20 mg (Apgar < 8) | 1 | 20 | Risk Ratio (M‐H, Random, 95% CI) | 0.0 [0.0, 0.0] |
| Outcome or subgroup title | No. of studies | No. of participants | Statistical method | Effect size |
| 1 Women with hypotension requiring intervention Show forest plot | 4 | Risk Ratio (M‐H, Random, 95% CI) | Subtotals only | |
| 1.1 Bolus + infusion vs infusion | 1 | 80 | Risk Ratio (M‐H, Random, 95% CI) | 3.5 [1.26, 9.72] |
| 1.2 0.5 mg/min vs 1 mg/min | 1 | 40 | Risk Ratio (M‐H, Random, 95% CI) | 1.22 [0.65, 2.29] |
| 1.3 0.5 mg/min vs 2 mg/min | 1 | 40 | Risk Ratio (M‐H, Random, 95% CI) | 1.57 [0.77, 3.22] |
| 1.4 0.5 mg/min vs 4 mg/min | 1 | 40 | Risk Ratio (M‐H, Random, 95% CI) | 1.22 [0.65, 2.29] |
| 1.5 1 mg/min vs 2 mg/min | 3 | 107 | Risk Ratio (M‐H, Random, 95% CI) | 1.24 [0.83, 1.84] |
| 1.6 1 mg/min vs 3 to 4 mg/min | 2 | 99 | Risk Ratio (M‐H, Random, 95% CI) | 1.29 [0.81, 2.05] |
| 1.7 2 mg/min vs 3 to 4 mg/min | 2 | 239 | Risk Ratio (M‐H, Random, 95% CI) | 1.21 [0.60, 2.43] |
| 2 Women with hypertension requiring intervention Show forest plot | 2 | Risk Ratio (M‐H, Random, 95% CI) | Subtotals only | |
| 2.1 Bolus + infusion vs infusion | 1 | 80 | Risk Ratio (M‐H, Random, 95% CI) | 1.0 [0.39, 2.59] |
| 2.2 0.5 mg/min vs 1 mg/min | 1 | 40 | Risk Ratio (M‐H, Random, 95% CI) | 5.0 [0.26, 98.00] |
| 2.3 0.5 mg/min vs 2 mg/min | 1 | 40 | Risk Ratio (M‐H, Random, 95% CI) | 0.67 [0.12, 3.57] |
| 2.4 0.5 mg/min vs 4 mg/min | 1 | 40 | Risk Ratio (M‐H, Random, 95% CI) | 0.2 [0.05, 0.80] |
| 2.5 1 mg/min vs 2 mg/min | 1 | 40 | Risk Ratio (M‐H, Random, 95% CI) | 0.14 [0.01, 2.60] |
| 2.6 1 mg/min vs 4 mg/min | 1 | 40 | Risk Ratio (M‐H, Random, 95% CI) | 0.05 [0.00, 0.76] |
| 2.7 2 mg/min vs 4 mg/min | 1 | 40 | Risk Ratio (M‐H, Random, 95% CI) | 0.30 [0.10, 0.93] |
| 3 Women with bradycardia Show forest plot | 1 | 19 | Risk Ratio (M‐H, Random, 95% CI) | 0.0 [0.0, 0.0] |
| 3.1 1 mg/min vs 2 mg/min | 1 | 19 | Risk Ratio (M‐H, Random, 95% CI) | 0.0 [0.0, 0.0] |
| 4 Women with nausea and/or vomiting Show forest plot | 3 | Risk Ratio (M‐H, Random, 95% CI) | Subtotals only | |
| 4.1 Bolus + infusion vs infusion (nausea) | 1 | 80 | Risk Ratio (M‐H, Random, 95% CI) | 1.83 [0.75, 4.48] |
| 4.2 0.5 mg/min vs 1 mg/min (nausea) | 1 | 40 | Risk Ratio (M‐H, Random, 95% CI) | 1.29 [0.60, 2.77] |
| 4.3 0.5 mg/min vs 2 mg/min (nausea) | 1 | 40 | Risk Ratio (M‐H, Random, 95% CI) | 1.5 [0.66, 3.43] |
| 4.4 0.5 mg/min vs 4 mg/min (nausea) | 1 | 40 | Risk Ratio (M‐H, Random, 95% CI) | 1.29 [0.60, 2.77] |
| 4.5 1 mg/min vs 2 mg/min (nausea) | 2 | 60 | Risk Ratio (M‐H, Random, 95% CI) | 2.19 [0.30, 15.85] |
| 4.6 1 mg/min vs 4 mg/min (nausea) | 1 | 40 | Risk Ratio (M‐H, Random, 95% CI) | 1.0 [0.43, 2.33] |
| 4.7 2 mg/min vs 4 mg/min (nausea) | 1 | 40 | Risk Ratio (M‐H, Random, 95% CI) | 0.86 [0.35, 2.10] |
| 4.8 Bolus + infusion vs infusion (vomiting) | 1 | 80 | Risk Ratio (M‐H, Random, 95% CI) | 1.67 [0.43, 6.51] |
| 4.9 0.5 mg/min vs 1 mg/min (vomiting) | 1 | 40 | Risk Ratio (M‐H, Random, 95% CI) | 0.67 [0.12, 3.57] |
| 4.10 0.5 mg/min vs 2 mg/min (vomiting) | 1 | 40 | Risk Ratio (M‐H, Random, 95% CI) | 2.0 [0.20, 20.33] |
| 4.11 0.5 mg/min vs 4 mg/min (vomiting) | 1 | 40 | Risk Ratio (M‐H, Random, 95% CI) | 2.0 [0.20, 20.33] |
| 4.12 1 mg/min vs 2 mg/min (vomiting) | 1 | 40 | Risk Ratio (M‐H, Random, 95% CI) | 3.0 [0.34, 26.45] |
| 4.13 1 mg/min vs 4 mg/min (vomiting) | 1 | 40 | Risk Ratio (M‐H, Random, 95% CI) | 3.0 [0.34, 26.45] |
| 4.14 2 mg/min vs 4 mg/min (vomiting) | 1 | 40 | Risk Ratio (M‐H, Random, 95% CI) | 1.0 [0.07, 14.90] |
| 4.15 1 mg/min vs 2 mg/min (nausea or vomiting) | 1 | 19 | Risk Ratio (M‐H, Random, 95% CI) | 8.18 [0.50, 133.66] |
| 5 Neonates with acidosis (pH < 7.2) Show forest plot | 2 | Risk Ratio (M‐H, Random, 95% CI) | Subtotals only | |
| 5.1 Bolus + infusion vs infusion | 1 | 78 | Risk Ratio (M‐H, Random, 95% CI) | 1.66 [0.53, 5.23] |
| 5.2 0.5 mg/min vs 1 mg/min | 1 | 40 | Risk Ratio (M‐H, Random, 95% CI) | 0.33 [0.04, 2.94] |
| 5.3 0.5 mg/min vs 2 mg/min | 1 | 40 | Risk Ratio (M‐H, Random, 95% CI) | 3.0 [0.13, 69.52] |
| 5.4 0.5 mg/min vs 4 mg/min | 1 | 40 | Risk Ratio (M‐H, Random, 95% CI) | 0.25 [0.03, 2.05] |
| 5.5 1 mg/min vs 2 mg/min | 1 | 40 | Risk Ratio (M‐H, Random, 95% CI) | 7.0 [0.38, 127.32] |
| 5.6 1 mg/min vs 4 mg/min | 1 | 40 | Risk Ratio (M‐H, Random, 95% CI) | 0.75 [0.19, 2.93] |
| 5.7 2 mg/min vs 4 mg/min | 1 | 40 | Risk Ratio (M‐H, Random, 95% CI) | 0.11 [0.01, 1.94] |
| 6 Neonatal Apgar score at 5 min Show forest plot | 3 | Risk Ratio (M‐H, Random, 95% CI) | Subtotals only | |
| 6.1 Bolus + infusion vs infusion (Apgar < 7) | 1 | 80 | Risk Ratio (M‐H, Random, 95% CI) | 0.0 [0.0, 0.0] |
| 6.2 0.5 mg/min vs 1 mg/min (Apgar < 8) | 1 | 40 | Risk Ratio (M‐H, Random, 95% CI) | 0.0 [0.0, 0.0] |
| 6.3 0.5 mg/min vs 2 mg/min (Apgar < 8) | 1 | 40 | Risk Ratio (M‐H, Random, 95% CI) | 0.0 [0.0, 0.0] |
| 6.4 0.5 mg/min vs 4 mg/min (Apgar < 8) | 1 | 40 | Risk Ratio (M‐H, Random, 95% CI) | 0.0 [0.0, 0.0] |
| 6.5 1 mg/min vs 2 mg/min (Apgar < 8) | 2 | 59 | Risk Ratio (M‐H, Random, 95% CI) | 0.0 [0.0, 0.0] |
| 6.6 1 mg/min vs 4 mg/min (Apgar < 8) | 1 | 40 | Risk Ratio (M‐H, Random, 95% CI) | 0.0 [0.0, 0.0] |
| 6.7 2 mg/min vs 4 mg/min (Apgar < 8) | 1 | 40 | Risk Ratio (M‐H, Random, 95% CI) | 0.0 [0.0, 0.0] |
| Outcome or subgroup title | No. of studies | No. of participants | Statistical method | Effect size |
| 1 Women with hypotension requiring intervention Show forest plot | 1 | Risk Ratio (M‐H, Random, 95% CI) | Subtotals only | |
| 1.1 Oral vs IM | 1 | 40 | Risk Ratio (M‐H, Random, 95% CI) | 3.0 [0.95, 9.48] |
| 1.2 Oral vs IV | 1 | 40 | Risk Ratio (M‐H, Random, 95% CI) | 19.00 [1.18, 305.88] |
| 2 Women with hypertension requiring intervention Show forest plot | 1 | Risk Ratio (M‐H, Random, 95% CI) | Subtotals only | |
| 2.1 Oral vs IM | 1 | 40 | Risk Ratio (M‐H, Random, 95% CI) | 0.0 [0.0, 0.0] |
| 2.2 Oral vs IV | 1 | 40 | Risk Ratio (M‐H, Random, 95% CI) | 0.0 [0.0, 0.0] |
| 3 Women with nausea and vomiting Show forest plot | 1 | Risk Ratio (M‐H, Random, 95% CI) | Subtotals only | |
| 3.1 Oral vs IM | 1 | 40 | Risk Ratio (M‐H, Random, 95% CI) | 1.33 [0.34, 5.21] |
| 3.2 Oral vs IV | 1 | 40 | Risk Ratio (M‐H, Random, 95% CI) | 9.00 [0.52, 156.91] |
| Outcome or subgroup title | No. of studies | No. of participants | Statistical method | Effect size |
| 1 Women with hypotension requiring intervention Show forest plot | 1 | 60 | Risk Ratio (M‐H, Random, 95% CI) | 0.75 [0.43, 1.30] |
| 2 Women with hypertension requiring intervention Show forest plot | 1 | 60 | Risk Ratio (M‐H, Random, 95% CI) | 0.0 [0.0, 0.0] |
| 3 Apgar < 8 at 5 min Show forest plot | 1 | 60 | Risk Ratio (M‐H, Random, 95% CI) | 0.0 [0.0, 0.0] |
| Outcome or subgroup title | No. of studies | No. of participants | Statistical method | Effect size |
| 1 Women with hypotension requiring intervention Show forest plot | 5 | 280 | Risk Ratio (M‐H, Random, 95% CI) | 0.45 [0.26, 0.80] |
| 2 Women with cardiac dysrhythmia Show forest plot | 3 | Risk Ratio (M‐H, Random, 95% CI) | Subtotals only | |
| 2.1 Tachycardia | 1 | 56 | Risk Ratio (M‐H, Random, 95% CI) | 0.87 [0.13, 5.73] |
| 2.2 Bradycardia | 3 | 180 | Risk Ratio (M‐H, Random, 95% CI) | 3.23 [0.17, 61.85] |
| 3 Women with nausea and/or vomiting Show forest plot | 3 | 180 | Risk Ratio (M‐H, Random, 95% CI) | 0.70 [0.16, 2.98] |
| 4 Neonates with acidosis (pH < 7.2) Show forest plot | 1 | 49 | Risk Ratio (M‐H, Random, 95% CI) | 0.96 [0.06, 14.50] |
| 5 Neonates with Apgar < 7 at 5 min Show forest plot | 1 | 50 | Risk Ratio (M‐H, Random, 95% CI) | 0.0 [0.0, 0.0] |
| 6 Neonates with Apgar < 8 at 5 min Show forest plot | 2 | 96 | Risk Ratio (M‐H, Random, 95% CI) | 0.0 [0.0, 0.0] |
| Outcome or subgroup title | No. of studies | No. of participants | Statistical method | Effect size |
| 1 Women with hypotension requiring intervention Show forest plot | 1 | 60 | Risk Ratio (M‐H, Random, 95% CI) | 2.0 [0.19, 20.90] |
| 2 Women with hypertension requiring intervention Show forest plot | 1 | 60 | Risk Ratio (M‐H, Random, 95% CI) | 17.0 [1.03, 281.91] |
| 3 Cardiac dysrhythmia Show forest plot | 1 | Risk Ratio (M‐H, Random, 95% CI) | Subtotals only | |
| 3.1 Bradycardia | 1 | 60 | Risk Ratio (M‐H, Random, 95% CI) | 15.0 [0.89, 251.42] |
| 4 Nausea and/or vomiting Show forest plot | 1 | Risk Ratio (M‐H, Random, 95% CI) | Subtotals only | |
| 4.1 Nausea | 1 | 60 | Risk Ratio (M‐H, Random, 95% CI) | 0.2 [0.01, 4.00] |
| 4.2 Vomiting | 1 | 60 | Risk Ratio (M‐H, Random, 95% CI) | 1.0 [0.07, 15.26] |
| Outcome or subgroup title | No. of studies | No. of participants | Statistical method | Effect size |
| 1 Women with hypotension requiring intervention Show forest plot | 1 | 59 | Risk Ratio (M‐H, Random, 95% CI) | 0.84 [0.23, 3.06] |
| 2 Women with hypertension requiring intervention Show forest plot | 1 | 59 | Risk Ratio (M‐H, Random, 95% CI) | 0.25 [0.08, 0.83] |
| 3 Women with bradycardia Show forest plot | 1 | 59 | Risk Ratio (M‐H, Random, 95% CI) | 0.0 [0.0, 0.0] |
| 4 Women with nausea and/or vomiting Show forest plot | 1 | 59 | Risk Ratio (M‐H, Random, 95% CI) | 0.0 [0.0, 0.0] |
| 5 Neonatal pH < 7.2 Show forest plot | 1 | 59 | Risk Ratio (M‐H, Random, 95% CI) | 0.0 [0.0, 0.0] |
| 6 Neonatal Apgar score < 8 at 5 min Show forest plot | 1 | 59 | Risk Ratio (M‐H, Random, 95% CI) | 0.0 [0.0, 0.0] |
| Outcome or subgroup title | No. of studies | No. of participants | Statistical method | Effect size |
| 1 Women with hypotension requiring intervention Show forest plot | 1 | 76 | Risk Ratio (M‐H, Random, 95% CI) | 0.73 [0.46, 1.15] |
| 2 Women with bradycardia Show forest plot | 1 | 76 | Risk Ratio (M‐H, Random, 95% CI) | 0.5 [0.05, 5.28] |
| 3 Women with nausea and/or vomiting Show forest plot | 1 | 76 | Risk Ratio (M‐H, Random, 95% CI) | 1.0 [0.32, 3.17] |
| Outcome or subgroup title | No. of studies | No. of participants | Statistical method | Effect size |
| 1 Women with hypotension requiring intervention Show forest plot | 1 | 60 | Risk Ratio (M‐H, Random, 95% CI) | 1.4 [0.50, 3.92] |
| 2 Women with cardiac dysrhythmia Show forest plot | 1 | 60 | Risk Ratio (M‐H, Random, 95% CI) | 1.22 [0.59, 2.51] |
| 2.1 Bradycardia | 1 | 60 | Risk Ratio (M‐H, Random, 95% CI) | 1.22 [0.59, 2.51] |
| 3 Women with nausea/vomiting Show forest plot | 1 | 60 | Risk Ratio (M‐H, Random, 95% CI) | 0.45 [0.18, 1.15] |
| 4 Neonatal Apgar score < 8 at 5 min Show forest plot | 1 | 60 | Risk Ratio (M‐H, Random, 95% CI) | 0.0 [0.0, 0.0] |
| Outcome or subgroup title | No. of studies | No. of participants | Statistical method | Effect size |
| 1 Women with hypotension requiring intervention Show forest plot | 1 | 117 | Risk Ratio (M‐H, Random, 95% CI) | 8.17 [1.04, 64.30] |
| 1.1 50 μg/mL vs 100 μg/mL | 1 | 117 | Risk Ratio (M‐H, Random, 95% CI) | 8.17 [1.04, 64.30] |
| 2 Women with hypertension requiring intervention Show forest plot | 1 | 117 | Risk Ratio (M‐H, Random, 95% CI) | 0.23 [0.05, 1.02] |
| 2.1 50 μg/mL vs 100 μg/mL | 1 | 117 | Risk Ratio (M‐H, Random, 95% CI) | 0.23 [0.05, 1.02] |
| 3 Women with cardiac dysrhythmia Show forest plot | 1 | 117 | Risk Ratio (M‐H, Random, 95% CI) | 0.11 [0.01, 0.80] |
| 3.1 Bradycardia: 50 μg/mL vs 100 μg/mL | 1 | 117 | Risk Ratio (M‐H, Random, 95% CI) | 0.11 [0.01, 0.80] |
| 4 Women with nausea and/or vomiting Show forest plot | 1 | 117 | Risk Ratio (M‐H, Random, 95% CI) | 3.5 [0.37, 32.67] |
| 4.1 Nausea and vomiting: 50 μg/mL vs 100 μg/mL | 1 | 117 | Risk Ratio (M‐H, Random, 95% CI) | 3.5 [0.37, 32.67] |
| 5 Neonatal cord blood pH < 7.2 Show forest plot | 1 | 117 | Risk Ratio (M‐H, Random, 95% CI) | 0.0 [0.0, 0.0] |
| 5.1 50 μg/mL vs 100 μg/mL | 1 | 117 | Risk Ratio (M‐H, Random, 95% CI) | 0.0 [0.0, 0.0] |
| 6 Neonatal Apgar score < 8 at 5 min Show forest plot | 1 | 117 | Risk Ratio (M‐H, Random, 95% CI) | 0.0 [0.0, 0.0] |
| 6.1 50 μg/mL vs 100 μg/mL | 1 | 117 | Risk Ratio (M‐H, Random, 95% CI) | 0.0 [0.0, 0.0] |
| Outcome or subgroup title | No. of studies | No. of participants | Statistical method | Effect size |
| 1 Women with hypotension requiring intervention Show forest plot | 2 | 142 | Risk Ratio (M‐H, Random, 95% CI) | 0.63 [0.21, 1.91] |
| 2 Women with hypertension requiring intervention Show forest plot | 1 | 93 | Risk Ratio (M‐H, Random, 95% CI) | 2.67 [1.31, 5.43] |
| 3 Women with bradycardia Show forest plot | 1 | 93 | Risk Ratio (M‐H, Random, 95% CI) | 0.21 [0.01, 4.32] |
| 4 Women with nausea and/or vomiting Show forest plot | 2 | Risk Ratio (M‐H, Random, 95% CI) | Subtotals only | |
| 4.1 Nausea or vomiting | 1 | 93 | Risk Ratio (M‐H, Random, 95% CI) | 2.49 [0.69, 9.04] |
| 4.2 Nausea | 1 | 49 | Risk Ratio (M‐H, Random, 95% CI) | 0.61 [0.36, 1.06] |
| 4.3 Vomiting | 1 | 49 | Risk Ratio (M‐H, Random, 95% CI) | 0.52 [0.10, 2.59] |
| 5 Neonates with Apgar score < 8 at 5 min Show forest plot | 2 | 142 | Risk Ratio (M‐H, Random, 95% CI) | 0.0 [0.0, 0.0] |
| Outcome or subgroup title | No. of studies | No. of participants | Statistical method | Effect size |
| 1 Women with hypotension requiring intervention Show forest plot | 8 | 740 | Risk Ratio (M‐H, Random, 95% CI) | 0.67 [0.54, 0.83] |
| 1.1 2 mg vs control | 2 | 79 | Risk Ratio (M‐H, Random, 95% CI) | 0.90 [0.51, 1.58] |
| 1.2 4 mg vs control | 5 | 277 | Risk Ratio (M‐H, Random, 95% CI) | 0.46 [0.34, 0.63] |
| 1.3 6 mg vs control | 1 | 38 | Risk Ratio (M‐H, Random, 95% CI) | 0.48 [0.22, 1.03] |
| 1.4 8 mg vs control | 5 | 346 | Risk Ratio (M‐H, Random, 95% CI) | 0.85 [0.70, 1.03] |
| 2 Women with bradycardia Show forest plot | 8 | 740 | Risk Ratio (M‐H, Random, 95% CI) | 0.49 [0.28, 0.87] |
| 2.1 2 mg vs control | 2 | 79 | Risk Ratio (M‐H, Random, 95% CI) | 0.23 [0.02, 3.29] |
| 2.2 4 mg vs control | 5 | 277 | Risk Ratio (M‐H, Random, 95% CI) | 0.33 [0.16, 0.71] |
| 2.3 6 mg vs control | 1 | 38 | Risk Ratio (M‐H, Random, 95% CI) | 0.0 [0.0, 0.0] |
| 2.4 8 mg vs control | 5 | 346 | Risk Ratio (M‐H, Random, 95% CI) | 0.94 [0.38, 2.37] |
| 3 Women with nausea or vomiting Show forest plot | 7 | 653 | Risk Ratio (M‐H, Random, 95% CI) | 0.35 [0.24, 0.51] |
| 3.1 2 mg vs control | 2 | 79 | Risk Ratio (M‐H, Random, 95% CI) | 0.54 [0.18, 1.59] |
| 3.2 4 mg vs control | 5 | 277 | Risk Ratio (M‐H, Random, 95% CI) | 0.32 [0.17, 0.60] |
| 3.3 6 mg vs control | 1 | 38 | Risk Ratio (M‐H, Random, 95% CI) | 0.09 [0.01, 0.74] |
| 3.4 8 mg vs control | 4 | 259 | Risk Ratio (M‐H, Random, 95% CI) | 0.38 [0.19, 0.76] |
| 4 Women with anaphylaxis Show forest plot | 1 | 150 | Risk Ratio (M‐H, Random, 95% CI) | 0.0 [0.0, 0.0] |
| 4.1 2 mg vs control | 1 | 37 | Risk Ratio (M‐H, Random, 95% CI) | 0.0 [0.0, 0.0] |
| 4.2 4 mg vs control | 1 | 37 | Risk Ratio (M‐H, Random, 95% CI) | 0.0 [0.0, 0.0] |
| 4.3 6 mg vs control | 1 | 38 | Risk Ratio (M‐H, Random, 95% CI) | 0.0 [0.0, 0.0] |
| 4.4 8 mg vs control | 1 | 38 | Risk Ratio (M‐H, Random, 95% CI) | 0.0 [0.0, 0.0] |
| 5 Neonatal Apgar score < 8 at 5 min Show forest plot | 3 | 284 | Risk Ratio (M‐H, Random, 95% CI) | 0.0 [0.0, 0.0] |
| 5.1 2 mg vs control | 1 | 37 | Risk Ratio (M‐H, Random, 95% CI) | 0.0 [0.0, 0.0] |
| 5.2 4 mg vs control | 2 | 102 | Risk Ratio (M‐H, Random, 95% CI) | 0.0 [0.0, 0.0] |
| 5.3 6 mg vs control | 1 | 38 | Risk Ratio (M‐H, Random, 95% CI) | 0.0 [0.0, 0.0] |
| 5.4 8 mg vs control | 2 | 107 | Risk Ratio (M‐H, Random, 95% CI) | 0.0 [0.0, 0.0] |
| 6 Neonatal pH < 7.2 Show forest plot | 2 | 134 | Risk Ratio (M‐H, Random, 95% CI) | 0.48 [0.05, 5.09] |
| 6.1 4 mg vs control | 1 | 65 | Risk Ratio (M‐H, Random, 95% CI) | 0.48 [0.05, 5.09] |
| 6.2 8 mg vs control | 1 | 69 | Risk Ratio (M‐H, Random, 95% CI) | 0.0 [0.0, 0.0] |
| Outcome or subgroup title | No. of studies | No. of participants | Statistical method | Effect size |
| 1 Women with hypotension requiring intervention Show forest plot | 1 | 112 | Risk Ratio (M‐H, Random, 95% CI) | 1.07 [0.76, 1.49] |
| 2 Women with bradycardia Show forest plot | 1 | 112 | Risk Ratio (M‐H, Random, 95% CI) | 3.0 [0.12, 72.10] |
| 3 Women with nausea and/or vomiting Show forest plot | 1 | 112 | Risk Ratio (M‐H, Random, 95% CI) | 0.38 [0.10, 1.34] |
| Outcome or subgroup title | No. of studies | No. of participants | Statistical method | Effect size |
| 1 Women with hypotension requiring intervention Show forest plot | 1 | 200 | Risk Ratio (M‐H, Random, 95% CI) | 0.05 [0.02, 0.14] |
| Outcome or subgroup title | No. of studies | No. of participants | Statistical method | Effect size |
| 1 Women with hypotension requiring intervention Show forest plot | 1 | 105 | Risk Ratio (M‐H, Random, 95% CI) | 0.79 [0.62, 1.01] |
| 1.1 0.25 mg/kg IV ketamine | 1 | 52 | Risk Ratio (M‐H, Random, 95% CI) | 0.83 [0.61, 1.14] |
| 1.2 0.5 mg/kg IV ketamine | 1 | 53 | Risk Ratio (M‐H, Random, 95% CI) | 0.73 [0.50, 1.07] |
| 2 Women with nausea and/or vomiting Show forest plot | 1 | 105 | Risk Ratio (M‐H, Random, 95% CI) | 0.79 [0.50, 1.25] |
| 2.1 0.25 mg/kg IV ketamine | 1 | 52 | Risk Ratio (M‐H, Random, 95% CI) | 0.91 [0.48, 1.71] |
| 2.2 0.5 mg/kg IV ketamine | 1 | 53 | Risk Ratio (M‐H, Random, 95% CI) | 0.69 [0.36, 1.31] |
| 3 Apgar score < 8 at 5 min Show forest plot | 1 | 105 | Risk Ratio (M‐H, Random, 95% CI) | 0.0 [0.0, 0.0] |
| 3.1 0.25 mg/kg IV ketamine | 1 | 52 | Risk Ratio (M‐H, Random, 95% CI) | 0.0 [0.0, 0.0] |
| 3.2 0.5 mg/kg IV ketamine | 1 | 53 | Risk Ratio (M‐H, Random, 95% CI) | 0.0 [0.0, 0.0] |
| Outcome or subgroup title | No. of studies | No. of participants | Statistical method | Effect size |
| 1 Women with hypotension requiring intervention Show forest plot | 1 | 20 | Risk Ratio (M‐H, Random, 95% CI) | 0.09 [0.01, 1.45] |
| 2 Women with nausea and/or vomiting Show forest plot | 1 | 20 | Risk Ratio (M‐H, Random, 95% CI) | 0.2 [0.01, 3.70] |
| 3 Neonates with acidosis (pH < 7.2) Show forest plot | 1 | 20 | Risk Ratio (M‐H, Random, 95% CI) | 0.0 [0.0, 0.0] |
| Outcome or subgroup title | No. of studies | No. of participants | Statistical method | Effect size |
| 1 Women with hypotension requiring intervention Show forest plot | 1 | 30 | Risk Ratio (M‐H, Random, 95% CI) | 0.05 [0.00, 0.75] |
| 2 Neonatal Apgar score < 8 at 5 min Show forest plot | 1 | 30 | Risk Ratio (M‐H, Random, 95% CI) | 0.0 [0.0, 0.0] |
| Outcome or subgroup title | No. of studies | No. of participants | Statistical method | Effect size |
| 1 Women with hypotension requiring intervention Show forest plot | 11 | 705 | Risk Ratio (M‐H, Random, 95% CI) | 0.61 [0.47, 0.78] |
| 2 Women with bradycardia Show forest plot | 1 | 74 | Risk Ratio (M‐H, Random, 95% CI) | 0.63 [0.11, 3.56] |
| 3 Women with nausea and/or vomiting Show forest plot | 4 | Risk Ratio (M‐H, Random, 95% CI) | Subtotals only | |
| 3.1 Women with nausea and/or vomiting | 4 | 276 | Risk Ratio (M‐H, Random, 95% CI) | 0.42 [0.14, 1.27] |
| 3.2 Women with nausea | 1 | 92 | Risk Ratio (M‐H, Random, 95% CI) | 1.44 [0.25, 8.20] |
| 3.3 Women with vomiting | 1 | 92 | Risk Ratio (M‐H, Random, 95% CI) | 0.0 [0.0, 0.0] |
| 4 Neonates with Apgar score < 8 at 5 min Show forest plot | 3 | 130 | Risk Ratio (M‐H, Random, 95% CI) | 0.0 [0.0, 0.0] |
| Outcome or subgroup title | No. of studies | No. of participants | Statistical method | Effect size |
| 1 Women with hypotension requiring intervention Show forest plot | 1 | 80 | Risk Ratio (M‐H, Random, 95% CI) | 0.85 [0.53, 1.37] |
| 2 Women with nausea and/or vomiting Show forest plot | 1 | Risk Ratio (M‐H, Random, 95% CI) | Subtotals only | |
| 2.1 Women with nausea | 1 | 80 | Risk Ratio (M‐H, Random, 95% CI) | 0.27 [0.12, 0.60] |
| 2.2 Women with vomiting | 1 | 80 | Risk Ratio (M‐H, Random, 95% CI) | 0.11 [0.01, 2.00] |
| Outcome or subgroup title | No. of studies | No. of participants | Statistical method | Effect size |
| 1 Women with hypotension requiring intervention Show forest plot | 1 | 40 | Risk Ratio (M‐H, Random, 95% CI) | 0.71 [0.47, 1.06] |
| 2 Neonates with Apgar score < 8 at 5 min Show forest plot | 1 | 40 | Risk Ratio (M‐H, Random, 95% CI) | 0.0 [0.0, 0.0] |
| Outcome or subgroup title | No. of studies | No. of participants | Statistical method | Effect size |
| 1 Women with hypotension requiring intervention Show forest plot | 1 | 34 | Risk Ratio (M‐H, Random, 95% CI) | 1.07 [0.81, 1.42] |
| Outcome or subgroup title | No. of studies | No. of participants | Statistical method | Effect size |
| 1 Women with hypotension requiring intervention Show forest plot | 1 | 40 | Risk Ratio (M‐H, Random, 95% CI) | 0.92 [0.57, 1.49] |
| 2 Neonates with Apgar score < 8 at 5 min Show forest plot | 1 | 40 | Risk Ratio (M‐H, Random, 95% CI) | 0.0 [0.0, 0.0] |
| Outcome or subgroup title | No. of studies | No. of participants | Statistical method | Effect size |
| 1 Women with hypotension requiring intervention Show forest plot | 1 | 98 | Risk Ratio (M‐H, Random, 95% CI) | 0.81 [0.58, 1.12] |
| 2 Women with nausea and/or vomiting Show forest plot | 1 | Risk Ratio (M‐H, Random, 95% CI) | Subtotals only | |
| 2.1 Nausea | 1 | 98 | Risk Ratio (M‐H, Random, 95% CI) | 0.65 [0.40, 1.07] |
| 2.2 Vomiting | 1 | 98 | Risk Ratio (M‐H, Random, 95% CI) | 0.38 [0.02, 9.01] |
| 3 Neonates with acidosis (pH < 7.2) Show forest plot | 1 | 98 | Risk Ratio (M‐H, Random, 95% CI) | 0.0 [0.0, 0.0] |
| 4 Neonates with Apgar < 7 at 5 min Show forest plot | 1 | 98 | Risk Ratio (M‐H, Random, 95% CI) | 0.0 [0.0, 0.0] |
| Outcome or subgroup title | No. of studies | No. of participants | Statistical method | Effect size |
| 1 Women requiring intervention for hypotension Show forest plot | 1 | 37 | Risk Ratio (M‐H, Random, 95% CI) | 0.71 [0.41, 1.21] |
| Outcome or subgroup title | No. of studies | No. of participants | Statistical method | Effect size |
| 1 Women with hypotension requiring intervention Show forest plot | 2 | 126 | Risk Ratio (M‐H, Random, 95% CI) | 0.91 [0.75, 1.09] |
| 2 Women with cardiac dysrhythmia requiring intervention Show forest plot | 1 | 40 | Risk Ratio (M‐H, Random, 95% CI) | 0.5 [0.05, 5.08] |
| 3 Neonates admitted to neonatal intensive care unit Show forest plot | 1 | 40 | Risk Ratio (M‐H, Random, 95% CI) | 0.0 [0.0, 0.0] |
| 4 Women with nausea Show forest plot | 1 | 86 | Risk Ratio (M‐H, Random, 95% CI) | 0.81 [0.45, 1.48] |
| Outcome or subgroup title | No. of studies | No. of participants | Statistical method | Effect size |
| 1 Women with hypotension requiring intervention Show forest plot | 1 | 58 | Risk Ratio (M‐H, Random, 95% CI) | 1.20 [0.80, 1.79] |
| 2 Women with cardiac dysrhythmia requiring intervention Show forest plot | 1 | Risk Ratio (M‐H, Random, 95% CI) | Subtotals only | |
| 2.1 Bradycardia | 1 | 58 | Risk Ratio (M‐H, Random, 95% CI) | 0.10 [0.01, 1.68] |
| 3 Women with nausea and/or vomiting Show forest plot | 1 | Risk Ratio (M‐H, Random, 95% CI) | Subtotals only | |
| 3.1 Nausea: 15 degree tilt | 1 | 58 | Risk Ratio (M‐H, Random, 95% CI) | 0.45 [0.18, 1.11] |
| 3.2 Vomiting: 15 degree tilt | 1 | 58 | Risk Ratio (M‐H, Random, 95% CI) | 0.15 [0.01, 2.83] |
| Outcome or subgroup title | No. of studies | No. of participants | Statistical method | Effect size |
| 1 Women with hypotension requiring intervention Show forest plot | 1 | 90 | Risk Ratio (M‐H, Random, 95% CI) | 0.63 [0.49, 0.80] |
| Outcome or subgroup title | No. of studies | No. of participants | Statistical method | Effect size |
| 1 Women with hypotension requiring intervention Show forest plot | 1 | 63 | Risk Ratio (M‐H, Random, 95% CI) | 0.73 [0.42, 1.26] |
| Outcome or subgroup title | No. of studies | No. of participants | Statistical method | Effect size |
| 1 Women with hypotension requiring intervention Show forest plot | 1 | 50 | Risk Ratio (M‐H, Random, 95% CI) | 0.84 [0.58, 1.22] |
| 2 Women with nausea and/or vomiting Show forest plot | 1 | Risk Ratio (M‐H, Random, 95% CI) | Subtotals only | |
| 2.1 Nausea | 1 | 50 | Risk Ratio (M‐H, Random, 95% CI) | 0.32 [0.15, 0.66] |
| 2.2 Vomiting | 1 | 50 | Risk Ratio (M‐H, Random, 95% CI) | 0.5 [0.14, 1.78] |
| 3 Neonates with Apgar < 7 at 5 min Show forest plot | 1 | 50 | Risk Ratio (M‐H, Random, 95% CI) | 0.0 [0.0, 0.0] |
| Outcome or subgroup title | No. of studies | No. of participants | Statistical method | Effect size |
| 1 Women with hypotension requiring intervention Show forest plot | 1 | 50 | Risk Ratio (M‐H, Random, 95% CI) | 0.94 [0.63, 1.40] |
| 2 Women with nausea and/or vomiting Show forest plot | 1 | Risk Ratio (M‐H, Random, 95% CI) | Subtotals only | |
| 2.1 Nausea | 1 | 50 | Risk Ratio (M‐H, Random, 95% CI) | 1.5 [0.48, 4.68] |
| 2.2 Vomiting | 1 | 50 | Risk Ratio (M‐H, Random, 95% CI) | 3.0 [0.33, 26.92] |
| 3 Neonates with Apgar < 7 at 5 min Show forest plot | 1 | 50 | Risk Ratio (M‐H, Random, 95% CI) | 0.0 [0.0, 0.0] |