Kortikosteroide zur Behandlung von Blutvergiftung (Sepsis)
Abstract
Background
Sepsis occurs when an infection is complicated by organ failures as defined by a sequential organ failure assessment (SOFA) score of two or higher. Sepsis may be complicated by impaired corticosteroid metabolism. Giving corticosteroids may benefit patients. The original review was published in 2004 and was updated in 2010 and again in 2015.
Objectives
To examine the effects of corticosteroids on death at one month in patients with sepsis, and to examine whether dose and duration of corticosteroids influence patient response to this treatment.
Search methods
We searched the Central Register of Controlled Trials (CENTRAL; 2014, Issue 10), MEDLINE (October 2014), EMBASE (October 2014), Latin American Caribbean Health Sciences Literature (LILACS; October 2014) and reference lists of articles, and we contacted trial authors. The original searches were performed in August 2003 and in October 2009.
Selection criteria
We included randomized controlled trials of corticosteroids versus placebo or supportive treatment in patients with sepsis.
Data collection and analysis
All review authors agreed on the eligibility of trials. One review author extracted data, which were checked by the other review authors, and by the primary author of the paper when possible. We obtained some missing data from trial authors. We assessed the methodological quality of trials.
Main results
We identified nine additional studies since the last update, for a total of 33 eligible trials (n = 4268 participants). Twenty‐three of these 33 trials were at low risk of selection bias, 22 were at low risk of performance and detection bias, 27 were at low risk of attrition bias and 14 were at low risk of selective reporting.
Corticosteroids reduced 28‐day mortality (27 trials; n = 3176; risk ratio (RR) 0.87, 95% confidence interval (CI) 0.76 to 1.00; P value = 0.05, random‐effects model). The quality of evidence for this outcome was downgraded from high to low for imprecision (upper limit of 95% CI = 1) and for inconsistency (significant heterogeneity across trial results). Heterogeneity was related in part to the dosing strategy. Treatment with a long course of low‐dose corticosteroids significantly reduced 28‐day mortality (22 trials; RR 0.87, 95% CI 0.78 to 0.97; P value = 0.01, fixed‐effect model). The quality of evidence was downgraded from high to moderate for inconsistency (owing to non‐significant effects shown by one large trial). Corticosteroids also reduced mortality rate in the intensive care unit (13 trials; RR 0.82, 95% CI 0.68 to 1.00; P value = 0.04, random‐effects model) and at the hospital (17 trials; RR 0.85, 95% CI 0.73 to 0.98; P value = 0.03, random‐effects model). Quality of the evidence for in‐hospital mortality was downgraded from high to moderate for inconsistency and imprecision (upper limit of 95% CI for RR approaching 1). Corticosteroids increased the proportion of shock reversal by day seven (12 trials; RR 1.31, 95% CI 1.14 to 1.51; P value = 0.0001) and by day 28 (seven trials; n = 1013; RR 1.11, 95% CI 1.02 to 1.21; P value = 0.01) and reduced the SOFA score by day seven (eight trials; mean difference (MD) ‐1.53, 95% CI ‐2.04 to ‐1.03; P value < 0.00001, random‐effects model) and survivors' length of stay in the intensive care unit (10 trials; MD ‐2.19, 95% CI ‐3.93 to ‐0.46; P value = 0.01, fixed‐effect model) without inducing gastroduodenal bleeding (19 trials; RR 1.24, 95% CI 0. 92 to 1.67; P value = 0.15, fixed‐effect model), superinfection (19 trials; RR 1.02, 95% CI 0.87 to 1.20; P value = 0.81, fixed‐effect model) or neuromuscular weakness (three trials; RR 0.62, 95% CI 0.21 to 1.88; P value = 0.40, fixed‐effect model). Corticosteroid increased the risk of hyperglycaemia (13 trials; RR 1.26, 95% CI 1.16 to 1.37; P value < 0.00001, fixed‐effect model) and hypernatraemia (three trials; RR 1.64, 95% CI 1.28 to 2.09; P value < 0.0001, fixed‐effect model).
Authors' conclusions
Overall, low‐quality evidence indicates that corticosteroids reduce mortality among patients with sepsis. Moderate‐quality evidence suggests that a long course of low‐dose corticosteroids reduced 28‐day mortality without inducing major complications and led to an increase in metabolic disorders.
PICO
Laienverständliche Zusammenfassung
Kortikosteroide zur Behandlung von Blutvergiftung (Sepsis)
Reviewfrage
In diesem Review untersuchten wir die Evidenz der Wirkung von systemischen Kortikosteroiden auf das Überleben über die Dauer eines Monats, sowie auf die Verträglichkeit bei Blutvergiftungen.
Hintergrund
Eine Blutvergiftung (Sepsis), die schwerste Form einer Infektion, wird diagnostiziert beim Vorliegen eines Infektionsherds mit Zeichen von den gesamten Körper umfassenden, systemischen Entzündungsreaktionen inklusive Organversagen. Die betroffene Person leidet an unzureichender Kontrolle der Körpertemperatur, einer Zu‐ oder Abnahme von weißen Blutkörperchen, sowie einer Beschleunigung von Herzschlag und Atmung. Bei einer Blutvergiftung kann die Wirksamkeit der körpereigenen Kortikosteroide beeinträchtigt werden. Kortikosteroide sind Hormone, die eine Schlüsselfunktion bei der Immunabwehr von Infektionen haben. Seit über 60 Jahren werden Kortikosteroide bei schweren Infektionen mit verschiedenen Ursachen verabreicht.
Recherchedatum
Die in diesem Review enthaltene Evidenz ist auf dem Stand von Oktober 2014.
Studienmerkmale
In diesen Review wurden insgesamt 33 randomisierte kontrollierte Studien eingeschlossen mit 4268 hospitalisierten Patienten, die an Sepsis litten. Bei drei Studien wurden auch Kinder untersucht, die verbleibenden 30 Studien umfassten ausschließlich Daten zu Erwachsenen. In fünf Studien wurden Kortikosteroide mit der alleinigen Standardtherapie verglichen. In den übrigen Studien erfolgte ein Vergleich zwischen Kortikosteroiden und einem Placebo.
Finanzierungsquellen der Studien
Zehn der 33 Studien wurden von einem Arzneimittelhersteller finanziert, 13 von öffentlichen Organisationen oder durch gemeinnützige Mittel, während bei zehn Studien die Finanzierungsquelle nicht angegeben war.
Hauptergebnisse
Durch Kortikosteroide konnte die Sterblichkeit in den ersten 28 Tagen um 13% gesenkt werden (Daten aus 27 Studien mit 3176 Teilnehmern). Die Sterblichkeitsrate sowohl auf der Intensivstation (ICU, Englisch: intensive care unit) als auch in anderen Krankenhausstationen wurde gesenkt (Daten aus 13 bzw. 17 Studien). Aus dem Review ging hervor, dass die positiven Auswirkungen auf das Überleben von der Dosis der Kortikosteroide abhängig war: je niedriger die Dosis (weniger als 400 mg Hydrocortison oder eines Äquivalents am Tag) über einen längeren Behandlungszeitraum (drei oder mehr Tage bei voller Dosierung), desto besser das Ergebnis. Außerdem hingen die Auswirkungen auf das Überleben vom Schweregrad der Erkrankung ab. Mit Bezug auf die ersten sieben Tage nach Beginn eines septischen Schocks (der die Notwendigkeit blutdruckstabilisierender Medikamente beinhaltete) konnten Kortikosteroide die Heilungschancen um 31% erhöht werden (Daten aus 12 Studien). Außerdem wurde die Zahl der Organe, deren Funktion beeinträchtigt war (Organversagen), gesenkt (Daten aus acht Studien). Die Aufenthaltsdauer in der ICU wurde um mehr als 2 Tage reduziert (Daten aus 10 Studien). Es wurden keine schädlichen Wirkungen durch Kortikosteroide festgestellt, bis auf einen schwachen Anstieg des Blutzucker‐ und Salz‐ (Natrium‐)gehalts (Daten aus 13 bzw. drei Studien). Es wurde weder vermehrtes Auftreten von Magen‐Darm‐Blutungen und ‑Infektionen verzeichnet (19 Studien), noch von neuromuskulärer Schwäche (drei Studien).
Es gab nur spärliche Daten zur Wirkung von Kortikosteroiden bei Kindern mit Blutvergiftung.
Qualität der Evidenz
Wir stuften die Qualität der Evidenz für die Sterblichkeit innerhalb von 28 Tagen als niedrig ein wegen mangelnder Präzision (das Konfidenzintervall des statistischen Ergebnisses reichte fast bis zum Punkt, welcher dem Fehlen einer Änderung entspricht) sowie Inkonsistenzen zwischen den Studien. Diese Ergebnisse standen teilweise im Zusammenhang mit den Unterschieden zwischen den einzelnen Studienpopulationen, mit der Art des verabreichten Kortikosteroids, Dosis und Behandlungsdauer, sowie mit dem Einsatz weiterer Behandlungsmaßnahmen. Die Qualität der Evidenz für die Sterblichkeit innerhalb von 28 Tagen in der Untergruppe, der über einen längeren Zeitraum ein niedrigdosiertes Kortikosteroid verabreicht wurde, wurde von hoch auf moderat herabgestuft, da in einer der beiden größten Studien zur Langzeitbehandlung mit niedrigdosierten Kortikosteroiden keine positiven Auswirkungen auf das Überleben beobachtet wurden.
Authors' conclusions
Summary of findings
| Steroids versus control for treating sepsis | ||||||
| Patient or population: patients with sepsis | ||||||
| Outcomes | Illustrative comparative risks* (95% CI) | Relative effect | Number of participants | Quality of the evidence | Comments | |
| Assumed risk | Corresponding risk | |||||
| Control | Steroids vs control | |||||
| 28‐Day all‐cause mortality | Study population | RR 0.87 | 3176 | ⊕⊕⊝⊝ | Trials were conducted over a period from 1976 to 2015. Differences in participant management and in the definition of sepsis were substantial <BR/>18 trial | |
| 318 per 1000 | 276 per 1000 | |||||
| 28‐Day all‐cause mortality by subgroups based on treatment dose/duration ‐ long course of low‐dose corticosteroids | Study population | RR 0.87 | 2266 | ⊕⊕⊕⊝ | Meta‐regression analysis also showed evidence of a dose response: Low doses were associated with better treatment response | |
| 321 per 1000 | 279 per 1000 | |||||
| Hospital mortality | Study population | RR 0.85 | 2014 | ⊕⊕⊕⊝ | Low doses of corticosteroids were associated with better treatment response | |
| 413 per 1000 | 351 per 1000 | |||||
| Number of participants with shock reversal at day 7 | Study population | RR 1.31 | 1561 | ⊕⊕⊕⊕ | Low doses of corticosteroids were associated with better treatment response | |
| 523 per 1000 | 685 per 1000 | |||||
| SOFA score at day 7 | Mean SOFA score at day 7 in intervention groups was | 1132 | ⊕⊕⊕⊕ | Observed reduction in SOFA score was of a magnitude that exceeded any reduction seen with any other treatment for sepsis | ||
| Length of ICU stay for survivors | Mean length of ICU stay for survivors in intervention groups was | 778 | ⊕⊕⊕⊕ | Observed reduction in length of ICU stay was of a magnitude that exceeded any reduction seen with any other treatment for sepsis | ||
| Length of hospital stay for survivors | Mean length of hospital stay for survivors in intervention groups was | 710 | ⊕⊕⊕⊝ | Observed reduction in length of hospital stay was of a magnitude that exceeded any reduction seen with any other treatment for sepsis | ||
| Number of participants with adverse events ‐ superinfections | Study population | RR 1.02 | 2567 | ⊕⊕⊕⊕ | One large trial suggested increased risk of new sepsis with corticosteroids | |
| 161 per 1000 | 164 per 1000 | |||||
| Number of participants with adverse events ‐ hyperglycaemia | Study population | RR 1.26 | 2081 | ⊕⊕⊕⊕ | One trial suggested that risk of hyperglycaemia was lower when corticosteroids were given as a continuous perfusion than when they were given as an intravenous bolus | |
| 348 per 1000 | 438 per 1000 | |||||
| *The basis for the assumed risk is provided in footnotes. The corresponding risk (and its 95% confidence interval) is based on the assumed risk in the comparison group and the relative effect of the intervention (and its 95% CI) | ||||||
| GRADE Working Group grades of evidence | ||||||
| aQuality of evidence was downgraded by 1 point owing to some inconsistency; 1 of the 2 largest trials showed no survival benefit | ||||||
Background
Description of the condition
Sepsis occurs when a site of infection is apparent and evidence shows body‐wide, systemic inflammation. Systemic inflammation is usually defined by two or more criteria: fever or low body temperature, an increase or decrease in white blood cells, an increase in heart rate and rapid breathing (ACCP/SCCM 1992; Bone 1991). Severe sepsis is diagnosed when sepsis is associated with organ failure or hypoperfusion. Septic shock is reported when severe sepsis is combined with a fall in systemic blood pressure that does not improve even when healthcare staff give intravenous fluids. Discussion among the scientific community reveals the need for a more pragmatic definition, such as sepsis corresponding to infection combined with organ failure or hypoperfusion, or septic shock corresponding to vasopressor‐dependent sepsis (Vincent 2013). A task force set up by the Society of Critical Care Medicine and the European Society of Intensive Care Medicine recently introduced a new definition of sepsis and septic shock (Singer 2015). Sepsis is seen when an infection is complicated by organ failures, as defined by a sequential organ failure assessment (SOFA) score (Vincent 1996) of two or higher. Septic shock is noted when infection is complicated by hypotension that requires use of vasopressor therapy while lactate levels are increased to above 2 mmol/L. Current incidence of sepsis in industrialized countries ranges from 50 to 100 cases per 100,000 population, with short‐term mortality of 20% to 50% (Annane 2003; Finfer 2004; Martin 2003; Padkin 2003; The EPISPESIS Group 2004). People usually die from hypotension or from progressive multiple organ failure (Angus 2013; Annane 2005; Parrillo 1993).
Description of the intervention
Corticosteroids include the natural steroid hormones produced by adrenocortical cells and a broad variety of synthetic analogues. These substances have various effects that may be grossly classified into glucocorticoid and mineralocorticoid effects. Glucocorticoid effects include mainly regulation of carbohydrates, lipids and proteins metabolism, as well as regulation of inflammation. Mineralocorticoid effects include mainly regulation of electrolytes and water metabolism. At molecular levels, glucocorticoids have non‐genomic and genomic effects. Rapid (within minutes) non‐genomic effects of glucocorticoids include a decrease in platelet aggregation, in cell adhesion and in intracellular phosphotyrosine kinases, and they include an increase in annexin 1 externalization (Lowenberg 2005). These effects may result from interaction of glucocorticoids with specific membrane sites (Norman 2004). Glucocorticoids have indirect genomic effects, called transrepression (Rhen 2005). These occur within a few hours following exposure of cells to glucocorticoids. They result from physical interaction between the monomeric glucocorticoid‐glucocorticoid receptor (G‐GR) α complex and various nuclear transcription factors, such as nuclear factor (NF)‐κB and activator protein (AP)‐1. Subsequently, these nuclear transcription factors are sequestrated in the cytosol and cannot enter the nucleus, preventing expression of genes encoding for most if not all pro‐inflammatory mediators. Glucocorticoids also have direct genomic effects, called transactivation. They require only a few days of cell exposure to glucocorticoids. Indeed, conformational changes (i.e. dimerization of the G‐GRα complex) are needed before this complex can migrate to the nucleus to interact with glucocorticoid‐responsive elements, that is, parts of genes encoding for regulators of termination of inflammation. Then, key anti‐inflammatory factors are up‐regulated, leading to phagocytosis, chemokinesis and anti‐oxidative processes. The net effect of glucocorticoids involves reprogramming rather than inhibiting immune cell function (Erschen 2007). Glucocorticoids induce specific activated anti‐inflammatory monocyte subtypes that migrate quickly to inflamed tissues (Varga 2008). They prolonged survival of this subtype of monocytes via A3 adenosine receptor‐triggered anti‐apoptotic effects (Barczyk 2010). Obviously, these molecular mechanisms of action of glucocorticoids are appropriate for counteracting the uncontrolled inflammation that may characterize sepsis.
How the intervention might work
Researchers have explored the biological mechanisms of sepsis to explore potential interventions. Corticosteroids have been a topic of particular focus because of their influence on the immune response. In sepsis, the hypothalamic‐pituitary gland hormonal pathway to the adrenal glands stimulates corticosteroid production (Chrousos 1995; Cooper 2003). These hormones affect inflammation through production of white blood cells, cytokines (proteins that influence the immune response) and nitric oxide. In sepsis, cytokines may suppress adrenocorticotropin hormone synthesis (Polito 2011; Sharshar 2003) and the cortisol response to exogenous adrenocorticotropin hormone (Hotta 1986; Jaattela 1991). Likewise, sepsis may be associated with alterations in scavenger receptor B1‐mediated cholesterol delivery (Cai 2008). This causes poor adrenal activity in almost half of patients (Annane 2000; Lipiner 2007; Marik 2008; Rothwell 1991) and possible resistance of body tissues to corticosteroids (Meduri 1998a) due to fewer corticosteroid receptors or receptors with lower affinity (Barnes 1995; Huang 1987; Molijn 1995). Alteration in corticosteroid receptor numbers and in binding capacity may be related at least in part to nitric oxide (Duma 2004; Galigniana 1999). Recent works suggest that immune cells ‐ not steroid‐secreting cells ‐ are key regulators of the interaction between the immune sytem and the adrenals (Kanczkowski 2013). In addition, acute illness such as sepsis may be associated with decreased cortisol clearance from plasma (Boonen 2013; Melby 1958), likely resulting from altered hepatic and renal inactivation of cortisol (Boonen 2013), Early studies showed that a pharmacological dose of corticosteroids prolonged survival among animals with sepsis (Fabian 1982). More recent studies in rodents have demonstrated that lower doses of corticosteroids, for example, 0.1 mg/kg of dexamethasone, improved haemodynamic and organ function, favourably modulated the inflammatory response and prolonged survival (di Villa Bianca 2003; Heller 2003; Tsao 2004; Vachharajani 2006). Protective effects of these glucocorticoids against sepsis may be mediated in part by the endothelial glucocorticoid receptor (Goodwin 2013). In healthy volunteers challenged with endotoxin, a low dose of corticosteroids, for example, 10 mg of prednisolone, blocked the release of pro‐inflammatory cytokines, prevented endothelial cell and neutrophil activation and inhibited the acute phase response without altering coagulation and fibrinolysis balance (de Kruif 2007). Studies in patients with septic shock showed that a short course of corticosteroids may result in a rebound in the systemic inflammatory response (Briegel 1994; Keh 2003). In addition, it is now recognized that increased pro‐inflammatory cytokine release can be sustained for longer than a week in patients with sepsis (Kellum 2007). Likewise, timing of initiation of corticosteroids may be an important factor in response to treatment. Indeed, in observational studies, short‐term mortality increased with delayed initiation of hydrocortisone (Katsenos 2014; Park 2012). For these reasons, we would anticipate that corticosteroid treatment is beneficial for patients with sepsis, and that differences in dose, timing or duration of steroid treatment may differentially affect patient response to treatment.
Why it is important to do this review
Initially, researchers used high doses of corticosteroids, usually given as a single bolus, in an attempt to block potential bursts in pro‐inflammatory cytokines. Two systematic reviews and meta‐analyses of trials of corticosteroids in sepsis or in septic shock included 10 (Lefering 1995) and nine (Cronin 1995) randomized controlled trials, respectively. These systematic reviews showed no significant difference in relative risk of death, and no significant increase in risk of gastrointestinal bleeding or superinfection associated with corticosteroids.
Subsequently, most clinicians will not recommend use of high doses of corticosteroids in sepsis. However, this review covered a period from 1966 to 1993 and did not exclude potential benefits of a lower dose (≤ 300 mg of hydrocortisone or equivalent per day) and a longer duration at full dose (≥ three days) of treatment, as investigated in randomized controlled trials over the past two decades (Annane 2002; Arabi 2011; Bollaert 1998; Briegel 1999; Chawla 1999; Cicarelli 2007; Confalonieri 2005; Gordon 2014; Hu 2009; Huh 2007; Keh 2003; Liu 2012; Meduri 2007; Meijvis 2011; Mikami 2007; Oppert 2005; Rezk 2013; Rinaldi 2006; Sabry 2011; Snijders 2010; Tandan 2005; Torres 2015; Valoor 2009; Yildiz 2002; Yildiz 2011). Among these trials, the two largest yielded different findings (Annane 2002; Sprung 2008). In one study, the combination of hydrocortisone and fludrocortisone given at low doses for one week was associated with reduced duration of shock and of organ failure and reduced mortality among patients with septic shock, and a blunted response to corticotrophin was reported (Annane 2002). In the second trial, hydrocortisone was given alone for five days and was tapered off over six additional days (Sprung 2008). This trial found significant reduction in duration and intensity of shock and organ failure showed no survival benefit. In addition to differences in treatment modalities, major discrepancies between these trials (Annane 2002 vs Sprung 2008) included differences in routine practices at the time these studies were conducted (no vs broad use of corticosteroids in sepsis), differences in severity of illness (high vs low baseline risk of death) and differences in populations (mostly medical intensive care unit (ICU) patients with lung infection vs mostly surgical ICU patients with abdominal infection). Thereafter, international guidelines have suggested that corticosteroids should be used only in patients with septic shock who are poorly responsive to fluid replacement and vasopressor therapy (Dellinger 2008; Dellinger 2013).
We therefore aim to systematically review the effects of corticosteroids in patients with sepsis.
Objectives
To examine the effects of corticosteroids on death at one month in patients with sepsis, and to examine whether dose and duration of corticosteroids influence patient response to this treatment.
Methods
Criteria for considering studies for this review
Types of studies
We included randomized controlled trials (RCTs) with or without blinding.
Types of participants
We included children and adults with sepsis defined by the following criteria (ACCP/SCCM 1992; Vincent 2013).
-
Documented infection defined as culture or Gram stain of blood, sputum, urine or normally sterile body fluid that is positive for a pathogenic micro‐organism; or a focus of infection identified by visual inspection (e.g. ruptured bowel with the presence of free air or bowel contents in the abdomen found at the time of surgery; wound with purulent drainage); and
-
At least two symptoms of a systemic inflammatory response syndrome, such as fever (body temperature > 38°C) or hypothermia (< 36°C), tachycardia (> 90 beats per minute), tachypnoea (> 20 breaths per minute) or hyperventilation (arterial carbon dioxide tension (PaCO2) < 32 mm Hg) and abnormal white blood cell count (> 12,000 cells/mL or < 4000 cells/mL) or more than 10% immature band of neutrophils; and
-
At least one sign of organ dysfunction, that is, metabolic acidosis, arterial hypoxaemia (arterial oxygen tension [PaO2]:fractional inspired oxygen [FiO2] < 250 mm Hg), oliguria (< 30 mL/h for ≥ three hours), coagulopathy or encephalopathy; and
-
Septic shock defined by a combination of these criteria and the presence of hypotension (persisting systolic arterial pressure < 90 mm Hg) that is refractory to fluid resuscitation and requires vasopressor support, that is, more than 5 µg/kg of body weight per minute of dopamine or any dose of epinephrine or norepinephrine.
We included data from trials of acute respiratory distress syndrome (ARDS) when separate data were available for participants with sepsis, or when contact with study authors resulted in provision of the data.
Types of interventions
Intervention
Systemic treatment with any type of corticosteroid preparation (e.g. cortisone, hydrocortisone, methylprednisolone, betamethasone, dexamethasone).
Low‐dose corticosteroid was defined by a total dose per day of 400 mg or less of hydrocortisone (or equivalent); otherwise the dose of corticosteroid would be considered as high. A long course for the intervention was defined by a full‐dose treatment duration of three or more days; otherwise treatment was considered as a short course.
Control
Standard therapy (which may have included antibiotics, fluid replacement, inotropic or vasopressor therapy, mechanical ventilation or renal replacement therapy) or placebo.
Types of outcome measures
Primary outcomes
-
28‐Day all‐cause mortality.
Indeed, this was the primary outcome measure in most of the RCTs on sepsis conducted since 1992 (Annane 2009b). Most studies performed before 1992 looked at 14‐day or hospital mortality rates. We used these data to compute the pooled analysis on 28‐day mortality, unless we could obtain actual 28‐day mortality rates from study authors.
Secondary outcomes
-
ICU mortality.
-
Hospital mortality.
-
Number of participants with shock reversal (as defined by stable haemodynamic status ≥ 24 hours after withdrawal of vasopressor therapy) at day seven and at day 28.
-
Number of organs affected and severity of organ dysfunction at day seven, as measured by the sequential organ failure assessment (SOFA) score (Vincent 1996).
-
Length of stay in the ICU (for all participants and for survivors only).
-
Length of hospital stay (for all participants and for survivors only).
-
Adverse events (i.e. gastrointestinal bleeding and superinfection or any other adverse effects or complications of corticosteroid treatment).
Search methods for identification of studies
We attempted to identify all relevant studies regardless of language or publication status (published, unpublished, in press, in progress).
Electronic searches
We originally searched the Cochrane Infectious Diseases Group Trials Register for relevant trials (to August 2003) using the search terms 'sepsis' and 'septic shock'. Full details on the methods of the Cochrane Infectious Diseases Group and of the journals handsearched are published in The Cochrane Library in the section on Cochrane Review Groups.
In this updated version, we searched the Cochrane Central Register of Controlled Trials (CENTRAL; 2014 Issue 10) using the search terms 'sepsis', 'septic shock', 'steroids' and 'corticosteroids' (for the detailed search strategy, see Appendix 1).
We also searched (up to October 2014) MEDLINE, EMBASE and Latin American Caribbean Health Sciences Literature (LILACS) using the topic search terms in combination with the search strategy for identifying trials developed by The Cochrane Collaboration (Higgins 2011). (For detailed search strategies, see Appendix 2 (MEDLINE), Appendix 3 (EMBASE) and Appendix 4 (LILACS)).
Searching other resources
We checked the reference lists of all trials identified by these methods, and we contacted study authors to request additional published or unpublished data. We also searched the proceedings of annual meetings of major critical care medicine symposia, that is, Society of Critical Care Medicine, American Thoracic Society, International Symposium on Intensive Care and Emergency Medicine, American College of Chest Physicians and European Society of Intensive Care Medicine (1998 to 2014).
Finally, we searched for ongoing RCTs (October 2014) in the metaRegister of Controlled Trials using the search terms 'septic shock', 'sepsis', steroids', 'corticosteroids', 'adrenal cortex hormones' and 'glucocorticoids' (www.controlled‐trials.com/mrct/active).
Data collection and analysis
Selection of studies
All review authors checked the titles and abstracts identified during the search. All review authors examined in full any trial that potentially met the inclusion criteria. Five review authors (Djillali Annane, Pierre Edouard Bollaert, Josef Briegel, Didier Keh and Yizhak Kupfer) evaluated all trials, except those in which they had participated. We decided which trials fitted the inclusion criteria and graded their methodological quality. We resolved disagreements between the five review authors by discussion with the sixth review author (Eric Bellissant) until consensus was reached. One review author (Djillali Annane) contacted study authors for clarification, when necessary.
Data extraction and management
One review author (DA) drew up a standard data extraction form, and four other review authors (PEB, JB, DK, YK) amended and validated the design of the form before data abstraction. Four review authors (DA, PEB, JB, DK) independently extracted data, except those from trials in which they had participated. One review author (DA) systematically contacted the authors of trials to request missing data when possible. One review author (DA) entered (DA secretary independently reentered all data to achieve a double entry) the data into the computer, and five review authors (EB, PEB, JB, DK, YK) checked the accuracy of data entered against the original articles.
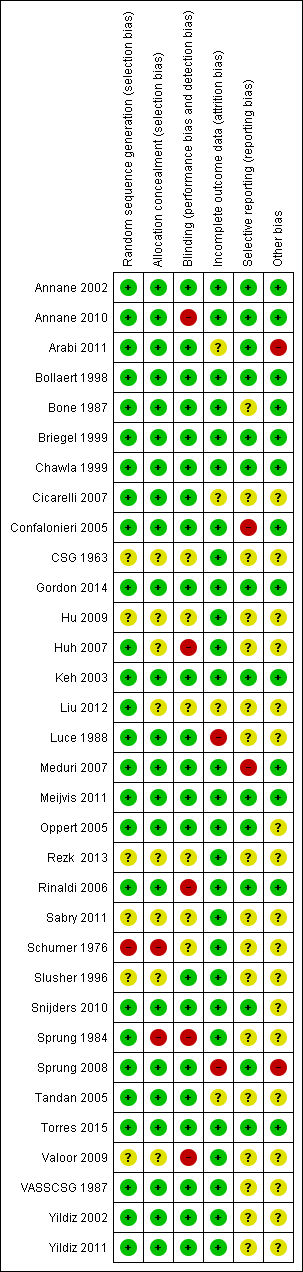
Assessment of risk of bias in included studies
We assessed risk of bias within individual trials as recommended by the Cochrane Handbook for Systematic Reviews of Interventions (Higgins 2011). We considered the following domains: selection bias, performance bias, detection bias, attrition bias, reporting bias and any other bias. We judged selection bias on the basis of how the random sequence was generated and how allocation was concealed. We judged performance bias and detection bias on the basis of who was blinded and how, among participants, care‐givers, pharmacists, data collectors, outcome assessors and data analysts (Devereaux 2001). In judging attrition bias, we considered how many (and the reasons why) participants were lost to follow‐up or were not included in analyses. When available, we compared outcomes reported in trial protocols versus actual results reported, to identify potential selective reporting bias. We resolved disagreements between the five review authors by discussion with the sixth review author (EB) until consensus was reached. One review author (DA) contacted study authors for clarification, when necessary.
Measures of treatment effect
-
We performed intention‐to‐treat (ITT) analyses. We performed all statistical calculations using RevMan 5 or STATA/IC version 10.1 (Stata Corp, College Station, Texas) as appropriate.
-
We calculated a weighted treatment effect across trials. We expressed results as risk ratios (RRs) with 95% confidence intervals (CIs) for dichotomous outcomes, and as mean differences (MDs, 95% CIs) for continuous outcomes.
Unit of analysis issues
In this review, we used data from trials in which the unit of randomization was an individual, and in which parallel groups were designed. For events that may occur repeatedly, such as receiving vasopressor therapy, we used only the first occurrence of the event.
Dealing with missing data
We systematically tried to contact primary authors of original trials to obtain missing information and unpublished data.
Assessment of heterogeneity
We considered that evidence for significant heterogeneity was present when I2 > 30%.
Assessment of reporting biases
We sought evidence of publication bias by using the funnel plot method. We used STATA/IC version 10.1 (Stata Corp, College Station, Texas) to prepare a contour‐enhanced funnel plot (Peters 2008). This graphical analysis used the log of the RR and the standard error of the RR. We plotted contours illustrating the statistical significance of study effect estimates by using a two‐tailed test.
Data synthesis
We considered methods based on the random‐effects model for all analyses, except when we found no evidence for significant heterogeneity in the results. Indeed, we suspected that we would observe heterogeneity across studies, as they were conducted over a wide period of time (almost half a century between first and last trials) and the rationale on which studies were designed varied greatly over time, with marked differences in treatment strategies and in populations between studies conducted before and after the early 90s.
Subgroup analysis and investigation of heterogeneity
-
To identify potential sources of heterogeneity, we sought a priori to conduct a subgroup analysis based on 'dose and duration', that is, a long course (three or more days) of low‐dose (< 400 mg/d) hydrocortisone or equivalent. This subgroup analysis allowed evaluation of a strategy based on developments in our understanding of the role of corticosteroids in host response to sepsis, as tested in trials performed after 1992. Older trials used a short course (one to four bolus doses within 24 hours) of high‐dose corticosteroids (> 400 mg of hydrocortisone or equivalent) as an anti‐inflammatory approach, and trials conducted after 1992 used low‐dose corticosteroids at full dose over a longer period (≥ three days). To further explore the putative interaction between corticosteroid dose and duration and the magnitude of effect, we considered performing a meta‐regression analysis using 28‐day all‐cause mortality as the dependent variable, and dosage and duration of corticosteroids as predictors. We performed meta‐regression analyses using STATA/IC version 10.1 (Stata Corp, College Station, Texas). We also tested a priori the interaction between baseline severity of illness and magnitude of effect in a meta‐regression analysis using mortality rates in controls as predictors. Finally, we conducted a subgroup analysis based on targeted population, sepsis, only septic shock, sepsis with ARDS, community‐acquired pneumonia and sepsis with critical illness‐related corticosteroid insufficiency (Marik 2008).
-
We assessed the validity of subgroup analyses (based on treatment modalities, i.e. dose and duration, or on population) on the basis of the following criteria: (1) subgroup comparisons within studies rather than between studies; (2) hypothesis preceding the analysis; (3) one of very few hypotheses; (4) large and consistent differences across studies; and (5) external evidence supporting the results (Guyatt 2008b). When subgroup analyses met these criteria and were found to be statistically significant, we applied GRADE (Grades of Recommendation, Assessment, Development and Evaluation) criteria to evaluate the quality of evidence (Guyatt 2008a).
Sensitivity analysis
We conducted sensitivity analyses for generation of allocation sequence, concealment of allocation and blinding.
Assessment of quality of evidence using GRADE and selection of outcomes for 'Summary of findings' tables
For assessments of the overall quality of evidence for each outcome that included pooled data from RCTs only, we downgraded the evidence from 'high quality' by one level for serious (or by two for very serious) study limitations (according to risk of bias evaluation), indirectness of evidence, serious inconsistency (i.e. when I2 statistic > 30%), imprecision of effect estimates (large 95% confidence intervals or small treatment effects) or potential publication bias. Data from observational studies were first determined to be of low quality.
We exported data from Review Manager to GRADE profiler (GRADEpro version 3.6) to create 'Summary of findings' tables. We included the following patient‐centred outcomes in the 'Summary of findings' table.
-
28‐Day all‐cause mortality.
-
28‐Day all‐cause mortality for long courses of low‐dose corticosteroids.
-
In‐hospital all‐cause mortality.
-
Number of participants with shock reversal at day seven.
-
Sepsis‐related organ failure assessment score at day seven.
-
Length of stay in the ICU for survivors.
-
Number of participants with superinfection within 28 days.
Results
Description of studies
Results of the search
Our search results are detailed in Figure 1.

Flow diagram.
The search strategy yielded 47 RCTs that evaluated corticosteroids in sepsis.
Included studies
Since the last update in 2010 (see Published notes), we have included nine additional trials for a total of 33 trials (n = 4268 participants) and have described them below (see Characteristics of included studies).
Source of information
In addition to the data extracted from these publications, we obtained unpublished information from 19 trials by contacting the primary authors (Annane 2002; Annane 2010; Arabi 2011; Bollaert 1998; Briegel 1999; Chawla 1999; Cicarelli 2007; Confalonieri 2005; Gordon 2014; Keh 2003; Meduri 2007; Meijvis 2011; Oppert 2005; Rinaldi 2006; Sprung 1984; Sprung 2008; Tandan 2005; Torres 2015; Yildiz 2002) (Appendix 5). In four cases, contact with study authors did not lead to provision of additional information (Luce 1988; Meijvis 2011; Rezk 2013; Snijders 2010).
Trial centres
Eleven trials were multi‐centre trials (i.e. > two centres) (Annane 2002; Annane 2010; Bone 1987; Confalonieri 2005; CSG 1963; Gordon 2014; Meduri 2007; Sabry 2011; Sprung 2008; Torres 2015; VASSCSG 1987).
Age of participants
One study enrolled both children and adults (CSG 1963). Two trials included only children (Slusher 1996; Valoor 2009). All remaining trials included only adults.
Description of participants
Seven trials included both participants with sepsis and individuals with septic shock (Bone 1987; Liu 2012; Luce 1988; Slusher 1996; VASSCSG 1987; Yildiz 2002; Yildiz 2011). One trial included participants with sepsis (Rinaldi 2006). Five trials targeted participants with community‐acquired pneumonia‐related sepsis (Confalonieri 2005; Meijvis 2011; Sabry 2011; Snijders 2010; Torres 2015). Three trials focused on participants with ARDS and sepsis (Liu 2012; Meduri 2007; Rezk 2013). The remaining trials focused only on participants with septic shock treated by a vasopressor (Annane 2002; Annane 2010; Arabi 2011; Bollaert 1998; Briegel 1999; Chawla 1999; Cicarelli 2007; CSG 1963; Gordon 2014; Hu 2009; Huh 2007; Keh 2003; Oppert 2005; Schumer 1976; Sprung 1984; Sprung 2008; Tandan 2005; Valoor 2009). Two trials included only participants with septic shock with adrenal insufficiency as defined by a cortisol increment less than 9 µg/dL after a corticotropin bolus (Huh 2007; Tandan 2005). In 10 trials, investigators systematically performed a short corticotropin test at baseline (Annane 2002; Annane 2010; Arabi 2011; Bollaert 1998; Huh 2007; Meduri 2007; Oppert 2005; Tandan 2005; Sprung 2008; Yildiz 2011).
Control
Two studies did not use a placebo and compared corticosteroid therapy versus standard therapy, that is, antibiotics, fluid resuscitation and vasopressor when needed (Hu 2009; Rinaldi 2006). In one study, only one centre used a placebo (Sprung 1984). One trial that compared hydrocortisone versus hydrocortisone plus fludrocortisone did not use a placebo of fludrocortisone for technical reasons (Annane 2010). Another trial compared duration of hydrocortisone treatment (i.e. three vs seven days) and did not use a placebo (Huh 2007). In the remaining trials, corticosteroid therapy was compared with placebo.
Corticosteroid dose and treatment course
Eighteen trials tested the effects of long‐course (three or more days at full dose) of low‐dose hydrocortisone (Annane 2002; Annane 2010; Arabi 2011; Bollaert 1998; Briegel 1999; Chawla 1999; Confalonieri 2005; Gordon 2014; Hu 2009; Huh 2007; Keh 2003; Liu 2012; Oppert 2005; Rinaldi 2006; Sabry 2011; Sprung 2008; Tandan 2005; Valoor 2009). In one trial (Huh 2007), investigators compared hydrocortisone 50 mg intravenously every six hours when given for three days versus seven days. Another trial compared seven‐day treatment with hydrocortisone versus seven‐day treatment with the combination of hydrocortisone plus fludrocortisone (Annane 2010). One trial compared a short course (two days at full dose) of low‐dose (300 mg on day one and 250 mg on day two) intravenous hydrocortisone (CSG 1963). Another study used a cross‐over design to compare a three‐day course of low‐dose hydrocortisone versus placebo (Keh 2003).
Three trials tested effects of a long course of low‐dose prednisolone (Snijders 2010; Yildiz 2002; Yildiz 2011).
Two trials tested effects of a long course of low‐dose dexamethasone (Cicarelli 2007; Meijvis 2011). Another trial tested effects of a short course of low‐dose dexamethasone (Slusher 1996).
Three studies tested effects of a long course of low‐dose intravenous methylprednisolone (Meduri 2007; Rezk 2013; Torres 2015).
Five trials tested effects of a short course of a large dose of methylprednisolone (Bone 1987; Luce 1988; Schumer 1976; Sprung 1984; VASSCSG 1987), and two tested effects of dexamethasone (Schumer 1976; Sprung 1984).
Outcomes
Nineteen trials explicitly reported 28‐day mortality rates (Annane 2002; Annane 2010; Arabi 2011; Bollaert 1998; Briegel 1999; Chawla 1999; Cicarelli 2007; Confalonieri 2005; Gordon 2014; Huh 2007; Liu 2012; Meijvis 2011; Oppert 2005; Snijders 2010; Sprung 2008; Tandan 2005; Valoor 2009; Yildiz 2002; Yildiz 2011). For three trials, contact with the primary author of the paper led to recording of 28‐day mortality rates (Meduri 2007; Rinaldi 2006; Sprung 1984). Two trials reported only 14‐day mortality rates (Bone 1987; VASSCSG 1987). Five trials reported only hospital mortality rates (CSG 1963; Luce 1988; Schumer 1976; Slusher 1996; Torres 2015). One trial did not report mortality rates (Keh 2003). For one trial, the time point for mortality rate was unclear and remained unclear after contact with the trial primary author (Rezk 2013).
Eleven trials explicitly reported ICU mortality rates (Annane 2002; Annane 2010; Arabi 2011; Bollaert 1998; Briegel 1999; Confalonieri 2005; Gordon 2014; Hu 2009; Meduri 2007; Sabry 2011; Sprung 2008), and the primary authors of three additional trials provided this outcome (Chawla 1999; Rinaldi 2006; Torres 2015).
Hospital mortality rates were available for 20 trials (Annane 2002; Annane 2010; Arabi 2011; Bollaert 1998; Briegel 1999; Chawla 1999; Confalonieri 2005; CSG 1963; Gordon 2014; Luce 1988; Meduri 2007; Meijvis 2011; Rinaldi 2006; Schumer 1976; Slusher 1996; Sprung 1984; Sprung 2008; Tandan 2005; Torres 2015; Yildiz 2002).
Twelve trials reported the rate of shock reversal at day seven (Annane 2002; Arabi 2011; Bone 1987; Bollaert 1998; Briegel 1999; Chawla 1999; Gordon 2014; Hu 2009; Oppert 2005; Sabry 2011; Sprung 1984; Sprung 2008), and eight trials (Annane 2002; Bollaert 1998; Briegel 1999; Chawla 1999; Gordon 2014; Huh 2007; Sprung 2008; Tandan 2005) the rate of shock reversal at day 28.
Nine trials reported the numbers of dysfunctional organs at seven days, that is, SOFA scores (Annane 2002; Annane 2010; Arabi 2011; Cicarelli 2007; Gordon 2014; Oppert 2005; Rinaldi 2006; Sabry 2011; Sprung 2008).
Fourteen trials reported length of ICU stay (Annane 2002; Annane 2010; Arabi 2011; Bollaert 1998; Briegel 1999; Chawla 1999; Confalonieri 2005; Gordon 2014; Hu 2009; Huh 2007; Meduri 2007; Rinaldi 2006; Sprung 2008; Torres 2015), and 14 reported length of hospital stay (Annane 2002; Annane 2010; Arabi 2011; Bollaert 1998; Chawla 1999; Confalonieri 2005; Gordon 2014; Meduri 2007; Meijvis 2011; Slusher 1996; Snijders 2010; Sprung 2008; Torres 2015; Yildiz 2002).
Excluded studies
We excluded 14 trials (see Characteristics of excluded studies).
Ongoing studies
We identified nine additional randomized trials of prolonged treatment with a low dose of corticosteroids from trials registries (but these nine studies were not included in the analysis; see Characteristics of ongoing studies). Three of these trials never recruited participants because they lacked funding (NCT00127985 2005; NCT00368381 2008; NCT00562835 2008). One trial was halted prematurely as the result of a too slow recruitment rate; no data are available at the time of this review update (NCT00732277 2008). Two trials are now completed, but no data are available at the time of this review update (Blum 2015; NCT00670254 2008). One trial was initiated with a 2 × 2 factorial design to also allow evaluation of the effects of drotrecogin alfa activated (DAA), a recombinant activated protein C (NCT00625209 2008). Owing to the withdrawal of DAA from the market on October 25, 2011, the trial committees (Steering Committee and Data Safety and Monitoring Board) decided, with the approval of French health authorities and of the Comité de Protection des Personnes de Saint Germain en Laye, to release the data on DAA and to continue the trial using a two‐parallel‐group design corresponding to hydrocortisone and fludrocortisone (experimental arm) and their placebos (control arm) (Annane 2013). Trials included only adults, except one that evaluated treatment with hydrocortisone in children with sepsis (NCT00732277 2008).
Risk of bias in included studies
The detailed methodological quality of individual trials is reported in the 'Risk of bias' tables, in Figure 2 and in Appendix 6.

Methodological quality summary: review authors' judgements about each methodological quality item for each included study.
Randomization
In one trial, we considered that randomization (method of generation of allocation sequence) was inappropriate to minimize selection bias, that is, as based on a card system (Schumer 1976); we judged the method for generation of allocation sequence as having high risk of bias. In six trials, the method was unclear (CSG 1963; Hu 2009; Rezk 2013; Sabry 2011; Slusher 1996; Valoor 2009), and it was deemed to have low risk of bias in the remaining trials. We judged the method used for allocation concealment to be at low risk of bias in all but 10 trials. In one trial, assignment of treatment was based on the use of unsealed envelopes (Schumer 1976). In another trial, investigators enrolling participants at one of the two participating centres could have foreseen the upcoming assignment, as the local ethical committee refused to accept blind allocation (Sprung 1984). In eight trials, study authors did not report the method used for allocation concealment (CSG 1963; Hu 2009; Huh 2007; Liu 2012; Rezk 2013; Sabry 2011; Slusher 1996; Valoor 2009).
Blinding
In four trials, we judged the method used for blinding as having high risk of bias (Annane 2010; Rinaldi 2006; Sprung 1984; Valoor 2009). Four trials used open‐label treatments (Annane 2010; Huh 2007; Rinaldi 2006; Valoor 2009). In the fifth trial (Sprung 1984), the local ethical committee at one of the two centres did not permit double‐blind allocation and administration of treatment. Therefore, blinding was not possible for 40 of the 59 participants included in the trial.
Six additional trials did not report the method used to ensure blinding (CSG 1963; Hu 2009; Liu 2012; Rezk 2013; Sabry 2011; Schumer 1976).
The remaining trials were deemed appropriately double‐blinded.
Withdrawal
Fiftteen trials (Annane 2002; Annane 2010; Bollaert 1998; Briegel 1999; Chawla 1999; Gordon 2014; Keh 2003; Meduri 2007; Meijvis 2011; Oppert 2005; Rinaldi 2006; Snijders 2010; Sprung 2008; Torres 2015; VASSCSG 1987) explicitly provided the numbers of, and reasons for, withdrawals or losses to follow‐up. In one trial, only 500 of the 800 expected participants were recruited, mainly as the result of loss of equipoise among investigators (Sprung 2008). Another trial was halted prematurely for futility after enrolment of 75 of 150 foreseen participants (Arabi 2011).
Intention‐to‐treat analysis and adherence to the protocol
Nineteen trials explicitly reported use of intention‐to‐treat analysis (as the primary analysis) and numbers of, and reasons for, non‐adherence to the protocol (Annane 2002; Annane 2010; Arabi 2011; Bollaert 1998; Bone 1987; Briegel 1999; Chawla 1999; Confalonieri 2005; Gordon 2014; Keh 2003; Meduri 2007; Meijvis 2011; Oppert 2005; Rinaldi 2006; Sabry 2011; Snijders 2010; Sprung 2008; Torres 2015; VASSCSG 1987). One trial reported only use of intention‐to‐treat analysis (Luce 1988). The remaining trials provided no information about these criteria. However, the number of analysed participants matched the number of randomly assigned participants, except for five trials. In one trial, 191 participants were randomly assigned to the placebo group and 190 were analysed for the mortality outcome (Bone 1987). In two trials (Annane 2002; Sprung 2008), one participant withdrew his or her consent and 499 of 500 and 299 of 300 randomly assigned participants were analysed, respectively. In two trials, contact with the primary author allowed us to obtain information on participants who were dropped out from the analysis (Oppert 2005; Rinaldi 2006). In the first study, seven randomly assigned participants (five in the corticosteroid group and two in the placebo group) were not analysed (Oppert 2005). Four of these participants (two in the corticosteroid group and two in the placebo group) were discharged alive from the ICU and then were lost to follow up. The three remaining participants (in the corticosteroid group) died ‐ two before receiving hydrocortisone and the last at study day 17. In the second study, 12 of 52 participants were dropped out of the study ‐ six in the control group and six in the corticosteroid group (Rinaldi 2006). Nine participants (four in the control group) were excluded, as they developed renal failure. Two control participants died in the ICU at day five and day seven, respectively. Three of the corticosteroid‐treated participants died, at days five, six and 28, respectively. Three other participants (two control group) were excluded, as they developed septic shock. All died at days three, five and six, respectively. In two trials, additional open‐label corticosteroids were given to some participants (Gordon 2014; Snijders 2010). In the first trial, five participants in the placebo arm were given rescue corticosteroids for treatment of life‐threatening hypotension and were considered as cross‐overs (Gordon 2014). In the second trial, 37 (17.4%) participants did not complete the full course of study treatment as a consequence of premature death in 10 participants, consent withdrawal in five participants, post‐randomization exclusion in eight participants and additional open‐label corticosteroid treatment in 14 participants (Snijders 2010).
Explicit definition of septic shock
Seventeen trials provided an explicit definition of sepsis (as defined in the Methods section of this review) (Annane 2002; Annane 2010; Arabi 2011; Bollaert 1998; Briegel 1999; Chawla 1999; Cicarelli 2007; Gordon 2014; Hu 2009; Huh 2007; Keh 2003; Oppert 2005; Sprung 1984; Sprung 2008; Tandan 2005; Valoor 2009; Yildiz 2011). Seven trials provided a definition of septic shock without referring to the need for vasopressor agents (Bone 1987; Luce 1988; Rinaldi 2006; Schumer 1976; Slusher 1996; VASSCSG 1987; Yildiz 2002). One study did not explicitly provide the definition used for sepsis (CSG 1963). Six trials explicitly defined sepsis due to community‐acquired pneumonia (Confalonieri 2005; Meijvis 2011; Mikami 2007; Sabry 2011; Snijders 2010; Torres 2015). In two trials, participants were randomly assigned on the basis of the presence of ARDS, and data provided in papers confirmed the presence of sepsis (Liu 2012; Rezk 2013). In another trial on early ARDS, contact with the primary author confirmed that explicit definitions of sepsis were used (Meduri 2007).
Effects of interventions
See: Summary of findings for the main comparison Steroids versus control for treating sepsis
We did not pool the data from three trials that included children (CSG 1963; Slusher 1996; Valoor 2009), one cross‐over trial (Keh 2003), one trial that compared two durations of hydrocortisone treatment (Huh 2007) and one trial that compared hydrocortisone versus the combination of hydrocortisone plus fludrocortisone (Annane 2010).
28‐Day all‐cause mortality
Data for 28‐day mortality were available for 20 trials; among these, two trials had no corticosteroid‐free arm. In addition, we used data on 14‐day mortality (two trials), hospital mortality (four trials) or ICU mortality (two trials), or data on short‐term mortality (one trial). Thus, we computed data from 27 trials that accounted for 3176 participants. In the treated group, 474 of 1618 participants died by day 28 compared with 495 of 1558 participants in the control group. Significant heterogeneity was evident in the results (Chi2 test = 44.99, P value = 0.01, I2 statistic = 42%). The RR of dying at 28 days was 0.87 (95% CI 0.76 to 1.00, P value = 0.05, random‐effects model) (Analysis 1.1). We downgraded the quality of evidence for this outcome from high to low for imprecision (upper limit of 95% CI = 1) and for inconsistency (significant heterogeneity across trial results).
We analysed separately the 18 studies for which 28‐day mortality data were available and the two studies reporting only 14‐day mortality (Analysis 1.2). A total of 327 of 1009 deaths occurred at 28 days in the corticosteroid‐treated group and 331 of 957 deaths in the control group (RR 0.90, 95% CI 0.80 to 1.00; P value = 0.06, fixed‐effect model), and mild heterogeneity was evident in the results (Chi2 test = 19.89, P value = 0.28, I2 statistic = 15%). Among studies reporting only 14‐day mortality rates, 88 of 303 deaths were reported in the corticosteroid‐treated group and 72 of 301 deaths in the control group (RR 1.21, 95% CI 0.93 to 1.59; P value = 0.15, random‐effects model), and moderate heterogeneity was noted in the results (Chi2 test = 1.32, P value = 0.25, I2 statistic = 24%). Subgroup differences were statistically significant (P value = 0.04).
Differences in methodological quality across trials may have accounted for observed heterogeneity in the results. Subgroup analyses based on trials reporting an adequate method for generation of the allocation sequence showed an RR for dying at 28 days of 0.97 (95% CI 0.86 to 1.10) (Analysis 1.3). Similarly, subgroup analyses based on studies with adequate allocation concealment showed an RR for dying at 28 days of 0.96 (95% CI 0.84 to 1.09), and subgroup analyses on double‐blind trials showed an RR for dying at 28 days of 0.95 (95% CI 0.84 to 1.08) (Analysis 1.3).
Heterogeneity across trials may have been the result of different therapeutic regimens and different populations. Subgroup analysis on the 22 trials that tested a long course of low‐dose corticosteroids showed less heterogeneity across trials (Chi2 test = 25.09, P value = 0.240, I2 statistic = 16%) and an RR for dying at 28 days of 0.87 (95% CI 0.78 to 0.9; P value = 0.01, fixed‐effect model) in favour of the corticosteroid group (Analysis 1.4). We downgraded the quality of evidence from high to moderate for inconsistency (owing to one large trial showing non‐significant effects). Subgroup analyses on trials that tested a short course of high‐dose corticosteroids showed significant heterogeneity across trials (Chi2 test = 18.73, P value = 0.0009, I2 statistic = 79%) and an RR for dying at 28 days of 0.96 (95% CI 0.80 to 1.16; random‐effects model) (Analysis 1.4). Subgroup differences were not statistically significant (P value = 0.35).
Meta‐regression analysis confirmed the positive interaction between the dose given at day one (regression coefficient 0.051; P value = 0.04) (Figure 3) and total dose (regression coefficient 0.072; P value = 0.05) (Figure 4) and the RR for dying at 28 days, that is, the lower the dose of treatment with corticosteroids, the lower was the risk of dying. No significant interaction was observed between duration of treatment (regression co‐efficient ‐0.057; P value = 0.15), mineralocorticoid activity of the experimental drug (regression co‐efficient ‐0.21; P value = 0.48) or mortality in the control arm (regression co‐efficient 0.0008; P value = 0.76) and the RR for dying.

Figure represents the results from meta‐regression of log of risk ratio of dying and log of the dose of corticosteroids given at day 1 and expressed as equivalent mg of hydrocortisone. Estimates from each study are represented by circles. Circle sizes depend on the precision of each estimate (the inverse of its within‐study variance), which is the weight given to each study in the fixed‐effect model.
Meta‐regression included 26 trials. The trial by Schummer et al was not included.
REML estimate of between‐study variance tau2 = .01078.
% residual variation due to heterogeneity: I2 res = 5.07%
Proportion of between‐study variance explained Adj R2 = 11.16%

Figure represents results from meta‐regression of log of risk ratio of dying and log of cumulated dose of corticosteroids expressed as equivalent mg of hydrocortisone. Estimates from each study are represented by circles. Circle sizes depend on the precision of each estimate (the inverse of its within‐study variance), which is the weight given to each study in the fixed‐effect model.
Meta‐regression included 26 trials. The trial by Schummer et al was not included.
REML estimate of between‐study variance tau2 = .01183
% residual variation due to heterogeneity I2 res = 6.99%
Proportion of between‐study variance explained Adj R2 = 2.49%
Subgroup analysis based on targeted populations found significant subgroup differences (P value = 0.01) (Analysis 1.5). In studies of heterogenous populations of participants with sepsis, the RR for dying at 28 days was 1.11 (95% CI 0.91 to 1.34; six trials; n = 826; I2 statistic = 0%). In studies of only participants with septic shock, the RR for dying at 28 days was 0.88 (95% CI 0.78 to 0.99; 12 trials; n = 1444; I2 statistic = 57%). In studies of participants with sepsis and ARDS, the RR was 0.46 (95% CI 0.25 to 0.85; three trials; n = 114; I2 = 0%), and in studies of participants with sepsis and community‐acquired pneumonia, the RR was 0.62 (95% CI 0.38 to 1.02; five trials; n = 763; I2 statistic = 2%).
Subgroup analysis of participants with adrenal insufficiency showed no heterogeneity in the results. Investigators reported 138 deaths among 294 participants in the treated group and 153 deaths among 289 in the placebo group. The RR for dying was 0.88 (95% CI 0.76 to 1.02; eight trials; n = 583; I2 statistic = 0%) (Analysis 1.6).
One trial of a large dose of corticosteroids was a statistical outlier and was excluded from the meta‐regression analysis (Schumer 1976).
Funnel plot analysis, including all trials, suggested some asymmetry (Figure 5). Contour‐enhanced funnel plot analysis including trials of a long course of low‐dose corticosteroids also suggested significant asymmetry (P value = 0.01) (Figure 6).

Funnel plot of comparison: 1 Steroids versus control, outcome: 1.1 28‐Day all‐cause mortality.
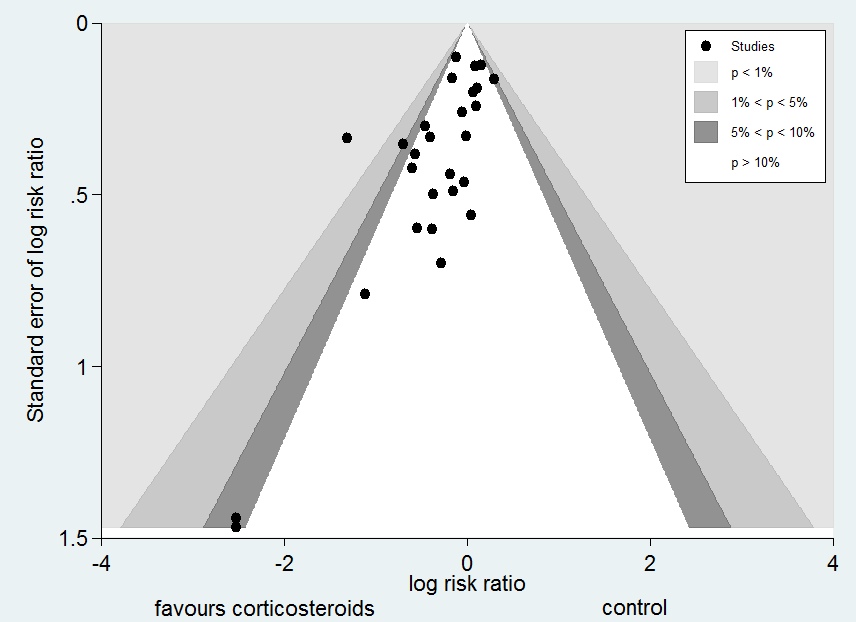
Contour‐enhanced funnel plot
Log of risk ratio for 28‐day mortality is plotted against its standard error
In one trial comparing hydrocortisone alone versus hydrocortisone plus fludrocortisone, the hazard ratio of death was 0.94 (95% CI 0.73 to 1.21) (Annane 2010).
Intensive care unit (ICU) mortality
Data were available from 13 trials, accounting for 1463 participants. All of these trials investigated a long course of low‐dose corticosteroids. A total of 264 of 748 participants in the treated group and 289 of 715 participants in the control group died in the ICU. Some heterogeneity was evident in the results (Chi2 test = 17.21, P value = 0.14, I2 statistic = 30%). The RR for dying in the ICU was 0.82 (95% CI, 0.68 to 1.00, P value = 0.045; random‐effects model) (Analysis 1.7).
Hospital mortality
We could extract data on hospital mortality from 17 trials that accounted for 2014 participants. A total of 383 of 1041 participants in the treated group compared with 402 of 973 in the control group died in hospital. Heterogeneity in the results was significant (Chi2 test = 30.11, P value = 0.02, I2 statistic = 47%). The RR for dying in hospital was 0.85 (95% CI, 0.73 to 0.98; P value = 0.03, random‐effects model) (Analysis 1.8). The quality of evidence for this outcome was downgraded from high to moderate for inconsistency and imprecision (upper limit of 95% CI for RR approaching 1).
In one trial comparing hydrocortisone alone versus hydrocortisone plus fludrocortisone, the RR for death was 0.94 (95% CI 0.77 to 1.14) (Annane 2010).
Shock reversal at day seven
We could extract data from 12 trials that accounted for 1561 participants. A total of 532 of 806 participants in the treated group and 395 of 755 in the control group had shock reversed at day seven. Significant heterogeneity was evident in the results (Chi2 test = 25.33, P value = 0.008, I2 statistic= 57%). The RR for having shock reversed at day seven was 1.31 (95% CI 1.14 to 1.51; P value = 0.0001, random‐effects model) in favour of the corticosteroid group (Analysis 1.9). We did not downgrade the quality of evidence for this outcome for inconsistency, as the direction of the effect was consistent across trials.
Heterogeneity in the results could be explained by differences in treatment strategies used in the various trials. Two trials evaluated one or two boluses of high‐dose corticosteroids (Bone 1987; Sprung 1984), and the 10 remaining trials studied treatment with a long course of low‐dose corticosteroids. Analysis of these 10 trials (n = 1258) revealed no greater heterogeneity in the results (I2 statistic = 0%). Then, 422 of 633 participants in the treated group and 306 of 625 participants in the control group had shock reversed at day seven. The RR for having shock reversed was 1.34 (95% CI 1.22 to 1.46; P value < 0.00001) in favour of the corticosteroid group (Analysis 1.9).
In one cross‐over trial, hydrocortisone was given for three days at a dose of 240 mg per day (Keh 2003). Although this trial could not provide information on shock reversal at day seven, investigators showed that at day three, fewer hydrocortisone patients than placebo‐treated patients required norepinephrine treatment (6/20 vs 14/20; P value = 0.025).
Shock reversal at day 28
We could extract data from seven trials, accounting for 1013 participants. A total of 345 of 512 participants in the treated group had shock reversed at day 28, as did 297 of 501 in the placebo group. No heterogeneity was evident in the results (I2 statistic = 0%). The RR for having shock reversed was 1.11 (95% CI 1.02 to 1.21; P value = 0.01) in favour of the corticosteroid group (Analysis 1.10).
Number of organs affected and intensity of organ dysfunction according to SOFA score at day seven
In one study (Briegel 1999), corticosteroid treatment was associated with a non‐significant (P value = 0.18) trend toward earlier resolution of organ dysfunction. Eight studies (n = 1132) reported the SOFA score at seven days post randomization. The MD in the SOFA score at day seven was ‐1.53 (95% CI ‐2.04 to ‐1.03; P value < 0.00001, random‐effects model) in favour of corticosteroids. Moderate heterogeneity across studies was noted (Chi² test = 10.80, P value = 0.15, I² statistic = 35%) (Analysis 1.11). We did not downgrade the quality of evidence for this outcome, as the direction of the effect was consistent across trials.
Length of stay in the intensive care unit (ICU)
In 12 trials (n = 1384), the MD for ICU length of stay for all participants was ‐1.68 (95% CI ‐3.27 to ‐0.09; P value = 0.04, random‐effects model) with some heterogeneity evident across studies (Chi² test = 16.03, P value = 0.14, I² statistic = 31%) (Analysis 1.12). We could extract data from 10 trials on 778 ICU survivors. The mean difference for ICU length of stay among these survivors was ‐2.19 (95% CI ‐3.93 to ‐0.46; P value = 0.01, fixed‐effect model). No heterogeneity was evident across studies (Chi² test = 8.63, P value = 0.47, I² statistic = 0%) (Analysis 1.13). We judged the quality of evidence for this outcome as high.
Length of hospital stay
From 12 trials (n = 1802), we could extract data on all participants. Some heterogeneity in the results was evident (I2 statistic = 22%). No evidence showed a difference between the two groups (MD ‐0.97, 95% CI ‐2.55 to 0.61, random‐effects model) (Analysis 1.14). We could extract data for hospital survivors from nine studies (n = 710). We noted some heterogeneity in the results (I2 statistic = 43%). No evidence suggested a difference between the two groups (MD ‐4.11, 95% CI ‐8.50 to 0.28) (Analysis 1.15).
Adverse events
Gastroduodenal bleeding
We could extract data from 19 trials (n = 2382). A total of 81 of 1219 participants in the treated group and 62 of 1163 in the control group had an episode of gastroduodenal bleeding. We noted no heterogeneity in the results (I2 statistic = 0%). The RR for having gastroduodenal bleeding was 1.24 (95% CI 0. 92 to 1.67; P value = 0.15, fixed‐effect model) (Analysis 1.16).
Superinfection
We could extract data from 19 trials (n = 2567). A total of 219 of 1307 participants in the treated group and 203 of 1260 participants in the control group had an episode of nosocomial infection. We noted moderate heterogeneity in the results (Chi² test = 18.98, P value = 0.21, I² statistic = 21%). The RR for superinfection was 1.02 (95% CI 0.87 to 1.20; P value = 0.81, fixed‐effect model) (Analysis 1.16).
Hyperglycaemia
The number of participants who presented with hyperglycaemia was reported for 13 trials (n = 2081). Moderate heterogeneity was noted in the results (Chi² test = 13.60, P value = 0.19; I² statistic = 26%). The RR for hyperglycaemia was 1.26 (95% CI 1.16 to 1.37; P value < 0.00001, fixed‐effect model) (Analysis 1.16).
One trial comparing tight glucose control versus standard care found no benefit in normalizing blood glucose levels among corticosteroid‐treated septic shock participants (Annane 2010).
Hypernatraemia
The number of participants who presented with hypernatraemia was reported for three trials (n = 805). We noted no heterogeneity in the results (I2 statistic = 0%). The RR for hypernatraemia was 1.64 (95% CI 1.28 to 2.09; P value < 0.00001, fixed‐effect model) (Analysis 1.16).
Neuromuscular weakness
The number of participants who presented with neuromuscular weakness was reported for three trials (n = 811). Moderate heterogeneity was evident in the results (I2 statistic = 30%). The RR for neuromuscular weakness was 0.62 (95% CI 0.21 to 1.88; P value = 0.24) (Analysis 1.16).
We have summarized the main results in summary of findings Table for the main comparison.
Discussion
Summary of main results
Effects of corticosteroids on mortality
Overall, this review suggested that, in sepsis, corticosteroids reduced all‐cause 28‐day mortality, although the P value was 0.05, and significantly reduced intensive care unit (ICU) and in‐hospital mortality. For these outcomes, results showed strong heterogeneity.
Subgroup analysis based on treatment modalities showed that a long course of low‐dose corticosteroids significantly reduced 28‐day mortality with little heterogeneity in results. By contrast, a short course of high‐dose corticosteroids did not affect mortality, in keeping with previous reports (Cronin 1995; Lefering 1995).
Patients with more severe forms of sepsis, such as those with vasopressor‐dependent septic shock and those with acute respiratory distress syndrome (ARDS), may be more likely to derive a survival benefit from corticosteroids than patients with less severe sepsis. Patients whose sepsis is secondary to community‐acquired pneumonia also are more likely to benefit from corticosteroids. Indeed, analysis based on the targeted population showed statistically significant subgroup differences. Analysis of eight trials including patients with critical illness‐related corticosteroid insufficiency suggested a non‐significant reduction in the risk of death. However, studies did not use the same definition for adrenal insufficiency. Additional studies are needed to determine the best diagnostic tool for critical illness‐related corticosteroid insufficiency (Marik 2008).
Effects of corticosteroids on morbidity outcomes
The beneficial effects of corticosteroids on mortality may be related to the favourable effects of treatment on duration of shock. Indeed, this review showed that treatment with corticosteroids resulted in a substantial reduction in shock duration, with fewer patients remaining on vasopressor therapy by day seven and by day 28. Treatment with a long course of low‐dose corticosteroids may attenuate the severity of inflammation (Confalonieri 2005; Keh 2003; Mikami 2007a; Oppert 2005; Rinaldi 2006) and the intensity and duration of organ system failure (Briegel 1999; Confalonieri 2005; Keh 2003; Oppert 2005; Sprung 2008), as shown in this review by a marked decrease in sequential organ failure assessment (SOFA) score at day seven. In addition, subsequent to favourable effects on cardiovascular and other organ functions, corticosteroid therapy resulted in substantial shortening of ICU length of stay.
Tolerance of corticosteroids
Finally, this review also showed no evidence of effects of corticosteroids on rates of gastroduodenal bleeding or superinfection, or on the proportion of patients with acquired neuromuscular weakness. Corticosteroids were associated with increased risk for developing hyperglycaemia and hypernatraemia. One randomized controlled trial suggested that continuous infusion of hydrocortisone resulted in fewer episodes of hyperglycaemia than were seen with bolus administration (Loisa 2007). One trial on 509 corticosteroid‐treated patients with septic shock reported no benefit for normalizing blood glucose levels (Annane 2010).
Overall completeness and applicability of evidence
Although the subgroup analysis is a between‐study and not a within‐study hypothesis, we thought its validity was acceptable according to proposed criteria (Guyatt 2008b). First, we defined the hypothesis for an interaction between dose and duration and effects of corticosteroids on mortality a priori. Second, we conducted only three subgroup analyses (based on methodological quality of studies, dose and duration and targeted population). Third, treatment effect was seen as a 4% absolute difference in mortality and rather consistent findings in terms of 28‐day, ICU and hospital mortality (risk ratios (RRs) 0.87, 0.82 and 0.91, respectively). Meta‐regression analysis further confirmed the interaction of dose and duration with effects of corticosteroids on mortality. Fourth, strong external evidence supports these results. Experimental and human studies have shown that a dose of 400 mg or less of hydrocortisone or equivalent can reverse the systemic inflammatory response, endothelial activation and coagulation disorders secondary to infection (Annane 2005), thus arguing against the use of higher doses. Moreover, at these low doses, corticosteroids have been shown to improve rather than suppress innate immunity in patients with septic shock (Kaufman 2008). It is now established that sepsis results in a sustained pro‐inflammatory state, arguing against a short course of treatment (Kellum 2007).
Quality of the evidence
We judged the quality of evidence for 28‐day mortality as low rather than high because some imprecision and inconsistency across trials were related in part to differences in study populations and to differences in treatment dose and duration. We downgraded the quality of evidence for 28‐day mortality in the subgroup of long course of low‐dose corticosteroids from high to moderate because one of the two largest trials on a long course of low‐dose corticosteroids reported no survival benefit (Sprung 2008). Other differences between trials included differences in targeted populations, in control of co‐interventions or in type and dose of corticosteroids. In addition, ongoing trials (Gordon 2014a; NCT00625209 2008; Venkatesh 2013) may influence the direction and magnitude of treatment effects.
Potential biases in the review process
In this review, we performed a comprehensive search of the literature with no restriction on language, so we can assume that the risk of missing important trials was very limited. The asymmetrical funnel plot for the primary outcome of this review suggests some publication bias. However, potential sources of an asymmetrical funnel plot also include selection biases, poor methodological quality of smaller studies, true heterogeneity, artefacts and chance (Egger 1997). Visual inspection of the funnel plot suggests a small‐study effect (i.e. among small studies, the positive ones are more likely to be published). Nevertheless, our thorough search strategy and the need to enrol studies in public clinical trial registries may have decreased the risk of missing any randomized controlled trial. As discussed in this review, all studies on low‐dose corticosteroids described methods of acceptable quality. True heterogeneity seems to be a more plausible explanation for the observed asymmetrical funnel plot. Indeed, the effects of low‐dose corticosteroids on mortality may be proportional to the basal risk of death, and the Corticosteroid Therapy of Septic Shock trial (CORTICUS) included patients at lower risk of death (Sprung 2008). In addition, smaller intervention effects in the CORTICUS trial may have resulted from an improved standard of care introduced during the decade that separated most of the smaller trials from CORTICUS. Finally, the asymmetrical funnel plot may have been due to chance.
According to the primary objective of this systematic review, we included only trials that compared corticosteroids versus standard therapy alone or placebo. One trial used a cross‐over design (Keh 2003), and we could obtain none of the foreseen outcomes for this review. This trial concluded that prolonged treatment with a low dose of hydrocortisone improved haemodynamic and immune outcomes. Another trial compared three days versus seven days of hydrocortisone therapy and suggested no evidence for differences in outcomes between patients treated for three days or seven days (Huh 2007). However, this trial has some limitations, including lack of blinding and small sample size. Three other trials have included children (CSG 1963; Slusher 1996; Valoor 2009). We considered that pooling the results of remaining trials in a meta‐analysis was acceptable.
Two trials were published only as an abstract (Chawla 1999; Tandan 2005). Nevertheless, the primary investigators for these studies (Chawla 1999; Tandan 2005) provided sufficient unpublished data for review authors to compute the primary outcome and several secondary outcomes for this review, allowing us to include these trials in the meta‐analysis. Both published and unpublished data were available for 17 trials (Annane 2002; Annane 2010; Arabi 2011; Bollaert 1998; Briegel 1999; Chawla 1999; Cicarelli 2007; Confalonieri 2005; Gordon 2014; Keh 2003; Meduri 2007; Oppert 2005; Rinaldi 2006; Sprung 1984; Sprung 2008; Torres 2015; Yildiz 2002), and the primary author for each trial validated the data extraction form. For four studies, contact with the primary investigator yielded no additional data (Luce 1988; Meijvis 2011; Rezk 2013; Snijders 2010).
We chose to convert outcome measures that correspond to censored data into dichotomous variables, that is, the proportion of participants with a particular event after one week and after four weeks, or at ICU or hospital discharge.
Agreements and disagreements with other studies or reviews
Findings in this review that a short course of high‐dose corticosteroids provides no benefit for patients with sepsis are in line with reports from previous systematic reviews (Cronin 1995; Lefering 1995) and with current international guidelines (Dellinger 2013).
We found scarce data that could not allow conclusions on effects of corticosteroids in children with sepsis, in keeping with a recent systematic review (Menon 2013).
The beneficial effects of corticosteroids on shock reversal in patients with septic shock are consistent across recent systematic reviews (Kalil 2011; Moran 2010; Sherwin 2012). The survival benefit derived from corticosteroids for patients with sepsis was suggested by some previous authors (Moran 2010) but not by others (Kalil 2011; Sherwin 2012). Nevertheless, current systematic reviews have included trials that were not included in previous systematic reviews, as they were published only recently or were published in non‐English language. Current reviews have included non‐published information for a large number of trials after contact was made with original study authors, resulting in inclusion of qualitatively and quantitatively better data than were provided previously.

Methodological quality summary: review authors' judgements about each methodological quality item for each included study.

Figure represents the results from meta‐regression of log of risk ratio of dying and log of the dose of corticosteroids given at day 1 and expressed as equivalent mg of hydrocortisone. Estimates from each study are represented by circles. Circle sizes depend on the precision of each estimate (the inverse of its within‐study variance), which is the weight given to each study in the fixed‐effect model.
Meta‐regression included 26 trials. The trial by Schummer et al was not included.
REML estimate of between‐study variance tau2 = .01078.
% residual variation due to heterogeneity: I2 res = 5.07%
Proportion of between‐study variance explained Adj R2 = 11.16%

Figure represents results from meta‐regression of log of risk ratio of dying and log of cumulated dose of corticosteroids expressed as equivalent mg of hydrocortisone. Estimates from each study are represented by circles. Circle sizes depend on the precision of each estimate (the inverse of its within‐study variance), which is the weight given to each study in the fixed‐effect model.
Meta‐regression included 26 trials. The trial by Schummer et al was not included.
REML estimate of between‐study variance tau2 = .01183
% residual variation due to heterogeneity I2 res = 6.99%
Proportion of between‐study variance explained Adj R2 = 2.49%
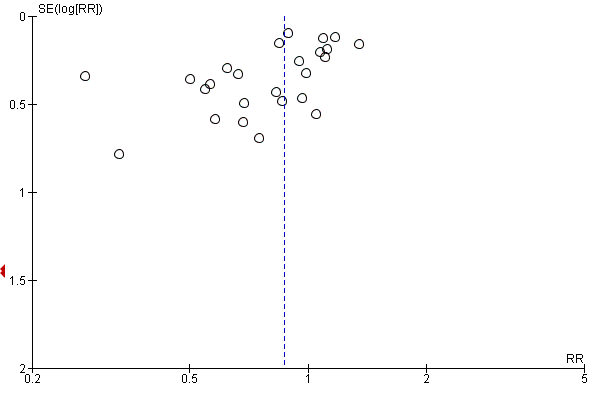
Funnel plot of comparison: 1 Steroids versus control, outcome: 1.1 28‐Day all‐cause mortality.

Contour‐enhanced funnel plot
Log of risk ratio for 28‐day mortality is plotted against its standard error

Comparison 1 Steroids versus control, Outcome 1 28‐Day all‐cause mortality.
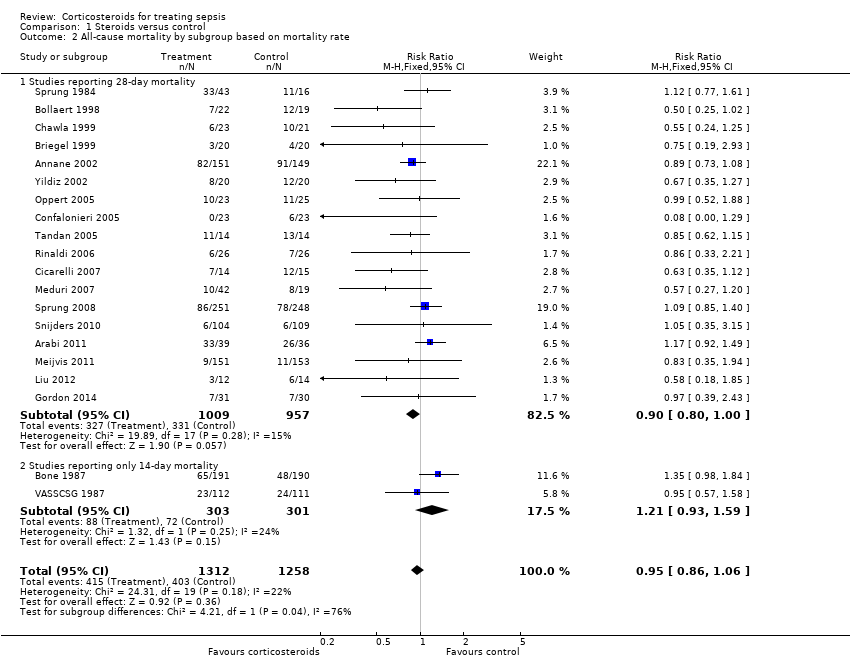
Comparison 1 Steroids versus control, Outcome 2 All‐cause mortality by subgroup based on mortality rate.

Comparison 1 Steroids versus control, Outcome 3 28‐Day all‐cause mortality by subgroups based on methodological quality.

Comparison 1 Steroids versus control, Outcome 4 28‐Day all‐cause mortality by subgroups based on treatment dose/duration.

Comparison 1 Steroids versus control, Outcome 5 28‐Day all‐cause mortality by subgroups based on targeted population.
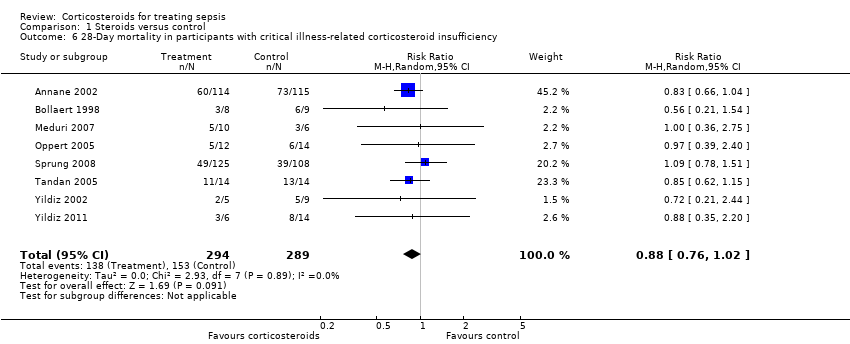
Comparison 1 Steroids versus control, Outcome 6 28‐Day mortality in participants with critical illness‐related corticosteroid insufficiency.
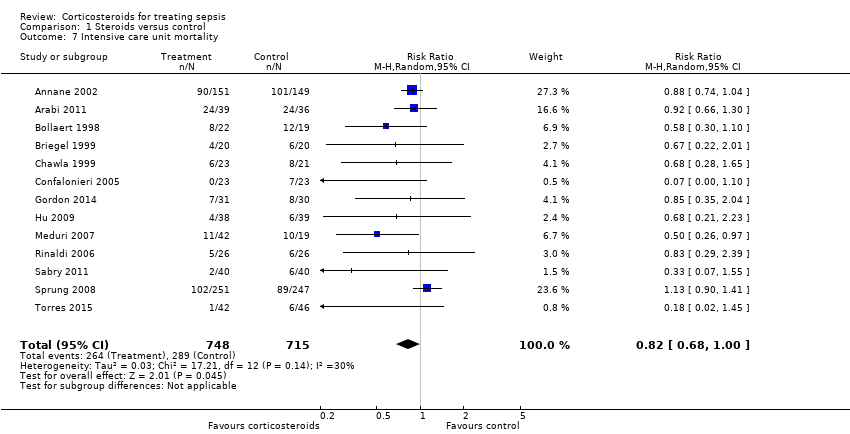
Comparison 1 Steroids versus control, Outcome 7 Intensive care unit mortality.
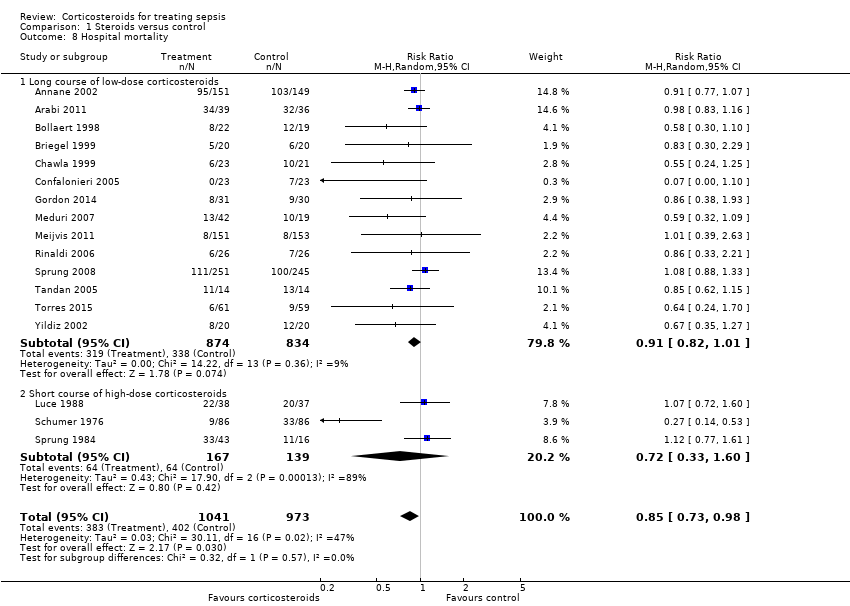
Comparison 1 Steroids versus control, Outcome 8 Hospital mortality.

Comparison 1 Steroids versus control, Outcome 9 Number of participants with shock reversal at day 7.

Comparison 1 Steroids versus control, Outcome 10 Number of participants with shock reversal at 28 days.

Comparison 1 Steroids versus control, Outcome 11 SOFA score at day 7.
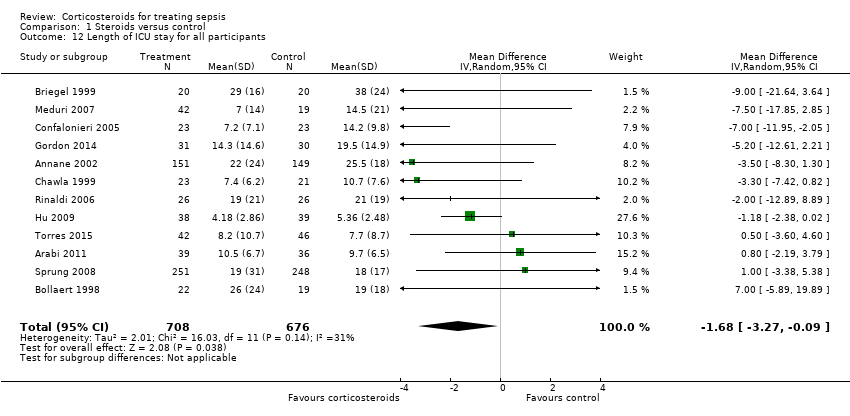
Comparison 1 Steroids versus control, Outcome 12 Length of ICU stay for all participants.

Comparison 1 Steroids versus control, Outcome 13 Length of ICU stay for survivors.

Comparison 1 Steroids versus control, Outcome 14 Length of hospital stay for all participants.
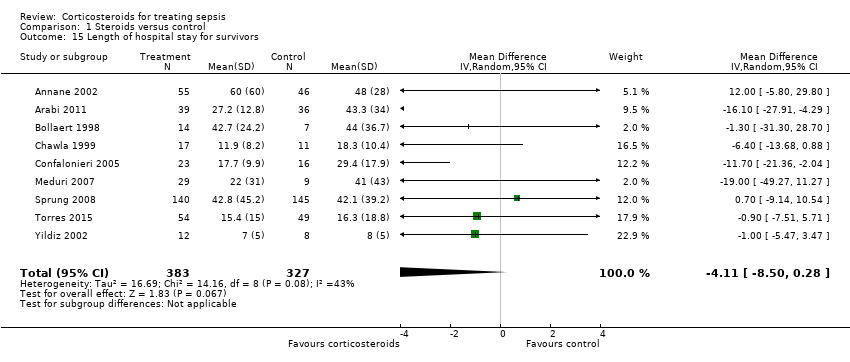
Comparison 1 Steroids versus control, Outcome 15 Length of hospital stay for survivors.

Comparison 1 Steroids versus control, Outcome 16 Number of participants with adverse events.
| Steroids versus control for treating sepsis | ||||||
| Patient or population: patients with sepsis | ||||||
| Outcomes | Illustrative comparative risks* (95% CI) | Relative effect | Number of participants | Quality of the evidence | Comments | |
| Assumed risk | Corresponding risk | |||||
| Control | Steroids vs control | |||||
| 28‐Day all‐cause mortality | Study population | RR 0.87 | 3176 | ⊕⊕⊝⊝ | Trials were conducted over a period from 1976 to 2015. Differences in participant management and in the definition of sepsis were substantial <BR/>18 trial | |
| 318 per 1000 | 276 per 1000 | |||||
| 28‐Day all‐cause mortality by subgroups based on treatment dose/duration ‐ long course of low‐dose corticosteroids | Study population | RR 0.87 | 2266 | ⊕⊕⊕⊝ | Meta‐regression analysis also showed evidence of a dose response: Low doses were associated with better treatment response | |
| 321 per 1000 | 279 per 1000 | |||||
| Hospital mortality | Study population | RR 0.85 | 2014 | ⊕⊕⊕⊝ | Low doses of corticosteroids were associated with better treatment response | |
| 413 per 1000 | 351 per 1000 | |||||
| Number of participants with shock reversal at day 7 | Study population | RR 1.31 | 1561 | ⊕⊕⊕⊕ | Low doses of corticosteroids were associated with better treatment response | |
| 523 per 1000 | 685 per 1000 | |||||
| SOFA score at day 7 | Mean SOFA score at day 7 in intervention groups was | 1132 | ⊕⊕⊕⊕ | Observed reduction in SOFA score was of a magnitude that exceeded any reduction seen with any other treatment for sepsis | ||
| Length of ICU stay for survivors | Mean length of ICU stay for survivors in intervention groups was | 778 | ⊕⊕⊕⊕ | Observed reduction in length of ICU stay was of a magnitude that exceeded any reduction seen with any other treatment for sepsis | ||
| Length of hospital stay for survivors | Mean length of hospital stay for survivors in intervention groups was | 710 | ⊕⊕⊕⊝ | Observed reduction in length of hospital stay was of a magnitude that exceeded any reduction seen with any other treatment for sepsis | ||
| Number of participants with adverse events ‐ superinfections | Study population | RR 1.02 | 2567 | ⊕⊕⊕⊕ | One large trial suggested increased risk of new sepsis with corticosteroids | |
| 161 per 1000 | 164 per 1000 | |||||
| Number of participants with adverse events ‐ hyperglycaemia | Study population | RR 1.26 | 2081 | ⊕⊕⊕⊕ | One trial suggested that risk of hyperglycaemia was lower when corticosteroids were given as a continuous perfusion than when they were given as an intravenous bolus | |
| 348 per 1000 | 438 per 1000 | |||||
| *The basis for the assumed risk is provided in footnotes. The corresponding risk (and its 95% confidence interval) is based on the assumed risk in the comparison group and the relative effect of the intervention (and its 95% CI) | ||||||
| GRADE Working Group grades of evidence | ||||||
| aQuality of evidence was downgraded by 1 point owing to some inconsistency; 1 of the 2 largest trials showed no survival benefit | ||||||
| Outcome or subgroup title | No. of studies | No. of participants | Statistical method | Effect size |
| 1 28‐Day all‐cause mortality Show forest plot | 27 | 3176 | Risk Ratio (M‐H, Random, 95% CI) | 0.87 [0.76, 1.00] |
| 2 All‐cause mortality by subgroup based on mortality rate Show forest plot | 20 | 2570 | Risk Ratio (M‐H, Fixed, 95% CI) | 0.95 [0.86, 1.06] |
| 2.1 Studies reporting 28‐day mortality | 18 | 1966 | Risk Ratio (M‐H, Fixed, 95% CI) | 0.90 [0.80, 1.00] |
| 2.2 Studies reporting only 14‐day mortality | 2 | 604 | Risk Ratio (M‐H, Fixed, 95% CI) | 1.21 [0.93, 1.59] |
| 3 28‐Day all‐cause mortality by subgroups based on methodological quality Show forest plot | 20 | Risk Ratio (M‐H, Random, 95% CI) | Subtotals only | |
| 3.1 Adequate generation of allocation sequence | 19 | 2342 | Risk Ratio (M‐H, Random, 95% CI) | 0.97 [0.86, 1.10] |
| 3.2 Adequate allocation concealment | 18 | 2283 | Risk Ratio (M‐H, Random, 95% CI) | 0.96 [0.84, 1.09] |
| 3.3 Blinded trials | 18 | 2259 | Risk Ratio (M‐H, Random, 95% CI) | 0.95 [0.84, 1.08] |
| 4 28‐Day all‐cause mortality by subgroups based on treatment dose/duration Show forest plot | 27 | Risk Ratio (M‐H, Fixed, 95% CI) | Subtotals only | |
| 4.1 Long course of low‐dose corticosteroids | 22 | 2266 | Risk Ratio (M‐H, Fixed, 95% CI) | 0.87 [0.78, 0.97] |
| 4.2 Short course of high‐dose corticosteroids | 5 | 910 | Risk Ratio (M‐H, Fixed, 95% CI) | 0.96 [0.80, 1.16] |
| 5 28‐Day all‐cause mortality by subgroups based on targeted population Show forest plot | 26 | Risk Ratio (M‐H, Fixed, 95% CI) | Subtotals only | |
| 5.1 Sepsis | 6 | 826 | Risk Ratio (M‐H, Fixed, 95% CI) | 1.11 [0.91, 1.34] |
| 5.2 Septic shock only | 12 | 1444 | Risk Ratio (M‐H, Fixed, 95% CI) | 0.88 [0.78, 0.99] |
| 5.3 Sepsis and ARDS | 3 | 114 | Risk Ratio (M‐H, Fixed, 95% CI) | 0.46 [0.25, 0.85] |
| 5.4 Sepsis and community‐acquired pneumonia | 5 | 763 | Risk Ratio (M‐H, Fixed, 95% CI) | 0.62 [0.38, 1.02] |
| 6 28‐Day mortality in participants with critical illness‐related corticosteroid insufficiency Show forest plot | 8 | 583 | Risk Ratio (M‐H, Random, 95% CI) | 0.88 [0.76, 1.02] |
| 7 Intensive care unit mortality Show forest plot | 13 | 1463 | Risk Ratio (M‐H, Random, 95% CI) | 0.82 [0.68, 1.00] |
| 8 Hospital mortality Show forest plot | 17 | 2014 | Risk Ratio (M‐H, Random, 95% CI) | 0.85 [0.73, 0.98] |
| 8.1 Long course of low‐dose corticosteroids | 14 | 1708 | Risk Ratio (M‐H, Random, 95% CI) | 0.91 [0.82, 1.01] |
| 8.2 Short course of high‐dose corticosteroids | 3 | 306 | Risk Ratio (M‐H, Random, 95% CI) | 0.72 [0.33, 1.60] |
| 9 Number of participants with shock reversal at day 7 Show forest plot | 12 | 1561 | Risk Ratio (M‐H, Random, 95% CI) | 1.31 [1.14, 1.51] |
| 9.1 Shock reversal at day 7 in trials on long course of low‐dose corticosteroids | 10 | 1258 | Risk Ratio (M‐H, Random, 95% CI) | 1.34 [1.22, 1.46] |
| 9.2 Shock reversal at day 7 in trials on short course of high‐dose corticosteroids | 2 | 303 | Risk Ratio (M‐H, Random, 95% CI) | 1.07 [0.64, 1.79] |
| 10 Number of participants with shock reversal at 28 days Show forest plot | 7 | 1013 | Risk Ratio (M‐H, Random, 95% CI) | 1.11 [1.02, 1.21] |
| 11 SOFA score at day 7 Show forest plot | 8 | 1132 | Mean Difference (IV, Random, 95% CI) | ‐1.53 [‐2.04, ‐1.03] |
| 12 Length of ICU stay for all participants Show forest plot | 12 | 1384 | Mean Difference (IV, Random, 95% CI) | ‐1.68 [‐3.27, ‐0.09] |
| 13 Length of ICU stay for survivors Show forest plot | 10 | 778 | Mean Difference (IV, Fixed, 95% CI) | ‐2.19 [‐3.93, ‐0.46] |
| 14 Length of hospital stay for all participants Show forest plot | 12 | 1802 | Mean Difference (IV, Random, 95% CI) | ‐0.97 [‐2.55, 0.61] |
| 15 Length of hospital stay for survivors Show forest plot | 9 | 710 | Mean Difference (IV, Random, 95% CI) | ‐4.11 [‐8.50, 0.28] |
| 16 Number of participants with adverse events Show forest plot | 21 | Risk Ratio (M‐H, Fixed, 95% CI) | Subtotals only | |
| 16.1 Gastroduodenal bleeding | 19 | 2382 | Risk Ratio (M‐H, Fixed, 95% CI) | 1.24 [0.92, 1.67] |
| 16.2 Superinfections | 19 | 2567 | Risk Ratio (M‐H, Fixed, 95% CI) | 1.02 [0.87, 1.20] |
| 16.3 Hyperglycaemia | 13 | 2081 | Risk Ratio (M‐H, Fixed, 95% CI) | 1.26 [1.16, 1.37] |
| 16.4 Hypernatraemia | 3 | 805 | Risk Ratio (M‐H, Fixed, 95% CI) | 1.64 [1.28, 2.09] |
| 16.5 Neuromuscular weakness | 3 | 811 | Risk Ratio (M‐H, Fixed, 95% CI) | 0.62 [0.21, 1.88] |